monthly budget statement december 2014 … and board member allowances and employee benefits ......
TRANSCRIPT

SOL PLAATJE LOCAL MUNICIPALITY
MONTHLY BUDGET STATEMENT
decEMBER 2014
15 january 2015

Table of Contents
PART 1 – IN YEAR REPORT
1. Purpose .......................................................................................................................... 2
2. Vision of Sol Plaatje Local Municipality........................................................................... 2
3. Background .................................................................................................................... 2
4. Executive summary ........................................................................................................ 3
4.1 Operating Revenue by Source ................................................................................. 3
4.2 Operating Expenditure by Type ................................................................................ 7
4.3 Capital expenditure ................................................................................................ 10
4.4 Cash flows .............................................................................................................. 11
5. In-year budget statement tables ................................................................................... 12
PART 2 - SUPPORTING DOCUMENTATION
6. Debtors‟ Analysis ......................................................................................................... 13
7. Creditors‟ Analysis........................................................................................................ 17
8. Investment portfolio analysis ........................................................................................ 18
9. Allocation and grant receipts and expenditure .............................................................. 19
10. Councillor and board member allowances and employee benefits ............................... 22
11. Material variances to the service delivery and budget implementation plan .................. 23
12. Capital programme performance .................................................................................. 23
13. Other supporting documents ........................................................................................ 24
14. Conclusion ................................................................................................................... 24
15. Annexures .................................................................................................................... 24
16. Municipal Manager‟s quality certification ...................................................................... 33

List of Abbreviations and Acronyms used in the MBS
AGSA - Auditor-General South Africa
BTO - Budget and Treasury Office
CFO - Chief Financial Officer
COGHSTA - Department of Co-operative Governance, Human Settlement and Traditional Affairs
DBSA - Development Bank of South Africa
DoRA - Division of Revenue Act
DPW – Department of Public Works
DWA - Department of Water Affairs
ED - Executive Director
EEDG - Energy Efficiency and Demand Side Management Grant
EPWP - Expanded Public Works Programme
GRAP - Generally Recognised Accounting Practices
GURP - Galeshewe Urban Renewal Programme
IDP - Integrated Development Plan
INEP - Integrated National Electrification Programme
ISDG - Infrastructure Skills Development Grant
IT - Information Technology
KPA - Key Performance Area
KPI - Key Performance Indicator
MBRR - Municipal Budget and Reporting Regulations
MBS – Monthly Budget Statement
MFMA - Municipal Finance Management Act
MIG - Municipal Infrastructure Grant
MM - Municipal Manager
MSA - Municipal Systems Act
MSIG - Municipal Systems Improvement Grant
MTREF - Medium Term Revenue and Expenditure Framework
NDPG - Neighbourhood Development Partnership Grant
NERSA - National Energy Regulator of South Africa (“the Regulator”)
NT - National Treasury
PPE - Property, Plant and Equipment
R&M - Repairs and Maintenance
SCM - Supply Chain Management
SDBIP - Service Delivery and Budget Implementation Plan
SEDP - Strategic Economic Development and Planning
SLA -Service Level Agreement
SMME -Small, Medium and Micro Enterprises
SPM - Sol Plaatje Municipality
VAT – Value Added Tax
YTD – Year-to-date
_____________________________________________
Monthly Budget Statement: December 2014 2
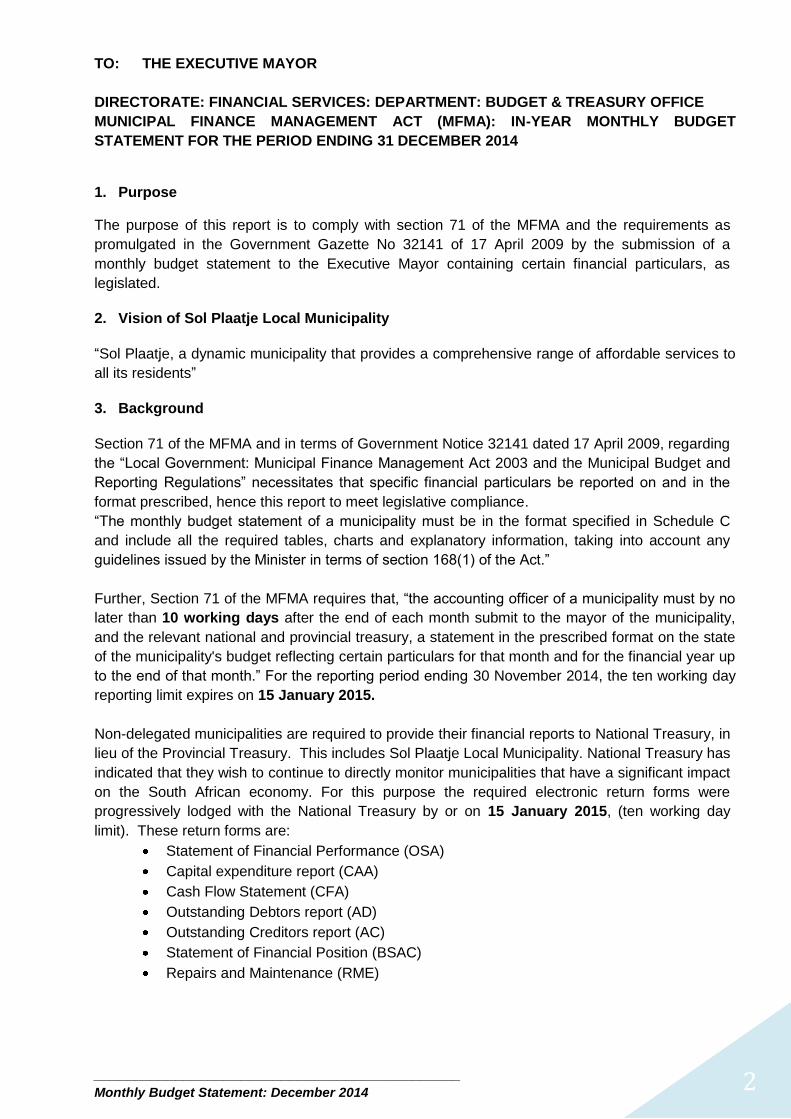
TO: THE EXECUTIVE MAYOR
DIRECTORATE: FINANCIAL SERVICES: DEPARTMENT: BUDGET & TREASURY OFFICE
MUNICIPAL FINANCE MANAGEMENT ACT (MFMA): IN-YEAR MONTHLY BUDGET
STATEMENT FOR THE PERIOD ENDING 31 DECEMBER 2014
1. Purpose
The purpose of this report is to comply with section 71 of the MFMA and the requirements as
promulgated in the Government Gazette No 32141 of 17 April 2009 by the submission of a
monthly budget statement to the Executive Mayor containing certain financial particulars, as
legislated.
2. Vision of Sol Plaatje Local Municipality
“Sol Plaatje, a dynamic municipality that provides a comprehensive range of affordable services to
all its residents”
3. Background
Section 71 of the MFMA and in terms of Government Notice 32141 dated 17 April 2009, regarding
the “Local Government: Municipal Finance Management Act 2003 and the Municipal Budget and
Reporting Regulations” necessitates that specific financial particulars be reported on and in the
format prescribed, hence this report to meet legislative compliance.
“The monthly budget statement of a municipality must be in the format specified in Schedule C
and include all the required tables, charts and explanatory information, taking into account any
guidelines issued by the Minister in terms of section 168(1) of the Act.”
Further, Section 71 of the MFMA requires that, “the accounting officer of a municipality must by no
later than 10 working days after the end of each month submit to the mayor of the municipality,
and the relevant national and provincial treasury, a statement in the prescribed format on the state
of the municipality's budget reflecting certain particulars for that month and for the financial year up
to the end of that month.” For the reporting period ending 30 November 2014, the ten working day
reporting limit expires on 15 January 2015.
Non-delegated municipalities are required to provide their financial reports to National Treasury, in
lieu of the Provincial Treasury. This includes Sol Plaatje Local Municipality. National Treasury has
indicated that they wish to continue to directly monitor municipalities that have a significant impact
on the South African economy. For this purpose the required electronic return forms were
progressively lodged with the National Treasury by or on 15 January 2015, (ten working day
limit). These return forms are:
Statement of Financial Performance (OSA)
Capital expenditure report (CAA)
Cash Flow Statement (CFA)
Outstanding Debtors report (AD)
Outstanding Creditors report (AC)
Statement of Financial Position (BSAC)
Repairs and Maintenance (RME)

_____________________________________________
Monthly Budget Statement: December 2014
3
4. Executive summary
The Statement of Financial Performance shown in Annexure A, Table C4, is prepared on a
similar basis to the prescribed budget format, detailing revenue by source and expenditure by
type. The summary report indicates the following:
Summary Statement of Financial Performance:
Description R thousand
December 2014
YTD Budget
December
2014 YTD
Actual
Variance
Favourable
(Unfavourable)
YTD Actual vs
YTD Budget % Variance %
Total Operating Revenue 885,602 899,520 13,919 101.57% 1.57%
Total Operating Expenditure 814,540 821,120 6,579 100.81% 0.81%
Surplus (Deficit) 71,061 78,400 7,339 110.33% 10.33%
Consolidated performance against YTD and Original Budget
4.1 Operating Revenue by Source
Comparison against YTD Budget (SDBIP Target)
As indicated in the table above, as at 31 December 2014 the accrued revenue resulted in a variance
of 1.57% of the year-to-date budgeted SDBIP target of R885,602m. Revenue derived from Property
Rates is performing satisfactorily with a positive variance of 0.53%. Revenue from Electricity Sales
was overestimated as a result of the factoring in of revenue due to the new structure for commercial
users which has moved over to Time of Use (TOU) tariff. The other major impact as well is a result of
NERSA not approving the tariff for large power users. An appeal was lodged with the Regulator but
we are still awaiting a response from them. This is putting strain on SPM‟s cash flow, on the current
and future budget cycles. The electricity prepaid sales for December amounting to R15 million
excluding VAT will only be read into the system in January 2015. All other service charges are
performing satisfactorily. Interest on Outstanding Debtors shows a favourable variance of R20m.
Transfers recognised – Operational shows a negative variance of -1.46% or R1.5m. Other Revenue
2013/14
Audited
Outcome
Original
Budget
Adjusted
Budget
Monthly
actual
YearTD
actual
YearTD
budget
YTD
variance
YTD
variance
Full Year
Forecast
R thousands %
Revenue By Source
Property rates 368,225 397,946 32,115 278,558 277,100 1,458 1% 397,946
Property rates - penalties & collection charges – –
Serv ice charges - electricity rev enue 528,885 608,853 42,264 265,574 301,540 (35,966) -12% 608,853
Serv ice charges - w ater rev enue 197,867 239,315 14,698 103,066 103,500 (434) 0% 239,315
Serv ice charges - sanitation rev enue 63,601 67,187 5,652 34,400 33,594 806 2% 67,187
Serv ice charges - refuse rev enue 44,695 46,841 3,961 23,737 23,421 316 1% 46,841
Serv ice charges - other – –
Rental of facilities and equipment 17,795 17,606 1,388 7,799 5,560 2,239 40% 17,606
Interest earned - ex ternal inv estments 21,413 12,000 857 1,146 4,580 (3,434) -75% 12,000
Interest earned - outstanding debtors 56,744 45,000 6,459 36,396 16,150 20,246 125% 45,000
Div idends receiv ed – – –
Fines 11,554 7,635 398 2,225 3,818 (1,593) -42% 7,635
Licences and permits 2,708 2,672 135 1,282 300 982 327% 2,672
Agency serv ices 4,339 4,900 1,143 2,856 2,400 456 19% 4,900
Transfers recognised - operational 166,601 164,710 48,480 103,463 105,000 (1,537) -1% 164,710
Other rev enue 36,945 33,745 12,824 39,019 8,640 30,379 352% 33,745
Gains on disposal of PPE 275 – – –
Total Revenue (excluding capital transfers and
contributions)
1,521,649 1,648,410 – 170,373 899,520 885,602 13,919 2% 1,648,410
Description Ref
Budget Year 2014/15
NC091 Sol Plaatje - Table C4 Monthly Budget Statement - Financial Performance (revenue and expenditure) - M06 December

_____________________________________________
Monthly Budget Statement: December 2014
4
reflects a positive variance. The other source of revenue that is below the target are Fines amounting
to R1.5m. Due to the implementation of GRAP, this revenue stream will increase at year end through
the creation of debtors due to the non-payment of fines. Interest from External Investments shows a
negative variance as a result of accrued interest accounted for in respect of the prior financial year.
Interest accrued for the current year will again be raised at year-end. It should be noted that minor
errors were detected with supporting schedule SA25 but this will be corrected during the adjustment
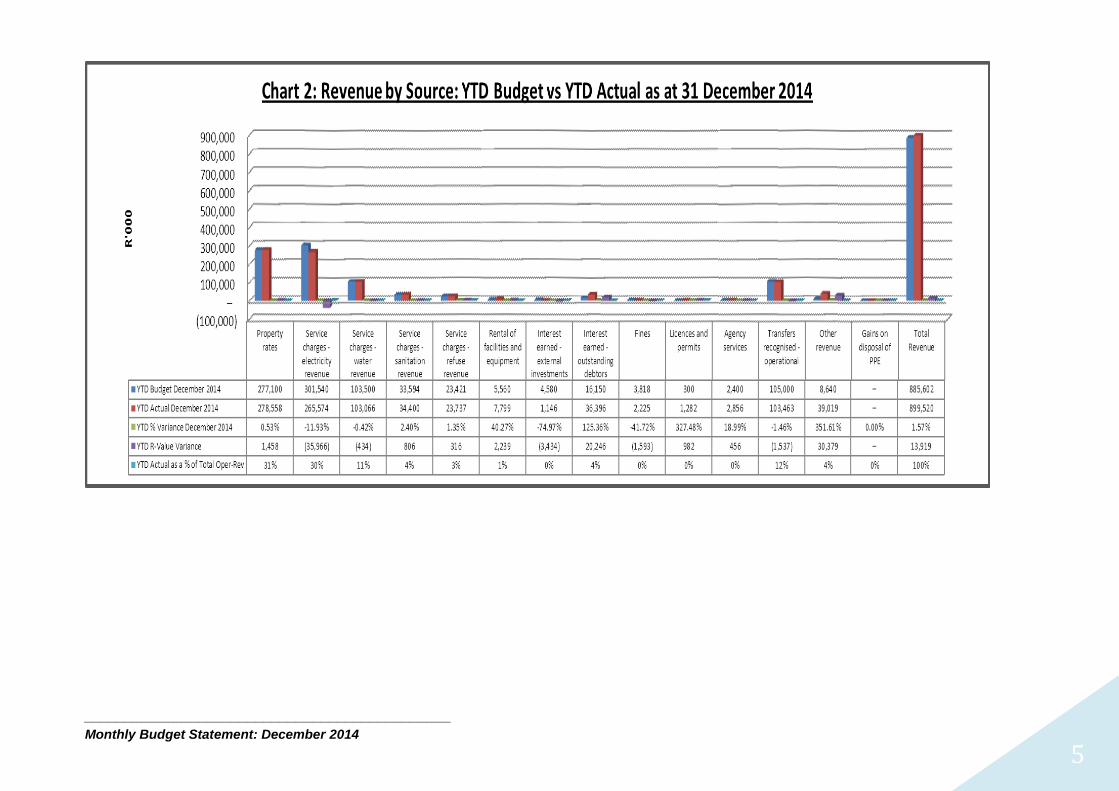
budget. For a comparison, please see Chart 1 and Chart 2 below.
Also indicated in the Chart 1 and Chart 2 below is the weighting of the YTD Actual on billed revenue
per Source as a percentage of total operational revenue as at 31 December 2014. The main
contributors are Property Rates (31%) and Service Charges – Electricity Revenue (30%). This is
followed by Transfers recognised – Operational with a weighting of 12% and Service Charges –
Water Revenue at 11%.
_____________________________________________
Monthly Budget Statement: December 2014
5

_____________________________________________
Monthly Budget Statement: December 2014
6
Operating Revenue by Source: Comparison against Original Budget
Indicated in Chart 3 above is the year-to-date actual compared to the Original Budget. When calculating the ideal In-Year-Monitoring percentage of
50% (calculated on 100% / 12 months of the year) as at the end of December 2014, the total operational revenue compared against Original
Budget is 54.57% which is a positive variance of 4.57%. This is mainly attributable to the annual billing on Property Rates which is standing at 70%
when comparing the actual of R278m to the budgeted R397m.
The total overall revenue derived from Service Charges is performing satisfactorily, however the revenue from electricity sales is putting pressure
on other service charges and affect the cash flow negatively. Interest on Outstanding Debtors is performing well. Interest from External
Investments shows a negative variance as a result of accrued interest accounted for in respect of the previous financial year. Interest accrued for
the current year will again be raised at year-end. Other Revenue is performing satisfactorily and the variance is attributable to the receipts on
Housing Projects which will be dealt with in the adjustment budget and payments received in advance for electricity connections.

_____________________________________________
Monthly Budget Statement: December 2014
7
4.2 Operating Expenditure by Type
Comparison against YTD Budget (SDBIP Target)
As indicated in the Table above and Chart 5 below, as at 31 December 2014 current
expenditure shows an over-spending with a variance of 0.81% or R6.5m, above the year-to-
date budgeted SDBIP target of R814,540m. The main areas where expenditure is less than
YTD budgets are: Bulk Purchases and Depreciation. The outstanding ESKOM account for
December will be settled in January 2015. All outstanding invoices that were due to DWA
have been settled in December 2014. The outstanding invoices for December 2014 will be
settled in January 2015 but we are however still awaiting the original invoices from DWA.
In December the first bi-annual interest payment was made on the long-term loan amounting
to R15m under Finance charges. The category under Other Expenditure was under-projected
and this will be corrected during the adjustment budget. The expenditure incurred on housing
projects will also be corrected during the adjustment budget. Refer to Annexure A – Table
SC1 for further details on both revenue by source and expenditure by type.
2013/14
Audited
Outcome
Original
Budget
Adjusted
Budget
Monthly
actual
YearTD
actual
YearTD
budget
YTD
variance
YTD
variance
Full Year
Forecast
R thousands %
Expenditure By Type
Employ ee related costs 474,749 547,624 49,999 250,508 265,000 (14,492) -5% 547,624
Remuneration of councillors 18,459 19,968 1,571 9,405 9,984 (579) -6% 19,968
Debt impairment 126,810 145,000 – 145,000 145,000 – 145,000
Depreciation & asset impairment 41,988 52,550 – – 8,758 (8,758) -100% 52,550
Finance charges 28,056 36,559 15,539 15,433 18,200 (2,767) -15% 36,559
Bulk purchases 381,005 422,000 30,751 189,114 217,000 (27,886) -13% 422,000
Other materials 64,257 87,135 9,059 37,525 41,340 (3,815) -9% 87,135
Contracted serv ices – – –
Transfers and grants 19,564 54,750 2,376 22,033 19,384 2,649 14% 54,750
Other ex penditure 248,674 266,997 34,869 152,101 89,874 62,227 69% 266,997
Loss on disposal of PPE – – – – – – –
Total Expenditure 1,403,563 1,632,584 – 144,164 821,120 814,540 6,579 1% 1,632,584
Description Ref
Budget Year 2014/15
NC091 Sol Plaatje - Table C4 Monthly Budget Statement - Financial Performance (revenue and expenditure) - M06 December

_____________________________________________
Monthly Budget Statement: December 2014
8
Also indicated in the Chart 4 above is the weighting of the YTD Actual on Expenditure by Type as a percentage of total operational expenditure as at 31
December 2014. The main cost drivers of the municipality are Employee Related Costs (30%) and Bulk Purchases (23%). This is followed by General
Expenses & Other with a weighting of 21% and Debt Impairment 18%.
_____________________________________________
Monthly Budget Statement: December 2014
9
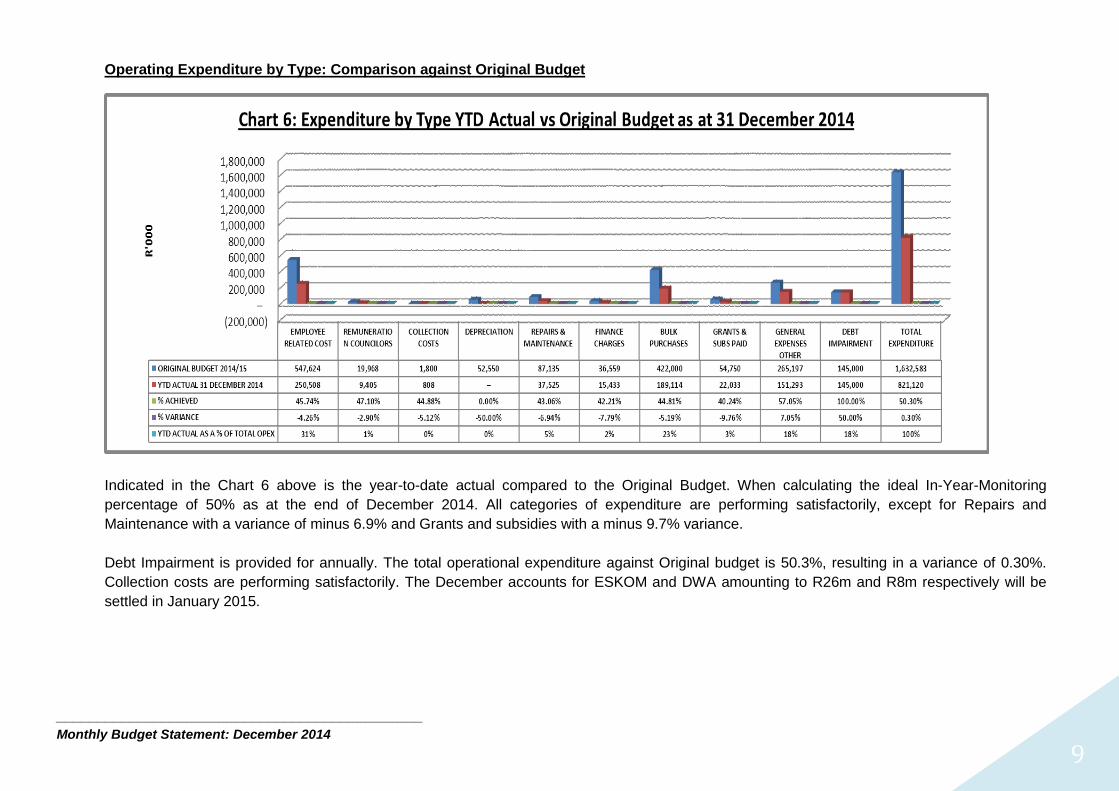
Operating Expenditure by Type: Comparison against Original Budget
Indicated in the Chart 6 above is the year-to-date actual compared to the Original Budget. When calculating the ideal In-Year-Monitoring
percentage of 50% as at the end of December 2014. All categories of expenditure are performing satisfactorily, except for Repairs and
Maintenance with a variance of minus 6.9% and Grants and subsidies with a minus 9.7% variance.
Debt Impairment is provided for annually. The total operational expenditure against Original budget is 50.3%, resulting in a variance of 0.30%.
Collection costs are performing satisfactorily. The December accounts for ESKOM and DWA amounting to R26m and R8m respectively will be
settled in January 2015.
_____________________________________________
Monthly Budget Statement: December 2014
10
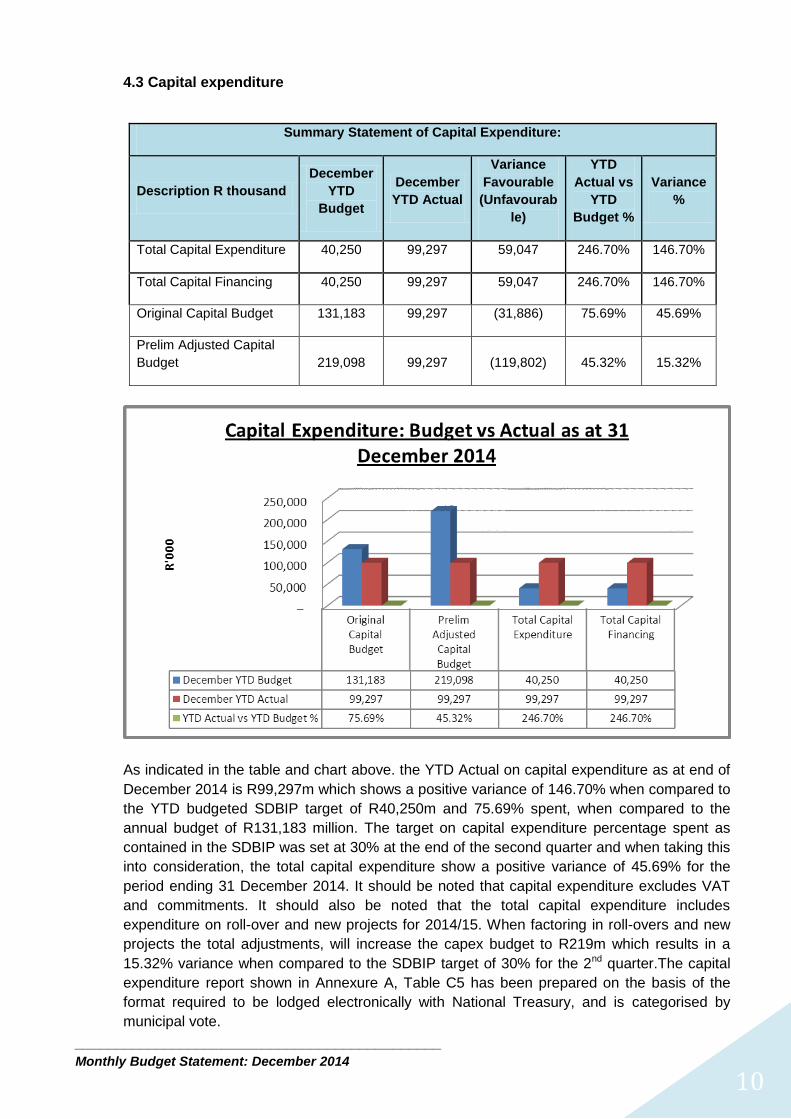
4.3 Capital expenditure
Summary Statement of Capital Expenditure:
Description R thousand
December
YTD
Budget
December
YTD Actual
Variance
Favourable
(Unfavourab
le)
YTD
Actual vs
YTD
Budget %
Variance
%
Total Capital Expenditure 40,250 99,297 59,047 246.70% 146.70%
Total Capital Financing 40,250 99,297 59,047 246.70% 146.70%
Original Capital Budget 131,183 99,297 (31,886) 75.69% 45.69%
Prelim Adjusted Capital
Budget 219,098 99,297 (119,802) 45.32% 15.32%
As indicated in the table and chart above. the YTD Actual on capital expenditure as at end of
December 2014 is R99,297m which shows a positive variance of 146.70% when compared to
the YTD budgeted SDBIP target of R40,250m and 75.69% spent, when compared to the
annual budget of R131,183 million. The target on capital expenditure percentage spent as
contained in the SDBIP was set at 30% at the end of the second quarter and when taking this
into consideration, the total capital expenditure show a positive variance of 45.69% for the
period ending 31 December 2014. It should be noted that capital expenditure excludes VAT
and commitments. It should also be noted that the total capital expenditure includes
expenditure on roll-over and new projects for 2014/15. When factoring in roll-overs and new
projects the total adjustments, will increase the capex budget to R219m which results in a
15.32% variance when compared to the SDBIP target of 30% for the 2nd quarter.The capital
expenditure report shown in Annexure A, Table C5 has been prepared on the basis of the
format required to be lodged electronically with National Treasury, and is categorised by
municipal vote.
_____________________________________________
Monthly Budget Statement: December 2014
11
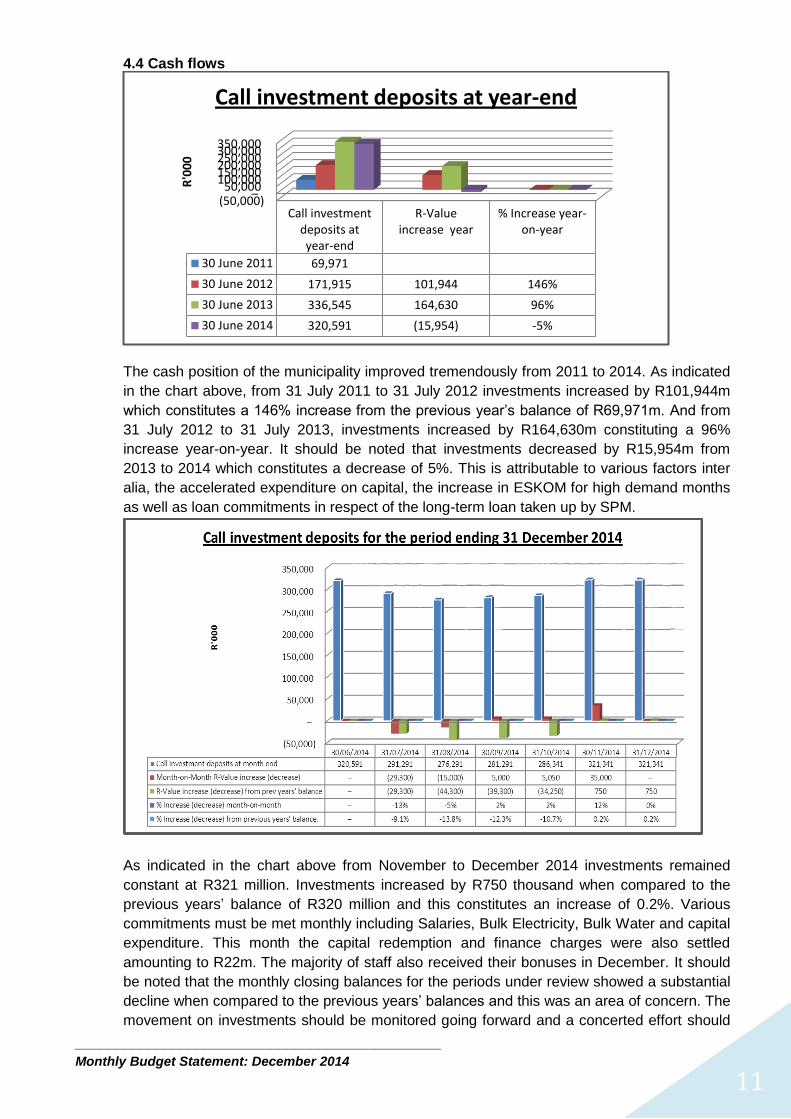
4.4 Cash flows
The cash position of the municipality improved tremendously from 2011 to 2014. As indicated
in the chart above, from 31 July 2011 to 31 July 2012 investments increased by R101,944m
which constitutes a 146% increase from the previous year‟s balance of R69,971m. And from
31 July 2012 to 31 July 2013, investments increased by R164,630m constituting a 96%
increase year-on-year. It should be noted that investments decreased by R15,954m from
2013 to 2014 which constitutes a decrease of 5%. This is attributable to various factors inter
alia, the accelerated expenditure on capital, the increase in ESKOM for high demand months
as well as loan commitments in respect of the long-term loan taken up by SPM.
As indicated in the chart above from November to December 2014 investments remained
constant at R321 million. Investments increased by R750 thousand when compared to the
previous years‟ balance of R320 million and this constitutes an increase of 0.2%. Various
commitments must be met monthly including Salaries, Bulk Electricity, Bulk Water and capital
expenditure. This month the capital redemption and finance charges were also settled
amounting to R22m. The majority of staff also received their bonuses in December. It should
be noted that the monthly closing balances for the periods under review showed a substantial
decline when compared to the previous years‟ balances and this was an area of concern. The
movement on investments should be monitored going forward and a concerted effort should
(50,000) –
50,000 100,000 150,000 200,000 250,000 300,000 350,000
Call investmentdeposits atyear-end
R-Valueincrease year
% Increase year-on-year
30 June 2011 69,971
30 June 2012 171,915 101,944 146%
30 June 2013 336,545 164,630 96%
30 June 2014 320,591 (15,954) -5%
R'0
00
Call investment deposits at year-end

_____________________________________________
Monthly Budget Statement: December 2014
12
be done to collect current and long outstanding debt. It should be noted that the other major
impact is a result of NERSA not approving the tariff for large power users. An appeal was
lodged with the Regulator but we are still awaiting a response from them. This is putting strain
on SPM‟s cash flow, on the current and future budget cycles.
5. In-year budget statement tables The financial results for the period ended 31 December 2014 are attached consisting of the
following tables, in Annexure A: Part 1
(a) Table C1: Consolidated Monthly Budget Statement – Summary
(b) Table C2: Consolidated Monthly Budget Statement – Financial Performance (standard
Classification)
(c) Table C3: Consolidated Monthly Budget Statement – Financial Performance
(Revenue and Expenditure by Municipal vote)
(d) Table C4: Consolidated Monthly Budget Statement – Financial Performance
(Revenue and Expenditure)
(e) Table C5: Consolidated Monthly Budget Statement – Capital Expenditure by vote,
standard classification and funding
(f) Table C6: Consolidated Monthly Budget Statement – Financial Position
(g) Table C7: Consolidated Monthly Budget Statement – Cash Flow
(h) Table SC1: Material variance explanations
_____________________________________________
Monthly Budget Statement: December 2014
13
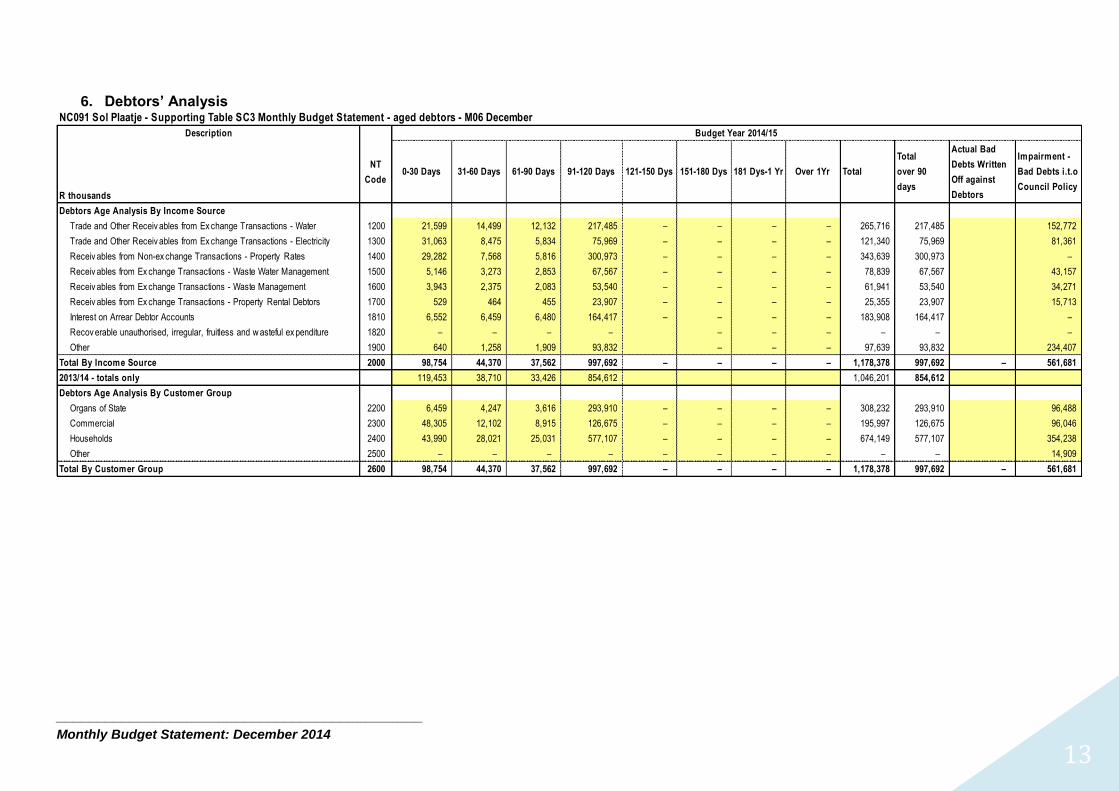
6. Debtors’ Analysis
Description
R thousands
NT
Code0-30 Days 31-60 Days 61-90 Days 91-120 Days 121-150 Dys 151-180 Dys 181 Dys-1 Yr Over 1Yr Total
Total
over 90
days
Actual Bad
Debts Written
Off against
Debtors
Impairment -
Bad Debts i.t.o
Council Policy
Debtors Age Analysis By Income Source
Trade and Other Receiv ables from Ex change Transactions - Water 1200 21,599 14,499 12,132 217,485 – – – – 265,716 217,485 152,772
Trade and Other Receiv ables from Ex change Transactions - Electricity 1300 31,063 8,475 5,834 75,969 – – – – 121,340 75,969 81,361
Receiv ables from Non-ex change Transactions - Property Rates 1400 29,282 7,568 5,816 300,973 – – – – 343,639 300,973 –
Receiv ables from Ex change Transactions - Waste Water Management 1500 5,146 3,273 2,853 67,567 – – – – 78,839 67,567 43,157
Receiv ables from Ex change Transactions - Waste Management 1600 3,943 2,375 2,083 53,540 – – – – 61,941 53,540 34,271
Receiv ables from Ex change Transactions - Property Rental Debtors 1700 529 464 455 23,907 – – – – 25,355 23,907 15,713
Interest on Arrear Debtor Accounts 1810 6,552 6,459 6,480 164,417 – – – – 183,908 164,417 –
Recov erable unauthorised, irregular, fruitless and w asteful ex penditure 1820 – – – – – – – – – –
Other 1900 640 1,258 1,909 93,832 – – – 97,639 93,832 234,407
Total By Income Source 2000 98,754 44,370 37,562 997,692 – – – – 1,178,378 997,692 – 561,681
2013/14 - totals only 119,453 38,710 33,426 854,612 1,046,201 854,612
Debtors Age Analysis By Customer Group
Organs of State 2200 6,459 4,247 3,616 293,910 – – – – 308,232 293,910 96,488
Commercial 2300 48,305 12,102 8,915 126,675 – – – – 195,997 126,675 96,046
Households 2400 43,990 28,021 25,031 577,107 – – – – 674,149 577,107 354,238
Other 2500 – – – – – – – – – – 14,909
Total By Customer Group 2600 98,754 44,370 37,562 997,692 – – – – 1,178,378 997,692 – 561,681
NC091 Sol Plaatje - Supporting Table SC3 Monthly Budget Statement - aged debtors - M06 December
Budget Year 2014/15

_____________________________________________
Monthly Budget Statement: December 2014 14
Indicated in the table below is the month-on-month growth in outstanding gross debtors from
November 2014 to December 2014.
Debtors Age Analysis By Income Source
Balance
November 2014
Balance
December 2014
Percentage
month-on-
month
Increase/
(Decrease) in
Debtors
R-Value
Increase/(De
crease)
As a % of
total o/s
debt
Trade and Other Receivables from Exchange Transactions - Water
277,734,624 265,716,131 -4.5% -12,018,493 23%
Trade and Other Receivables from Exchange Transactions - Electricity
125,150,217 121,340,439 -3.1% -3,809,778 10%
Receivables from Non-exchange Transactions - Property Rates
332,518,205 343,639,042 3.2% 11,120,837 29%
Receivables from Exchange Transactions - Waste Water Management
80,550,357 78,839,044 -2.2% -1,711,313 7%
Receivables from Exchange Transactions - Waste Management
63,017,810 61,940,711 -1.7% -1,077,099 5%
Receivables from Exchange Transactions - Property Rental Debtors
24,991,571 25,354,951
363,380 2%
Interest on Arrear Debtor Accounts
184,651,226 183,908,419 -0.4% -742,807 16%
Recoverable unauthorised, irregular or fruitless and wasteful Expenditure
- -
-
Other
103,281,934 97,638,908 -5.8% -5,643,026 8%
Total By Income Source 1,191,895,944 1,178,377,645 -1.1% -13,518,299 100%
Debtors Age Analysis By Customer Group
Organs of State
308,831,017 308,231,617 -0.2% -599,400 26%
Commercial
222,330,551 195,996,614 -13.4% -26,333,937 17%
Households
660,734,376 674,149,414 2.0% 13,415,038 57%
Other
0 0
0 0%
Total By Customer Group 1,191,895,944 1,178,377,645 -1.1% -13,518,299 100%
Outstanding debt per income source decreased by 1.1%. Electricity decreased by 3.1%.
Debt on Property Rates increased by 3.2%, Sale of Water decreased by 4.5%.
All other Debtors by customer group decreased as indicated in the table above except for
debt owed by Households. Outstanding debt on Organs of State decreased by 0.2% and
Commercial debtors decreased by 13.4% Government debt constitutes 26% of total
outstanding debt. Households constituting 57%, and Businesses 17%.

_____________________________________________
Monthly Budget Statement: December 2014 15
_____________________________________________
Monthly Budget Statement: December 2014 16
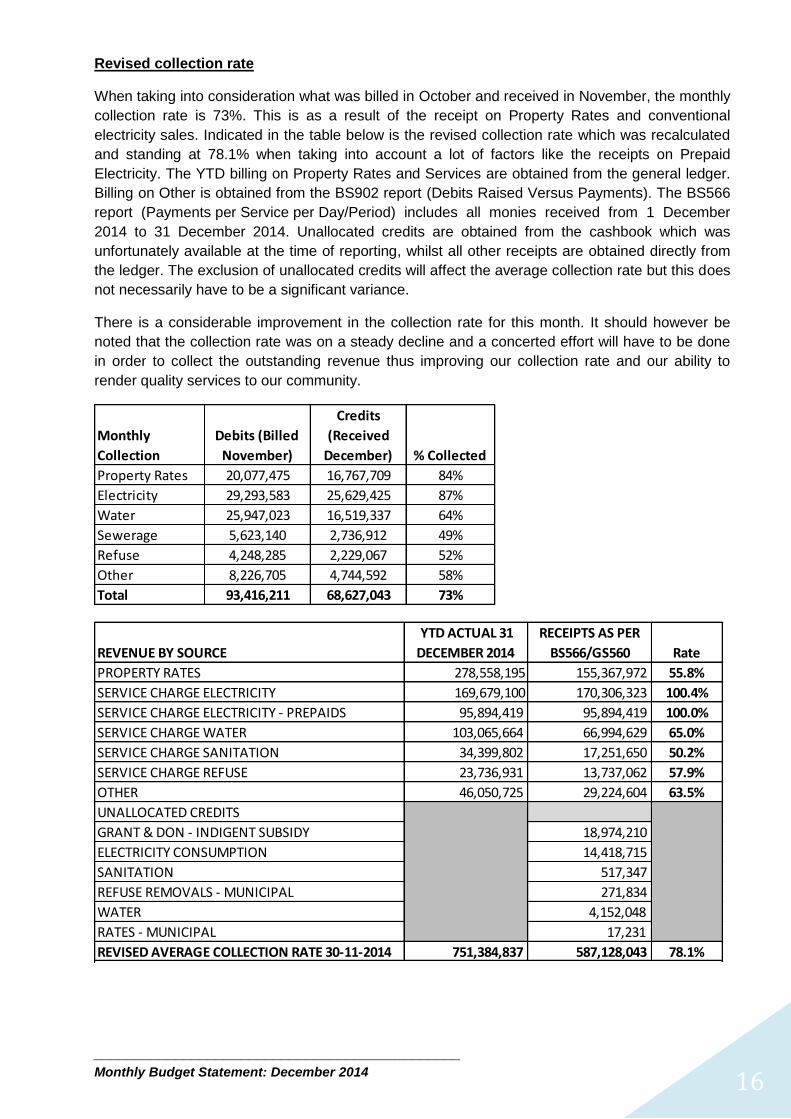
Revised collection rate
When taking into consideration what was billed in October and received in November, the monthly
collection rate is 73%. This is as a result of the receipt on Property Rates and conventional
electricity sales. Indicated in the table below is the revised collection rate which was recalculated
and standing at 78.1% when taking into account a lot of factors like the receipts on Prepaid
Electricity. The YTD billing on Property Rates and Services are obtained from the general ledger.
Billing on Other is obtained from the BS902 report (Debits Raised Versus Payments). The BS566
report (Payments per Service per Day/Period) includes all monies received from 1 December
2014 to 31 December 2014. Unallocated credits are obtained from the cashbook which was
unfortunately available at the time of reporting, whilst all other receipts are obtained directly from
the ledger. The exclusion of unallocated credits will affect the average collection rate but this does
not necessarily have to be a significant variance.
There is a considerable improvement in the collection rate for this month. It should however be
noted that the collection rate was on a steady decline and a concerted effort will have to be done
in order to collect the outstanding revenue thus improving our collection rate and our ability to
render quality services to our community.
Monthly
Collection
Debits (Billed
November)
Credits
(Received
December) % Collected
Property Rates 20,077,475 16,767,709 84%
Electricity 29,293,583 25,629,425 87%
Water 25,947,023 16,519,337 64%
Sewerage 5,623,140 2,736,912 49%
Refuse 4,248,285 2,229,067 52%
Other 8,226,705 4,744,592 58%
Total 93,416,211 68,627,043 73%
REVENUE BY SOURCE
YTD ACTUAL 31
DECEMBER 2014
RECEIPTS AS PER
BS566/GS560 Rate
PROPERTY RATES 278,558,195 155,367,972 55.8%
SERVICE CHARGE ELECTRICITY 169,679,100 170,306,323 100.4%
SERVICE CHARGE ELECTRICITY - PREPAIDS 95,894,419 95,894,419 100.0%
SERVICE CHARGE WATER 103,065,664 66,994,629 65.0%
SERVICE CHARGE SANITATION 34,399,802 17,251,650 50.2%
SERVICE CHARGE REFUSE 23,736,931 13,737,062 57.9%
OTHER 46,050,725 29,224,604 63.5%
UNALLOCATED CREDITS
GRANT & DON - INDIGENT SUBSIDY 18,974,210
ELECTRICITY CONSUMPTION 14,418,715
SANITATION 517,347
REFUSE REMOVALS - MUNICIPAL 271,834
WATER 4,152,048
RATES - MUNICIPAL 17,231
REVISED AVERAGE COLLECTION RATE 30-11-2014 751,384,837 587,128,043 78.1%

_____________________________________________
Monthly Budget Statement: December 2014 17
7. Creditors’ Analysis
Bulk Electricity - The outstanding ESKOM account for December 2014 will be settled in January
2015.
Bulk Water - The only outstanding invoices are for December 2014 of which are still awaiting the
originals. We are opting to settle the copy tax invoices whilst awaiting the originals. The purpose is
to prevent the delay in settling bulk creditors and for cash flow purposes as well.
PAYE and Pension deductions are paid over monthly to the relevant institutions.
Loan repayments – the first bi-annual payment on the loan repayments which was due at the end
of December amounted to R6,564m for capital redemption and R15,539m in respect of interest.
Other creditors are invoices raised on our account. From DWA for the Water and Research Levy
Fees
Budget Year 2014/15
R thousands
Creditors Age Analysis By Customer Type
Bulk Electricity 0100 26,049 – – – – – – – 26,049 45,295
Bulk Water 0200 8,028 – – – – – – – 8,028 –
PAYE deductions 0300 6,204 – – – – – – – 6,204 4,758
VAT (output less input) 0400 – – – – – – – – – –
Pensions / Retirement deductions 0500 5,553 – – – – – – – 5,553 3,143
Loan repay ments 0600 22,102 – – – – – – – 22,102 –
Trade Creditors 0700 18,425 – – – – – – – 18,425 34,221
Auditor General 0800 – – – – – – – – – –
Other 0900 187 – – – – – – – 187 34,080
Total By Customer Type 1000 86,548 – – – – – – – 86,548 121,496
NT
Code0 -
30 Days
31 -
60 Days
Prior y ear
totals for chart
(same period)
NC091 Sol Plaatje - Supporting Table SC4 Monthly Budget Statement - aged creditors - M06 December
181 Days -
1 Year
Over 1
Year
Total61 -
90 Days
91 -
120 Days
121 -
150 Days
151 -
180 Days
Description

_____________________________________________
Monthly Budget Statement: December 2014 18
8. Investment portfolio analysis
The market value of the investment portfolio has been utilized and for the period ending 31
December 2014 the value of total investments made was R 321 million.
Investments by maturity
Name of institution & investment ID
Period of
Investment
R thousands Yrs/Months
Municipality
Absa Bank 20-7127-2547 4 mths Notice 16.02.2015 27 06.34 5,000 5,000
First Rand PVH4A06025 6 mths Notice 06.02.2015 54 06.30 10,000 10,000
Nedbank 9002324052 INV.124 4 mths Notice 04.03.2015 86 06.74 15,000 15,000
Absa Bank 20-7018-8810 6 mths Notice 04.06.2015 56 06.60 10,000 10,000
Inv estec Bank DBRK140968566 4 mths Notice 29.01.2015 54 06.40 10,000 10,000
Inv estec Bank DBRK141669169 4 mths Notice 06.02.2015 27 06.35 5,000 5,000
Absa Bank 20-7228-1090 4 mths Notice 17.03.2015 27 06.29 5,000 5,000
Standard Bank 048466271-039 12 mths Fix ed 01.04.2015 124 06.95 20,973 20,973
Absa Bank 20 -6295-4443 12 mths Fix ed 24.06.2015 14 07.00 2,418 2,418
Absa Bank 20-7291-5615 6 mths Notice 03.06.2015 58 06.85 10,000 10,000
Absa Bank 20-7315-5743 6 mths Notice 02.03.2015 57 06.77 10,000 10,000
Absa Bank 20-7325-2802 6 mths Notice 09.04.2015 87 06.85 15,000 15,000
Standard Bank 048466271-043 4 mths Notice 06.02.2015 27 06.475 5,000 5,000
Standard Bank 048466271-044 6 mths Notice 15.04.2015 87 06.85 15,000 15,000
First Rand PVHA13024 4 mths Notice 16.02.2015 27 06.25 5,000 5,000
First Rand PVH4916012 4 mths Notice 16.01.2015 32 06.25 6,000 6,000
First Rand PVH4A23020 4 mths Notice 23.02.2015 53 06.25 10,000 10,000
First Rand PVH4409038 6 mths Notice 09.04.2015 86 06.75 15,000 15,000
First Rand PVH4819006 6 mths Notice 16.02.2015 28 06.55 5,000 5,000
Inv estec Bank DB RK140867202 6 mths Notice 09.03.2015 29 06.75 5,000 5,000
Inv estec Bank DB RK141373258 6 mths Notice 03.06.2015 58 06.85 10,000 10,000
Inv estec Bank DB MM140866539 6 mths Notice 02.03.2015 57 06.75 10,000 10,000
Inv estec Bank DB RK141569866 6 mths Notice 15.04.2015 89 06.95 15,000 15,000
Nedbank 9002324052 INV.125 6 mths Notice 09.03.2015 29 06.74 5,000 5,000
Nedbank 9002324052 INV.130 6 mths Notice 04.06.2015 55 06.56 10,000 10,000
Nedbank 9002324052 INV.127 4 mths Notice 23.02.2015 27 06.25 5,000 5,000
Nedbank 9002324052 INV.126 6 mths Notice 15.04.2015 85 06.69 15,000 15,000
Nedbank 9002324052 INV.129 4 mths Notice 19.03.2015 27 06.25 5,000 5,000
First Rand,Nedbank,S'dard,Inv estec, Call a/c 266 05.05 61,950 61,950
Municipality sub-total 1,731 321,341 – 321,341
TOTAL INVESTMENTS AND INTEREST 2 1,731 321,341 – 321,341
NC091 Sol Plaatje - Supporting Table SC5 Monthly Budget Statement - investment portfolio - M06 December
Ref
Type of
Investment
Expiry date
of
investment
Market
value at end
of the
month
Accrued
interest for
the month
Yield for the
month 1
(%)
Market
value at
beginning
of the
month
Change in
market
value

_____________________________________________
Monthly Budget Statement: December 2014 19
9. Allocation and grant receipts and expenditure
2013/14 Budget Year 2014/15
Audited
Outcome
Original
Budget
Adjusted
Budget
Monthly
actual
YearTD
actual
YearTD
budget
YTD
variance
YTD
variance
Full Year
Forecast
R thousands %
RECEIPTS: 1,2
Operating Transfers and Grants
National Government: 157,963 155,804 – – 113,815 64,918 45,908 70.7% 155,804
Local Gov ernment Equitable Share 145,905 145,440 – 106,050 60,600 45,450 75.0% 145,440
Finance Management 1,550 1,600 – 1,600 667 1,600
Municipal Sy stems Improv ement 890 934 – 934 389 934
EPWP Incentiv e 6,618 5,330 – 3,731 2,221 5,330
Infrastructure Skills Dev elopment 3,000 2,500 – 1,500 1,042 458 44.0% 2,500
Provincial Government: 2,146 7,372 – – 2,587 3,072 (485) -15.8% 7,372
Health subsidy 865 2,809 – 2,587 1,170 1,416 121.0% 2,809
COGHSTA
DWA –
Library 4 1,281 4,563 – – 1,901 (1,901) -100.0% 4,563
Prov incial Resort Subsidy –
District Municipality: 1,800 – – – – – – –
Frances Baard District Municipality 1,800 –
–
Other grant providers: 1,525 1,534 – – – 639 (639) -100.0% 1,534
MIG ops 1,534 639 (639) -100.0% 1,534
Other grant providers: 1,525
Total Operating Transfers and Grants 5 163,434 164,710 – – 116,402 68,629 44,784 65.3% 164,710
Capital Transfers and Grants
National Government: 87,860 78,677 – 22,019 36,041 32,782 14,009 42.7% 78,677
Municipal Infrastructure Grant (MIG) 52,243 45,677 22,019 33,041 19,032 14,009 73.6% 45,677
Neighbourhood Dev elopment Partnership 5,000 2,083 5,000
Municipal Infrastructure Grant (MIG)
INEP 20,000 3,000 – 3,000 1,250 3,000
Department of Water Affairs 15,617 25,000 10,417 25,000
INEP (Eskom) –
Provincial Government: 15,905 10,250 – – – 4,271 (4,271) -100.0% 10,250
DWA 5,000 5,000 2,083 (2,083) -100.0% 5,000
COGHSTA 10,905 –
DHLG (GURP) 5,250 2,188 5,250
District Municipality: 4,284 – – – – – – –
Frances Baard District Municipality 4,284 –
Other grant providers: – – – – – – – –
Transnet – –
Other –
Total Capital Transfers and Grants 5 108,049 88,927 – 22,019 36,041 37,053 9,738 26.3% 88,927
TOTAL RECEIPTS OF TRANSFERS & GRANTS 5 271,484 253,637 – 22,019 152,443 105,682 54,522 51.6% 253,637
Description Ref
NC091 Sol Plaatje - Supporting Table SC6 Monthly Budget Statement - transfers and grant receipts - M06 December

_____________________________________________
Monthly Budget Statement: December 2014 20
Operational Grants
Expenditure on EPWP is showing as a negative as a result of the correction on the expenditure to
be aligned to the annual allocation as per requirement by the DPW. According to the Department
we are not allowed to report on expenditure in excess of the gazetted amount. We are however
experiencing huge challenges in respect of funding for the EPWP which is not sufficient and this is
putting strain on our cash flow and which is not affordable nor sustainable. As at 31 December
2014, the total expenditure incurred on EPWP is R8,852 million whilst the gazetted allocation is
only R5,330 million. Management is in a process of reviewing this programme. It should also be
noted that nothing has been gazetted for the two outer years of the current MTREF.
Capital Grants
Expenditure on MIG and INEP is performing exceptionally well. The total funds transferred in
respect of MIG was R33,041 million whilst the total YTD expenditure is R35,278 million which
constitutes a 106.7% spent. The total gazetted MIG funds are R47,211m and the YTD
expenditure achieved against MIG is 75% spent.
2013/14 Budget Year 2014/15
Audited
Outcome
Original
Budget
Adjusted
Budget
Monthly
actual
YearTD
actual
YearTD
budget
YTD
variance
YTD
variance
Full Year
Forecast
R thousands %
EXPENDITURE
Operating expenditure of Transfers and Grants
National Government: 157,995 155,804 – (1,535) 114,031 77,902 36,129 46.4% 155,804
Local Gov ernment Equitable Share 145,905 145,440 – 106,050 72,720 33,330 45.8% 145,440
Finance Management 1,550 1,600 87 1,056 800 256 32.0% 1,600
Municipal Sy stems Improv ement 890 934 168 276 467 (191) -40.9% 934
EPWP Incentiv e 6,618 5,330 (2,098) 5,330 2,665 2,665 100.0% 5,330
Infrastructure Skills Dev elopment 3,032 2,500 308 1,319 1,250 69 5.5% 2,500
Provincial Government: 4,369 7,372 – 1,174 7,503 3,686 3,817 103.6% 7,372
Health subsidy 2,663 2,809 968 5,336 1,405 3,932 279.9% 2,809
DWA –
Library 1,706 4,563 206 2,167 2,282 (114) -5.0% 4,563
Prov incial Resort Subsidy –
District Municipality: 1,800 – – – – – – –
Frances Baard District Municipality 1,800 –
Other grant providers: 2,437 1,534 – 142 814 767 47 6.1% 1,534
Other 1,100 –
MIG ops 1,337 1,534 142 814 767 47 6.1% 1,534
Total operating expenditure of Transfers and Grants: 166,601 164,710 – (219) 122,348 82,355 39,993 48.6% 164,710
Capital expenditure of Transfers and Grants
National Government: 114,743 78,677 – 250 37,370 39,339 (1,968) -5.0% 78,677
Municipal Infrastructure Grant (MIG) 54,045 45,677 250 34,464 22,839 11,626 50.9% 45,677
Neighbourhood Dev elopment Partnership 7,220 5,000 – – 2,500 (2,500) -100.0% 5,000
EDSM 4,948 – – – –
INEP 32,914 3,000 – 2,906 1,500 1,406 93.7% 3,000
Department of Water Affairs 15,617 25,000 12,500 (12,500) -100.0% 25,000
INEP (Eskom) –
Provincial Government: 21,126 10,250 – – – 5,125 (5,125) -100.0% 10,250
DWA 5,000 5,000 2,500 (2,500) -100.0% 5,000
COGHSTA 15,165
DHLG (GURP) 960 5,250 2,625 (2,625) -100.0% 5,250
District Municipality: 4,284 – – – – – – –
Frances Baard District Municipality 4,284 –
Other grant providers: – – – – – – – –
Transnet –
Other –
Total capital expenditure of Transfers and Grants 140,153 88,927 – 250 37,370 44,464 (7,093) -16.0% 88,927
TOTAL EXPENDITURE OF TRANSFERS AND GRANTS 306,754 253,637 – 31 159,718 126,819 32,899 25.9% 253,637
Description Ref
NC091 Sol Plaatje - Supporting Table SC7(1) Monthly Budget Statement - transfers and grant expenditure - M06 December

_____________________________________________
Monthly Budget Statement: December 2014 21
The final roll-over approval granted by NT in terms of section 21(2) of the DoRA (Act No. 2 of
2013) for the municipality was in respect of ISDG amounting to R1.6 million. The YTD
performance is satisfactory with 83% of the roll-over funds already spent as at 31 December
2014. There are a few challenges pertaining to the current year‟s allocation of R2.5 million but a
concerted effort needs to done to have the funds fully spent at year-end.
Approved
Rollover
2013/14
Monthly actual YearTD actual YTD variance YTD variance
R thousands %
EXPENDITURE
Operating expenditure of Approved Roll-overs
National Government: 1,592 308 1,319 273 17.1%
Infrastructure Skills Dev elopment 1,592 308 1,319 273 17.1%
Provincial Government: – – – –
District Municipality: – – – –
Other grant providers: – – – –
MIG ops –
Total operating expenditure of Approved Roll-overs 1,592 308 1,319 273 17.1%
Capital expenditure of Approved Roll-overs
National Government: – – – –
Provincial Government: – – – –
District Municipality: – – – –
Other grant providers: – – – –
Total capital expenditure of Approved Roll-overs – – – –
TOTAL EXPENDITURE OF APPROVED ROLL-OVERS 1,592 308 1,319 273 17.1%
NC091 Sol Plaatje - Supporting Table SC7(2) Monthly Budget Statement - Expenditure against approved rollovers - M06 December
Description Ref
Budget Year 2014/15

_____________________________________________
Monthly Budget Statement: December 2014 22
10. Councillor and board member allowances and employee benefits
2013/14 Budget Year 2014/15
Audited
Outcome
Original
Budget
Adjusted
Budget
Monthly
actual
YearTD
actual
YearTD
budget
YTD
variance
YTD
variance
Full Year
Forecast
R thousands %
1 A B C D
Councillors (Political Office Bearers plus Other)
Basic Salaries and Wages 12,114 18,300 1,069 6,396 9,150 (2,754) -30% 18,300
Pension and UIF Contributions 797 47 284 284 #DIV/0! –
Medical Aid Contributions 460 38 236 236 #DIV/0! –
Motor Vehicle Allow ance 3,554 289 1,724 1,724 #DIV/0! –
Cellphone Allow ance 1,534 128 766 766 #DIV/0! –
Housing Allow ances – –
Other benefits and allow ances 1,668 834 (834) -100% 1,668
Sub Total - Councillors 18,459 19,968 – 1,571 9,405 9,984 (579) -6% 19,968
% increase 4 8.2% 8.2%
Senior Managers of the Municipality 3
Basic Salaries and Wages 5,130 6,390 533 3,769 3,195 574 18% 6,390
Pension and UIF Contributions 815 1,168 100 705 584 121 21% 1,168
Medical Aid Contributions 192 215 15 94 107 (13) -12% 215
Ov ertime – – –
Performance Bonus – – –
Motor Vehicle Allow ance 2,008 1,992 216 1,356 996 360 36% 1,992
Cellphone Allow ance 102 17 101 – 101 #DIV/0! –
Housing Allow ances 55 36 3 55 18 37 210% 36
Other benefits and allow ances 309 828 47 401 414 (13) -3% 828
Pay ments in lieu of leav e 74 70 70 #DIV/0! –
Long serv ice aw ards 29 2 14 14 #DIV/0! –
Post-retirement benefit obligations 2 – –
Sub Total - Senior Managers of Municipality 8,713 10,628 – 932 6,567 5,314 1,253 24% 10,628
% increase 4 22.0% 22.0%
Other Municipal Staff
Basic Salaries and Wages 249,375 293,953 22,290 133,790 146,977 (13,187) -9% 293,953
Pension and UIF Contributions 55,411 47,571 3,871 23,502 23,785 (284) -1% 47,571
Medical Aid Contributions 29,797 37,026 3,180 18,031 18,513 (482) -3% 37,026
Ov ertime 21,433 17,549 2,051 12,080 8,774 3,305 38% 17,549
Performance Bonus – – –
Motor Vehicle Allow ance 28,851 27,936 3,166 17,497 13,968 3,528 25% 27,936
Cellphone Allow ance – – –
Housing Allow ances 1,615 1,966 152 878 983 (106) -11% 1,966
Other benefits and allow ances 40,979 47,684 12,807 28,888 23,842 5,046 21% 47,684
Pay ments in lieu of leav e 8,664 7,500 575 3,489 3,750 (261) -7% 7,500
Long serv ice aw ards 9,075 11,404 975 5,789 5,702 87 2% 11,404
Post-retirement benefit obligations 2 21,669 44,406 22,203 (22,203) -100% 44,406
Sub Total - Other Municipal Staff 466,870 536,996 – 49,067 243,941 268,498 (24,556) -9% 536,996
% increase 4 15.0% 15.0%
Total Parent Municipality 494,042 567,591 – 51,570 259,913 283,796 (23,882) -8% 567,591
TOTAL SALARY, ALLOWANCES & BENEFITS 494,042 567,591 – 51,570 259,913 283,796 (23,882) -8% 567,591
% increase 4 14.9% 14.9%
TOTAL MANAGERS AND STAFF 475,583 547,624 – 49,999 250,508 273,812 (23,304) -9% 547,624
Summary of Employee and Councillor remuneration Ref
NC091 Sol Plaatje - Supporting Table SC8 Monthly Budget Statement - councillor and staff benefits - M06 December

_____________________________________________
Monthly Budget Statement: December 2014 23
11. Material variances to the service delivery and budget implementation plan Other Material variances to the SDBIP will be included in the section 72 Mid-year Budget and
Performance Assessment report for the period ending 31 December 2014.
12. Capital programme performance
Please refer to notes on Capital Expenditure in the Executive Summary.
_____________________________________________
Monthly Budget Statement: December 2014 24
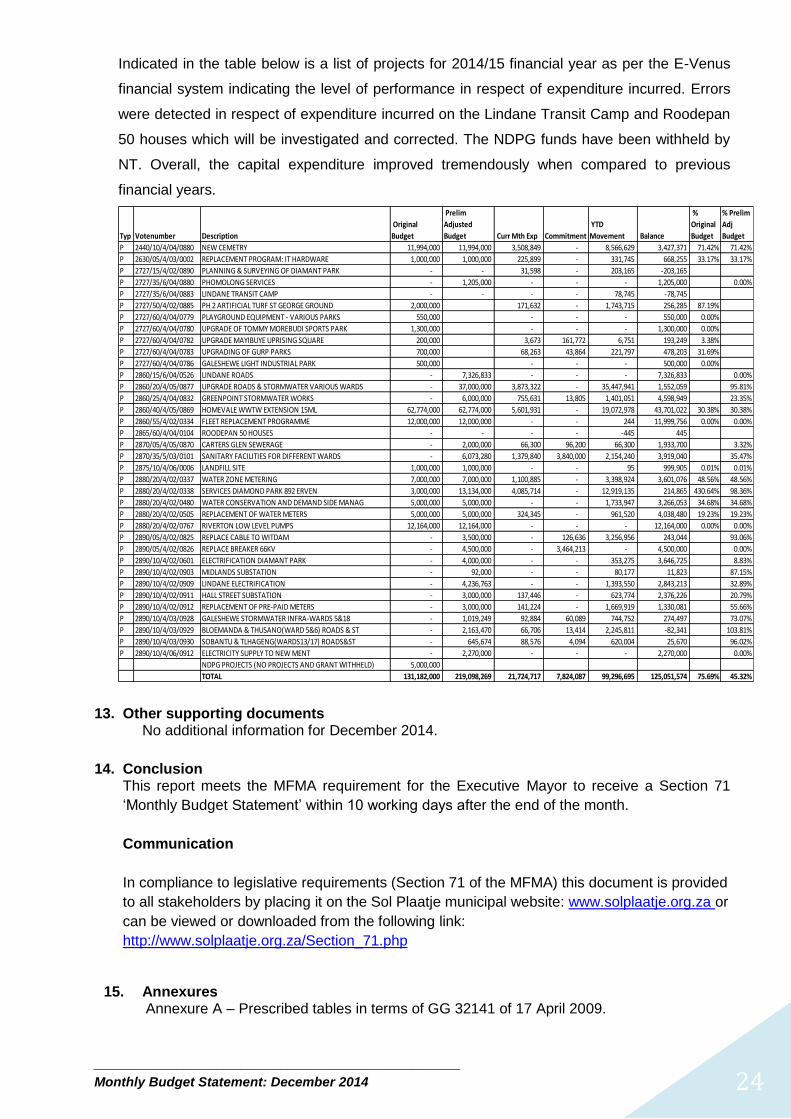
Indicated in the table below is a list of projects for 2014/15 financial year as per the E-Venus
financial system indicating the level of performance in respect of expenditure incurred. Errors
were detected in respect of expenditure incurred on the Lindane Transit Camp and Roodepan
50 houses which will be investigated and corrected. The NDPG funds have been withheld by
NT. Overall, the capital expenditure improved tremendously when compared to previous
financial years.
13. Other supporting documents No additional information for December 2014.
14. Conclusion This report meets the MFMA requirement for the Executive Mayor to receive a Section 71
„Monthly Budget Statement‟ within 10 working days after the end of the month.
Communication
In compliance to legislative requirements (Section 71 of the MFMA) this document is provided
to all stakeholders by placing it on the Sol Plaatje municipal website: www.solplaatje.org.za or
can be viewed or downloaded from the following link:
http://www.solplaatje.org.za/Section_71.php
15. Annexures Annexure A – Prescribed tables in terms of GG 32141 of 17 April 2009.
Typ Votenumber Description
Original
Budget
Prelim
Adjusted
Budget Curr Mth Exp
Commitment
YTD
Movement Balance
%
Original
Budget
% Prelim
Adj
Budget
P 2440/10/4/04/0880 NEW CEMETRY 11,994,000 11,994,000 3,508,849 - 8,566,629 3,427,371 71.42% 71.42%
P 2630/05/4/03/0002 REPLACEMENT PROGRAM: IT HARDWARE 1,000,000 1,000,000 225,899 - 331,745 668,255 33.17% 33.17%
P 2727/15/4/02/0890 PLANNING & SURVEYING OF DIAMANT PARK - - 31,598 - 203,165 -203,165
P 2727/35/6/04/0880 PHOMOLONG SERVICES - 1,205,000 - - - 1,205,000 0.00%
P 2727/35/6/04/0883 LINDANE TRANSIT CAMP - - - - 78,745 -78,745
P 2727/50/4/02/0885 PH 2 ARTIFICIAL TURF ST GEORGE GROUND 2,000,000 171,632 - 1,743,715 256,285 87.19%
P 2727/60/4/04/0779 PLAYGROUND EQUIPMENT - VARIOUS PARKS 550,000 - - - 550,000 0.00%
P 2727/60/4/04/0780 UPGRADE OF TOMMY MOREBUDI SPORTS PARK 1,300,000 - - - 1,300,000 0.00%
P 2727/60/4/04/0782 UPGRADE MAYIBUYE UPRISING SQUARE 200,000 3,673 161,772 6,751 193,249 3.38%
P 2727/60/4/04/0783 UPGRADING OF GURP PARKS 700,000 68,263 43,864 221,797 478,203 31.69%
P 2727/60/4/04/0786 GALESHEWE LIGHT INDUSTRIAL PARK 500,000 - - - 500,000 0.00%
P 2860/15/6/04/0526 LINDANE ROADS - 7,326,833 - - - 7,326,833 0.00%
P 2860/20/4/05/0877 UPGRADE ROADS & STORMWATER VARIOUS WARDS - 37,000,000 3,873,322 - 35,447,941 1,552,059 95.81%
P 2860/25/4/04/0832 GREENPOINT STORMWATER WORKS - 6,000,000 755,631 13,805 1,401,051 4,598,949 23.35%
P 2860/40/4/05/0869 HOMEVALE WWTW EXTENSION 15ML 62,774,000 62,774,000 5,601,931 - 19,072,978 43,701,022 30.38% 30.38%
P 2860/55/4/02/0334 FLEET REPLACEMENT PROGRAMME 12,000,000 12,000,000 - - 244 11,999,756 0.00% 0.00%
P 2865/60/4/04/0104 ROODEPAN 50 HOUSES - - - - -445 445
P 2870/05/4/05/0870 CARTERS GLEN SEWERAGE - 2,000,000 66,300 96,200 66,300 1,933,700 3.32%
P 2870/35/5/03/0101 SANITARY FACILITIES FOR DIFFERENT WARDS - 6,073,280 1,379,840 3,840,000 2,154,240 3,919,040 35.47%
P 2875/10/4/06/0006 LANDFILL SITE 1,000,000 1,000,000 - - 95 999,905 0.01% 0.01%
P 2880/20/4/02/0337 WATER ZONE METERING 7,000,000 7,000,000 1,100,885 - 3,398,924 3,601,076 48.56% 48.56%
P 2880/20/4/02/0338 SERVICES DIAMOND PARK 892 ERVEN 3,000,000 13,134,000 4,085,714 - 12,919,135 214,865 430.64% 98.36%
P 2880/20/4/02/0480 WATER CONSERVATION AND DEMAND SIDE MANAG 5,000,000 5,000,000 - - 1,733,947 3,266,053 34.68% 34.68%
P 2880/20/4/02/0505 REPLACEMENT OF WATER METERS 5,000,000 5,000,000 324,345 - 961,520 4,038,480 19.23% 19.23%
P 2880/20/4/02/0767 RIVERTON LOW LEVEL PUMPS 12,164,000 12,164,000 - - - 12,164,000 0.00% 0.00%
P 2890/05/4/02/0825 REPLACE CABLE TO WITDAM - 3,500,000 - 126,636 3,256,956 243,044 93.06%
P 2890/05/4/02/0826 REPLACE BREAKER 66KV - 4,500,000 - 3,464,213 - 4,500,000 0.00%
P 2890/10/4/02/0601 ELECTRIFICATION DIAMANT PARK - 4,000,000 - - 353,275 3,646,725 8.83%
P 2890/10/4/02/0903 MIDLANDS SUBSTATION - 92,000 - - 80,177 11,823 87.15%
P 2890/10/4/02/0909 LINDANE ELECTRIFICATION - 4,236,763 - - 1,393,550 2,843,213 32.89%
P 2890/10/4/02/0911 HALL STREET SUBSTATION - 3,000,000 137,446 - 623,774 2,376,226 20.79%
P 2890/10/4/02/0912 REPLACEMENT OF PRE-PAID METERS - 3,000,000 141,224 - 1,669,919 1,330,081 55.66%
P 2890/10/4/03/0928 GALESHEWE STORMWATER INFRA-WARDS 5&18 - 1,019,249 92,884 60,089 744,752 274,497 73.07%
P 2890/10/4/03/0929 BLOEMANDA & THUSANO(WARD 5&6) ROADS & ST - 2,163,470 66,706 13,414 2,245,811 -82,341 103.81%
P 2890/10/4/03/0930 SOBANTU & TLHAGENG(WARDS13/17) ROADS&ST - 645,674 88,576 4,094 620,004 25,670 96.02%
P 2890/10/4/06/0912 ELECTRICITY SUPPLY TO NEW MENT - 2,270,000 - - - 2,270,000 0.00%
NDPG PROJECTS (NO PROJECTS AND GRANT WITHHELD) 5,000,000
TOTAL 131,182,000 219,098,269 21,724,717 7,824,087 99,296,695 125,051,574 75.69% 45.32%

_____________________________________________
Monthly Budget Statement: December 2014
25
Annexure A
NC091 Sol Plaatje - Table C1 Monthly Budget Statement Summary - M06 December
2013/14
Audited
Outcome
Original
Budget
Adjusted
Budget
Monthly
actual
YearTD
actual
YearTD
budget
YTD
variance
YTD
variance
Full Year
Forecast
R thousands %
Financial Performance
Property rates 368,225 397,946 – 32,115 278,558 277,100 1,458 1% 397,946
Serv ice charges 835,048 962,195 – 66,574 426,776 462,054 (35,278) -8% 962,195
Inv estment rev enue 21,413 12,000 – 857 1,146 4,580 (3,434) -75% 12,000
Transfers recognised - operational 166,601 164,710 – 48,480 103,463 105,000 (1,537) -1% 164,710
Other ow n rev enue 130,362 111,558 – 22,346 89,576 36,868 52,709 143% 111,558
Total Revenue (excluding capital transfers
and contributions)
1,521,649 1,648,410 – 170,373 899,520 885,602 13,919 2% 1,648,410
Employ ee costs 474,749 547,624 – 49,999 250,508 265,000 (14,492) -5% 547,624
Remuneration of Councillors 18,459 19,968 – 1,571 9,405 9,984 (579) -6% 19,968
Depreciation & asset impairment 41,988 52,550 – – – 8,758 (8,758) -100% 52,550
Finance charges 28,056 36,559 – 15,539 15,433 18,200 (2,767) -15% 36,559
Materials and bulk purchases 445,262 509,135 – 39,811 226,639 258,340 (31,701) -12% 509,135
Transfers and grants 19,564 54,750 – 2,376 22,033 19,384 2,649 14% 54,750
Other ex penditure 375,484 411,997 – 34,869 297,101 234,874 62,227 26% 411,997
Total Expenditure 1,403,563 1,632,584 – 144,164 821,120 814,540 6,579 1% 1,632,584
Surplus/(Deficit) 118,086 15,826 – 26,209 78,400 71,061 7,339 10% 15,826
Transfers recognised - capital 140,153 88,927 – – – 28,368 (28,368) -100% 88,927
Contributions & Contributed assets 721 – – – – – – –
Surplus/(Deficit) after capital transfers &
contributions
258,960 104,754 – 26,209 78,400 99,429 (21,029) -21% 104,754
Share of surplus/ (deficit) of associate – – – – – – – –
Surplus/ (Deficit) for the year 258,960 104,754 – 26,209 78,400 99,429 (21,029) -21% 104,754
Capital expenditure & funds sources
Capital expenditure 238,409 131,183 – 21,725 99,297 40,250 59,047 147% 131,183
Capital transfers recognised 140,153 88,927 – 14,475 51,227 25,750 25,477 99% 88,927
Public contributions & donations – – – – – – – –
Borrow ing 64,803 – – – – – – –
Internally generated funds 33,453 42,255 – 7,249 48,070 14,500 33,570 232% 42,255
Total sources of capital funds 238,409 131,183 – 21,725 99,297 40,250 59,047 147% 131,183
Financial position
Total current assets 920,546 751,806 – 840,935 751,806
Total non current assets 1,491,500 1,581,719 – 1,592,181 1,581,719
Total current liabilities 255,011 230,326 – 173,572 230,326
Total non current liabilities 482,036 502,441 – 506,144 502,441
Community wealth/Equity 1,674,999 1,600,758 – 1,753,400 1,600,758
Cash flows
Net cash from (used) operating 175,143 159,383 – 17,857 120,995 236,449 115,454 49% 159,383
Net cash from (used) inv esting (238,409) (131,183) – (21,725) (99,297) (40,250) 59,047 -147% (131,183)
Net cash from (used) financing 44,500 (14,564) – – (6,564) (7,913) (1,349) 17% (14,564)
Cash/cash equivalents at the month/year end 305,199 250,538 – – 320,334 425,187 104,853 25% 318,836
Debtors & creditors analysis 0-30 Days 31-60 Days 61-90 Days 91-120 Days 121-150 Dys 151-180 Dys181 Dys-
1 YrOver 1Yr Total
Debtors Age Analysis
Total By Income Source 98,754 44,370 37,562 997,692 – – – – 1,178,378
Creditors Age Analysis
Total Creditors 86,548 – – – – – – – 86,548
Description
Budget Year 2014/15

_____________________________________________
Monthly Budget Statement: December 2014
26
2013/14 Budget Year 2014/15
Audited
Outcome
Original
Budget
Adjusted
Budget
Monthly
actual
YearTD
actual
YearTD
budget
YTD
variance
YTD
variance
Full Year
Forecast
R thousands 1 %
Revenue - Standard
Governance and administration 772,885 720,716 – 32,824 432,272 455,765 (23,493) -5% 720,716
Ex ecutiv e and council 386,279 302,496 – – 147,766 173,665 (25,899) -15% 302,496
Budget and treasury office 379,124 403,348 – 32,469 283,238 277,100 6,138 2% 403,348
Corporate serv ices 7,483 14,872 – 355 1,267 5,000 (3,733) -75% 14,872
Community and public safety 37,561 34,244 – 13,730 24,658 11,421 13,237 116% 34,244
Community and social serv ices 15,697 16,147 – 579 3,524 4,000 (476) -12% 16,147
Sport and recreation 8,896 6,351 – 359 1,345 2,800 (1,455) -52% 6,351
Public safety 414 369 – 3 64 135 (71) -53% 369
Housing 9,850 8,569 – 12,787 22,296 3,100 19,196 619% 8,569
Health 2,704 2,809 – 3 (2,571) 1,386 (3,957) -286% 2,809
Economic and environmental services 9,922 10,913 – 1,529 5,703 5,460 243 4% 10,913
Planning and dev elopment 2,613 2,910 – 216 1,237 1,458 (221) -15% 2,910
Road transport 7,309 8,003 – 1,313 4,466 4,002 464 12% 8,003
Env ironmental protection – – – – – – – –
Trading services 839,740 966,635 – 66,152 435,103 447,475 (12,372) -3% 966,635
Electricity 529,055 608,861 – 41,457 271,124 294,541 (23,417) -8% 608,861
Water 198,083 239,316 – 14,719 103,607 93,696 9,911 11% 239,316
Waste w ater management 64,665 68,318 – 5,727 34,897 34,164 733 2% 68,318
Waste management 47,936 50,141 – 4,250 25,475 25,074 401 2% 50,141
Other 4 2,415 4,828 – 338 1,784 – 1,784 #DIV/0! 4,828
Total Revenue - Standard 2 1,662,522 1,737,337 – 114,573 899,520 920,121 (20,601) -2% 1,737,337
Expenditure - Standard
Governance and administration 410,719 526,701 – 34,190 230,816 325,608 (94,792) -29% 526,701
Ex ecutiv e and council 275,661 366,399 – 19,629 151,917 251,545 (99,628) -40% 366,399
Budget and treasury office 77,121 92,131 – 8,421 45,074 44,063 1,011 2% 92,131
Corporate serv ices 57,938 68,171 – 6,140 33,825 30,000 3,825 13% 68,171
Community and public safety 181,879 197,169 – 31,557 123,274 78,150 45,124 58% 197,169
Community and social serv ices 60,195 68,817 – 7,067 33,704 25,800 7,904 31% 68,817
Sport and recreation 41,576 41,162 – 4,629 22,619 18,090 4,529 25% 41,162
Public safety 40,759 48,346 – 2,956 15,270 19,200 (3,930) -20% 48,346
Housing 23,114 19,833 – 15,199 42,451 5,560 36,891 664% 19,833
Health 16,236 19,010 – 1,706 9,231 9,500 (269) -3% 19,010
Economic and environmental services 74,088 90,676 – 10,144 47,983 31,300 16,683 53% 90,676
Planning and dev elopment 22,893 27,407 – 2,467 13,196 8,000 5,196 65% 27,407
Road transport 51,195 63,269 – 7,677 34,786 23,300 11,486 49% 63,269
Env ironmental protection – – – – – – – –
Trading services 727,487 808,894 – 67,350 414,306 374,910 39,396 11% 808,894
Electricity 463,369 526,015 – 38,065 264,835 268,069 (3,234) -1% 526,015
Water 169,011 185,596 – 18,950 98,350 58,275 40,075 69% 185,596
Waste w ater management 50,636 52,142 – 5,660 25,805 26,050 (245) -1% 52,142
Waste management 44,470 45,141 – 4,674 25,315 22,516 2,799 12% 45,141
Other 9,390 9,145 – 923 4,741 4,572 169 4% 9,145
Total Expenditure - Standard 3 1,403,563 1,632,584 – 144,164 821,120 814,540 6,580 1% 1,632,584
Surplus/ (Deficit) for the year 258,960 104,754 – (29,591) 78,400 105,581 (27,180) -26% 104,754
RefDescription
NC091 Sol Plaatje - Table C2 Monthly Budget Statement - Financial Performance (standard classification) - M06 December

_____________________________________________
Monthly Budget Statement: December 2014
27
Vote Description 2013/14
Audited
Outcome
Original
Budget
Adjusted
Budget
Monthly
actual
YearTD
actual
YearTD
budget
YTD
variance
YTD
variance
Full Year
Forecast
R thousands %
Revenue by Vote 1
Vote 1 - EXECUTIVE AND COUNCIL 47 – – – 47 – 47 #DIV/0! –
Vote 2 - MUNICIPAL AND GENERAL 384,798 300,330 – 55,800 147,720 168,814 (21,095) -12.5% 300,330
Vote 3 - MUNICIPAL MANAGER 1,434 2,166 – – – 405 (405) -100.0% 2,166
Vote 4 - CORPORATE SERVICES 7,275 6,552 – 339 1,137 3,000 (1,863) -62.1% 6,552
Vote 5 - COMMUNITY SERVICES 34,696 33,457 – 2,254 6,697 9,950 (3,253) -32.7% 33,457
Vote 6 - FINANCIAL SERVICES 379,124 411,367 – 32,469 283,238 283,349 (111) 0.0% 411,367
Vote 7 - STRATEGY ECON DEVELOPMENT AND PLAN 5,236 8,039 – 571 3,152 2,959 193 6.5% 8,039
Vote 8 - INFRASTRUCTURE AND SERVICES 849,913 975,425 – 78,941 457,530 451,642 5,888 1.3% 975,425
Total Revenue by Vote 2 1,662,522 1,737,337 – 170,373 899,520 920,119 (20,599) -2.2% 1,737,337
Expenditure by Vote 1
Vote 1 - EXECUTIVE AND COUNCIL 37,349 38,247 – 3,291 19,239 19,124 116 0.6% 38,247
Vote 2 - MUNICIPAL AND GENERAL 225,489 311,639 – 14,974 125,509 217,200 (91,691) -42.2% 311,639
Vote 3 - MUNICIPAL MANAGER 12,823 16,512 – 1,364 7,169 7,500 (331) -4.4% 16,512
Vote 4 - CORPORATE SERVICES 49,306 56,621 – 5,165 27,939 29,311 (1,371) -4.7% 56,621
Vote 5 - COMMUNITY SERVICES 148,305 165,068 – 16,536 82,069 69,893 12,176 17.4% 165,068
Vote 6 - FINANCIAL SERVICES 83,887 101,510 – 9,220 50,076 50,755 (679) -1.3% 101,510
Vote 7 - STRATEGY ECON DEVELOPMENT AND PLAN 34,148 38,723 – 3,568 18,822 19,577 (755) -3.9% 38,723
Vote 8 - INFRASTRUCTURE AND SERVICES 812,257 904,263 – 90,047 490,297 401,183 89,115 22.2% 904,263
Total Expenditure by Vote 2 1,403,563 1,632,584 – 144,164 821,120 814,541 6,579 0.8% 1,632,584
Surplus/ (Deficit) for the year 2 258,960 104,754 – 26,209 78,400 105,579 (27,178) -25.7% 104,754
NC091 Sol Plaatje - Table C3 Monthly Budget Statement - Financial Performance (revenue and expenditure by municipal vote) - M06 December
Ref
Budget Year 2014/15

_____________________________________________
Monthly Budget Statement: December 2014
28
2013/14
Audited
Outcome
Original
Budget
Adjusted
Budget
Monthly
actual
YearTD
actual
YearTD
budget
YTD
variance
YTD
variance
Full Year
Forecast
R thousands %
Revenue By Source
Property rates 368,225 397,946 32,115 278,558 277,100 1,458 1% 397,946
Property rates - penalties & collection charges – –
Serv ice charges - electricity rev enue 528,885 608,853 42,264 265,574 301,540 (35,966) -12% 608,853
Serv ice charges - w ater rev enue 197,867 239,315 14,698 103,066 103,500 (434) 0% 239,315
Serv ice charges - sanitation rev enue 63,601 67,187 5,652 34,400 33,594 806 2% 67,187
Serv ice charges - refuse rev enue 44,695 46,841 3,961 23,737 23,421 316 1% 46,841
Serv ice charges - other – –
Rental of facilities and equipment 17,795 17,606 1,388 7,799 5,560 2,239 40% 17,606
Interest earned - ex ternal inv estments 21,413 12,000 857 1,146 4,580 (3,434) -75% 12,000
Interest earned - outstanding debtors 56,744 45,000 6,459 36,396 16,150 20,246 125% 45,000
Div idends receiv ed – – –
Fines 11,554 7,635 398 2,225 3,818 (1,593) -42% 7,635
Licences and permits 2,708 2,672 135 1,282 300 982 327% 2,672
Agency serv ices 4,339 4,900 1,143 2,856 2,400 456 19% 4,900
Transfers recognised - operational 166,601 164,710 48,480 103,463 105,000 (1,537) -1% 164,710
Other rev enue 36,945 33,745 12,824 39,019 8,640 30,379 352% 33,745
Gains on disposal of PPE 275 – – –
Total Revenue (excluding capital transfers and
contributions)
1,521,649 1,648,410 – 170,373 899,520 885,602 13,919 2% 1,648,410
Expenditure By Type
Employ ee related costs 474,749 547,624 49,999 250,508 265,000 (14,492) -5% 547,624
Remuneration of councillors 18,459 19,968 1,571 9,405 9,984 (579) -6% 19,968
Debt impairment 126,810 145,000 – 145,000 145,000 – 145,000
Depreciation & asset impairment 41,988 52,550 – – 8,758 (8,758) -100% 52,550
Finance charges 28,056 36,559 15,539 15,433 18,200 (2,767) -15% 36,559
Bulk purchases 381,005 422,000 30,751 189,114 217,000 (27,886) -13% 422,000
Other materials 64,257 87,135 9,059 37,525 41,340 (3,815) -9% 87,135
Contracted serv ices – – –
Transfers and grants 19,564 54,750 2,376 22,033 19,384 2,649 14% 54,750
Other ex penditure 248,674 266,997 34,869 152,101 89,874 62,227 69% 266,997
Loss on disposal of PPE – – – – – – –
Total Expenditure 1,403,563 1,632,584 – 144,164 821,120 814,540 6,579 1% 1,632,584
Surplus/(Deficit) 118,086 15,826 – 26,209 78,400 71,061 7,339 0 15,826
Transfers recognised - capital 140,153 88,927 28,368 (28,368) (0) 88,927
Contributions recognised - capital – – –
Contributed assets 721 – –
Surplus/(Deficit) after capital transfers &
contributions
258,960 104,754 – 26,209 78,400 99,429 104,754
Tax ation –
Surplus/(Deficit) after taxation 258,960 104,754 – 26,209 78,400 99,429 104,754
Attributable to minorities
Surplus/(Deficit) attributable to municipality 258,960 104,754 – 26,209 78,400 99,429 104,754
Share of surplus/ (deficit) of associate
Surplus/ (Deficit) for the year 258,960 104,754 – 26,209 78,400 99,429 104,754
Description Ref
Budget Year 2014/15
NC091 Sol Plaatje - Table C4 Monthly Budget Statement - Financial Performance (revenue and expenditure) - M06 December

_____________________________________________
Monthly Budget Statement: December 2014
29
2013/14 Budget Year 2014/15
Audited
Outcome
Original
Budget
Adjusted
Budget
Monthly
actual
YearTD
actual
YearTD
budget
YTD
variance
YTD
variance
Full Year
Forecast
R thousands 1 %
Multi-Year expenditure appropriation 2
Vote 1 - EXECUTIVE AND COUNCIL – – – – – – – –
Vote 2 - MUNICIPAL AND GENERAL – – – – – – – –
Vote 3 - MUNICIPAL MANAGER – – – – – – – –
Vote 4 - CORPORATE SERVICES – – – – – – – –
Vote 5 - COMMUNITY SERVICES – 12,994 – 3,509 8,567 2,150 6,417 298% 12,994
Vote 6 - FINANCIAL SERVICES – – – – – – – –
Vote 7 - STRATEGY ECON DEVELOPMENT AND PLAN – – – – – – – –
Vote 8 - INFRASTRUCTURE AND SERVICES 9,409 74,774 – 11,722 68,043 26,850 41,193 153% 74,774
Total Capital Multi-year expenditure 4,7 9,409 87,769 – 15,231 76,610 29,000 47,610 164% 87,769
Single Year expenditure appropriation 2
Vote 1 - EXECUTIVE AND COUNCIL 1,333 – – – – – – –
Vote 2 - MUNICIPAL AND GENERAL 1,030 – – – – – – –
Vote 3 - MUNICIPAL MANAGER 55 – – – – – – –
Vote 4 - CORPORATE SERVICES 285 – – – – – – –
Vote 5 - COMMUNITY SERVICES 6,727 – – – – – – –
Vote 6 - FINANCIAL SERVICES 3,192 1,000 – 226 332 300 32 11% 1,000
Vote 7 - STRATEGY ECON DEVELOPMENT AND PLAN 5,292 10,250 – 275 2,254 450 1,804 401% 10,250
Vote 8 - INFRASTRUCTURE AND SERVICES 211,086 32,164 – 5,993 20,101 10,500 9,601 91% 32,164
Total Capital single-year expenditure 4 229,000 43,414 – 6,494 22,687 11,250 11,437 102% 43,414
Total Capital Expenditure 238,409 131,183 – 21,725 99,297 40,250 59,047 147% 131,183
Capital Expenditure - Standard Classification
Governance and administration 5,896 1,000 – 226 332 300 32 11% 1,000
Ex ecutiv e and council 2,418 – – –
Budget and treasury office 3,192 1,000 226 332 300 32 11% 1,000
Corporate serv ices 285 – – –
Community and public safety 6,727 12,994 – 3,509 8,567 2,400 6,167 257% 12,994
Community and social serv ices 6,727 12,994 3,509 8,567 2,400 6,167 257% 12,994
Sport and recreation – – – –
Public safety – – – –
Housing – – – –
Health – – –
Economic and environmental services 56,832 10,250 – 5,152 42,714 1,000 41,714 4171% 10,250
Planning and dev elopment 5,292 10,250 275 2,254 1,000 1,254 125% 10,250
Road transport 51,540 4,877 40,460 40,460 #DIV/0! –
Env ironmental protection – –
Trading services 161,666 94,938 – 12,838 47,685 33,550 14,135 42% 94,938
Electricity 65,072 3,000 279 7,378 350 7,028 2008% 3,000
Water 20,195 29,164 1,425 6,094 7,200 (1,106) -15% 29,164
Waste w ater management 74,280 62,774 11,134 34,213 26,000 8,213 32% 62,774
Waste management 2,120 – 0 – 0 #DIV/0! –
Other 7,289 12,000 – (0) 3,000 (3,000) -100% 12,000
Total Capital Expenditure - Standard Classification 3 238,409 131,183 – 21,725 99,297 40,250 59,047 147% 131,183
Funded by:
National Gov ernment 99,126 78,677 9,359 32,997 16,800 16,197 96% 78,677
Prov incial Gov ernment 36,743 10,250 5,117 18,230 8,950 9,280 104% 10,250
District Municipality 4,284 – – –
Other transfers and grants – – –
Transfers recognised - capital 140,153 88,927 – 14,475 51,227 25,750 25,477 99% 88,927
Public contributions & donations 5 – – –
Borrowing 6 64,803 – – – – –
Internally generated funds 33,453 42,255 7,249 48,070 14,500 33,570 232% 42,255
Total Capital Funding 238,409 131,183 – 21,725 99,297 40,250 59,047 147% 131,183
NC091 Sol Plaatje - Table C5 Monthly Budget Statement - Capital Expenditure (municipal vote, standard classification and funding) - M06 December
Vote Description Ref

_____________________________________________
Monthly Budget Statement: December 2014
30
2013/14 Budget Year 2014/15
Audited
Outcome
Original
Budget
Adjusted
Budget
YearTD
actual
Full Year
Forecast
R thousands 1
ASSETS
Current assets
Cash – – –
Call inv estment deposits 320,607 262,936 321,341 262,936
Consumer debtors 260,972 226,537 462,130 226,537
Other debtors 315,560 240,670 31,790 240,670
Current portion of long-term receiv ables – – –
Inv entory 23,407 21,664 25,674 21,664
Total current assets 920,546 751,806 – 840,935 751,806
Non current assets
Long-term receiv ables 836 4,628 4,628
Inv estments –
Inv estment property 201,756 190,000 202,854 190,000
Inv estments in Associate –
Property , plant and equipment 1,281,007 1,377,415 1,388,228 1,377,415
Agricultural –
Biological assets –
Intangible assets 1,098 2,874 1,098 2,874
Other non-current assets 6,802 6,802 6,802
Total non current assets 1,491,500 1,581,719 – 1,592,181 1,581,719
TOTAL ASSETS 2,412,046 2,333,525 – 2,433,115 2,333,525
LIABILITIES
Current liabilities
Bank ov erdraft 15,408 12,444 1,007 12,444
Borrow ing 22,372 11,051 11,051
Consumer deposits 16,684 18,113 18,692 18,113
Trade and other pay ables 193,082 180,679 153,872 180,679
Prov isions 7,465 8,039 8,039
Total current liabilities 255,011 230,326 – 173,572 230,326
Non current liabilities
Borrow ing 237,719 214,736 253,528 214,736
Prov isions 244,316 287,705 252,616 287,705
Total non current liabilities 482,036 502,441 – 506,144 502,441
TOTAL LIABILITIES 737,046 732,767 – 679,716 732,767
NET ASSETS 2 1,674,999 1,600,758 – 1,753,400 1,600,758
COMMUNITY WEALTH/EQUITY
Accumulated Surplus/(Deficit) 1,553,953 1,569,658 1,632,353 1,569,658
Reserv es 121,046 31,100 121,046 31,100
TOTAL COMMUNITY WEALTH/EQUITY 2 1,674,999 1,600,758 – 1,753,400 1,600,758
Description Ref
NC091 Sol Plaatje - Table C6 Monthly Budget Statement - Financial Position - M06 December

_____________________________________________
Monthly Budget Statement: December 2014
31
2013/14 Budget Year 2014/15
Audited
Outcome
Original
Budget
Adjusted
Budget
Monthly
actual
YearTD
actual
YearTD
budget
YTD
variance
YTD
variance
Full Year
Forecast
R thousands 1 %
CASH FLOW FROM OPERATING ACTIVITIES
Receipts
Ratepay ers and other 1,139,194 1,302,790 95,593 592,161 732,249 (140,088) -19% 1,302,790
Gov ernment - operating 166,601 164,710 48,480 108,029 105,000 3,029 3% 164,710
Gov ernment - capital 140,153 88,927 3,403 81,820 34,518 47,302 137% 88,927
Interest 78,157 23,250 7,316 38,856 10,580 28,276 267% 23,250
Div idends – – – –
Payments
Suppliers and employ ees (1,301,342) (1,378,985) (119,022) (662,300) (623,198) 39,102 -6% (1,378,985)
Finance charges (28,056) (36,559) (15,538) (15,538) (18,200) (2,662) 15% (36,559)
Transfers and Grants (19,564) (4,750) (2,376) (22,033) (4,500) 17,533 -390% (4,750)
NET CASH FROM/(USED) OPERATING ACTIVITIES 175,143 159,383 – 17,857 120,995 236,449 115,454 49% 159,383
CASH FLOWS FROM INVESTING ACTIVITIES
Receipts
Proceeds on disposal of PPE –
Decrease (Increase) in non-current debtors –
Decrease (increase) other non-current receiv ables –
Decrease (increase) in non-current inv estments –
Payments
Capital assets (238,409) (131,183) (21,725) (99,297) (40,250) 59,047 -147% (131,183)
NET CASH FROM/(USED) INVESTING ACTIVITIES (238,409) (131,183) – (21,725) (99,297) (40,250) 59,047 -147% (131,183)
CASH FLOWS FROM FINANCING ACTIVITIES
Receipts
Short term loans –
Borrow ing long term/refinancing 64,803 –
Increase (decrease) in consumer deposits 1,263 – 1,263
Payments
Repay ment of borrow ing (20,303) (15,827) (6,564) (7,913) (1,349) 17% (15,827)
NET CASH FROM/(USED) FINANCING ACTIVITIES 44,500 (14,564) – – (6,564) (7,913) (1,349) 17% (14,564)
NET INCREASE/ (DECREASE) IN CASH HELD (18,766) 13,637 – (3,868) 15,135 188,286 13,637
Cash/cash equiv alents at beginning: 323,965 236,901 305,199 236,901 305,199
Cash/cash equiv alents at month/y ear end: 305,199 250,538 – 320,334 425,187 318,836
Description Ref
NC091 Sol Plaatje - Table C7 Monthly Budget Statement - Cash Flow - M06 December

_____________________________________________
Monthly Budget Statement: December 2014
32
Variance Reasons for material deviations Remedial or corrective steps/remarks
R thousands
1 Revenue By Source
Property rates 1% Acceptable
Property rates - penalties & collection charges
Serv ice charges - electricity rev enue -12% To be inv estigated
Serv ice charges - w ater rev enue 0% Acceptable
Serv ice charges - sanitation rev enue 2% Acceptable
Serv ice charges - refuse rev enue 1% Acceptable
Serv ice charges - other
Rental of facilities and equipment 40% Actual receipts are more than the projected receipts
Interest earned - ex ternal inv estments -75%
As a result of the recognition of accrued interest for 2013/14
financial y ear
Interest earned - outstanding debtors 125% Actual billing more than the projected rev enue
Div idends receiv ed
Fines -42% Actual receipts are less than the projected receipts
Licences and permits 327% Actual receipts are more than the projected receipts
Agency serv ices 19% Actual receipts are more than the projected receipts
Transfers recognised - operational -1%
Other rev enue 352% Erroneous projection on Other Rev enue
Gains on disposal of PPE
2 Expenditure By Type
Employ ee related costs -5.47% Acceptable
Remuneration of councillors -5.80% Acceptable
Debt impairment 0.00%
Depreciation & asset impairment
Finance charges
Bulk purchases -12.85% Inv oices for bulk purchases for the month of December 2014
w ill be settled in January 2015.
Other materials -9.23% Acceptable. But needs improv ement
Contracted serv ices
Transfers and grants 13.67% Correction done on sy stem i.r.o v ote linked to indigents.
Other ex penditure 69.24%
Under projection on Other Ex penditure to be corrected in the
adjustment budget. Pay ments of housing projects to be
handled in the Adjustment budget.
Loss on disposal of PPE
3 Capital Expenditure
Vote 5 - COMMUNITY SERVICES 398%
Estimation done conserv ativ ely , as capex is usually slow in
the beginning of the financial y ear
Vote 6 - FINANCIAL SERVICES
Vote 7 - STRATEGY ECON DEVELOPMENT AND PLAN
Vote 8 - INFRASTRUCTURE AND SERVICES 236%
Estimation done conserv ativ ely , as capex is usually slow in
the beginning of the financial y ear
4 Financial Position
Total current assets 89,129 Substantial Increase in Consumer debtors
Total non current assets 10,462 Acceptable
Total current liabilities (56,754) Decrease in trade and other pay ables
Total non current liabilities 3,703 Acceptable
5 Cash Flow
NET CASH FROM/(USED) OPERATING ACTIVITIES 48.83% Budget on receipts from Rate pay ers and other is ov erstated
NET CASH FROM/(USED) INVESTING ACTIVITIES -146.70% Accelerated Capex
NET CASH FROM/(USED) FINANCING ACTIVITIES 17.05% Loan repay ments less than initially anticipated
6 Measureable performance
7 Municipal Entities
Ref Description
NC091 Sol Plaatje - Supporting Table SC1 Material variance explanations - M06 December