montana state university · other account balances and transaction cycles. we also conduct a...
TRANSCRIPT

A RepoRtto the
MontAnALegisLAtuRe
LegisLAtive Auditdivision
13-11B
FinAnciAL Audit
FebRuARy 2015
Montana State UniversityFor the Fiscal Year Ended
June 30, 2014
Financial AuditsFinancial audits are conducted by the Legislative Audit Division to determine if the financial statements included in this report are presented fairly and the agency has complied with laws and regulations having a direct and material effect on the financial statements. In performing the audit work, the audit staff uses standards set forth by the American Institute of Certified Public Accountants and the United States Government Accountability Office. Financial audit staff members hold degrees with an emphasis in accounting. Most staff members hold Certified Public Accountant (CPA) licenses.
Government Auditing Standards, the Single Audit Act Amendments of 1996 and OMB Circular A‑133 require the auditor to issue certain financial, internal control, and compliance reports. This individual agency audit report is not intended to comply with these requirements and is therefore not intended for distribution to federal grantor agencies. The Legislative Audit Division issues a statewide biennial Single Audit Report which complies with the above reporting requirements. The Single Audit Report for the two fiscal years ended June 30, 2013, was issued March 28, 2014. The Single Audit Report for the two fiscal years ended June 30, 2015, will be issued by March 31, 2016. Copies of the Single Audit Report can be obtained by contacting:
Single Audit Coordinator Legislative Audit DivisionOffice of Budget and Program Planning Room 160, State CapitolRoom 277, State Capitol P.O. Box 201705P.O. Box 200802 Helena, MT 59620‑1705Helena, MT 59620‑0802
Legislative AuditCommittee
RepresentativesRandy Brodehl, [email protected]
Virginia [email protected]
Mike [email protected] Hayman
[email protected] Osmundson
[email protected] Tropila
SenatorsDee Brown
[email protected] Brown
[email protected] Malek
[email protected] McNally
[email protected] (Eric) [email protected]
Cynthia [email protected]
Members serve until a member’s legislative term of office ends or until a successor is appointed,
whichever occurs first.
§5‑13‑202(2), MCA
Fraud Hotline(Statewide)
1‑800‑222‑4446(in Helena)
Audit StaffJennifer ErdahlBrent LaymanKent Rice
Natalie H. GibsonPaul J. O’LoughlinShandell VanDonsel
Reports can be found in electronic format at:http://leg.mt.gov/audit
LEGISLATIVE AUDIT DIVISION Tori Hunthausen, Legislative Auditor Deputy Legislative Auditors:Deborah F. Butler, Legal Counsel Cindy Jorgenson Angus Maciver
Room 160 • State Capitol Building • PO Box 201705 • Helena, MT • 59620-1705Phone (406) 444-3122 • FAX (406) 444-9784 • E-Mail [email protected]
February 2015
The Legislative Audit Committeeof the Montana State Legislature:
This is our financial audit report on the consolidated financial statements of the Montana State University (university) for the fiscal year ended June 30, 2014. During our audit, we reviewed financial records related to the university’s compensation and benefits, student financial aid, tuition and fees, grants and contracts, as well as other account balances and transaction cycles. The report does not contain any recommendations to the university. We thank President Cruzado and her staff for their cooperation and assistance during the audit.
Respectfully submitted,
/s/ Tori Hunthausen
Tori Hunthausen, CPALegislative Auditor

Table of ContentsAppointed and Administrative Officials ...................................................................................iiReport Summary ...................................................................................................................S-1
CHAPTER I – INTRODUCTION ��������������������������������������������������������������������������������������������������������������1Audit Scope ...............................................................................................................................1Background ...............................................................................................................................1
INDEPENDENT AUDITOR’S REPORT AND MONTANA STATE UNIVERSITY FINANCIAL STATEMENTS
Independent Auditor’s Report ............................................................................................... A-1Management’s Discussion and Analysis ................................................................................A-5Consolidated Statements of Net Position ............................................................................ A-17University Component Units-Combined Statements of Financial Position ........................ A-18Consolidated Statements of Revenue, Expenses and Changes in Net Position ................... A-19University Component Units-Combined Statement of Activities .......................................A-20Consolidated Statements of Cash Flows ..............................................................................A-22Notes to Consolidated Financial Statements .......................................................................A-24Required Supplementary Information ................................................................................ A-55Unaudited Supplemental Information ................................................................................A-56
UNIVERSITY RESPONSEMontana State University .....................................................................................................B-1
i
13-11B

Appointed and Administrative OfficialsTerm Expires
Board of Regents of Higher Education
Paul Tuss, Chair February 1, 2020
Major Robinson, Vice Chair February 1, 2018
Fran M. Albrecht February 1, 2019
William Johnstone February 1, 2017
Jeffrey Krauss February 1, 2015
Martha Sheehy February 1, 2021
Mariah R. Williams, Student Regent June 30, 2015
Clayton Christian, Commissioner of Higher Education*
Steve Bullock, Governor*
Denise Juneau, Superintendent of Public Instruction*
*Ex officio members
Office of the Commissioner of Higher Education
Clayton Christian Commissioner of Higher Education
Mick Robinson Deputy Commissioner for Fiscal Affairs/Chief of Staff
Neil Moisey Deputy Commissioner for Academic, Research and Student Affairs
John Cech Deputy Commissioner for Two-Year and Community College Education
Tyler Trevor Deputy Commissioner for Planning and Analysis
Kevin McRae Deputy Commissioner for Communications and Human Resources
Vivian Hammill Chief Legal Counsel
Frieda Houser Director of Accounting and Budget
Montana Legislative Audit Divisionii
Montana State University–All Campuses
Waded Cruzado President
Leslie Taylor Legal Counsel
Daniel Adams Director of Institutional Audit and Advisory Services
Montana State University–Bozeman
Martha Potvin Provost and Vice President for Academic Affairs
Terry Leist Vice President for Administration and Finance
Renee Reijo Pera Vice President of Research and Economic Development
Chris Kearns Vice President for Student Success
Laura Humberger Associate Vice President for Financial Services
Kathy Attebury Director of University Budgets
Montana State University–Billings
Mark Nook Chancellor
Mark Pagano Provost and Academic Vice Chancellor
Terrie Iverson Vice Chancellor of Administrative Services
Joe Oravecz Vice Chancellor for Student Affairs
LeAnn Anderson Director of Financial Services
Barb Shafer Director of Business Services
Trudy Collins University Budget Director
Montana State University–Northern
Greg Kegel Interim Chancellor
Brian Simonson Vice Chancellor for Finance and Administration
William Rugg Provost and Vice Chancellor for Academic Affairs
Kim Watson Dean of Student Engagement/Director of Residence Life
Chris Wendland Director of Financial Services
Jamie McBryan Director of Business Services
iii
13-11B
Great Falls College– Montana State University
Susan Wolff Dean and CEO
Darryl Stevens Associate Dean of Administration and Finance
Heidi Pasek Associate Dean and Chief Academic Officer
Camille Consolvo Associate Dean of Student Services
Jillian Ehnot Controller
Carmen Roberts Budget and Purchasing Analyst
Montana Agricultural Experiment Station
Glenn Duff Interim Director
Jody Barney Budget and Fiscal Director
Montana State University Extension
Jeff Bader Director
Sandra Rahn Gibson Budget and Fiscal Director
For additional information concerning Montana State University, contact:
Daniel Adams, Director of Institutional Audit and Advisory ServicesP.O. Box 170580 Bozeman, MT 59717(406) 994-1805e-mail: [email protected]
iv Montana Legislative Audit Division
Montana LegisLative audit division
Financial auditMontana State UniversityFor the Fiscal Year Ended June 30, 2014
February 2015 13-11b report Summary
The Montana State University (MSU) Bozeman campus full time equivalent (FTE) student increased by 433, or 3.35 percent, in 2014. Since 2010, the student FTE for MSU Bozeman has increased by approximately 2,500. In response to this continued trend of increased enrollment, MSU Bozeman issued $65.5 million in bonds during fiscal year 2014 to fund a new 400-bed residence hall, the new Jake Jabs College of Business and Entrepreneurship building, and to renovate three existing dining halls, as well as to fund maintenance projects in various residence halls.
ContextMontana State University (MSU) serves state, national, and international students with a diversity of undergraduate and graduate academic degrees, as well as two-year vocational and technical programs. The University includes four campuses located in Bozeman, Billings, Great Falls, and Havre, as well as the Montana Agricultural Experiment Station, Montana Extension Service, and the Fire Services Training School.
In addition to the financial activity of MSU, the financial statements include financial activity related to foundations for the Bozeman, Billings, and Havre campuses, the Museum of the Rockies Incorporated, and the Bozeman Bobcat Club.
The report also contains unaudited supplemental information with detailed information for each campus, the Agricultural Experiment Station, Montana State University Extension Service, and the Fire Services Training School.
During our audit, we reviewed financial records related to the university’s compensation and benefits, student financial aid, tuition and fees, grants and contracts, as well as other account balances and transaction cycles. We issued an unmodified opinion over the university’s financial statements. Readers of this report can rely on the financial statements to be a fair representation of the university’s operations for fiscal year 2014 and financial position as of June 30, 2014. The Independent Auditor’s Report on page A-1 refers to a prior period restatement of the 2013 amounts due to an adjustment to Other Post-Employment Benefits. Our opinion is not modified with respect to this matter.
Results
For a complete copy of the report (13-11B) or for further information, contact the Legislative Audit Division at 406-444-3122; e-mail to lad@mt�gov; or check the web site at
http://leg�mt�gov/auditReport Fraud, Waste, and Abuse to the Legislative Auditor’s FRAUD HOTLINE
Call toll-free 1-800-222-4446, or e-mail ladhotline@mt�gov�
S-1

Chapter I – Introduction
Audit ScopeWe performed a financial audit of Montana State University (MSU) for the fiscal year ended June 30, 2014. The objectives of our audit were to:
1. Determine whether the university’s consolidated financial statements present fairly, in all material respects, the financial position as of June 30, 2014, and the results of operations, and cash flows of Montana State University for the fiscal year then ended.
2. Obtain an understanding of the university’s internal control systems to the extent necessary to support our audit of the consolidated financial statements.
During our audit, we reviewed financial records related to the university’s compensation and benefits, student financial aid, tuition and fees, grants and contracts, as well as other account balances and transaction cycles.
We also conduct a financial-related audit of Montana State University-Bozeman and its affiliated campuses to determine compliance with regulations related to contract and grant expenditures, other governmental financial assistance, and selected state laws, regulations, and rules. We issued the financial-related audit (13-13) for the fiscal years 2012 and 2013, in October 2013.
BackgroundMontana State University consists of campuses located in Bozeman, Billings, Havre, and Great Falls. All campuses are accredited by the Commission on Colleges of the Northwest Association of Schools and Colleges. The Montana State University campuses provide a diverse selection of undergraduate and graduate academic and two-year vocational/technical programs to students.
Montana State University-Bozeman offers four-year undergraduate programs as well as master’s and doctoral graduate programs. It includes the Colleges of Agriculture, Arts and Architecture, Business, Education, Health and Human Development, Engineering, Letters and Science, Nursing, University Honors College, University Studies, and the Graduate School. The Bozeman campus also includes the MSU Extension Service, the Montana Agricultural Experiment Station, the Gallatin College Program, and the Fire Services Training School, which have facilities located in or near cities or towns throughout Montana.
Montana State University-Billings consists of the Colleges of Arts and Sciences, Business, Education, Allied Health Professions, and City College. Montana State
1
13-11B

University-Billings offers a full complement of one-year and two-year certificate programs, associate, bachelor, and master’s degrees, as well as pre-professional academic offerings in a number of fields.
Montana State University-Northern is a regional, multi-purpose educational center, serving students who seek both a technical and liberal arts education. It offers courses at the campus in Havre and at facilities in Great Falls and Lewistown. Montana State University-Northern offers liberal arts, professional and technical educational programs ranging from certificates through master’s degrees.
Great Falls College Montana State University is a public institution offering two-year transfer degrees as well as degrees and certificates that prepare students to enter the current workforce. Transfer degrees include general education (Associate of Arts, Associate of Science, and the Montana University System Core) offerings. The Certificate and Associate of Applied Science degrees include one- and two-year applied programs in Health Sciences, Business Trades, and Technology disciplines.
Additional detailed information for each of the Montana State University campuses is included in the Unaudited Supplemental Information beginning on page A-56.
2 Montana Legislative Audit Division

Independent Auditor’s Report and Montana State University Financial Statements
13-11B

LEGISLATIVE AUDIT DIVISION Tori Hunthausen, Legislative Auditor Deputy Legislative Auditors:Deborah F. Butler, Legal Counsel Cindy Jorgenson Angus Maciver
Room 160 • State Capitol Building • PO Box 201705 • Helena, MT • 59620-1705Phone (406) 444-3122 • FAX (406) 444-9784 • E-Mail [email protected]
Independent Auditor’s Report
The Legislative Audit Committeeof the Montana State Legislature:
IntroductionWe have audited the accompanying Consolidated Statements of Net Position of Montana State University, a component unit of the state of Montana, as of June 30, 2014, and 2013, the related Consolidated Statements of Revenues, Expenses and Changes in Net Position and Consolidated Statements of Cash Flows for each of the fiscal years then ended, and the University Component Units-Combined Statements of Financial Position as of June 30, 2014, and 2013, and the University Component Units-Combined Statement of Activities for the fiscal years then ended, and the related notes to the financial statements.
Management’s Responsibility for the Financial StatementsManagement is responsible for the preparation and fair presentation of these financial statements in accordance with accounting principles generally accepted in the United States of America; this responsibility includes designing, implementing, and maintaining internal controls relevant to the preparation and fair presentation of financial statements that are free from material misstatement, whether due to fraud or error.
Auditor’s Responsibility Our responsibility is to express an opinion on these financial statements based on our audit. We did not audit the financial statements of the university’s aggregate discretely presented component units. Those statements, which include the Montana State University Foundation, the Montana State University –Billings Foundation, the Montana State University-Northern Foundation, the Museum of the Rockies, Incorporated, and The Montana State University Bobcat Club, were audited by other auditors whose reports thereon have been furnished to us, and our opinion, insofar as it relates to the amounts for the component units of the university, as noted above, is based on the reports of other auditors.
We conducted our audit in accordance with auditing standards generally accepted in the United States of America. Those standards require that we plan and perform the audit to obtain reasonable assurance about whether the financial statements are free from material misstatement.
A-1
An audit involves performing procedures to obtain audit evidence about the amounts and disclosures in the financial statements. The procedures selected depend on the auditor’s judgment, including the assessment of the risks of material misstatement of the financial statements, whether due to fraud or error. In making those risk assessments, the auditor considers internal controls relevant to the university’s preparation and fair presentation of the financial statements in order to design audit procedures that are appropriate in the circumstances, but not for the purpose of expressing an opinion on the effectiveness of university’s internal control, and accordingly, we express no such opinion. An audit also includes evaluating the appropriateness of accounting policies used and the reasonableness of significant accounting estimates made by management, as well as the overall presentation of the financial statements.
We believe that the audit evidence we have obtained is sufficient and appropriate to provide a basis for our audit opinion.
Opinion In our opinion, based on our audit and the reports of other auditors, the financial statements referred to above present fairly, in all material respects, the financial position of the Montana State University and its aggregate discretely presented component units as of June 30, 2014, and 2013, and the changes in net position and, where applicable, cash flows for the fiscal years then ended in conformity with accounting principles generally accepted in the United States of America.
Emphasis of MatterAs discussed in Note 1 to the financial statements, the Fiscal Year 2013 financial statements were restated to correct a misstatement of Other Post–Employment Benefits. Our opinion is not modified with respect to this matter.
Other MattersRequired Supplementary InformationAccounting principles generally accepted in the United States of America require that the Management’s Discussion and Analysis beginning on page A-5 and the Required Supplementary Information related to Other Post-Employment Benefits on page A-55, be presented to supplement the consolidated financial statements. Such information, although not a part of the basic financial statements, is required by the Governmental Accounting Standards Board who considers it to be an essential part of financial reporting for placing the consolidated financial statements in an appropriate operational, economic, or historical context. We have applied certain limited procedures to the required supplementary information in accordance with auditing standards generally accepted in the United States of America, which consisted of inquiries of management about the methods of preparing the information and comparing the information for consistency with management’s responses to our inquiries, the consolidated financial statements, and other knowledge we obtained during our audit of the consolidated financial statements. We do not express an opinion or provide any assurance on the information because the limited procedures do not provide us with sufficient evidence to express an opinion or provide any assurance.
A-2
Other InformationOur audit was conducted for the purpose of forming an opinion on the basic consolidated financial statements as a whole. The Unaudited Supplemental Information - all Campuses beginning on page A-56 is presented for purposes of additional analysis and is not a required part of the consolidated financial statements. Such information has not been subjected to the auditing procedures applied in the audit of the consolidated financial statements, and accordingly, we do not express an opinion or provide any assurance on it.
Respectfully submitted,
/s/ Cindy Jorgenson
Cindy Jorgenson, CPADeputy Legislative AuditorHelena, MT
December 17, 2014
A-3

A-4

Montana State University(a component unit of the State of Montana)Management’s Discussion and AnalysisAs of and For Each of the Years Ended June 30, 2014
3
Montana State University (the “University”) is a land grant university that serves state, national and international constituents by providing academic instruction, conducting a very high level of research activity, advancing fundamental knowledge, and by disseminating knowledge to the people of Montana and beyond through community engagement. The University encompasses four campuses located in Bozeman, Billings, Great Falls and Havre, as well as the Montana Agricultural Experiment Station, Montana Extension Service and the Fire Services Training School. The University operates throughout Montana’s 145,556 square miles of urban and rural communities housing a population of just over 1 million.
The University is proud to deliver quality instruction and services to a diverse student population, which is possible because of its dedicated faculty and staff, and because its students recognize quality and value. The University continues to ensure diligent recruiting of in-state students, while managing its mix of in-state, out-of-state, and out-of-area students to ensure a diverse, growing student population.
OPERATIONS
Condensed Statements of Revenues, Expenses and Changes in Net Position(in millions)
The Statement of Revenues, Expenses and Changes in Net Position presents the revenues earned and expenses incurred during the year on a full accrual basis, and classifies activities as either “operating” or “non-operating.” This distinction results in operating deficits for those institutions that depend on gifts and state aid, which are classified as non-operating revenue. The utilization of capital assets is reflected in the financial statements as depreciation, an operating expense, which allocates the cost of assets over their expected useful lives.
Comparison of 2014 and 2013 Results of Operations
The University’s net financial position increased $9.8 million during 2014, resulting primarily from capital grants and contributions of $12.8 million. Of this balance, $11.4 million was in support of the Jake Jabs College of Business and Entrepreneurship. Additionally, the State of Montana contributed $3.3 million for various projects including $1.7 million for Americans With Disabilities Act (ADA) upgrades to the Creative Arts Complex, $0.6 million for the welding program at the Great Falls Campus, and energy and other improvements to Leon Johnson Hall on the Bozeman campus. These increases were offset by OPEB expense of $5.4 million, which is an actuarially-determined amount related to the participation of retirees on the University’s health insurance plan.
2014 2013(restated)
2012(restated)
Operating revenues $ 341.9 $ 333.6 $ 334.5
Operating expenses 502.8 481.9 474.8
Operating loss (160.9) (148.3) (140.3)Non-operating revenues
and expenses (net) 154.9 142.8 145.3Income before capital &
other items(6.0) (5.5) 5.0
Capital & other items 15.8 6.2 21.1
Change in net position $ 9.8 $ 0.7 $ 26.1
A-5

Montana State University(a component unit of the State of Montana)Management’s Discussion and AnalysisAs of and For Each of the Years Ended June 30, 2014 (continued)
4
Operating revenues contain the majority of the University’s income, and increased $8.2 million, or 2.5%, from 2013 to 2014.
Tuition and fee revenues increased approximately $8.2 million, or 5.3%. Tuition rates were increased by 3.0% and 2.8% for nonresident undergraduate and graduate students, respectively, at the Bozeman campus and by 2.1% and 2.0% for nonresident undergraduate and graduate students, respectively, at the Billings campus. In addition, the number of full-time-equivalent students for all campuses increased by 1.2%, from 19,824 to 20,053.
Grant and contract operating revenues, including facility and administrative cost recoveries, decreased 1.2%, to $101.2million, compared with 2013 revenues of $102.4 million, as federal expenditures stabilize.
Revenues from auxiliary enterprises increased $3.0 million, or 6.9%, to $46.9 million, from $43.9 million in 2013.Slight price increases were implemented, and occupancy increased on the Bozeman campus once again due to a large incoming freshman class and retention of upperclassmen. Freshman students from outside the immediate area are required to live on-campus.
Other revenues decreased $1.7 million, or 5.8%, to $27.1 million, as compared with $28.8 million in 2013, largely due to$2.7 million in insurance proceeds received in 2013, compared to $0.4 million received in 2014.
Net non-operating revenue increased $12.1 million from 2013 to 2014, primarily due to an increase in state appropriations of $9.4 million, to $110.5 million, as compared with $101.1 million in 2013. The 2013 State Legislature
A-6

Montana State University(a component unit of the State of Montana)Management’s Discussion and AnalysisAs of and For Each of the Years Ended June 30, 2014 (continued)
5
appropriated funds to cover inflationary costs and wage increases for the next two years so that the University couldfreeze tuition for resident students through spring of 2015.
Capital and other items increased $9.6 million primarily due to $11.4 million in gift revenue through the MSU Alumni Foundation in support of the Jake Jabs College of Business and Entrepreneurship during 2014.
Operating expenses increased $20.8 million, or 4.3%, from 2013 to 2014. The most significant increase was ininstructional costs, which increased $5.9 million, or 4.9%. This was primarily due to an increase in compensation and benefits of $6.8 million, largely as a result of salary increases and additional staffing and class sections added to accommodate the University’s growing enrollment.
Employees in the Montana University System were given 2.5% plus $250 annual raises, in addition to certain merit and tenure increases. As such, compensation and benefits expenses increased in nearly all areas.
Research expenses increased $2.1 million, or 2.1%, primarily due to an increase of $2.8 million in expenditures for supplies and services. Increases and decreases in research funding exist from time to time depending the timing of grant-funding and the mix of capital versus operating grants.
Auxiliary expenses increased $3.3 million, or 6.9%, largely due to an increase in compensation and benefits of $1.9million, or 8.4%. In addition, because of high occupancy rates in the residence halls, and due to increased enrollment overall, additional food and other operating costs were incurred.
A-7

Montana State University(a component unit of the State of Montana)Management’s Discussion and AnalysisAs of and For Each of the Years Ended June 30, 2014 (continued)
6
Student services expenses increased $1.9 million, or 5.1% primarily due to an increase in compensation and benefits related to student services of $1.6 million, or 7.0%. Student Services expenses include many different services to students such as financial aid staff, counselors, recruiting and admissions officers, athletics functions, and the dean of students’ office. To ensure adequate support for the University’s growing student body, additional staff and other expenses were incurred.
Academic support increased $2.2 million and institutional support increased $2.5 million, which were primarily the result of increases in compensation and benefits related to salary increases and additional staffing needed to support the University’s growing enrollment.
Depreciation expense increased by $0.8 million, or 2.7%, primarily due to the completion of large construction projects in 2014 including Gallatin Residence Hall, improvements to Linfield hall, and other energy improvements and residence hall upgrades.
Comparison of 2013 and 2012 Results of Operations (restated)
The University’s net financial position increased $0.7 million during 2013, resulting primarily from $6.8 million ofOPEB expense, which is an actuarially-determined amount related to the participation of retirees on the University’s health insurance plan. Offsetting the OPEB expense, capital and other items provided $6.2 million, resulting largely from $2.4 million in federal funding for the completion of a renovation to Bozeman’s Cooley Lab and other smaller projects including upgrades at the Northern campus and a renovation of the Museum of the Rockies planetarium. Additionally, the State contributed $2.7 million for various projects including $1.2 million for Americans With Disabilities Act (ADA) upgrades to the Creative Arts Complex and $0.5 million for energy improvement upgrades to Leon Johnson Hall on the Bozeman campus.
Operating revenues contain the majority of the University’s income, and decreased $0.9 million, or 0.3%, from 2012 to 2013.
Tuition and fee revenues increased approximately $11.7 million, or 8.3%. Tuition and fee rates were increased by 5.0% at the Bozeman, Billings and Northern campuses, and the number of full-time-equivalent students for all campusesincreased by 2.1%, from 19,420 to 19,824.
Grant and contract operating revenues, including facility and administrative cost recoveries, decreased 10.5%, to $102.5million, compared with 2012 revenues of $114.4 million largely due to a $4.9 million decrease in funds received as a result of Federal American Recovery and Reinvestment Act (ARRA) from 2012 to 2013. In addition, grant and contract operating revenues decreased as a result of reductions in federal expenditures and as a result of grants closing at a faster rate than new grants are received.
Revenues from auxiliary enterprises increased $1.5 million, or 3.5%, to $43.9 million, from $42.5 million in 2012.Slight price increases were implemented, and occupancy increased once again due to a large incoming freshman class and retention of upperclassmen. Freshman students from outside the immediate area are required to live on-campus.
Other revenues decreased $2.0 million, or 6.4%, to $28.8 million, as compared with $30.7 million in 2012, largely due to insurance proceeds received in 2012 as a result of hailstorm damage, which were not received in 2013.
Net non-operating revenue decreased $2.5 million from 2012 to 2013, primarily due to a decreases in investment income of $1.7 million and Federal Pell grant revenue of $1.6 million.
Capital and other items decreased $15.0 million due primarily to $11.1 million in federal grant funding for renovations to Cooley Lab in 2012, which were not received in 2013.
A-8
Montana State University(a component unit of the State of Montana)Management’s Discussion and AnalysisAs of and For Each of the Years Ended June 30, 2014 (continued)
7
Operating expenses increased $7.1 million, or 1.5%, from 2012 to 2013. The most significant increase was in instruction costs, which increased $7.6 million, or 6.8%. This was primarily due to an increase in compensation and benefits of $7.0 million, largely as a result of salary increases and additional class sections added to accommodate the University’s growing enrollment.
Employees in the Montana University System were given 2% plus $500 annual raises, in addition to certain merit and tenure increases. As such, compensation and benefits expenses increased in nearly all areas.
Research expenses decreased $5.2 million, or 4.9%, largely due to a $4.9 million decrease in funds received as a result of Federal American Recovery and Reinvestment Act (ARRA) funding. Increases and decreases in research funding exist from time to time depending the timing of grant-funding and the success of the University in securing competitively awarded grants. Additionally, research funding nationwide is declining due to overall reductions in federal expenditures.
Auxiliary expenses increased $1.4 million, or 3.0%, largely due to an increase in compensation and benefits of $0.7 million, or 3.3%. In addition, because of high occupancy rates in the residence halls, and due to increased enrollment overall, additional food and other operating costs were incurred.
Public Service expenses increased $1.5 million, or 6.1%, largely due to an increase in compensation and benefits of $0.5 million combined with increases in indirect costs and subcontracts related to grant activity.
Student services expenses increased by $2.3 million, or 6.7% primarily due to an increase in compensation and benefits related to student services of $1.7 million, or 8.1%. Student Services expenses include many different services to students such as financial aid staff, counselors, recruiting and admissions officers, athletics functions, and the dean of students’ office. To ensure adequate support for the University’s growing student body, additional staff and other expenses were incurred.
Plant-related expenses decreased $2.2 million, or 5.6%, primarily due to expenditures in 2012 associated with roofs, windows, and other repairs required as a result of a severe hailstorm, which were not required in 2013. Depreciation expense increased by $1.4 million, or 4.8%, primarily due to the completion of large construction projects in 2013 including Cooley Lab, improvements to Hapner and Langford residence halls, and a number of energy improvements and residence hall upgrades.
A-9

Montana State University(a component unit of the State of Montana)Management’s Discussion and AnalysisAs of and For Each of the Years Ended June 30, 2014 (continued)
8
NET POSITION
Condensed Statements of Net Position(in millions)
The Statement of Net Position is presented in a classified format, which differentiates between current and non-current assets and liabilities, deferred outflows and deferred inflows, and also categorizes net position (formerly called “fund balance”) into four categories.
The University’s overall financial position improved, increasing $9.8million from the prior year.
Due to the implementation of Governmental Accounting Standards Board Statement Number 65, Items Previously Reported as Assets and Liabilities, the University’s deferred loss on debt refunding is now presented as a deferred outflow on the Statement of Net Position. The deferred loss on debt refunding is the excess of the reacquisition price of refunded debt over its net carrying amount. Note 11 to the accompanying financial statements provides detail with respect to the reclassification.
Comparison of 2014 and 2013 NetPosition
Current assets include the University’s cash and cash equivalents; accounts, grants and loans receivable; inventories; and other assets expected to benefit the University within one year. Accounts and grants receivable result primarily from sponsored projects that are payable on a cost-reimbursement basis, and also from student accounts. The increase of $26.1 million in current assets resulted primarily from an increase of $20.7 million in short term investments as a result of unexpended bond proceeds. See Note 2 to the financial statements.
Capital assets, net increased $9.2 million, resulting from asset additions of $40.5 million, offset by depreciation and amortization expense of $20.1 million and $6.1 million in net book value of asset retirements, as shown in further detail in Note 7 to the financial statements.
Asset additions included $30.0 million in construction projects. The Bozeman campus continued the construction of the Jake Jabs College of Business and Entrepreneurship expending $9.5 million during 2014 and completed the construction of Gallatin Residence Hall with additional costs of $1.2 million during 2014. Improvements to the
ASSETS2014 2013
(restated)2012
(restated)Current assets $ 239.1 $ 213.0 $ 215.3Capital assets, net 403.2 394.0 378.1Other noncurrent assets 88.9 48.1 50.5Total assets 731.3 655.1 643.9
DEFERRED OUTFLOWS 7.5 8.0 7.3
TOTAL ASSETS AND DEFERRED OUTFLOWS $ 738.8 $ 663.0 $ 651.2
LIABILITIESCurrent liabilities $ 75.9 $ 72.8 $ 67.4Noncurrent liabilities 285.0 222.2 216.4Total liabilities 360.9 294.9 283.7
NET POSITIONNet investment in capital assets 276.2 263.8 255.0Restricted, non-expendable 13.2 13.0 12.5Restricted, expendable 15.9 14.4 12.8Unrestricted 72.6 76.9 87.2Total net position 377.9 368.1 367.5
TOTAL LIABILITIES AND NET POSITION $ 738.8 $ 663.0 $ 651.2
A-10
Montana State University(a component unit of the State of Montana)Management’s Discussion and AnalysisAs of and For Each of the Years Ended June 30, 2014 (continued)
9
Miller Dining Facility added $2.4 million and the renovation of Linfield Hall in Bozeman added $1.6 million.Energy efficiency enhancements were also implemented, totaling $2.5 million in 2014. Additional, smaller projects make up the remaining increase, and include residence hall upgrades, office and lab renovations and other building improvement projects at all of the University’s campuses and agencies.
Equipment additions totaled $7.7 million during 2014. Research and instruction in the sciences require a substantial equipment investment, and many specialized pieces of equipment are grant-funded. In 2014, equipment related to research accounted for $2.2 million of the additions. Approximately $0.9 million in library materials were acquired in 2014 as well.
Other noncurrent assets include endowment fund and other long term investments, student loans receivable, and donated funds restricted to use for facility construction. The balance increased $40.8 million from 2013, primarily due to a $32.5 million increase in investments which was primarily the result of unexpended bond proceeds for the future construction of a new residence hall on the Bozeman campus, and an $8.7 million increase in other noncurrent assets primarily resulting from a $9.5 million gift receivable from the MSU Alumni Foundation.
Deferred outflows represent both the University’s derivative financial instrument and the deferred loss on debt refunding.
Derivative financial instruments are presented as deferred outflows which offset the University’s hedging derivative instrument liability recorded in non-current liabilites. The University pays a variable rate of interest to the holders ofits Series J bonds. To hedge against rises in interest rates, a transaction was entered into whereby the counterparty pays to the University that same variable rate of interest, and in return the University pays the counterparty a fixed rate of interest. The counterparty may opt out in 2016. Because current bond interest rates are lower than the fixed amount paid to the counterparty, the market value of the instrument is negative. As such, a liability was recorded and is included in Noncurrent liabilities. The offsetting entry is displayed as a deferred outflow rather than being recorded as an expense, because the cash flow hedge is operating as anticipated to achieve the intended synthetic fixed interest rate. The balance remained stable from 2013 to 2014.
The deferred loss on debt refunding is the excess of the reacquisition price of refunded debt over its net carrying amount.For the year ended June 30, 2014, the University adopted the provisions of GASB Statement No. 65, Items Previously Reported as Assets and Liabilities, which required reclassifying deferred loss on debt refunding balances from an offset to long-term debt into a deferred outflow. The deferred loss on refunding balances that were reclassified were related to Series 2004I, Series 2006K, Series 2008L, Series 2012N and Series 2012O. This reclassification is reflected for all periods presented, including $3.7 million for the year ended June 30, 2014 and $4.1 million for the year ended June 30, 2013.
Current liabilities include payroll and related liabilities, amounts payable to suppliers for goods and services received, cash received for which the University has not yet earned the related revenue, securities lending liability, and debt principal payments due within one year. The balance increased $3.1 million, or 4.3%, from 2013 to 2014,primarily as a result of an increase of $1.3 million in compensated absence liability estimated to be payable within a one-year period. The remainder of the increase resulted primarily from the overall growth of the University and related operating expenses.
Noncurrent liabilities include debt and advance liabilities, the amount of compensated absence liability estimated to be payable after a one-year period, and amounts which would be payable to the Federal government should the University choose to cease participation in the Federal Perkins Loan or Nursing Loan programs. These balances increased a total of $62.9 million, or 28.3%, resulting primarily from an increase in debt and leases payable of $60.9 million as the University issued $65.5 million in new bonds during 2014 to fund a new 400-bed residence hall and a new academic building on the Bozeman campus, and enhance its three dining facilities. In addition, the University’s OPEB liability, which is an actuarially-determined amount related to the participation of retirees on the University’s
A-11
Montana State University(a component unit of the State of Montana)Management’s Discussion and AnalysisAs of and For Each of the Years Ended June 30, 2014 (continued)
10
health insurance plan, increased $4.6 million. An actuarially-determined liability of approximately $49.9 million was calculated, of which the seventh year of a 30-year amortization, plus interest, was recorded during 2014 (see note 15 to the financial statements). These increases were offset by a decrease in the non-current portion of advances from primary government of $2.2 million. This decrease was primarily due to $2.7 million in advancesthrough the state’s Intercap loan program being repaid or reclassified to current liabilities, while $0.5 million was borrowed. Additional information can be found in note 10 to the financial statements.
Net investment in capital assets consist of the historical acquisition value of capital assets, reduced by both accumulated depreciation expense charged against assets and debt balances related to capital assets. This balance increases as assets are acquired and debt is repaid, and decreases as assets are depreciated and debt is incurred. Balances increased $12.4 million due to asset additions and debt repayment (discussed above), and were decreasedby depreciation expense and additional debt and intergovernmental advances incurred.
Restricted, non-expendable balances must be held in perpetuity, and include endowment principal as well as certain balances in student loan funds. Balances increased $0.2 million, primarily due an increase in fair market value in the University-owned endowment balances as compared with 2013 balances.
Restricted, expendable net assets represent balances that may be expended by the University in accordance with restrictions imposed by an external party, such as a donor, or through a legislative mandate. The University’s most significant restricted, expendable balances relate to funds restricted to use for the construction, renewal or replacement of facilities, for the payment of debt and for scholarships. Balances increased $1.5 million in comparison with 2013 balances.
Unrestricted net assets may be designated for specific purposes by action of management or the Board of Regents, or may otherwise be limited by contractual agreements with outside parties. Unrestricted net assets are designated for specific purposes as described in the notes to the financial statements, and include funds accumulated for employee termination payouts, scholarships, facility renewal and replacement, and student organization funds. The University’sreserves decreased $4.3 million in comparison with 2013 balances.
Comparison of 2013 and 2012 Net Position (restated)
Current assets include the University’s cash and cash equivalents; accounts, grants and loans receivable; inventories; and other assets expected to benefit the University within one year. Accounts and grants receivable result primarily from sponsored projects that are payable on a cost-reimbursement basis, and also from student accounts. The decrease of $2.4 million in current assets resulted primarily from a decrease of $3.3 million in cash and equivalents, which is discussed in the Statement of Cash Flows section of this document.
Capital assets, net increased $16.0 million, resulting from asset additions of $47.5 million, offset by depreciation and amortization expense of $30.0 million and $1.5 million in net book value of asset retirements, as shown in further detail in Note 7 to the financial statements.
Asset additions included $31.2 million in construction projects. The Bozeman campus completed the renovation of Cooley Lab with additional costs of $2.8 million and continued the construction of Gallatin Residence Hall expending $5.5 million during 2013. Improvements to Hapner and Langford Halls in Bozeman added $3.4 million and renovation to the Student Union Building in Billings added $1.8 million. A number of energy efficiency enhancements were also implemented, totaling $6.3 million. Additional, smaller projects make up the remaining increase, and include residence hall upgrades, office and lab renovations and other building improvement projects.
Equipment additions totaled $10.0 million during 2013. Research and instruction in the sciences require a substantial equipment investment, and accounted for $5.2 million of the additions. Many specialized pieces of equipment are grant-funded. Approximately $1.2 million in library materials were acquired in 2013 as well.
A-12
Montana State University(a component unit of the State of Montana)Management’s Discussion and AnalysisAs of and For Each of the Years Ended June 30, 2014 (continued)
11
Other noncurrent assets include endowment fund and other long term investments, student loans receivable, and donated funds restricted to use for facility construction. The balance decreased $2.4 million from 2012, primarily due to a $1.7 million decrease in investments and a $1.3 million decrease in loans receivable.
Deferred outflows represent both the University’s derivative financial instrument and the deferred loss on debt refunding.
Derivative financial instruments are presented as deferred outflows which offset the University’s hedging derivative instrument liability recorded in non-current liabilites. The University pays a variable rate of interest to the holders of its Series J bonds. To hedge against rises in interest rates, a transaction was entered into whereby the counterparty pays to the University that same variable rate of interest, and in return the University pays the counterparty a fixed rate of interest. The counterparty may opt out in 2016. Because current bond interest rates are lower than the fixed amount paid to the counterparty, the market value of the instrument is negative. As such, a liability was recorded and is included in Noncurrent liabilities. The offsetting entry is displayed as a deferred outflow rather than being recorded as an expense, because the cash flow hedge is operating as anticipated to achieve the intended synthetic fixed interest rate. The balance decreased by $2.2 million from 2012 to 2013 due to an increase in the variable interest rate paid by the counterparty.
The deferred loss on debt refunding is the excess of the reacquisition price of refunded debt over its net carrying amount.During the year ended June 30, 2014, the University adopted the provisions of GASB Statement No. 65, Items Previously Reported as Assets and Liabilities, which required reclassifying deferred loss on debt refunding balances from an offset to long-term debt into a deferred outflow. The deferred loss on refunding balances that were reclassified were related to Series 2004I, Series 2006K, Series 2008L, Series 2012N and Series 2012O. This reclassification is reflected for all periods presented, including $4.1 million for the year ended June 30, 2013 and $1.2 million for the year ended June 30, 2012.
Current liabilities include payroll and related liabilities, amounts payable to suppliers for goods and services received, cash received for which the University has not yet earned the related revenue, securities lending liability, and debt principal payments due within one year. The balance increased $5.4 million, or 8.0%, from 2012 to 2013, primarily as a result of an increase of approximately $4.0 million in accounts payable relating to payments to vendors for energy improvement and other construction projects. The remainder of the increase resulted primarily from the overall growth of the University and related operating expenses.
Noncurrent liabilities include debt and advance liabilities, the amount of compensated absence liability estimated to be payable after a one-year period, and amounts which would be payable to the Federal government should the University choose to cease participation in the Federal Perkins Loan or Nursing Loan programs. These balances increased a total of $5.8 million, or 2.7%, resulting primarily from the University’s OPEB liability, which is an actuarially-determined amount related to the participation of retirees on the University’s health insurance plan, and increased $6.4 million. An actuarially-determined liability of approximately $55.4 million was calculated, of which the sixth year of a 30-year amortization, plus interest, was recorded during 2013 (see note 15 to the financial statements). In addition, the non-current portion of advances from primary government increased $3.6 million, because $5.9 million was borrowed through the state’s Intercap loan program, while $1.8 million in advances were repaid. These increases were offset by a decrease in the non-current portion of debt and leases payable of $3.4million, as the University paid down a portion of its debt in accordance with anticipated repayment schedules.
Net investment in capital assets consist of the historical acquisition value of capital assets, reduced by both accumulated depreciation expense charged against assets and debt balances related to capital assets. This balance increases as assets are acquired and debt is repaid, and decreases as assets are depreciated and debt is incurred. Balances increased due to asset additions and debt repayment (discussed above), and were decreased by depreciation expense and additional debt and intergovernmental advances incurred.
A-13

Montana State University(a component unit of the State of Montana)Management’s Discussion and AnalysisAs of and For Each of the Years Ended June 30, 2014 (continued)
12
Restricted, non-expendable balances must be held in perpetuity, and include endowment principal as well as certain balances in student loan funds. Balances increased $0.6 million, primarily due an increase in fair market value in the University-owned endowment balances as compared with 2012 balances.
Restricted, expendable net assets represent balances that may be expended by the University in accordance with restrictions imposed by an external party, such as a donor, or through a legislative mandate. The University’s most significant restricted, expendable balances relate to funds restricted to use for the construction, renewal or replacement of facilities, for the payment of debt and for scholarships. Balances increased $1.6 million in comparison with 2012 balances.
Unrestricted net assets may be designated for specific purposes by action of management or the Board of Regents, or may otherwise be limited by contractual agreements with outside parties. Substantially all unrestricted net assets are designated for specific purposes as described in the notes to the financial statements, and include funds accumulated for employee termination payouts, scholarships, facility renewal and replacement, and student organization funds. The University’s unrestricted net assets decreased by $10.3 million, primarily as a result of non-cash OPEB expense of $6.4 million, as well as the use of a portion of University reserves for strategic investments.
CASH FLOWS
Condensed Statements of Cash Flows(in millions)
The Statement of Cash Flows presents information related to cash inflows and outflows, categorized by operating, noncapital financing, capital financing, and investing activities. The reconciliation of operating loss to cash used in operations explains the relationship between the Statement of Net Position and the Statement of Revenues, Expenses and Changes in Net Position, showing that increases and decreases in operating assets often require the use or receipt of cash, but do not result in recognition of a revenue or an expense.
Comparison of 2014 and 2013 Cash Flows
Operating activities used $126.6 million in cash, resulting primarily from an operating loss of $160.9 million. The operating loss was offset by non-cash expenses of $36.5 million, primarily due to $30.8 million in depreciation and amortization, as well as $4.6 million in non-cash expense resulted from the amortization of the Annual Required Contribution to the OPEB liability (see note 15 to the financial statements). Other, less significant, increases and decreases also contributed to the change. In 2013, operating activities used $106.4 million in cash, with an operating loss of $148.3 million, offset by non-cash expenses of $37.6 million.
Noncapital financing activities provided $158.5 million in cash, resulting from $110.5 million in state and localappropriations, $29.0 million in federal Pell grant revenue, $15.3 million in expendable gifts, and $3.4 million of land grant income. In 2013, noncapital financing activities provided $146.1 million in cash resulting from $101.1
2014 2013 2012Cash provided/(used) by:
Operating activities, net $ (126.6) $ (106.4) $ (104.7)Noncapital financing activities,
net 158.5 146.1 149.4Capital and related financing
activities, net 20.1 (46.4) (22.6)Investing activities, net (51.0) 3.4 2.4
Net change in cash 1.0 (3.3) 24.5Cash, beginning of year 180.2 183.5 159.0Cash, end of year $ 181.1 $ 180.2 $ 183.5
A-14
Montana State University(a component unit of the State of Montana)Management’s Discussion and AnalysisAs of and For Each of the Years Ended June 30, 2014 (continued)
13
million in state and local appropriations, $30.2 million in federal Pell grant revenue, $13.8 million in expendable gifts, and $1.9 million of land grant income.
Capital and related financing activities provided $20.1 million in cash, resulting primarily from cash proceeds from debt refunding and other borrowings which provided $68.7 million. The debt refunding and other borrowings was offset by cash expended on capital assets of $36.0, including building construction (see note 7 to the financial statements). Other uses of cash include $6.7 million in principal debt repayments and interest payments of $5.8 million. In 2013, these activities used $46.4 million in cash. Uses in 2013 included debt interest, principal and advance payments totaling $53.9 million and $40.3 million expended on capital assets. Proceeds from debt refunding and other borrowings provided $49.1 million and borrowings from the State’s Intercap lending program provided $5.9 million in 2013.
Comparison of 2013 and 2012 Cash Flows
Operating activities used $106.4 million in cash, resulting primarily from an operating loss of $148.3 million. The operating loss was offset by non-cash expenses of $37.6 million, primarily due to $30.0 million in depreciation and amortization, as well as $6.4 million in non-cash expense resulted from the amortization of the Annual Required Contribution to the OPEB liability (see note 15 to the financial statements). Other, less significant, increases and decreases also contributed to the change. In 2012, operating activities used $104.7 million in cash, with an operating loss of $140.3 million, offset by non-cash expenses of $36.1 million.
Noncapital financing activities provided $146.1 million in cash, resulting from $101.1 million in state and local appropriations, $30.2 million in federal Pell grant revenue, $13.8 million in expendable gifts, and $1.9 million of land grant income. In 2012, noncapital financing activities provided $149.4 million in cash resulting from $101.0 million in state and local appropriations, $31.8 million in federal Pell grant revenue, $13.6 million in expendable gifts, and $1.8 million of land grant income.
Capital and related financing activities used $46.4 million in cash. Debt interest, principal and advance payments totaled $61.6 million, primarily due to $53.9 in principal repayments and refunding of debt offset by proceeds from debt refunding and other borrowings which provided $49.1 million, and borrowings from the State’s Intercap lending program which provided $5.9 million. Uses also included $40.3 million expended on capital assets, including building construction (see note 7 to the financial statements). In 2012, these activities used $22.6 million in cash. Uses in 2012 included $31.2 million expended on capital assets, and debt interest, principal and advance payments totaling $12.8 million. Proceeds from a bond issuance provided $15.3 million in 2012, borrowings from the State’s Intercap lending program provided $2.8 million, and borrowing through the State Building Energy Conservation Program provided $1.5 million in 2012.
A-15

Montana State University(a component unit of the State of Montana)Management’s Discussion and AnalysisAs of and For Each of the Years Ended June 30, 2014 (continued)
14
DEBT AND ADVANCES
As of June 30, 2014, the University had approximately $179.5 million in outstanding bond, note, and capital lease principal, an increase compared with $117.8 million at June 30, 2013 (see note 10 to the financial statements). Bonds were issued during 2014 to construct a new 400-bed residence hall and make improvements to three existing dining halls, and other major deferred maintenance projects. Bonds were also issued to bridge the construction of a new gift-funded academic building. The majority of bond debt bears interest at fixed rates, except for $32.5 million in bonds which arereset with a weekly municipal bond index. A fixed-payer swap and a constant maturity swap are associated with theSeries 2005J variable rate debt, as described in note 10 to the financial statements. Intercap debt is issued at a variable rate, reset each February, and as of June 30, 2014, was 1.0%. As of June 30, 2014, and as of the most recent rating reports received in October, 2013, the University’s bonds are rated Aa3 by Moody’s Investor Services and A+ by Standard and Poor’s.
ECONOMIC OUTLOOK
In May 2013 the Board of Regents adopted a pilot performance-based funding model for fiscal year 2014 and beyond, which will affect the allocation of 5% of the University’s state appropriation (approximately $7.5 million for the entire Montana University System). The performance indicators include graduation rates and the number of freshman returning for their sophomore year. Performance through fiscal year 2014 will result in additional funding of $4.3 million during fiscal year 2015 allocated to the University, with the remaining $4.2 million allocated to other higher education units in the state.
Student enrollment has increased in each of the past seven years as the University gained in market share state-wide and in the nonresident market. Resident enrollment represents over 74% of the University’s 2014 student FTE of 20,053.Management continues to focus on the University’s recruiting efforts to maintain an appropriate mix of in- and out-of-state students. Increased enrollment, combined with tuition increases for nonresident students implemented at the four-year campuses in 2013 and 2014 have enabled the University to implement 2% and 2.5% pay increases. Additionally,modest reserves have been set aside which ensure the availability of retirement payout and scholarship funding, and also provide a means to absorb unexpected expenses or decreases in revenue.
To assist in the allocation of its resources, management evaluates programs regularly, and maintains a budgeting process that is open to the public. Accountability and stewardship of the University’s assets are stressed by top management, as is excellence in the programs offered. University management will continue to determine the proper balance between spending and revenue, to ensure that quality programs remain while access to the University is not unduly limited by the cost of attendance.
A-16

Montana State University(a component unit of the State of Montana)Consolidated Statements of Net PositionAs of June 30
ASSETS2014 2013
(restated)Current assets:
Cash and cash equivalents (note 2) $ 180,047,112 $ 179,119,894Short term investments 20,702,031 -Securities lending collateral 849,459 1,141,800Accounts and grants receivable, net (note 3) 9,580,002 9,216,998Amounts receivable from Federal government 15,982,897 13,669,630Amounts receivable from primary government 510,233 607,165Amounts receivable from other State of Montana component units 5,469 8,354Loans receivable, net (note 6) 3,538,131 3,492,445Inventories (note 4) 3,519,622 2,918,317Prepaid expenses and other current assets (note 5) 4,410,685 2,781,255
Total current assets 239,145,641 212,955,858Noncurrent assets
Restricted cash and cash equivalents 1,072,977 1,038,664Restricted investments 7,363,365 7,285,637Loans receivable, net (note 6) 19,623,952 20,128,858Investments 51,017,281 18,521,030Capital assets, net (note 7) 403,200,491 394,022,468Other noncurrent assets (note 7) 9,841,999 1,138,656
Total noncurrent assets 492,120,065 442,135,313Total assets 731,265,706 655,091,171
DEFERRED OUTFLOWSDerivative financial instrument (note 10) 3,852,345 3,868,317Deferred loss on debt refunding (note 11) 3,677,924 4,087,746
Total deferred outflows 7,530,269 7,956,063TOTAL ASSETS AND DEFERRED OUTFLOWS $ 738,795,975 $ 663,047,234
LIABILITIES Current liabilities:
Accounts payable and accrued liabilities (note 8) $ 36,148,887 $ 35,219,474Advances and other amounts payable to primary government 2,311,113 2,317,881Amounts payable to other State of Montana component units 107,047 145,652Securities lending liability 849,459 1,141,800Property held in trust for others 1,845,701 1,583,463Unearned revenues (note 9) 10,270,306 10,177,719Current portion compensated absences 16,784,864 15,512,992Current portion debt and capital lease obligations (note 10) 7,560,876 6,676,591
Total current liabilities 75,878,253 72,775,572Noncurrent liabilities:
Advances from primary government 21,050,852 23,236,002Debt, capital lease, and other obligations (note 10) 171,981,451 111,102,333Compensated absences 13,807,042 14,004,836LT OPEB Implicit Rate Subsidy 51,399,245 46,831,891Due to Federal government 22,774,457 22,593,240Derivative instrument-- swap liability (note 10) 4,034,590 4,389,311
Total noncurrent liabilities 285,047,637 222,157,613Total liabilities 360,925,890 294,933,185NET POSITION
Net investment in capital assets 276,193,219 263,785,515Restricted - nonexpendable 13,201,116 13,025,939Restricted - expendable 15,915,324 14,423,380Unrestricted (note 13) 72,560,426 76,879,215
Total net position 377,870,085 368,114,049TOTAL LIABILITIES AND NET POSITION $ 738,795,975 $ 663,047,234
The accompanying notes are an integral part of these financial statements.
A-17

Montana State University(a component unit of the State of Montana)UNIVERSITY COMPONENT UNITS-- Combined Statements of Financial PositionAs of June 30 or December 31
Assets: 2014 2013Cash and cash equivalents $ 6,531,364 $ 5,456,760
Accrued dividends and interest 106,045 121,521Investments 216,914,664 183,513,218Amounts due from the institution or other MSU component units 1,305,169 1,440,169Contributions receivable, net of allowance 21,221,893 20,989,054Contracts, notes and other receivables 4,645,621 4,823,351Non-depreciable capital assets 456,581 472,486Depreciable capital assets, net 8,963,748 9,657,349Other assets 2,030,490 2,234,615
Total assets $ 262,175,575 $ 228,708,523
Liabilities and net assets:Liabilities
Accounts payable $ 599,079 $ 605,413 Accrued expenses and other liabilities 1,224,937 1,205,233Compensated absences 457,588 445,857Notes and bonds payable 12,680,581 2,742,589Amounts due to the institution or other MSU component units 634,162 613,917Liabilities to external beneficiaries 8,275,099 7,181,238Custodial funds 12,607,847 11,568,333Total liabilities 36,479,293 24,362,580
Net assetsUnrestricted net assets 17,867,161 16,644,785Temporarily restricted net assets 88,202,975 79,983,416Permanently restricted net assets 119,626,146 107,717,742Total net assets 225,696,282 204,345,943
Total liabilities and net assets $ 262,175,575 $ 228,708,523The accompanying notes are an integral part of these financial statements.
A-18

Montana State University(a component unit of the State of Montana)Consolidated Statements of Revenues, Expenses and Changes in Net PositionAs of and for Each of the Years Ended June 30
OPERATING REVENUES2014 2013
(restated)Tuition and fees (net of $33,958,075 and $33,174,915 scholarship discount) $ 161,709,200 $ 153,523,695Federal appropriations 4,931,090 5,044,560Federal grants and contracts 69,533,147 69,497,113State grants and contracts 6,120,375 6,187,965Non-governmental grants and contracts 9,704,352 10,367,073Grant and contract facilities and administrative cost recoveries 15,861,311 16,349,985Educational, public service and outreach revenues 24,697,825 24,294,342Auxiliary revenues:Housing (net of $2,910,883 and $2,759,381 scholarship discount) 18,333,032 17,326,126Food services (net of $2,823,799 and $2,689,116 scholarship discount) 18,637,625 16,974,138Other auxiliary sales and services (net of $782,912 and $796,828 scholarship
discount)9,968,576 9,630,042
Interest earned on loans 75,355 108,097Other operating revenues 2,305,523 4,349,063
Total operating revenues 341,877,411 333,652,199
OPERATING EXPENSESCompensation and benefits 291,328,431 276,921,086Annual Required Contribution to OPEB (note 15) 5,430,244 6,838,811Operating expenses (note 14) 147,979,316 141,602,956Scholarships and fellowships (net of $40,475,669 and $39,420,240
scholarship discount) 27,201,954 26,541,997Depreciation and amortization 30,834,839 30,025,952
Total operating expenses 502,774,784 481,930,802Operating loss (160,897,373) (148,278,603)
NONOPERATING REVENUES (EXPENSES)State and local appropriations 110,541,580 101,115,514Federal Pell grant revenue 28,973,682 30,207,442Land grant income (pledged as security for repayment of bonds) 3,375,355 1,931,796Gifts (expendable) 15,340,768 13,786,571Investment income 2,667,274 1,260,416Interest expense (6,037,446) (5,513,076)
Net non operating revenues (expenses) 154,861,213 142,788,663Income before other revenues, expenses, gains and losses (6,036,160) (5,489,940)Loss on disposals of capital assets (348,084) (1,291,770)Additions to permanent endowment 46,755 106,175Capital gifts, grants and contributions 16,093,525 7,329,815Change in net position 9,756,036 654,280
Net position, beginning of year as previously stated 368,114,049 359,897,962
Prior period OPEB restatement - 7,561,807
Net position, beginning of year as restated 368,114,049 367,459,769
Net position, end of year $ 377,870,085 $ 368,114,049
The accompanying notes are an integral part of these financial statements.
A-19

Montana State University(a component unit of the State of Montana)UNIVERSITY COMPONENT UNITS-- Combined Statement of ActivitiesAs of and for the Year Ended June 30, 2014 or December 31, 2013
Temporarily PermanentlyUnrestricted Restricted Restricted Total
Revenues:Contributions $ 2,428,436 $ 13,999,544 $ 10,746,483 $ 27,174,463Investment, interest and dividend
income 1,461,462 1,858,638 35,330 3,355,430Net realized and unrealized gain
(loss) on investments 2,701,776 18,500,247 133,992 21,336,015Contract support and contributions
from University 1,420,203 - - 1,420,203Special events 1,084,165 33,068 - 1,117,233Other income 7,821,502 (1,959,840) 21,493 5,883,155Net assets released from restrictions 23,926,765 (24,184,694) 257,929 -Total revenues 40,844,309 8,246,963 11,195,227 60,286,499
Expenses:Program services
University support 18,234,498 18,234,498Academic and institutional 2,554,024 2,554,024Scholarships and awards 6,186,665 6,186,665Total program services expense 26,975,187 26,975,187
Operating expensesFundraising efforts 3,733,069 3,733,069General and administrative 5,854,885 5,854,885Investment management costs 1,020,745 1,020,745Other miscellaneous 2,030,082 2,030,082Total operating expenses 12,638,781 12,638,781
Change in net assets before Nonoperating items 1,230,341 8,246,963 11,195,227 20,672,531
Nonoperating expensesPayments to beneficiaries and
change in liabilities to external beneficiaries (7,965) (27,404) 713,177 677,808
Change in net assets 1,222,376 8,219,559 11,908,404 21,350,339
Net assets, beginning of year 16,644,785 79,983,416 107,717,742 204,345,943
Net assets, end of fiscal year $ 17,867,161 $ 88,202,975 $ 119,626,146 $ 225,696,282The accompanying notes are an integral part of these financial statements.
A-20
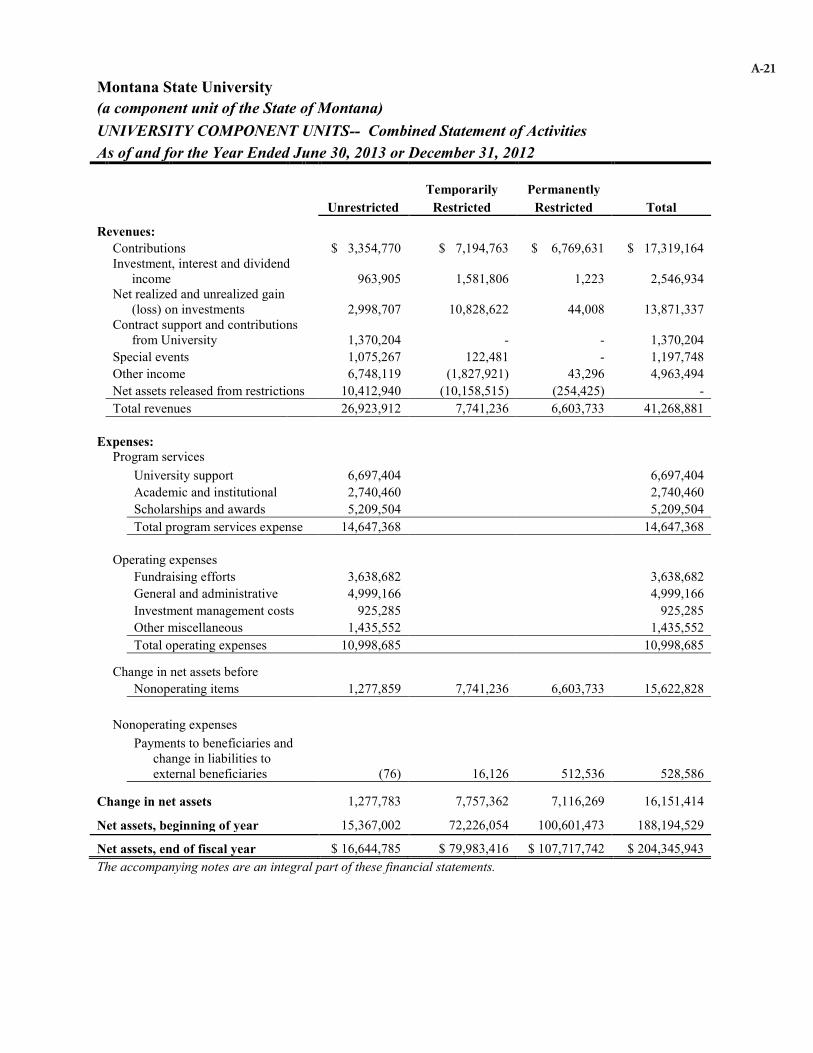
Montana State University(a component unit of the State of Montana)UNIVERSITY COMPONENT UNITS-- Combined Statement of ActivitiesAs of and for the Year Ended June 30, 2013 or December 31, 2012
Temporarily PermanentlyUnrestricted Restricted Restricted Total
Revenues:Contributions $ 3,354,770 $ 7,194,763 $ 6,769,631 $ 17,319,164 Investment, interest and dividend
income 963,905 1,581,806 1,223 2,546,934Net realized and unrealized gain
(loss) on investments 2,998,707 10,828,622 44,008 13,871,337Contract support and contributions
from University 1,370,204 - - 1,370,204Special events 1,075,267 122,481 - 1,197,748Other income 6,748,119 (1,827,921) 43,296 4,963,494Net assets released from restrictions 10,412,940 (10,158,515) (254,425) -Total revenues 26,923,912 7,741,236 6,603,733 41,268,881
Expenses:Program services
University support 6,697,404 6,697,404Academic and institutional 2,740,460 2,740,460Scholarships and awards 5,209,504 5,209,504Total program services expense 14,647,368 14,647,368
Operating expensesFundraising efforts 3,638,682 3,638,682General and administrative 4,999,166 4,999,166Investment management costs 925,285 925,285Other miscellaneous 1,435,552 1,435,552Total operating expenses 10,998,685 10,998,685
Change in net assets before Nonoperating items 1,277,859 7,741,236 6,603,733 15,622,828
Nonoperating expensesPayments to beneficiaries and
change in liabilities to external beneficiaries (76) 16,126 512,536 528,586
Change in net assets 1,277,783 7,757,362 7,116,269 16,151,414
Net assets, beginning of year 15,367,002 72,226,054 100,601,473 188,194,529
Net assets, end of fiscal year $ 16,644,785 $ 79,983,416 $ 107,717,742 $ 204,345,943The accompanying notes are an integral part of these financial statements.
A-21
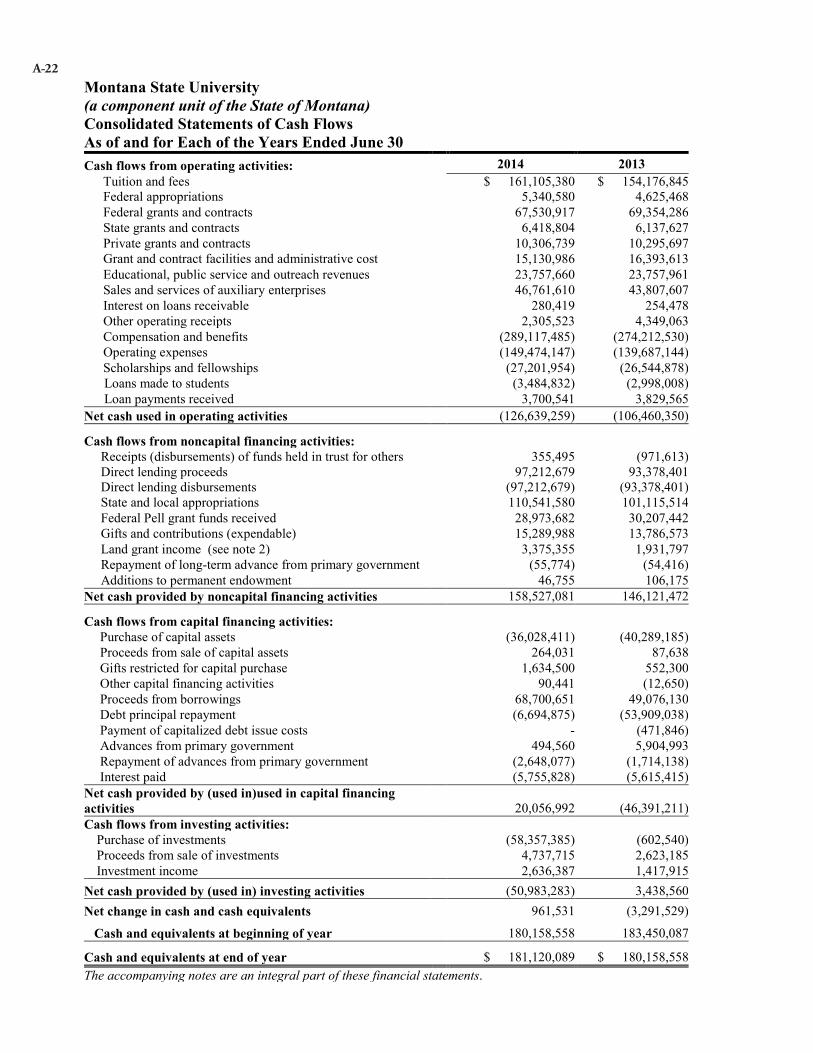
Montana State University(a component unit of the State of Montana)Consolidated Statements of Cash FlowsAs of and for Each of the Years Ended June 30Cash flows from operating activities: 2014 2013
Tuition and fees $ 161,105,380 $ 154,176,845Federal appropriations 5,340,580 4,625,468Federal grants and contracts 67,530,917 69,354,286State grants and contracts 6,418,804 6,137,627Private grants and contracts 10,306,739 10,295,697Grant and contract facilities and administrative cost 15,130,986 16,393,613Educational, public service and outreach revenues 23,757,660 23,757,961Sales and services of auxiliary enterprises 46,761,610 43,807,607Interest on loans receivable 280,419 254,478Other operating receipts 2,305,523 4,349,063Compensation and benefits (289,117,485) (274,212,530)Operating expenses (149,474,147) (139,687,144)Scholarships and fellowships (27,201,954) (26,544,878)Loans made to students (3,484,832) (2,998,008)Loan payments received 3,700,541 3,829,565
Net cash used in operating activities (126,639,259) (106,460,350)
Cash flows from noncapital financing activities:Receipts (disbursements) of funds held in trust for others 355,495 (971,613)Direct lending proceeds 97,212,679 93,378,401Direct lending disbursements (97,212,679) (93,378,401)State and local appropriations 110,541,580 101,115,514Federal Pell grant funds received 28,973,682 30,207,442Gifts and contributions (expendable) 15,289,988 13,786,573Land grant income (see note 2) 3,375,355 1,931,797Repayment of long-term advance from primary government (55,774) (54,416)Additions to permanent endowment 46,755 106,175
Net cash provided by noncapital financing activities 158,527,081 146,121,472
Cash flows from capital financing activities:Purchase of capital assets (36,028,411) (40,289,185)Proceeds from sale of capital assets 264,031 87,638Gifts restricted for capital purchase 1,634,500 552,300Other capital financing activities 90,441 (12,650)Proceeds from borrowings 68,700,651 49,076,130Debt principal repayment (6,694,875) (53,909,038)Payment of capitalized debt issue costs - (471,846)Advances from primary government 494,560 5,904,993Repayment of advances from primary government (2,648,077) (1,714,138)Interest paid (5,755,828) (5,615,415)
Net cash provided by (used in)used in capital financing activities 20,056,992 (46,391,211)Cash flows from investing activities:
Purchase of investments (58,357,385) (602,540)Proceeds from sale of investments 4,737,715 2,623,185Investment income 2,636,387 1,417,915
Net cash provided by (used in) investing activities (50,983,283) 3,438,560Net change in cash and cash equivalents 961,531 (3,291,529)
Cash and equivalents at beginning of year 180,158,558 183,450,087
Cash and equivalents at end of year $ 181,120,089 $ 180,158,558The accompanying notes are an integral part of these financial statements.
A-22

Montana State University(a component unit of the State of Montana)Consolidated Statements of Cash Flows (continued)As of and for Each of the Years Ended June 30
Reconciliation of Operating Loss to Net Cash Used in Operations
2014 2013(restated)
Operating loss $ (160,897,373) $ (148,278,603)Noncash income and expense:
Depreciation and amortization on capital assets 30,834,839 30,025,952Provision for uncollectible accounts 1,080,783 1,162,179Amortization of OPEB liability 4,567,354 6,364,088
Changes in operating assets and liabilities:Accounts and grants receivable (2,759,756) (2,396,644)Loans receivable 439,075 1,086,271Inventories (601,305) 196,710Prepaid expenses (1,679,429) (722,807)Accounts payable and other accrued liabilities 1,028,672 3,298,467Unearned revenue 92,587 1,061,889Compensated absences 1,074,077 1,629,338Amounts due to Federal government 181,217 112,810
Net cash used in operations $ (126,639,259) $ (106,460,350)
Schedule of noncash financing and investing activities
2014 2013
Capital assets contributed to the University $ 4,459,526 $ 6,777,514Capital assets acquired through issuance of capital lease obligations $ 137,038 $ 305,712Capital assets acquired via trade-in $ 119,601 $ 90,139Bond issue costs, discounts, premiums and deferred loss on
refunding amortized or written off to interest expense (net) $ 8,508 $ 780,146Net increase (decrease) in fair value of investments $ (53,264) $ 362,300
Reconciliation of cash and cash equivalents as shown on the Statements of Cash Flows to cash as shown in the Statements of Net Position
2014 2013Cash and cash equivalents classified as current assets $ 180,047,112 $ 179,119,894Cash and cash equivalents classified as noncurrent assets 1,072,977 1,038,664Total cash and cash equivalents as reported on the
Statements of Cash Flows $ 181,120,089 $ 180,158,558
The accompanying notes are an integral part of these financial statements.
A-23

Montana State University(a component unit of the State of Montana)Notes to Consolidated Financial StatementsAs of and for Each of the Years Ended June 30
A-22
NOTE 1 – ORGANIZATION, BASIS OF PRESENTATION AND SUMMARY OF SIGNIFICANT ACCOUNTING POLICIES
ORGANIZATIONThe accompanying financial statements include all activities of the four Montana State University campuses, the Montana Agricultural Experiment Station, Montana Extension Service and the Fire Services Training School, collectively referred to as the “University.” The four campuses of the University are Montana State University–Bozeman, Montana State University– Billings, Montana State University– Northern (located in Havre) and Great Falls College Montana State University. Significant interagency transactions have been eliminated in consolidation.
The University is the State’s land grant university, serving the state, national and international communities by providing its students with academic instruction, conducting a high level of research activity, performing other activities that advance fundamental knowledge, and by disseminating knowledge to the people of Montana.
A financial reporting entity, as defined by Governmental Accounting Standards Board (“GASB”) Statement No. 14, The Financial Reporting Entity, consists of the primary government, organizations for which the primary government is financially accountable and other organizations for which the nature and significance of their relationship with the primary government are such that exclusion could cause the financial statements to bemisleading or incomplete. Accordingly, the financial statements for the University are included as a component unit of the State of Montana Basic Financial Statements, which are prepared annually and presented in the Montana Comprehensive Annual Financial Report (CAFR).
In May 2002, the Governmental Accounting Standards Board (GASB) issued Statement No. 39, Determining Whether Certain Organizations Are Component Units, an Amendment of GASB Statement No. 14. The statement was clarified by the issuance of GASB Statement No. 61, The Financial Reporting Entity:Omnibus—An Amendment of GASB Statements No. 14 and No. 34, which modifies certain requirements for inclusion of component units in the financial reporting entity. The statements require that a legally tax exempt organization be reported as a component unit of a reporting entity if the economic resources received or held by these organizations are entirely or virtually entirely for the direct benefit of the reporting entity or its component units, and the reporting entity is entitled to, or has the means to otherwise access, a majority of the economic resources received or held by the separate organization. The resources of the separate organization must also be significant to the reporting entity. In addition, organizations are evaluated for inclusion if they are closely related to, or financially integrated with, the reporting entity, and qualify as presenting a financial benefit or burden relationship. The University has established a threshold minimum of 1% - 2% of consolidated net position or 1% - 2% of consolidated revenues as an initial requirement for inclusion of an organization as a component unit in its financial statements. Other entities may be included, though, if the University determines that to exclude the entity would be misleading, according to clarified criteria presented on statement No. 61. For further discussion of component units, see Note 20.
BASIS OF PRESENTATIONIn June 1999, the GASB issued Statement No. 34, Basic Financial Statements and Management Discussion and Analysis for State and Local Governments. This was followed in November, 1999 by GASB Statement No. 35, Basic Financial Statements and Management’s Discussion and Analysis for Public Colleges and Universities. As a component unit of the State of Montana, the University was also required to adopt GASB Statements No. 34 and No. 35. The latter statement was adopted as amended by GASB Statements No. 37 and No. 38.
The financial statement presentation required by GASB Statements No. 34 and No. 35 provides a comprehensive, entity-wide perspective of the University’s assets, liabilities, net position, revenues, expenses, changes in net position, and cash flows, and replaces the fund-group perspective previously required.
For financial reporting purposes, the University is considered a special-purpose government engaged only in business-type activities. Business-type activities are those that are financed in whole or in part by fees charged to external parties for goods or services. Accordingly, the University’s financial statements have been prepared using
A-24
Montana State University(a component unit of the State of Montana)Notes to Consolidated Financial StatementsAs of and for Each of the Years Ended June 30 (continued)
the economic resources measurement focus and the accrual basis of accounting. Under the accrual basis, revenues are recognized when earned, and expenses are recorded when an obligation has been incurred.
Certain prior year amounts have been reclassified to conform with current year presentation. In addition, a prior year restatement was made because it was discovered that the University had over-recorded its OPEB liability in all except the year of inception. As a result, the beginning fund balance as previously reported was increased by $7.6 million, and the OPEB and related benefits expense previously reported in 2013 was reduced by $1.9 million.
SIGNIFICANT ACCOUNTING POLICIES
Cash equivalents – For purposes of the statement of cash flows, the University considers its unrestricted, highly liquid investments purchased with an original maturity of three months or less to be cash equivalents. Certain funds on deposit with trustees, as well as funds invested in the Short Term Investment Pool with the Montana Board of Investments are considered cash equivalents, unless the Montana Board of Investments management determines that a portion of its portfolio is sufficiently illiquid and should be considered investments. In such cases, each participant in the pool is allocated its pro-rata share of illiquid funds.
Investments – The University accounts for its investments at fair value in accordance with GASB Statement No. 31 Accounting and Financial Reporting for Certain Investments and for External Investment Pools. Investment income is recorded on the accrual basis. All investment income, including unrealized gains and losses on the carrying value of investments, is reported as a component of investment income. Investments include derivatives that do not qualify for hedge accounting in accordance with GASB 53.
Accounts and grants receivable – Accounts receivable include tuition and fees charged to students and auxiliary enterprise services provided to students, faculty and staff. Accounts receivable also include amounts due from the Federal government, state and local governments, or private sources, in connection with reimbursement of allowable expenditures made pursuant to the University’s grants and contracts. Accounts receivable are reported net of estimated uncollectible amounts.
Allowances for uncollectible accounts – The University estimates the value of its receivables that will ultimately prove uncollectible, and has reported a provision for such as an expense in the accompanying financial statements.
Inventories – Inventories include consumable supplies, livestock, and food items and items held for resale or recharge within the University. Inventories are valued at lower of cost or market value, using First In First Out (FIFO) or specific identification methods.
Restricted cash and investments – Cash and investments that are externally restricted as to use are classified as noncurrent assets in the accompanying statement of net position. Such assets include endowment fund cash and investments.
Capital assets – Capital assets are stated at cost for purchased or constructed assets, and at estimated fair value for donated assets. Renovations to buildings, infrastructure, and land improvements that significantly increase the value,change the use, or extend the useful life of the structure are capitalized. Routine repairs and maintenance and minor renovations are charged to operating expense in the year in which the expense is incurred. Capitalization thresholds range from $5,000 for equipment to $500,000 for infrastructure.
Depreciation and amortization are computed on a straight-line basis over the estimated useful lives of the respective assets, ranging from 3 years for certain software to 75 years for certain infrastructure assets. The University has elected to capitalize museum, fine art and special library collections, but does not record depreciation on those items.
Unearned revenues – Unearned revenues include amounts received for tuition and fees and certain auxiliary activities prior to the end of the fiscal year but related to events occurring in the subsequent accounting period. Unearned revenues also include amounts received from grant and contract sponsors that have not yet been earned.
A-25
Montana State University(a component unit of the State of Montana)Notes to Consolidated Financial StatementsAs of and for Each of the Years Ended June 30 (continued)
Compensated absences – Eligible University employees earn a minimum of 8 hours sick and 10 hours annual leave for each month worked. Eligible employees may accumulate annual leave up to twice their annual accrual, while sick leave may accumulate without limitation. Twenty-five percent of accumulated sick leave earned after July 1, 1971 and 100 percent of accumulated annual leave, if not used during employment, is paid upon termination.
Other Post-Employment Benefits (OPEB) –During the year ended June 30, 2008, the University adopted GASBStatement No. 45, Accounting and Financial Reporting by Employers for Post-employment Benefits Other Than Pensions. The University allows retirees to participate in the Montana University System’s self-funded health insurance plan by paying an amount considered by the University to cover their full costs (as calculated using the pooled risk of retirees and active employees). An actuarial study determined that this blended rate structure results in an implicit rate subsidy to retirees, who are considered to be a higher-cost pool of participants. The State of Montana and its component units will amortize the calculated OPEB liability resulting from this implicit rate subsidy over a period of 30 years. The state has not mandated funding of the liability. See note 15.
Net position – Resources are classified in one of the following four categories:
Net investment in capital assets – this represents the University’s total investment in capital assets, net of accumulated depreciation and outstanding principal balances of debt attributable to the acquisition, construction or improvement of those assets.
Restricted, nonexpendable – this represents net balances subject to externally imposed stipulations requiring permanent maintenance. Such assets include the University's permanent endowment funds.
Restricted, expendable – this represents balances whose use by the University is subject to externally imposed stipulations as to use of the assets.
Unrestricted– this represents balances that are not subject to externally imposed stipulations. Unrestricted balances may be designated for specific purposes by action of management or the Board of Regents or may otherwise be limited by contractual agreements with outside parties. Substantially all unrestricted balancesare designated for specific purposes as described in Note 13.
Classification of revenues – The University has classified its revenues as either operating or nonoperating according to the following criteria:
Operating revenues – include activities that have the characteristics of exchange transactions, including (1) student tuition and fees, net of scholarship discounts and allowances, (2) sales and services of auxiliary enterprises, net of scholarship discounts and allowances, (3) most Federal, state and local grants and contracts and Federal appropriations, and (4) interest on institutional student loans.
Nonoperating revenues – include activities that have the characteristics of nonexchange transactions, such as gifts and contributions, and other revenue sources that are defined as nonoperating revenues by GASBStatement No. 9, Reporting Cash Flows of Proprietary and Nonexpendable Trust Funds and Governmental Entities That Use Proprietary Fund Accounting, and GASB No. 34, such as state appropriations and investment income.
Use of restricted revenues – When the University maintains both restricted and unrestricted funds for the same purpose, the order of use of such funds is determined on a case-by-case basis, depending on relevant law and other restrictions. Restricted funds remain classified as restricted until they are expended.
Income taxes – The University, as a political subdivision of the State of Montana, is excluded from Federal income taxes under Section 115(1) of the Internal Revenue Code, as amended. Certain activities of the University may be subject to taxation as unrelated business income under Internal Revenue Code Sections 511 to 514. Because tax
A-26

Montana State University(a component unit of the State of Montana)Notes to Consolidated Financial StatementsAs of and for Each of the Years Ended June 30 (continued)
liabilities are not considered to be material, no provision for income tax expense is reported in the accompanying financial statements.
Scholarship discounts and allowances – Student tuition and fee revenues, and certain other revenues from students, are reported net of scholarship discounts and allowances in the statement of revenues, expenses, and changes in net position.Scholarship discounts and allowances are computed as the difference between the stated charge for goods and services provided by the University, and the amount that is paid by students and/or third parties making payments on the students’ behalf. Certain governmental grants are recorded as operating revenues in the University’s financial statements. To the extent that revenues from such programs are used to satisfy tuition and fees and other student charges, the University has recorded a scholarship discount and allowance.
Accounting Standards Recently Adopted – During the year ended June 30, 2014, the University adopted the provisions of GASB Statement No. 65, Items Previously Reported as Assets and Liabilities. GASB No. 65 establishes accounting and financial reporting standards that reclassify, as deferred outflows of resources or deferred inflows of resources, certain items that were previously reported as assets and liabilities. The University’s implementation of GASB No. 65 required debt issuance costs to be expensed. The University recorded approximately $0.8 million in professional services expense during fiscal 2014 year for debt issuance costs which had been previously capitalized, as it was not deemed an amount significant enough to warrant restating prior periods.
Implementation of GASB 65 also resulted in reclassifying the University’s deferred loss on debt refunding balances from an offset to long-term debt into a deferred outflow. The deferred loss on debt refunding is the excess of the reacquisition price of refunded debt over its net carrying amount. The deferred loss on refunding balances that were reclassified were related to Series 2004I, Series 2006K, Series 2008L, Series 2012N and Series 2012O. Deferred loss on debt refunding is further described in note 11.
Accounting standards not yet implemented – Management is currently evaluating the effect of recently-issued accounting pronouncements. In particular, Statement No. 68, Accounting and Financial Reporting for Pensions—an amendment of GASB Statement No. 27, is expected to have a significant impact upon adoption.
NOTE 2 –CASH DEPOSITS, CASH EQUIVALENTS AND INVESTMENTS
Cash deposits –The University must comply with State statutes, which generally require that cash and investmentsremain on deposit with the State treasury, and as such are subject to the State’s investment policies. Certain exceptions exist, which allow funds to be placed on deposit with trustees to satisfy bond covenants or to maximize investment earnings through placing certain funds with recognized University foundations. Deposits with the State treasury and other financial institutions totaled $121,740,862 at June 30, 2014 and $107,773,030 at June 30, 2013.
Cash equivalents – These amounts consist of cash held by trustees as well as $50,896,319 and $64,608,043 of the amount invested in the Short Term Investment Pool (STIP) with the Montana Board of Investments at June 30, 2014and 2013, respectively.
STIP participants include both state agencies and local governments. By meeting certain conditions, STIP, as a 2a7-like pool, is allowed to use amortized cost or book value rather than fair value to report net assets to compute unit values. As described in the notes to the Montana Board of Investments Consolidated Unified Investment Program Financial Statements, investments must have a maximum maturity of 397 or fewer days unless they have reset dates.
Investments – These amounts consist of U.S. Government Securities, amounts invested in the Montana Board of Investments Trust Fund Investment Pool (TFIP), certain funds invested in the Montana Board of Investments STIP, funds held in common investment pools administered by the MSU-Bozeman and MSU- Northern Foundations, as well as other funds held with trustees and the market value of the University’s non-hedging derivative financial instrument.Except for funds held in the Montana Board of Investments STIP, as discussed above, investments are recorded at fair
A-27

Montana State University(a component unit of the State of Montana)Notes to Consolidated Financial StatementsAs of and for Each of the Years Ended June 30 (continued)
value. The MSU Bozeman Foundation’s investment pool totals $166,300,216, of which the University owns $8,857,554or 5.3%. Foundation investment pools are not subject to regulatory oversight.
Endowment spending policy – The State of Montana has adopted the Uniform Prudent Management of Institutional Funds Act (UPMIFA), including the provision that the appropriation for expenditure of an amount greater than 7% of the fair market value of an endowment fund (calculated on the basis of market values averaged over a period of not less than three preceding years) creates a rebuttable presumption of imprudence. A majority of the University’s endowment funds are managed by the MSU Bozeman Foundation, in accord with their spending policy, which conforms to UPMIFA.
Securities lending transactions –The Board of Investments (BOI) is authorized by law to lend its securities, and has contracted with its custodial bank, State Street Bank, to lend the BOI’s securities to broker-dealers and other entities. The custodial bank is required to maintain collateral equal to 102% of the fair value of domestic securities and 105%of the fair value of international securities while the securities are on loan. The BOI and the bank split the earnings80% and 20% respectively on security lending activities. The University’s allocated portion of security lending cash collateral was $849,459 at June 30, 2014 and $1,141,800 at June 30, 2013.
The BOI did not impose any restrictions during fiscal years 2014 and 2013 on the amount of the loans State Street Bank made on its behalf. There were no failures by any borrowers to return loaned securities or pay distributions thereon during fiscal years 2014 and 2013. Moreover, there were no losses during fiscal years 2014 and 2013resulting from a default of the borrowers or State Street Bank and Trust.
During fiscal years 2014 and 2013, the BOI and the borrowers maintained the right to terminate all securities lending transactions on notice. The cash collateral received for each loan was invested, together with the cash collateral of other qualified plan lenders, in a collective investment fund comprised of a liquidity pool and a duration pool. As of June 30, 2014, the Quality D Short Term Investment Fund liquidity pool had an average duration of 37days and an average weighted final maturity of 104 days for U.S. dollar collateral. The duration pool had an average duration of 42 days and an average weighted final maturity of 1,770 days for U.S. dollar collateral. As of June 30, 2013, the Quality D Short Term Investment Fund liquidity pool had an average duration of 29 days and an average weighted final maturity of 85 days for U.S. dollar collateral. The duration pool had an average duration of 44 days and an average weighted final maturity of 1,972 days for U.S. dollar collateral. Because the securities lending transactions were terminable at will, their duration did not generally match the duration of the investments made with the cash collateral received from the borrower. As of June 30, 2014 the BOI had no credit risk exposure to borrowers. The private equity and real estate pools do not participate in securities lending.
Investment risks – The University’s investments are concentrated primarily with the State of Montana; therefore, discussion of the risks of the applicable State investment products is summarized below. Detailed asset maturity and other information demonstrating risk associated with the BOI STIP and TFIP is contained in the BOI financial statements, and may be accessed by contacting the Board of Investments at P.O. Box 200126, Helena, MT 59620-0126. Investment risks are described in the following paragraphs. Risks specific to derivative financial instruments are discussed in Note 10.
Credit Risk – Credit risk is defined as the risk that an issuer or other counterparty to an investment will not fulfill its obligation. With the exception of the U.S. government securities, all TFIP fixed income instruments have credit risk as measured by major credit rating services.
Custodial Credit Risk – Custodial credit risk for investments is the risk that, in the event of the failure of the counterparty to a transaction, a government will not be able to recover the value of the investment or collateral securities that are in the possession of an outside party. The securities in the State of Montana Short Term Investment Pool and the State of Montana Trust Fund Investment Pool are held in name of the BOI or were registered in the nominee name for the BOI and held in possession of the BOI custodial bank.
A-28
Montana State University(a component unit of the State of Montana)Notes to Consolidated Financial StatementsAs of and for Each of the Years Ended June 30 (continued)
Concentration of Credit Risk – Concentration of credit risk is the risk of loss attributed to the magnitude of anentity’s investment in a single issuer. Because the University is limited to investing in certain funds and with certain entities by state statute, it does not maintain its own credit risk policy.
Interest Rate Risk – Interest rate risk is the risk that changes in interest rates will adversely affect the fair value of an investment. According to GASB Statement No. 40, interest rate disclosures are not required for STIP since STIP is a 2a-7-like pool. The TFIP investment policy does not formally address interest rate risk.
The State of Montana has selected the effective duration method to disclose interest rate risk. The University’s investments are categorized below to disclose interest rate and credit risk as of June 30, 2014. Credit risk reflects the security quality rating, by investment security type, as of the report date. Interest rate risk is disclosed using effective duration. If a security investment type is unrated, the quality type is indicated by NR. Although STIP and TFIPinvestments have been rated by investment security type, neither has been rated by an NRSRO.
Land grant earnings – The University benefits from two separate land grants which total 240,000 acres. The first granted 90,000 acres for the University under provisions of the Morrill Act of 1862. The second, under the Enabling Act of 1889, granted an additional 50,000 acres for agricultural institutions and 100,000 acres for state normal schools.
Under provisions of both grants, income from the sale of land and land assets must be reinvested and constitutes, along with the balance of the unsold land, a perpetual endowment fund. The State of Montana, Board of Land Commissioners, administers both grants and holds all endowed assets. The University’s land grant assets are not reflected in these financial statements, but are included as a component of the State of Montana Basic Financial Statements that are prepared annually and presented in the Montana Comprehensive Annual Financial Report.
Investment income from the perpetual endowment is distributed periodically to the University by the State of Montana, Board of Land Commissioners, and is reported as revenue in the accompanying financial statements. The University has currently pledged such income to the retirement of revenue bond indebtedness; after satisfying the liens of the indenture, the University may expend the funds for any lawful purpose.
In addition to distributed endowment income, the University also receives revenue generated from trust land timber sales. The University has the flexibility to designate timber sales revenues as either distributable or for reinvestment, should it choose to expend the funds for certain specified purposes.
Cash equivalents and investments are categorized as follows at June 30, 2014:
Security Type Fair Value
Moody’s Credit Quality Rating
Effective Duration(years)
State of Montana Short Term Investment Pool $ 51,460,417 NR*** N/AU. S. Bank Money Market Funds (collateralized by
U.S. Bank pool, not in the University’s name)6,587,769 P-1 N/A
State of Montana Trust Fund Investment Pool* 15,985,966 NR*** 5.13Foundation Pooled Cash Equivalents and Investments**
7,422,177 NR*** N/A**
Non-hedging derivative investment value 1,556,177 Baa2 21.42Guaranteed Investment Contract 53,548,232 A2 1.16
* TFIP and Foundation investments are intended to be permanent investments.** The Foundation investment pool is not considered a debt pool, and as such, a duration calculation is not applicable.*** Not rated
A-29

Montana State University(a component unit of the State of Montana)Notes to Consolidated Financial StatementsAs of and for Each of the Years Ended June 30 (continued)
NOTE 3 – ACCOUNTS AND GRANTS RECEIVABLE
Accounts receivable consisted of the following as of June 30:2014 2013
Accounts receivable $ 10,104,936 $ 9,774,446Other receivables, including private grants and contracts 3,616,729 3,104,564
Gross accounts and grants receivable 13,721,665 12,879,010Less allowance for uncollectible accounts (4,141,663) (3,662,012)
Net accounts and grants receivable $ 9,580,002 $ 9,216,998
NOTE 4 – INVENTORIESInventories consisted of the following as of June 30:
2014 2013Bookstore $ 1,263,738 $ 1,006,907Food services 252,097 280,237Facilities services 700,905 671,468Livestock 907,995 622,408Other 394,887 337,297
Total inventories $ 3,519,622 $ 2,918,317
NOTE 5 – PREPAID EXPENSES AND OTHER CURRENT ASSETSPrepaid expenses consisted of the following as of June 30:
2014 2013Library subscriptions $ 2,298,209 $ 1,583,758Other (including summer session payments) 2,112,476 1,197,497
Total prepaid expenses $ 4,410,685 $ 2,781,255
NOTE 6 – LOANS RECEIVABLE
Student loans made under the Federal Perkins Loan Program constitute the majority of the University’s loan balances. Included in noncurrent liabilities as of June 30, 2014 and 2013 are $22,774,457 and $22,593,240 that would be repayable to the Federal government, should the University choose to cease participation in the Federal Perkins Loan program.
The Federal portions of interest income and loan program expenses are shown as additions to and deductions from the amount due to the Federal government, and not as operating transactions, in the accompanying financial statements.
A-30
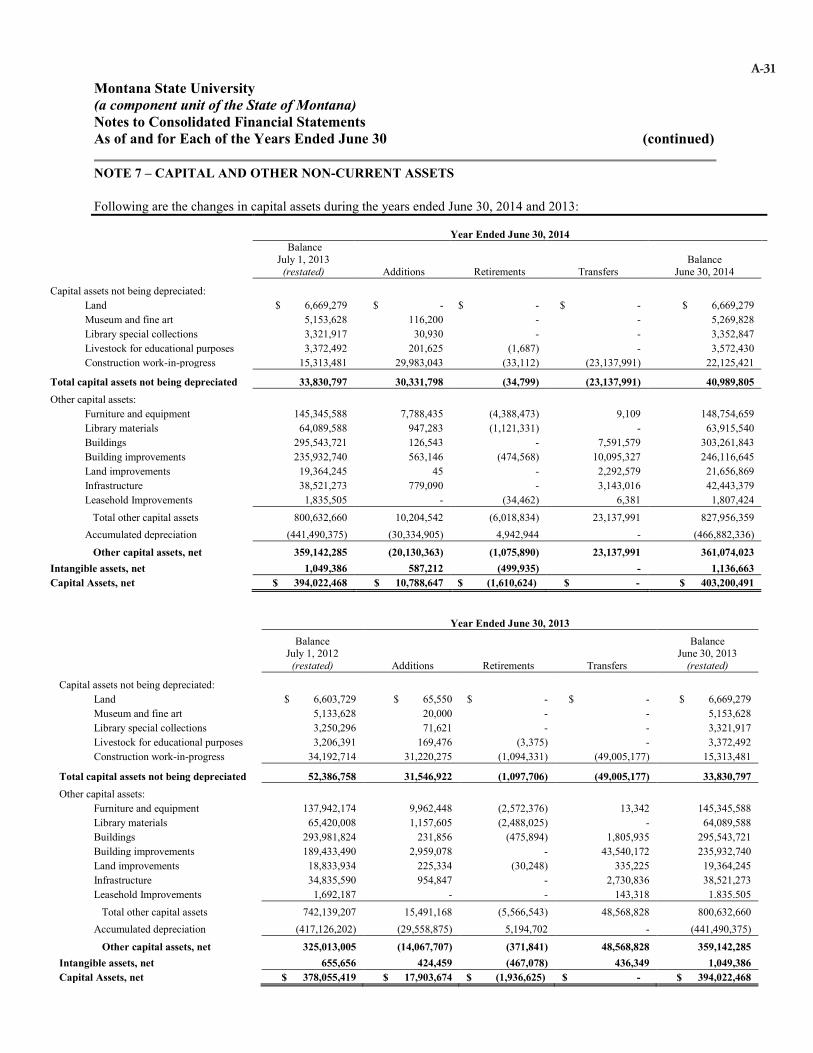
Montana State University(a component unit of the State of Montana)Notes to Consolidated Financial StatementsAs of and for Each of the Years Ended June 30 (continued)
NOTE 7 – CAPITAL AND OTHER NON-CURRENT ASSETS
Following are the changes in capital assets during the years ended June 30, 2014 and 2013:
Year Ended June 30, 2014Balance
July 1, 2013(restated) Additions Retirements Transfers
Balance June 30, 2014
Capital assets not being depreciated: Land $ 6,669,279 $ - $ - $ - $ 6,669,279 Museum and fine art 5,153,628 116,200 - - 5,269,828 Library special collections 3,321,917 30,930 - - 3,352,847 Livestock for educational purposes 3,372,492 201,625 (1,687) - 3,572,430 Construction work-in-progress 15,313,481 29,983,043 (33,112) (23,137,991) 22,125,421
Total capital assets not being depreciated 33,830,797 30,331,798 (34,799) (23,137,991) 40,989,805Other capital assets:
Furniture and equipment 145,345,588 7,788,435 (4,388,473) 9,109 148,754,659 Library materials 64,089,588 947,283 (1,121,331) - 63,915,540 Buildings 295,543,721 126,543 - 7,591,579 303,261,843 Building improvements 235,932,740 563,146 (474,568) 10,095,327 246,116,645 Land improvements 19,364,245 45 - 2,292,579 21,656,869 Infrastructure 38,521,273 779,090 - 3,143,016 42,443,379 Leasehold Improvements 1,835,505 - (34,462) 6,381 1,807,424
Total other capital assets 800,632,660 10,204,542 (6,018,834) 23,137,991 827,956,359 Accumulated depreciation (441,490,375) (30,334,905) 4,942,944 - (466,882,336)
Other capital assets, net 359,142,285 (20,130,363) (1,075,890) 23,137,991 361,074,023Intangible assets, net 1,049,386 587,212 (499,935) - 1,136,663Capital Assets, net $ 394,022,468 $ 10,788,647 $ (1,610,624) $ - $ 403,200,491
Year Ended June 30, 2013
Balance July 1, 2012
(restated) Additions Retirements Transfers
Balance June 30, 2013
(restated)
Capital assets not being depreciated: Land $ 6,603,729 $ 65,550 $ - $ - $ 6,669,279 Museum and fine art 5,133,628 20,000 - - 5,153,628 Library special collections 3,250,296 71,621 - - 3,321,917 Livestock for educational purposes 3,206,391 169,476 (3,375) - 3,372,492 Construction work-in-progress 34,192,714 31,220,275 (1,094,331) (49,005,177) 15,313,481
Total capital assets not being depreciated 52,386,758 31,546,922 (1,097,706) (49,005,177) 33,830,797Other capital assets:
Furniture and equipment 137,942,174 9,962,448 (2,572,376) 13,342 145,345,588 Library materials 65,420,008 1,157,605 (2,488,025) - 64,089,588 Buildings 293,981,824 231,856 (475,894) 1,805,935 295,543,721 Building improvements 189,433,490 2,959,078 - 43,540,172 235,932,740 Land improvements 18,833,934 225,334 (30,248) 335,225 19,364,245 Infrastructure 34,835,590 954,847 - 2,730,836 38,521,273 Leasehold Improvements 1,692,187 - - 143,318 1.835.505
Total other capital assets 742,139,207 15,491,168 (5,566,543) 48,568,828 800,632,660 Accumulated depreciation (417,126,202) (29,558,875) 5,194,702 - (441,490,375)
Other capital assets, net 325,013,005 (14,067,707) (371,841) 48,568,828 359,142,285Intangible assets, net 655,656 424,459 (467,078) 436,349 1,049,386Capital Assets, net $ 378,055,419 $ 17,903,674 $ (1,936,625) $ - $ 394,022,468
A-31

Montana State University(a component unit of the State of Montana)Notes to Consolidated Financial StatementsAs of and for Each of the Years Ended June 30 (continued)
Historical records are not available for certain of the University’s assets. As such, some values have been estimated based on insurance values, industry-accepted valuation techniques, or estimates made by University personnel knowledgeable as to the assets’ values. Livestock held for educational purposes consist primarily of cattle herds. Breeding cattle are routinely replaced in the herds by their offspring; additions and deductions from the asset cost are not reported for reproducing cattle replaced in this manner.
Other non-current assets –
During the year ended June 30, 2014, the MSU Alumni Foundation committed to a $10 million gift, which will be paid to the University as needed to repay principal on its Series B debt. The gift is recorded in the accompanying financial statements as $0.5 million in current receivables, and $9.5 million in long-term assets. The Series B debt was issued to bridge fund construction of a classroom building until gift proceeds are received.
NOTE 8 – ACCOUNTS PAYABLE AND ACCRUED LIABILITIES
Accounts payable and accrued liabilities consisted of the following as of June 30:
2014 2013Compensation, benefits and related liabilities $ 21,628,304 $ 18,865,589Accrued interest expense 795,959 557,721Accounts payable and other accrued liabilities 13,724,624 15,796,164
Total $ 36,148,887 $ 35,219,474
NOTE 9 – UNEARNED REVENUES
Unearned revenues consisted of the following as of June 30:2014 2013
Grant and contract funds received in advance $ 3,103,104 $ 2,918,358Summer session payments received in advance 5,728,489 5,941,945Other unearned revenues 1,438,713 1,317,416
Total $ 10,270,306 $ 10,177,719
A-32

Montana State University(a component unit of the State of Montana)Notes to Consolidated Financial StatementsAs of and for Each of the Years Ended June 30 (continued)
NOTE 10 – NON-CURRENT LIABILITIES AND DERIVATIVE INSTRUMENTS
Following are the changes in noncurrent liabilities for the years ended June 30, 2014 and 2013:
Year Ended June 30, 2014
BalanceJuly 1, 2013
(restated) Additions Reductions Balance
June 30, 2014
Amountsdue withinone year
Bonds, notes payable, and capital lease obligations
Bonds payable, net of discount $ 115,623,105 $ 68,384,052 $ (6,596,013) $ 177,411,144 $ 7,115,000 Notes and other long-term liabilities 1,803,974 379,250 (380,030) 1,803,194 325,500Capital lease obligations 351,845 137,038 (160,894) 327,989 120,376
Total bonds, notes and capital leaseobligations $ 117,778,924 $ 68,900,340 $ (7,136,937) $ 179,542,327 $ 7,560,876
Compensated absence liability $ 29,517,828 $ 16,788,761 $ (15,714,683) $ 30,591,906 $ 16,784,864 Advances from primary government – Intercap $ 14,588,566 $ 494,560 $ (2,150,295) $ 12,932,831 $ 1,716,765 Advances from primary government - MSTA $ 4,974,180 $ - $ (55,775) $ 4,918,405 $ 57,168
Advances from primary government - DEQ $ 5,934,189 $ - $ (497,784) $ 5,436,405 $ 462,857
Amounts due to Federal government $ 22,593,240 $ 195,717 $ (14,500) $ 22,774,457 $ -OPEB liability— implicit rate subsidy for retiree health insurance $ 46,831,891 $ 5,430,244 $ (862,890) $ 51,399,245 $ -Derivative instrument liability $ 4,389,311 $ - $ (354,721) $ 4,034,590 $ -
Year Ended June 30, 2013
BalanceJuly 1, 2012
(restated) Additions Reductions
BalanceJune 30, 2013
(restated)
Amountsdue withinone year
Bonds, notes payable, and capital lease obligations
Bonds payable, net of discount $ 118,066,439 $ 49,860,994 $ (52,304,328) $ 115,623,105 $ 6,285,000Notes and other long-term liabilities 1,980,781 62,650 (239,457) 1,803,974 279,535Capital lease obligations 30,890 342,936 (21,981) 351,845 112,056
Total bonds, notes and capital lease obligations $ 120,078,110 $ 50,266,580 $ (52,565,766) $ 117,778,924 $ 6,676,591
Compensated absence liability $ 27,888,492 $ 15,674,209 $ (14,044,873) $ 29,517,828 $ 15,512,992 Advances from primary government – Intercap $ 9,973,193 $ 5,904,993 $ (1,289,620) $ 14,588,566 $ 1,707,373 Advances from primary government - MSTA $ 5,028,596 $ - $ (54,416) $ 4,974,180 $ 55,775
Advances from primary government - DEQ $ 6,358,707 $ - $ (424,518) $ 5,934,189 $ 497,784
Amounts due to Federal government $ 22,480,430 $ 141,568 $ (28,758) $ 22,593,240 $ -OPEB liability— implicit rate subsidy for retiree health insurance (restated) $ 40,467,803 $ 6,838,811 $ (474,723) $ 46,831,891 $ -Derivative instrument liability $ 6,496,633 $ (2,107,322) $ - $ 4,389,311 $ -
Amounts not due within one year are reflected in the noncurrent liabilities section of the accompanying Statement of Net Position.
A-33

Montana State University(a component unit of the State of Montana)Notes to Consolidated Financial StatementsAs of and for Each of the Years Ended June 30 (continued)
Derivative financial instruments –
DescriptionThe University has two interest rate swaps as of June 30, 2014. Interest rate swaps are classified as hedging derivative instruments if the instruments meet the criteria of paragraphs 27 (a) and (b) of Governmental Accounting Standards Board Statement Number 53, or as investment derivative instruments if they do not.
The following table summarizes the interest rate swaps outstanding as of June 30, 2014:
Derivative Description Trade DateEffective
DateTermination
Date Terms Counterparty$25.75 million fixed payer swap 3/10/2005 7/21/2005 11/15/2035* Pay 3.953%, Receive SIFMA Deutsche Bank AG$25.25 million basis swap 12/19/2006 11/15/2007 11/15/2035 Pay SIFMA, Receive 86.8%
of 10-year SIFMAMorgan Stanley Capital Services Inc.
*Counterparty may opt out in 2016
As of June 30, 2014, the fixed payer swap is classified as a hedging derivative instrument under Statement No. 53, whereas the basis swap is an investment derivative instrument because there is no identified financial risk being hedged by the basis swap that can be expressed in terms of exposure to adverse changes in cash flows or fair values. Statement No. 53 includes four methods for evaluating hedge effectiveness; a governmental entity may use any of the evaluation methods outlined in the Statement and is not limited to using the same method from period to period. The four methods described in Statement No. 53 are: consistent critical terms, synthetic instrument, dollar-offset, and regression analysis. In addition, Statement No. 53 permits a governmental entity to use other quantitative methods that are based on “established principles of financial economic theory.” The fixed payer swap passes the established criteria using the regression analysis methodology.
The fair values of the interest rate swaps were estimated using the zero-coupon method. This method calculates the future net settlement payments required by the swap, assuming that the current forward rates implied by the yield curve correctly anticipate future spot interest rates. These payments are then discounted using the spot rates implied by the current yield curve for hypothetical zero-coupon bonds due on the date of each future net settlement on the swaps. The time value is equal to the option value minus the intrinsic value. The option value was estimated using a trinomial option pricing model. Incorporating market volatility data, the trinomial model calculates all possible changes in the value of the underlying swap for each future cash flow period (up, down or unchanged) to form a trinomial tree. This tree is used to calculate the current value of the option.
On September 10, 2010, the Series J bonds were converted to index bonds. While in index mode the interest rate is reset weekly at a rate of the Securities Industry and Financial Markets Association (“SIFMA”) rate plus a fixed spread. The spread is based on the long-term, unenhanced rating assigned to the issuer; the current spread as of June 30 was 0.65%. The dependent variable in the regression is the interest rates of the hedged cash flows; the independent variable is the floating rates due under the hedging derivative. The counterparty to the fixed payer swap has the right to terminate the swap at $0 on December 14, 2016 (a European option). Upon entering into the transaction, the University received consideration from the counterparty in the form of an off-market (lower) fixed swap rate. A portion of the consideration received was a result of the option being in-the-money at inception; that is, the option had intrinsic value as the cancelable swap’s fixed rate of 3.953% was lower than the at-market rate of 4.110% on the trade date. The remainder of the up-front consideration reflects the time value the counterparty pays for holding the option. To the University, the time value portion represents future investment revenue. The intrinsic value of the cancelable swap is considered a loan receivable for financial reporting purposes and is treated as an asset in the accompanying financial statements. Interest accrues to the balance of the asset each year and amortizes with each swap payment.
A-34

Montana State University(a component unit of the State of Montana)Notes to Consolidated Financial StatementsAs of and for Each of the Years Ended June 30 (continued)
The table below summarizes the reported balances as of and the derivative instrument activity during the years ended June 30, 2014 and 2013.
Activity During 2014 Fair Value as of June 30, 2014
Type of derivative Notional Classification Amount Classification Amount
Cash flow hedge -Pay fixed interest
rate swap$ 22,475,000 Interest expense $ 20,145 Loan receivable $ 306,860
Investment income $ 338,749Deferred outflow
increase/(decrease) $ (15,972)Derivative liability $ 4,034,590
Investment derivative -
Basis swap $ 22,475,000 Investment loss $ 339,870 Investment (excluding interestaccrued) $ 1,556,177
Activity During 2013 Fair Value as of June 30, 2013
Type of derivative Notional Classification Amount Classification Amount
Cash flow hedge -Pay fixed interest
rate swap$ 23,025,000 Interest expense $ 18,211 Loan receivable $ 327,005
Investment loss $ 94,850Deferred outflow
increase/(decrease) $ (2,202,172)Derivative liability $ 4,389,311
Investment derivative -
Basis swap $ 23,025,000 Investment loss $ 332,777 Investment (excluding interestaccrued) $ 1,899,836
The objective and terms of the University’s hedging derivative outstanding as of June 30, 2014 is as follows:
Type ObjectiveNotional amount
Effective Date
Termination Date
Cash (Paid)/
Received TermsPay fixed, cancelable interest rate swap
Hedge interest rate risk on Series J 2005 Bonds
$22,475,000 7/21/2005 11/15/2035 - Pay 3.953%Receive SIFMA
Credit Risk It is the University’s policy to enter into derivative agreements with highly rated counterparties. As of June 30, 2014, counterparty ratings were A2 and Baa1 by Moody’s and A+ and A- by Standard and Poor’s. The University manages credit risk by requiring its counterparties to post collateral in certain events. The University is entitled to collateral from its fixed payer swap counterparty if the interest rate swap’s fair value is greater than $5MM and thecounterparty is rated A+ or A, by S&P, or A1 or A2 by Moody’s. If the counterparty to the fixed payer swap is rated A- or below, by S&P, or A3 or below by Moody’s, the University is entitled to collateral up to 100% of the swap’s fair value. The University is not required to post collateral. The University will continue to monitor counterparty credit risk.
The University enters into derivative agreements with multiple counterparties to limit concentration of credit risk. Currently, the University has interest rate swaps with two different counterparties and each counterparty accounts for approximately 50% of outstanding notional. The University monitors counterparty credit risk on an ongoing basis.
A-35

Montana State University(a component unit of the State of Montana)Notes to Consolidated Financial StatementsAs of and for Each of the Years Ended June 30 (continued)
Interest Rate Risk Interest payments on variable rate debt will typically increase as interest rates increase. The University believes it has significantly reduced interest rate risk by entering into a pay-fixed, receive floating interest rate swap. As interest rates increase, net swap payments decrease so that changes in hedged variable-rate debt interest payments,attributable to SIFMA, are largely offset by the net swap payments.
Basis RiskThe variable-rate cash flows being hedged by the pay-fixed swap will increase or decrease as SIFMA rates increase or decrease. Because the hedged cash flows are SIFMA based and the floating receipts of the pay-fixed swap are SIFMA based, there is no basis risk.
Termination RiskThe University or its counterparties may terminate a derivative instrument if the other party fails to perform under the terms of the contract. In addition, the University’s fixed payer swap counterparty has the right to terminate the derivative if the credit rating of the University’s unenhanced long-term revenue bond rating is withdrawn, suspended or reduced below BBB-, in the case of S&P, or below Baa3 in the case of Moody’s. If such an event occurs, the University could be forced to terminate the fixed payer swap in a liability position. As of June 30, 2014, the University’s unenhanced long-term revenue bond rating was Aa3 by Moody’s and A+ by Standard and Poor’s.
Rollover RiskThe University’s hedging derivative includes a cancelation option which allows the counterparty to cancel the swap on 12/14/16. Should the counterparty exercise its option, the University would be exposed to rollover risk as exercise would only be likely in a rate environment higher than that at the time the trade was originally entered into.
Foreign Currency RiskAll hedging derivatives are denominated in US Dollars and therefore the University is not exposed to foreign currency risk.
Market Access RiskMarket access risk is the risk that the University will not be able to enter credit markets or that credit will become more costly. For example, to complete a derivative instrument’s objective, an issuance of refunding bonds may be planned in the future. If at that time the University is unable to enter credit market, expected cost savings may not be realized.
NOTE 11 – BONDS, NOTES, ADVANCES PAYABLE AND DEFERRED LOSS ON DEBT REFUNDING
Revenue bond principal outstanding was as follows as of June 30:
Coupon rate 2014 2013Series 2004H 5.50% $ 600,000 $ 1,165,000Series 2004I 3.625% 760,000 1,485,000Series 2005J 0.71% * 22,475,000 23,025,000Series 2006K 4.00% – 4.50% 10,565,000 11,185,000Series 2008L 3.75% – 5.00% 10,415,000 13,630,000Series 2011M 2.00% – 5.00% 14,025,000 14,100,000Series 2012N 2.00% – 4.00% 20,385,000 20,460,000Series 2012O 0.886%–3.09% 27,905,000 28,365,000Series 2013A 2.00% – 5.00% 55,480,000 -Series 2014B 0.71%* 10,000,000 -Total principal outstanding $ 172,610,000 $ 113,415,000
* The interest rate on the Series J and Series B debt is variable, and adjusted weekly
A-36

Montana State University(a component unit of the State of Montana)Notes to Consolidated Financial StatementsAs of and for Each of the Years Ended June 30 (continued)
Revenue bonds are payable as follows:
During the year ending June 30, Principal Interest Net Hedging
Derivative Interest Total 2015 $ 7,115,000 $ 5,550,673 $ 861,921 $ 13,527,5942016 7,270,000 5,330,377 837,091 13,437,4682017 8,620,000 5,106,176 811,320 14,537,4962018 8,775,000 4,888,132 784,061 14,447,1932019 16,590,000 4,652,421 755,853 21,998,2742020-2024 39,235,000 19,194,863 3,304,864 61,734,7272025-2029 29,465,000 13,155,083 2,387,249 45,007,3322030-2034 22,635,000 9,034,465 1,244,853 32,914,3182035-2039 16,960,000 5,472,779 - 22,432,7792040-2044 15,945,000 2,072,624 - 18,017,624Total cash requirements 172,610,000 $ 74,457,593 $ 10,987,212 $ 258,054,805
Unamortized premium (discount) net 4,801,144Bond payable, net $ 177,411,144
Description of bonded indebtedness–
Series A 2013, December 31, 2013– In December 2013, the University issued $55,480,000 in Series A 2013Facilities Improvement Revenue Bonds to fund the construction of a new 400-bed residence hall on the Bozeman campus, as well as renovate and expand three existing dining halls and fund major and deferred maintenance projects in various residence halls. Payments are scheduled each May and November through November, 2043. The bonds are secured by a first lien on and pledge of the net pledged revenues, as described in Note 17.
Series B 2014, January 31, 2014– In January 2014, the University issued $10,000,000 in Series B 2014 Facilities Improvement Revenue Bonds to fund the construction of a new academic building on the Bozeman campus. The bonds were a direct placement with Wells Fargo Bank. The bonds contain an index rate mode whereby the interest rate is reset periodically at SIFMA plus an applicable spread based on the term of the rate period. Payments are scheduled each January and will amortize over a 5-year term at the greater of: 1) a minimum of $500,000 per year, or 2) 85% of pledge receipts, so long as there is no more than $8,000,000 outstanding at the time the index floating rate mode matures. The bonds are secured by a first lien on and pledge of the net pledged revenues, as described in Note 17.
Series H 2004, October 14, 2004 – The Series H bonds were refunded in October 2012 upon issuance of the Series N 2012 bonds. Principal remaining for the Series H 2004 bonds as of June 30, 2014 was $600,000. The Series H bonds will be fully defeased in November 2014.
Series I 2004, November 23, 2004 – The Series I bonds were refunded in October 2012 upon issuance of the Series O 2012 bonds. Principal remaining for the Series I 2004 bonds as of June 30, 2014 was $760,000. The Series I bonds will be fully defeased in November 2014.
Series J 2005, July 21, 2005 – In July 2005, the University issued $25,750,000 of Series J 2005 Auction RateFacilities Improvement Revenue Bonds to fund the majority of a student facilities enhancement project on the Bozeman campus. The proceeds, together with University funds, were used to renovate the student fitness center, construct a theater, and renovate portions of the Strand Union Building. The bonds are being repaid with a combination of student fees and auxiliary operations revenues. Principal payments continue each May and November through November, 2035. On September 11, 2008, the University remarketed these bonds as Variable Rate Demand Bonds in the daily mode, whereas they had previously been marketed as Municipal Auction Rate
A-37

Montana State University(a component unit of the State of Montana)Notes to Consolidated Financial StatementsAs of and for Each of the Years Ended June 30 (continued)
Securities in the weekly mode. The bonds were remarketed without bond insurance, because variable rate instruments backed by a direct-pay letter of credit were trading at more attractive rates from the bond issuer’sperspective, which is a result of the insurer’s downgrading and general market conditions. The bonds are no longer insured by Ambac; instead, the University entered into a Letter of Credit and Reimbursement Agreement with Wachovia Bank, NA (“Wachovia”), for a term of two years, in which Wachovia assumed a direct-pay responsibility for the bonds. Wachovia Bank was subsequently purchased by Wells Fargo. Because the letter of credit was scheduled to terminate in September of 2010, the University sought pricing on a renewed letter of credit as well as a direct-placement transaction. After reviewing several options, the University selected the direct-placement transaction, and on September 10, 2010, amended its bond indenture to permit issuance of the Series J bonds in the indexed floater mode, re-issuing the bonds in whole to Wells Fargo Bank. In place of a letter of credit fee, the University now pays Wells Fargo Bank a pre-determined basis point spread over and above the SIFMA weekly indexed rate. Principal payment amounts and dates remained the same as they were prior to the remarketing.In September 2013, the University entered into a 5-year renewal of its direct purchase agreement with Wells Fargo Bank relative to its Series J 2005 bonds, at a rate of 0.65% above SIFMA.
Series K 2006, July 26, 2006 – In July 2006, the University issued its Series K refunding debt in the principal amount of $13.71 million. The proceeds were used to refund portions of the Series E 1998 and Series D 1996 debt, and resulted in an economic gain to the University of $704,468. The proceeds of the Series K 2006 bonds were used to acquire United States Government Obligations, the maturing principal and interest on which are calculated to be sufficient to pay, when due, at maturity or upon redemption, the principal of and interest on the $7,315,000 Series D 1996 bonds maturing on and after November 15, 2007 (which were redeemed at par on November 15, 2006), and to pay, when due, at maturity or upon redemption, the principal of and interest on the $5,840,000 Series E 1998 bonds that were refunded. The refunded Series D 1996 bonds and Series E 1998 bonds are no longer considered to be outstanding under the Indenture.
Series L 2008, June 26, 2008 – In June 2008, the University refunded its Series G 2003 Auction Rate Bonds through the issuance of fixed rate Series L 2008 bonds in the amount of $17.59 million. Series L bond proceeds were sufficient to legally defease the Series 2003 G bonds. The Series L debt will be repaid by November of 2016, the same maturity date as the refunded Series G debt. Repayment is guaranteed by Assured Guaranty. The Series Gbonds were called in July, 2008 and are no longer outstanding. The original proceeds of the refunded debt had been used for a $16,745,000 current refunding of the serial portion of the Series 1993-A bonds, and $2,015,000 had been used for an advance refunding of the Series 1994 C bonds.
Series M 2011, October 26, 2011– In October 2011, the University issued $14,100,000 in Series M 2011 Facilities Improvement Revenue Bonds to fund the construction of a new suite-style residence hall on the Bozeman campus,as well as renovate public spaces in two existing residence halls and perform energy efficiency improvements including window and lighting fixture replacement. Payments are scheduled each May and November through November, 2027. The bonds are secured by a first lien on and pledge of the net pledged revenues, as described in Note 17.
Series N 2012, October 17, 2012 – In October 2012, the University issued its Series N refunding debt in the principal amount of $20.5 million. The proceeds were used to refund the Series H 2004 Facilities Improvement Revenue Bonds with stated maturities in the year 2015 and thereafter. The refunding resulted in an economic gain to the University of $2.2 million. The proceeds of the Series N 2012 bonds were used to acquire direct general obligations, the maturing principal and interest on which are calculated to be sufficient to pay, when due, at maturity or upon redemption, the principal of and interest on the $19.6 million Series H 2004 bonds with maturities in the year 2015 and thereafter. The refunded Series H 2004 bonds are no longer considered to be outstanding under the Indenture. The portion of the Series H bonds that were not refunded totals $1.2 million. This portion matures in the year 2015 and will be retired in accordance with the original repayment schedule.
Series O 2012, October 17, 2012 – In October 2012, the University issued its Series O 2012 refunding debt in the principal amount of $28.4 million. The proceeds were used to refund the Series I 2004 Facilities Revenue Refunding Bonds with stated maturities in the year 2015 and thereafter. The refunding resulted in an economic gain to the
A-38

Montana State University(a component unit of the State of Montana)Notes to Consolidated Financial StatementsAs of and for Each of the Years Ended June 30 (continued)
University of $1.6 million. The proceeds of the Series O 2012 bonds were used to acquire direct general obligations, the maturing principal and interest on which are calculated to be sufficient to pay, when due, at maturity or upon redemption, the principal of and interest on the $25.8 million Series I 2004 bonds with maturities in the year 2015 and thereafter. The refunded Series I 2004 bonds are no longer considered to be outstanding under the Indenture. The portion of the Series I bonds that were not refunded totals $1.5 million. This portion matures in the year 2015and will be retired in accordance with the original repayment schedule.
Deferred Loss on Debt Refunding –
Deferred loss on debt refunding is the excess of the reacquisition price of refunded debt over its net carrying amount. For the year ended June 30, 2014, the University adopted the provisions of GASB Statement No. 65,Items Previously Reported as Assets and Liabilities, which required reclassifying deferred loss on debt refunding balances from an offset to long-term debt into a deferred outflow. The deferred loss on refunding balances that were reclassified were related to Series 2004I, Series 2006K, Series 2008L, Series 2012N and Series 2012O. This reclassification is reflected for all periods presented, including $3.7 million for the year ended June 30, 2014 and $4.1 million for the year ended June 30, 2013. Though the transactions resulted in an accounting loss, the refundings resulted in an economic gain, in that future principal plus interest (including issuance costs) will be less than the principal and interest that would have been paid had the original debt been paid out to its scheduled maturity. This occurs due to lower interest costs over the life of the debt.
Notes payable – consisted of the following as of June 30:
Interest RateMaturity
Date 2014 2013BB&T
Information Technology Oracle Site License 4.24% 04/01/14 $ - $ 144,535Academic Analytics
Information Technology Software License - 11/01/15 216,100 -
MSU-Northern FoundationConsolidated Foundation Loan 6.00% 10/01/19 1,305,169 1,440,169
Total note principal outstanding $ 1,521,269 $ 1,584,704
Notes are payable as follows:During the year ending June 30, Principal Interest Total 2015 $ 325,500 $ 78,310 $ 403,8102016 330,600 65,110 395,7102017 220,000 51,910 271,9102018 220,000 38,710 258,7102019 220,000 25,510 245,5102020-2024 205,169 12,310 217,479Total $ 1,521,269 $ 271,860 $ 1,793,129
Advances payable to primary government – The University participates in the State’s Intercap loan program. Intercap loans contain a variable interest rate, which is based on the underlying bond rate of the Montana Board of Investments Intercap bonds, and is adjusted each February. The rate as of June 30, 2014 was 1.00%.
Other advances were made during the mid- 1990s by the Montana Science and Technology Alliance (MSTA) to stimulate research and creative activities in Montana. Such loans were subsequently assumed by the State of Montana Board of Investments. Amounts are expected to be repaid as follows; however, actual payments are allocated between three of the state institutions of higher education based on relative proportions of annual Research and Creative Activities expenditures, and actual repayments and the timing thereof may vary.
A-39
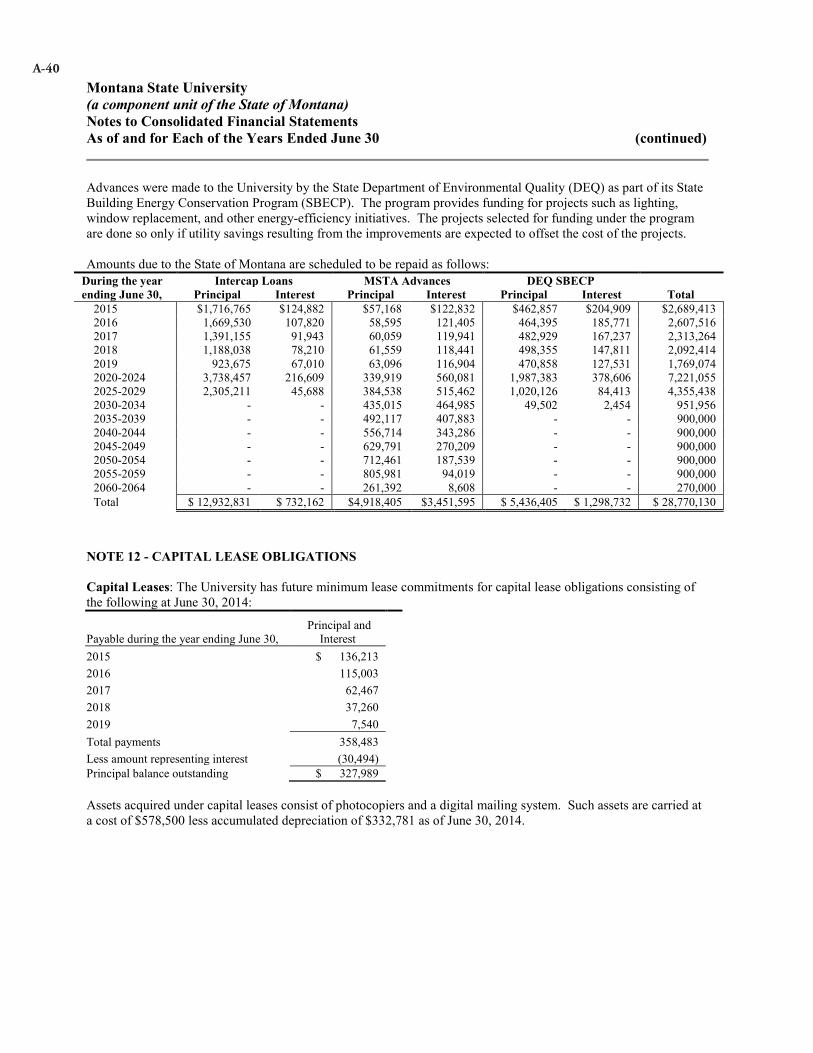
Montana State University(a component unit of the State of Montana)Notes to Consolidated Financial StatementsAs of and for Each of the Years Ended June 30 (continued)
Advances were made to the University by the State Department of Environmental Quality (DEQ) as part of its State Building Energy Conservation Program (SBECP). The program provides funding for projects such as lighting, window replacement, and other energy-efficiency initiatives. The projects selected for funding under the program are done so only if utility savings resulting from the improvements are expected to offset the cost of the projects.
Amounts due to the State of Montana are scheduled to be repaid as follows:During the year ending June 30,
Intercap Loans MSTA Advances DEQ SBECPPrincipal Interest Principal Interest Principal Interest Total
2015 $1,716,765 $124,882 $57,168 $122,832 $462,857 $204,909 $2,689,4132016 1,669,530 107,820 58,595 121,405 464,395 185,771 2,607,5162017 1,391,155 91,943 60,059 119,941 482,929 167,237 2,313,2642018 1,188,038 78,210 61,559 118,441 498,355 147,811 2,092,4142019 923,675 67,010 63,096 116,904 470,858 127,531 1,769,0742020-2024 3,738,457 216,609 339,919 560,081 1,987,383 378,606 7,221,0552025-2029 2,305,211 45,688 384,538 515,462 1,020,126 84,413 4,355,4382030-2034 - - 435,015 464,985 49,502 2,454 951,9562035-2039 - - 492,117 407,883 - - 900,0002040-2044 - - 556,714 343,286 - - 900,000 2045-2049 - - 629,791 270,209 - - 900,000 2050-2054 - - 712,461 187,539 - - 900,000 2055-2059 - - 805,981 94,019 - - 900,000 2060-2064 - - 261,392 8,608 - - 270,000Total $ 12,932,831 $ 732,162 $4,918,405 $3,451,595 $ 5,436,405 $ 1,298,732 $ 28,770,130
NOTE 12 - CAPITAL LEASE OBLIGATIONS
Capital Leases: The University has future minimum lease commitments for capital lease obligations consisting of the following at June 30, 2014:
Payable during the year ending June 30,Principal and
Interest 2015 $ 136,2132016 115,0032017 62,4672018 37,2602019 7,540Total payments 358,483Less amount representing interest (30,494)Principal balance outstanding $ 327,989
Assets acquired under capital leases consist of photocopiers and a digital mailing system. Such assets are carried at a cost of $578,500 less accumulated depreciation of $332,781 as of June 30, 2014.
A-40

Montana State University(a component unit of the State of Montana)Notes to Consolidated Financial StatementsAs of and for Each of the Years Ended June 30 (continued)
NOTE 13 – NET POSITION
As of June 30, the University’s unrestricted balances were as follows:
20142013
(restated)Board of Regents’ approved reserves $ 19,960,000 $ 18,873,738Other designated purposes 52,600,426 58,005,477Total unrestricted net position $ 72,560,426 $ 76,879,215
As of June 30, the University’s restricted balances were as follows:2014 2013
Restricted - nonexpendable:Endowments $ 8,441,621 $ 8,320,951Loans 4,759,495 4,704,988
Total restricted - nonexpendable $ 13,201,116 $ 13,025,939Restricted - expendable:
Scholarships $ 1,770,537 $ 1,210,131Research and other 2,915,252 2,436,545Loans 394,105 392,163Construction and renewal of plant facilities 4,845,605 4,966,545Debt retirement 5,989,825 5,417,996
Total restricted - expendable $ 15,915,324 $ 14,423,380
A-41
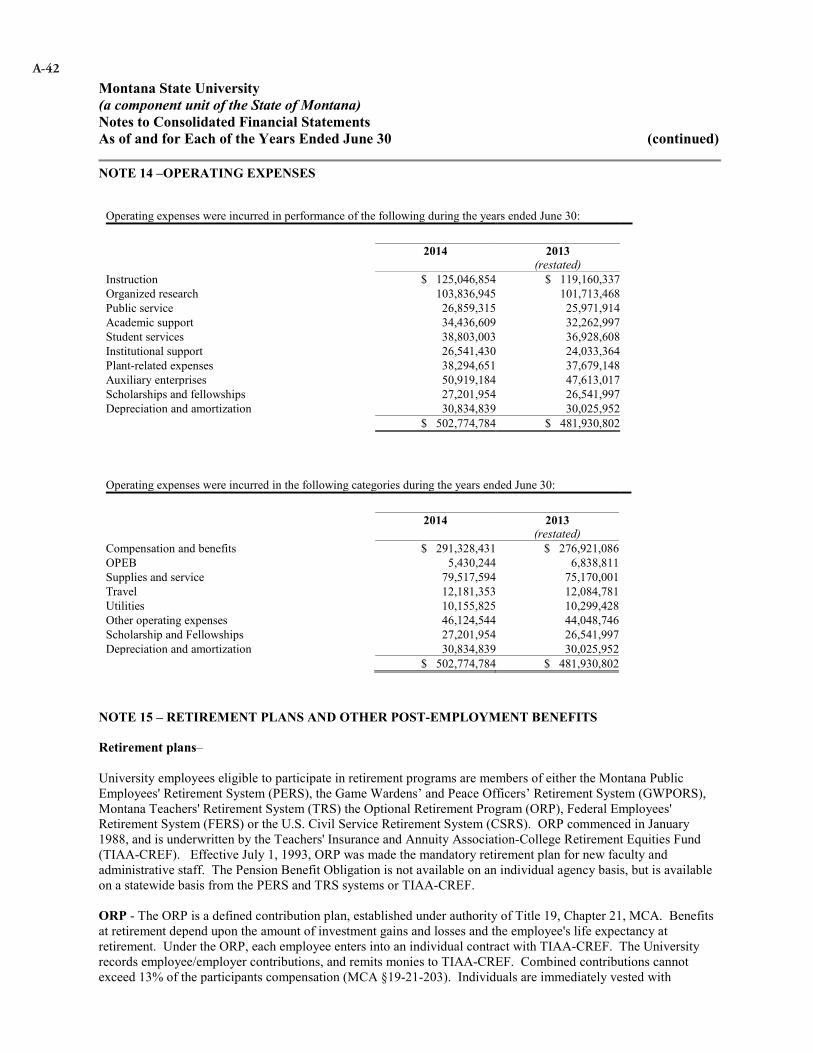
Montana State University(a component unit of the State of Montana)Notes to Consolidated Financial StatementsAs of and for Each of the Years Ended June 30 (continued)
NOTE 14 –OPERATING EXPENSES
Operating expenses were incurred in performance of the following during the years ended June 30:
2014 2013(restated)
Instruction $ 125,046,854 $ 119,160,337Organized research 103,836,945 101,713,468Public service 26,859,315 25,971,914Academic support 34,436,609 32,262,997Student services 38,803,003 36,928,608Institutional support 26,541,430 24,033,364Plant-related expenses 38,294,651 37,679,148Auxiliary enterprises 50,919,184 47,613,017Scholarships and fellowships 27,201,954 26,541,997Depreciation and amortization 30,834,839 30,025,952
$ 502,774,784 $ 481,930,802
Operating expenses were incurred in the following categories during the years ended June 30:
2014 2013(restated)
Compensation and benefits $ 291,328,431 $ 276,921,086OPEB 5,430,244 6,838,811Supplies and service 79,517,594 75,170,001Travel 12,181,353 12,084,781Utilities 10,155,825 10,299,428Other operating expenses 46,124,544 44,048,746Scholarship and Fellowships 27,201,954 26,541,997Depreciation and amortization 30,834,839 30,025,952
$ 502,774,784 $ 481,930,802
NOTE 15 – RETIREMENT PLANS AND OTHER POST-EMPLOYMENT BENEFITS
Retirement plans–
University employees eligible to participate in retirement programs are members of either the Montana Public Employees' Retirement System (PERS), the Game Wardens’ and Peace Officers’ Retirement System (GWPORS), Montana Teachers' Retirement System (TRS) the Optional Retirement Program (ORP), Federal Employees' Retirement System (FERS) or the U.S. Civil Service Retirement System (CSRS). ORP commenced in January 1988, and is underwritten by the Teachers' Insurance and Annuity Association-College Retirement Equities Fund (TIAA-CREF). Effective July 1, 1993, ORP was made the mandatory retirement plan for new faculty and administrative staff. The Pension Benefit Obligation is not available on an individual agency basis, but is available on a statewide basis from the PERS and TRS systems or TIAA-CREF.
ORP - The ORP is a defined contribution plan, established under authority of Title 19, Chapter 21, MCA. Benefits at retirement depend upon the amount of investment gains and losses and the employee's life expectancy at retirement. Under the ORP, each employee enters into an individual contract with TIAA-CREF. The University records employee/employer contributions, and remits monies to TIAA-CREF. Combined contributions cannot exceed 13% of the participants compensation (MCA §19-21-203). Individuals are immediately vested with
A-42

Montana State University(a component unit of the State of Montana)Notes to Consolidated Financial StatementsAs of and for Each of the Years Ended June 30 (continued)
contributions. Annual reports that include financial statements and required supplemental information on the plan are available from TIAA-CREF, 730 Third Avenue, New York, New York 10017-3206, Phone 1-800-842-2733.
TRS - This system was established in 1937 and is governed by Title 19, Chapter 20, MCA, as a cost-sharing multi-employer defined benefit pension plan providing retirement services to all persons employed as teachers or professional staff of any public elementary or secondary school, vocational-technical center or unit of the University System. Eligibility is met with a minimum of 25 years of service or age 60 with 5 years of creditable service. The formula for benefits is 1/60 times creditable service years times average final compensation. Rights are vested after 5 years of creditable service, and vested employees may retire at or after age 50 and receive reduced retirement benefits. The active participant and employer contribution rates are statutorily determined (MCA §19-20-602 and §19-20-605). Additional information or a separate financial statement can be obtained from the State of Montana, Department of Administration, Teachers' Retirement Division, P.O. Box 200139, Helena, MT 59620-0139
PERS - This system was established in 1945 and is governed by Title 19, Chapter 3, MCA, as a cost-sharing multi-employer defined benefit pension plan providing retirement services to substantially all public employees. Effective July 1, 2002, eligible new employees of the University are defaulted into the PERS defined benefit plan and have one year from their date of hire to elect whether to stay in the PERS defined benefit plan, enroll in the ORP plan, or enroll in the PERS Defined Contribution Plan. Benefit eligibility is age 60 with at least 5 years of service, age 65 regardless of service, or 30 years of service regardless of age. Actuarially reduced benefits may be taken with 25 years of service or at age 50 with at least 5 years of service. Monthly retirement benefits are determined by multiplying 1/56 by the number of years of service by the final average salary, unless the employee has 25 or more years of service, in which case the multiplier is 1/50. The required contribution rates for active participants and employers are statutorily determined (MCA §19-3-315 and MCA §19-3-316). Members’ rights become vested after 5 years of service. Additional information or a separate financial statement can be obtained from the State of Montana, Department of Administration, Public Employees' Retirement Administration, P.O. Box 200131, Helena,MT 59620-0131.
GWPORS – This retirement system was established in 1963 and is governed by Title 19, Chapter 8, MCA, to provide retirement services for all persons employed as game wardens and peace officers. Effective July 1, 1997, this system became the mandatory system for campus security officers employed by the Montana University System, unless they already held membership in another State retirement system. Participants are eligible to retire after completing 20 years of service and reaching age 50. Early retirement with a reduced benefit may be taken after completing 5 years of service and reaching 55 years of age. The retirement formula is 2% of the final average salary per year of service. The required contribution rates for active participants and employers are statutorily determined (MCA §19-8-502 and MCA §19-8-504). Members’ rights become vested after 5 years of service. Additional information or a separate financial statement can be obtained from the State of Montana, Department of Administration, Public Employees' Retirement Administration, P.O. Box 200131, Helena, MT 59620-0131.
FERS - This plan commenced in 1986 and is available to Federal employees joining the Extension Service staff that either had no prior covered service under CSRS or had a break in service. This retirement plan contains defined benefit plan components, a Basic Benefit Plan and Social Security, and a defined contribution component, the Thrift Savings Plan (TSP). Basic benefits can be received at age 55 with as little as 10 years of service, and minimum retirement benefits at age 62 with 5 years of service. The formula for basic benefits is 1% of the highest consecutive three-year-average salary multiplied by the number of years of service. The formula changes slightly if over 62 and over 20 years of service. At age 62, retirees are eligible for cost of living adjustments on retirement benefits. The employer is required to make at least a 1% contribution to the TSP. The TSP benefits at retirement depend upon the amount of employer contributions, employee voluntary contributions and investment gains and losses. Further information regarding the Federal Employees Retirement System can be obtained from the U.S. Office of Personnel Management, 1900 E Street NW, Washington, DC 20415.
CSRS - This retirement plan is authorized under the Smith-Lever Act of 1914 as amended and is available to Federal employees who first entered covered service before January 1, 1987 and who are joining the Extension Service staff without a break in service. CSRS is a defined benefit plan. The retirement benefits are based upon the
A-43
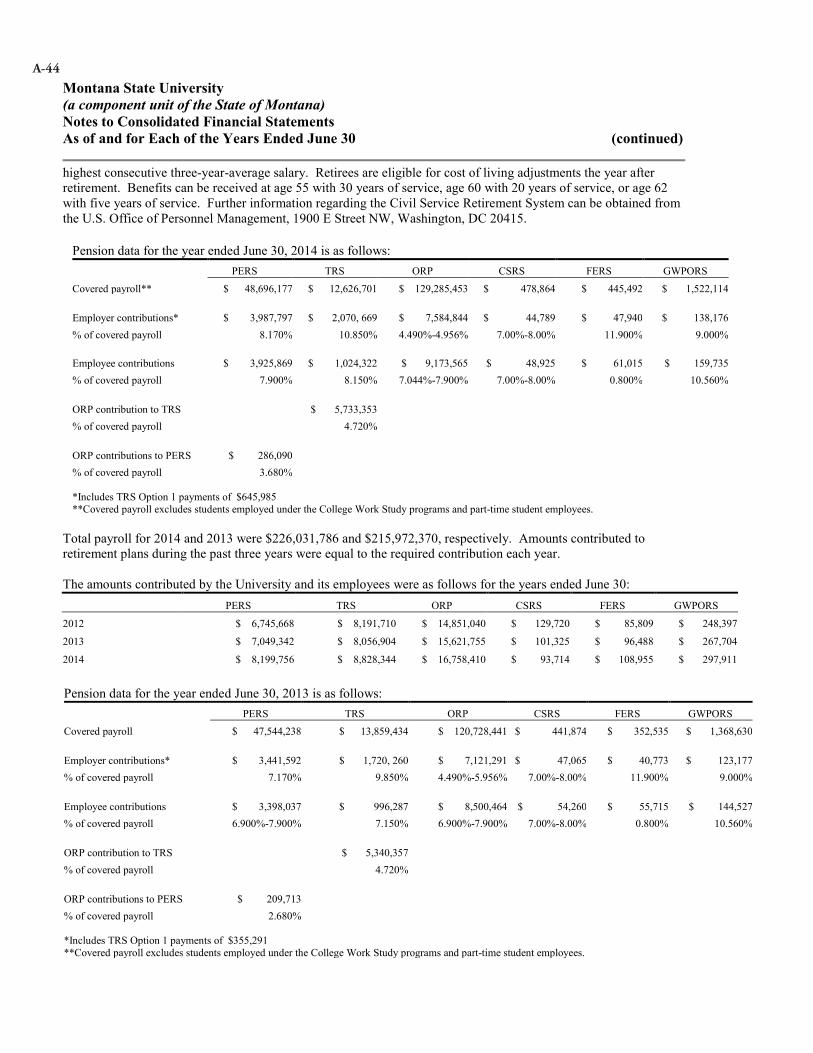
Montana State University(a component unit of the State of Montana)Notes to Consolidated Financial StatementsAs of and for Each of the Years Ended June 30 (continued)
highest consecutive three-year-average salary. Retirees are eligible for cost of living adjustments the year after retirement. Benefits can be received at age 55 with 30 years of service, age 60 with 20 years of service, or age 62 with five years of service. Further information regarding the Civil Service Retirement System can be obtained from the U.S. Office of Personnel Management, 1900 E Street NW, Washington, DC 20415.
Pension data for the year ended June 30, 2014 is as follows:PERS TRS ORP CSRS FERS GWPORS
Covered payroll** $ 48,696,177 $ 12,626,701 $ 129,285,453 $ 478,864 $ 445,492 $ 1,522,114
Employer contributions* $ 3,987,797 $ 2,070, 669 $ 7,584,844 $ 44,789 $ 47,940 $ 138,176% of covered payroll 8.170% 10.850% 4.490%-4.956% 7.00%-8.00% 11.900% 9.000%
Employee contributions $ 3,925,869 $ 1,024,322 $ 9,173,565 $ 48,925 $ 61,015 $ 159,735% of covered payroll 7.900% 8.150% 7.044%-7.900% 7.00%-8.00% 0.800% 10.560%
ORP contribution to TRS $ 5,733,353% of covered payroll 4.720%
ORP contributions to PERS $ 286,090% of covered payroll 3.680%
*Includes TRS Option 1 payments of $645,985**Covered payroll excludes students employed under the College Work Study programs and part-time student employees.
Total payroll for 2014 and 2013 were $226,031,786 and $215,972,370, respectively. Amounts contributed to retirement plans during the past three years were equal to the required contribution each year.
The amounts contributed by the University and its employees were as follows for the years ended June 30:PERS TRS ORP CSRS FERS GWPORS
2012 $ 6,745,668 $ 8,191,710 $ 14,851,040 $ 129,720 $ 85,809 $ 248,397
2013 $ 7,049,342 $ 8,056,904 $ 15,621,755 $ 101,325 $ 96,488 $ 267,704
2014 $ 8,199,756 $ 8,828,344 $ 16,758,410 $ 93,714 $ 108,955 $ 297,911
Pension data for the year ended June 30, 2013 is as follows:PERS TRS ORP CSRS FERS GWPORS
Covered payroll $ 47,544,238 $ 13,859,434 $ 120,728,441 $ 441,874 $ 352,535 $ 1,368,630
Employer contributions* $ 3,441,592 $ 1,720, 260 $ 7,121,291 $ 47,065 $ 40,773 $ 123,177% of covered payroll 7.170% 9.850% 4.490%-5.956% 7.00%-8.00% 11.900% 9.000%
Employee contributions $ 3,398,037 $ 996,287 $ 8,500,464 $ 54,260 $ 55,715 $ 144,527% of covered payroll 6.900%-7.900% 7.150% 6.900%-7.900% 7.00%-8.00% 0.800% 10.560%
ORP contribution to TRS $ 5,340,357% of covered payroll 4.720%
ORP contributions to PERS $ 209,713% of covered payroll 2.680%
*Includes TRS Option 1 payments of $355,291**Covered payroll excludes students employed under the College Work Study programs and part-time student employees.
A-44

Montana State University(a component unit of the State of Montana)Notes to Consolidated Financial StatementsAs of and for Each of the Years Ended June 30 (continued)
Other Post-Employment Benefits (OPEB) —
Authorization— Montana State law requires state agencies to provide access to health insurance benefits to eligible retirees up to Medicare – eligible age (65) (§2-18-704(1)(a), MCA). The Board of Regents of the Montana University System (MUS), having broad authority to act in the best interests of the MUS, has directed the Office of the Commissioner of Higher Education (OCHE) to provide access to health insurance benefits beyond age 65.Eligible University retirees may participate in the health insurance plan, provided that they contribute to the cost of the plan.
Eligibility— Retirees who are eligible to receive retirement benefits from Teachers Retirement System (TRS) or the Public Employees Retirement System (PERS) at the time employment ceases may participate in the plan. Retirees who are in the Optional Retirement Plan (ORP) (through TIAA-CREF) or any other defined contribution plan associated with the MUS must have worked five or more years and be age 50, or have worked 25 years with the MUS to be eligible for retiree insurance benefits. The MUS’s Interunit Benefits Committee, at the direction of the OCHE, sets the premiums for such participation. Until a retiree reaches age 65, individual retiree participation premiums range from $575-$687 per month, depending on the level of deductible and other selected plan features. Upon reaching age 65 (Medicare eligibility), monthly participation premiums range from $243-$291 for an individual retiree. Coverage is also extended to dependents and surviving dependents of the employee. Retirees who select a non-MUS Medicare Advantage Program are not considered in the above rates.
Financial and plan information— The MUS Group Benefits Plan does not issue a stand-alone financial report, but is subject to audit as part of the State of Montana’s Basic Financial Statements, included in the Comprehensive Annual Financial Report (CAFR). A copy of the most recent CAFR can be obtained online at http://afsd.mt.gov/CAFR/CAFR.asp or by contacting the Montana Department of Administration, PO Box 200102, Helena, MT 59620-0102.
A schedule of funding progress contained in the Required Supplementary Information immediately following the notes to the financial statements presents multi-year trend information.
The plan is considered to be a multi-employer agent plan. All units of the MUS fund the post-employment benefits on a pay-as-you-go basis from general assets. The University’s annual other post-employment benefit (OPEB) cost (expense) is calculated based on the annual required contribution (ARC) of the employer, an amount actuarially determined in accordance with GASB Statement No. 45. The calculated ARC represents an amount that, if funded, would cover normal cost each year and amortize any unfunded actuarial liability over a period of 30 years.. The most recent actuarial determination was based on plan information as of July 1, 2013. At that time, the number of active University participants in the health insurance plan was 3,513. The total number of inactive (retiree and dependent) participants was 979. During the years ended June 30, 2014, 2013 and 2012, the University contributed$35,014.278, $31,509,597, and $31,006,741, respectively, which was calculated based on a contribution rate per actively employed participants, whose annual covered payroll totaled $201,051,981 as of the last actuarial valuation.Included within this amount, the University is deemed to have contributed $862,890, $474,723 and $106,919, for retirees or their dependents during 2014, 2013 and 2012, respectively.
As of the latest actuarial evaluation, the accrued liability for retiree health benefits was $49,869,358 all of which was unfunded. The percentage of annual OPEB cost contributed to the plan was 16%, 7% and 2%for 2014, 2013 and 2012 respectively. The funded status of the plan as of June 30 was 0% for each of the previous three years.
A-45
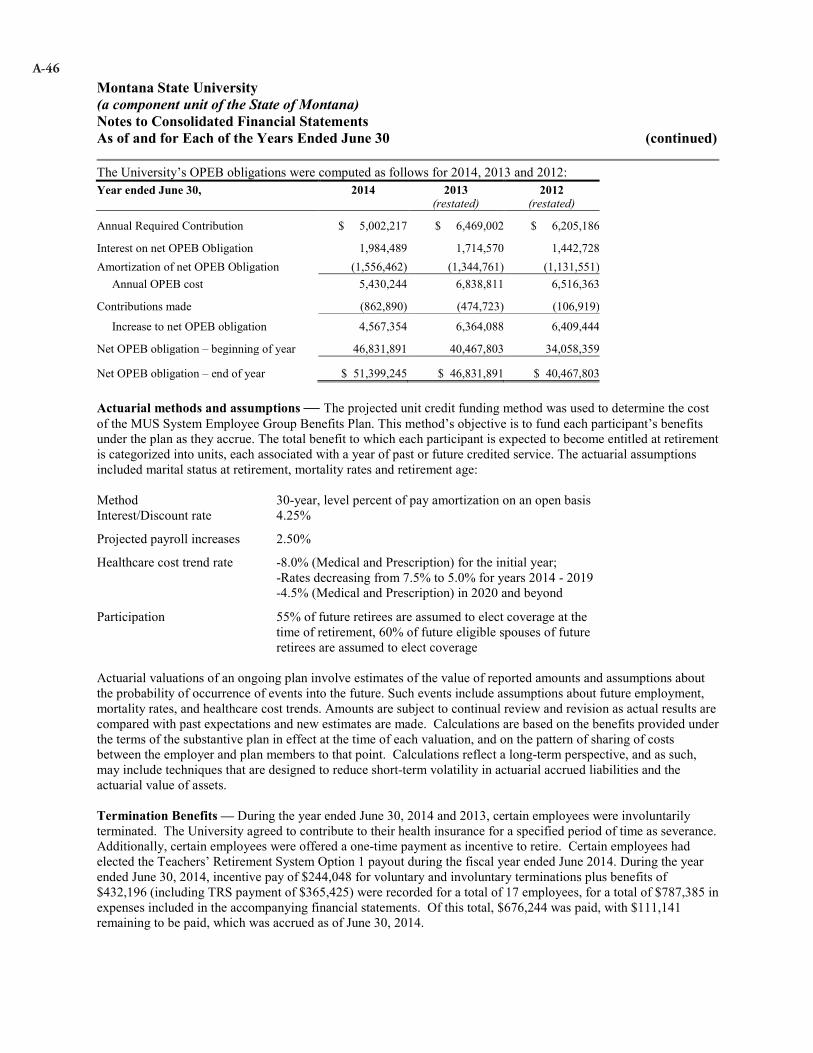
Montana State University(a component unit of the State of Montana)Notes to Consolidated Financial StatementsAs of and for Each of the Years Ended June 30 (continued)
The University’s OPEB obligations were computed as follows for 2014, 2013 and 2012:Year ended June 30, 2014 2013
(restated)2012
(restated)
Annual Required Contribution $ 5,002,217 $ 6,469,002 $ 6,205,186
Interest on net OPEB Obligation 1,984,489 1,714,570 1,442,728Amortization of net OPEB Obligation (1,556,462) (1,344,761) (1,131,551)
Annual OPEB cost 5,430,244 6,838,811 6,516,363
Contributions made (862,890) (474,723) (106,919)
Increase to net OPEB obligation 4,567,354 6,364,088 6,409,444
Net OPEB obligation – beginning of year 46,831,891 40,467,803 34,058,359
Net OPEB obligation – end of year $ 51,399,245 $ 46,831,891 $ 40,467,803
Actuarial methods and assumptions — The projected unit credit funding method was used to determine the cost of the MUS System Employee Group Benefits Plan. This method’s objective is to fund each participant’s benefits under the plan as they accrue. The total benefit to which each participant is expected to become entitled at retirement is categorized into units, each associated with a year of past or future credited service. The actuarial assumptions included marital status at retirement, mortality rates and retirement age:
MethodInterest/Discount rate
30-year, level percent of pay amortization on an open basis4.25%
Projected payroll increases 2.50%
Healthcare cost trend rate -8.0% (Medical and Prescription) for the initial year; -Rates decreasing from 7.5% to 5.0% for years 2014 - 2019-4.5% (Medical and Prescription) in 2020 and beyond
Participation 55% of future retirees are assumed to elect coverage at the time of retirement, 60% of future eligible spouses of future retirees are assumed to elect coverage
Actuarial valuations of an ongoing plan involve estimates of the value of reported amounts and assumptions about the probability of occurrence of events into the future. Such events include assumptions about future employment, mortality rates, and healthcare cost trends. Amounts are subject to continual review and revision as actual results are compared with past expectations and new estimates are made. Calculations are based on the benefits provided under the terms of the substantive plan in effect at the time of each valuation, and on the pattern of sharing of costs between the employer and plan members to that point. Calculations reflect a long-term perspective, and as such, may include techniques that are designed to reduce short-term volatility in actuarial accrued liabilities and the actuarial value of assets.
Termination Benefits — During the year ended June 30, 2014 and 2013, certain employees were involuntarily terminated. The University agreed to contribute to their health insurance for a specified period of time as severance. Additionally, certain employees were offered a one-time payment as incentive to retire. Certain employees had elected the Teachers’ Retirement System Option 1 payout during the fiscal year ended June 2014. During the year ended June 30, 2014, incentive pay of $244,048 for voluntary and involuntary terminations plus benefits of $432,196 (including TRS payment of $365,425) were recorded for a total of 17 employees, for a total of $787,385 in expenses included in the accompanying financial statements. Of this total, $676,244 was paid, with $111,141 remaining to be paid, which was accrued as of June 30, 2014.
A-46
Montana State University(a component unit of the State of Montana)Notes to Consolidated Financial StatementsAs of and for Each of the Years Ended June 30 (continued)
NOTE 16 – RISK MANAGEMENT
Due to the diverse risk exposure of the University and its constituent agencies, the insurance portfolio contains a comprehensive variety of coverage. Montana statutes, Sections 2-9-101 through 305, MCA require participation of all state agencies in the self-insurance plan established by the Montana Department of Administration, Risk Management and Tort Defense Division (RMTDD). The self-insurance program includes coverage for automobile physical damage, aircraft physical damage and liability, general liability and property exposures. The RMTDD provides coverage, above self-insured retentions, by purchasing other commercial coverage using Alliant Insurance Services as the primary insurance broker for volunteer accidental death & dismemberment, boiler & machinery, crime, business interruption, cyber/data information security, fine art, foreign liability and special risks, inland marine, student medical and non-medical professional liability, excess property, and special events coverage. The insurance broker for crime insurance is HUB International, and coverage for aviation excess liability and aircraft hull liability is held through a specialty broker, Mountain Air Aviation. MSU secures athletic injury and catastrophic sports injury insurance for its NCAA programs through Bene Marc, Inc. and Summit America Insurance Services. In addition to these basic policies, the University’s Department of Safety and Risk Management establishes guidelines and provides consultation in risk assessment, avoidance, acceptance and transfer. There have been no significant reductions in commercial property insurance protection from 2014 to 2015, and there were no instances in which settlements exceeded insurance coverage for the past three fiscal years.
Buildings and contents – are insured for replacement cost value. For each loss covered by the State’s self- insurance program and commercial coverage, MSU elects a $1,000 per occurrence retention.
General liability and tort claim coverage – includes comprehensive liability for personal injury or property damage that may arise from a negligent act or omission of the state. Also included are automobile liability, watercraft and mobile equipment, and are provided for by the University’s participation in the State’s self-insurance program. If the RMTDD pays damages on a claim, the division has the right to recover costs or damages from any party in connection with the claim. There is no agency deductible applied to tort liability claims. There is a $250/$500 deductible for comprehensive/collision claims on state owned, loaned or leased vehicles.
The Tort Claims Act of the State of Montana, Section 2-9-102, MCA, provides that governmental entities are liable for its torts and of those of its employees acting within the course and scope of their employment or duties, whether arising out of a governmental or proprietary function, except as specifically provided by the Legislature. Accordingly, Section 2-9-305, MCA, requires that the State “provide for the immunization, defense and indemnification of its public officers and employees civilly sued for their actions taken within the course and scope of their employment.”
Self-Funded Programs – The University’s employee health care program is self-funded, and is provided through participation in the Montana University System (MUS) Inter-unit Benefits Program. The MUS program is funded on an actuarial basis and the University believes that sufficient reserves exist to pay run-off claims related to prior years, and considers premiums and University contributions sufficient to pay current and future claims.
Effective July 1, 2003, the MUS adopted a self-funded workers’ compensation insurance program, provided through membership in the MUS Self-Insured Workers’ Compensation Program. The MUS program is funded on an actuarial basis and utilizes an OCHE employee as an in-house administrator. Benefits provided are prescribed by state law and include biweekly payments for temporary loss of wages as well as qualifying permanent partial and permanent total disability. Medical and indemnity benefits are statutorily prescribed for qualifying job-related injuries or illnesses.
The MUS program incorporates a self-insured retention of $750,000 per occurrence and excess commercial coverage to statutory limits. Employer’s liability coverage has a $750,000 per occurrence retention with a per occurrence insurance limit of $1,000,000. The University makes monthly contributions to the self-funded program utilizing the MUS Workers’ Compensation Board recommended rates for premium payments. The MUS Workers’ Compensation Board annually utilizes actuarially recommendations based upon the National Council for Compensation Insurance (NCCI) rates per $100 in University payroll.
A-47
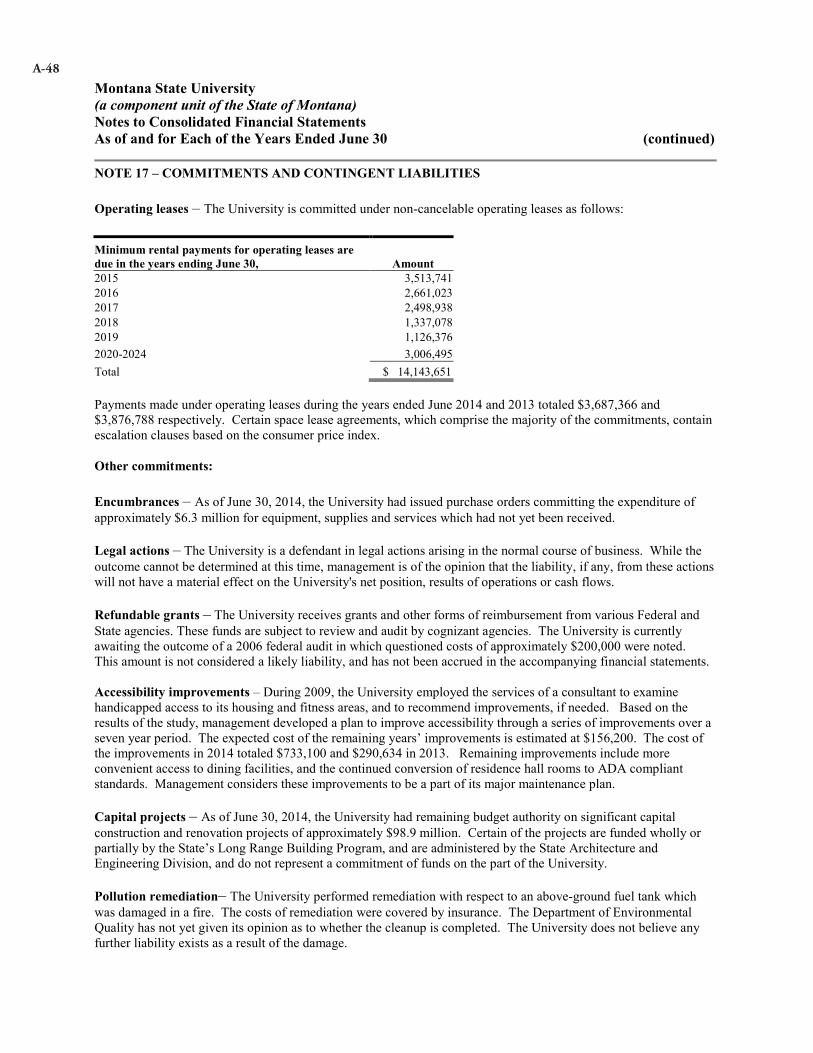
Montana State University(a component unit of the State of Montana)Notes to Consolidated Financial StatementsAs of and for Each of the Years Ended June 30 (continued)
NOTE 17 – COMMITMENTS AND CONTINGENT LIABILITIES
Operating leases – The University is committed under non-cancelable operating leases as follows:
Minimum rental payments for operating leases are due in the years ending June 30, Amount 2015 3,513,7412016 2,661,0232017 2,498,9382018 1,337,0782019 1,126,3762020-2024 3,006,495Total $ 14,143,651
Payments made under operating leases during the years ended June 2014 and 2013 totaled $3,687,366 and$3,876,788 respectively. Certain space lease agreements, which comprise the majority of the commitments, contain escalation clauses based on the consumer price index.
Other commitments:
Encumbrances – As of June 30, 2014, the University had issued purchase orders committing the expenditure of approximately $6.3 million for equipment, supplies and services which had not yet been received.
Legal actions – The University is a defendant in legal actions arising in the normal course of business. While the outcome cannot be determined at this time, management is of the opinion that the liability, if any, from these actions will not have a material effect on the University's net position, results of operations or cash flows.
Refundable grants – The University receives grants and other forms of reimbursement from various Federal and State agencies. These funds are subject to review and audit by cognizant agencies. The University is currently awaiting the outcome of a 2006 federal audit in which questioned costs of approximately $200,000 were noted. This amount is not considered a likely liability, and has not been accrued in the accompanying financial statements.
Accessibility improvements – During 2009, the University employed the services of a consultant to examine handicapped access to its housing and fitness areas, and to recommend improvements, if needed. Based on the results of the study, management developed a plan to improve accessibility through a series of improvements over aseven year period. The expected cost of the remaining years’ improvements is estimated at $156,200. The cost of the improvements in 2014 totaled $733,100 and $290,634 in 2013. Remaining improvements include more convenient access to dining facilities, and the continued conversion of residence hall rooms to ADA compliant standards. Management considers these improvements to be a part of its major maintenance plan.
Capital projects – As of June 30, 2014, the University had remaining budget authority on significant capital construction and renovation projects of approximately $98.9 million. Certain of the projects are funded wholly or partially by the State’s Long Range Building Program, and are administered by the State Architecture and Engineering Division, and do not represent a commitment of funds on the part of the University.
Pollution remediation– The University performed remediation with respect to an above-ground fuel tank which was damaged in a fire. The costs of remediation were covered by insurance. The Department of Environmental Quality has not yet given its opinion as to whether the cleanup is completed. The University does not believe any further liability exists as a result of the damage.
A-48

Montana State University(a component unit of the State of Montana)Notes to Consolidated Financial StatementsAs of and for Each of the Years Ended June 30 (continued)
Pledged revenues – The University’s bonded indebtedness, as described in Note 11, is payable from and secured by a parity first lien on and pledge of certain gross and net revenues, which comprised: 1) all student building fees and certain student union use fees assessed against students attending the University; 2) net student housing system pledged revenues, after the payment of operation and maintenance expenses of such facilities: 3) certain rental and other income generated by the pledged facilities; 4) lease rentals from the Museum of the Rockies; 5) all Land Grant income; 6) certain student athletic fees; 7) certain Health & Physical Education fees; 8) MSU- Bozeman Fieldhouse fees; 9) capitalized interest and earnings on certain funds created under the Indenture; 10) certain Grant-related Facilities & Administrative Costs with respect to the Series H 2004 debt; 11) revenue generated from the student facility enhancement fee; 12) lease income generated from the University’s lease with the ASMSU Bookstore; and 13) student fees generated by the student union building fees. None of the net pledged revenues are derived from facilities or fees relating to the Great Falls campus, the MSU Extension Service, the Montana Agricultural Experiment Station, or the Fire Services Training School.
All of the above revenues are cross-pledged to repay any and all of the secured debt. The remaining cash requirements to repay bonds, including principal and interest, total $258,054,804 from July 1, 2014 through June 30, 2044.
Amounts of pledged revenue were as follows in the years ended June 30:2014 2013
DescriptionPledged Revenue
Total Similar Revenue
%Pledged
Pledged Revenue
Total Similar Revenue(restated)
%Pledged
Student fees (no tuition is pledged) $ 9,020,551 $37,049,930 24% $ 8,450,123 $36,580,651 23%Housing and residence hall dining revenues, net of related expenses 11,134,821 11,134,821 100% 10,727,320 10,727,320 100%Grant and contract facility and administrative cost recoveries 1,388,104 15,861,311 9% 1,482,103 16,349,985 9%Bozeman campus athletic events revenue 3,003,855 3,144,353 96% 2,428,568 2,574,711 94%Bozeman campus parking revenues 2,155,927 2,155,927 100% 1,859,485 1,859,485 100%Bozeman bookstore and museum lease income 709,739 709,739 100% 743,505 743,505 100%Land grant income 3,375,355 3,375,355 100% 1,931,797 1,931,797 100%Investment income 678,888 2,369,918 29% 462,917 1,260,416 37%Total 31,467,240 28,085,818
Less debt service requirements (11,676,936) (10,449,013)Excess of pledged revenue over
debt service requirements $ 19,790,304 $ 17,636,805
NOTE 18 – RELATED PARTIES
Private nonprofit organizations affiliated with the University include the MSU Foundation, the MSU-BillingsFoundation, the MSU-Northern Foundation, the MSU-Bozeman Alumni Association, the MSU Bobcat Club, the MSU-Bozeman Bookstore, Friends of KUSM, Friends of KEMC and the Museum of the Rockies, Inc. As discussed in note 20, certain of the parties are considered Component Units of the University. During 2012, the MSU-Bozeman Alumni Association was merged into the MSU Foundation, and the name of the combined entity was changed to the MSU Alumni Foundation.
During the years ended June 30, 2014 and 2013, respectively, the Foundations provided $20,292,081 and $7,645,575 in scholarship, in-kind capital donations, and other gift support directly to the University, in addition tosignificant payments made to others in support of the University. The University paid to its Foundations $2,167,638
A-49

Montana State University(a component unit of the State of Montana)Notes to Consolidated Financial StatementsAs of and for Each of the Years Ended June 30 (continued)
and $2,243,621 during the years ended 2014 and 2013, respectively, which included payments for contracted services, capital campaign support, and operating leases.
MSU- Bozeman leased certain office space from the MSU Alumni Foundation’s wholly owned subsidiary, Advanced Technology Inc. (ATI). Rental and other payments to ATI totaled $196,520 during 2014 and $179,982 during 2013. In June 2008, the University entered into a space lease agreement with the MSU Alumni Foundationin which a total of $350,000 in rent was paid over a period of five months, in exchange for a 20-year space rental agreement. When the MSU Foundation merged operations with the MSU Alumni Association, the space rental agreement was cancelled, and the MSU Alumni Foundation gave credit to the University for the remaining prepaid rent. As of June 30, 2014, $62,500 remained as credit for the University, to be used toward payment for future services.
Friends of Montana Public Television provided $913,625 during 2014 and $1,076,497 during 2013 and Friends of KEMC Public Radio provided $700,000 during 2014 and $500,000 during 2013 in support of the University’s television and radio stations.
The Museum of the Rockies, Inc. paid $300,000 per year to the University for facility rental, and provided$1,434,961 and $1,671,686 during the fiscal years ended June 2014 and 2013, respectively, in support of the University, primarily as reimbursement for Museum staff salaries and benefits as well as improvements to the leased facility. The Museum of the Rockies lease continues at a rate of $300,000 per year through 2016.
The MSU Bobcat Club provided $1,125,000 and $1,100,000 in support of athletic programs during the years ended June 30, 2014 and 2013.
NOTE 19 – SUBSEQUENT EVENTS
In September of 2014, the Board of Regents authorized the Billings campus to repair and replace the existing roof for the Student Union Building, and seek an Intercap loan in the amount of $850,000 to finance the project.
In November of 2014, the Board of Regents authorized the Bozeman campus to execute a lease with Bozeman Deaconess Hospital. This arrangement will provide space to accommodate elements of the University of Washington’s School of Medicine Wyoming, Washington, Alaska, Montana, Idaho consortium (WWAMI) medicalprogram by locating first, second and third year WWAMI students under one roof and facilitate additional integration of clinical and basic science teaching.
NOTE 20 – COMPONENT UNITS
Entities included as component units of the University are nonprofit, tax exempt organizations operating exclusively for the purposes of encouraging, promoting and supporting educational programs, research, scholarly pursuits and athletics at, or in connection with the University. Although the University may not control the timing or amount of receipts from these entities, the majority of the revenues or incomes thereon that the entities hold and invest are restricted by donors to the activities of the University. The entities included as component units in the financial statements are the Montana State University Foundation (doing business as the Montana State University Alumni Foundation) (406-994-2053), the MSU-Billings Foundation (406-657-2244), the MSU-Northern Foundation (406-265-3711), the MSU Bobcat Club (406-994-3741), and the Museum of the Rockies, Inc. (406-994-3466).
The Foundations and the Museum of the Rockies, Inc., meet the test for component units based on the materiality of the support provided to the university. The Montana State University Bobcat Club has been included as a component unit because management believes it would be misleading to exclude it. Support received from this entity is significant and critical in relation to the operations of the individual sports it supports; additionally, many financial statement readers do not differentiate between the University and its sports support organizations, and would expect their financial information to be included within the University’s audited statements.
A-50

Montana State University(a component unit of the State of Montana)Notes to Consolidated Financial StatementsAs of and for Each of the Years Ended June 30 (continued)
Condensed financial information for each of the University’s component units follows.
Montana State UniversityCondensed Combining Schedule of Component Unit Statements of Financial PositionAs of June 30, 2014 or December 31, 2013*
Montana State University
Alumni Foundation
Montana State University-
Billings Foundation
Montana State University-Northern
FoundationMuseum of the Rockies, Inc.
Montana State
University Bobcat Club Combined
Assets:
Cash and investments $ 179,308,865 $ 26,417,510 $ 4,494,540 $ 11,733,420 $ 1,597,738 $ 223,552,073
Amounts due from MSU - - 1,305,169 - - 1,305,169
Other receivables, net 23,787,776 801,000 700,816 559,611 18,311 25,867,514
Capital assets, net 4,798,863 1,285,730 57,489 3,278,247 - 9,420,329
Other assets 419,638 166,678 12,271 603,014 828,889 2,030,490
Total assets $ 208,315,142 $ 28,670,918 $ 6,570,285 $ 16,174,292 $ 2,444,938 $ 262,175,575
Liabilities:Accounts payable and other
liabilities $ 749,536 $ 808,421 $ - $ 522,415 $ 201,232 $ 2,281,604
Amounts due to MSU 308,180 - - 325,982 - 634,162
Notes, bonds and debt obligations 12,680,581 - - - - 12,680,581
Liabilities to external parties 6,251,226 375,790 1,648,083 - - 8,275,099
Custodial funds 10,944,300 1,663,547 - - - 12,607,847
Total liabilities 30,933,823 2,847,758 1,648,083 848,397 201,232 36,479,293
Net assets:
Unrestricted 4,036,349 4,997,655 (989,968) 9,163,808 659,317 17,867,161
Temporarily restricted 72,938,520 7,671,201 2,015,440 5,337,335 240,479 88,202,975
Permanently restricted 100,406,450 13,154,304 3,896,730 824,752 1,343,910 119,626,146
Total net assets 177,381,319 25,823,160 4,922,202 15,325,895 2,243,706 225,696,282
Total liabilities and net assets $ 208,315,142 $ 28,670,918 $ 6,570,285 $ 16,174,292 $ 2,444,938 $ 262,175,575*The Museum of the Rockies, Inc. maintains a December 31 year-end. All other component units’ year-ends coincide with the University’s June 30 fiscal year.
A-51

Montana State University(a component unit of the State of Montana)Notes to Consolidated Financial StatementsAs of and for Each of the Years Ended June 30 (continued)
Montana State UniversityCondensed Combining Schedule of Component Unit Statements of Activities
For the Year Ended June 30, 2014 or December 31, 2013*
Montana State
University Alumni
Foundation
Montana State University-
Billings Foundation
Montana State
University-Northern
Foundation
Museum of the Rockies,
Inc.
Montana State
University Bobcat Club Combined
Revenues:Contributions $ 20,711,370 $ 2,737,116 $ 912,969 $ 1,304,942 $ 1,508,066 $ 27,174,463 Investment income and unrealized
gain on investments 19,454,660 3,236,941 479,057 1,332,117 188,670 24,691,445 Support from University 1,200,000 50,000 170,203 - - 1,420,203 Other income 2,264,243 899,590 97,844 3,013,058 725,653 7,000,388 Total revenues 43,630,273 6,923,647 1,660,073 5,650,117 2,422,389 60,286,499
Expenses:University support 15,434,814 840,016 113,049 1,527,869 318,750 18,234,498 Scholarships and other program
expenses 3,201,470 1,653,421 547,523 2,164,565 1,173,710 8,740,689 Supporting services 9,636,765 747,574 347,000 1,127,690 779,752 12,638,781 Total expenses 28,273,049 3,241,011 1,007,572 4,820,124 2,272,212 39,613,968
Change in net assets beforenonoperating items 15,357,224 3,682,636 652,501 829,993 150,177 20,672,531
Nonoperating items 727,404 - (49,596) - - 677,808
Change in net assets 16,084,628 3,682,636 602,905 829,993 150,177 21,350,339
Net assets, beginning of fiscal year 161,296,691 22,140,524 4,319,297 14,495,902 2,093,529 204,345,943
Net assets, end of fiscal year $ 177,381,319 $ 25,823,160 $ 4,922,202 $ 15,325,895 $ 2,243,706 $ 225,696,282
Component Unit Investment Composition*: Component Unit Promises Receivable*:2014 2013 2014 2013
Pooled investments**:Equity securities $ 20,769,897 $ 16,134,294 Receivable in one year $ 5,598,900 $ 2,531,276Debt securities 10,031,154 9,781,743 Receivable in one to five years 14,369,885 14,773,494
Alternative investments 114,398,921 97,842,120 Receivable after five years 3,271,595 5,782,756
Real Estate 27,627 2,441,209 Less discounts and allowances (2,018,487) (2,098,472)
Cash equivalents 12,883,975 4,785,108 Total $ 21,221,893 $ 20,989,054
Other pooled investments 38,042,865 34,454,006
US Treasuries 388,390 283,756
Other real estate 576,083 811,083Other investments 9,020,015 8,199,368
Investments held in trust for others 10,775,737 8,780,531Total $ 216,914,664 $ 183,513,218
* The Museum of the Rockies, Inc. maintains a December 31 year-end. All other component units’ year-ends coincide with the University’s June 30 fiscal year.
**Foundation investment pools are not subject to regulatory oversight.
A-52

Montana State University(a component unit of the State of Montana)Notes to Consolidated Financial StatementsAs of and for Each of the Years Ended June 30 (continued)
Montana State UniversityCondensed Combining Schedule of Component Unit Statements of Financial PositionAs of June 30, 2013 or December 31, 2012*
Montana State
University Alumni
Foundation
Montana State
University-Billings
Foundation
Montana State University-Northern
Foundation
Museum of the Rockies,
Inc.
Montana State
University Bobcat Club Combined
Assets:
Cash and investments $ 152,001,279 $ 21,702,522 $ 3,688,623 $ 10,208,822 $ 1,490,253 $ 189,091,499
Amounts due from MSU - - 1,440,169 -
- 1,440,169
Other receivables, net 23,141,776 1,041,100 767,531 824,254 37,744 25,812,405
Capital assets, net 4,786,963 1,893,556 58,350 3,390,966
- 10,129,835
Other assets 357,566 125,201 17,071 984,774 750,003 2,234,615
Total assets $ 180,287,584 $ 24,762,379 $ 5,971,744 $ 15,408,816 $ 2,278,000 $ 228,708,523Liabilities:Accounts payable and other
liabilities $ 693,344 $ 797,854 $ - $ 580,834 $ 184,471 $ 2,256,503
Amounts due to MSU 298,339 - - 315,578 - 613,917
Notes, bonds and debt obligations 2,726,087 - - 16,502 - 2,742,589
Liabilities to external parties 5,128,463 400,328 1,652,447 - - 7,181,238
Custodial funds 10,144,660 1,423,673 - - - 11,568,333
Total liabilities 18,990,893 2,621,855 1,652,447 912,914 184,471 24,362,580
Net assets:
Unrestricted 4,491,687 4,526,621 (967,363) 8,109,723 484,117 16,644,785
Temporarily restricted 67,629,971 4,881,839 1,642,007 5,562,097 267,502 79,983,416
Permanently restricted 89,175,033 12,732,064 3,644,653 824,082 1,341,910 107,717,742
Total net assets 161,296,691 22,140,524 4,319,297 14,495,902 2,093,529 204,345,943
Total liabilities and net assets $ 180,287,584 $ 24,762,379 $ 5,971,744 $ 15,408,816 $ 2,278,000 $ 228,708,523*The Museum of the Rockies, Inc. maintains a December 31 year-end. All other component units’ year-ends coincide with the University’s June 30 fiscal year.
A-53
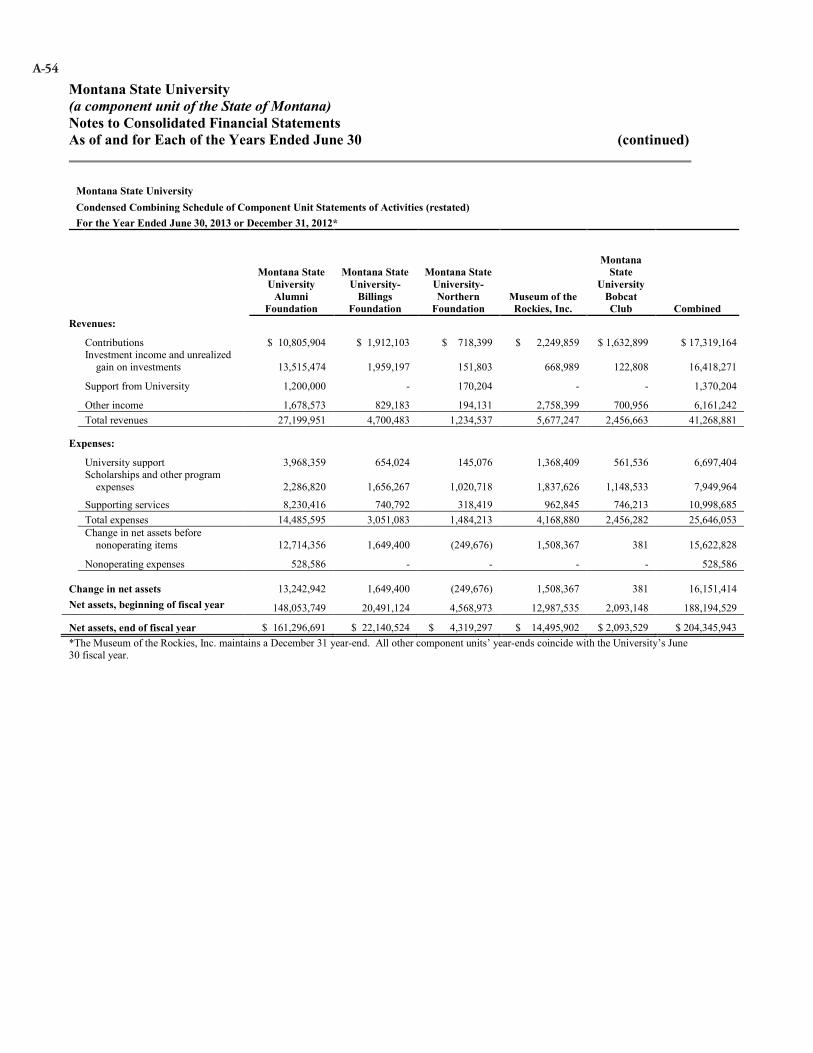
Montana State University(a component unit of the State of Montana)Notes to Consolidated Financial StatementsAs of and for Each of the Years Ended June 30 (continued)
Montana State UniversityCondensed Combining Schedule of Component Unit Statements of Activities (restated)For the Year Ended June 30, 2013 or December 31, 2012*
Montana State University
Alumni Foundation
Montana State University-
Billings Foundation
Montana State University-Northern
FoundationMuseum of the Rockies, Inc.
Montana State
University Bobcat Club Combined
Revenues:
Contributions $ 10,805,904 $ 1,912,103 $ 718,399 $ 2,249,859 $ 1,632,899 $ 17,319,164Investment income and unrealized
gain on investments 13,515,474 1,959,197 151,803 668,989 122,808 16,418,271
Support from University 1,200,000 - 170,204 - - 1,370,204
Other income 1,678,573 829,183 194,131 2,758,399 700,956 6,161,242Total revenues 27,199,951 4,700,483 1,234,537 5,677,247 2,456,663 41,268,881
Expenses:
University support 3,968,359 654,024 145,076 1,368,409 561,536 6,697,404Scholarships and other program
expenses 2,286,820 1,656,267 1,020,718 1,837,626 1,148,533 7,949,964
Supporting services 8,230,416 740,792 318,419 962,845 746,213 10,998,685Total expenses 14,485,595 3,051,083 1,484,213 4,168,880 2,456,282 25,646,053Change in net assets before
nonoperating items 12,714,356 1,649,400 (249,676) 1,508,367 381 15,622,828
Nonoperating expenses 528,586 - - - - 528,586
Change in net assets 13,242,942 1,649,400 (249,676) 1,508,367 381 16,151,414Net assets, beginning of fiscal year 148,053,749 20,491,124 4,568,973 12,987,535 2,093,148 188,194,529
Net assets, end of fiscal year $ 161,296,691 $ 22,140,524 $ 4,319,297 $ 14,495,902 $ 2,093,529 $ 204,345,943*The Museum of the Rockies, Inc. maintains a December 31 year-end. All other component units’ year-ends coincide with the University’s June 30 fiscal year.
A-54
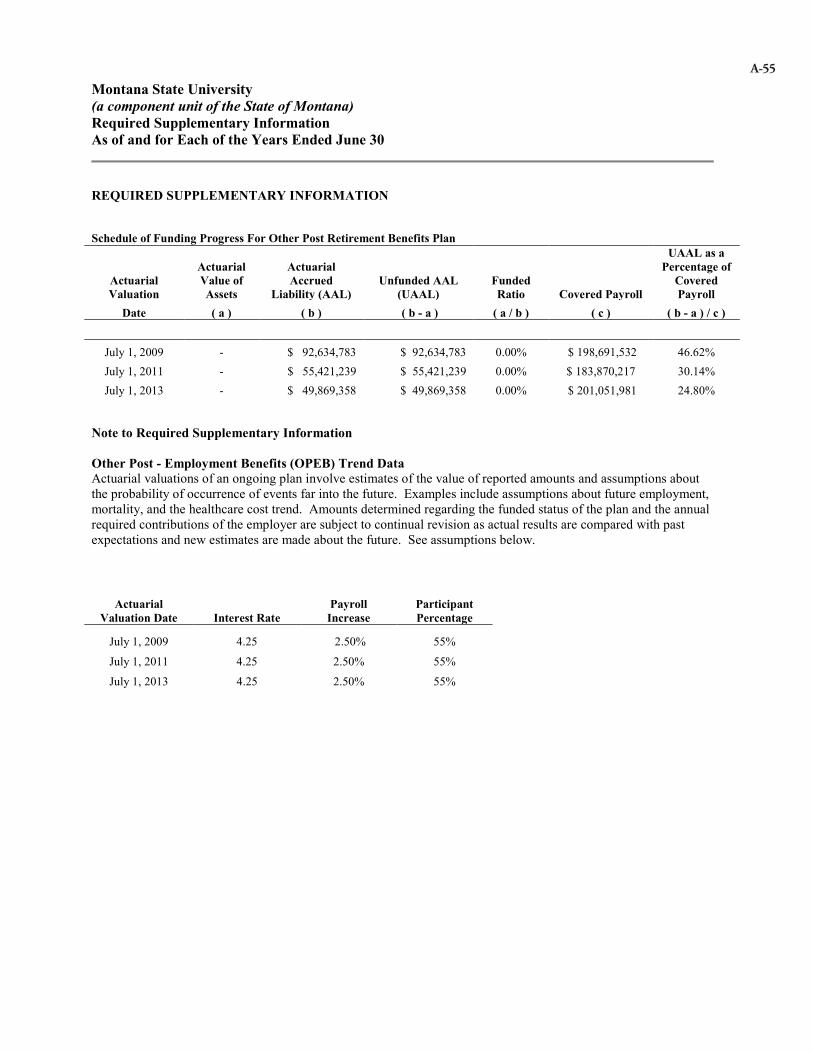
Montana State University(a component unit of the State of Montana)Required Supplementary InformationAs of and for Each of the Years Ended June 30
REQUIRED SUPPLEMENTARY INFORMATION
Schedule of Funding Progress For Other Post Retirement Benefits Plan
Actuarial Valuation
Actuarial Value of Assets
Actuarial Accrued
Liability (AAL) Unfunded AAL
(UAAL)Funded Ratio Covered Payroll
UAAL as a Percentage of
Covered Payroll
Date ( a ) ( b ) ( b - a ) ( a / b ) ( c ) ( b - a ) / c )
July 1, 2009 - $ 92,634,783 $ 92,634,783 0.00% $ 198,691,532 46.62%July 1, 2011 - $ 55,421,239 $ 55,421,239 0.00% $ 183,870,217 30.14%July 1, 2013 - $ 49,869,358 $ 49,869,358 0.00% $ 201,051,981 24.80%
Note to Required Supplementary Information
Other Post - Employment Benefits (OPEB) Trend DataActuarial valuations of an ongoing plan involve estimates of the value of reported amounts and assumptions about the probability of occurrence of events far into the future. Examples include assumptions about future employment, mortality, and the healthcare cost trend. Amounts determined regarding the funded status of the plan and the annual required contributions of the employer are subject to continual revision as actual results are compared with past expectations and new estimates are made about the future. See assumptions below.
Actuarial Valuation Date Interest Rate
Payroll Increase
Participant Percentage
July 1, 2009 4.25 2.50% 55%
July 1, 2011 4.25 2.50% 55%
July 1, 2013 4.25 2.50% 55%
A-55

Montana State University(a component unit of the State of Montana)Unaudited Supplemental InformationAs of and for Each of the Years Ended June 30
Unaudited Supplemental InformationA-57 Montana State University‐All Campuses and AgenciesA-60 MSU BozemanA-62 Montana Agricultural Experiment StationA-63 MSU Extension ServiceA-64 MSU Fire Services Training SchoolA-65 MSU BillingsA-69 MSU NorthernA-70 Great Falls College Montana State University
A-56
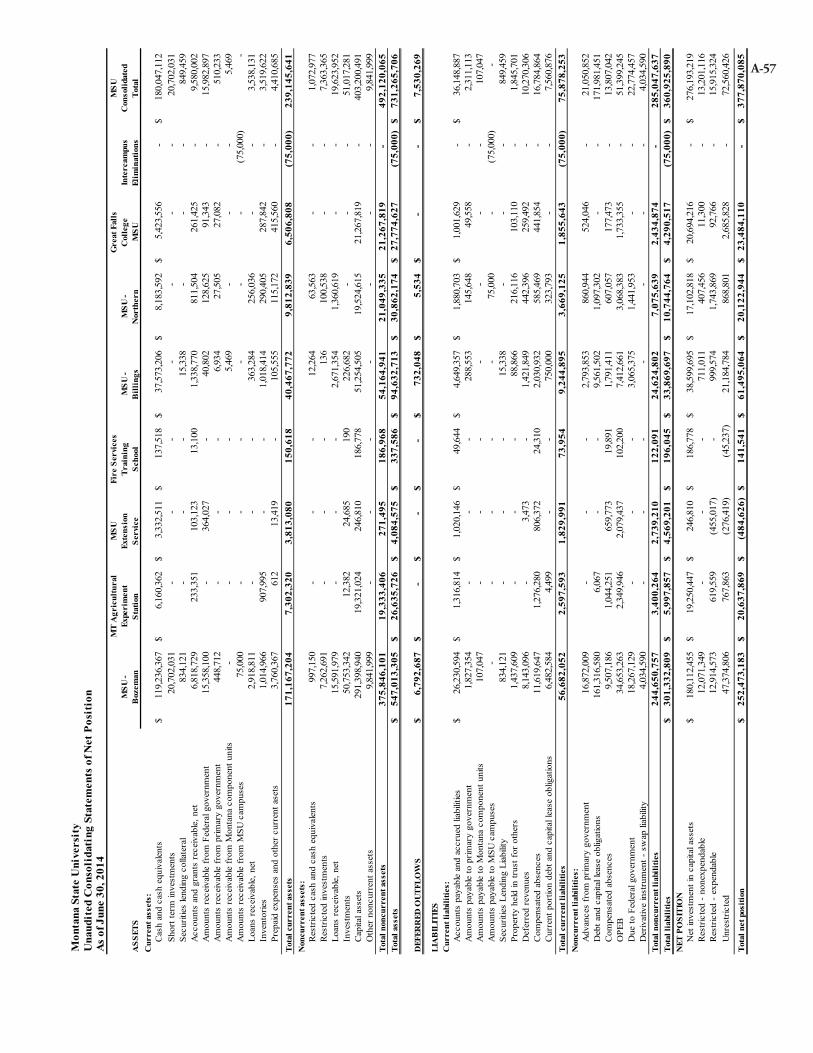
Mon
tana
Sta
te U
nive
rsit
yU
naud
ited
Con
soli
dati
ng S
tate
men
ts o
f Net
Pos
itio
nA
s of
Jun
e 30
, 201
4M
T A
gric
ultu
ral
MSU
Fire
Ser
vice
sG
reat
Fal
lsM
SUM
SU -
Expe
rim
ent
Exte
nsio
nTr
aini
ngM
SU -
MSU
-C
olle
geIn
terc
ampu
sC
onso
lidat
edA
SSET
SB
ozem
anSt
atio
nSe
rvic
eSc
hool
Bill
ings
Nor
ther
nM
SUEl
imin
atio
nsTo
tal
Cur
rent
ass
ets:
Cas
h an
d ca
sh e
quiv
alen
ts11
9,23
6,36
7$
6,16
0,36
2$
3,33
2,51
1$
137,
518
$37
,573
,206
$8,
183,
592
$5,
423,
556
$-
180,
047,
112
$Sh
ort t
erm
inve
stm
ents
20,7
02,0
31-
--
--
--
20,7
02,0
31Se
curit
ies
lend
ing
colla
tera
l83
4,12
1-
--
15,3
38-
--
849,
459
Acc
ount
s an
d gr
ants
rec
eiva
ble,
net
6,81
8,72
923
3,35
110
3,12
313
,100
1,33
8,77
081
1,50
426
1,42
5-
9,58
0,00
2A
mou
nts
rece
ivab
le f
rom
Fed
eral
gov
ernm
ent
15,3
58,1
00-
364,
027
-40
,802
128,
625
91,3
43-
15,9
82,8
97A
mou
nts
rece
ivab
le f
rom
prim
ary
gove
rnm
ent
448,
712
--
-6,
934
27,5
0527
,082
-51
0,23
3A
mou
nts
rece
ivab
le f
rom
Mon
tana
com
pone
nt u
nits
--
--
5,46
9-
--
5,46
9A
mou
nts
rece
ivab
le f
rom
MSU
cam
puse
s75
,000
--
--
--
(75,
000)
-Lo
ans
rece
ivab
le, n
et2,
918,
811
--
-36
3,28
425
6,03
6-
-3,
538,
131
Inve
ntor
ies
1,01
4,96
690
7,99
5-
-1,
018,
414
290,
405
287,
842
-3,
519,
622
Prep
aid
expe
nses
and
oth
er c
urre
nt a
sets
3,76
0,36
761
213
,419
-10
5,55
511
5,17
241
5,56
0-
4,41
0,68
5To
tal c
urre
nt a
sset
s17
1,16
7,20
47,
302,
320
3,81
3,08
015
0,61
840
,467
,772
9,81
2,83
96,
506,
808
(75,
000)
239,
145,
641
Non
curr
ent a
sset
s:R
estr
icte
d ca
sh a
nd c
ash
equi
vale
nts
997,
150
--
-12
,264
63,5
63-
-1,
072,
977
Res
tric
ted
inve
stm
ents
7,26
2,69
1-
--
136
100,
538
--
7,36
3,36
5Lo
ans
rece
ivab
le, n
et15
,591
,979
--
-2,
671,
354
1,36
0,61
9-
-19
,623
,952
Inve
stm
ents
50,7
53,3
4212
,382
24,6
8519
022
6,68
2-
--
51,0
17,2
81C
apita
l ass
ets
291,
398,
940
19,3
21,0
2424
6,81
018
6,77
851
,254
,505
19,5
24,6
1521
,267
,819
-40
3,20
0,49
1O
ther
non
curr
ent a
sset
s9,
841,
999
--
--
--
-9,
841,
999
Tota
l non
curr
ent a
sset
s37
5,84
6,10
119
,333
,406
271,
495
186,
968
54,1
64,9
4121
,049
,335
21,2
67,8
19-
492,
120,
065
Tota
l ass
ets
547,
013,
305
$26
,635
,726
$4,
084,
575
$33
7,58
6$
94,6
32,7
13$
30,8
62,1
74$
27,7
74,6
27$
(75,
000)
731,
265,
706
$
DEF
ERR
ED O
UTFL
OW
S6,
792,
687
$-
$-
$-
$73
2,04
8$
5,53
4$
-$
-7,
530,
269
$
LIA
BIL
ITIE
SC
urre
nt li
abili
ties:
Acc
ount
s pa
yabl
e an
d ac
crue
d lia
bilit
ies
26,2
30,5
94$
1,31
6,81
4$
1,02
0,14
6$
49,6
44$
4,64
9,35
7$
1,88
0,70
3$
1,00
1,62
9$
-36
,148
,887
$A
mou
nts
paya
ble
to p
rimar
y go
vern
men
t1,
827,
354
--
-28
8,55
314
5,64
849
,558
-2,
311,
113
Am
ount
s pa
yabl
e to
Mon
tana
com
pone
nt u
nits
107,
047
--
--
--
-10
7,04
7A
mou
nts
paya
ble
to M
SU c
ampu
ses
--
--
-75
,000
-(7
5,00
0)-
Secu
ritie
s Le
ndin
g Li
abili
ty83
4,12
1-
--
15,3
38-
--
849,
459
Prop
erty
hel
d in
trus
t for
oth
ers
1,43
7,60
9-
--
88,8
6621
6,11
610
3,11
0-
1,84
5,70
1D
efer
red
reve
nues
8,14
3,09
6-
3,47
3-
1,42
1,84
944
2,39
625
9,49
2-
10,2
70,3
06C
ompe
nsat
ed a
bsen
ces
11,6
19,6
471,
276,
280
806,
372
24,3
102,
030,
932
585,
469
441,
854
-16
,784
,864
Cur
rent
por
tion
debt
and
cap
ital l
ease
obl
igat
ions
6,48
2,58
44,
499
--
750,
000
323,
793
--
7,56
0,87
6To
tal c
urre
nt li
abili
ties
56,6
82,0
522,
597,
593
1,82
9,99
173
,954
9,24
4,89
53,
669,
125
1,85
5,64
3(7
5,00
0)75
,878
,253
Non
curr
ent l
iabi
litie
s:A
dvan
ces
from
prim
ary
gove
rnm
ent
16,8
72,0
09-
--
2,79
3,85
386
0,94
452
4,04
6-
21,0
50,8
52D
ebt a
nd c
apita
l lea
se o
blig
atio
ns16
1,31
6,58
06,
067
--
9,56
1,50
21,
097,
302
--
171,
981,
451
Com
pens
ated
abs
ence
s9,
507,
186
1,04
4,25
165
9,77
319
,891
1,79
1,41
160
7,05
717
7,47
3-
13,8
07,0
42O
PEB
34,6
53,2
632,
349,
946
2,07
9,43
710
2,20
07,
412,
661
3,06
8,38
31,
733,
355
-51
,399
,245
Due
to F
eder
al g
over
nmen
t 18
,267
,129
--
-3,
065,
375
1,44
1,95
3-
-22
,774
,457
Der
ivat
ive
inst
rum
ent -
sw
ap li
abili
ty4,
034,
590
--
--
--
-4,
034,
590
Tota
l non
curr
ent l
iabi
litie
s24
4,65
0,75
73,
400,
264
2,73
9,21
012
2,09
124
,624
,802
7,07
5,63
92,
434,
874
-28
5,04
7,63
7To
tal l
iabi
litie
s30
1,33
2,80
9$
5,99
7,85
7$
4,56
9,20
1$
196,
045
$33
,869
,697
$10
,744
,764
$4,
290,
517
$(7
5,00
0)36
0,92
5,89
0$
NET
PO
SITI
ON
Net
inve
stm
ent i
n ca
pita
l ass
ets
180,
112,
455
$19
,250
,447
$24
6,81
0$
186,
778
$38
,599
,695
$17
,102
,818
$20
,694
,216
$-
276,
193,
219
$R
estr
icte
d -
none
xpen
dabl
e12
,071
,349
--
-71
1,01
140
7,45
611
,300
-13
,201
,116
Res
tric
ted
- ex
pend
able
12,9
14,5
7361
9,55
9(4
55,0
17)
-99
9,57
41,
743,
869
92,7
66-
15,9
15,3
24U
nres
tric
ted
47,3
74,8
0676
7,86
3(2
76,4
19)
(45,
237)
21,1
84,7
8486
8,80
12,
685,
828
-72
,560
,426
Tota
l net
pos
ition
252,
473,
183
$20
,637
,869
$(4
84,6
26)
$14
1,54
1$
61,4
95,0
64$
20,1
22,9
44$
23,4
84,1
10$
-37
7,87
0,08
5$
A-57
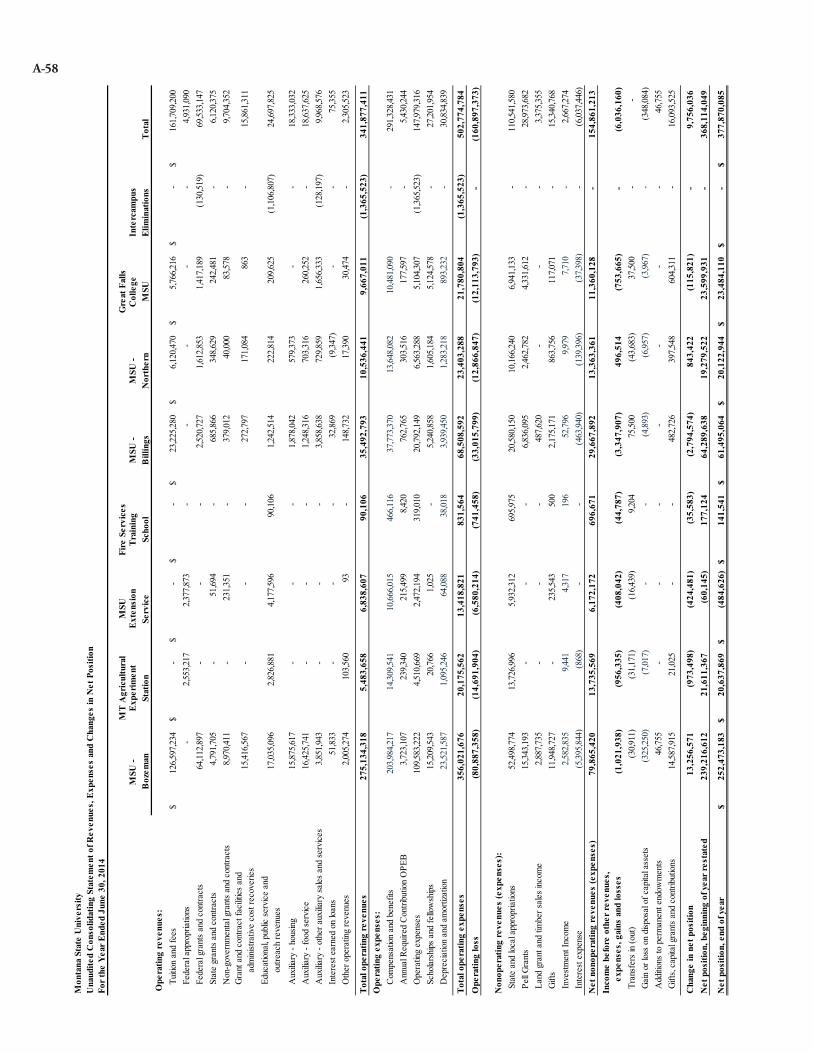
Mon
tana
Sta
te U
nive
rsity
Una
udite
d C
onso
lidat
ing
Stat
emen
t of R
even
ues,
Exp
ense
s an
d C
hang
es in
Net
Pos
ition
For t
he Y
ear E
nded
Jun
e 30
, 201
4
MT
Agr
icul
tura
lM
SUFi
re S
ervi
ces
Gre
at F
alls
MSU
- Ex
perim
ent
Exte
nsio
nTr
aini
ngM
SU -
MSU
-C
olle
geIn
terc
ampu
sB
ozem
anSt
atio
nSe
rvic
eSc
hool
Bill
ings
Nor
ther
nM
SUEl
imin
atio
nsTo
tal
Ope
ratin
g re
venu
es:
Tuiti
on a
nd fe
es12
6,59
7,23
4$
-$
-$
-$
23,2
25,2
80$
6,12
0,47
0$
5,76
6,21
6$
-$
161,
709,
200
$Fe
dera
l app
ropr
iatio
ns-
2,55
3,21
72,
377,
873
--
--
-4,
931,
090
Fede
ral g
rant
s an
d co
ntra
cts
64,1
12,8
97-
--
2,52
0,72
71,
612,
853
1,41
7,18
9(1
30,5
19)
69,5
33,1
47St
ate
gran
ts a
nd c
ontra
cts
4,79
1,70
5-
51,6
94-
685,
866
348,
629
242,
481
-6,
120,
375
Non
-gov
ernm
enta
l gra
nts
and
cont
ract
s8,
970,
411
-23
1,35
1-
379,
012
40,0
0083
,578
-9,
704,
352
Gra
nt a
nd c
ontra
ct fa
cilit
ies
and
a
dmin
istra
tive
cost
reco
verie
s15
,416
,567
--
-27
2,79
717
1,08
486
3-
15,8
61,3
11
Educ
atio
nal,
publ
ic s
ervi
ce a
nd
out
reac
h re
venu
es17
,035
,096
2,82
6,88
14,
177,
596
90,1
061,
242,
514
222,
814
209,
625
(1,1
06,8
07)
24,6
97,8
25
Aux
iliary
- ho
usin
g15
,875
,617
--
-1,
878,
042
579,
373
--
18,3
33,0
32A
uxilia
ry -
food
ser
vice
16,4
25,7
41-
--
1,24
8,31
670
3,31
626
0,25
2-
18,6
37,6
25A
uxilia
ry -
othe
r aux
iliary
sal
es a
nd s
ervi
ces
3,85
1,94
3-
--
3,85
8,63
872
9,85
91,
656,
333
(128
,197
)9,
968,
576
Inte
rest
ear
ned
on lo
ans
51,8
33-
--
32,8
69(9
,347
)-
-75
,355
Oth
er o
pera
ting
reve
nues
2,00
5,27
410
3,56
093
-14
8,73
217
,390
30,4
74-
2,30
5,52
3
Tota
l ope
ratin
g re
venu
es27
5,13
4,31
85,
483,
658
6,83
8,60
790
,106
35,4
92,7
9310
,536
,441
9,66
7,01
1(1
,365
,523
)34
1,87
7,41
1O
pera
ting
expe
nses
:C
ompe
nsat
ion
and
bene
fits
203,
984,
217
14,3
09,5
4110
,666
,015
466,
116
37,7
73,3
7013
,648
,082
10,4
81,0
90-
291,
328,
431
Ann
ual R
equi
red
Con
tribu
tion
OPE
B3,
723,
107
239,
340
215,
499
8,42
076
2,76
530
3,51
617
7,59
7-
5,43
0,24
4O
pera
ting
expe
nses
109,
583,
222
4,51
0,66
92,
472,
194
319,
010
20,7
92,1
496,
563,
288
5,10
4,30
7(1
,365
,523
)14
7,97
9,31
6Sc
hola
rshi
ps a
nd fe
llow
ship
s15
,209
,543
20,7
661,
025
-5,
240,
858
1,60
5,18
45,
124,
578
-27
,201
,954
Dep
reci
atio
n an
d am
ortiz
atio
n23
,521
,587
1,09
5,24
664
,088
38,0
183,
939,
450
1,28
3,21
889
3,23
2-
30,8
34,8
39
Tota
l ope
ratin
g ex
pens
es35
6,02
1,67
620
,175
,562
13,4
18,8
2183
1,56
468
,508
,592
23,4
03,2
8821
,780
,804
(1,3
65,5
23)
502,
774,
784
Ope
ratin
g lo
ss(8
0,88
7,35
8)(1
4,69
1,90
4)(6
,580
,214
)(7
41,4
58)
(33,
015,
799)
(12,
866,
847)
(12,
113,
793)
-(1
60,8
97,3
73)
Non
oper
atin
g re
venu
es (e
xpen
ses)
: S
tate
and
loca
l app
ropr
iatio
ns52
,498
,774
13,7
26,9
965,
932,
312
695,
975
20,5
80,1
5010
,166
,240
6,94
1,13
3-
110,
541,
580
Pel
l Gra
nts
15,3
43,1
93-
--
6,83
6,09
52,
462,
782
4,33
1,61
2-
28,9
73,6
82 L
and
gran
t and
tim
ber s
ales
inco
me
2,88
7,73
5-
--
487,
620
--
-3,
375,
355
Gift
s11
,948
,727
-23
5,54
350
02,
175,
171
863,
756
117,
071
-15
,340
,768
Inv
estm
ent I
ncom
e2,
582,
835
9,44
14,
317
196
52,7
969,
979
7,71
0-
2,66
7,27
4 I
nter
est e
xpen
se(5
,395
,844
)(8
68)
--
(463
,940
)(1
39,3
96)
(37,
398)
-(6
,037
,446
)N
et n
onop
erat
ing
reve
nues
(exp
ense
s)79
,865
,420
13,7
35,5
696,
172,
172
696,
671
29,6
67,8
9213
,363
,361
11,3
60,1
28-
154,
861,
213
Inco
me
befo
re o
ther
reve
nues
,
exp
ense
s, g
ains
and
loss
es(1
,021
,938
)(9
56,3
35)
(408
,042
)(4
4,78
7)(3
,347
,907
)49
6,51
4(7
53,6
65)
-(6
,036
,160
) T
rans
fers
in (o
ut)
(30,
911)
(31,
171)
(16,
439)
9,20
475
,500
(43,
683)
37,5
00-
- G
ain
or lo
ss o
n di
spos
al o
f cap
ital a
sset
s(3
25,2
50)
(7,0
17)
--
(4,8
93)
(6,9
57)
(3,9
67)
-(3
48,0
84)
Add
ition
s to
per
man
ent e
ndow
men
ts46
,755
--
--
--
-46
,755
Gift
s, ca
pita
l gra
nts
and
cont
ribut
ions
14,5
87,9
1521
,025
--
482,
726
397,
548
604,
311
-16
,093
,525
Cha
nge
in n
et p
ositi
on13
,256
,571
(973
,498
)(4
24,4
81)
(35,
583)
(2,7
94,5
74)
843,
422
(115
,821
)-
9,75
6,03
6N
et p
ositi
on, b
egin
ning
of y
ear r
esta
ted
239,
216,
612
21,6
11,3
67(6
0,14
5)17
7,12
464
,289
,638
19,2
79,5
2223
,599
,931
-36
8,11
4,04
9
Net
pos
ition
, end
of y
ear
252,
473,
183
$20
,637
,869
$(4
84,6
26)
$14
1,54
1$
61,4
95,0
64$
20,1
22,9
44$
23,4
84,1
10$
-$
377,
870,
085
$
A-58

Montana State UniversityUnaudited Supplemental InformationAs of and for the Year Ended June 30, 2014 (continued)
Montana State University—All Campuses and Agencies
OverviewThe University is accredited by the Northwest Association of Schools and Colleges and, in addition, by national professional accrediting organizations in teacher education, nursing, environmental health, engineering, engineering technologies, architecture, foods and nutrition, chemistry, art, music and business.
Enrollment
Tuition and FeesTuition and fees vary from campus to campus, and on each campus differ for residents and nonresidents and for undergraduate students and graduate students. The ranges of tuition and fees charged for full-time students during the 2013-2014 academic year, on a per-semester basis, were as follows:
Resident Undergraduate—Graduate
NonresidentUndergraduate (WUE)—
GraduateBozeman Campus $3,376 – $3,909 $4,778 – $10,891Billings Campus $2,872 – $3,312 $4,030 – $8,820Northern Campus (1) $2,633 – $3,363 $3,673– $9,283Great Falls Campus (2) $1,543– N/A $2,167 – N/A
(1) Average of lower and upper divisions.(2) Undergraduate program only.
Employees and Graduate AssistantsAs of Fall 2013, the University had 7,505 employees and utilized 666 graduate assistants as follows:
Bozeman Billings Northern Great Falls TotalFaculty/Professional 2,040 477 178 168 2,863State classified system 1,137 218 65 52 1,472Temporary hourly 281 70 41 17 409Students 2,284 300 119 58 2,761
Total employees 5,742 1,065 403 295 7,505Graduate assistants 644 22 - - 666
Nearly all faculty and classified employees at the University are members of and represented by various collective bargaining units. Currently, part-time employees and administrative professionals are not represented by any of thecollective bargaining units.
Annual Full Time Equivalent Students2014 2013 2012
Montana residents Undergraduate 13,789 13,871 14,001
Graduate 1,078 1,090 1,168Nonresidents
Undergraduate 3,735 3,503 3,108Graduate 334 334 264
Western Undergraduate Exchange 1,117 1,026 879Total 20,053 19,824 19,420
A-59

Montana State UniversityUnaudited Supplemental InformationAs of and for the Year Ended June 30, 2014 (continued)
MSU- Bozeman
Campus OverviewOn February 16, 1893, the Agricultural College of the State of Montana was founded in Bozeman as the state's land grant institution, and was the first unit of higher education of the of the state of Montana. Later renamed The Montana College of Agriculture and Mechanic Arts, the institution was popularly known as Montana Agricultural College, or MAC. By the 1920s, the institution's preferred name was Montana State College and so it remained until July 1, 1965, when, in recognition of the enormous advances in the College's commitment to scientific and humanistic research, the thirty-ninth legislative assembly of the State of Montana changed MSC's name to Montana State University. In 1994, the Board of Regents approved a restructuring plan that created a four-campus Montana State University and gave the Bozeman campus administrative oversight of the, now, MSU-Billings, Great Falls College MSU and MSU-Northern. Statutory authority for Montana State University- Bozeman is contained in Title 20, Chapter 25, Section 201 Montana Code Annotated.
The curricula offered are organized into eleven undergraduate colleges, including a workforce development program(Gallatin College), as well as a division providing for post-graduate advanced degrees, as follows: College of Agriculture; College of Education, Health and Human Development; College of Engineering; College of Letters and Science; College of Business; College of Nursing; College of Arts and Architecture; University Studies; the Graduate School; and the University Honors College. In addition to a degree in their regular majors, honors students who complete certain curriculum requirements also graduate with a University Honors degree.
The campus offers a curriculum leading to associates’ degrees in three areas, bachelor's degrees in over 50 fields, master's degrees in over 40 fields and doctorate degrees in nearly 20 fields, as well as maintaining an active role in research through individual departments and programs.
Situated within the City of Bozeman, the campus comprises approximately 1,781 acres and more than 40 classroom and administrative buildings, including a full-service library, ten residence halls, three cafeterias, an animal bioscience facility, historic Hamilton Hall, the recently-renovated Gaines Hall, a heavily used chemistry classroom building, the Museum of the Rockies, and numerous other classroom buildings and special laboratories. Afederally-funded $17 million renovation of one of the University’s most active research laboratory facilities was recently completed, as was a suite-style residence hall. Currently under construction is a building which will house the Jake Jabs College of Business and Entrepreneurship. The building and related programs were recently funded with a $25 million gift to the MSU Alumni Foundation. Also under construction is a 400-bed residence hall, to house the University’s growing freshman population.
As the state’s Land Grant institution, the University’s mission is to educate students, create knowledge and art, and serve communities by integrating learning, discovery and engagement. The Extended University provides educational opportunities to the citizens of the State by providing off-campus instruction in the form of courses, institutes and conferences for individuals not regularly enrolled at the University. Public service and outreach are central to the Bozeman campus’s mission. The campus is the hub of a network of extension offices operating in each of Montana’s 56 counties, seven Agricultural Research Centers, five extended nursing campuses, a widely utilized teaching and research museum, and a statewide public television network.
A-60
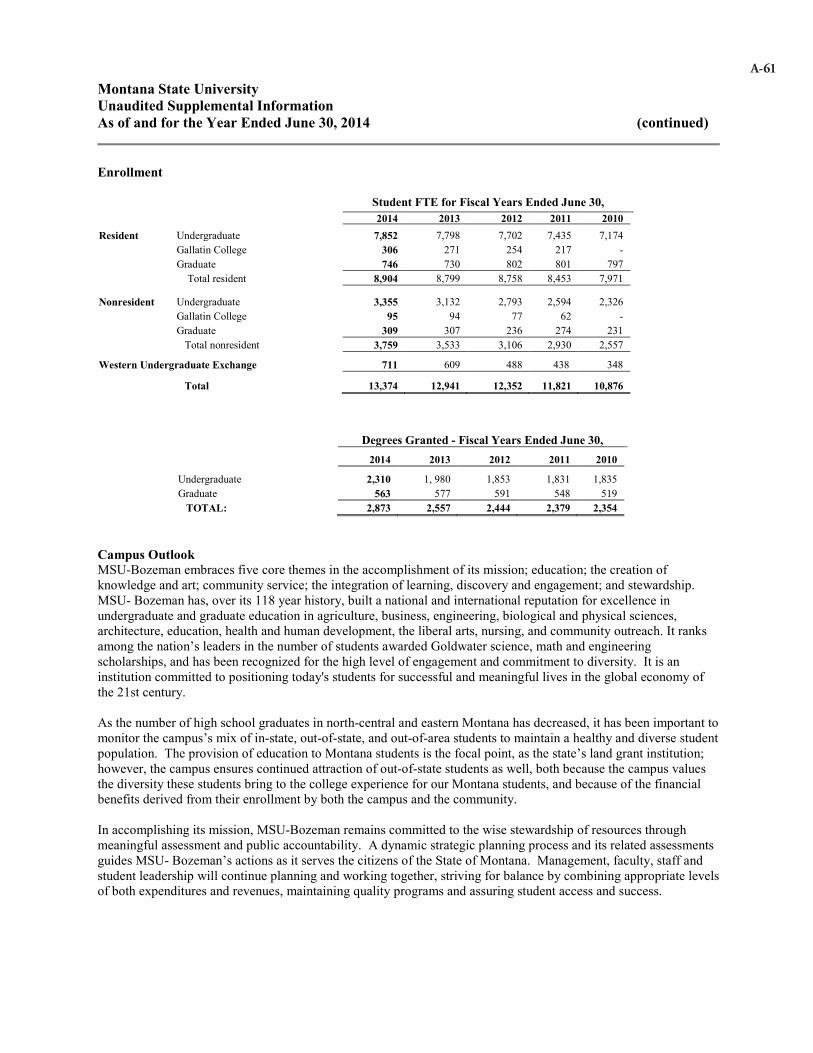
Montana State UniversityUnaudited Supplemental InformationAs of and for the Year Ended June 30, 2014 (continued)
Enrollment
Student FTE for Fiscal Years Ended June 30,2014 2013 2012 2011 2010
Resident Undergraduate 7,852 7,798 7,702 7,435 7,174Gallatin College 306 271 254 217 -Graduate 746 730 802 801 797
Total resident 8,904 8,799 8,758 8,453 7,971
Nonresident Undergraduate 3,355 3,132 2,793 2,594 2,326Gallatin College 95 94 77 62 -Graduate 309 307 236 274 231
Total nonresident 3,759 3,533 3,106 2,930 2,557
Western Undergraduate Exchange 711 609 488 438 348
Total 13,374 12,941 12,352 11,821 10,876
Degrees Granted - Fiscal Years Ended June 30,2014 2013 2012 2011 2010
Undergraduate 2,310 1, 980 1,853 1,831 1,835 Graduate 563 577 591 548 519 TOTAL: 2,873 2,557 2,444 2,379 2,354
Campus OutlookMSU-Bozeman embraces five core themes in the accomplishment of its mission; education; the creation of knowledge and art; community service; the integration of learning, discovery and engagement; and stewardship.MSU- Bozeman has, over its 118 year history, built a national and international reputation for excellence in undergraduate and graduate education in agriculture, business, engineering, biological and physical sciences, architecture, education, health and human development, the liberal arts, nursing, and community outreach. It ranks among the nation’s leaders in the number of students awarded Goldwater science, math and engineering scholarships, and has been recognized for the high level of engagement and commitment to diversity. It is an institution committed to positioning today's students for successful and meaningful lives in the global economy of the 21st century.
As the number of high school graduates in north-central and eastern Montana has decreased, it has been important to monitor the campus’s mix of in-state, out-of-state, and out-of-area students to maintain a healthy and diverse student population. The provision of education to Montana students is the focal point, as the state’s land grant institution; however, the campus ensures continued attraction of out-of-state students as well, both because the campus values the diversity these students bring to the college experience for our Montana students, and because of the financial benefits derived from their enrollment by both the campus and the community.
In accomplishing its mission, MSU-Bozeman remains committed to the wise stewardship of resources through meaningful assessment and public accountability. A dynamic strategic planning process and its related assessmentsguides MSU- Bozeman’s actions as it serves the citizens of the State of Montana. Management, faculty, staff and student leadership will continue planning and working together, striving for balance by combining appropriate levels of both expenditures and revenues, maintaining quality programs and assuring student access and success.
A-61
Montana State UniversityUnaudited Supplemental InformationAs of and for the Year Ended June 30, 2014 (continued)
Montana Agricultural Experiment Station (MAES)
Agency OverviewThe Hatch Act of 1887 created the State Agricultural Experiment Station system. This unique federal/state partnership, supporting agricultural and natural resource research and outreach, is a contract for maintaining viable agricultural and natural resource communities and an affordable supply of food and fiber for America.
In 1893, Montana endorsed the terms of the Morrill Act, creating the land-grant university and the designation of the Montana Agricultural Experiment Station (MAES). The MAES operates under these enabling Acts and subsequent federal and state legislation and amendments through the authority of the MAES Director as approved by USDA. The MAES houses people and programs at its research centers throughout Montana and at the Bozeman campus.
The research centers consist of: Northern Agricultural Research Center (ARC) at Havre, Northwestern ARC at Creston, Western ARC at Corvallis, Central ARC at Moccasin, Southern ARC at Huntley, Western Triangle ARC at Conrad, and Eastern ARC at Sidney. The research centers are located in environments that serve the specific needs of clientele in local areas consisting of multiple counties, as well as the broader needs of Montana’s agricultural and natural resource systems. The oldest research centers, Central and Western, were established in 1907 with the most recent, Western Triangle, established in 1978. The MAES also cooperates with the federal USDA ARS Fort Keogh Livestock and Range Research Laboratory at Miles City, a partnership that has been in place since 1924 and the USDA ARS research programs at Sidney.
The Bozeman MAES component includes the academic departments of Agricultural Economics and Economics, Animal and Range Sciences, Land Resources and Environmental Sciences, Plant Sciences and Plant Pathology, and Microbiology and Immunology, a collaboration between the MAES and the College of Letters and Science. The majority of the MAES faculty are located on the MSU-Bozeman campus, with split appointments between research,teaching and some extension service, which provides unique and high quality educational opportunities on- and off-campus that are appropriate for the region, and also appeal to students and clientele from around the world.
The MAES cooperates with state, regional and federal agencies on research to generate and disseminate superior knowledge and produce advances in technology that increase the competitiveness and profitability in agricultural and natural resource systems. The MAES aids agriculture in competing and succeeding in a global environment, preserving environmental quality, improving the quality of life, and adding value to state, regional and national resources within the global economy, as well as developing cutting-edge outreach and education programs.
HighlightsThe MAES and the College of Agriculture continue to be successful in securing and leveraging new extramural funding to support research programs. The College of Agriculture, which is collaboratively funded by the MAES, has been among the most productive of the academic disciplines in terms of sponsored program expenditures, at approximately $20 million annually. The departments of Microbiology and Immunology, Land Resources and Environmental Science, and Plant Science and Plant Pathology rank in the top five in a field of over 30 departments in terms of sponsored program expenditures. The MAES received funding during the recent legislative session to hire personnel with specialties in horticulture, animal science, wildlife habitat ecology, plant physiology and pulse crops. Funding agencies include national, regional and state from multiple sources. Research programs have impact in Montana, the region and nation.
OutlookThe MAES base-funded programs are financed by state (84%) and federal (16%) funding. Recent appropriationfunding will support the operations and maintenance of new buildings across the MAES system and maintain an internal equipment fund. The MAES foresees continued pressure to reduce agricultural research funding through the upcoming farm bill. Competitive grant programs at state, regional and national levels are also significantly constrained. These concerns occur concurrently with an increased need for agriculture to succeed as a primary economic engine for Montana.
A-62
Montana State UniversityUnaudited Supplemental InformationAs of and for the Year Ended June 30, 2014 (continued)
MSU Extension Service (ES)
Agency OverviewThe mission of Montana State University Extension is to improve the lives of Montana citizens by providing unbiased research-based education and information that integrates learning, discovery and engagement to strengthen the social, economic and environmental well-being of individuals, families, and communities. To meet the educational needs of Montanans, Extension coordinates educational and research resources in the region through campus-based specialists and 54 local Extension offices providing outreach to all 56 Montana counties and 7 reservations. Because Montana’s communities are as diverse as its landscape, the structure of our organization--MSU faculty living in Montana’s small towns and cities--ensures that programs are in tune with local issues and can adapt quickly to changing needs.
The unique funding structure of Montana State University Extension combines state general fund, Federal Smith-Lever and county resources. The state legislature appropriates general funds on a biennial basis. Extension agent salaries are paid from both Federal Smith-Lever and county funding sources, while Extension specialists are paid from state general funds. Extension funds the payroll benefit costs for all employees hired on state funding, while county agents’ benefits are paid from a blend of Federal Smith-Lever and state general fund dollars. Operational allocations are made to specialists based on a pre-established formula, and other operating dollars are allocated to support staff development, program development, personnel recruitment and general operating purposes.
To deliver the practical advice and information needed by Montana’s agricultural community, Extension taps into the resources of the entire university system. Research results from the ARCs and funding through USDA assist in developing programmatic responses. Primary concerns related to sustainability and profitability, natural resources and the environment, and technology transfer/value-added opportunities are addressed through outreach efforts across the state.
Extension’s Family & Consumer Sciences program area serves a wide variety of people and families, providing specialized programs including those targeted toward the elderly, children, single parents and stepfamilies. Topics include food and nutrition, housing, health, family issues, personal finance, environmental health and many other subjects useful to Montanans. One special program emphasizes nutrition education for families with limited resources.
Extension agents also work with Montana 4-H programs to serve youth throughout the state. In 2013, Montana 4-Hreached 23,948 Montana youth, ages 6-19. Approximately 50 percent of these youth are involved in year-long community clubs, while the rest are active through a variety of short term and special interest education programs. These youth are supported by 4,327 trained adult and youth volunteers who lead local programs and activities.
Local community and economic viability efforts continue to be an area of major emphasis for Extension's Community Development program. Extension continues to collaborate with a variety of state and federal agencies to provide local governance, strategic planning, and leadership development education for local communities and individuals. The MSU Extension – Local Government Center provides the only extensive education and training for Montana's elected and government officials at the local and county level.
Montana State University Extension’s strategic plan complements the university’s strategic plan by focusing on engagement within Montana communities and the integration of learning, discovery, and engagement. Montana State University Extension is successful throughout the state in meeting and excelling at this tripartite mission. Within Montana State University’s strategic plan, Montana State University Extension has a clear leadership role in increasing its capacity as a statewide resource for collaborating to respond to local needs and address the state's greatest challenges.
A-63

Montana State UniversityUnaudited Supplemental InformationAs of and for the Year Ended June 30, 2014 (continued)
Fire Services Training School (FSTS)
Agency OverviewThe Fire Services Training School (FSTS) is an educational outreach program of Montana State University’s Extension Service. The FSTS is authorized in 20-31-102, MCA. The purpose of the FSTS is to provide fire service personnel with professional training, identify new methods of fire prevention and suppression and disseminate information about them, provide a resource center for use by local fire services, provide testing and certification for personnel and apparatus, and coordinate fire services training in the state.
These goals are accomplished by building capacity in local governments for protecting citizens’ lives and property, and safeguarding the community tax base and infrastructure from harm caused by fires, accidents, injuries, hazardous materials incidents and other emergencies. FSTS trainers provide instruction and resources to local fire and rescue services and are strategically located in Cascade, Custer, Valley, Roosevelt, Flathead, Missoula, and Lewis & Clark counties.
The FSTS audience consists of 11,700 fire fighters in more than 400 organizations, 95 percent of whom are volunteers. The FSTS provides 70 percent of its services to all- volunteer fire companies, 24 percent to combination (with both paid and volunteer firefighters) fire companies, and 6 percent to all- paid fire companies.
The FSTS curriculum includes entry level recruit academies, hazardous materials and technical rescue courses, leadership and management, as well as tactical and strategic level incident operations courses. The FSTS continues to introduce new methods and technology into local fire service organizations, and has resulted in enhanced firefighter safety, a higher level of citizen protection, and significantly reduced costs for fire insurance premiums in many communities.
A-64

Montana State UniversityUnaudited Supplemental InformationAs of and for the Year Ended June 30, 2014 (continued)
MSU- Billings
Campus OverviewMontana State University Billings is a comprehensive public four-year higher education institution located in Montana's largest population center, whose faculty is actively engaged in teaching, research, creative endeavors and public service. MSU Billings is unique in that it is one of a select few higher education institutions that also boasts an embedded two-year community college.
The University opened in 1927 and was initially called Eastern Montana State Normal School at Billings and was established to prepare teachers for elementary schools in eastern Montana. MSU Billings has grown, with the city of Billings and Yellowstone County, into the major urban comprehensive higher education center of south central and eastern Montana. The University campus consists of four colleges: the College of Arts and Sciences, the College of Business, the College of Education and the College of Allied Health Professions. Seven miles west of the University campus sits City College at MSU Billings, which serves the comprehensive two-year mission of the university. MSU Billings offers a full complement of one- and two-year certificate programs, associate degrees, and bachelor and master degrees, as well as pre-professional academic offerings in nearly 100 academic areas; and features 24 programs that are completely available online. Several academic programs are unique to the Montana University System. The MSU Billings Extended Campus also maintains a presence in Downtown Billings through outreach education to underserved populations, GED preparation, summer programs for children and short-term training/conference space.
MSU Billings is accredited by the Northwest Commission on Colleges & Universities. The MSU Billings College of Business is accredited by the Association to Advance Collegiate Schools of Business, whose standards are used as the basis to evaluate a business school’s mission, operations, faculty qualifications and contributions, programs, and other critical areas. The MSU Billings College of Education is accredited by the National Council for the Accreditation of Teacher Education for preparing elementary and secondary teachers and school counselors through the Bachelor of Science and Master of Education degrees, and the Master of Science in Special Education degree. Disciplinary departments that have received national accreditation include the Music Department (National Association of Schools of Music), the Art Department (National Association of Schools of Art and Design), the Department of Health and Human Performance (Commission on Accreditation of Athletic Training Education), and the Department of Rehabilitation and Human Services (Council on Rehabilitation Education). City College programs are approved by the National Institute for Automotive Excellence and the Montana Board of Nursing.
Public service is integral to the mission of the University. Its two primary public service entities are KEMC/Yellowstone Public Radio and the Montana Center for Inclusive Education, a comprehensive education, rehabilitation, and diagnostic center serving Montanans with disabilities.
A-65

Montana State UniversityUnaudited Supplemental InformationAs of and for the Year Ended June 30, 2014 (continued)
Enrollment Student FTE for Fiscal Years Ended June 30,
2014 2013 2012 2011 2010Resident
Undergraduate 2,531 2,646 2,731 2,819 2,707City College 819 849 947 990 924Graduate 267 291 314 317 264
Total Resident 3,617 3,786 3,992 4,126 3,895
NonresidentUndergraduate 181 168 138 109 91City College 24 28 24 16 12Graduate 25 27 28 24 31
Total nonresident 230 223 190 149 134
Western Undergraduate ExchangeMain Campus 262 263 252 233 193City College 44 46 44 47 37
Total Western Undergraduate Exchange 306 309 296 280 230Total 4,153 4,318 4,478 4,555 4,259
Degrees Granted - Fiscal Years Ended June 30,2014 2013 2012 2011 2010
University Campus:Associate Degrees 33 25 32 40 32Bachelor’s Degrees 502 568 510 533 547Master’s Degrees 127 139 152 125 128Total University Campus 662 732 694 698 707
City College Campus:Certificates 26 26 36 29 28Associate Degrees 240 258 291 212 196Total City College 266 284 327 241 224
Grand Total Degrees 928 1,016 1,021 939 931
MSU Billings started the 2014-2015 academic year with 4,781 students, which is short of last fall’s opening enrollment of 4,969. This is the second consecutive year where enrollment has been below 5,000 students. However, MSU Billings still holds strong as the third largest higher education unit in Montana. While FTE enrollment growth was down for 2014-2015, the new freshman class is up by nearly three percent with a marked increase of those students coming from the three Billings high schools. Factors contributing to decreased student FTE in 2013 and 2014 include record graduating classes, declining high school enrollments in Montana, and a strong economic growth in eastern Montana. However the five-year trend points to continued interest in MSU Billings and its programs. The University is in the process of creating a new Student Success Committee to address such issues as student success, enrollment and retention.
Campus OutlookMSU Billings continues to serve our students and community with superior levels of excellence and efficiency. Base budgets have been reallocated to develop a student-centered learning environment using continuous assessment of learner growth, student outcomes and increased academic student support services. An Academic Program Prioritization Committee was created last year to evaluate every academic program from the ground up with the expectation that this evaluation process will result in a clearer understanding of which programs the university recognizes as imperative to our future. Conversely, the evaluation will also address programs that have outlived
A-66
Montana State UniversityUnaudited Supplemental InformationAs of and for the Year Ended June 30, 2014 (continued)
their centrality to our mission. The initial work of the committee has been completed and will be evaluated over the coming year.
MSU Billings has made a substantial investment in distance learning by developing full degree programs, and general education, online. This investment will continue in order to provide educational offerings to Montana citizens who are place bound or time bound. Increasing opportunities for students to participate in internships and cooperative education experiences continues to be a priority for the University.
Grants and research production continues. The work of two science faculty members on unique fungal research has led to the approval of MSU Billings’ first patent. This project is being done in collaboration with INBRE and MSU Bozeman. Three faculty members were recently inducted in to the National Academy of Inventors. The University received a $1.2 million grant from the National Science Foundation (NSF) for a NOYCE grant to prepare teachers for rural Montana. MSU Billings received a $1.5 million grant from the Dept. of Labor as part of a $25 million federal grant to Montana higher education units to train and prepare workers for jobs in energy and manufacturing industries. Other new grants include Montana Board of Research & Commercialization Technology and additional INBRE grants.
Thanks to additional funding by the Montana Legislature in support of veterans returning to school, the University used proceeds to hire a coordinator to assist veterans returning to the classroom and to renovate dedicated space for veterans to meet and study.
Because Billings is the primary healthcare center of the region, MSU Billings partnered with the healthcare industry to meet its educational needs and established the College of Allied Health Professions with key programs in athletic training, health and human performance and rehabilitation and human services. The College of Allied Health Professions continues growth in enrollments and graduations.
As part of the Governor’s initiative to improve Montana’s workforce, MSU Billings is working with local school districts to expand dual-enrollment programs whereby high school students can take college level courses taught at their high school and receive credit at both institutions. This gives students a chance to experience a college class and helps to open doors to further education and preparing them for college, as well as give them a head start when they do attend college. MSU Billings also offers a Connections program for high school students to participate in classes at the University.
The College of Business recently instituted a hall of fame to recognize our state’s most respected and influential leaders for their commitment and investment in our communities. The hall of fame is designed to honor, preserve and perpetuate the names and outstanding accomplishments of Montana business leaders who have enhanced the state’s business climate and made significant contributions to their communities, and who serve as role models for Montana’s business students.
The 2013 Montana Legislature appropriated $10 million to provide funds for the renovation and expansion of the existing outdated science facility. An additional $5 million needed for the project will be raised through fundraising efforts of the MSU Billings Foundation before construction begins. The renovated MSU Billings Yellowstone Hall will provide state-of-the-art facilities for both the College of Arts and Sciences and the College of Allied Health Professions.
City College at MSU Billings (formerly known as the College of Technology) has continued its transition to a true “community” college by expanding offerings and programs and focuses on the needs of two-year education in theBillings region.
MSU Billings student success continues with a Goldwater Scholarship recipient in 2014, the GNAC Female Athlete of the Year, and SkillsUSA and American Indian Business Leaders national competition winners to name a few.
A-67

Montana State UniversityUnaudited Supplemental InformationAs of and for the Year Ended June 30, 2014 (continued)
Support for the University continues to be strong. The MSU Billings Foundation Opportunity Campaign for MSU Billings Scholarships raised over $7.2 million in gifts and pledges, exceeding the original $6 million goal. The Foundation distributed $1.4 million in scholarships in FY14.
A-68
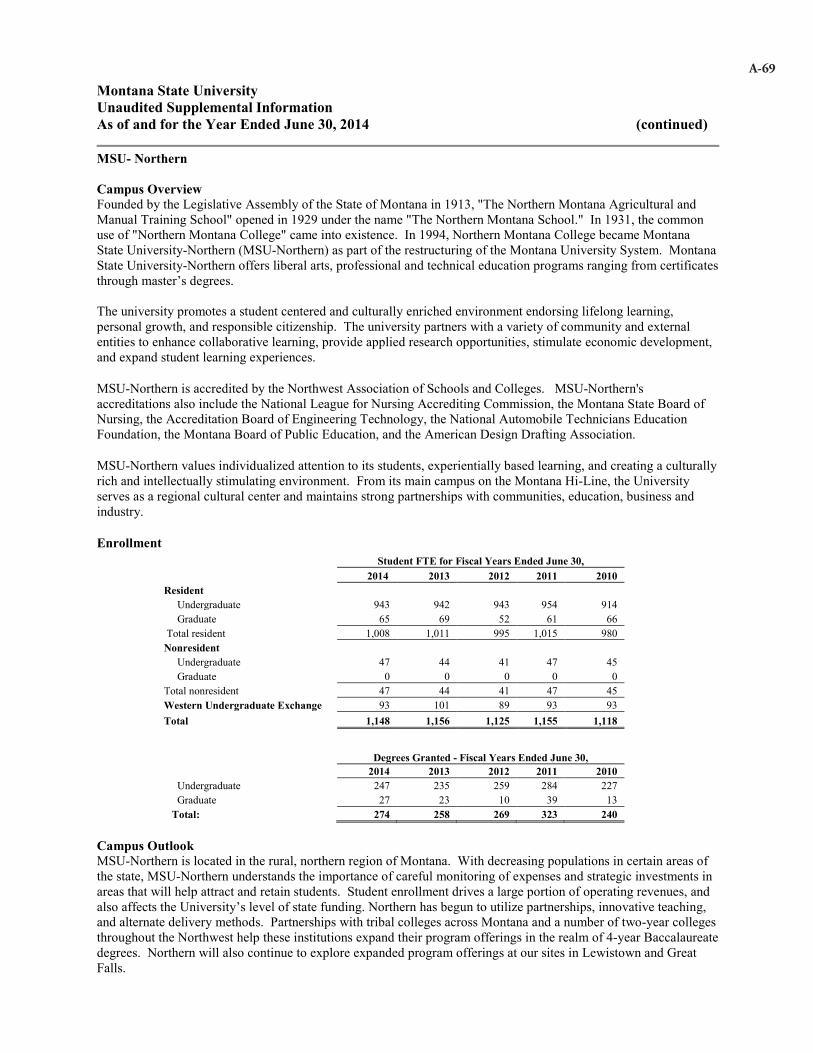
Montana State UniversityUnaudited Supplemental InformationAs of and for the Year Ended June 30, 2014 (continued)
MSU- Northern
Campus OverviewFounded by the Legislative Assembly of the State of Montana in 1913, "The Northern Montana Agricultural and Manual Training School" opened in 1929 under the name "The Northern Montana School." In 1931, the commonuse of "Northern Montana College" came into existence. In 1994, Northern Montana College became Montana State University-Northern (MSU-Northern) as part of the restructuring of the Montana University System. Montana State University-Northern offers liberal arts, professional and technical education programs ranging from certificates through master’s degrees.
The university promotes a student centered and culturally enriched environment endorsing lifelong learning, personal growth, and responsible citizenship. The university partners with a variety of community and external entities to enhance collaborative learning, provide applied research opportunities, stimulate economic development, and expand student learning experiences.
MSU-Northern is accredited by the Northwest Association of Schools and Colleges. MSU-Northern's accreditations also include the National League for Nursing Accrediting Commission, the Montana State Board of Nursing, the Accreditation Board of Engineering Technology, the National Automobile Technicians Education Foundation, the Montana Board of Public Education, and the American Design Drafting Association.
MSU-Northern values individualized attention to its students, experientially based learning, and creating a culturally rich and intellectually stimulating environment. From its main campus on the Montana Hi-Line, the University serves as a regional cultural center and maintains strong partnerships with communities, education, business and industry.
EnrollmentStudent FTE for Fiscal Years Ended June 30,
2014 2013 2012 2011 2010Resident Undergraduate 943 942 943 954 914 Graduate 65 69 52 61 66Total resident 1,008 1,011 995 1,015 980
Nonresident Undergraduate 47 44 41 47 45 Graduate 0 0 0 0 0Total nonresident 47 44 41 47 45Western Undergraduate Exchange 93 101 89 93 93Total 1,148 1,156 1,125 1,155 1,118
Degrees Granted - Fiscal Years Ended June 30, 2014 2013 2012 2011 2010
Undergraduate 247 235 259 284 227 Graduate 27 23 10 39 13
Total: 274 258 269 323 240
Campus OutlookMSU-Northern is located in the rural, northern region of Montana. With decreasing populations in certain areas of the state, MSU-Northern understands the importance of careful monitoring of expenses and strategic investments in areas that will help attract and retain students. Student enrollment drives a large portion of operating revenues, and also affects the University’s level of state funding. Northern has begun to utilize partnerships, innovative teaching, and alternate delivery methods. Partnerships with tribal colleges across Montana and a number of two-year colleges throughout the Northwest help these institutions expand their program offerings in the realm of 4-year Baccalaureate degrees. Northern will also continue to explore expanded program offerings at our sites in Lewistown and Great Falls.
A-69
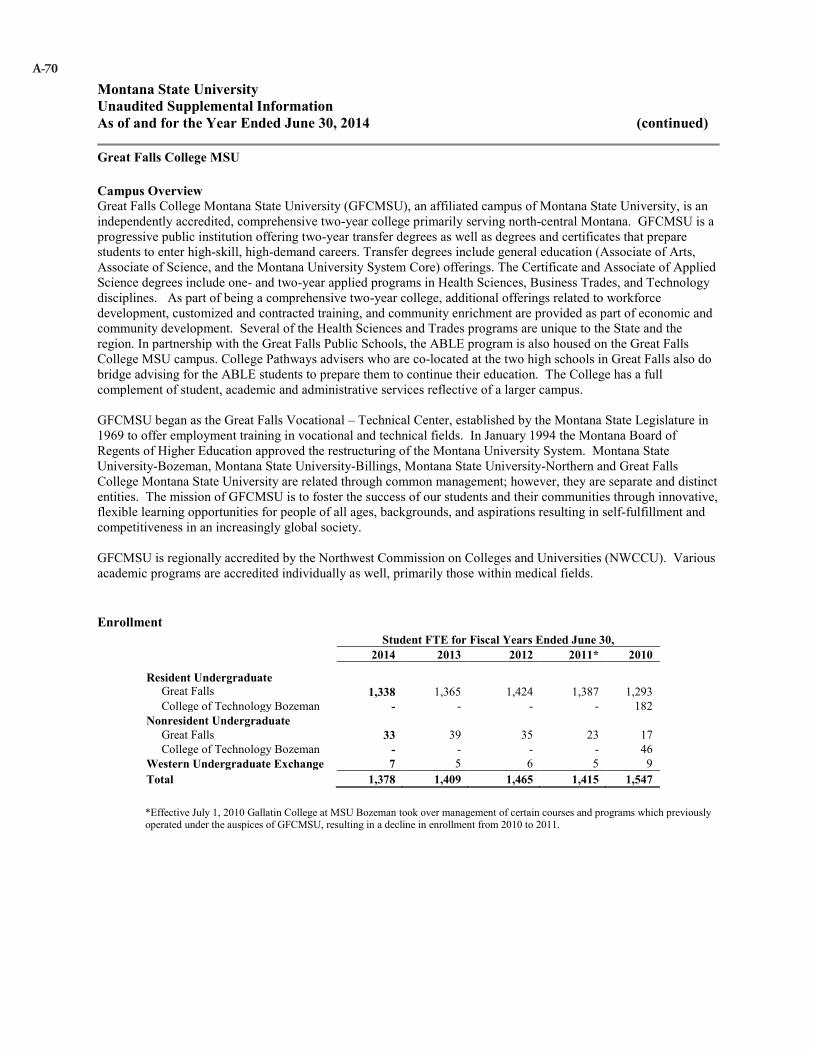
Montana State UniversityUnaudited Supplemental InformationAs of and for the Year Ended June 30, 2014 (continued)
Great Falls College MSU
Campus OverviewGreat Falls College Montana State University (GFCMSU), an affiliated campus of Montana State University, is an independently accredited, comprehensive two-year college primarily serving north-central Montana. GFCMSU is a progressive public institution offering two-year transfer degrees as well as degrees and certificates that prepare students to enter high-skill, high-demand careers. Transfer degrees include general education (Associate of Arts, Associate of Science, and the Montana University System Core) offerings. The Certificate and Associate of Applied Science degrees include one- and two-year applied programs in Health Sciences, Business Trades, and Technology disciplines. As part of being a comprehensive two-year college, additional offerings related to workforce development, customized and contracted training, and community enrichment are provided as part of economic and community development. Several of the Health Sciences and Trades programs are unique to the State and the region. In partnership with the Great Falls Public Schools, the ABLE program is also housed on the Great Falls College MSU campus. College Pathways advisers who are co-located at the two high schools in Great Falls also do bridge advising for the ABLE students to prepare them to continue their education. The College has a full complement of student, academic and administrative services reflective of a larger campus.
GFCMSU began as the Great Falls Vocational – Technical Center, established by the Montana State Legislature in 1969 to offer employment training in vocational and technical fields. In January 1994 the Montana Board of Regents of Higher Education approved the restructuring of the Montana University System. Montana State University-Bozeman, Montana State University-Billings, Montana State University-Northern and Great Falls College Montana State University are related through common management; however, they are separate and distinct entities. The mission of GFCMSU is to foster the success of our students and their communities through innovative, flexible learning opportunities for people of all ages, backgrounds, and aspirations resulting in self-fulfillment and competitiveness in an increasingly global society.
GFCMSU is regionally accredited by the Northwest Commission on Colleges and Universities (NWCCU). Various academic programs are accredited individually as well, primarily those within medical fields.
EnrollmentStudent FTE for Fiscal Years Ended June 30,
2014 2013 2012 2011* 2010
Resident UndergraduateGreat Falls 1,338 1,365 1,424 1,387 1,293College of Technology Bozeman - - - - 182
Nonresident UndergraduateGreat Falls 33 39 35 23 17College of Technology Bozeman - - - - 46
Western Undergraduate Exchange 7 5 6 5 9Total 1,378 1,409 1,465 1,415 1,547
*Effective July 1, 2010 Gallatin College at MSU Bozeman took over management of certain courses and programs which previously operated under the auspices of GFCMSU, resulting in a decline in enrollment from 2010 to 2011.
A-70
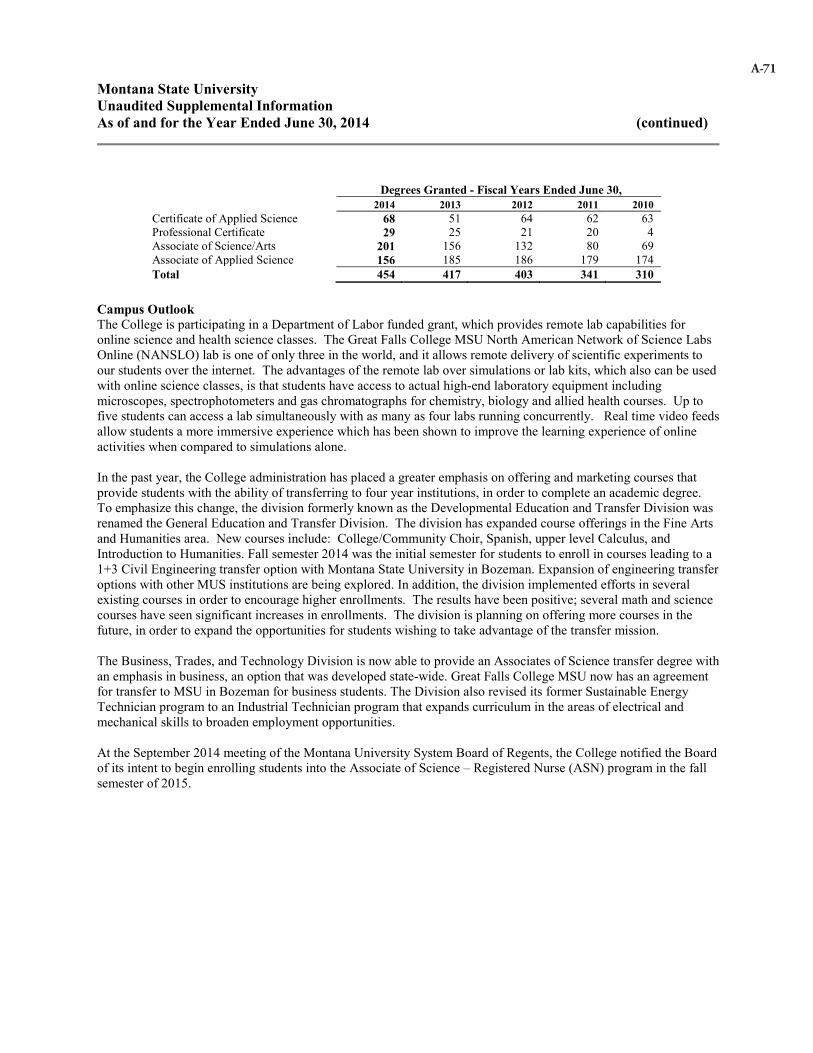
Montana State UniversityUnaudited Supplemental InformationAs of and for the Year Ended June 30, 2014 (continued)
Degrees Granted - Fiscal Years Ended June 30,2014 2013 2012 2011 2010
Certificate of Applied Science 68 51 64 62 63Professional Certificate 29 25 21 20 4Associate of Science/Arts 201 156 132 80 69Associate of Applied Science 156 185 186 179 174Total 454 417 403 341 310
Campus OutlookThe College is participating in a Department of Labor funded grant, which provides remote lab capabilities for online science and health science classes. The Great Falls College MSU North American Network of Science Labs Online (NANSLO) lab is one of only three in the world, and it allows remote delivery of scientific experiments to our students over the internet. The advantages of the remote lab over simulations or lab kits, which also can be used with online science classes, is that students have access to actual high-end laboratory equipment including microscopes, spectrophotometers and gas chromatographs for chemistry, biology and allied health courses. Up to five students can access a lab simultaneously with as many as four labs running concurrently. Real time video feeds allow students a more immersive experience which has been shown to improve the learning experience of online activities when compared to simulations alone.
In the past year, the College administration has placed a greater emphasis on offering and marketing courses that provide students with the ability of transferring to four year institutions, in order to complete an academic degree. To emphasize this change, the division formerly known as the Developmental Education and Transfer Division was renamed the General Education and Transfer Division. The division has expanded course offerings in the Fine Arts and Humanities area. New courses include: College/Community Choir, Spanish, upper level Calculus, and Introduction to Humanities. Fall semester 2014 was the initial semester for students to enroll in courses leading to a 1+3 Civil Engineering transfer option with Montana State University in Bozeman. Expansion of engineering transfer options with other MUS institutions are being explored. In addition, the division implemented efforts in several existing courses in order to encourage higher enrollments. The results have been positive; several math and science courses have seen significant increases in enrollments. The division is planning on offering more courses in the future, in order to expand the opportunities for students wishing to take advantage of the transfer mission.
The Business, Trades, and Technology Division is now able to provide an Associates of Science transfer degree with an emphasis in business, an option that was developed state-wide. Great Falls College MSU now has an agreement for transfer to MSU in Bozeman for business students. The Division also revised its former Sustainable Energy Technician program to an Industrial Technician program that expands curriculum in the areas of electrical and mechanical skills to broaden employment opportunities.
At the September 2014 meeting of the Montana University System Board of Regents, the College notified the Board of its intent to begin enrolling students into the Associate of Science – Registered Nurse (ASN) program in the fall semester of 2015.
A-71


Montana State UniverSity
UniverSity reSponSe


B-1