monitoring of the australian petroleum industry 2013 of the australian... · monitoring of the...
TRANSCRIPT

Monitoring of the Australian petroleum industry
Report of the ACCC into the prices, costs and profits of unleaded petrol in Australia
DECEMBER 2013
Mo
nito
ring
of th
e A
ustra
lian
pe
trole
um
ind
ustry: R
ep
ort o
f the A
CC
C in
to th
e p
rices, c
osts a
nd
pro
fits of u
nle
ad
ed
petro
l in A
ustra
lia D
ec
em
be
r 20
13

Monitoring of the Australian petroleum industry
Report of the ACCC into the prices, costs and profits of unleaded petrol in Australia
DECEMBER 2013

ISBN 978 1 921973 90 1
Australian Competition and Consumer Commission 23 Marcus Clarke Street, Canberra, Australian Capital Territory, 2601
© Commonwealth of Australia 2013
This work is copyright. In addition to any use permitted under the Copyright Act 1968, all material contained within this work is provided under a Creative Commons Attribution 3.0 Australia licence, with the exception of:• the Commonwealth Coat of Arms• the ACCC and AER logos• any illustration, diagram, photograph or graphic over which the Australian Competition and Consumer
Commission does not hold copyright, but which may be part of or contained within this publication.
The details of the relevant licence conditions are available on the Creative Commons website, as is the full legal code for the CC BY 3.0 AU licence.
Requests and inquiries concerning reproduction and rights should be addressed to the Director, Corporate Communications, ACCC, GPO Box 3131, Canberra ACT 2601, or [email protected].
Important notice
The information in this publication is for general guidance only. It does not constitute legal or other professional advice, and should not be relied on as a statement of the law in any jurisdiction. Because it is intended only as a general guide, it may contain generalisations. You should obtain professional advice if you have any specific concern.
The ACCC has made every reasonable effort to provide current and accurate information, but it does not make any guarantees regarding the accuracy, currency or completeness of that information.
Parties who wish to re-publish or otherwise use the information in this publication must check this information for currency and accuracy prior to publication. This should be done prior to each publication edition, as ACCC guidance and relevant transitional legislation frequently change. Any queries parties have should be addressed to the Director, Corporate Communications, ACCC, GPO Box 3131, Canberra ACT 2601, or [email protected].
ACCC 12/13_767
www.accc.gov.au

Contents
ACCC activities in the Australian petroleum industry 2012–13 vii
Key findings viii
Shortened terms xv
Glossary xviii
Summary xxiv
The ACCC and the petrol industry xxiv
ACCC action in retail petrol sector xxiv
Monitoring 2012−13: international factors and domestic retail price cycles drive price volatility xxv
Role of the ACCC lvi
1 Background and objectives 1
1.1 Background to the ACCC’s involvement in the petrol industry 1
1.2 The petrol monitoring report 1
1.3 Data collection 2
1.4 Data issues 3
1.5 Report outline 5
2 ACCC activities related to the petroleum industry 7
2.1 Introduction 7
2.2 Enforcement and compliance under the Competition and Consumer Act 8
2.3 Monitoring activities 12
2.4 Informing consumers 12
2.5 Engagement with key stakeholders 13
3 Developments in industry structure 15
3.1 Introduction 15
3.2 Crude oil production 16
3.3 Australian refining 18
3.4 Imports and exports of refined fuel 21
3.5 Major terminal infrastructure 23
3.6 Wholesaling 28
3.7 Retailing 30
3.8 Concluding observations 33
Monitoring of the Australian petroleum industry December 2013 iii

4 International context 35
4.1 Introduction 35
4.2 Crude oil prices 35
4.3 Demand for crude oil 39
4.4 Supply of crude oil 40
4.5 Refining capacity 43
4.6 Prospects for crude oil prices 45
5 Ethanol blended petrol 47
5.1 Introduction 47
5.2 Ethanol blended petrol and government policy 48
5.3 Sales of ethanol blended petrol 50
5.4 Retail sites selling E10 petrol 53
5.5 Price differentials 55
5.6 Ethanol supply and demand 57
5.7 Ethanol blended petrol: consumer and industry engagement 60
6 Wholesale prices 61
6.1 Introduction 61
6.2 The wholesale sector 61
6.3 Wholesale price benchmarks 62
6.4 Relationship between wholesale prices and the benchmarks 69
6.5 Comparing wholesale and retail prices 73
6.6 Observations on wholesale prices 75
7 Premium unleaded petrol 77
7.1 Introduction 77
7.2 Features of premium unleaded petrol 77
7.3 Retail premium unleaded petrol prices 78
7.4 Determinants of premium unleaded petrol prices 80
7.5 Supply of premium unleaded petrol 86
7.6 Demand for premium unleaded petrol 87
iv Monitoring of the Australian petroleum industry December 2013

8 Retail prices 93
8.1 Introduction 93
8.2 Retail petrol price movements 93
8.3 Determinants of petrol prices 96
8.4 Components of retail petrol prices 104
8.5 Gross indicative retail differences for petrol 106
8.6 Other grades of petrol 107
8.7 Diesel and LPG prices 108
8.8 Australian prices compared with other countries 112
9 Retail prices in regional locations 117
9.1 Introduction 117
9.2 Influences on prices in regional locations 118
9.3 Price movements can vary among regional locations 120
9.4 Petrol prices in regional locations 123
10 Retail pricing analysis 129
10.1 Introduction 129
10.2 Price cycles 130
10.3 Data on price cycles 131
10.4 Peaks and troughs by day of the week 133
10.5 Duration of price cycles 141
10.6 Consumer buying patterns during the price cycle 144
10.7 Gross indicative retail differences over the price cycle 149
10.8 Price cycle increases and public holidays 152
11 Financial performance of the consolidated downstream petroleum industry 155
11.1 Introduction 155
11.2 Overview of the financial performance of the downstream petroleum industry 156
11.3 Revenues, costs and profits in the downstream industry: all products 158
11.4 Revenues, costs and profits in the downstream industry: petrol products 161
11.5 Profits by sector: all products 163
11.6 Profits by sector: petrol products 164
11.7 Methodology note for assessing profitability in the Australian downstream petroleum industry 165
Monitoring of the Australian petroleum industry December 2013 v
12 Financial performance of the refinery, total supply, wholesale and retail sectors 169
12.1 Introduction 170
12.2 Overview of financial performance in the refinery, total supply, wholesale and retail sectors 171
12.3 Refinery sector: revenues, costs and profits for all products 172
12.4 Refinery sector: revenues, costs and profits, petrol products 176
12.5 Total supply sector 178
12.6 Total supply sector: revenues, costs and profits, all products 179
12.7 Total supply sector: revenues, costs and profits, petrol products 182
12.8 Total supply sector: foreign exchange gains and losses 183
12.9 Wholesale sector 184
12.10 Wholesale sector: revenues, costs and profits, all products 184
12.11 Wholesale sector: revenues, costs and profits, petrol products 188
12.12 Retail sector 190
12.13 Retail sector: revenues, costs and profits 191
12.14 Retail sector: revenues, costs and profits, petrol products 195
12.15 Retail sector: the importance of convenience store sales 197
12.16 Methodology note 199
Appendix A: Minister’s Direction 201
Appendix B: Major infrastructure schematics 202
Appendix C: Major Australian terminals 206
Appendix D: E10 price monitoring 210
Appendix E: Gross indicative retail differences 217
Appendix F: Annual retail fuel prices in all monitored locations 223
Appendix G: Petrol price cycles and public holidays in the five largest cities 227
ACCC contacts 233
vi Monitoring of the Australian petroleum industry December 2013

ACCC activities in the Australian petroleum industry 2012–13
Role of ACCCPetrol prices in Australia are determined by the market and fluctuate depending on the prices that are set by individual retailers. The ACCC has no role in setting fuel prices.
One of the areas of concern to consumers is the level of competition in local and national fuel markets. Where there is evidence of anti-competitive conduct, these issues are dealt with through enforcement of the Competition and Consumer Act 2010 (the Act). The ACCC is responsible for enforcing the Act across the Australian economy, including the fuel industry. The ACCC’s roles in relation to the fuel industry, apart from its monitoring role, include enforcement and compliance, mergers and acquisitions, authorisations and notifications, and administration of the Oilcode.
ACCC investigationsIn 2012–13 the ACCC considered three major fuel-related issues:
• ACCC investigation into price information sharing arrangements in the retail sector The ACCC continued its investigation into whether retail petrol price information sharing arrangements breach the Act by substantially lessening price competition in petrol retailing to the detriment of consumers.
• ACCC investigation into shopper-docket discounting schemes The ACCC continued its investigation into the implications of shopper docket discount fuel offers by the major supermarkets which has raised concerns that the offers may substantially lessen competition in petrol retailing.
• ACCC review of sale of BP retail sites in South Australia to Peregrine Corporation In May 2013, Peregrine Corporation (which operates under the trading name of On The Run) advised the ACCC that it intended to acquire 25 of BP’s retail petrol sites in South Australia.
2012–13 Monitoring—retail petrol price volatilityRetail petrol prices continued to be a source of concern to Australian motorists during 2012–13. On average, however, price levels and volatility were comparable to 2011–12.
There are three main factors that affect the level and volatility of petrol prices at the pump:
• International factors—In the medium to long term, retail petrol prices are primarily driven by the level of and changes in international prices of refined petrol. Because international prices are denominated in US dollars, changes in the exchange rate between the Australian dollar and US dollar also affect prices.
• Excise and GST contributed 51 cents per litre, or around 36 per cent of average retail prices, in 2012–13.
• Price cycles—In the short term, the variability of prices associated with petrol price cycles in the large capital cities is an outcome of the profit-maximising pricing policies of the major retailers.
In assessing petrol price movements, the ACCC’s monitoring activities during 2012–13 encompassed:
• monitoring retail prices in capital cities against the relevant international benchmark prices
• monitoring retail prices in around 180 regional locations
• reporting on industry profits based on cost and revenue data provided by monitored companies.
Monitoring of the Australian petroleum industry December 2013 vii

Key findings
Australian retail petrol prices in 2012−13 were broadly comparable with 2011–12Average annual retail petrol prices in 2012−13 were slightly lower than average annual prices seen in 2011–12 but otherwise broadly in line with prices in the previous 12 months.
• the annual average retail price of regular unleaded petrol (RULP) in the five largest capital cities was 141.3 cents per litre (cpl), compared with 142.8 cpl in 2011–12
• price volatility in 2012−13 was similar to 2011−12—the range between the highest and lowest seven-day rolling average prices in 2012−13 was 23 cpl, compared with 22 cpl in 2011−12.
In the long run international market prices and domestic fuel taxes largely determine Australian petrol pricesOf the average annual price for the five largest capital cities in 2012−13 of 141.3 cpl:
• the international market price of refined petrol contributed 74.2 cpl (53 per cent)
• government taxes contributed 51.0 cpl (36 per cent). Government taxes consist of excise (fixed at 38.14 cpl) and GST (equivalent to 1/11 of the final retail price).
In 2012−13 average annual international prices of crude oil and refined petrol were among the highest on record, in both nominal and real terms.
Because international prices are expressed in USD, changes in the AUD–USD exchange rate also affect domestic retail prices.
Short run price volatility exacerbated by retail petrol price cyclesPetrol price cycles are still evident in many retail markets, particularly in the larger capital cities.
Petrol price cycles are not caused by changes in international benchmark prices or other costs. Rather, price cycles are an outcome of petrol retailers’ profit maximising pricing policies.
Consumers’ concerns with petrol price cycles are due to the large price increases that occur in a single day, and across most retail sites, on a regular basis.
The duration of price cycles in the eastern capital cities has increased from the regular weekly cycle seen several years ago. In 2013, the average length of petrol price cycles has increased to between 13 and 19 days on average.
In 2012–13 petrol prices were in line with previous year
Australian retail petrol prices largely reflect international factors and domestic taxes
Price cycles are still evident in Australia’s largest cities
viii Monitoring of the Australian petroleum industry December 2013

The lengthening and increasing variability of price cycles has made them less predictable and more difficult for consumers to take advantage of low points in the cycle.
ACCC investigation into price information sharingThe ACCC’s investigation into whether price information sharing arrangements in relation to the retail petrol sector may be in breach of the Competition and Consumer Act 2010 (the Act) is nearing completion and it is anticipated it will be finalised in the coming months. These arrangements allow for the private and very frequent exchange of comprehensive retail price information between the major petrol retailers. The ACCC is concerned that these arrangements may lessen price competition in petrol retailing to the detriment of consumers by reducing independent rivalry between the major petrol retailers in their setting of prices.
The ACCC has concluded its investigation of shopper docket discounting schemes in the retail sector
ACCC investigation into shopper-docket discounting schemesThe ACCC’s investigation into the competition implications of shopper docket discount fuel offers by the major supermarkets was completed in December 2013. This investigation, which had been on-going since early 2012, has raised competition concerns in relation to shopper docket fuel discount schemes, given the extended frequency, duration and size of shopper docket fuel discounts offered by the major supermarket chains. The investigation resulted in undertakings being given to the ACCC by both Coles Group Limited and Woolworths Limited that they would limit their shopper docket discounts.
Sale of BP retail sites to PeregrineIn May 2013, Peregrine Corporation (which operates under the trading name of On The Run) advised the ACCC that it intended to acquire 25 of BP’s company owned and operated retail petrol sites in South Australia, comprising all 16 of BP’s sites in Adelaide and nine sites in regional South Australia. Peregrine has acquired the nine regional sites from BP which were not subject to the clearance application. The ACCC is continuing to investigate whether the acquisition would be likely to have the effect of substantially lessening competition in the retail sale of fuel in Adelaide and South Australia.
The ACCC is progressing its investigation of the price information sharing arrangements in the retail sector
The ACCC has concluded its investigation of shopper docket discounting schemes in the retail sector
The ACCC is reviewing the proposed sale of BP’s retail sites in SA to On The Run
Monitoring of the Australian petroleum industry December 2013 ix

Australian post-tax retail prices are low by international standards Crude oil and refined petrol are both internationally traded commodities and their prices form the basis for the setting of retail prices in most countries.
Relatively low levels of taxation on petrol in Australia have resulted in Australian petrol prices being among the lowest in the OECD.1
Key international factors Imported fuel provides the marginal source of petrol supplies in Australia.
As such, the international benchmark price of imports forms the basis for retail prices in Australia. The price of Singapore Mogas 95 Unleaded (Mogas 95) is the most appropriate benchmark price for refined regular unleaded petrol sold to Australian motorists.
Over time, Australian retail petrol prices have tracked the price of Mogas 95 closely. Between 2002–03 and 2012−13, average annual retail prices of regular unleaded petrol (excluding taxes and subsidies) at Australia’s five largest capital cities have risen 113 per cent while the annual average price of Mogas 95 has risen 121 per cent (both in nominal terms).
The price of Mogas 95 is also linked to the price of crude oil as it is the major input into the production of refined petrol. Crude oil is an internationally traded commodity and its price is also determined by global demand and supply factors.
Through the effect crude oil has on international benchmark prices of refined petrol, it is also a key driver of the retail price of petrol in the long run.
Australian refineries generally pay a price for crude oil that is based on the price of Brent crude oil (a heavily traded crude oil marker) or Tapis crude oil (the crude oil marker that has typically been used in the Asia-Pacific region).
International crude oil pricesInternational crude oil prices were volatile during 2012−13, generally moving in phases corresponding with changes in sentiment regarding global economic conditions and other geo-political factors. In particular:
• geo-political concerns in the Middle East, particularly regarding Syria
• supply disruptions in the North Sea
• changing sentiment about economic recovery in the US
• changes in regional crude stockpile and seasonal demand.
1 Bureau of Resources and Energy Economics, (2013), Australian Petroleum Statistics, issue number 205, August 2013
Due to lower fuel taxes in Australia relative to other countries, Australian petrol prices are among the lowest in the OECD
Volatility again characterised crude oil prices in 2012–13
x Monitoring of the Australian petroleum industry December 2013

Crude oil prices during 2012−13 remained at historically high levels. Average annual crude oil prices in 2012−13 were among the highest on record.
Increasing reliance on crude oil produced from unconventional and more costly sources, including shale oil and tar sand deposits is likely to keep crude oil prices relatively high in the future as lower-cost traditional oil fields continue to be depleted. Crude oil prices could potentially increase as the world economy recovers.
ProfitsThe retail sector earned net profits of $534.9 million across all products and services in 2012−13, an increase of 18.9 per cent in real terms from 2011–12.
Retail profits2
Total profits in the retail sector have been on an upward trend since 2002–03, the first year for which the ACCC has collected data. This trend has been particularly strong since 2008−09, with total net profits increasing by around 114 per cent in real terms in the five years to 2012−13.
Petrol productsRetail net profits on petrol products (that is, on regular unleaded (RULP), premium unleaded (PULP) and ethanol blended petrol (EBP), and excluding convenience store sales) were $297.5 million in 2012−13, 21.8 per cent higher in real terms compared with 2011–12. In the last five years, petrol products’ net profits have increased more than three-fold in real terms.
Since 2008–09, unit net profits on petrol products in the retail sector have increased more than four-fold from 0.52 cpl to 2.36 cpl in 2012−13.
In terms of cents per litre of fuel sold, unit net profits on both PULP and RULP products have risen markedly in the last six years. In 2012−13 PULP products were a significant contributor to retail profits, earning similar total profits as RULP products on considerably smaller volumes. In 2012−13 unit net profits on PULP products in the retail sector were 3.69 cpl compared with 1.77 cpl for RULP products. Since 2007–08, unit net profits on PULP products in the retail sector have increased more than ten-fold compared with a three-fold increase in RULP unit net profits.
It is likely that the New South Wales (NSW) Government mandate on ethanol may be one of the factors promoting greater demand for and higher profits on PULP products. The NSW mandate, which requires a minimum of 6 per cent of total fuel sale volumes to be ethanol, may have contributed to an increase in demand for PULP by reducing supply of RULP in that state.
2 Retail profits on petrol products include subsidies from non-fuel businesses for costs associated with sales of discounted petrol.
Average crude oil prices in 2012–13 were among the highest ever
Profits in the downstream industry were higher in 2012–13
Monitoring of the Australian petroleum industry December 2013 xi

Convenience store salesPetrol retailers earned net profits of $205 million from convenience store sales in 2012−13, an increase of 17.1 per cent in real terms from the previous year. In the last seven years, convenience store sales have contributed on average around 39 per cent of total retail profits. Net profits on convenience store sales have increased consistently since 2006–07. In the last seven years convenience store profits have risen more than 140 per cent in real terms.
Total downstream industry profitsIn 2012−13 the broader downstream petroleum industry also recorded higher net profits than in 2011–12.
Net profits for all products in the downstream petroleum industry were around $775 million (or 0.86 cpl), compared with a net profit in real terms of $417 million (or 0.47 cpl) in 2011–12. The increase in profits in 2012−13 was due to smaller losses in refining and total supply and, as noted, strong growth in retail profits.
Net profits for petrol products across the entire downstream industry were $1010 million, or 2.72 cpl. This compares with a real loss of $9.7 million or –0.03 cpl in the previous year.
Refinery and total supply sector profitsThe refinery and total supply sectors made a net loss of $106.8 million and $623 million respectively, compared with net losses in 2011–12 in real terms of $609 million and $1.1 billion, respectively. Gains in valuations of inventory holdings are likely to have contributed to improved outcomes in these sectors in 2012−13.
The performances of the refinery and total supply sectors in 2012−13 continued the recent trend of low and variable profits in these sectors. Since 2008–09 the refinery sector has recorded average annual net losses of $153 million in real terms compared with average annual net profits in real terms of $1.3 billion from 2002–03 to 2007–08. The financial performance of the refinery and total supply sectors is influenced by the variability of international prices of crude oil and refined petrol and, increasingly, by competition from more efficient overseas refineries.
Wholesale sector profitsThe wholesale sector earned total net profits of $863 million across all products, down 22.2 per cent in real terms on the previous year.
Domestic refiningThe Australian refinery sector is facing a challenging future due to competitive pressure from large, low-cost Asian mega refineries.
With imports providing the marginal source of supply, prices in Australia are set with reference to import parity. As such, Australian refiners (and suppliers) have little scope to pass on costs that are out of line with international best practice. The emergence of more efficient and low-cost refineries in Asia
Australian refineries face a challenging future
xii Monitoring of the Australian petroleum industry December 2013

able to produce Australian standard fuel potentially available to independent importers, limits domestic refineries’ discretion over prices they charge to wholesalers.
The impact of competitive pressures from the availability of supplies from overseas refineries is evident from the recent closure of the Shell Clyde refinery, the announced closure of the Caltex Kurnell refinery and the announced sale of the Shell refinery in Geelong.
Independent importsImports by independent wholesalers continued to grow in 2012−13. Since 2007–08 independent imports have increased more than fivefold accounting for about 26 per cent of total imports in 2012−13, compared with 5 per cent in 2007–08.
The growth in independent imports has been encouraged by greater access to import terminals and continues to be underpinned by the ability to source fuel refined to Australian standards from overseas refineries.
Independent wholesalers/importers have now established a viable presence in the downstream petroleum industry. Their potential for further expansion continues to provide credible competitive discipline on the larger petrol companies. The ability of independent importers to source fuel from more efficient overseas refineries constrains local refiners to charge prices consistent with import parity prices.
During 2012−13, there were a number of developments in the structure of the wholesale sector, including two new entrants:
• Puma Energy acquired the businesses and distribution networks of Central Combined Group, Ausfuel and Neumann Petroleum
• Idemitsu Kosan acquired the business and distribution network of Freedom Fuels.
Regional pricesMotorists are concerned with retail prices in regional locations, which tend to be higher and less variable than prices in capital cities.
ACCC analysis of fuel prices in regional locations throughout Australia indicates that higher prices in regional areas are due to:
• the limited number of retail sites operating in a particular regional market—a lower number of retail sites may mean a lower level of local competition
• lower volumes of fuel sold (hence higher average costs)
• distance/location factors increasing costs
• lower convenience store sales (thus the need for greater margins on fuel).
Independent wholesalers/importers continue to provide an alternative source of fuel
Competition issues and structural factors largely account for higher prices in regional areas
Monitoring of the Australian petroleum industry December 2013 xiii

Also, in many regional locations there is a lag behind movements in prices in capital cities. This lag occurs because the turnover of petrol supplies in regional areas is generally lower than in capital cities.
The ACCC understands the concerns of motorists in regional locations and actively monitors petrol prices in around 180 locations throughout Australia and also analyses competition issues in those locations. The ACCC takes allegations of anti-competitive conduct seriously and it will not hesitate to take action to enforce the Act if there is evidence that a breach of the Act is likely to have occurred.
Changes in ownership of retail sites in regional locations can be scrutinised where there is evidence that the sale may result in a substantial lessening of competition in that market.
The ACCC welcomes any information or evidence that local businesses or the public have in relation to potential regional retail ownership changes that may result in increased concentration.
Ethanol—NSW mandate has affected fuel marketsSince its introduction in October 2007 the NSW mandate has had a significant impact on competition and consumers:
• the competitive dynamic among retailers has been affected by the reduced availability of RULP
• some motorists face reduced choice as those who cannot use EBP in their vehicles (or choose not to) have decided to use PULP because of the reduced availability of RULP
• higher prices for motorists who have decided to use the more expensive PULP in response to reduced availability of RULP.
The ACCC will investigate and take action through the courts where appropriate if there is evidence of anti-competitive behaviour in regional markets
Ethanol mandate has reduced consumer choice in NSW
xiv Monitoring of the Australian petroleum industry December 2013
Shortened terms
7-Eleven 7-Eleven Stores Pty Ltd
AUD Australian dollars
ABS Australian Bureau of Statistics
ACCC Australian Competition and Consumer Commission
AIP Australian Institute of Petroleum
APAC APAC biofuel consultants (a joint venture of EnergyQuest Pty Ltd and Ecco Consulting Pty Ltd)
APS Australian Petroleum Statistics
Ausfuel Ausfuel Group (now acquired by Puma Energy)
ASX Australian Securities Exchange
avg. average
bl barrel (equals 158.9873 litres)
BP BP Australia Pty Ltd
BREE Bureau of Resources and Energy Economics
CAD Canadian dollars
CBA Commonwealth Bank of Australia
CIA Central Intelligence Agency
Caltex Caltex Australia Ltd
Coles Express Coles Express Pty Ltd
Coogee Chemicals Coogee Chemicals Pty Ltd
cpl Australian cents per litre
E10 see EBP
E85 see EBP
EBIT earnings before interest and tax
EBP ethanol blended petroleum, of which E10 (regular unleaded petrol with 10 per cent ethanol) is a common blend. E85 is a petrol blend containing 70 per cent to 85 per cent ethanol.
EUR euros
excl. excluding
FCAI Federal Chamber of Automotive Industries
FOB free on board
FuelCC Fuel Consultative Committee
GIRDs gross indicative retail differences
GL gigalitres
GST goods and services tax
Gull Gull Petroleum Group (part of Ausfuel Group, now acquired by Puma Energy)
Monitoring of the Australian petroleum industry December 2013 xv

IEA International Energy Agency
Informed Sources Informed Sources (Australia) Pty Ltd
IPP import parity price/pricing
JTA joint terminal arrangement
JV joint venture
KBD thousand barrels per day
KL kilolitres (thousand litres)
LHS left-hand side
Liberty Liberty Oil Pty Ltd
LPG automotive liquefied petroleum gas
mbpd million barrels per day
MMA McLennan Magasanik Associates Pty Ltd
ML megalitre (million litres)
MOC market on close
Mobil Mobil Oil Australia Pty Ltd
mogas motor gasoline
MON motor octane number
MOPS Mean of Platts Singapore (refer to Platts in the glossary)
MTBE methyl tertiary butyl ether (a fuel additive and octane enhancer)
na not applicable
Neumann Neumann Petroleum Pty Ltd (now acquired by Puma Energy)
NZRC New Zealand Refining Company
OECD Organisation for Economic Co-operation and Development
On The Run retail trading name of Peregrine Corporation
OPEC Organisation of the Petroleum Exporting Countries
pa per annum
PSA Prices Surveillance Authority
PULP premium unleaded petrol
PUMA Puma Energy—subsidiary of Dutch-based commodities Trafigura Beheer BV—owns businesses in the wholesale and retail sectors of Australian downstream industry.
RBA Reserve Bank of Australia
RBOB Reformulated Gasoline Blendstocks for Oxygenate Blending
RET Department of Resources, Energy and Tourism (now Department of Industry)
RFS Renewable Fuels Scheme (United States)
RHS right-hand side
Rio Tinto Rio Tinto Ltd
RON research octane number
RULP regular unleaded petrol
xvi Monitoring of the Australian petroleum industry December 2013

Saudi CP Saudi contract price
SEWPaC Department of Sustainability, Environment, Water, Population and Communities (now Department of the Environment)
Shell Shell Company of Australia Ltd
SMP Sydney Metropolitan Pipeline Pty Ltd
Stolthaven Stolthaven Australia Pty Ltd
TGP terminal gate price
the Act Competition and Consumer Act 2010 (formerly the Trade Practices Act 1974)
Trafigura Trafigura Beheer BV—Dutch-based commodities trading firm which, through subsidiary Puma Energy, owns assets in the wholesale and retail sectors of the Australian downstream petroleum industry
United United Petroleum Pty Ltd
USD United States dollars
USD/bl United States dollars per barrel
US EIA United States Energy Information Administration
US FTC United States Federal Trade Commission
Vopak Vopak Terminals Australia Pty Ltd
Woolworths Woolworths Ltd
WSFR Worldscale flat rate
WTI West Texas Intermediate
Monitoring of the Australian petroleum industry December 2013 xvii

Glossary
2007 ACCC petrol inquiry report the report of the ACCC’s 2007 public inquiry into the price of unleaded petrol: Petrol prices and Australian consumers: Report of the ACCC inquiry into the price of unleaded petrol, December 2007.
2008 ACCC petrol monitoring report the ACCC’s 2008 petrol monitoring report, Monitoring of the Australian petroleum industry: Report of the ACCC into the prices, costs and profits of unleaded petrol in Australia, December 2008.
2009 ACCC petrol monitoring report the ACCC’s 2009 petrol monitoring report, Monitoring of the Australian petroleum industry: Report of the ACCC into the prices, costs and profits of unleaded petrol in Australia, December 2009.
2010 ACCC petrol monitoring report the ACCC’s 2010 petrol monitoring report, Monitoring of the Australian petroleum industry: Report of the ACCC into the prices, costs and profits of unleaded petrol in Australia, December 2010.
2011 ACCC petrol monitoring report the ACCC’s 2011 petrol monitoring report, Monitoring of the Australian petroleum industry: Report of the ACCC into the prices, costs and profits of unleaded petrol in Australia, December 2011.
2012 ACCC petrol monitoring report the ACCC’s 2012 petrol monitoring report, Monitoring of the Australian petroleum industry: Report of the ACCC into the prices, costs and profits of unleaded petrol in Australia, December 2012.
automotive fuel includes petrol, diesel and automotive LPG.
Alaska North Slope crude oil a crude oil used as the benchmark for the acquisition cost of composite crude oil for California refineries.
barrel a traditional measure used by the oil industry: one barrel is equivalent to 158.987 litres.
benchmark pricing the practice of pricing to an identified crude or product price; for instance, the Tapis crude oil pricing benchmark.
biodiesel a diesel fuel based on vegetable oil or animal fat, typically made in combination with alcohol.
Brent crude a type of oil sourced from the North Sea and usually refined in northwest Europe. The Brent crude oil marker, also known as Brent blend, London Brent and Brent petroleum, remains the major benchmark for other crude oils in Europe and Africa.
buy–sell arrangements arrangements between domestic refinery owners for the purchase and sale of petroleum products.
city–country differential the difference between the average country retail price of petrol and the average city retail price of petrol.
xviii Monitoring of the Australian petroleum industry December 2013

commission agent an arrangement whereby an agent receives a commission for selling a product owned by another; in the downstream petroleum sector a commission agent often operates a retail site owned by a petrol refiner or wholesaler.
Consumer Consultative Committee established in 2001 by the ACCC to provide a forum for consumer representatives and the ACCC to discuss and collaboratively address consumer protection issues.
crude oil a naturally occurring flammable liquid found in rock and other geological formations, consisting of hydrocarbons and other organic compounds. Common crude oil benchmarks include Tapis (Malaysia), which Australia has traditionally used as its benchmark, Brent (North Sea) and West Texas Intermediate (US).
diesel (automotive distillate) fuel designed to run in diesel engines, widely used in the mining and transport sectors, as well as in some passenger motor vehicles.
distributor a transport company that picks up petroleum products from refineries, terminals and depots for delivery to retailers and end users.
downstream the refining, importing, distribution and marketing of petroleum products.
Dubai crude a crude oil benchmark price used in New Zealand. A cheaper heavier crude oil sourced from the Middle East suited for the only refinery in New Zealand.
earnings before interest and tax (EBIT) a measure of a company’s profits that excludes interest and tax expenses.
EBIT margin EBIT divided by sales revenue.
EBP (ethanol blended petrol) unleaded petrol that includes a proportion of ethanol (for instance, E10 is an unleaded petrol that includes up to 10 per cent ethanol).
Edmonton Par crude oil spot price a benchmark for the price of crude oil in Canada.
Euro-Super 95 a RON 95 grade of petrol largely sold throughout European countries.
exclusive dealing a type of conduct prohibited in certain circumstances by section 47 of the Competition and Consumer Act 2010 which broadly speaking involves one trader imposing restrictions on another’s freedom to choose with whom, or in what or where it deals.
five largest cities Sydney, Melbourne, Brisbane, Perth and Adelaide.
fixed costs costs that do not vary with output.
free on board (FOB) arrangement whereby the seller pays for transportation of goods to the port of shipment, plus loading costs, with the buyer responsible for the cost of marine freight transport, insurance, unloading and transportation from the arrival port to the final destination.
fuel automotive, aviation, marine and other transport fuels, and non-transport fuels such as butane and heating oil.
Monitoring of the Australian petroleum industry December 2013 xix

Fuel Consultative Committee (FuelCC) Established in 2010 by the ACCC to provide a forum for the ACCC, the fuel industry and motoring organisations to discuss fuel related issues and to assist the ACCC in undertaking its role under the Act on issues related to competition and consumer protection in the fuel industry.
fuel quality premium additional price added to a price benchmark to reflect the higher quality of Australian-grade fuel relative to the Singapore benchmark price.
gantry a facility used to transfer fuel products from a refinery or terminal to trucks or rail tankers.
gas liquid petroleum gas or LPG, including automotive LPG.
gasoline crack the difference between the price of refined petrol and the price of a barrel of crude oil, adjusted for volume differences.
gross profit the difference between the revenue received from the sale of products and the cost of producing or purchasing them.
import parity pricing (IPP) the setting of prices of domestically refined petrol in the wholesale market at a price comparable to the cost of importing fuel into a given location in Australia.
import terminal a major terminal with a direct pipeline connection to a port—most fuel at import terminals is received via ship.
independent retailers retailers (owning single or multiple sites) other than supermarket retailers and refiner-marketers. Independent retailers can sell petrol under the brand name of one of the refiner-wholesalers or under their own brand name.
Informed Sources company that collects pricing information on various fuels and provides it to subscribers.
large independent chains companies—other than refiner-wholesalers and supermarket chains—that import, wholesale and/or retail fuel in Australia; these include Ausfuel and Neumann (now both owned by Puma Energy), United, Liberty, 7-Eleven and On The Run.
light, sweet crude crude oil with low viscosity (light) and relatively low levels of sulphur (sweet). These oils are preferred by refiners because of their ease of handling and relatively high yields of high-value products such as petrol, diesel and jet fuel.
major terminal a fuel storage terminal connected to a port or a refinery by one or more pipelines. There are two broad types of major terminals—import terminals and refinery-pipeline terminals.
marginal cost the additional cost to produce one extra unit of output.
Mean of Platts Singapore (MOPS) the average of prices reported by Platts for Singapore traded commodities, for instance MOPS 95. MOPS 95 is used as a benchmark for refined petrol in the South East Asia region.
xx Monitoring of the Australian petroleum industry December 2013

mogas motor gasoline (the commonly used international term for petrol). It is used in oil markets as the benchmark for unleaded petrol in the Asia-Pacific region, including Australia.
nameplate capacity the potential output of a refinery running at optimum utilisation.
New York Harbour conventional gasoline spot price
Platts established benchmark price for unleaded petrol in North America and Canada.
notification a process under the Competition and Consumer Act 2010 by which a person who engages in exclusive dealing conduct may obtain prior legal protection from the application of the Act for that conduct.
oil sands see tar sands
Oilcode a prescribed mandatory industry code of conduct under section 51AE of the Competition and Consumer Act 2010. It regulates the conduct of suppliers, distributors and retailers in the downstream petroleum industry.
other fuels includes kerosene, biodiesel, LPG, lead replacement and aviation fuels.
other oil-based products includes LPG, aviation fuels, industrial and marine fuels, heating oil, fuel oil, lubricant oils, greases, basestocks and bitumen.
petrol/petrol products unleaded petrol—includes RULP (RON 91), PULP (RON 95 and above) and EBP. The terms ‘unleaded petrol’ and ‘petrol’ are used interchangeably in this report.
petroleum products any oil-based products derived from crude oil, as it is processed in oil refineries.
Platts a provider of energy market information including price benchmarks for the oil, petrol and other energy markets.
Platts assessed price for MOPS the mean of the high and low components of a Platts assessment for oil cargoes loading from Singapore; a free on-board price for completed deals in a particular commodity, quoted in USD.
PULP premium unleaded petrol, such as RON 95 and above.
price support rebate provided to a petrol retailer to compensate for periods of price discounting.
RBOB Reformulated Gasoline Blendstocks for Oxygenate Blending
a wholesale price for a base gasoline in California designed to be blended with an oxygenate to comply with environmental regulations for finished reformulated gasoline.
refining the production of petroleum products from crude oil.
refiner margin the petroleum product revenues received by a company, less all costs for raw materials (crude oil, catalysts etc.), product input costs and processing costs per barrel of product sold.
refiner-marketer a company that refines, imports, wholesales and retails fuel. There are currently two refiner-marketers operating in Australia—BP and Caltex.
Monitoring of the Australian petroleum industry December 2013 xxi

refiner-wholesaler a company that refines, imports and wholesales fuel; in Australia these are BP, Caltex, Mobil and Shell.
refinery exchange arrangements between refiner-marketers before July 2002 for the swap of a volume of product in one location for an equivalent volume in another location where they did not operate a refinery.
refinery-pipeline terminal a major terminal with a direct or indirect pipeline connection to a refinery that supplies most of its fuel.
refinery products fuel and other oil-based products such as lubricants and bitumen.
regional centres and country towns around 180 regional centres and country towns which the ACCC monitors.
retail the sale of petroleum products to the public through retail sites.
retail margin the difference between the cost of acquiring a product from a wholesaler and the retail selling price of that product. Effectively the retailer’s gross margin.
return on assets net profit divided by total assets, expressed as a percentage, which shows how effectively a company’s assets are being used to generate profit.
return on capital employed net profit divided by the sum of total assets minus current liabilities and expressed as a percentage. This measure compares earnings with the capital invested in the company.
return on sales net profit divided by total sales, expressed as a percentage, which shows how much profit is being produced per dollar of sales.
RULP regular unleaded petrol—RON 91; includes low-aromatic unleaded petrol.
RON research octane number, a measure of the efficiency of petrol at resisting engine knocking. In Australia, grades of petrol typically include RON 91 (regular) and RON 95 and higher (premium grades).
Rotterdam (ARA) Platts established benchmark price for unleaded petrol in Europe.
shopper docket an offer to consumers to supply petrol or diesel at a reduced price if the consumer has spent a certain amount in one purchase on grocery goods or has acquired certain identified goods from a nominated supermarket or retailer.
smaller capital cities Darwin, Hobart and Canberra.
supermarket retailer supermarkets that sell fuel under their own name/brand.
Tapis crude a light, sweet crude oil from Malaysia; it is used in oil markets as the benchmark for crude oil in the Asia-Pacific region, which includes Australia.
terminal a storage facility from which fuel is received via ship and/or refinery and distributed to retailers, distributors and end users.
xxii Monitoring of the Australian petroleum industry December 2013

tar sands naturally occurring bitumen soaked sands that can be refined to produce a range of liquid hydrocarbons.
terminal gate price (TGP) price for a spot purchase of petrol from a terminal; used as a benchmark price; the TGP is the price a purchaser expects to pay, usually in cash, when they arrive at a wholesaler’s terminal wanting to purchase a tanker load of 30 000 litres of petrol.
terminal throughput the annual volume received and then distributed by a refinery or terminal via truck or rail gantry.
terminal turnover the number of times a terminal is effectively filled and emptied during a year (that is, annual throughput divided by physical capacity).
third line forcing a form of exclusive dealing conduct prohibited by section 47 of the CCA. It involves either a supply of goods or services, or a supply at a particular price, on the condition that the purchaser acquires goods or services from a particular third party, or a refusal to supply goods or services to the purchaser because the purchaser will not agree to acquire the goods or services from the particular third party.
tight oil/reserves a term used to describe oil embedded in low-permeable sandstone, carbonate, and shale rock.
total supply sector the fuel industry sector that imports and exports petroleum products, and purchases petroleum products from Australian refineries. This sector also imports crude oil for use by refineries.
unleaded petrol see ‘petrol’—the terms ‘unleaded petrol’ and ‘petrol’ are used interchangeably in this report.
vertical integration the undertaking by a single company of successive stages in the process of production and/or supply.
wholesale the sale and movement of petroleum products from a wholesaler to other wholesalers, to retailers or to end users such as transport, agricultural and mining companies.
West Texas Intermediate (WTI) a type of crude oil; also known as Texas Light Sweet. WTI crude is traded on the New York Mercantile Exchange. Prices have been affected by build-up of excess supplies as a result of infrastructure bottlenecks at the land-locked trading hub of Cushing, Oklahoma. As a result the price of WTI is no longer a useful indicator of world demand and supply conditions for crude oil.
Worldscale a provider of shipping freight price and other freight market information. Freight rates are quoted by ship and port combination. The freight rate for a given ship and port combination reflects market demand and the availability of shipping.
Monitoring of the Australian petroleum industry December 2013 xxiii

Summary
This is the sixth annual monitoring report by the ACCC into the prices, costs and profits of the Australian downstream petroleum industry. The following summary focuses on the major findings and issues that arose from the ACCC’s monitoring role and other activities undertaken in the petrol industry during 2012−13. More comprehensive analysis of each of the topics covered in this summary can be found in the relevant chapters of this report.
The ACCC and the petrol industryPetrol prices in Australia are determined by the market and fluctuate depending on the prices that are set by individual retailers. The ACCC has no role in setting fuel prices.
Retail petrol prices are a function of international prices, government taxes and costs and margins associated with refining/importing, storing, distributing and selling petrol to Australian motorists.
Through its monitoring reports, the ACCC enhances transparency of industry outcomes and raises public awareness of the factors that drive retail petrol prices.
However, through two important investigations during 2012−13, the ACCC has acted on matters with potential implications for retail petrol prices and businesses involved in the retail petrol sector.
ACCC action in retail petrol sector
Investigation into price information sharing arrangements in the petrol industryPetrol price sharing arrangements allow for the private and very frequent exchange of comprehensive price information between the major petrol retailers. The ACCC has been concerned for some time about the presence of price information sharing arrangements in relation to the retail petrol sector and their potential impact on competition. In particular, the ACCC is concerned that such arrangements may lessen price competition in petrol retailing to the detriment of consumers by reducing independent rivalry between the major petrol retailers in their setting of prices.
As such, in 2012 the ACCC announced an investigation into the competition effects of price information sharing arrangements in relation to the retail petrol sector. The ACCC investigation is nearing completion and it is anticipated it will be finalised in the coming months.
Investigation into shopper docket discounting schemesColes and Woolworths, the two major Australian supermarket chains, have operated shopper docket discounting schemes involving petrol for a number of years. In the past, other retailers such as BP, Caltex, United and other independent retailers have also conducted their own shopper docket discounting schemes.
Coles and Woolworths offer four cents per litre (cpl) discounts on petrol purchases when a minimum amount is spent on purchases at their supermarkets, typically $30. At various times over the years, the supermarkets have been offering discounts greater than four cpl. The ACCC has expressed significant and further concern about escalating shopper docket discounts which in some cases are reaching 45 cpl.
While the ACCC supports initiatives that aim to provide benefits to consumers, it is necessary to assess such schemes to consider their effect on competition and prices. Consequently, in 2012 the ACCC commenced an investigation into the effects of shopper docket discounting schemes on competition and consumer welfare. The ACCC’s investigation has raised competition concerns in relation to shopper docket fuel schemes, given the size, frequency and duration of the discounts offered by the major supermarket chains.
xxiv Monitoring of the Australian petroleum industry December 2013

The ACCC was concerned that offers by Coles or Woolworths of 8 cpl fuel discounts could have longer term effects on the structure of retail fuel markets and also were having short term effects of increasing the general pump prices in those markets.
The ACCC’s investigation was finalised in December 2013 following the ACCC’s acceptance of undertakings under section 87B of the Act from Coles Group Limited, Coles Supermarkets Australia Pty Limited, Eureka Operations Pty Ltd (Coles), and Woolworths Limited (Woolworths). The key aspects of the undertakings include:
• Coles and Woolworths may continue to offer fuel saving offers to their supermarket customers, but any discounts on fuel offered to supermarket customers from 1 January 2014 are not to exceed 4 cpl
• at their retail sites, Coles and Woolworths may still offer discounts on fuel (including discounts in excess of 4 cpl), but from 1 January 2014, all fuel discounts (including those offered by the supermarkets) must be funded from within their fuel retailing operations (including associated convenience stores and other activities at their retail sites).
Monitoring 2012−13: international factors and domestic retail price cycles drive price volatilityThe ACCC’s monitoring of the downstream petroleum industry during 2012−13 has shown that retail petrol prices continued to be characterised by volatility in the last 12 months.
There are two main factors that contribute to the volatility of petrol prices at the pump: international prices and, in most capital cities, petrol price cycles:
• In the medium to long term, retail petrol prices are primarily driven by the level of, and changes in, international prices of refined petrol. Because international benchmark prices are denominated in US dollars (USD), changes in the exchange rate between the Australian dollar (AUD) and the USD also affect prices.
• In the short term, the variability of prices in the large capital cities is mostly associated with retail petrol price cycles, which are the result of profit-maximising pricing policies of the major retailers.
In 2012−13 petrol prices were comparable with 2011–12In 2012−13, annual average retail prices of regular unleaded petrol (RULP) in real terms remained among the highest seen in Australia in recent years and slightly lower than the annual average retail price for 2011–12 (chart 1).
Monitoring of the Australian petroleum industry December 2013 xxv

Chart 1 Annual average RULP prices, in real terms: 1999–2000 to 2012−13
0
20
40
60
80
100
120
140
160
180
2012-132011-122010-112009-102008-092007-082006-072005-062004-052003-042002-032001-022000-011999-2000
cpl
2012
-13
2011
-12
2010
-11
2009
-10
2008
-09
2007
-08
2006
-07
2005
-06
2004
-05
2003
-04
2002
-03
2001
-02
2000
-01
1999
-200
0
Sources: ACCC calculations based on Informed Sources, Platts and RBA data; Australian Bureau of Statistics (ABS), 6401.0 Consumer Price Index, Australia, Table 1. CPI: All Groups, Index Numbers and Percentage Changes.
Note: Real values in 2012−13 dollars.
In other respects, retail petrol prices in 2012−13 were also broadly comparable to prices in 2011–12, with prices remaining within a similar range in both years:
• the annual average nominal retail price of RULP in the five largest capital cities in 2012−13 was 141.3 cpl, down 1.5 cpl on 142.8 cpl for 2011–12
• price volatility in 2012−13 was similar to 2011−12—the range between the highest and lowest seven-day rolling average prices in 2012−13 was 23 cpl, compared with 22 cpl in 2011–12.
In the long run movements in Australian retail petrol prices follow movements in international benchmark pricesThe main influence on retail prices continued to be the international price of refined petrol.
Chart 2 displays average daily retail prices in real terms in the five largest cities3 and the real price of the international refined petrol benchmark Singapore Mogas 95 Unleaded (Mogas 95) since July 2007 and clearly shows that retail prices have closely followed movements in Mogas 95 prices.
3 A seven-day rolling average price is the average of the current day’s price and the prices on the six previous days. In the case of retail prices it is the average of calendar days, but in the case of Mogas 95 it is the average of working days (i.e. Monday to Friday). The refiner-wholesalers use a rolling average for Mogas 95 prices when determining their wholesale prices.
xxvi Monitoring of the Australian petroleum industry December 2013

Chart 2 Daily retail RULP prices, adjusted retail RULP prices and Mogas 95 prices in real terms: 1 July 2007 to 30 September 2013
cpl
0
20
40
60
80
100
120
140
160
180
200
Sep–13Aug–13Jul–13Jun–13May–13Apr–13Mar–13Feb–13Jan–13Dec–12Nov–12Oct–12Sep–12Aug–12Jul–12Jun–12May–12Apr–12Mar–12Feb–12Jan–12Dec–11Nov–11Oct–11Sep–11Aug–11Jul–11Jun–11May–11Apr–11Mar–11Feb–11Jan–11Dec–10Nov–10Oct–10Sep–10Aug–10Jul–10Jun–10May–10Apr–10Mar–10Feb–10Jan–10Dec–09Nov–09Oct–09Sep–09Aug–09Jul–09Jun–09May–09Apr–09Mar–09Feb–09Jan–09Dec–08Nov–08Oct–08Sep–08Aug–08Jul–08Jun–08May–08Apr–08Mar–08Feb–08Jan–08Dec–07Nov–07Oct–07Sep–07Aug–07Jul–07
Sep–
13Ju
l–13
May
–13
Mar
–13
Jan–
13N
ov–1
2Se
p–12
Jul–
12M
ay–1
2M
ar–1
2Ja
n–12
Nov
–11
Sep–
11Ju
l–11
May
–11
Mar
–11
Jan–
11N
ov–1
0Se
p–10
Jul–
10M
ay–1
0M
ar–1
0Ja
n–10
Nov
–09
Sep–
09Ju
l–09
May
–09
Mar
–09
Jan–
09N
ov–0
8Se
p–08
Jul–
08M
ay–0
8M
ar–0
8Ja
n–08
Nov
–07
Sep–
07Ju
l–07
Adjusted retail petrol price (with excise and GST removed) —seven-day rolling average, five largest citiesRetail petrol price—seven-day rolling average, five largest citiesMogas 95—seven-day rolling average, lagged 10 days
Sources: ACCC calculations based on Informed Sources, Platts and RBA data; Australian Bureau of Statistics (ABS), 6401.0 Consumer Price Index, Australia, Table 1. CPI: All Groups, Index Numbers and Percentage Changes.
Note: Mogas 95 prices are lagged by 10 days as there is generally around a one to two-week lag between changes in international prices and changes in retail prices in the five largest cities. This is because of the averaging formula used by refiners in Australia when setting their wholesale prices and the lag between changes in wholesale prices and retail prices. Real values in June 2013 dollars.
Chart 2 shows not only that retail prices are strongly influenced by the level of and changes in international prices but also that government taxes represent a significant proportion of final retail prices.
Refined petrol is an internationally traded commodity whose price is established by global supply and demand factors. The international benchmark that is used as the basis for setting petrol prices varies across countries depending on their proximity to the world’s major trading regions. The Singapore Mogas 95 Unleaded4 price is the relevant international benchmark used for domestic pricing of RULP products in Australia. Singapore benchmark prices are used for pricing Australia’s unleaded petrol due to Singapore being one of the world’s most important trading and refining centres and because of its proximity to Australia.5
The international price of refined petrol and government taxes are the largest component of Australian retail petrol pricesThe significance of international benchmark prices and government taxes on domestic prices is further evident in chart 3 which shows that Mogas 95 is the largest component of the average final retail price paid by motorists during 2012−13. Mogas 95 accounts for around 53 per cent of the average annual retail price of petrol. Excise and taxes comprise around 36 per cent of the final retail price.
4 Mogas 95, or Motor Gasoline 95, refers to the price of unleaded petrol with a Research Octane Number (RON) of 95.
5 US Energy Information Administration (2013), Countries: Singapore, see: http://www.eia.gov/countries/analysisbriefs/Singapore/singapore.pdf—accessed 31 October 2013.
Monitoring of the Australian petroleum industry December 2013 xxvii

Chart 3 Total downstream components of the average annual retail RULP price of 141.3 cents per litre: five largest cities, 2012−13 (components are to scale)
Total downstream costs and margins(including storage, transport, wholesaleand retail) 16.10 cpl (11.39%)
Excise and Taxes51 cpl (36.09%)
Mogas 9574.20cpl (52.51%)
Sources: ACCC calculations based on Informed Sources, Platts and RBA and WA FuelWatch data, and information provided by monitored companies.
Note: Costs and margins include components for the quality premium, freight, wharfage and other wholesale/retail costs and margins. The net profit on RULP across Australia for all sectors of the downstream petroleum industry in 2012−13 was 0.73 cpl.
Short run price variability in large capital cities due to petrol price cyclesIn the short-term, petrol price cycles are a major source of price volatility in retail markets in the larger cities. Retail petrol price cycles have continued to occur in a number of Australian cities in 2012 and 2013.6 Many Australian motorists are often concerned with petrol price cycles, particularly at the high point of a cycle or when jumps of 20 cpl across most, if not all, outlets may occur.
Petrol price cycles do not occur in response to changes in international benchmark prices or other cost considerations. Rather, price cycles are the results of the profit-maximising pricing policies of petrol retailers.
The duration of price cycles over the past few years has tended to increase from the regular weekly cycles seen in most capital cities several years ago. In contrast, Perth has a regular seven-day cycle. In 2012, the average length of price cycles in Sydney, Melbourne, Brisbane and Adelaide increased from around seven days to around 14 days. During 2013, the average length of price cycles increased to between 13 days in Adelaide and 19 days in Sydney and Brisbane.
Although quite a number of consumers have traditionally taken advantage of the low point of a price cycle, the increasing length and variability of the cycle in Adelaide, Melbourne, Sydney and Brisbane has meant that consumers find it difficult to determine the days which have the lowest prices in a cycle.
However, consumers in Perth continue to have some certainty on when the cheapest day of the cycle occurs. For the past two years, the cheapest day in Perth has been on a Wednesday. Western Australia is the only state or territory to have fuel price regulations that require retail sites to keep
6 A petrol price cycle is a movement in price from a trough to a peak to a subsequent trough. See chart 10.1 in chapter 10. The ACCC defines a price cycle as having occurred when the increase in price from the trough to the peak is 3 per cent or more of the trough price, and the decrease in price to the subsequent trough is also 3 per cent or more of the initial trough price. A price cycle increase is the increase in price from the initial trough to the peak. Petrol price cycles are discussed in more detail in chapter 10.
xxviii Monitoring of the Australian petroleum industry December 2013

their prices constant over a 24-hour period. Further, there is a requirement that the price of each retail site be publicly available on the FuelWatch website.
Chart 4 shows daily average petrol prices over a four-week period during June 2013 and illustrates the price cycles that occurred during this period.
Chart 4 Daily average RULP prices in the five largest cities: 1 June 2013 to 30 June 2013
cpl
130
135
140
145
150
155
160
29 JUN22 JUN15 JUN8 JUN1 JUN
BrisbaneMelbourne PerthAdelaideSydney
Source: ACCC, based on Informed Sources data.
The general pricing behaviour in the retail sector is that one or two of the major retailers will substantially raise prices at several retail sites and wait for the market to respond. If other retailers respond to this move with similar increases, then the increased price spreads across the retail network. However, occasionally competitors do not respond to the price increase, or delay in responding, and retail prices remain low for a longer period of time.
Australian taxes are lower than most other countries so Australian petrol prices are among the lowest in the OECDAustralian retail petrol prices have remained relatively low when compared with other countries in the Organisation for Economic Co-operation and Development (OECD). Chart 5 provides a list of the OECD countries and their price of petrol per litre in the June quarter 2013.
Chart 5 shows that the Australian price per litre for petrol in the June quarter 2013 was the fourth lowest of any OECD country. Australia has had the fourth lowest prices among OECD countries in each year since 2007–08.
The main determinant of lower retail petrol prices in Australia is Australia’s relatively lower rate of taxation on fuel. In the June 2013 quarter, tax represented around 36 per cent of the retail price of petrol in Australia, compared with an OECD average of around 49 per cent. Tax as a percentage of the retail petrol price in OECD countries ranged from a high of around 59 per cent in the UK, Norway and the Netherlands to a low of around 14 per cent in the US and Mexico. When retail prices are assessed without the tax component, Australia ranks around the median of OECD countries (the red line in chart 5).
Monitoring of the Australian petroleum industry December 2013 xxix

Chart 5 Petrol prices and taxes in OECD countries: Australian cents per litre, June quarter 2013
0 25 50 75 100 125 150 175 200 225 250 275
Mexico
United States
Canada
Australia
Japan
Poland
New Zealand
Luxembourg
Korea
Austria
Czech Republic
Spain
Hungary
Switzerland
Slovak Republic
France
United Kingdom
Germany
Ireland
Portugal
Finland
Belgium
Sweden
Denmark
Greece
Netherlands
Italy
Norway
Turkey
cplTax component Average price less taxPrice less tax
Source: Bureau of Resources and Energy Economics, Australian Petroleum Statistics, Issue no 205, August 2013.
Note: The average petrol price less tax in OECD countries was 92.1 cpl in the June quarter 2013.
Care must be taken when making international comparisons as fuel quality standards (for example, octane rating and the content of MTBE and sulphur) for the most commonly used form of petrol in each market differ between countries.
Impact of international factors
The impact of AUD–USD exchange rate on retail petrol prices
International benchmark prices of refined petrol are denominated in USD. This means that the exchange rate of the local currency to the USD impacts on domestic retail prices. The strength of the AUD–USD exchange rate during most of the period during which the ACCC has monitored the petrol industry (July 2007 to July 2013) has meant lower retail prices in Australia than would otherwise have been the case.
xxx Monitoring of the Australian petroleum industry December 2013

As the Australian dollar was relatively strong throughout most of 2012−13, Australian motorists were somewhat protected from potentially higher petrol prices. However, since early May 2013, the AUD–USD exchange rate dropped below parity and reached a low of around USD 0.89 at the beginning of August 2013. Since then, the AUD–USD exchange rate increased by around USD 0.06 to around USD 0.95 in mid-September 2013, before ending the month at around USD 0.93.
The decrease in the value of the Australian dollar from early May 2013 by around 16 per cent meant that retail petrol prices in the September quarter 2013 were around 12 cpl higher than they otherwise would have been.
Chart 6 displays the impact of the AUD–USD exchange rate on nominal retail petrol prices from July 2007 to September 2013:
• the red line shows actual seven-day rolling average retail prices across the five largest cities
• the upper line displays what retail prices would have been if the AUD–USD exchange rate was held constant at the lowest daily exchange rate over this period, which was around USD 0.61
• the lower line shows what retail prices would have been if the AUD–USD exchange rate was held constant at the highest daily exchange rate over this period, at around USD 1.11.
It can be seen from chart 6 that during 2012−13:
• retail petrol prices were at their highest at the end of February 2013 and were around 151 cpl. The AUD–USD exchange rate was around USD 1.03 at this time. If the exchange rate had been at its six-year minimum level at this time (USD 0.61), retail prices would have been around 213 cpl (or 62 cpl higher).
• retail petrol prices were at their lowest in early July 2012 at around 128 cpl. The AUD–USD exchange rate was around USD 1.02 at this time. If the exchange rate had been at its six-year maximum level at this time (USD 1.11), retail prices would have been around 122 cpl (or 6 cpl lower).
• a strong AUD–USD exchange rate for most of 2012−13 protected consumers to a substantial degree from very high international refined petrol prices.
Monitoring of the Australian petroleum industry December 2013 xxxi

Chart 6 Seven-day rolling average retail RULP prices in the five largest cities—based on actual, minimum and maximum AUD–USD exchange rates—nominal: 1 July 2007 to 30 September 2013
cpl
70
90
110
130
150
170
190
210
230
Sep–13Aug–13Jul–13Jun–13May–13Apr–13Mar–13Feb–13Jan–13Dec–12Nov–12Oct–12Sep–12Aug–12Jul–12Jun–12May–12Apr–12Mar–12Feb–12Jan–12Dec–11Nov–11Oct–11Sep–11Aug–11Jul–11Jun–11May–11Apr–11Mar–11Feb–11Jan–11Dec–10Nov–10Oct–10Sep–10Aug–10Jul–10Jun–10May–10Apr–10Mar–10Feb–10Jan–10Dec–09Nov–09Oct–09Sep–09Aug–09Jul–09Jun–09May–09Apr–09Mar–09Feb–09Jan–09Dec–08Nov–08Oct–08Sep–08Aug–08Jul–08Jun–08May–08Apr–08Mar–08Feb–08Jan–08Dec–07Nov–07Oct–07Sep–07Aug–07Jul–07
Sep–
13Ju
l–13
May
–13
Mar
–13
Jan–
13N
ov–1
2Se
p–12
Jul–
12M
ay–1
2M
ar–1
2Ja
n–12
Nov
–11
Sep–
11Ju
l–11
May
–11
Mar
–11
Jan–
11N
ov–1
0Se
p–10
Jul–
10M
ay–1
0M
ar–1
0Ja
n–10
Nov
–09
Sep–
09Ju
l–09
May
–09
Mar
–09
Jan–
09N
ov–0
8Se
p–08
Jul–
08M
ay–0
8M
ar–0
8Ja
n–08
Nov
–07
Sep–
07Ju
l–07
Price range bound by highest and lowest exchange ratesActual seven-day rolling average retail prices
Sources: ACCC calculations based on Informed Sources, Platts and RBA data.
Australian retail petrol prices are also affected by world crude oil prices
Crude oil is the major input into the production of refined petrol and accounts for a significant proportion of total refinery costs. As such, world crude oil prices are a major influence on international benchmark prices of refined petrol and in turn on domestic retail prices.
There are a number of international benchmark prices of crude oil, known as crude oil markers, which are used for pricing purposes in the refined petrol markets. The two crude oil markers generally used in Australia are:
• Tapis crude oil, which is a common crude oil marker used in this region and is a Malaysian light sweet crude oil.
• Brent crude oil, which is a light sweet crude oil from the North Sea and is probably the most widely used crude oil marker on global markets.
Chart 7 shows that in the long run there are strong linkages between the prices of the Tapis and Brent crude oil markers and the price of the international refined petrol benchmark Mogas 95.
xxxii Monitoring of the Australian petroleum industry December 2013

Chart 7 Weekly average prices of Mogas 95 and Brent and Tapis crude oil, in real terms: 1 July 1993 to 30 June 2013
USD
per bl
0
20
40
60
80
100
120
140
160
180
07-Jun-1304-Jan-1306-Jul-1206-Jan-1201-Jul-1107-Jan-1102-Jul-1001-Jan-1003-Jul-0902-Jan-0904-Jul-0804-Jan-0806-Jul-0705-Jan-0707-Jul-0606-Jan-0601-Jul-0507-Jan-0502-Jul-0402-Jan-0404-Jul-0303-Jan-0305-Jul-0204-Jan-0206-Jul-0105-Jan-0107-Jul-0007-Jan-0002-Jul-9901-Jan-9903-Jul-9802-Jan-9804-Jul-9703-Jan-9705-Jul-9605-Jan-9607-Jul-9506-Jan-9501-Jul-9407-Jan-9402-Jul-93
07-J
un-1
304
-Jan
-13
06-J
ul-1
206
-Jan
-12
01-J
ul-1
107
-Jan
-11
02-J
ul-1
001
-Jan
-10
03-J
ul-0
902
-Jan
-09
04-J
ul-0
804
-Jan
-08
06-J
ul-0
705
-Jan
-07
07-J
ul-0
606
-Jan
-06
01-J
ul-0
507
-Jan
-05
02-J
ul-0
402
-Jan
-04
04-J
ul-0
303
-Jan
-03
05-J
ul-0
204
-Jan
-02
06-J
ul-0
105
-Jan
-01
07-J
ul-0
007
-Jan
-00
02-J
ul-9
901
-Jan
-99
03-J
ul-9
802
-Jan
-98
04-J
ul-9
703
-Jan
-97
05-J
ul-9
605
-Jan
-96
07-J
ul-9
506
-Jan
-95
01-J
ul-9
407
-Jan
-94
02-J
ul-9
3
TapisBrent Mogas 95
Sources: ACCC calculations based on Platts data; U.S. Department of Labor, Bureau of Labor Statistics, Consumer price index for all urban consumers, http://www.dlt.ri.gov/lmi/pdf/cpi.pdf, accessed 31 October 2013.
Note: Real values in 2012−13 dollars.
As is the case with refined petrol, crude oil is an internationally traded commodity with its own supply and demand characteristics. As such it is possible that from time to time movements of crude oil and refined petrol prices may not precisely mirror each other. Factors that impact on crude oil markets include the levels and sudden changes of economic growth, regional conflicts, levels of inventories, extreme climatic conditions and general confidence levels.
Chart 8 shows that from mid-May to August 2013 there was a divergence in general trends of crude oil and refined petrol prices.
Monitoring of the Australian petroleum industry December 2013 xxxiii

Chart 8 Weekly average prices of Mogas 95 and Brent and Tapis crude oil: 1 July 2011 to 9 August 2013
USD
per bl
90
95
100
105
110
115
120
125
130
135
140
02-Aug-1305-Jul-1307-Jun-1303-May-1305-Apr-1301-Mar-1301-Feb-1304-Jan-1307-Dec-1202-Nov-1205-Oct-1207-Sep-1203-Aug-1206-Jul-1201-Jun-1204-May-1206-Apr-1202-Mar-1203-Feb-1206-Jan-1202-Dec-1104-Nov-1107-Oct-1102-Sep-1105-Aug-1101-Jul-11
02-A
ug-1
3
05-J
ul-1
3
07-J
un-1
3
03-M
ay-1
3
05-A
pr-1
3
01-M
ar-1
3
01-F
eb-1
3
04-J
an-1
3
07-D
ec-1
2
02-N
ov-1
2
05-O
ct-1
2
07-S
ep-1
2
03-A
ug-1
2
06-J
ul-1
2
01-J
un-1
2
04-M
ay-1
2
06-A
pr-1
2
02-M
ar-1
2
03-F
eb-1
2
06-J
an-1
2
02-D
ec-1
1
04-N
ov-1
1
07-O
ct-1
1
02-S
ep-1
1
05-A
ug-1
1
01-J
ul-1
1
TapisBrentMogas 95
Source: ACCC calculations based on Platts data.
International prices high and volatile despite weak global economic conditions
Crude oil prices have demonstrated significant volatility in recent years, and in 2012−13 prices continued to fluctuate at comparatively high levels. Despite weakness in the global economy, average annual prices were among the highest on record during 2012−13, and were only marginally lower than in 2011–12.
The strong upwards long-term trend in real prices since the late 1990s can be seen in chart 9 which shows average annual Brent crude oil prices since 1990–91.
xxxiv Monitoring of the Australian petroleum industry December 2013

Chart 9 Average annual price of Brent crude oil, in real terms: 1990–91 to 2012−13
USD
per bl
0
20
40
60
80
100
120
2012–132011–122010–112009–102008–092007–082006–072005–062004–052003–042002–032001–022000–011999–001998–991997–981996–971995–961994–951993–941992–931991–921990–91
2012
–13
2011
–12
2010
–11
2009
–10
2008
–09
2007
–08
2006
–07
2005
–06
2004
–05
2003
–04
2002
–03
2001
–02
2000
–01
1999
–00
1998
–99
1997
–98
1996
–97
1995
–96
1994
–95
1993
–94
1992
–93
1991
–92
1990
–91
Sources: ACCC calculations based on Platts data. U.S. Department of Labor, Bureau of Labor Statistics, Consumer price index for all urban consumers, http://www.dlt.ri.gov/lmi/pdf/cpi.pdf, accessed 31 October 2013.
Note: Real values in 2012−13 dollars.
Chart 9 also shows that since the Global Financial Crisis (GFC) in 2007–08 real crude oil prices have remained at historically high levels despite global economic weakness. It is possible that this may in part be due to the effect on crude oil prices of the growing reliance on more costly sources of crude oil.
As noted in recent ACCC petrol monitoring reports, development of unconventional crude oil deposits, such as tar sands and shale/tight reserves7 have contributed to supplies and averted short-term supply scarcity. However, it would appear that the higher cost associated with the development of these deposits relative to conventional sources of crude oil, may have maintained upward pressure on the average cost of crude oil supplies and thus on crude oil prices.
The International Energy Agency (IEA) has proposed a schematic showing production costs associated with different sources of crude oil. The schematic is reproduced in chart 10 and suggests rising costs of developing crude oil reserves as production moves from conventional to non-conventional sources of crude oil. Estimated costs of production range from USD 10 per barrel for existing sources of conventional crude up to around USD 150 per barrel for biodiesel.
7 “Tight reserves” refer to liquid oil embedded in low-permeable sandstone, carbonate and shale rock (US Energy Information Administration, Annual Energy Outlook 2012, p. 95).
Monitoring of the Australian petroleum industry December 2013 xxxv

Chart 10 Estimated crude oil production costs: 2008 USD per barrelPro
duc
tion
cos
t (200
8 USD
per bl)
Available oil (billion barrels)
0
10
20
30
40
50
60
70
80
90
100
110
120
130
140
150
10000900080007000600050004000300020001000
MENAconv. oil
Alreadypurchased
Otherconv. oil
Deep water
CO2 E
OR
Other EOR
Heavy oil bitumen
Arctic
Oilshales Bi
o mass
to liqu
ids
Gas to
liqu
ids Coal to
liquids
Ethano
l
Bio-diesel
Average price of Brent crude 2012–13 (in 2008 dollars): USD 101
Source: ACCC estimates based on International Energy Agency, Medium-term oil and gas markets 2011; p. 62.
Notes: Production cost is the break-even point not including an assumed rate of return on investment.
EOR—Enhanced Oil Recovery. MENA—Middle East and North Africa.
According to the data in chart 10, at the annual average crude oil price of USD 101 per barrel (in terms of 2008 dollars) for 2012−13, some sources of unconventional crude oil supplies are commercially viable, for example heavy oil bitumen and oil shales. The growth in production of crude oil from unconventional sources in recent years is in part a reflection of higher international prices. See section 4.4.3 for a discussion of unconventional sources of oil.
As supplies of low-cost crude oil deposits continue to be depleted and the world increases its reliance on alternative high-cost sources of supplies, crude oil prices can be expected to continue to remain well above the levels of USD 20 to USD 40 per barrel that existed prior to the early 2000s (see chart 9).
Crude oil markers
As noted, both Tapis and Brent are common crude oil markers used in Australia for benchmark pricing purposes. Traditionally, Tapis has been the main crude oil marker used in South-East Asia and the broader Asia-Pacific region. However, with the production of Tapis crude declining in recent years, Brent has been increasingly used as a marker for pricing crude oil in the region.
In theory, crude oil markers—such as Tapis and Brent—are to some degree, interchangeable commodities in a global market. Therefore, in the medium to longer term the prices of these markers should vary little from each other, apart from differences in quality.
Chart 11 presents price data in real terms for Tapis and Brent crude oil over the past 33 years. It is clear that movements in these two crude oil markers have tracked each other very closely.
xxxvi Monitoring of the Australian petroleum industry December 2013

Chart 11 Average annual benchmark prices of Brent and Tapis crude oil, in real terms: 1980 to 2013
USD
per bl
0
20
40
60
80
100
120
140
2013201220112010200920082007200620052004200320022001200019991998199719961995199419931992199119901989198819871986198519841983198219811980
2013
2012
2011
2010
2009
2008
2007
2006
2005
2004
2003
2002
2001
2000
1999
1998
1997
1996
1995
1994
1993
1992
1991
1990
1989
1988
1987
1986
1985
1984
1983
1982
1981
1980
Tapis Brent
Sources: Brent crude price data up until 2012 from BP Statistical review of world energy 2013; Brent crude price data for 2013 is ACCC calculations based on Bloomberg data; Tapis data is ACCC calculations based on Platts; U.S. Department of Labor, Bureau of Labor Statistics, Consumer price index for all urban consumers, http://www.dlt.ri.gov/lmi/pdf/cpi.pdf, accessed 31 October 2013.
Notes: Real values in 2013 dollars.
Brent 2013 data is 6-monthly data and Tapis is up to 9 August 2013.
Other crude oil markers used around the world include the West Texas Intermediate (WTI), which is a light sweet crude priced out of Cushing, Oklahoma. Over the last few years, WTI has consistently traded at a discount to Brent and Tapis. WTI prices have been distorted by the build-up of excess supplies resulting from infrastructure bottlenecks at the landlocked trading hub for WTI at Cushing, Oklahoma. In October 2011, the WTI discount relative to Brent reached an all-time high of USD 28 per barrel.
The ACCC has previously stated that because of the unique supply situation at Cushing, the price of WTI was not representative of broader global demand and supply conditions and could not be considered a relevant crude oil marker for countries in the Asia-Pacific region. In addition, WTI is not exported out of the US nor is it generally used to benchmark prices in Australia.
Since October 2011, however, the differential between WTI and Brent has decreased. Following an announcement in November 2011 that the pipeline linking Cushing to the Gulf Coast would be reversed, the differential between WTI and Brent fell to around USD 8 per barrel. Reversing the pipeline allowed crude oil to flow out of Cushing and helped to alleviate infrastructure constraints at Cushing.
In recent months, the supply situation at Cushing has continued to improve. The differential between WTI and Brent fell to around USD 6 per barrel in July 2013. However, it is too soon to conclude that the price of WTI has become representative of broader global demand and supply conditions, and as a result should not yet be considered a relevant crude oil marker for countries in the Asia-Pacific region.
Monitoring of the Australian petroleum industry December 2013 xxxvii

Retail petrol prices over 2012−13In 2012−13, average annual retail petrol prices across the five largest cities were broadly comparable to prices throughout 2011–12, both in terms of absolute levels and extent of variability.
The annual average retail price of petrol across the five largest cities in 2012−13 was 141.3 cpl, which was 1.5 cpl lower than in 2011–12.
In seven-day rolling average terms, during 2012−13, prices varied from a low of around 128 cpl in July 2012 to a high of around 151 cpl in February 2013—a range of 23 cpl. This is broadly comparable to 2011–12, when the range between the highest and lowest prices was 22 cpl.
Chart 12 shows both the daily average retail prices and the seven-day rolling average prices, across the five largest cities over the period 1 July 2012 to 31 July 2013. The effect of the regular retail price cycle is clearly evident in this chart.
Chart 12 Daily average RULP prices and seven-day rolling average retail prices, five largest cities: 1 July 2012 to 30 September 2013
cpl
125
130
135
140
145
150
155
160
165
xSep-13Aug-13Jul-13Jun-13May-13Apr-13Mar-13Feb-13Jan-13Dec-12Nov-12Oct-12Sep-12Aug-12Jul-12Se
p-13
Aug
-13
Jul-1
3
Jun-
13
May
-13
Apr
-13
Mar
-13
Feb-
13
Jan-
13
Dec
-12
Nov
-12
Oct
-12
Sep-
12
Aug
-12
Jul-1
2
Seven-day rolling averageDaily average
Source: ACCC calculations based on Informed Sources data.
Retail prices in regional locations
Prices in regional locations in Australia tend to be higher than in capital cities.
The ACCC has noted the concerns of motorists in regional locations about the relatively higher prices of petrol in some regional locations.
Although retail prices in regional locations are largely driven by the same factors as those in larger capital cities, they are generally higher than in the capital cities for a number of reasons, including:
• the limited number of retail sites operating in a particular regional market—a lower number of retail sites may mean a lower level of local competition
• lower volumes of fuel sold (hence higher average costs)
• distance/location factors increasing costs
• lower convenience store sales (thus the need for greater margins on fuel).
xxxviii Monitoring of the Australian petroleum industry December 2013

These factors can also explain differences in petrol prices between different regional locations. Price movements in regional locations tend to be more stable than in the five largest cities and also tend to lag behind movements in these cities, particularly in times of rapidly changing prices.
Only a small number of regional locations have regular price cycles. These tend to be larger population centres or in locations very close to them.
Chart 13 shows daily average retail prices across all of the monitored regional locations in Australia and daily average retail prices in the five largest cities over the period 1 July 2012 to 30 September 2013.8 It can be seen that:
• prices in regional locations in aggregate broadly follow prices in the five largest cities
• regional locations in aggregate do not have the retail price cycles that are clearly evident in the five largest cities
• the difference between prices in regional locations and the five largest cities varies the most when prices change rapidly, such as occurred in April and May 2013.
Chart 13 Daily average retail RULP prices, monitored regional locations in aggregate and five largest cities: 1 July 2012 to 30 September 2013
cpl
120
130
140
150
160
170
180
xSep-13Aug-13Jul-13Jun-13May-13Apr-13Mar-13Feb-13Jan-13Dec-12Nov-12Oct-12Sep-12Aug-12Jul-12Se
p-13
Aug
-13
Jul-1
3
Jun-
13
May
-13
Apr
-13
Mar
-13
Feb-
13
Jan-
13
Dec
-12
Nov
-12
Oct
-12
Sep-
12
Aug
-12
Jul-1
2
Regional locationsFive largest cities
Source: ACCC calculations based on Informed Sources data.
Nominal components of retail prices 2012−13As Australian petrol prices are not regulated, local petrol companies have discretion in determining their prices. However, the two largest components of the petrol pump price are outside the control of local petrol companies. These cost components of petrol, diesel and LPG prices are:
• the respective international benchmark prices for refined petrol, diesel and LPG
• GST and excise taxes (for petrol and diesel—there is currently minimal excise imposed on LPG, although it increased from 5.0 cpl to 7.5 cpl on 1 July 2013).
8 The specific regional locations monitored by the ACCC in each state and the Northern Territory are listed in appendix F. It also provides average annual prices for RULP, diesel, automotive LPG and EBP in 2012−13 for each of those locations.
Monitoring of the Australian petroleum industry December 2013 xxxix

In 2012−13, taxes and international benchmark prices accounted for about 89 per cent of the average annual retail price of RULP in the five largest capital cities. That is, out of an annual average retail price of 141.3 cpl, 125.2 cpl is directly attributable to the cost of refining petrol and taxes (chart 14).
For diesel, these two components also account for 87 per cent of the annual average bowser price (chart 15).
For LPG, the international benchmark price and taxes account for 81 per cent, in part reflecting the low level of excise on LPG and higher transport and storage costs relative to petrol and diesel (chart 16).
Other costs and margins therefore account for about 16 cpl of the retail price of petrol, 19 cpl for diesel and 14 cpl for LPG. This amount covers a number of costs including transport and freight, salaries, repair and maintenance, storage and terminal costs.
Chart 14 Nominal components of Australian retail RULP prices in the five largest cities: 2012−13
Other costs and marginsTaxesMogas 95
PETROL141.3 cpl
cpl %
16.1 11
51.0 36
74.2 53
Sources: ACCC calculations based on Informed Sources, Platts and RBA data.
xl Monitoring of the Australian petroleum industry December 2013

Chart 15 Nominal components of Australian retail diesel prices in the five largest cities: 2012−13
Other costs and marginsTaxesGasoil 10ppm
DIESEL147.4 cpl
cpl %
18.6 13
51.5 35
77.3 52
Sources: ACCC calculations based on Informed Sources, Platts and RBA data.
Chart 16 Nominal components of Australian retail LPG prices in the five largest cities: 2012−13
Other costs and marginsTaxesSaudi CP
LPG70.7 cpl
cpl %
13.5 19
11.4 16
45.8 65
Sources: ACCC calculations based on Informed Sources, LPG Australia and RBA data.
Monitoring of the Australian petroleum industry December 2013 xli

Components of the pump price over timeChart 17 shows a more detailed breakdown of the components of the annual average retail petrol price of RULP across the five largest cities from 2010–11 to 2012−13.
Each bar represents the annual average retail price disaggregated into the following:
• Tapis crude oil—the benchmark for crude oil in the Asia-Pacific region (including Australia)
• Excise (which is set at a constant 38.14 cpl) and GST
• Gasoline crack—the difference between the price of Mogas 95 and Tapis crude oil
• Wholesale costs and margins (excluding excise and GST)
• Retail costs and margins (excluding GST).
Chart 17 Components of annual average retail RULP prices in the five largest cities: 2010–11 to 2012−13
0
20
40
60
80
100
120
140
160
2012–132011–122010–11
cpl
Wholesale costs and margins (excl excise and GST)
Excise and GST
Retail costs and margins (excl GST)
Gasoline crack
Tapis crude oil
avg. 131.7 cpl avg. 142.8 cpl avg. 141.3 cpl
Sources: ACCC calculations based on Informed Sources, Platts, RBA and WA FuelWatch data, and information provided by monitored companies.
It can be seen in chart 17 that changes in the international price of crude oil have been overwhelmingly responsible for movements in average retail petrol prices over time. As noted, international prices are affected by a range of global economic and geo-political factors. With the exception of the gasoline crack, other components attributable to the local petrol companies and to excise and GST have been relatively stable.
The producers of crude oil accrue the greatest benefits when international prices increase. This is because costs associated with the exploration and development of crude oil deposits are largely fixed in the short-term.
xlii Monitoring of the Australian petroleum industry December 2013

ProfitsAs part of its analysis of the downstream petroleum industry, the ACCC collects extensive financial information from the four refiner-wholesalers and major independent wholesalers and retailers.
Financial information collected for the period from 2002–03 to 2012−13 was analysed to estimate the profitability of each sector of the downstream petroleum industry, including total supply (which includes the refining sub-sector along with imports and buy-sell transactions), wholesale and retail.
The downstream petroleum industry derives its income from a variety of sources. These include the refining of crude oil into a suite of automotive fuels and other products; revenue from the on-selling of these refined products to the commercial sector; revenue from the on-selling of fuel to the public; and revenue from selling products at convenience stores (attached to retail sites).
The ACCC produces estimates of revenues, costs and profits for the total suite of products sold in the Australian downstream petroleum industry and for petrol products, (that is, RULP, PULP and EBP). The ACCC does this on a consolidated basis for the entire downstream petroleum industry, as well as for each sector of the industry.
Due to adjustments made for inter-sector transactions by integrated companies, combined sectorial and product groups’ financial results may not be comparable with estimates for the consolidated performance of the entire downstream industry.
Retail sector profits higher in 2012−139
The financial performance of the retail petrol sector has been characterised by growing profits since 2002–03, the first year for which the ACCC collected data for the petrol monitoring program.
In 2012−13, total retail net profits reported by the monitored firms increased 18.9 per cent in real terms (or 21.6 per cent in nominal terms) to $534.9 million compared with the previous 12 months (chart 18). These profits were earned on the retailing of all products and services, including convenience store sales.
Chart 18 shows that the overall trend of rising profits in the retail sector has been particularly evident since 2008–09. Total retail profits have increased around 114 per cent in real terms in the five years to 2012−13, from $249.5 million in 2008–09 to $534.9 million in 2012−13.
9 Retail profits on petrol products include subsidies from non-fuel businesses for costs associated with sales of discounted petrol.
Monitoring of the Australian petroleum industry December 2013 xliii

Chart 18 Retail sector net profits in real terms, all products and services: 2002–03 to 2012−13
0
100
200
300
400
500
600
700
2012–132011–122010–112009–102008–092007–082006–072005–062004–052003–042002–03
$ million
Sources: ACCC calculations based on data obtained from firms monitored through the ACCC’s monitoring process; ABS, 6401.0 Consumer Price Index, Australia, Table 1. CPI: All Groups, Index Numbers and Percentage Changes.
Note: Real values in 2012−13 dollars.
The ACCC has also estimated total and unit net profits earned on petrol products (RULP, PULP and EBP) sold in the retail sector. This measure of profits excludes profits from convenience store sales. Unit net profits are net profits per litre of petrol products sold and measure the difference between unit revenues, the average revenue per litre of petrol sold, and unit costs, the average cost of marketing/selling refined petrol to motorists.
In 2012−13 net profits on petrol products rose 21.8 per cent in real terms to $297.5 million.
Chart 19 shows net profits on petrol products since 2002–03. Net profits on petrol products have increased from $69.1 million in 2008–09 to $297.5 million in 2012−13.
xliv Monitoring of the Australian petroleum industry December 2013

Chart 19 Retail sector net profit in real terms, petrol products: 2002–03 to 2012−13
0
50
100
150
200
250
300
350
2012–132011–122010–112009–102008–092007–082006–072005–062004–052003–042002–03
$ million
Sources: ACCC calculations based on data obtained from firms monitored through the ACCC’s monitoring process; ABS, 6401.0 Consumer Price Index, Australia, Table 1. CPI: All Groups, Index Numbers and Percentage Changes.
Note: Real values in 2012−13 dollars.
Chart 20 shows unit net profits on petrol products since 2002–03. In 2012−13 unit net profits on petrol products rose to 2.36 cpl from 1.94 cpl in real terms in 2011–12 (or 1.89 cpl in nominal terms).
It is also clear from chart 20 that unit net profits on petrol products have increased markedly in the five years since 2008–09. Petrol products’ unit net profits in real terms have increased more than four-fold from 0.58 cpl in 2008–09 to 2.36 cpl in 2012−13.
Chart 20 Retail sector unit net profit in real terms, petrol products: 2002–03 to 2012−13
0.0
0.5
1.0
1.5
2.0
2.5
3.0
2012–132011–122010–112009–102008–092007–082006–072005–062004–052003–042002–03
cpl
Sources: ACCC calculations based on data obtained from firms monitored through the ACCC’s monitoring process; ABS, 6401.0 Consumer Price Index, Australia, Table 1. CPI: All Groups, Index Numbers and Percentage Changes.
Note: Real values in 2012−13 dollars.
Monitoring of the Australian petroleum industry December 2013 xlv

Regular and premium unleaded petrol
Net profits on both PULP and RULP products have increased significantly since 2007–08.
PULP products were a significant contributor to retail profits in 2012−13, earning similar total profits as RULP products on smaller volumes. As a result, in 2012−13, unit net profits on PULP products in the retail sector were 3.69 cpl compared with 1.77 cpl for RULP products. Since 2007–08, unit net profits on PULP products in the retail sector have increased more than 10-fold compared with a three-fold increase in RULP unit net profits.
The NSW government mandate on ethanol may be one of the factors promoting greater demand for and higher net profits on PULP products. The NSW mandate, which requires a minimum of 6 per cent of total fuel sale volumes to be ethanol, may have contributed to an increase in demand for PULP products by reducing supply of RULP products in that state.
Convenience store profits higher in 2012−13
Along with higher profits on the sale of petrol products, convenience store products and services has been the other major source of increased profits in the retail sector.
Chart 21 shows net profits on convenience store sales since 2006–07. In 2012−13 net profits on convenience store sales rose 17.1 per cent in real terms to $205.2 million.
Chart 21 also shows that net profits on convenience store sales have increased consistently since 2006−07. In the last seven years convenience store profits have risen more than 140 per cent in real terms.
Chart 21 Convenience store net profit in real terms: 2006–07 to 2012−13
0
50
100
150
200
250
2012–132011–122010–112009–102008–092007–082006–07
$ million
Sources: ACCC calculations based on data obtained from firms monitored through the ACCC’s monitoring process; ABS, 6401.0 Consumer Price Index, Australia, Table 1. CPI: All Groups, Index Numbers and Percentage Changes.
Note: Real values in 2012−13 dollars.
xlvi Monitoring of the Australian petroleum industry December 2013
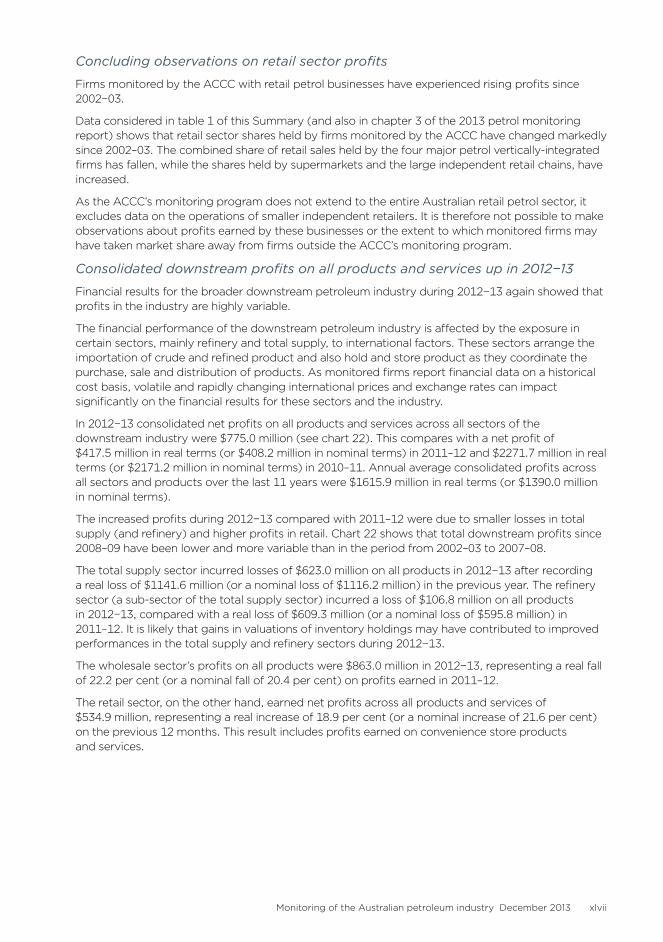
Concluding observations on retail sector profits
Firms monitored by the ACCC with retail petrol businesses have experienced rising profits since 2002−03.
Data considered in table 1 of this Summary (and also in chapter 3 of the 2013 petrol monitoring report) shows that retail sector shares held by firms monitored by the ACCC have changed markedly since 2002–03. The combined share of retail sales held by the four major petrol vertically-integrated firms has fallen, while the shares held by supermarkets and the large independent retail chains, have increased.
As the ACCC’s monitoring program does not extend to the entire Australian retail petrol sector, it excludes data on the operations of smaller independent retailers. It is therefore not possible to make observations about profits earned by these businesses or the extent to which monitored firms may have taken market share away from firms outside the ACCC’s monitoring program.
Consolidated downstream profits on all products and services up in 2012−13
Financial results for the broader downstream petroleum industry during 2012−13 again showed that profits in the industry are highly variable.
The financial performance of the downstream petroleum industry is affected by the exposure in certain sectors, mainly refinery and total supply, to international factors. These sectors arrange the importation of crude and refined product and also hold and store product as they coordinate the purchase, sale and distribution of products. As monitored firms report financial data on a historical cost basis, volatile and rapidly changing international prices and exchange rates can impact significantly on the financial results for these sectors and the industry.
In 2012−13 consolidated net profits on all products and services across all sectors of the downstream industry were $775.0 million (see chart 22). This compares with a net profit of $417.5 million in real terms (or $408.2 million in nominal terms) in 2011–12 and $2271.7 million in real terms (or $2171.2 million in nominal terms) in 2010–11. Annual average consolidated profits across all sectors and products over the last 11 years were $1615.9 million in real terms (or $1390.0 million in nominal terms).
The increased profits during 2012−13 compared with 2011–12 were due to smaller losses in total supply (and refinery) and higher profits in retail. Chart 22 shows that total downstream profits since 2008–09 have been lower and more variable than in the period from 2002–03 to 2007–08.
The total supply sector incurred losses of $623.0 million on all products in 2012−13 after recording a real loss of $1141.6 million (or a nominal loss of $1116.2 million) in the previous year. The refinery sector (a sub-sector of the total supply sector) incurred a loss of $106.8 million on all products in 2012−13, compared with a real loss of $609.3 million (or a nominal loss of $595.8 million) in 2011–12. It is likely that gains in valuations of inventory holdings may have contributed to improved performances in the total supply and refinery sectors during 2012−13.
The wholesale sector’s profits on all products were $863.0 million in 2012−13, representing a real fall of 22.2 per cent (or a nominal fall of 20.4 per cent) on profits earned in 2011–12.
The retail sector, on the other hand, earned net profits across all products and services of $534.9 million, representing a real increase of 18.9 per cent (or a nominal increase of 21.6 per cent) on the previous 12 months. This result includes profits earned on convenience store products and services.
Monitoring of the Australian petroleum industry December 2013 xlvii

Chart 22 Total consolidated downstream net profit (adjusted EBIT) in real terms, all products: 2002–03 to 2012−13
-1500
-1000
-500
0
500
1000
1500
2000
2500
3000
3500
4000
2012–132011–122010–112009–102008–092007–082006–072005–062004–052003–042002–03
$ million
Average: 2002–03 to 2012–13
Sources: ACCC analysis based on data obtained from firms monitored through the ACCC’s monitoring process; ABS, 6401.0 Consumer Price Index, Australia, Table 1. CPI: All Groups, Index Numbers and Percentage Changes.
Note: Real values in 2012−13 dollars.
Consolidated downstream profits on petrol products higher in 2012−13
Total profits on petrol products (RULP, PULP and EBP) across all sectors of the downstream industry were $1009.8 million. This compares with a real net loss of $9.7 million (or nominal losses of $9.5 million) in 2011–12.
In addition to estimating total industry profits, the ACCC has also estimated unit net profits, that is profits per litre of products sold in the entire downstream industry. Unit profits on petrol products, expressed as cents per litre (cpl), is a measure of the difference between unit revenues, the average revenue per litre of petrol sold, and unit costs, the average cost for the entire industry to purchase and process crude oil and market/sell a litre of refined petrol. In 2012−13, unit net profits on petrol products were 2.72 cpl.
By comparison, in 2011–12 the entire downstream industry recorded a real and nominal unit net loss of 0.03 cpl. As shown in chart 23, the average annual real unit profit on petrol products since 2012−13 is 1.78 cpl (or an average nominal unit profit of 1.55 cpl). Chart 23 also shows that since 2008–09 total downstream unit net profits have been more variable and generally lower than in the six years to 2007–08.
xlviii Monitoring of the Australian petroleum industry December 2013

Chart 23 Total downstream unit net profit in real terms, petrol products (cents per litre): 2002–03 to 2012−13
-2
-1
0
1
2
3
4
2012–132011–122010–112009–102008–092007–082006–072005–062004–052003–042002–03
cpl
Average: 2002–03 to 2012–13
Sources: ACCC analysis based on data obtained from firms monitored through the ACCC’s monitoring process; ABS, 6401.0 Consumer Price Index, Australia, Table 1. CPI: All Groups, Index Numbers and Percentage Changes.
Note: Real values in 2012−13 dollars.
Australian refinery sector losses down in 2012−13
The volatile nature of profits in the Australian downstream petroleum industry is partly reflected in the variable financial performance of the refinery sector over the last decade.
The refinery sector incurred a net loss of $106.8 million in 2012−13. This compares with a real net loss of $609.3 million (or nominal loss of $595.8 million) in 2011–12 and a net profit of $364.1 million (or a nominal profit of $348 million) in 2010–11 (chart 24).
Monitoring of the Australian petroleum industry December 2013 xlix

Chart 24 Refinery sector net profit in real terms, all products: 2002–03 to 2012−13
-1000
-500
0
500
1000
1500
2000
2500
3000
2012–132011–122010–112009–102008–092007–082006–072005–062004–052003–042002–03
$ million
Average: 2002–03 to 2007–08
Average: 2008–09 to 2012–13
Sources: ACCC calculations based on data obtained from firms monitored through the ACCC’s monitoring process; ABS, 6401.0 Consumer Price Index, Australia, Table 1. CPI: All Groups, Index Numbers and Percentage Changes.
Note: Real values in 2012−13 dollars.
The refinery sector In Australia was generally profitable in the six years leading up to the GFC in 2007–08, due to favourable trading conditions, including high refining margins as a result of tight supplies and rising international crude oil and refined petrol prices. By contrast, the period since the GFC, has been characterised by a comparatively strong Australian exchange rate relative to the USD, volatile international prices resulting in losses in the values of inventory holdings and falling refinery margins due to ample availability of refined petrol in the Asia-Pacific region.
The two distinct phases of financial performance of the refinery sector can be seen in chart 24. In the six years to 2007–08 refinery sector earned average annual net profits of $1346.0 million in real terms (or $1119.4 million in nominal terms). On the other hand, in the five years since 2008–09, the refinery sector has incurred losses averaging $153.1 million in real terms (or $146.3 million in nominal terms) per annum.
Recent developments in the fuel industry
Ethanol blended petrol
Ethanol is added to petrol to produce various grades of EBP. The most common EBP is E10, which is RULP containing up to 10 per cent ethanol.
Total sales of EBP in Australia in 2012−13 decreased by around 5 per cent from 2011–12. Sales were down in NSW and Queensland, and increased marginally in Victoria. As a proportion of total petrol sales in Australia EBP sales remained unchanged (at 14 per cent). The number of retail sites selling E10 across Australia decreased in 2012−13.
The largest volume of EBP is sold in NSW, which accounted for over 82 per cent of the Australian EBP market in 2012−13. This is primarily a result of the NSW ethanol mandate. From October 2011 the mandate has required that 6 per cent of the total volume of petrol sold in NSW should be ethanol. However, in 2012−13 only around 3.5 per cent of the volume of petrol sold was ethanol.
In 2012−13, across all retail sites selling both RULP and E10 which are monitored by the ACCC, RULP prices were on average higher than E10 prices by around 2.0 cpl. This was a slight increase on 2011−12 (1.8 cpl).
l Monitoring of the Australian petroleum industry December 2013

In 2012−13 there appeared to be sufficient supply to meet demand: ethanol production capacity in Australia was estimated to be 450 mega litres (ML) and ethanol demand was estimated to be around 284 ML.
Effects of New South Wales ethanol mandate
Since its introduction in October 2007 the NSW mandate has had a significant impact on competition and consumers:
• it has affected the competitive dynamic among retailers by reducing the availability of RULP from many retail sites
• it has reduced consumer choice—some motorists who cannot use E10 in their vehicles (or choose not to) have, because of the reduced availability of RULP, decided to use PULP
• in 2012−13 PULP accounted for the largest share of automotive fuels sold in NSW
• as PULP retails at a higher price than RULP, it has meant that these motorists have been paying higher prices than if they had continued to purchase RULP
• over the last 12 months the number of retail sites selling E10 only in Sydney has decreased by 70 sites to around 330 sites. This diminishes the adverse impact of the NSW ethanol mandate on those consumers that wish to purchase RULP.
Premium Fuels
In Australia the two main grades of PULP are PULP 95 and PULP 98. Other grades of PULP are also available in the Australian market, but they are sold in much lower volumes. Sales of the PULP grades have grown steadily over the last five years. Over the same time sales of RULP have decreased by around one-fifth. In NSW PULP sales have almost doubled over the last five years, and now constitute almost half of total PULP sales in Australia. This increase has been significantly influenced by the ethanol mandate in that state, which has reduced the availability of RULP to consumers.
In 2012−13 average PULP 95 retail prices were 10.4 cpl higher than average RULP retail prices, and average PULP 98 retail prices were 15.4 cpl higher than average RULP retail prices. These differentials were marginally higher than in 2011–12.
Refining
The competitive environment faced by Australian refineries has changed dramatically in recent years. The US Energy Information Administration (US EIA) has noted that as refineries around the world become larger and more complex, small and older refineries (such as those still operating in Australia) will find it increasingly difficult to compete with petrol produced at lower margins.10
Australian refineries were built many decades ago and are now small, as well as dated, by international standards. The emergence of large and more efficient refineries in Asia capable of producing Australian standard fuels has placed the smaller Australian refineries under intense competitive pressure. According to the Department of Resources Energy and Tourism (RET) the Australian refining sector will continue to face a tough competitive climate in the foreseeable future:
Australia’s refining industry is undergoing structural change in response to strong competitive pressure from larger and newer Asian refineries, which continue to lower the break-even benchmark that our refineries compete against. The domestic pressure of high local costs, coupled with a high exchange rate, is expected to keep Australian refineries under pressure for some time.11
10 US Energy Information Administration (2012), Annual Energy Outlook, p. 44.
11 Department of Resources Energy and Tourism, Energy White Paper 2012, p. 125, at: http://www.ret.gov.au/energy/Documents/ewp/2012/Energy_%20White_Paper_2012.pdf. Accessed 25 September 2013.
Monitoring of the Australian petroleum industry December 2013 li

These pressures have resulted in integrated oil companies moving further away from lower margin downstream activities (including refining) and concentrating on oil exploration and extraction activities. In the process, local petrol companies have rationalised their refinery assets, leading to the closure of refineries in the last few years.
There were a number of significant developments in the Australian refining sector during 2012−13, including:
• In July 2012, Caltex announced that it would close its Kurnell refinery in the second half of 2014 and convert it into an import terminal.12
• In August 2012, Mobil formally closed the Port Stanvac refinery in Adelaide which was mothballed in 2003. Mobil has commenced demolition of its Port Stanvac refinery, with work planned to be completed by the end of 2013.13
• During September and October 2012, Shell ceased refining operations at its Clyde refinery in Sydney. Following the cessation of refining operations, Shell has commenced the process of transitioning its Clyde site into an import terminal.14
• In April 2013, Shell announced its intention to sell its Corio refinery before the end of 2014. Shell also noted that if it is unable to achieve a successful sale it would consider other options, such as converting the site into an import terminal.15
With a positive medium term outlook for the supply of refined fuels in Asia, refinery margins will continue to be under pressure. In this climate, the challenges faced by the older and higher cost refineries such as those still operating in Australia are likely to intensify. Australian refineries are not unique in experiencing serious challenges. Refineries in OECD European countries are also undergoing structural change. The IEA reports that since 2008, 15 refineries have closed in Europe.16 Further rationalisation is possible given over capacity and falling oil intensity due to continued gains in fuel efficiency.
The closure of refineries will increase Australia’s reliance on imports of refined fuels. While Australia imported about 5 per cent of its refined petrol requirements in 2004–05, the Bureau of Resources and Energy Economics (BREE) forecasts that imports’ share of total consumption will increase to just under 50 per cent by 2019–20.17
The IEA’s medium-term oil market report states that global refining capacity is set to rise by 9.5 mbpd over the 2013–18 period, the majority of which is planned in non-OECD Asia and the Middle East. Some of the new refining capacity in India and much of that being built in the Middle East, mainly in Saudi Arabia, will be used to produce fuel for export markets and cleaner fuels that meet stricter future environmental regulations. It would appear from these developments that the region could potentially produce adequate supplies of petrol refined to Australian standards.18
12 Caltex Australia (2012), Facts about our Kurnell refinery announcement, media release, 10 August: http://www.caltex.com.au/Pages/FactsKurnell.aspx. Accessed 25 September 2013.
13 ExxonMobil (2012), Adelaide Refinery demolition underway, media release, 5 September, http://www.exxonmobil.com.au/Australia-English/PA/news_releases_20120905.aspx. Accessed 25 September 2013.
14 Shell Australia (2012), Date of Clyde conversion confirmed, media release, 6 June, http://www.shell.com.au/aboutshell/media-centre/news-and-media-releases/archive/2012/date-for-clyde-conversion-07062012.html. Accessed 25 September 2013.
15 Shell Australia (2013), Shell announces Geelong refinery for sale, media release, 4 April, http://www.shell.com.au/aboutshell/media-centre/news-and-media-releases/2013/shell-glg-refinery-for-sale-04042013.html. Accessed 25 September 2013.
16 Medium Term Oil Market Report, OECD/IEA 2013, p. 90.
17 Department of Resources Energy and Tourism, Energy White Paper 2012, p. 126, http://www.ret.gov.au/energy/Documents/ewp/2012/Energy_%20White_Paper_2012.pdf. Accessed 25 September 2013.
18 For a discussion of developments in global refinery capacity see section on ‘Refining’ in Medium Term Oil Market Report, OECD/IEA 2013, pp. 80–106.
lii Monitoring of the Australian petroleum industry December 2013

Wholesale (independent imports)
Imports by independent wholesalers continued to grow in 2012−13. Independent imports have increased more than fivefold since 2007–08 when they represented less than 5 per cent of total imports by monitored firms. However, due to increased import activity by the refiner-wholesalers in the wake of refinery closures, the share of independent imports in total imports by monitored firms has fallen in the last three years from 40 per cent in 2010–11 to 30 per cent of total imports in 2011–12 and 26 per cent in 2012−13.
The emergence of independent importers has been one of the most significant developments in the last decade in the wholesale sector of the Australian downstream industry. While still relatively small, the potential for additional future growth in independent imports means that independent importers continue to exert competitive discipline on the established petrol companies.
Data presented in chapter 6 on wholesale prices indicates that import costs in Australia bear a close approximation to estimates of import parity prices (IPP).19 In other words, IPP represent a reasonable proxy for import costs. In previous monitoring reports, the ACCC observed that buy-sell prices are competitive with prices at which independent wholesalers/importers can purchase fuel from the refiner-wholesalers.20 This means that independent importers’ capacity to source fuel at IPP from overseas refineries represents a credible threat to by-pass local suppliers and places a constraint on prices charged by domestic refiner-wholesalers.
Over the past few years, the majority of investment in import terminals has been undertaken by independent terminal owners, which has resulted in a significant increase in the number, capacity and accessibility of independently-owned import terminals. Reflecting this trend, refiner-wholesalers as well as smaller wholesalers/importers have been increasing their use of independently-owned terminals.
Acquisitions in the wholesale sector
In 2012−13 there were a number of important developments in the structure of the wholesale sector, including merger and acquisition activity between independent wholesalers/importers.
Puma Energy entered the Australian fuel market through the acquisitions of Central Combined Group (CCG), Ausfuel (with operations centred in Western Australia, Northern Territory and Queensland) and Neumann Petroleum (Queensland and northern New South Wales). Puma Energy, owned by Dutch-based commodity trader Trafigura Beheer BV, is an international energy company which has been diversifying into activities including petrol refining, storage, distribution and retail in a number of countries. In addition to acquiring the retail networks established by Neumann and Ausfuel, these acquisitions have provided Puma Energy with:
• Neumann’s Eagle Farm terminal in Brisbane21
• Ausfuel’s 11 fuel depots in Western Australia, South Australia and Northern Territory22
• CCG’s five fuel depots throughout Mackay, Gladstone and Emerald, which is intended to increase Puma Energy’s exposure to the growing mining industry fuel market in regional Queensland.23
19 The import parity price is the notional cost of importing refined petrol to Australia. See chapter 6 for a discussion of import parity prices.
20 These are prices that the four refiner-wholesalers charge each other for refined petrol bought and sold to each other in locations where one of them does not have a refinery.
21 Puma Energy (2013), Puma Energy completes Ausfuel and Neumann Petroleum acquisitions, media release, 4 March, http://www.pumaenergy.com/2013/03/04/puma-energy-completes-ausfuel-and-neumann-petroleum-acquisitions. Accessed 21 September 2013.
22 Puma Energy (2013), Puma Energy completes Ausfuel and Neumann Petroleum acquisitions, media release, 4 March, http://www.pumaenergy.com/2013/03/04/puma-energy-completes-ausfuel-and-neumann-petroleum-acquisitions. Accessed 23 September 2013.
23 Puma Energy (2013), Puma Energy secures entry into Australian mining market, 27 February, http://www.pumaenergy.com/2013/02/27/puma-energy-secures-entry-into-australian-mining-market. Accessed 23 September 2013.
Monitoring of the Australian petroleum industry December 2013 liii

In December 2012, Japanese energy/petroleum company Idemitsu Kosan purchased Freedom Fuels. Idemitsu Kosan acquired all of Freedom Fuel’s retail sites, mainly in Queensland and New South Wales, as well as its import fuel terminals in Sydney and Brisbane.24
The acquisition of assets in the Australian downstream petroleum industry by a commodities trading firm and an energy company, and the potential interest in other assets by other such firms, is significant. It may signal changing perceptions of Australia’s presence in the global petroleum market.
Australia is the 12th largest economy in the world and the largest economy in the South East Asian region.25 With global integrated companies closing down their refineries in Australia and generally reducing their presence in the domestic downstream industry, Australia will have to increase its reliance on imports to meet its fuel requirements. According to some media reports, Australia is poised to become the largest importer of refined fuel in South East Asia.26
The prospect of Australia’s import requirements increasing substantially means that commodity traders already in the business of moving large quantities of refined fuel around the world, are now interested in increasing their exposure to Australia in their global portfolio of regional investments.
Ownership of a retail network, such as Trafigura has accomplished through Puma Energy’s purchase of Neumann and Ausfuel, provides importers with a ready-made outlet for imported petrol. It is plausible that ownership by Neumann and Ausfuel of strategic assets, such as terminals and pipelines in proximity to mining centres in Queensland and Western Australia, may have added to Trafigura’s interest in these businesses.
In this context, potential interest in Australia’s largest independent wholesaler, United Petroleum, is not surprising. Recent media reports suggest that United Petroleum may also be a potential seller of its wholesale (and retail) business. Companies which have been reported to be potentially interested in acquiring United include the Vitol group, also a Dutch-based global commodities trader.27 United Petroleum has a larger retail network than Ausfuel and Neumann and also owns a terminal in Hastings, Victoria, but has fewer assets in the mining rich states of Queensland and Western Australia.
Retail
There was a substantial amount of activity between independent operators in the retail sector throughout 2012−13, including a number of acquisitions.
As noted, Puma Energy entered the Australian retail sector through its acquisitions of Ausfuel, Neumann Petroleum and CCG. Puma Energy’s acquisitions provided it with a substantial fuel retailing network, including:
• 110 retail sites from its acquisition of Ausfuel
• 120 retail sites from its the acquisition of Neumann Petroleum
• 18 retail sites from its acquisition of CCG.
Through its acquisition of Freedom Fuels, Japanese petroleum company Idemitsu Kosan also entered the Australian retail petrol sector in 2012−13. This acquisition provided Idemitsu Kosan with a network of 42 retail sites.
24 Idemitsu Kosan Co., Ltd (2012), Idemitsu acquires Australian petroleum products distributor Freedom Energy Holdings Pty Ltd, media release, 17 December, http://www.idemitsu.com/company/news/2012/121217.html. Accessed 23 September 2013.
25 See World Bank country rankings by Gross Domestic Product 2012, at http://databank.worldbank.org/data/download/GDP.pdf. Accessed 21 September 2013.
26 See Javier Blas, Trafigura bets $800m on Australia energy, Financial Times, 3 February 2013, at http://www.ft.com/cms/s/0/3197076a-6e14–11e2–983d-00144feab49a.html. Accessed 21 September 2013.
27 Street Talk, United Petroleum may interest Caltex, Vitol, Australian Financial Review, 27 August 2013, p. 16. See http://www.afr.com/tags?tag=C_A-CAP%20RESOURCES%20LIMITED-ACB. Accessed 21 September 2013.
liv Monitoring of the Australian petroleum industry December 2013

In May 2013, Peregrine Corporation (which operates under the trading name of On The Run) advised the ACCC that it intended to acquire 25 of BP’s company owned and operated retail petrol sites in South Australia, comprising all 16 of BP’s sites in Adelaide and nine sites in regional South Australia. Subsequently Peregrine acquired the nine regional sites which were not subject to the clearance application. The ACCC timeline for the review of the proposed acquisition of 16 Adelaide sites has been suspended to allow the merger parties to provide further information.
As noted, there have also been reports that independent fuel retailer United Petroleum is considering selling its network of retail sites and fuel distribution network.28
Table 1 shows the share of retail sale volumes among the refiner-marketers, supermarkets and independent retail chains.
Table 1 Share of volume of retail petrol sales by brand: 2002–03 to 2012−13
BP
%
Caltex
%
Mobil
%
Shell
%
Coles Express/Shell (co-branded)
%
Woolworths/ Caltex
(co-branded) %
Large independent retail chains
%
2002–03 20 24 19 20 – 10 6
2003–04 20 22 17 3 16 14 7
2004–05 18 18 12 3 25 18 6
2005–06 19 16 11 3 25 20 6
2006–07 19 16 11 3 22 22 7
2007–08 20 17 11 2 20 22 8
2008–09 19 16 11 2 22 23 9
2009–10 17 16 10 2 22 23 10
2010–11 19 18 – 2 22 23 17
2011–12 16 18 – 2 23 24 17
2012−13 15 18 – 2 24 24 18
Source: ACCC analysis and estimates based on data obtained from firms monitored through the ACCC’s monitoring process.
Notes: Data is only for monitored companies, so does not include the total volume of retail sales in Australia.
Large independent retail chains are: 7-Eleven, On the Run, and the retail operations of Neumann, United and Ausfuel.
In 2002–03, Woolworths was not co-branded with Caltex.
Totals may not add to 100 per cent due to rounding.
In 2012−13, refiner wholesalers’ combined market share of branded retail sales by monitored firms was 35 per cent, the lowest since 2002–03 when their combined market share was 83 per cent.
On the other hand, independent retail chains and the supermarkets have experienced increases in the share of the retail market monitored by the ACCC. From 2002-03 to 2012 13, the supermarkets’ retail market share has increased from 10 per cent to 48 per cent, while the share held by the large independent chains has increased from 7 per cent to 18 per cent.
28 Gillian Tan (2013), United Petroleum considers sale or JV, appoints KPMG as adviser, The Australian, July 26 2013, http://www.theaustralian.com.au/business/wall-street-journal/united-petroleum-considers-sale-or-jv-appoints-kpmg-as-adviser/story-fnay3vxj-1226686343858. Accessed 21 September 2013.
Monitoring of the Australian petroleum industry December 2013 lv

The retail market shares held by supermarkets and large independent retail chains have increased at a time when, as noted earlier (and further explored in chapter 12 of the 2013 petrol monitoring report) retail profits have increased also.
Role of the ACCCThe ACCC does not regulate prices in the downstream petroleum industry, nor does it have a role in setting petrol prices. Petrol prices in Australia are set by market forces.
The ACCC is an independent statutory authority that administers the Competition and Consumer Act 2010 (the Act) (formerly the Trade Practices Act 1974) and other laws. The purpose of the Act is to enhance the welfare of Australians through the promotion of competition and fair trading and provision for consumer protection. These laws apply to all industry sectors, including the fuel industry.
Apart from its monitoring functions, the ACCC’s activities in the fuel industry relating to the Act include enforcement and compliance, mergers and acquisitions, authorisations and notifications, and administration of the Oilcode.
The ACCC also maintains an active role in enhancing consumer awareness and information on petrol issues and engaging with stakeholders.
Enforcement and compliance
Misleading conduct and false representations
In 2012−13, the ACCC received around 100 complaints (around 11 per cent of all fuel related contacts) alleging misleading and deceptive conduct and false or misleading representations in the fuel industry. Similar to 2011–12, the main issues raised by consumers in 2012−13 included concerns about pricing practices, labelling on fuel pumps, advertising promotions (such as discount schemes), fuel quality claims and concerns about inaccurate fuel measurements.
Fuel price boards
In response to concern about the potential for consumers to be misled by the advertising of fuel prices, in particular discounted and undiscounted prices, on road side price boards, Treasury, together with all the Australian Consumer Law regulators have worked to identify options for a consistent national framework on fuel price board signage.
A public consultation paper on a proposed national petrol information standard was released in December 2012 and consultation undertaken with industry and consumer groups. In July 2013 no agreement was reached on the standard and Consumer Affairs Ministers decided that further public consultation with industry and consumer stakeholders was appropriate.
In November 2013, Consumer Affairs Ministers noted further consultation had taken place and agreed that the Federal Government would work on a proposal for a minimum mandatory information standard for price boards. It is anticipated that the proposed national information standard will be put to a vote by Consumer Affairs Ministers in 2014.
Price information sharing
The ACCC’s investigation into whether price information sharing arrangements in relation to the retail petrol sector may be in breach of the Act, announced on 3 May 2012, is nearing completion and it is anticipated it will be finalised in the coming months. The ACCC is concerned that these arrangements may lessen price competition in petrol retailing to the detriment of consumers by reducing independent rivalry between the major petrol retailers in their setting of prices.
These petrol price sharing arrangements allow for the private and very frequent exchange of comprehensive retail price information between the major petrol retailers.
lvi Monitoring of the Australian petroleum industry December 2013
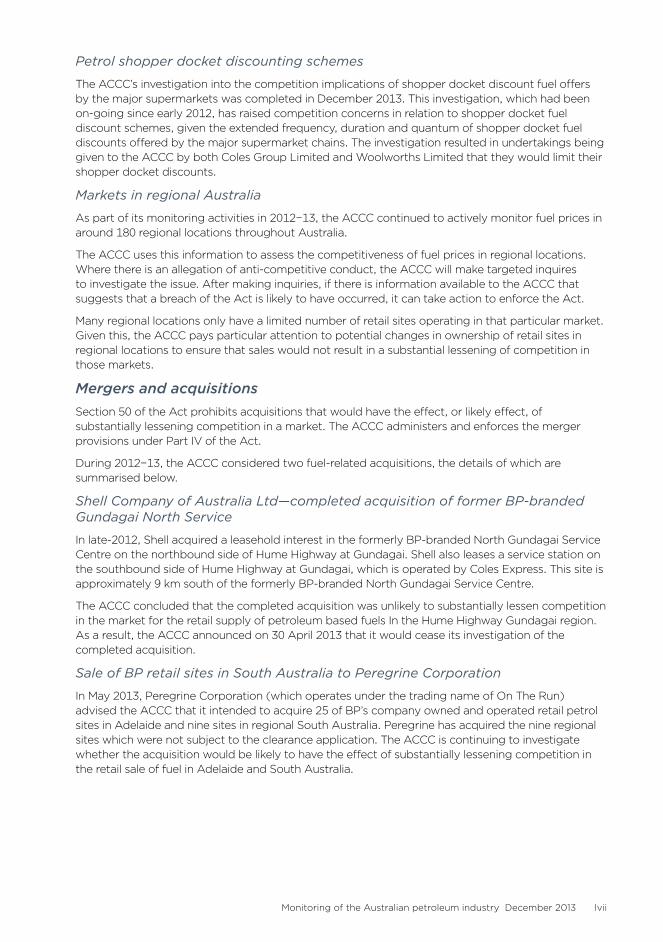
Petrol shopper docket discounting schemes
The ACCC’s investigation into the competition implications of shopper docket discount fuel offers by the major supermarkets was completed in December 2013. This investigation, which had been on-going since early 2012, has raised competition concerns in relation to shopper docket fuel discount schemes, given the extended frequency, duration and quantum of shopper docket fuel discounts offered by the major supermarket chains. The investigation resulted in undertakings being given to the ACCC by both Coles Group Limited and Woolworths Limited that they would limit their shopper docket discounts.
Markets in regional Australia
As part of its monitoring activities in 2012−13, the ACCC continued to actively monitor fuel prices in around 180 regional locations throughout Australia.
The ACCC uses this information to assess the competitiveness of fuel prices in regional locations. Where there is an allegation of anti-competitive conduct, the ACCC will make targeted inquires to investigate the issue. After making inquiries, if there is information available to the ACCC that suggests that a breach of the Act is likely to have occurred, it can take action to enforce the Act.
Many regional locations only have a limited number of retail sites operating in that particular market. Given this, the ACCC pays particular attention to potential changes in ownership of retail sites in regional locations to ensure that sales would not result in a substantial lessening of competition in those markets.
Mergers and acquisitionsSection 50 of the Act prohibits acquisitions that would have the effect, or likely effect, of substantially lessening competition in a market. The ACCC administers and enforces the merger provisions under Part IV of the Act.
During 2012−13, the ACCC considered two fuel-related acquisitions, the details of which are summarised below.
Shell Company of Australia Ltd—completed acquisition of former BP-branded Gundagai North Service
In late-2012, Shell acquired a leasehold interest in the formerly BP-branded North Gundagai Service Centre on the northbound side of Hume Highway at Gundagai. Shell also leases a service station on the southbound side of Hume Highway at Gundagai, which is operated by Coles Express. This site is approximately 9 km south of the formerly BP-branded North Gundagai Service Centre.
The ACCC concluded that the completed acquisition was unlikely to substantially lessen competition in the market for the retail supply of petroleum based fuels In the Hume Highway Gundagai region. As a result, the ACCC announced on 30 April 2013 that it would cease its investigation of the completed acquisition.
Sale of BP retail sites in South Australia to Peregrine Corporation
In May 2013, Peregrine Corporation (which operates under the trading name of On The Run) advised the ACCC that it intended to acquire 25 of BP’s company owned and operated retail petrol sites in Adelaide and nine sites in regional South Australia. Peregrine has acquired the nine regional sites which were not subject to the clearance application. The ACCC is continuing to investigate whether the acquisition would be likely to have the effect of substantially lessening competition in the retail sale of fuel in Adelaide and South Australia.
Monitoring of the Australian petroleum industry December 2013 lvii
Authorisations and notificationsIn certain circumstances, the ACCC can grant protection from legal action for certain anti-competitive conduct where the public benefit from that conduct outweighs any public detriment. Businesses may obtain protection from legal action by applying for an authorisation or submitting a notification to the ACCC.
All authorisation applications and notifications are available on a public register and on the ACCC’s website.
Authorisations
Authorisation is a process under which protection can, following the receipt of a valid application, be granted for potential breaches of the competition provisions of the Act—except for the misuse of market power—if the ACCC is satisfied the conduct delivers a net public benefit. There were no fuel-related authorisations lodged with the ACCC in 2012−13.
Exclusive dealing notifications
Exclusive dealing conduct involves placing restrictions on the supply of goods or services, such as requiring a person to purchase goods from a third-party supplier (known as third-line forcing), or requiring a person not to purchase goods from other competitors. Protection from legal action under the Act for engaging in this conduct can be obtained by lodging a notification with the ACCC.
In 2012−13, the ACCC considered four fuel-related third-line forcing exclusive dealing notifications, all of which were allowed to stand. The third-line forcing conduct under the notifications fell into two broad categories:
• shopper docket arrangements involving IGA supermarkets
• a discount on fuel purchased from a supplier to business entities who are participants In the buying-group program.
Administration of the Oilcode
The Oilcode came into effect on 1 March 2007 as a prescribed industry code of conduct under the Act and aims to regulate the conduct of suppliers, distributors and retailers in the downstream petroleum industry. A review of the Oilcode by the Department of Industry (formerly RET) is scheduled to commence in late 2013.
The ACCC’s role is to ensure compliance with the Oilcode and the Act by informing downstream petroleum industry participants of their rights and obligations under the law and by enforcing the law where necessary. In 2012−13, the ACCC received two complaints and five enquiries about the Oilcode. The complaints were not pursued as the issues identified were unlikely to raise concerns under the Oilcode or the Act.
Informing consumersWhile the ACCC’s primary role is to enforce the provisions of the Act, it also monitors fuel prices. In doing this, the ACCC seeks to educate consumers on what influences domestic retail prices by providing fact sheets, information on its website and by responding to calls to its Infocentre. Throughout 2012−13, the ACCC expanded and reviewed its public information activities to provide a broad range of information to consumers.
Stakeholder engagementIn addition to on-going liaison with key stakeholders as a part of its broader role, the ACCC formally consulted with fuel industry and consumer groups through its Fuel Consultative Committee (FuelCC). In 2012−13 the FuelCC met on two occasions and discussed a number of issues related to the fuel industry including sale of significant refining assets, availability of pricing information to consumers, state government mandates on biofuels, confusion about price cycles, fuel supply concerns, broader industry regulation and profitability of the fuel industry, and retail site drive-off failure-to-pay compliance issues.
lviii Monitoring of the Australian petroleum industry December 2013

1 Background and objectives
1.1 Background to the ACCC’s involvement in the petrol industry
The Australian Competition and Consumer Commission’s (ACCC) involvement in the petrol industry pre-dates the commencement of the present series of formal monitoring reports in 2008. The ACCC and its predecessors, the Trade Practices Commission and the Prices Surveillance Authority (PSA), have had extensive involvement in the petrol industry. Activities undertaken have included prices surveillance, public inquiries, informal price monitoring, public awareness and education activities as well as enforcement of the Competition and Consumer Act 2010 (the Act).
From 1984 the petrol industry was subject to a prices surveillance regime administered by the PSA. Under prices surveillance, the PSA, and subsequently the ACCC, established maximum wholesale prices for petrol, including freight differentials. Prices surveillance was abolished in August 1998.
Following deregulation, the ACCC continued to informally monitor the industry. Through this watching brief the ACCC was able to provide information to consumers through various ACCC publications and the ACCC website. Information collected from informal monitoring also assisted with administering the provisions of the Act and helped the ACCC prepare analyses and reports for the Australian Government and Parliament.
The ACCC’s 2007 inquiry into the petrol industry covered the industry structure, an assessment of competition, the determination of prices and possible methods to address impediments to efficient petrol pricing. The inquiry was triggered by concerns about a discrepancy between movements in domestic petrol prices and international petrol prices. A summary of the ACCC’s major findings and recommendations, and the government’s response, was presented in the ACCC 2009 petrol monitoring report.29
1.2 The petrol monitoring report
1.2.1 Minister’sDirectionOn 17 December 2007, the Minister for Competition and Consumer Affairs directed the ACCC, under subsection 95ZE(1) of the Trade Practices Act 1974 (since renamed the Competition and Consumer Act 2010), to conduct formal monitoring of prices, costs and profits relating to the supply of unleaded petroleum products. The minister directed the ACCC to undertake monitoring for three years. Subsequently, the minister extended the direction to the end of 2011 and then 2012. On 6 July 2012 the Assistant Treasurer, the Hon David Bradbury MP, issued a new direction for the ACCC to continue monitoring until 16 December 2013. This is the sixth annual monitoring report. The direction has been further extended into 2014.
1.2.2 ObjectivesofthemonitoringreportThe key objectives of the monitoring program derive from the minister’s direction, its accompanying letter, and the ACCC’s responsibilities under the Act.30 The program therefore has three key objectives:
• improving consumer awareness by increasing the amount of information available regarding the petrol industry
• complying with the minister’s direction by describing and analysing prices, costs and profits
29 ACCC, Monitoring of the Australian petroleum industry, December 2009, p. 6.
30 A copy of the minister’s direction is at appendix A.
Monitoring of the Australian petroleum industry December 2013 1

• focusing on areas of the industry where competition may be less than fully effective, and on industry conduct that may warrant further consideration by the ACCC.
1.2.3 ScopeofthemonitoringreportThis monitoring report covers the three major sectors of the downstream petrol industry: total supply (refining and importing), wholesaling and retailing (figure 1.1).
For each sector, the report presents detailed cost, revenue and profitability data. The report analyses data on wholesale and retail prices and volumes of petrol products, especially regular unleaded petrol (RULP) and premium unleaded petrol (PULP), as well as related petroleum products. As in previous years, this report also considers structural changes and trends in the industry, impacts of international factors, and developments in the market for ethanol blended petrol (EBP).
Figure 1.1 Scope of the 2013 petrol monitoring report
Upstream:Oil explorationand extraction
Domesticrefining
Buy-sell arrangements
Importingpetrol
Supply
Internationalrefining
Major wholesalers Major retailers
Minor wholesalers Minor retailers
1.3 Data collection
1.3.1 ProcessFor the 2013 monitoring report, the ACCC’s approach to data collection was similar to previous monitoring reports.
The report focusses on the Australian downstream industry. Consequently, the ACCC has not sought data from overseas suppliers of crude oil or refined product, domestic producers of crude oil or from minor wholesalers and retailers.
The following companies have provided information for the 2013 monitoring report:
• refiner-marketers: BP and Caltex31
• refiner-wholesalers: BP, Caltex, Mobil and Shell
31 ‘Refiner-marketers’ is the traditional term referring to the four companies (BP, Shell, Caltex and Mobil) which used to refine, wholesale and retail fuel in Australia. Mobil and Shell, while still marketing proprietary fuels, have effectively withdrawn from direct retailing. ‘Refiner-marketer’ is still used to refer to BP and Caltex as they are still integrated from refining to retailing. Mobil and Shell remain in refining and wholesaling. As these four companies account for all of refining output and the vast majority of wholesale sales, this report refers to them as ‘refiner-wholesalers’.
2 Monitoring of the Australian petroleum industry December 2013

• supermarket petrol retailers: Coles Express and Woolworths Petrol
• independent wholesalers: Liberty, United, Ausfuel and Neumann32
• independent retail chains: United, Ausfuel, Neumann, 7-Eleven and On The Run
• independent terminal owners: Vopak, Stolthaven, Terminals Pty Ltd and Coogee Chemicals.
Data was sought from the refiner-wholesalers, independent wholesalers, importers and retailers on wholesale, import and retail transactions, pricing benchmarks and financial performance. Information on the operation and capacity of terminals was sought from terminal owners/operators.
Monitored companies were asked to complete templates which provided standardised data, allowing the ACCC to analyse and compare across companies, and with previous years.
The ACCC wishes to thank the companies for the information provided for this report.
1.3.2 DatatemplatesIn the petrol industry, as with other industries, different companies use different business models, organisational structures and reporting systems. Even among petrol companies that operate in the same sector, there are differences in the way they operate and report data.
Differences in company reporting structures and accounting systems can complicate comparison of data across companies.
While the ACCC has sought to use data templates that as far as possible mirror companies’ own reporting frameworks, it has been necessary to use standardised data templates in order to ensure that data collected in the monitoring program is comparable across companies.
The design and conceptual basis of the financial and transactional data templates for 2012–13 were largely the same as for 2011–12.
1.4 Data issuesOver the course of the monitoring program the ACCC has encountered a number of recurring issues in collecting and processing data. These are further explored below.
1.4.1 SectorialCoverageAs noted above, the downstream petrol industry comprises three major segments: total supply (refining and importing), wholesaling and retailing. Coverage of the ACCC’s monitoring program varies according to sector.
The ACCC collects data from the four Australian refiners and the major importers, so the report has close to comprehensive coverage of the total supply sector.
In the wholesale sector the monitoring program covers the refiner-wholesalers, as well as the major independent wholesalers. There are a large number of other independent, though small, wholesalers from which it would not be possible to collect data, so coverage, while extensive, is not complete. Despite this, it is pertinent to note that all wholesalers need to acquire products from either a refiner or an importer, thus allowing sales volumes to be estimated.
Similarly, retail includes a large number of small independent operators from which it was not possible to collect data, so the coverage of this sector is less than complete. Data on this sector was obtained from the two refiner-marketers, the supermarkets and the large independent retailers. Retail price data for some of the smaller retailers was obtained from Informed Sources. Retail sales volumes of smaller operators can be estimated from the data provided by refiner-marketers on their wholesale transactions.
32 On 4 March 2013 Puma Energy announced the acquisition of Ausfuel and Neumann; see http://www.pumaenergy.com/2013/03/04/puma-energy-completes-ausfuel-and-neumann-petroleum-acquisitions; accessed 11 November 2013.
Monitoring of the Australian petroleum industry December 2013 3

1.4.2 ProductCoverageIn reporting on the prices, costs and profits of unleaded petrol products (RULP, PULP and EBP), the ACCC also considers other products in the Australian downstream petroleum market, specifically diesel and automotive liquid petroleum gas (LPG), as well as non-fuel retail sales. Most monitored companies include some or all of these in their operations; hence they are included to provide a more comprehensive analysis of the industry.
1.4.3 DatavolatilityThe financial performance of the industry, particularly at the total supply level, is affected by many factors, some of which are particularly volatile.
The most significant factors are the price movements of the industry’s key input, crude oil, and outputs, refined petrol products. These are globally traded commodities and their prices are subject to considerable volatility. As transactions for these commodities are undertaken in USD, changes in the exchange rate can also affect financial outcomes expressed in AUD. Changes in commodity prices and the USD–AUD exchange rate can also impact on the values of what are sometimes significant inventory holdings.
The effects of changes in the values of inventory holdings and foreign exchange transactions are reflected in the adjusted earnings before interest and tax (EBIT) data. Only the effects of foreign exchange transactions are reported separately to the ACCC as part of the monitoring of the total supply sector, which is the sector with the greatest exposure to foreign currency fluctuations.
Financial performance can also be affected by one-off events such as impairment charges resulting from asset revaluations impacted by re-assessments of their future earnings potential. These costs have been reported separately to the ACCC, but as they are not associated with monitored firms’ normal business operations they have been excluded from the calculation of adjusted EBIT.
1.4.4 TimeseriesTo assist in understanding the volatility in financial performance, the ACCC presents data from 2002–03 so as to provide a long term perspective. In a number of charts, the ACCC has presented average the key performance indicators over this time series so as to smooth out the historical cost profits. Transactional data is presented from 2007–08.
Data for time series longer than three years is presented in real terms. In chapters 11 and 12 all data used to assess the financial performance of the downstream petroleum industry is in real terms. Financial year 2012–13 is used as the base year.
1.4.5 AllocatingcostsOne of the issues in monitoring an industry producing, importing and selling a range of products is that costs cannot necessarily be directly attributed to a particular product or service. Petroleum products are produced jointly as part of a suite of products. The nature of petrol refining is that it is more efficient and economical to employ refinery processes and staff to produce a number of petroleum products as part of the same operations. Similarly, many wholesale and retail costs are common to the supply of these products, and non-fuel products for retailers, as they are often sold from the same premises by the same staff.
The existence of common and joint costs means that costs must be ‘allocated’ to individual products. As the monitored companies do not generally measure profits by product or service, they do not allocate costs to individual products or services.
The methodology the ACCC has used to allocate common costs in the 2013 monitoring report is consistent with that used in previous reports. Product volumes have been used as the basis for splitting costs, with the assumption being that costs indirectly associated with refining or selling products tend to be proportional to their volumes. This methodology has been used for the total supply (including refining) and wholesale sectors.
4 Monitoring of the Australian petroleum industry December 2013

The allocation of common costs in the retail sector differs slightly due to the existence of convenience store activities. Costs are first allocated on the basis of gross profit on petroleum sales and on convenience sales. Costs estimated for petroleum product activities are then further allocated to individual products on the basis of their respective sales volumes.
While the ACCC has used well accepted cost allocation rules and conventions such as using production volumes, sales volumes and sales values, care should be taken when interpreting data presented in this report as there is no exact way of allocating common costs.
1.4.6 CostbasisFinancial data can be measured and reported either on the basis of historical costs or current (replacement) costs. Historical cost is based on the actual or original cost, while replacement cost is based on the current market price of the product or service. Depending on the volatility of costs, the basis used can have an impact on financial results. In an environment of price stability, historical and replacement costs are likely to be similar. However, when prices are volatile, there is a divergence in the data produced by historical and replacement cost measures.
The cost of the major input into the production of refined petrol—crude oil—can change significantly between the times of purchase and when it is used to produce refined petrol. Consequently, the use of historical cost at a time of rapidly changing prices means that refining profits are affected by timing considerations.
Replacement cost on the other hand is a popular measure used in the oil industry by some firms with refinery operations. This measure excludes the impact of changes in the price of oil and refined products which are seen as external factors impacting profits outside the control of management. By excluding these movements, replacement cost provides a more effective understanding of management performance.
For the ACCC monitoring program, data is collected from companies on a historical cost basis for a number of reasons: not all monitored companies report on a replacement cost basis; historical cost accounting is consistent with Australian and international accounting standards; and finally, historical cost valuation allows the ACCC to compare monitored companies with companies in other industries.
1.4.7 ConfidentialityThe information provided to the ACCC is mostly commercially sensitive and has been provided on a confidential basis. To protect confidentiality, this report presents primarily aggregated analysis of costs, revenues and profits.
1.5 Report outlineThe structure of the 2013 monitoring report is consistent with the structure adopted for previous monitoring reports and reflects the key features and characteristics of the Australian downstream petrol industry as well as other relevant issues highlighted in the minister’s direction.
The report’s structure is as follows:
Chapter 2 describes the ACCC’s petrol-related activities in 2012–13
Chapter 3 presents developments in the industry structure
Chapter 4 provides an international context for price setting in Australia in 2012–13
Chapter 5 focuses on developments in the market for ethanol blended petrol
Chapter 6 assesses pricing in the wholesale sector
Chapter 7 describes trends in the market for premium grades of petrol
Chapter 8 outlines prices in the retail sector
Monitoring of the Australian petroleum industry December 2013 5

Chapter 9 focuses on retail pricing in regional locations
Chapter 10 considers major retail pricing issues in 2012–13
Chapter 11 analyses the revenue, costs and profits in the total downstream petroleum industry
Chapter 12 analyses the revenue, costs and profits in the refining, total supply, wholesale and retail sectors
6 Monitoring of the Australian petroleum industry December 2013

2 ACCC activities related to the petroleum industry
Key pointsIn 2012–13 the ACCC
• considered around 900 complaints and inquiries about fuel related issues
The issues most commonly raised by consumers related to high prices, fuel quality, and allegations of anti-competitive conduct.
• continued fuel monitoring activities in Australia, including in all Australian capital cities and in around 180 regional locations
• concluded an investigation into the competition implications in relation to shopper docket discount fuel offers by the major supermarkets
• continued an investigation into price information sharing arrangements in the retail petrol sector
• started working with state government regulators and industry stakeholders to develop a consistent approach to fuel price boards
• continued a focus on improving consumer understanding about fuel issues by updating fuel related information on the ACCC’s new website and other publications, and providing informed comment to media organisations
The ACCC’s fuel related web pages received more than 300 000 hits in 2012–13, and included one of the most-visited pages on the ACCC website.
• engaged with stakeholders to identify opportunities to improve compliance with the Competition and Consumer Act 2010 and held two Fuel Consultative Committee meetings.
2.1 Introduction The ACCC’s main role is to enforce the Competition and Consumer Act 2010 (the Act) across the Australian economy, which includes the fuel industry. The ACCC’s activities relating to the Act included enforcement and compliance, mergers and acquisitions, authorisations and notifications, and administration of the Oilcode. This chapter outlines the ACCC’s activities in relation to the downstream petroleum industry in 2012–13.
In 2012–13, the ACCC continued a range of activities in the fuel industry to address concerns about possible competition and consumer protection issues, including:
• an examination of the price information sharing arrangements in the retail petrol industry and their impact on competition
• an examination of the effect of ‘shopper docket’ discounts on competition in the retail fuel market.
Monitoring of the Australian petroleum industry December 2013 7

2.2 Enforcement and compliance under the Competition and Consumer Act
Complaints and inquiries regarding fuel
The ACCC receives information about potential breaches of the Act from a wide variety of sources, with the most common source being complaints and inquiries from consumers. During 2012–13 the ACCC received around 900 complaints and inquiries about fuel issues, which was around a third lower than the total number of complaints and inquiries received in 2011–12.
The topics which raised most concern included the price of fuel being too high, issues relating to fuel discount shopper dockets, alleged collusion and other restrictive trade practices, price discrepancies between boards and fuel pumps, accuracy of fuel pumps, and issues concerning fuel quality.
Similar to previous years, in 2012–13 the number of fuel related complaints and inquiries received by the ACCC moved broadly in line with movements in retail petrol prices. Generally, when fuel prices increase, complaints and inquiries to the ACCC also increase.
While petrol prices during 2012–13 were at levels similar to early 2008, the level of complaints has been much lower. This could be due to the relative stability of prices in 2012–13 when compared with the sharp price rises seen in 2008. A relatively large number of complaints were received in early 2012, which were also associated with a sharp petrol price increase. This may demonstrate consumer sensitivity to rapid price rises (chart 2.1).
Chart 2.1 Fuel contacts received by the ACCC by month and average petrol prices in the five largest cities: July 2007 to June 2013
Num
ber of c
ontacts
0
100
200
300
400
500
600
700
800
900
Jun–13Apr–13Jan–13Oct–12Jul–12Apr–12Jan–12Oct–11Jul–11Apr–11Jan–11Oct–10Jul–10Apr–10Jan–10Oct–09Jul–09Apr–09Jan–09Oct–08Jul–08Apr–08Jan–08Oct–07Jul–07
Price
(cp
l)
0
20
40
60
80
100
120
140
160
180
Jun–13Apr–13Jan–13Oct–12Jul–12Apr–12Jan–12Oct–11Jul–11Apr–11Jan–11Oct–10Jul–10Apr–10Jan–10Oct–09Jul–09Apr–09Jan–09Oct–08Jul–08Apr–08Jan–08Oct–07Jul–07
Retail petrol price (five-city monthly average)Number of contacts
Apr
–13
Jan–
13
Oct
–12
Jul–
12
Apr
–12
Jan–
12
Oct
–11
Jul–
11
Apr
–11
Jan–
11
Oct
–10
Jul–
10
Apr
–10
Jan–
10
Oct
–09
Jul–
09
Apr
–09
Jan–
09
Oct
–08
Jul–
08
Apr
–08
Jan–
08
Oct
–07
Jul–
07
Source: ACCC and Informed Sources data
Potential compliance issues
About 18 per cent of complaints and inquiries received about the fuel industry related to potential compliance issues under the Act. The ACCC examined these contacts carefully and made further inquiries or assessments in respect of 11 matters.
8 Monitoring of the Australian petroleum industry December 2013

High prices
The ACCC does not set wholesale or retail petrol prices in Australia. Retailers and wholesalers are free to set their prices according to market conditions. As detailed in chapter 8, retail fuel prices are largely driven by movements in international market prices for crude oil and refined petroleum products. Despite this, concern about high fuel prices was the most commonly raised issue among complaints and inquiries to the ACCC in 2012–13, at more than 20 per cent. Similar to 2011–12, common price-related issues included complaints or inquiries about:
• differences in fuel prices between suburbs, towns or service stations
• differences in fuel prices for one type of fuel compared to another
• the relationship between retail fuel prices in Australia and international benchmark prices.
2.2.1 Anti-competitiveconductDuring 2012–13, the ACCC continued its focus on examining allegations of anti-competitive conduct in the retail fuel industry. If warranted by the information provided in support of the allegation, the ACCC undertakes further analysis of fuel prices in the metropolitan and regional areas in the context of allegations. Where there is information to suggest a breach of the Act may have occurred, the ACCC investigates and gathers further information by making targeted inquiries. After making inquiries, if the information available to the ACCC shows that a breach of the Act may have occurred, it may take legal action.
While most matters were addressed directly with the complainants, the ACCC identified a number of matters concerning allegations of anti-competitive conduct for further investigation over the 2012–13 financial year. The two most significant investigations are noted below.
2.2.2 Priceinformationsharing—fuelcompaniesOn 3 May 2012, the ACCC announced an investigation into whether price information sharing arrangements in the retail petrol sector may be in breach of the Act. The ACCC is concerned that these arrangements may substantially lessen price competition in petrol retailing to the detriment of consumers by reducing independent rivalry between the major petrol retailers in their setting of prices.
These petrol price sharing arrangements allow the private and very frequent exchange of comprehensive retail price information between the major petrol retailers.
The investigation is continuing but is expected to be finalised in the coming months.
2.2.3 ShopperdocketfueldiscountingschemesThe ACCC’s investigation into the competition implications in relation to shopper docket discount fuel offers by the major supermarkets was completed in December 2013.
This investigation, which had been ongoing since mid-2012, considered whether competition issues arise in relation to shopper docket discount fuel schemes, given the extended frequency, duration and quantum of shopper docket fuel discounts offered by the major supermarket chains. The investigation resulted in undertakings being given to the ACCC by both Coles Group Limited and Woolworths Limited that they would limit their shopper docket discounts.
2.2.4 MisleadingconductandfalserepresentationsIn 2012–13, the ACCC received around 100 complaints (around 11 per cent of all fuel related contacts) alleging misleading and deceptive conduct and false or misleading representations. Conduct would be in breach of the Act where it misleads, deceives or is likely to mislead or deceive consumers. Such conduct may include lying to consumers, leading them to a wrong conclusion, creating a false impression or making false or inaccurate claims.
Monitoring of the Australian petroleum industry December 2013 9

Similar to 2011–12, the main issues raised by consumers in 2012–13 included concerns about pricing practices, labelling on fuel pumps, advertising promotions (such as discount schemes), fuel price boards, fuel quality claims and concerns about inaccurate fuel measurements.
2.2.5 FuelpriceboardsThere has been growing concern among Australian Consumer Law agencies and fuel industry stakeholders about the potential for consumers to be misled by the advertising of fuel prices, in particular conditionally discounted prices on road-side price boards. In July 2012, Ministers for Consumer Affairs requested Australian Consumer Law regulators to identify options for a consistent national framework on fuel price board signage.
A public consultation paper on a proposed national petrol information standard was released in December 2012 and consultation undertaken with industry and consumer groups. Members of the ACCC’s Fuel Consultative Committee discussed the proposal in 2012 and 2013.
In July 2013 Ministers noted that agreement was not reached over a national information standard. Ministers agreed to undertake further consultation with industry and consumer stakeholders.
In November 2013, Consumer Affairs Ministers noted further consultation had taken place and agreed that the Australian Government would work on a proposal for a minimum mandatory information standard for price boards. It is anticipated that the proposed national information standard will be put to a vote by Consumer Affairs Ministers in 2014.
2.2.6 MergersandacquisitionsSection 50 of the Act prohibits acquisitions that would have the effect, or likely effect, of substantially lessening competition in a market. The ACCC administers and enforces the merger provisions under Part IV of the Act.
During 2012–13 the ACCC considered two fuel-related acquisitions, the details of which are summarised below.
Shell Company of Australia Ltd—completed acquisition of former BP-branded Gundagai North Service
In late 2012 Shell acquired a leasehold interest in the formerly BP-branded North Gundagai Service Centre on the northbound side of the Hume Highway at Gundagai. Shell also leases a service station site on the southbound side of the Hume Highway at Gundagai, which is operated by Coles Express. This site is approximately 9 km south of the formerly BP-branded North Gundagai Service Centre.
The ACCC concluded that the completed acquisition was unlikely to substantially lessen competition in the market for the retail supply of petroleum based fuels in the Hume Highway Gundagai region for the following reasons:
• the former BP-branded Gundagai North Service Centre (Target site) and the Shell-branded South Gundagai Service Centre (South site), were not close competitors prior to the completed acquisition because:
– although both sites were located close to the highway and were visible and accessible to vehicles travelling in both directions, only a small percentage of vehicles crossed the highway to purchase petrol prior to the acquisition
– there was no evidence of price competition between the sites prior to the acquisition
• a number of large transport companies, whose vehicles represented a significant percentage of the commercial traffic on the highway in the Gundagai region, operated their own petrol bowsers and as such did not need to purchase petrol at either the Target site or the South site
• the availability of substitutes to the Target site and the South site, including Caltex at Tarcutta, BP at Jugiong; and to a lesser degree the Caltex at Yass, and Caltex stations at Holbrook.
On 30 April 2013 the ACCC announced it would cease its investigation of the completed acquisition.
10 Monitoring of the Australian petroleum industry December 2013

Sale of BP retail sites in South Australia to Peregrine Corporation
In May 2013, Peregrine Corporation (which operates under the trading name of On The Run) advised the ACCC that it intended to acquire 25 of BP’s company owned and operated retail petrol sites in Adelaide and nine sites in regional South Australia. Peregrine has acquired the nine regional sites which were not subject to the clearance application. The ACCC is continuing to investigate whether the acquisition would be likely to have the effect of substantially lessening competition in the retail sale of fuel in Adelaide and South Australia.
2.2.7 AuthorisationsandnotificationsIn certain circumstances, the ACCC can grant protection from legal action for certain anti-competitive conduct where that conduct delivers an offsetting public benefit. Businesses may obtain protection from legal action by applying for an authorisation or lodging a notification with the ACCC. Authorisation applications and notifications are available on a public register on the ACCC’s website.
Authorisations
Authorisation is a process under which legal protection can, following the receipt of a valid application, be granted for potential breaches of the competition provisions of the Act, except for misuse of market power, if the ACCC is satisfied the conduct delivers a net public benefit. There were no fuel-related authorisation applications lodged with the ACCC in 2012–13.
Exclusive dealing notifications
For certain types of conduct, including exclusive dealing, protection from legal action under the Act can also be obtained by lodging a notification with the ACCC. Exclusive dealing involves placing restrictions on the supply of goods or services such as requiring a person to purchase goods from a third-party supplier (known as ‘third line forcing’).
In 2012–13, the ACCC considered four fuel-related third line forcing exclusive dealing notifications, all of which were allowed. The third line forcing conduct under the notifications fell into two broad categories:
• shopper docket arrangements involving IGA supermarkets
• a discount on fuel purchased from a supplier to business entities who are participants in the buying-group program.
2.2.8 AdministrationoftheOilcodeThe Oilcode aims to regulate the conduct of suppliers, distributors and retailers in the downstream petroleum retail industry. It encourages greater transparency of terminal gate pricing and fuel re-selling agreements, whilst providing greater certainty for industry participants regarding the supply of petroleum products and tenure under fuel reselling agreements. The code also provides an effective and relatively inexpensive method to resolve disputes between suppliers, distributors or retailers.
The Oilcode came into effect on 1 March 2007 as a prescribed industry code of conduct under the Act. A review of the Oilcode by the Department of Resources, Energy and Tourism (RET) in 2008–09 resulted in a number of amendments to the code. The amendments came into effect on 3 July 2012. A further review of the Oilcode by the Department of Industry (formerly RET) is scheduled to commence by the end of 2013.
The ACCC’s role is to ensure compliance with the Oilcode and the Act by informing downstream petroleum industry participants of their rights and obligations under the law and by enforcing the law where necessary. In 2012–13, the ACCC received two complaints and five enquiries about the Oilcode. The complaints were not pursued as the issues identified were unlikely to raise concerns under the Oilcode or the Act.
Monitoring of the Australian petroleum industry December 2013 11

2.3 Monitoring activities In 2012–13 the ACCC monitored petrol, diesel and automotive LPG prices across the majority of Australia on a daily basis. Monitoring supports the ACCC’s primary role of preventing anti-competitive conduct and protecting consumers. Formal monitoring activities included the production of this report, in response to the direction by the former Assistant Treasurer as minister responsible for competition policy matters.
The extensive fuel price information collected by the ACCC includes:
• retail prices of petrol, diesel and automotive liquefied petroleum gas (LPG) in the capital cities and around 180 regional locations
• premium unleaded petrol (PULP) 95/96 and PULP 98 prices in all capital cities and available regional centres and country towns
• E10 petrol (regular unleaded petrol with up to 10 per cent ethanol) prices in around 70 locations across Australia
• international crude oil and relevant international refined fuel prices
• data on wholesale transactions related to petrol
• published terminal gate prices (TGPs) of the oil companies and some independent wholesalers
• certain financial information from firms monitored under the formal monitoring program.
2.3.1 TheACCCandregionalengagementonfuelpricesAs part of its monitoring activities, the ACCC obtains fuel price information for around 180 regional locations throughout Australia. It also engages with industry groups and members of the public to collect additional information about regional fuel pricing issues.
The ACCC uses this information to monitor regional fuel prices against relevant benchmarks. Where there is an allegation of anti-competitive conduct, it will make targeted inquiries to investigate the issue. After making inquiries, if there is information available to the ACCC that a breach of the Act is likely to have occurred, it can take action to enforce the Act.
In addition, the ACCC pays particular attention to any potential changes in the ownership of retail sites in regional locations. Given many regional locations have a limited number of retail sites, the ACCC monitors such changes to ensure that the sale will not substantially lessen competition in that particular market.
2.4 Informing consumers While the ACCC’s primary role is to enforce the provisions of the Act, it also monitors fuel prices. In doing this, it seeks to educate consumers on what influences domestic retail prices by providing fact sheets and other information on the ACCC website and by responding to calls to our Infocentre. Throughout 2012–13 the ACCC expanded and reviewed public information activities to provide a broad range of information to consumers.
2.4.1 WebsiteIn 2012–13 the ACCC reviewed and updated fuel related content as part of the ACCC’s release of its new website. Information was also reviewed to improve accessibility standards of the information. The website is located at www.accc.gov.au/consumers/petrol-diesel-and-lpg.
The ACCC’s fuel related web pages received more than 330 000 hits in 2012–13. In particular, the city petrol prices page, which provides information about recent highest and lowest weekly petrol prices in each of the five largest cities, was the second highest page visited on the ACCC website with over 65 000 hits from February–June 2013.
12 Monitoring of the Australian petroleum industry December 2013

Fact sheets on a range of fuel related topics are available on the ACCC’s website which explain issues of concern to consumers, including unleaded petrol, petrol price cycles in Australia, regional fuel prices, diesel and automotive LPG fuel.
2.4.2 MinisterialcorrespondenceIn 2012–13 the ACCC addressed around 40 items of correspondence from Commonwealth and State parliamentarians on fuel issues. The most common topics were:
• high automotive fuel prices in regional locations
• fuel price differentials between regional locations and larger cities, and between regional locations
• high prices for automotive LPG fuel.
2.4.3 ACCCInfocentreDuring 2012–13 the ACCC Infocentre served more than 106 000 phone calls, and provided over 26 000 responses by email or letter. Of these, around 900 contacts raised fuel-related issues. Issues arising from these calls are discussed in section 2.2.
2.4.4 EnhancingconsumerunderstandingThe ACCC regularly engages with newspapers, television, radio and internet media outlets with the objective of making information about its analysis and developments in the petroleum industry more accessible to consumers. In 2012–13 the ACCC distributed news releases and/or provided informed comment on a variety of issues including:
• high petrol prices in regional areas and smaller cities, including differentials with fuel prices in capital cities
• petrol price cycles in larger cities
• fuel price boards
• shopper dockets
• diesel and automotive LPG prices
• the impact of exchange rate movements on petrol prices.
The ACCC also distributed a published formal monitoring report and summary of the 2012 report to key stakeholders.
2.5 Engagement with key stakeholdersIn 2012–13 the ACCC continued to engage with key stakeholders including consumers, industry and government organisations on a range of fuel issues.
2.5.1 ACCCConsultativeCommitteesIn addition to on-going liaison with key stakeholders as a part of its broader role, the ACCC formally consulted with industry and consumer groups through its consultative committees.
Fuel Consultative Committee
The ACCC formed the Fuel Consultative Committee (FuelCC) in 2010 to:
• provide an opportunity for meaningful dialogue between the ACCC, the fuel industry and motoring organisations and
• provide information to increase the ACCC’s understanding of fuel industry issues and to assist the ACCC in undertaking its role under the Act on issues related to competition and consumer protection in the fuel industry.
Monitoring of the Australian petroleum industry December 2013 13

There are currently 16 members on the FuelCC including retailers, refiner-marketers, industry associations and motoring organisations.
In 2012–13 the FuelCC met on two occasions and discussed issues including industry consolidation, sale of significant refining assets, availability of pricing information to consumers, state government mandates on biofuels, confusion about price cycles, fuel supply concerns, broader industry regulation and profitability of the fuel industry, and retail site drive-off failure-to-pay issues.
2.5.2 OthergovernmentbodiesAs a part of its broader role, the ACCC liaises and shares information in accordance with its Information Sharing Policy with the following government bodies to fulfil its functions under the Act:
• the Australian Government Treasury concerning fuel pricing issues and the fuel industry broadly
• the Australian Government Department of Industry about the fuel industry broadly and fuel supply, including security of supply
• the Australian Government Department of the Environment (formerly Dept of Sustainability, Environment, Water, Population and Communities) in relation to the quality of fuel supplies, including allegations of contamination
• the National Measurement Institute in relation to concerns about trade measurement practices
• state and territory government agencies regarding consumer protection and other fuel related issues such as state offices of fair trading and the FuelWatch monitoring service administered by the West Australian Government.
2.5.3 ConsumergroupsIn addition to meetings of the FuelCC and its efforts to increase consumer understanding about fuel prices, the ACCC corresponds and meets with consumer groups and motoring organisations to address concerns raised about the conduct of petrol retailers which affect consumers. In 2012–13 the ACCC engaged with organisations which included the motoring organisations across Australia.
Issues raised by these groups and considered by the ACCC included:
• labelling of petrol pumps at retail petrol stations
• proposals for increasing fuel pricing information available to consumers
• fuel price boards
• retail price differentials between RULP and PULP
• retail price differentials between metropolitan and regional areas
• allegations of anti-competitive conduct
• new and emerging issues in the fuel industry.
2.5.4 IndustryassociationsThe ACCC regularly corresponds and meets with industry associations to address key issues in the fuel industry. Organisations with which the ACCC engaged in 2012–13 include the Australasian Convenience and Petroleum Marketers Association (ACAPMA), the Australian Institute of Petroleum (AIP), and motoring organisations including the Australian Automobile Association (AAA), National Roads and Motorists’ Association (NRMA), Royal Automobile Club of Queensland (RACQ) and Royal Automobile Club of Tasmania (RACT).
14 Monitoring of the Australian petroleum industry December 2013
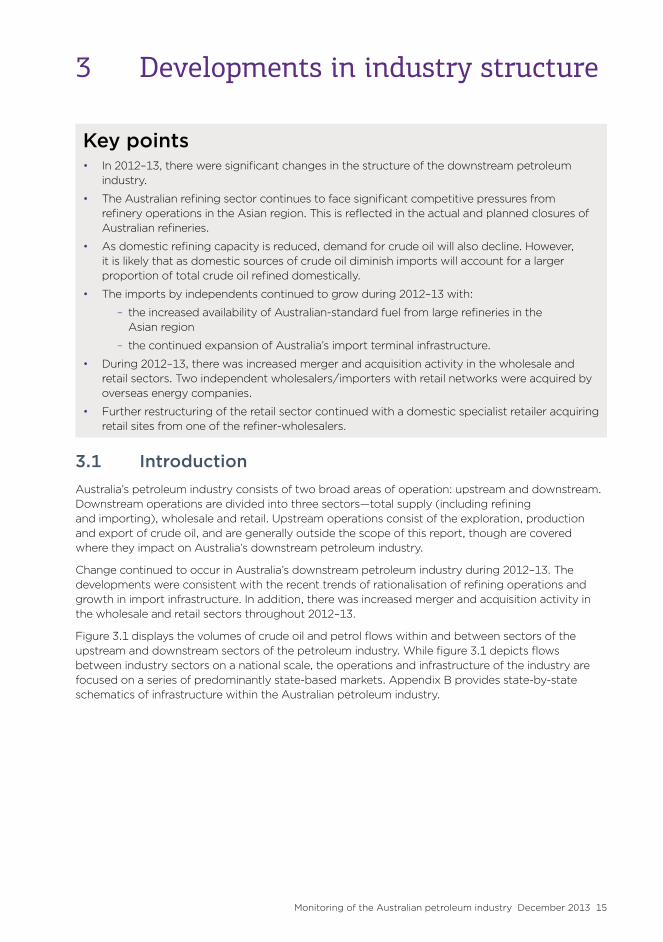
3 Developments in industry structure
Key points• In 2012–13, there were significant changes in the structure of the downstream petroleum
industry.
• The Australian refining sector continues to face significant competitive pressures from refinery operations in the Asian region. This is reflected in the actual and planned closures of Australian refineries.
• As domestic refining capacity is reduced, demand for crude oil will also decline. However, it is likely that as domestic sources of crude oil diminish imports will account for a larger proportion of total crude oil refined domestically.
• The imports by independents continued to grow during 2012–13 with:
– the increased availability of Australian-standard fuel from large refineries in the Asian region
– the continued expansion of Australia’s import terminal infrastructure.
• During 2012–13, there was increased merger and acquisition activity in the wholesale and retail sectors. Two independent wholesalers/importers with retail networks were acquired by overseas energy companies.
• Further restructuring of the retail sector continued with a domestic specialist retailer acquiring retail sites from one of the refiner-wholesalers.
3.1 IntroductionAustralia’s petroleum industry consists of two broad areas of operation: upstream and downstream. Downstream operations are divided into three sectors—total supply (including refining and importing), wholesale and retail. Upstream operations consist of the exploration, production and export of crude oil, and are generally outside the scope of this report, though are covered where they impact on Australia’s downstream petroleum industry.
Change continued to occur in Australia’s downstream petroleum industry during 2012–13. The developments were consistent with the recent trends of rationalisation of refining operations and growth in import infrastructure. In addition, there was increased merger and acquisition activity in the wholesale and retail sectors throughout 2012–13.
Figure 3.1 displays the volumes of crude oil and petrol flows within and between sectors of the upstream and downstream sectors of the petroleum industry. While figure 3.1 depicts flows between industry sectors on a national scale, the operations and infrastructure of the industry are focused on a series of predominantly state-based markets. Appendix B provides state-by-state schematics of infrastructure within the Australian petroleum industry.
Monitoring of the Australian petroleum industry December 2013 15

Figure 3.1 Crude oil and petrol flows through the Australian petroleum industry: 2012–13
21 000 ML Australian crude oil
Upstream
100 MLExportedpetrol
15 500 MLCrude oilexports
Domestic refining
15 000 ML Petrol refined
15 600 ML Petrol sold by retailers
Consumers
3100 MLPetrol sold directly to distributors and end users
3500 MLImportedpetrol
300 MLEthanol added at wholesale stage (for EBP)
18 700 ML Petrol sold by wholesalers
Imports & exports
5500 MLAustralian crude oil
Wholesale Retail
35 000 MLCrude oil refined
29 500 ML Importedcrude oil
Total supply
18 400 MLPetrol sold to wholesalers
Sources: Bureau of Resources and Energy Economics (BREE), Australian Petroleum Statistics, issue 203 (June 2013); ACCC estimates based on data obtained from firms monitored through the ACCC’s monitoring process and APAC Biofuel Consultants, Australian Biofuels 2012–13.
Note: Not all crude oil supplies are used in the manufacture of automotive fuels.
This chapter outlines the main features of the Australian downstream petroleum industry and highlights developments in the structure of the industry during 2012–13. In particular, this chapter details recent developments in Australian refining and importing operations and the latest trends in the wholesale and retail sectors. This chapter also describes the Australian context for crude oil, the major input in the production of refined fuels.
3.2 Crude oil productionDuring 2012–13 Australia continued to export the majority of its crude oil production and rely on imports for domestic refining.
The majority of domestic crude oil is light and sweet and is mainly sourced from two areas in Australia: the North West Shelf in Western Australia and the South East Gippsland Basin in Victoria. Although Australian refineries are able to process these crude oils, Australian companies generally prefer to export a large proportion of light and sweet crude oil, as these crude oil grades have traditionally generated premium prices in international markets. Australian refineries are also capable of processing cheaper, heavier varieties of crude oil, which are imported.
In 2012–13, Australia produced around 21 000 megalitres (ML) of crude oil. Since 2005–06, Australia has generally exported increasing proportions of its locally produced crude oil, as shown in chart 3.1. This trend continued in 2012–13, with 74 per cent of Australia’s crude oil production being exported, while 26 per cent was used in local refineries.
16 Monitoring of the Australian petroleum industry December 2013

The recent and planned reduction in Australia’s refining capacity (as outlined in section 3.3) will lessen future crude oil requirements in Australia. There has also been a decline in crude oil production in Australia over the past decade.
Chart 3.1 Volumes and percentage of Australian crude oil and condensate production used for domestic use or exported: 2002–03 to 2012–1333
0
5000
10000
15000
20000
25000
30000
35000
2012–132011–122010–112009–102008–092007–082006–072005–062004–052003–042002–03
meg
alitres
ExportedRefined in Australia
Sources: Department of Resources, Energy and Tourism (RET) and BREE, Australian Petroleum Statistics, various issues.
Note: Due to data revisions by BREE, chart may not be comparable with equivalent chart in previous monitoring reports.
3.2.1 OriginofcrudeoilimportsIn 2012–13, Malaysia continued to be the largest source of crude oil imports in Australia (chart 3.2). United Arab Emirates and Indonesia also remained large sources of crude oil imports, while there was a marked increase in the amount of crude oil sourced from Congo, Libya and Vietnam during 2012–13 compared with 2011–12.
33 Condensate is defined in the Excise Act 1901 as either (a) liquid petroleum, that is, a mixture of hydrocarbons that is produced from gas wells and that Is liquid at standard temperature and pressure after recovery in surface preparation facilities, or (b) another substance that is derived from gas associated with oil production and that is liquid at standard temperature and pressure.
Monitoring of the Australian petroleum industry December 2013 17

Chart 3.2 Major sources of crude oil imports to Australia: 2009–10 to 2012–13
0 1000 2000 3000 4000 5000 6000
Malaysia
United ArabEmirates
Indonesia
Nigeria
Vietnam
New Zealand
Libya
Gabon
Congo
Brunei
PapuaNew Guinea
Russia
megalitres (ML)2010–112009–10 2012–132011–12
Source: BREE, Australian Petroleum Statistics, issue 203 (June 2013).
3.3 Australian refiningThere are currently six refineries operating in Australia:
• BP’s Bulwer Island refinery (Brisbane)
• BP’s Kwinana refinery (Perth)
• Caltex’s Kurnell refinery (Sydney)
• Caltex’s Lytton refinery (Brisbane)
• Mobil’s Altona refinery (Melbourne)
• Shell’s Corio refinery (Geelong).
18 Monitoring of the Australian petroleum industry December 2013

Australia’s refineries are small by international standards and face increasing competitive pressures from large and complex international refineries. Throughout 2012–13 there were a number of significant events that occurred within Australia’s refining sector, including:
• In July 2012, Caltex announced that it would close its Kurnell refinery in the second half of 2014 and convert it into an import terminal.34
• In August 2012, Mobil formally closed its Port Stanvac refinery in Adelaide that was mothballed in 2003. Mobil has commenced demolition of its Port Stanvac refinery, with work planned to be completed by the end of 2013.35
• Throughout September and October 2012, Shell ceased refining operations at its Clyde refinery in Sydney. Following the cessation of refining operations, Shell is in the process of transitioning its Clyde site into an import terminal.36
• In April 2013, Shell announced its intention to sell its Corio refinery before the end of 2014. Shell also noted that if it is unable to achieve a successful sale it would consider other options, such as converting the site to an import terminal.37
One of the key factors contributing to these structural changes in the refining sector is the increasing competitive pressure that Australian refineries face from Asia’s large, low-cost refineries. Chapter 4 provides further discussion on the significance of Asian refining capacity in a global context.
3.3.1 RefinerycapacityThe most recent estimate of Australia’s refining capacity from the Australian Institute of Petroleum (AIP) indicates a total capacity of 40 440 ML pa.38
Australia’s total refining capacity has been relatively steady since 2007, only recently falling due to the closure of the Clyde refinery—which reduced capacity by around 4990 ML pa. The AIP estimated that when the closure of the Caltex Kurnell refinery takes effect in 2014, total capacity will drop by a further 7820 ML pa.39
3.3.2 RefineryproductionIn 2012–13 petrol production by Australian refineries was at its lowest level in the past 11 years, at just over 15 000 ML (chart 3.3). Petrol sales were also the lowest for this period, falling from 18 590 ML in 2011–12 to 18 239 ML in 2012–13.
Diesel production by contrast was steady at just over 12 000 ML, while sales rose to be at the highest level for the past 11 years.
34 Caltex Australia (2012), Facts about our Kurnell refinery announcement, media release, 10 August, http://www.caltex.com.au/Pages/FactsKurnell.aspx. Accessed 26 September 2013.
35 ExxonMobil (2012), Adelaide Refinery demolition underway, media release, 26 September, http://www.exxonmobil.com.au/Australia-English/PA/news_releases_20120905.aspx. Accessed 26 September 2013.
36 Shell Australia (2012), Date of Clyde conversion confirmed, media release, 6 June, http://www.shell.com.au/aboutshell/media-centre/news-and-media-releases/archive/2012/date-for-clyde-conversion-07062012.html. Accessed 26 September 2013.
37 Shell Australia (2013), Shell announces Geelong refinery for sale, media release, 4 April, http://www.shell.com.au/aboutshell/media-centre/news-and-media-releases/2013/shell-glg-refinery-for-sale-04042013.html. Accessed 26 September 2013.
38 Australian Institute of Petroleum (2012), Downstream Petroleum 2011, 9 March, p. 5.
39 Ibid.
Monitoring of the Australian petroleum industry December 2013 19

Chart 3.3 Production and sales of petrol and diesel in Australia: 2002–03 to 2012–13meg
alitres
0
5000
10000
15000
20000
25000
2012–132011–122010–112009–102008–092007–082006–072005–062004–052003–042002–03
Petrol production Petrol sales Diesel production Diesel sales
Source: ACCC analysis based on data obtained from firms monitored through ACCC’s monitoring process.
3.3.3 PetrolrefiningmarketsharesWith the closure of its Clyde refinery, Shell’s share of petrol production was 21 per cent in 2012–13, down from 25 per cent in 2011–12 and from 28 per cent in 2002–03 (chart 3.4). While Caltex’s share has increased over the 11 years since 2002–03, this will fall following the closure of its Kurnell refinery in 2014.
Chart 3.4 Share of petrol production in Australia: 2002–03 and 2012–13
Shell (28.3%)
Mobil (18.3%)Caltex (28.6%)
BP (24.7%)Shell (21.4%)
Mobil (15.3%)
Caltex (34.3%)
BP (29.0%)
Source: ACCC analysis based on data obtained from firms monitored through ACCC’s monitoring process.
20 Monitoring of the Australian petroleum industry December 2013

3.3.4 FutureoftheAustralianrefiningsectorWhile Australia’s refining capacity has fallen over the past decade and will continue to fall in the short to medium term, there has been a significant increase in Asian refining capacity in recent years. The Department of Resources, Energy and Tourism (RET) stated in its 2012 Energy White Paper that there is significant surplus refinery capacity in Asia.40 This Asian refining capacity will continue to be a potential source of supplies for independent importers in the future.
As Australia increases its reliance on imported petrol, access to terminals and other associated infrastructure will be a critical factor in supporting the expected growth in imports. Recent and planned expansion of both independently-owned and refiner-wholesaler owned import capacity suggests that capacity may be available to cater for greater volumes. Developments in major terminal infrastructure are outlined in section 3.5.4, and in appendix C.
3.4 Imports and exports of refined fuelAs a result of reduced refining capacity, Australia has become more reliant on imports of refined petroleum products in recent years. It is expected that imports will provide a larger proportion of petroleum sales in Australia as refining capacity further decreases over the next few years.
In 2012–13, imports contributed 20 per cent of petrol sales in Australia. As recently as 2002–03 low levels of imports of refined petrol were required as Australian refineries generally had the capacity to meet domestic demand.
Exports of refined fuels form a very small proportion of the Australian petroleum industry. Exports are likely to continue to decline as domestic refining capacity is reduced in coming years.
3.4.1 VolumesofpetrolanddieselimportsAccording to the Bureau of Resources and Energy Economics (BREE), the total volume of petrol imports changed slightly in 2012–13, decreasing by 0.4 per cent from the previous year, to 3655 ML (chart 3.5).
Diesel import volumes have increased since 2006–07, which continued in 2012–13. In 2012–13 diesel imports increased by 11.8 per cent to 12 549 ML. Since 2006–07, diesel imports have more than doubled.
Over the past decade, the volume of diesel imports has increased to be more than three times that of petrol imports. This is the result of increasing domestic demand for diesel and Australian refineries being configured with a petrol bias.
40 Department of Resources, Energy and Tourism (2012), Energy White Paper 2012: Australia’s Energy Transformation, October, p. 126.
Monitoring of the Australian petroleum industry December 2013 21
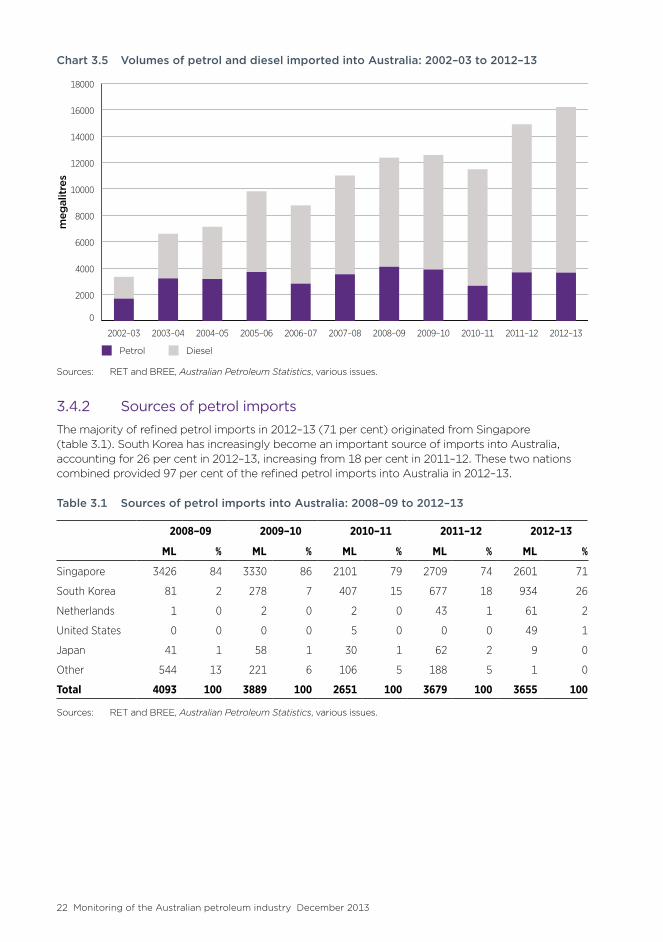
Chart 3.5 Volumes of petrol and diesel imported into Australia: 2002–03 to 2012–13
0
2000
4000
6000
8000
10000
12000
14000
16000
18000
2012–132011–122010–112009–102008–092007–082006–072005–062004–052003–042002–03
meg
alitres
DieselPetrol
Sources: RET and BREE, Australian Petroleum Statistics, various issues.
3.4.2 SourcesofpetrolimportsThe majority of refined petrol imports in 2012–13 (71 per cent) originated from Singapore (table 3.1). South Korea has increasingly become an important source of imports into Australia, accounting for 26 per cent in 2012–13, increasing from 18 per cent in 2011–12. These two nations combined provided 97 per cent of the refined petrol imports into Australia in 2012–13.
Table 3.1 Sources of petrol imports into Australia: 2008–09 to 2012–13
2008–09 2009–10 2010–11 2011–12 2012–13
ML % ML % ML % ML % ML %
Singapore 3426 84 3330 86 2101 79 2709 74 2601 71
South Korea 81 2 278 7 407 15 677 18 934 26
Netherlands 1 0 2 0 2 0 43 1 61 2
United States 0 0 0 0 5 0 0 0 49 1
Japan 41 1 58 1 30 1 62 2 9 0
Other 544 13 221 6 106 5 188 5 1 0
Total 4093 100 3889 100 2651 100 3679 100 3655 100
Sources: RET and BREE, Australian Petroleum Statistics, various issues.
22 Monitoring of the Australian petroleum industry December 2013

3.5 Major terminal infrastructureAs part of its monitoring activities, the ACCC collects detailed data on the use of and plans for major terminal infrastructure from the users, owners and operators of this infrastructure.41 Major terminal infrastructure in Australia is operated by refiner-wholesalers, major independent wholesalers/importers and other independent companies specialising in terminal ownership and operation.42
The majority of major terminals are owned and operated by refiner-wholesalers, though in recent years there has been a trend of increasing independent ownership and operation of terminals. This trend is expected to continue into the future. In addition, with the recent and planned reduction in refining capacity, refiner-wholesalers are expected to also increase their ownership and operation of terminals. For example, Caltex has gained approval for works at its Newport terminal in Victoria to expand capacity for fuel imports—as the terminal currently does not have practical capacity for fuel supply by ship.43
3.5.1 CapacityandthroughputDuring 2012–13, there was a decrease in the petrol capacity of both independently-owned terminals and refiner-wholesaler owned terminals (chart 3.6).
The decrease in the capacity of independently-owned terminals was primarily due to a large reallocation of tank capacity from petrol to the storage of other fuels, mainly aviation fuel. However, this capacity may be reallocated back to petrol storage in the future. Despite the decrease in petrol capacity during 2012–13, throughput of petrol continued to increase at independently-owned terminals. Since 2008–09, petrol throughput has increased by 82.6 per cent at independently-owned terminals.
Capacity at refiner-wholesaler owned terminals decreased in 2012–13, following increases in capacity over previous years. The decrease in petrol capacity during 2012–13 was accompanied by a decrease in petrol throughput. Since 2008–09, petrol throughput has decreased by 14.2 per cent at refiner-wholesaler owned terminals.
41 Major terminals are defined as terminals which have a pipeline connection to a port and/or refinery. They are the point at which fuel which has been refined in Australia or imported is stored, distributed or sold by wholesalers and importers.
42 The term ‘refiner-wholesalers’ is used to refer to the four major petrol companies that are involved in refining as well as wholesaling activities. While only BP and Caltex are integrated from refining to retailing, Mobil and Shell are involved in wholesaling and through their wholesale activities have branding arrangements with certain retailers.
43 Aurecon Australia Pty Ltd (2013), Caltex Newport ‘Horizons’—Report to accompany Application for Works Approval, 13 May, http://www.epa.vic.gov.au/our-work/licences-and-approvals/public-participation/featured-applications/~/media/Files/Our%20work/Licences%20and%20approvals/Featured%20works%20approval%20applications/Caltex%20Newport/WA00990.pdf. Accessed 3 October 2013.
Monitoring of the Australian petroleum industry December 2013 23

Chart 3.6 Petrol capacity and throughput by type of terminal owner: 2008–09 to 2012–13
0
100
200
300
400
500
600
700
800
Refiner-wholesaler owned terminals
Independently owned terminals
2012–132011–122010–112009–102008–09
meg
alitres
Capacity
0
2000
4000
6000
8000
10000
12000
14000
16000
18000
20000
2012–132011–122010–112009–102008–09meg
alitres
Throughput
Refiner-wholesaler owned terminalsIndependently owned terminals
Source: ACCC analysis based on data obtained from firms monitored through ACCC’s monitoring process.
During 2012–13, ethanol throughput at all terminals grew by 21.1 per cent, recovering from the fall of 21.5 per cent in the previous financial year. The largest increase occurred in New South Wales, the only state with a government ethanol mandate. New South Wales accounted for 68.3 per cent of total ethanol throughput during 2012–13, and experienced an increase in terminal throughput of 22.2 per cent compared with 2011–12.
Queensland’s share of ethanol terminal throughput continued to decrease in 2012–13, now accounting for 19.8 per cent of total throughput. Queensland’s share of ethanol throughput has declined since 2009–10, when it accounted for 40 per cent of total throughput. It is possible that the suspension of the announced state government ethanol mandate may have contributed to the decline in ethanol sales in Queensland in recent years.
3.5.2 ImportterminalswithsparecapacityMajor terminals are the points at which petrol that has been refined in Australia or imported into Australia is stored, distributed or sold by refiner-wholesalers and importers. Having access to this key infrastructure provides companies that wish to supply petrol into the Australian market with a strong basis for competing in the downstream petrol industry.
There are two types of major terminals: import terminals and refinery-pipeline terminals.
• Import terminals are connected to a port by a direct pipeline and generally receive all of their petrol from ships. Most independently-owned terminals are import terminals.
• Refinery-pipeline terminals are connected to a refinery by a direct or indirect pipeline. These terminals may also be connected to a port, though are likely to receive most of their petrol from the refinery. Some independently-owned terminals are in this category.
Import terminals generally have significantly lower turnover than refinery-pipeline terminals, as refinery-pipeline terminals have a direct link to what is usually an on-going source of supply.44 The lower turnover at import terminals is also partially due to the fact that these terminals are typically larger than refinery-pipeline terminals.
44 Turnover refers to the number of times a terminal is effectively emptied and filled in the year.
24 Monitoring of the Australian petroleum industry December 2013

During 2012–13, Australia’s import terminals had an average petrol turnover of 9.0 times, while refinery-pipeline terminals had an average turnover of 28.8 times (table 3.2). The increase in turnover at import terminals reflects the large decrease in petrol capacity at import terminals during 2012–13. As noted, the decrease in import terminal petrol capacity was mainly due to a large reallocation of tank capacity from petrol to instead storing other fuels.
Table 3.2 Petrol turnover by type of terminal: 2011–12 and 2012–13
Import terminals Refinery-pipeline terminals
Capacity ML
Throughput ML
Turnover times
Capacity ML
Throughput ML
Turnover times
2011–12 689.2 4941.1 7.2 497.2 14 309.9 28.8
2012–13 556.5 5010.9 9.0 471.5 13 591.2 28.8
Source: ACCC analysis based on data obtained from firms monitored through ACCC’s monitoring process. Note some data may not be comparable with data in the 2012 ACCC petrol monitoring report due to data revision by some of the monitored companies.
Note: Excludes import terminals that exist primarily to service local mines.
Gaining access to terminals is an important aspect of independent importers’ ability to compete in the petrol industry. As shown in table 3.3, there are relatively low levels of turnover at independently-owned import terminals, which suggests that there may be available spare capacity for independent importers.45
Table 3.3 Import terminal petrol turnover by type of ownership: 2012–13
Capacity ML
Throughput ML
Turnover times
Independently-owned 274.7 1948.3 7.1
Refiner-wholesaler owned 281.8 3062.7 10.9
Australia 556.5 5011.0 9.0
Source: ACCC analysis based on data obtained from firms monitored through ACCC’s monitoring process.
Note: Excludes throughput for terminals that exist primarily to service local mines.
3.5.3 GrowthinindependentimportsThe volume of petrol imported by independent wholesalers/importers monitored by the ACCC continued to grow in 2012–13, with independent import volumes of petrol products increasing by 5.7 per cent. This follows a small increase of 1.9 per cent in 2011–12. Despite this increase in import volumes, independents accounted for a smaller share of total imports by monitored firms in 2012–13, around 26 per cent, compared with about 30 per cent in 2011–12 and 40 per cent in 2010–11. In the last two years the share of independent imports of total petrol imports has fallen as refiner-wholesalers’ imports increased to compensate for lower refinery production.
The share of independent imports as a percentage of total petrol imports has been volatile since 2002–03. For example, independent imports accounted for 52 per cent of total imports in 2002–03, but then fell to around 14 per cent in 2003–04. This was mainly due to Mobil’s imports increasing substantially following the closure of the Port Stanvac refinery. Since 2007–08, independent imports as a percentage of total petrol imports by monitored firms have ranged
45 It is important to note that some independently-owned terminals may be the subject of exclusive leasing arrangements.
Monitoring of the Australian petroleum industry December 2013 25

from less than 5 per cent to around 40 per cent. However, in absolute terms petrol imports by independent importers have been increasing over time and have increased five-fold since 2007−08.
The recent growth in independent imports has been partly driven by the increased availability of Australian-standard petrol in overseas refineries, greater access to import terminals and the scaling back of the Australian refining sector. While independent imports remain relatively small in terms of the total wholesale market, the growing market presence of independent importers, and the potential for their continued growth, provides competitive discipline on the larger refiner-wholesalers.
Data presented in chapter 6 on wholesale prices indicates that import costs in Australia bear a close approximation to estimates of import parity prices (IPP). In other words, IPP represent a reasonable proxy for import costs. In previous monitoring reports, the ACCC observed that buy-sell prices, that is prices that the four refiner-wholesalers charge each other for refined petrol bought and sold to each other in locations where one of them does not have a refinery, are competitive with prices at which independent wholesalers/importers can purchase fuel from the refiner-wholesalers. This means that independent importers’ capacity to source fuel at IPP from overseas refineries represents a credible threat to by-pass local suppliers and places a constraint on prices charged by domestic refiner-wholesalers.
3.5.4 MajordevelopmentsinterminalinfrastructureDuring 2012–13, there were a number of key developments in the use, expansion and ownership of terminal infrastructure. The following is a list of the most significant developments, categorised by state.46
New South Wales• Shell has ceased refining operations at its Clyde refinery in Sydney and has begun transitioning
the site into an import terminal.47 The refinery ceased processing crude in early October 2012 and is currently operating in interim terminal mode, with work to convert the site into its end state operations expected to take between 2–3 years.
• Caltex has announced that it will close its Kurnell refinery in the second half of 2014 and convert the site into an import terminal.48
• Stolthaven Australia Pty Ltd has commenced construction of an import terminal in Newcastle, which will provide 90 ML of diesel capacity and 4.7 ML of biodiesel capacity. This terminal is due to be completed between December 2013 and June 2014. Shell has signed a memorandum of understanding to use this terminal, to provide fuel to the Hunter Valley and north to Gunnedah.
• In November 2012, Shell opened a new biodiesel facility at its Parramatta terminal in Western Sydney, which will enable Shell to sell Biodiesel 20 (B20) into the New South Wales market.49
Queensland• Puma Energy acquired Neumann Petroleum’s Eagle Farm import terminal in Brisbane in
March 2013.50 This follows investment undertaken by Neumann Petroleum in a pipeline extension to a deep-water port and a 15 ML increase in diesel capacity, which is due to be completed in December 2013.
46 Appendix C of this report lists all major terminals on a state-by-state basis.
47 Shell Australia (2012), Date of Clyde conversion confirmed, media release, 6 June, http://www.shell.com.au/aboutshell/media-centre/news-and-media-releases/archive/2012/date-for-clyde-conversion-07062012.html. Accessed 26 September 2013.
48 Caltex Australia (2012), Facts about our Kurnell refinery announcement, media release, 10 August, http://www.caltex.com.au/Pages/FactsKurnell.aspx. Accessed 26 September 2013.
49 Shell Australia (2012), Biodiesel facility launched at Parramatta Terminal, media release, 20 November, http://www.shell.com.au/aboutshell/media-centre/news-and-media-releases/archive/2012/b20-launch-parramatta-21112012.html. Accessed 26 September 2013.
50 Puma Energy (2013), Puma Energy expands into Australia, media release, 23 January, http://www.pumaenergy.com/2013/01/23/puma-energy-expands-into-australia. Accessed 26 September 2013.
26 Monitoring of the Australian petroleum industry December 2013

• Puma Energy also plans to develop a new petroleum import terminal at the Port of Mackay.51
• In May 2011, the ACCC decided not to oppose Caltex’s proposed acquisition of Mobil’s terminal assets in Gladstone. Caltex completed this transaction in February 2013.
• BP is constructing a new gantry at its import terminal in Gladstone.
• Shell opened two new diesel tanks at its Mackay terminal, with a combined capacity of 38 ML. These tanks will supply fuel to the Bowen Basin and Far North Queensland.52
South Australia• At Outer Harbour, Terminals Pty Ltd is currently constructing an 85 ML petrol, diesel, ethanol
and biodiesel import terminal. This project is due to be completed in the first quarter of 2014 and Caltex will use it to replace its existing Birkenhead terminal under a 25-year lease.
• BP has begun construction of a new 30 ML diesel storage tank at its Largs North import terminal with construction expected to be completed by the end of 2013.
• In August 2012, Mobil completed the construction and commissioning of a new 9 ML diesel fuel tank at its Birkenhead import terminal.53
Tasmania• United Petroleum purchased Stolthaven’s Bell Bay terminal during November and
December 2012.
Victoria• Terminals Pty Ltd are undertaking a greenfield investment in Geelong for an import terminal,
which will potentially include 45 ML of PULP storage, 50 ML of RULP storage, 50 ML of diesel storage and 50 ML of jet fuel storage. The total amount of capacity initially provided at the terminal will be a function of securing foundation clients. Terminals Pty Ltd are in the process of submitting a development application for this investment and expect to complete the project during 2016.
• Shell has indicated that if it is unable to achieve a successful sale of its Corio refinery it would consider other options, such as converting the site into an import terminal.54
• United Petroleum is in the conceptual stage of developing two new storage tanks at its Hastings terminal, with a total capacity of 40 ML.
• Mobil is in the preliminary design phase of two 16 ML tanks for its Yarraville terminal, with one tank planned to have capacity for jet fuel and the other with capacity for unleaded petrol. Should the project proceed, Mobil estimates that this construction will be completed between the end of 2015 and mid-2016.
• Caltex has received works approval to install up to eight new bulk storage tanks for petrol, diesel and jet fuel at its Newport terminal. The first stage of construction is expected to commence in 2014 and include four tanks and three tanker truck loading bays.55
51 Ibid.
52 Shell Australia (2012), Shell builds more tankage to supply Bowen Basin, media release, 31 July, http://www.shell.com.au/aboutshell/media-centre/news-and-media-releases/archive/2012/mackay-tank-launch-31072012.html. Accessed 26 September 2013.
53 ExxonMobil Australia (2012), Mobil expands fuel storage capacity in Adelaide, media release, 6 August, http://www.exxonmobil.com.au/Australia-English/PA/news_releases_20120806.aspx. Accessed 26 September 2013.
54 Shell Australia (2013), Shell announces Geelong refinery for sale, media release, 4 April, http://www.shell.com.au/aboutshell/media-centre/news-and-media-releases/2013/shell-glg-refinery-for-sale-04042013.html. Accessed 26 September 2013.
55 Environment Protection Authority (2013), Caltex Australia Petroleum P/L works approval, 6 September, http://www.epa.vic.gov.au/our-work/licences-and-approvals/public-participation/featured-applications/caltex-australia. Accessed 3 October 2013.
Monitoring of the Australian petroleum industry December 2013 27

Western Australia• Caltex and Shell have transitioned their terminal operations in Perth from their jointly-owned
import terminal in Fremantle to Coogee Chemical’s terminal at Kwinana. Caltex and Shell no longer operate at the Fremantle terminal and it is in the process of being decommissioned, with demolition planned for 2014.
3.6 WholesalingThe wholesale sector of the Australian petrol industry mainly consists of the four refiner-wholesalers and large independent wholesalers, such as Ausfuel, Liberty, Neumann, and United.56 There are also a number of other small wholesale companies that operate in Australia’s petrol industry, however these companies fall outside the scope of the ACCC’s monitoring activities.
3.6.1 WholesalemarketshareRefiner-wholesalers comprise the majority of the wholesale sector, accounting for over 90 per cent of the market monitored by the ACCC (table 3.4). The most noticeable change in market share from 2011–12 to 2012–13 was that Mobil increased its share from 10 per cent to 12 per cent. Mobil’s market share has been increasing for the past two years, following a significant drop in market share between 2009–10 and 2010–11.
Table 3.4 Monitored companies’ share of wholesale petrol sale volumes: 2006–07 to 2012–1357
2006–07 %
2007–08 %
2008–09 %
2009–10 %
2010–11 %
2011–12 %
2012–13 %
BP 17 17 17 17 18 18 18
Caltex 36 36 36 36 36 36 35
Mobil 15 15 13 13 9 10 12
Shell 27 27 28 29 30 29 28
Independent wholesalers 4 5 6 6 8 8 8
Source: ACCC analysis and estimates based on data obtained from firms monitored through ACCC’s monitoring process.
Note: Totals may not sum to 100 due to rounding.
3.6.2 TypesofwholesalesalesRefiner-wholesalers sell petrol to a range of wholesale customers, as shown in table 3.5. The composition of the refiner-wholesalers’ wholesale customer base has changed over time, particularly in terms of volumes sold to specialist retailers.
The specialist retailer category includes independents and supermarkets and has consistently accounted for the largest percentage of wholesale sales since the commencement of monitoring in 2007–08. The share of refiner-wholesalers’ wholesale sales to specialist retailers has also increased every year, accounting for over 63 per cent in 2012–13.
The growth in sales to specialist retailers over the last two financial years has been partly caused by 7-Eleven’s increased presence in the retail sector, including its acquisition of the Mobil retail network in 2010 and the on-sale of many Adelaide sites to On The Run.
56 During the 2012–13 financial year, Ausfuel and Neumann Petroleum were both acquired by Puma Energy.
57 Some volumes are not reported to the ACCC as wholesale transactions; hence the market share of independent wholesalers may be understated. Accordingly, the ACCC has made adjustments to the data to reflect this.
28 Monitoring of the Australian petroleum industry December 2013
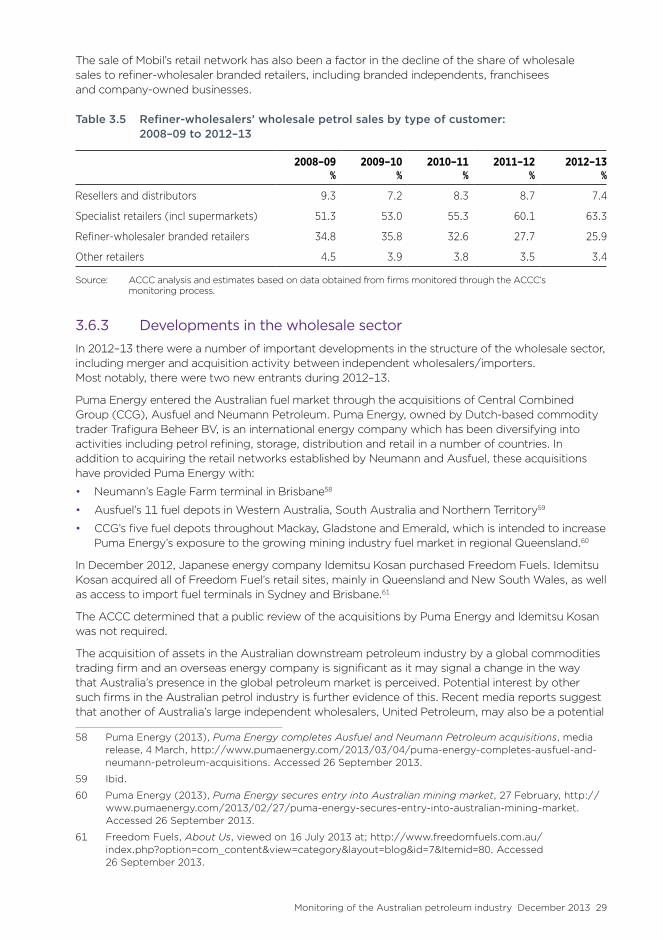
The sale of Mobil’s retail network has also been a factor in the decline of the share of wholesale sales to refiner-wholesaler branded retailers, including branded independents, franchisees and company-owned businesses.
Table 3.5 Refiner-wholesalers’ wholesale petrol sales by type of customer: 2008–09 to 2012–13
2008–09 %
2009–10 %
2010–11 %
2011–12 %
2012–13 %
Resellers and distributors 9.3 7.2 8.3 8.7 7.4
Specialist retailers (incl supermarkets) 51.3 53.0 55.3 60.1 63.3
Refiner-wholesaler branded retailers 34.8 35.8 32.6 27.7 25.9
Other retailers 4.5 3.9 3.8 3.5 3.4
Source: ACCC analysis and estimates based on data obtained from firms monitored through the ACCC’s monitoring process.
3.6.3 DevelopmentsinthewholesalesectorIn 2012–13 there were a number of important developments in the structure of the wholesale sector, including merger and acquisition activity between independent wholesalers/importers. Most notably, there were two new entrants during 2012–13.
Puma Energy entered the Australian fuel market through the acquisitions of Central Combined Group (CCG), Ausfuel and Neumann Petroleum. Puma Energy, owned by Dutch-based commodity trader Trafigura Beheer BV, is an international energy company which has been diversifying into activities including petrol refining, storage, distribution and retail in a number of countries. In addition to acquiring the retail networks established by Neumann and Ausfuel, these acquisitions have provided Puma Energy with:
• Neumann’s Eagle Farm terminal in Brisbane58
• Ausfuel’s 11 fuel depots in Western Australia, South Australia and Northern Territory59
• CCG’s five fuel depots throughout Mackay, Gladstone and Emerald, which is intended to increase Puma Energy’s exposure to the growing mining industry fuel market in regional Queensland.60
In December 2012, Japanese energy company Idemitsu Kosan purchased Freedom Fuels. Idemitsu Kosan acquired all of Freedom Fuel’s retail sites, mainly in Queensland and New South Wales, as well as access to import fuel terminals in Sydney and Brisbane.61
The ACCC determined that a public review of the acquisitions by Puma Energy and Idemitsu Kosan was not required.
The acquisition of assets in the Australian downstream petroleum industry by a global commodities trading firm and an overseas energy company is significant as it may signal a change in the way that Australia’s presence in the global petroleum market is perceived. Potential interest by other such firms in the Australian petrol industry is further evidence of this. Recent media reports suggest that another of Australia’s large independent wholesalers, United Petroleum, may also be a potential
58 Puma Energy (2013), Puma Energy completes Ausfuel and Neumann Petroleum acquisitions, media release, 4 March, http://www.pumaenergy.com/2013/03/04/puma-energy-completes-ausfuel-and-neumann-petroleum-acquisitions. Accessed 26 September 2013.
59 Ibid.
60 Puma Energy (2013), Puma Energy secures entry into Australian mining market, 27 February, http://www.pumaenergy.com/2013/02/27/puma-energy-secures-entry-into-australian-mining-market. Accessed 26 September 2013.
61 Freedom Fuels, About Us, viewed on 16 July 2013 at; http://www.freedomfuels.com.au/index.php?option=com_content&view=category&layout=blog&id=7&Itemid=80. Accessed 26 September 2013.
Monitoring of the Australian petroleum industry December 2013 29

seller of its wholesale (and retail) business. Companies which have been reported to be potentially interested in acquiring United include the Vitol group, a Dutch-based global commodities trader.62
As noted, with local integrated companies closing down their refineries, Australia will have to increase its reliance on imports to meet its current and future fuel requirements. According to some media reports, Australia is poised to become the largest importer of refined fuel in South East Asia.63 The increase in Australia’s import requirements has the effect of raising Australia’s importance in global trade flows and thus, commodity traders’ interests in the Australian downstream petroleum industry.
Ownership of a retail network, such as Trafigura has accomplished through Puma Energy’s purchase of Neumann and Ausfuel, provides importers with a ready-made outlet for petrol imports. It is also plausible that ownership by Neumann and Ausfuel of strategic assets, such as terminals and pipelines in proximity to mining centres in Queensland and Western Australia, may have added to Trafigura’s interest in these businesses.
3.7 RetailingThe Australian petrol retail sector has undergone significant changes over the last 10 years or so. In particular, while the four refiner-wholesalers previously sold the majority of petrol to motorists, supermarkets and other independent chains currently account for the majority of retail petrol sales.
3.7.1 RetailmarketshareIn 2012–13, retailers’ shares of retail petrol sales by brand remained relatively similar to 2011–12 (table 3.6). The main changes were that:
• BP’s market share continued to decrease, falling from 16 per cent to 15 per cent
• the market share of independent retail chains rose slightly, from 17 per cent to 18 per cent
• Coles had an increase in market share, rising from 23 per cent to 24 per cent, while Woolworths’ market share remained at 24 per cent.
62 Street Talk, United Petroleum may interest Caltex, Vitol, Australian Financial Review, 27 August 2013, p 16. See also http://www.afr.com/tags?tag=C_A-CAP%20RESOURCES%20LIMITED-ACB. Accessed 26 September 2013.
63 Javier Blas, Trafigura bets $800m on Australia energy, Financial Times, 3 February 2013, at http://www.ft.com/cms/s/0/3197076a-6e14-11e2-983d-00144feab49a.html. Accessed 26 September 2013.
30 Monitoring of the Australian petroleum industry December 2013

Table 3.6 Share of volume of retail petrol sales by brand: 2002–03 to 2012–13
BP
%
Caltex
%
Mobil
%
Shell
%
Woolworths/ Caltex
(co-branded) %
Coles Express/ Shell
(co-branded) %
Large independent retail chains
%
2002–03 20 24 19 20 10 - 6
2003–04 20 22 17 3 14 16 7
2004–05 18 18 12 3 18 25 6
2005–06 19 16 11 3 20 25 6
2006–07 19 16 11 3 22 22 7
2007–08 20 17 11 2 22 20 8
2008–09 19 16 11 2 23 22 9
2009–10 17 16 10 2 23 22 10
2010–11 19 18 - 2 23 22 17
2011–12 16 18 - 2 24 23 17
2012–13 15 18 - 2 24 24 18
Source: ACCC analysis and estimates based on data obtained from firms monitored through ACCC’s monitoring process.
Notes: Data is only for monitored companies, so does not include the total volume of retail sales in Australia.
In 2011–12, Puma Energy purchased the retail operations of Neumann and Ausfuel. In 2010–11, Mobil sold its retail sites to 7-Eleven and On The Run.
Large independent retail chains are: 7-Eleven, On The Run, and the retail operations of United and Puma Energy.
In 2002–03, Woolworths was not co-branded with Caltex.
Totals may not add up to 100 per cent due to rounding.
In 2012–13, refiner-wholesalers’ combined market share of branded retail sales by monitored firms was 35 per cent, the lowest over the period in table 3.6. Independent retail chains and the supermarkets experienced increases in market share. Since the commencement of monitoring in 2007–08, the supermarkets retail market share has increased from 42 per cent to 48 per cent in 2012–13.
3.7.2 RetailbusinesstypesThe brand name displayed at a petrol retail site does not always indicate the owner or the type of ownership structure of the site. In 2012–13, only 10.2 per cent of petrol retail sites were directly owned and operated by the refiner-wholesaler with the brand on the site (table 3.7). The majority of petrol sites are actually owned and/or operated by distributors, franchisees, independent retailers or commission agents. Coles Express and Woolworths were the only companies that operated all of the business on the sites displaying their brands (24.6 per cent of petrol retail sites).
Monitoring of the Australian petroleum industry December 2013 31

Table 3.7 Percentage of monitored retail sites by brand and business operator: 2012–13a
Brand Business operated by:b
Directly Owned and
Operated %
Distributor Owned
Operations %
Independent Retailer
%
Franchiseed
%
Commission agentd
%
Total
%
BP 7.8 9.0 8.1 0.3 0.0 25.2
Caltex 1.9 7.8 2.1 1.8 6.7 20.2
Mobil 0.0 2.2 0.0 0.0 0.0 2.2
Shell 0.5 0.0 4.8 0.0 0.0 5.2
Woolworths/Caltex (co-branded)
12.1 0.0 0.0 0.0 0.0 12.1
Coles Express/Shell (co-branded)
12.5 0.0 0.0 0.0 0.0 12.5
Specialist retailersc 0.0 0.0 1.6 7.8 0.0 9.5
Independent wholesalers
0.0 0.7 3.7 1.5 7.2 13.1
Total 34.7 19.7 20.3 11.5 13.9 100.0
Source: ACCC analysis and estimates based on data obtained from firms monitored through ACCC’s monitoring process.
Notes: (a) Data is only for monitored companies, so does not Include the total number of retail sites in Australia. Data is not comparable with data in previous monitoring reports due to site reclassifications by some monitored companies. Due to rounding some rows and columns may not equal the total.
(b) Sites are categorised by the operator of the business on the site, regardless of branding.
(c) Specialist retailers include those businesses operated by distributors, independent retail chains and other independents.
(d) Excludes supermarkets. Commission agents generally manage a business owned by a refiner-marketer or independent chain, and are generally compensated in the form of a commission based on the quantity of product sold. Franchisees rent a site or a number of sites and source fuel from the franchisor and brand it accordingly. They may also receive price support from the franchisor (wholesaler), providing some influence over the retail prices set by the franchisee.
3.7.3 RetailsitenumbersOver the long term, one of the most significant trends in the retail sector has been the decline in the number of retail sites. Past monitoring reports have highlighted the gradual decline in retail sites since the 1970s.64 This trend has appeared to have plateaued in recent years, as the number of retail sites has remained between 6000 and 6500 since the mid-2000s.
3.7.4 DevelopmentsintheretailsectorThe Australian retail sector also experienced change in 2012–13, with a number of major market share changes throughout the year. This included two new entrants into the Australian retail sector, Puma Energy and Idemitsu Kosan.
64 Refer chapter 4, 2011 ACCC petrol monitoring report for more analysis on the decline in retail site numbers since the 1970s: http://www.accc.gov.au/publications/monitoring-of-the-australian-petroleum-industry/monitoring-of-the-australian-petroleum-industry-2011-report. Accessed 26 September 2013.
32 Monitoring of the Australian petroleum industry December 2013

In March 2013, Puma Energy completed the acquisitions of Ausfuel and Neumann Petroleum. The acquisition of Ausfuel provided Puma Energy with an additional 110 retail sites, while the acquisition of Neumann Petroleum provided Puma Energy with an additional 120 retail sites.65
In May 2013, Peregrine Corporation (which operates under the trading name of On The Run) advised the ACCC that it intended to acquire 25 of BP’s company owned and operated retail petrol sites in South Australia, comprising all 16 of BP’s sites in Adelaide and nine sites in regional South Australia. Subsequently Peregrine acquired the nine regional sites which were not subject to the clearance application. The ACCC is continuing to investigate whether the acquisition would be likely to have the effect of substantially lessening competition in the retail sale of fuel in Adelaide and South Australia.
As noted, there have also been reports that independent fuel retailer United Petroleum is considering selling or undertaking a joint venture for its network of retail sites and fuel distribution network.66
3.8 Concluding observationsThroughout 2012–13, Australia’s downstream petroleum industry continued its process of transition and change that has been evident in recent years. In particular, there were significant developments in the structure of the total supply (including refining and importing), wholesale and retail sectors.
In the refining sector, the announcement by Shell of the sale of its Corio refinery in Geelong, with the potential for closure should the sale not go ahead, is further evidence of the significant challenges faced by Australia’s small refineries in the face of intense competitive tension from modern and more efficient refineries already constructed in Asia. This competitive threat is likely to continue to grow as additional refineries in Asia, and in the Middle East, come on stream in the medium term.
The reduction in refining capacity appears to have ramifications beyond Australia’s refinery sector. The concomitant increased reliance on imports to meet Australia’s refined fuel requirements appears to have contributed to foreign interest in the ownership of assets in Australia’s wholesale and retail sectors. The entry of Dutch-owned Puma Energy and Japanese energy firm Idemitsu Kosan, through the purchase of Ausfuel Group/Neumann Petroleum and Freedom Fuels respectively, signals a new phase in Australia’s downstream petrol industry.
Continued growth of independent imports in 2012–13 means that volumes of refined fuel imported by independent wholesalers have now grown more than fivefold since 2007–08. This is a reflection of the fact that improved access to Australian standard fuel from overseas refineries and to import infrastructure have entrenched independent importers’ positions in the downstream petroleum industry. The acquisition of the businesses of two independent wholesalers/importers during 2012–13 shows that they have become a viable alternative source of petrol for Australian motorists.
In the retail sector, the presence of the four refiner-wholesalers continued to decline as their share of branded retail sales among monitored firms fell to its lowest level since 2002–03. At the same time, independent retail chains and supermarkets continued to account for increased shares of retail sales.
65 Puma Energy, Puma completes Ausfuel and Neumann Petroleum acquisitions, Media Release, 4 March 2013, http://www.pumaenergy.com/2013/03/04/puma-energy-completes-ausfuel-and-neumann-petroleum-acquisitions. Accessed 26 September 2013.
66 Gillian Tan (2013), United Petroleum considers sale or JV, appoints KPMG as adviser, The Australian, July 26 2013, http://www.theaustralian.com.au/business/wall-street-journal/united-petroleum-considers-sale-or-jv-appoints-kpmg-as-adviser/story-fnay3vxj-1226686343858. Accessed 26 September 2013.
Monitoring of the Australian petroleum industry December 2013 33

34 Monitoring of the Australian petroleum industry December 2013

4 International context
Key points• Crude oil prices have exhibited significant volatility over the last decade and appear to have
consolidated at historically high levels in recent years.
• In 2012–13 instability in the Middle East tended to offset the impact of continuing global economic uncertainty on crude oil prices. The price of Brent crude oil ended the year at around the same level that it started the year.
• The price differential between the widely-used Brent crude oil benchmark and West Texas Intermediate (WTI) crude oil narrowed between April and June 2013, due to infrastructure developments, as well as improvements in US economic conditions.
• Strong economic activity and demand for crude oil in developing nations, particularly in Asia, have supported high crude oil prices.
• Australia’s refining capacity has decreased in recent years, in contrast to the strong growth in capacity in the Asia-Pacific region (which has been driven mainly by growth in India and China).
• Predictions for future crude oil prices vary widely, underlining the difficulty in forecasting future petrol price movements.
4.1 IntroductionCrude oil prices are the most important influence on movements in retail petrol prices in Australia and around the world.67 As the base product used in the production of petrol, the price of crude oil heavily influences international prices of refined petrol, which in turn drive changes in the retail price of petrol paid by Australian consumers.
This chapter explores crude oil pricing in greater detail and analyses key demand and supply factors affecting the international price of crude oil. It also considers future crude oil prices and, consequently, the outlook for the price of petrol.
4.2 Crude oil pricesCrude oil is one of the most commonly traded commodities in the world and is the base product in the production of a range of fuels including petrol, diesel and aviation fuel as well as other goods such as heating oil, lubricants and asphalt.
While the price of crude oil is influenced by a variety of factors, over time large swings in the price of crude oil also reflect changes in perceptions of the state of the world economy. In the long-term, economic growth is often accompanied by a greater demand for fuels. However in the short-term, crude oil prices often exhibit significant volatility on the basis of market sentiment.
4.2.1 Crudeoilpricesin2012–13Crude oil prices have demonstrated significant volatility in recent years, and in 2012–13 prices continued to fluctuate (though at comparatively high levels). Volatility in sentiment regarding global economic conditions was matched by volatility in prices during the year.
Chart 4.1 shows weekly average prices for Brent crude oil over the period July 2012 to September 2013.
67 All prices in this chapter are nominal prices unless otherwise specified.
Monitoring of the Australian petroleum industry December 2013 35

Chart 4.1 Weekly average price of Brent crude oil: 1 July 2012 to 30 September 2013USD
per bl
85
90
95
100
105
110
115
120
125
Sep–13Aug–13Jul–13Jun–13May–13Apr–13Mar–13Feb–13Jan–13Dec–12Nov–12Oct–12Sep–12Aug–12Jul–12
Sep–
13
Aug
–13
Jul–
13
Jun–
13
May
–13
Apr
–13
Mar
–13
Feb–
13
Jan–
13
Dec
–12
Nov
–12
Oct
–12
Sep–
12
Aug
–12
Jul–
12
Source: ACCC calculations based on Platts data.
The chart shows that prices started the year at around USD 99 per barrel in July 2012. Improvements in the global economy as well as ongoing instability in the Middle East saw an increase in prices, and they peaked at around USD 119 per barrel in February 2013. A downturn in global demand for crude oil and refined petrol, amid economic uncertainty in Europe, China and the US led to a decrease in prices in subsequent months, with prices returning to a low of around USD 99 per barrel in April 2013. Prices subsequently recovered, due to the possibility of a military strike on Syria and disruptions in North Sea oil supply, to be at around USD 110 per barrel at the end of September 2013.
On an historical basis, relatively high crude oil prices persisted throughout 2012–13, with the average price for the year being USD 109.1 per barrel. This was USD 3.5 per barrel below the average price in 2011–12 (USD 112.6 per barrel).
4.2.2 CrudeoilpricesoverthelongertermAs noted earlier, higher crude oil prices have also been accompanied by a heightened level of volatility in crude oil pricing.
Chart 4.2 shows monthly average prices for Brent crude oil over the last 20 years in both nominal and real terms. Brent crude oil prices were most volatile in the periods leading up to, and then immediately after, the Global Financial Crisis (GFC) in 2008 (when prices increased substantially and then fell dramatically) and also in the subsequent rebound of the world economy in 2009–10. Since then, while crude oil prices have remained volatile, they have consolidated at relatively high levels compared with historical averages.
36 Monitoring of the Australian petroleum industry December 2013

Chart 4.2 Monthly average prices of Brent crude oil in nominal and real terms: July 1994 to June 2013
USD
per bl
0
20
40
60
80
100
120
140
160
20132012201120102009200820072006200520042003200220012000199919981997199619951994
Brent (real)Brent (nominal)
Sources: ACCC calculations based on Platts data and U.S. Department of Labor, Bureau of Labor Statistics, Consumer price index for all urban consumers, www.dlt.ri.gov/lmi/pdf/cpi.pdf, accessed 31 October 2013.
Note: The base year is 2012–13.
4.2.3 Differentgradesofcrudeoil
Categories of crude oil
Crude oils are differentiated on the basis of their chemical properties and consistency and are generally described in terms of their sulphur content and density.
• Crudes with relatively low sulphur content are considered to be ‘sweet’, while crudes containing a higher proportion of sulphur are said to be ‘sour’. Crudes with a sulphur content of less than 0.5 per cent are typically considered to be ‘sweet’.
• A crude is ‘heavy’ or ‘light’ depending on its relative density according to the American Petroleum Industry gravity index.
Crudes that are light and sweet are generally sold at a premium to sour and heavy crudes, as they are easier to refine and can produce larger volumes of higher value end-products such as petrol and diesel.
Key crude oil benchmarks
The prominent grades of crude oil that serve as key benchmarks for crude oil prices around the world are:
• Brent—a light sweet North Sea crude oil that is commonly used as a pricing marker across many regions of the world.
• Dubai—a heavier, more sour crude oil produced in the United Arab Emirates. Dubai is commonly used as a benchmark for pricing exports of sour Middle East crudes to Asia.68
• West Texas Intermediate (WTI)—a light sweet crude oil from fields in West Texas deliverable into Cushing, Oklahoma. WTI is the major benchmark for US crude oil prices and is a deliverable grade for New York Mercantile Exchange crude oil futures contracts.69
68 Reuters, at http://glossary.reuters.com/index.php/Dubai_Crude, accessed 11 October 2013.
69 Reuters, at http://glossary.reuters.com/index.php/WTI, accessed 11 October 2013.
Monitoring of the Australian petroleum industry December 2013 37

• Tapis—a light sweet crude oil widely used as a marker in the South-East Asia region (although in recent years Tapis is being replaced by Brent as the key crude oil marker in the region).
Historically, the prices of all four crude oil grades have traded at broadly similar levels. Chart 4.3 shows weekly average prices of Brent, Dubai, WTI and Tapis crudes over the last three years.
Prior to 2011, the lighter and sweeter crude oils (Tapis, WTI and Brent) generally traded at a premium to the heavier Dubai grade. Being the lightest and sweetest of the four crudes, Tapis usually traded at the highest price. Dubai crude has generally traded at the lowest price due to its high sulphur content and heaviness.
Chart 4.3 Weekly average prices of WTI, Brent, Dubai and Tapis crudes: July 2010 to June 2013
USD
per bl
0
20
40
60
80
100
120
140
160
Apr–13Jan–13Oct–12Jul–12Apr–12Jan–12Oct–11Jul–11Apr–11Jan–11Oct–10Jul–10
DubaiBrent TapisWTI
Jun–13
Source: ACCC calculations based on Platts data.
In recent years the spread between the prices of the four crude oil markers has widened, with WTI becoming the cheapest of the four. The annual average price of WTI in 2012–13 was USD 92.1 per barrel. This compares with annual average prices for Dubai, Brent and Tapis crudes of USD 105.6 per barrel, USD 109.1 per barrel and USD 113.4 per barrel, respectively.
The divergence of the price of WTI relative to other crude markers was noted in the 2011 and 2012 ACCC petrol monitoring reports.70 The reasons for the divergence include the following:
• a build-up of crude oil stocks at the major trading hub in Cushing, largely from strong US domestic production in conjunction with additional inflows of production from Canada
• a lack of adequate infrastructure to move supplies of crude from the Cushing hub to major refining centres
• the high cost of moving crude oil from Cushing to the biggest US refining centres on the Gulf Coast.71
However, in the period April to June 2013 the spread between WTI and Brent prices decreased. After reaching a high of around USD 29 per barrel in September 2011, the spread narrowed considerably to be around USD 6 per barrel at the end of June 2013—the lowest since January 2011.
70 ACCC, Monitoring of the Australian petroleum industry, December 2011, pp. 41–42, and ACCC, Monitoring of the Australian petroleum industry, December 2012, p. 42.
71 US Energy Information Administration (US EIA), Short-Term Energy Outlook: Market Prices and Uncertainty Report July 2012, 10 July 2012, p. 2.
38 Monitoring of the Australian petroleum industry December 2013
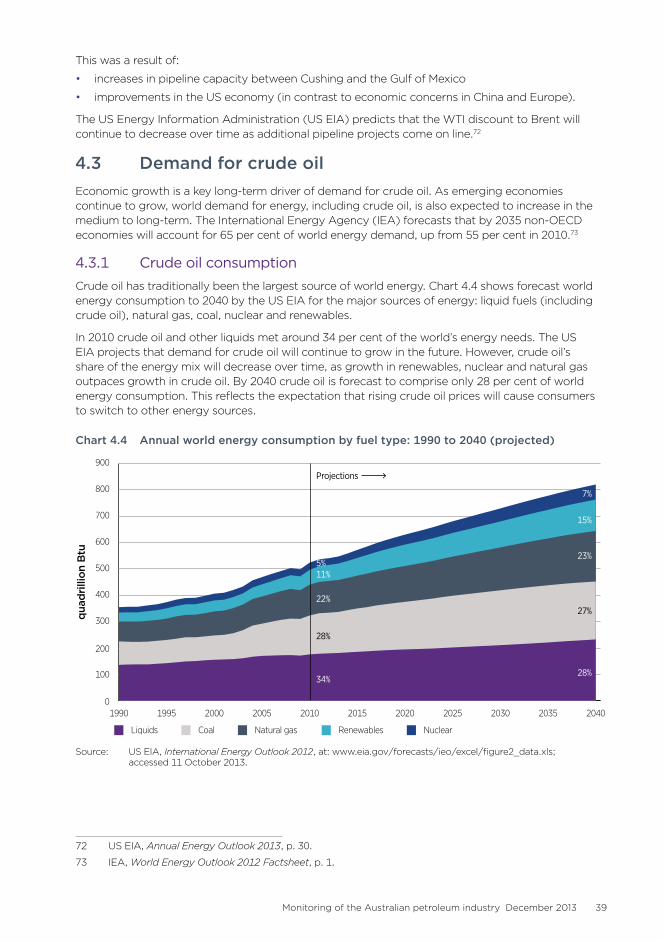
This was a result of:
• increases in pipeline capacity between Cushing and the Gulf of Mexico
• improvements in the US economy (in contrast to economic concerns in China and Europe).
The US Energy Information Administration (US EIA) predicts that the WTI discount to Brent will continue to decrease over time as additional pipeline projects come on line.72
4.3 Demand for crude oilEconomic growth is a key long-term driver of demand for crude oil. As emerging economies continue to grow, world demand for energy, including crude oil, is also expected to increase in the medium to long-term. The International Energy Agency (IEA) forecasts that by 2035 non-OECD economies will account for 65 per cent of world energy demand, up from 55 per cent in 2010.73
4.3.1 CrudeoilconsumptionCrude oil has traditionally been the largest source of world energy. Chart 4.4 shows forecast world energy consumption to 2040 by the US EIA for the major sources of energy: liquid fuels (including crude oil), natural gas, coal, nuclear and renewables.
In 2010 crude oil and other liquids met around 34 per cent of the world’s energy needs. The US EIA projects that demand for crude oil will continue to grow in the future. However, crude oil’s share of the energy mix will decrease over time, as growth in renewables, nuclear and natural gas outpaces growth in crude oil. By 2040 crude oil is forecast to comprise only 28 per cent of world energy consumption. This reflects the expectation that rising crude oil prices will cause consumers to switch to other energy sources.
Chart 4.4 Annual world energy consumption by fuel type: 1990 to 2040 (projected)
qua
drillion
Btu
0
100
200
300
400
500
600
700
800
900
20402035203020252020201520102005200019951990
NuclearRenewablesNatural gasCoalLiquids
Projections
5%11%
22%
28%
34%
7%
15%
23%
27%
28%
Source: US EIA, International Energy Outlook 2012, at: www.eia.gov/forecasts/ieo/excel/figure2_data.xls; accessed 11 October 2013.
72 US EIA, Annual Energy Outlook 2013, p. 30.
73 IEA, World Energy Outlook 2012 Factsheet, p. 1.
Monitoring of the Australian petroleum industry December 2013 39

4.3.2 OildemandgrowthFor some time growth in oil consumption has been most prevalent in developing economies. Chart 4.5 shows the projected change in consumption of crude oil and other liquid fuels by region between 2010 and 2040.
There is a clear contrast between forecast rates of growth for OECD and non-OECD regions, with consumption in non-OECD Asia increasing by around 19 million barrels per day over the 30-year period. By contrast, consumption in OECD Asia will stay near current levels, and consumption in OECD Europe will decline by around 700 000 barrels per day.
Chart 4.5 Change in consumption of crude oil and other liquid fuels by region, 2010–2040 (million barrels per day)
OECD Europe
OECD Asia
OECD Americas
Africa
Non-OECD Europe and Eurasia
Central and South America
Middle East
Non-OECD Asia
Source: US EIA, International Energy Outlook 2013, Figure 29, p. 23.
Overall, on the demand side, the US EIA expects that consumption of crude oil and other liquids will continue to increase, with virtually all the growth coming from non-OECD countries. Strong economic growth in these countries will increase consumption in the transportation and industrial sectors. However, rising prices for crude oil and other liquids will lead many users outside these sectors to switch to other energy sources where possible.74
4.4 Supply of crude oilThe main factors that determine the long-term supply of crude oil can be grouped into three categories:
• investment and production decisions of the Organisation of Petroleum Exporting Countries (OPEC)
• the economics of non-OPEC supply
• the economic viability of other (i.e. non-petroleum liquids) supply.75
OPEC is an inter-governmental cartel consisting of 12 oil producing and exporting nations: Algeria, Angola, Ecuador, Iran, Iraq, Kuwait, Libya, Nigeria, Qatar, Saudi Arabia, the United Arab Emirates and Venezuela. OPEC’s stated objective is ‘to coordinate and unify the petroleum policies of its Member Countries and ensure the stabilisation of oil markets in order to secure an efficient, economic and regular supply of petroleum to consumers, a steady income to producers and a fair return on capital for those investing in the petroleum industry’.76
74 US EIA, International Energy Outlook 2013, p. 26.
75 US EIA, Annual Energy Outlook 2013, p. 58.
76 OPEC Mission Statement, at: http://www.opec.org/opec_web/en/about_us/23.htm, accessed 11 October 2013.
40 Monitoring of the Australian petroleum industry December 2013

4.4.1 OilreservesFigure 4.1 shows the major proven crude oil reserves around the world as at January 2013.
Figure 4.1 Major proven crude oil reserves, billions of barrels: January 201378
Libya
Nige
riaAl
geria
Ango
la
Cana
daUn
ited S
tate
s
Mexic
o
Rest
of th
e wor
ld
Saud
i Ara
bia Iran
Iraq
Kuwa
itUA
EQa
tar
Vene
zuela
Braz
ilEc
uado
r
Russ
iaKa
zakh
stan
Azer
baija
n
China
12 11
21
13 8
26
25
7
10 265
155
141
102
98
298
173
48 37
80 30
Source: US EIA, International Energy Outlook 2013, table 6, p. 37. It is based on estimates by the Oil and Gas Journal provided to the US Securities and Exchange Commission.
Around half of the world’s proven crude oil reserves are located in the Middle East, with Saudi Arabia holding the most reserves in that region. More than 80 per cent of the world’s oil reserves are held by just eight countries. Of those countries, only Canada and Russia are non-OPEC members. In total, OPEC member countries hold around 70 per cent of the world’s proven crude oil reserves.
Since 2000 most of the increase in proven oil reserves came from revisions to existing reserves rather than discoveries of new reserves. In 2012–13 Venezuela overtook Saudi Arabia as the world’s largest holder of oil reserves, with 18 per cent of the world total (compared with 16 per cent in Saudi Arabia).77
4.4.2 MajorproducersIn 2012 Saudi Arabia was the largest producer of crude oil with an output of 11.7 million barrels per day (mbpd), followed by the United States with 11.1 mbpd and Russia with 10.4 mbpd. Chart 4.6 shows the top 30 crude oil producing countries in 2012. Australia ranks 29 with an output of 0.52 mbpd (down slightly from 0.53 mbpd in 2011).
77 US EIA, International Energy Outlook 2013, p. 37.
Monitoring of the Australian petroleum industry December 2013 41

Chart 4.6 Top 30 crude oil producing countries: 2012
0
2
4
6
8
10
12
14
EcuadorAustraliaMalaysiaEgyptArgentinaOmanAzerbaijanColombiaIndonesiaIndiaUnited KingdomLibyaQatarKazakhstanAngolaAlgeriaNorwayVenezuelaNigeriaBrazilKuwaitMexicoIraqUnited Arab EmiratesIranCanadaChinaRussiaUnited StatesSaudi Arabia
million bl p
er day
EcuadorAustraliaMalaysiaEgyptArgentinaOmanAzerbaijanColombiaIndonesiaIndiaUnited KingdomLibyaQatarKazakhstanAngolaAlgeriaNorwayVenezuelaNigeriaBrazilKuwaitMexicoIraqUnited Arab EmiratesIranCanadaChinaRussiaUnited StatesSaudi Arabia
Ecua
dor
Aus
tral
ia
Mal
aysi
a
Egyp
t
Arg
entin
a
Om
an
Aze
rbai
jan
Colo
mbi
a
Indo
nesi
a
Indi
a
Uni
ted
King
dom
Liby
a
Qat
ar
Kaza
khst
an
Ang
ola
Alg
eria
Nor
way
Vene
zuel
a
Nig
eria
Bra
zil
Kuw
ait
Mex
ico
Iraq
Uni
ted
Ara
b Em
irate
s
Iran
Cana
da
Chin
a
Rus
sia
Uni
ted
Stat
es
Saud
i Ara
bia
Non-OPECOPEC
Source: US EIA, International Energy Statistics, at http://www.eia.gov/cfapps/ipdbproject/iedindex3.cfm?tid=5&pid=53&aid=1&cid=regions,&syid=2009&eyid=2012&unit=TBPD, accessed 11 October 2013.
Note: Oil production represents total oil supply, that is, production of crude oil (including lease condensate), natural gas plant liquids, other liquids and refinery processing gains.
In 2012 OPEC member countries accounted for only 41 per cent of global crude oil production, considerably less than the proportion of reserves they hold. Since 1980 OPEC member countries have accounted for around 37 per cent of global oil production, ranging from a low of 28 per cent in 1985 to a high of 42 per cent in 2008.
The US EIA’s reference case projects that OPEC production will grow from 35 million barrels per day in 2011 to 48 million barrels per day in 2040, with OPEC members expected to maintain a market share of between 39 and 43 per cent for most of the projected period.78 This projection is based on the assumption that OPEC will continue to restrict production to maintain this relatively stable market share.
4.4.3 UnconventionalsourcesofsupplyUnconventional supplies of oil are becoming an increasingly important part of the global energy mix. As crude oil prices continue to rise, unconventional supplies will become a more economically viable source of supply. This is especially the case as increasing geopolitical concerns prevent access to prospective conventional sources.
Conventional sources of liquid fuels include crude oil and lease condensate, natural gas plant liquids, and refinery gain, while unconventional sources include oil sands, extra-heavy oil, biofuels, coal-to-liquids, gas-to-liquids, and shale oil.79
78 US EIA, Annual Energy Outlook 2013, p. 31.
79 US EIA, International Energy Outlook 2011, p. 25.
42 Monitoring of the Australian petroleum industry December 2013

The US EIA predicted that global production of unconventional liquid fuels would increase from 3.9 mbpd (or around 5 per cent of total production) in 2008 to 13.1 mbpd (or around 12 per cent of total production) in 2035.80
The major sources of future unconventional oil supply are predicted to be Canadian oil sands, US and Brazilian biofuels, and Venezuelan extra-heavy oil.
4.5 Refining capacityThe ability to refine crude oil to produce end-products is another crucial factor contributing to the supply and price of petrol. Australia’s refining industry is relatively small and, as discussed in chapter 3, its refining capacity has decreased in recent years.
Competitive pressures from newer, more complex and lower-cost Asian refineries mean that by mid-2014 Australia will have just five refineries in operation. In addition, in April 2013 Shell announced an intention to sell its Geelong refinery, with a possibility that, in the event that it is not sold, the refinery could be turned into an import-only terminal.
Australia currently accounts for less than 1 per cent of global refining capacity, despite being part of the fast growing Asia-Pacific region (which is now the world’s most significant region in terms of refining capacity).
The latest BP Statistical Review of World Energy shows world refining capacity by region for the three years 2002, 2007 and 2012. This is shown in table 4.1. It can be seen that:
• over the 10 years to 2012 the Asia-Pacific region expanded capacity by around 34 per cent to have around 33 per cent of world refining capacity
• the Middle East region has also experienced strong growth in capacity, expanding by 19 per cent over the period
• smaller gains were realised in North America and Africa, while South and Central America experienced an unexpectedly large fall in capacity in 2012.
The decline in Europe and Eurasia, however, has been slow and steady, with the European region experiencing waning demand due to a decline in economic conditions. Europe’s ageing refineries have struggled to adjust to the lower demand and weaker profit margins that accompanied the economic slowdown. In addition, refiners have been hit by increased competition from newer refineries with lower operating costs based in the Middle East and Asia. Since 2008 15 European refineries have shut down.81
80 Ibid.
81 ‘Refinery Closures Threaten Europe’s Energy Security’, The Wall Street Journal, 26 June 2013, http://online.wsj.com/article/SB10001424127887324328204578569514287514202.html, accessed 11 October 2013.
Monitoring of the Australian petroleum industry December 2013 43

Table 4.1 World refining capacity by region: 2002, 2007 and 2012 (thousand barrels per day)
2002 2007 2012 Change 2002 to 2012 (%)
Asia-Pacific 22 451 25 623 30 119 34 p
Middle East 6 934 7 586 8 255 19 p
North America 20 143 20 964 21 057 5 p
Africa 3 189 3 007 3 323 4 p
Europe and Eurasia 24 987 24 770 23 865 4 q
South and Central America 6 296 6 502 5 912 6 q
World 83 998 88 451 92 531 10 p
Source: BP, Statistical Review of World Energy, June 2013, p. 16.
The rapid expansion in the Chinese and Indian economies over the past decade has coincided with a surge in refining capacity in the Asia-Pacific region, with China’s capacity increasing by around 95 per cent and India’s by 78 per cent between 2002 and 2012. South Korea, Singapore, Thailand, Taiwan and Indonesia have also increased their refining capacity in the last 10 years, albeit by a much smaller degree. Only established economies, such as Australia and Japan, have seen a decrease in refining capacity during this period.
Chart 4.7 shows the change in refining capacity between 2002 and 2012 for countries in the Asia-Pacific region.
Chart 4.7 Refining capacity in the Asia-Pacific region, by country: 2002 and 2012
OtherAsia
Pacific
IndonesiaTaiwanThailandSingaporeSouthKorea
IndiaJapanChinaAustralia
12 000
10 000
8 000
6 000
4 000
2 000
14 000
Source: BP, Statistical Review of World Energy, June 2013, p. 16.
44 Monitoring of the Australian petroleum industry December 2013

4.6 Prospects for crude oil pricesPredicting future crude oil prices is an extremely difficult task. The volatility seen in prices before, during and after the GFC is testament to this.
Chart 4.8 presents predictions to 2040 for crude oil prices (WTI) by three organisations: IHS Global Insight and Energy Ventures Analysis (both private consultancy firms) and the US EIA. IHS Global Insight and Energy Ventures Analysis predict prices to decrease between now and 2040, declining to between USD 80 and 90 per barrel by 2040. However the US EIA reference case predicts prices to increase markedly, reaching around USD 160 per barrel by 2040.
Chart 4.8 Projections of WTI crude oil prices to 2040
USD
per bl
60
80
100
120
140
160
180
2040203520252012
IHS Global InsightEnergy Ventures AnalysisUS EIA
2012 price: USD 92
Source: US EIA, Annual Energy Outlook 2013, p. 93.
The wide divergence of oil price projections underlines the considerable level of uncertainly facing both the future supplies of crude oil and the level of global economic activity that will drive demand for oil.
A significant factor influencing the future price of crude oil is that supply costs will rise as production increasingly moves to non-conventional sources of crude.
The IEA has proposed a schematic showing production costs associated with different sources of crude oil. This is shown in chart 4.9. It suggests rising costs of developing crude oil reserves as production moves from conventional to non-conventional sources of crude oil. Estimated costs of production range from USD 10 per barrel for existing sources of conventional crude oil up to around USD 150 per barrel for biodiesel.
The chart suggests that at current crude oil prices of around USD 100–110 per barrel, production of oil from a number of alternative sources is commercially viable. These include: deep water, enhanced recovery from existing fields, bitumen, Arctic, oil shales and gas/coal/biomass conversions.
The implications of the IEA production cost schedule for exploration and development are relatively clear: as existing fields mature and conventional sources of crude oil are depleted, the average cost of producing oil will increase as production from non-conventional sources increases.
Monitoring of the Australian petroleum industry December 2013 45

Chart 4.9 Crude oil production cost schedulePro
duc
tion
cos
t (200
8 USD
per bl)
Available oil (billion barrels)
0
10
20
30
40
50
60
70
80
90
100
110
120
130
140
150
10000900080007000600050004000300020001000
MENAconv. oil
Alreadypurchased
Otherconv. oil
Deep water
CO2 E
OR
Other EOR
Heavy oil bitumen
Arctic
Oilshales Bi
o mass
to liqu
ids
Gas to
liqu
ids Coal to
liquids
Ethano
l
Bio-diesel
Average price of Brent crude 2012–13 (in 2008 dollars): USD 101
Source: ACCC estimates based on IEA, Medium-term oil and gas markets 2011, p. 62.
Notes: Production cost is the break-even point not including an assumed rate of return on investment; EOR—Enhanced Oil Recovery; MENA—Middle East and North Africa.
46 Monitoring of the Australian petroleum industry December 2013

5 Ethanol blended petrol
Key points• Ethanol is added to petrol to produce various grades of ethanol blended petrol (EBP). The
most common type of EBP is E10, which is regular unleaded petrol (RULP) containing up to 10 per cent ethanol.
• Total sales of EBP in Australia in 2012−13 decreased by around 5 per cent from 2011–12. – Sales were down in New South Wales (NSW) and Queensland, and increased marginally in Victoria (albeit from a very low base).
– EBP sales as a proportion of total petrol sales remained unchanged (at 14 per cent).
• The number of retail sites selling E10 across Australia decreased in 2012−13.
• The largest volume of EBP is sold in NSW, which accounted for over 82 per cent of the Australian EBP market in 2012−13. This is primarily a result of the NSW ethanol mandate.
– From October 2011 the mandate has required that 6 per cent of the total volume of petrol sold in NSW should be ethanol.
– However, in 2012−13 only around 3.5 per cent of the volume of petrol sold was ethanol.
• Since its introduction in October 2007 the NSW mandate has had a significant impact on competition and consumers:
– it has affected the competitive dynamic among retailers by reducing the availability of RULP from many retail sites
– it has reduced consumer choice—some motorists who cannot use E10 in their vehicles (or choose not to) have, because of the reduced availability of RULP, decided to use PULP
– as PULP retails at a higher price than RULP, it has meant that these motorists have been paying higher prices than if they had continued to purchase RULP.
• In 2012−13, across all retail sites selling both RULP and E10 which are monitored by the ACCC, RULP prices were on average higher than E10 prices by around 2.0 cents per litre (cpl). This was a slight increase on 2011−12 (1.8 cpl).
• In 2012−13 there was ample supply of fuel grade ethanol in Australia – ethanol production capacity in Australia was estimated to be 450 megalitres (ML) – ethanol demand was estimated to be around 284 ML.
5.1 IntroductionThe ACCC commenced monitoring and reporting on the price differential between regular unleaded petrol (RULP) and E10 petrol in October 2006. It first reported on the biofuels market in Australia in the 2010 ACCC petrol monitoring report.82
The main type of biofuel used as a transport fuel in Australia is ethanol.83 Most ethanol is produced by fermenting raw materials such as sugar cane, sugar beet, molasses, wheat, grain and forest products. It is added to petrol to produce various grades of ethanol blended petrol (EBP).
In Australia up to 10 per cent ethanol is blended with RULP to produce E10, which is the most common EBP marketed domestically. Ethanol is also present in E85 (a fuel blend consisting of 70–85 per cent ethanol with the remainder being petrol, which may only be used in vehicles
82 All prices in this chapter are expressed in nominal terms unless otherwise specified.
83 The other main type of biofuel is biodiesel, which is derived from plant or animal feedstocks containing fatty acids such as vegetable oils and tallow. It is usually blended with petroleum-based diesel to produce fuels for diesel-powered vehicles and equipment. In Australia, biodiesel is typically used as a fuel additive in 5 per cent (B5) and 20 per cent (B20) blends.
Monitoring of the Australian petroleum industry December 2013 47
specifically built or modified to use it) and in some premium unleaded petrol (PULP), such as ‘Premium 98’ and ‘Premium 100’ from United.
5.2 Ethanol blended petrol and government policyThere is no Australian Government mandate covering the supply of EBP in Australia. New South Wales (NSW) is the only state to have a mandate on the supply of EBP.
5.2.1 NSWethanolmandateThe NSW ethanol mandate was introduced in 2007 and required that, from 1 October 2007, 2 per cent of the total volume of petrol sold in NSW should be ethanol. On 1 January 2010 the mandated level increased to 4 per cent and on 1 October 2011 it increased to 6 per cent.
The final phase of the NSW mandate (requiring all RULP to be replaced with E10) was set to be introduced on 1 July 2012. This would have effectively banned the sale of RULP in NSW. However, on 31 January 2012 the NSW Government announced that it would introduce legislation to remove this requirement and that the ethanol mandate would remain at 6 per cent of total fuel sales.84 In May 2012 the NSW Government released a framework which set out conditions under which exemptions from the mandate may be granted under the Biofuels Act 2007.85 All applications for an exemption are required to include a business plan that identifies future steps to increase ethanol sales, and evidence that previous business plans have been adhered to.
There have been no changes to the ethanol mandate in NSW in 2012–13.
Impact on competition
Since its introduction in October 2007 the mandate has had a significant impact on competition and consumers:
• It has affected the competitive dynamic among retailers by reducing the availability of RULP from many retail sites.
– However, consumers have been able to source RULP from those retail sites excluded from the requirements of the legislation. Retail sites are excluded if they are part of an operation of 20 or fewer sites. These retail sites comprise around 25 per cent of retail sites in NSW.86
• It has reduced consumer choice. Some motorists who cannot use E10 in their vehicles (or choose not to) have, because of the reduced availability of RULP, decided to use PULP.
– This is reflected in the fact that demand for PULP in NSW over the last five years has doubled (which is a significantly higher growth rate than in other states).87
• Furthermore, as PULP retails at a higher price than RULP, it has meant that these motorists have been paying higher prices than if they had continued to purchase RULP.
84 The Hon Barry O’Farrell MP, Premier of NSW and Minister for Western Sydney, media release, 31 January 2012, Regular unleaded petrol to be retained in NSW, at: http://www.biofuels.nsw.gov.au/__data/assets/pdf_file/0011/168572/Ethanol_Unleaded_Petrol_31_1_12pg.pdf, accessed 31 October 2013.
85 The Hon Andrew Stoner, Deputy Premier of NSW and Minister for Regional Infrastructure and Services and the Hon Chris Hartcher, Minister for Resources and Energy, media release, 23 May 2012, NSW Government releases E10 exemption framework, at: http://www.biofuels.nsw.gov.au/__data/assets/pdf_file/0004/171085/Stoner-Hartcher_med_rel_-_E10_exemption_framework.pdf, accessed 31 October 2013.
86 Independent Pricing and Regulatory Tribunal, Ethanol supply and demand in NSW—Other Industries—Final Report, March 2012, p. 4, at: http://www.ipart.nsw.gov.au/Home/Industries/Other/Reviews/Ethanol/Review_of_Ethanol_Supply_and_Demand_in_NSW/23_May_2012_-_Released_Final_Report/Final_Report_-_Ethanol_supply_and_demand_in_NSW_-_March_2012, accessed 31 October 2013.
87 See section 7.6.2.
48 Monitoring of the Australian petroleum industry December 2013

5.2.2 QueenslandethanolmandateThe previous Queensland Government had planned to introduce a 5 per cent ethanol mandate for petrol sold in Queensland by 31 December 2010. However, this was postponed on 28 October 2010 when the then Treasurer, the Hon. Andrew Fraser, announced that implementation of the ethanol mandate had been suspended.88
There have been no public statements by the new Queensland Government regarding the ethanol mandate since it was elected in February 2012. However, there was a motion on ethanol which was debated in the Queensland Parliament on 21 May 2013. The motion, raised by an independent member, was:
That this House takes all measures possible to mandate unleaded petrol sold in Queensland to have a 10 per cent ethanol blend.89
In response to the motion, the Queensland Treasurer, the Hon. Tim Nicholls, moved that all words after ‘House’ be deleted and the motion be amended to, inter alia, note that: ‘…the Commonwealth fuel excise of 38.143 cents per litre is a more effective support for the domestic ethanol industry than a mandate.’90 He added: ‘Imported ethanol also attracts a 5 per cent import duty not applicable to domestically produced ethanol. Effectively, this is a substantial benefit and incentive for Australian growers and is of far more importance than a mandate.’91 The amendment was agreed to.92
5.2.3 EthanolProductionGrantsProgramTransport fuels such as petrol (including EBP) and diesel are currently subject to a fuel excise of 38.14 cents per litre (cpl). However, the Ethanol Production Grants Program (EPGP) provides full excise reimbursement to ethanol producers for ethanol produced and supplied for transport use in Australia from locally derived feedstocks. The EPGP commenced in September 2002. In June 2011, as part of the future taxation of alternative transport fuels package, the EPGP was extended to 30 June 2021, with a review after that date.93
The EPGP effectively makes the ethanol component of Australian produced EBP excise free. Imported ethanol for transport purposes is subject to the excise (and is also subject to import duty of 5 per cent).
88 The Honourable Andrew Fraser, Treasurer and Minister for Employment and Economic Development, media release, 28 October 2010, Ethanol mandate suspended at: http://statements.qld.gov.au/Statement/Id/72283, accessed 31 October 2013.
89 Queensland Parliament, Hansard, Tuesday 21 May 2013, p. 1605.
90 Ibid, p. 1607.
91 Ibid, p. 1608.
92 Ibid, p. 1615.
93 See Department of Resources, Energy and Tourism, Ethanol Production Grants Program, Program Administrative Guidelines, 3 July 2012, at: http://www.ret.gov.au/energy/Documents/Energy-Security/transport-fuels/alt-fuels/EPG-PAGs-approved-3-July-2012.pdf, accessed 31 October 2013.
Monitoring of the Australian petroleum industry December 2013 49

5.3 Sales of ethanol blended petrolNSW, Queensland and Victoria are the only states that sell EBP in any significant quantities in Australia. Table 5.1 shows sales of EBP, RULP and PULP in these states, and the total across Australia, in 2011−12 and 2012−13.
Table 5.1 Sales of EBP, RULP and PULP in NSW, Queensland, Victoria, and Australia— 2011−12 and 2012−13
NSWML
QldML
Vic.ML
AustraliaML
EBP 2011−12 2 189 461 63 2 714
2012−13 2 117 386 66 2 569
RULP 2011−12 1 774 2 718 3 765 11 313
2012−13 1 679 2 731 3 719 11 090
PULP* 2011−12 2 149 895 952 4 735
2012−13 2 288 926 1 012 5 000
Total 2011−12 6 112 4 074 4 780 18 762
2012−13 6 084 4 043 4 797 18 659
* Includes proprietary blends.
Sources: ACCC calculations based on Bureau of Resources and Energy Economics (BREE), Australian Petroleum Statistics, issue 203 May 2013 and issue 205 August 2013.
Note: NSW data includes the ACT.
The table shows that sales of EBP in 2012−13:
• totalled 2569 megalitres (ML) across Australia, a decrease of 145 ML (or around 5 per cent) on 2011–12
• totalled 2117 ML in NSW, a decrease of 72 ML (or around 3 per cent) on the previous year 94
• decreased by 75 ML in Queensland, a decrease of 16 per cent on the previous year
• increased in Victoria by 5 per cent on the previous year, but this was off a low base.
Chart 5.1 shows annual sales of EBP in Australia since 2005−06 and the proportion of total petrol sales represented by EBP.
94 Data from the NSW Office of Biofuels indicates that sales of EBP have been relatively stable over the last 11 quarters. See NSW Government Office of Biofuels, Biofuels results, at: http://www.biofuels.nsw.gov.au/results, accessed 31 October 2013.
50 Monitoring of the Australian petroleum industry December 2013

Chart 5.1 Total ethanol blended petrol sales by volume and as a proportion of total petrol sales: 2005−06 to 2012−13
0
500
1000
1500
2000
2500
3000
3500
2012–132011–122010–112009–102008–092007–082006–072005–06
meg
alitres
Sources: ACCC calculations based on Department of Resources, Energy and Tourism (RET) and BREE, Australian Petroleum Statistics, various issues.
The chart shows that:
• there was steady growth in sales of EBP between 2005−06 and 2010−11, peaking at 16 per cent of total petrol sales
• in 2011−12 there was a decrease in sales of EBP—to 14 per cent of total petrol sales
• sales of EBP in 2012–13 also decreased, but remained at 14 per cent of total petrol sales.
Chart 5.2 shows annual sales of EBP in the three largest markets as a proportion of total Australian EBP sales over the period 2005−06 to 2012−13. The chart indicates that since 2005−06 NSW’s share of national EBP sales steadily increased (from 19 per cent in 2005−06 to 82 per cent in 2012−13). Over the same period, Queensland’s share steadily decreased (from 78 per cent in 2005−06 to 15 per cent in 2012−13). Victoria’s share of national EBP sales remained small over this period (ranging between 1 per cent and 5 per cent).
Monitoring of the Australian petroleum industry December 2013 51
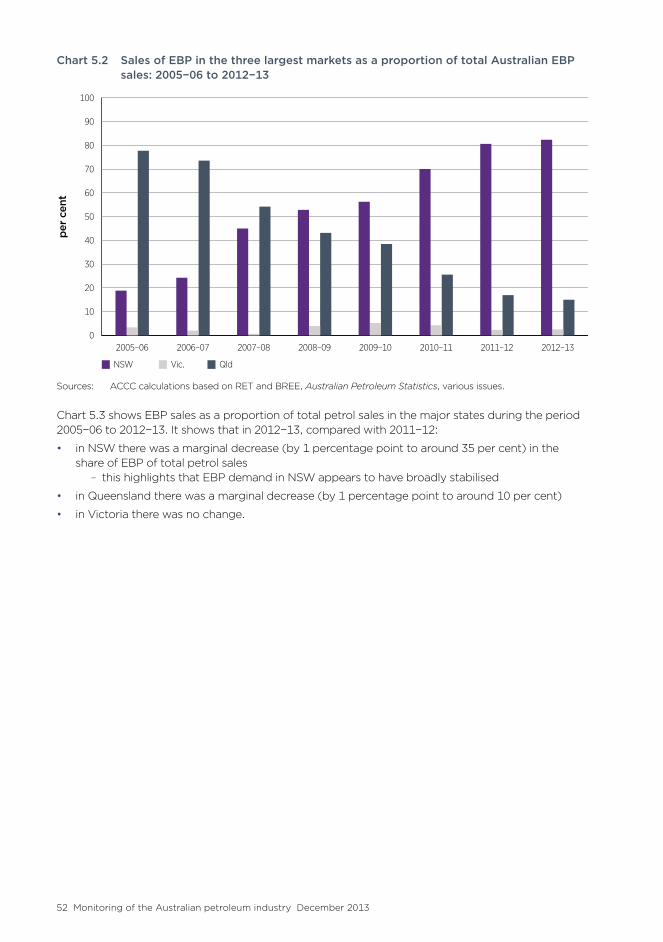
Chart 5.2 Sales of EBP in the three largest markets as a proportion of total Australian EBP sales: 2005−06 to 2012−13
0
10
20
30
40
50
60
70
80
90
100
2012–132011–122010–112009–102008–092007–082006–072005–06
per cen
t
QldVic.NSW
Sources: ACCC calculations based on RET and BREE, Australian Petroleum Statistics, various issues.
Chart 5.3 shows EBP sales as a proportion of total petrol sales in the major states during the period 2005−06 to 2012−13. It shows that in 2012−13, compared with 2011−12:
• in NSW there was a marginal decrease (by 1 percentage point to around 35 per cent) in the share of EBP of total petrol sales
– this highlights that EBP demand in NSW appears to have broadly stabilised
• in Queensland there was a marginal decrease (by 1 percentage point to around 10 per cent)
• in Victoria there was no change.
52 Monitoring of the Australian petroleum industry December 2013

Chart 5.3 EBP sales as a proportion of total petrol sales in the major states and Australia: 2005−06 to 2012−13
0
5
10
15
20
25
30
35
40
2012–132011–122010–112009–102008–092007–082006–072005–06
per cen
t
Qld AustVic.NSW
Sources: ACCC calculations based on RET and BREE, Australian Petroleum Statistics, various issues.
5.4 Retail sites selling E10 petrolChart 5.4 shows the number of retail sites at the first day of each month selling E10 in Australia over the period January 2007 to October 2013. The chart shows that:
• the number of retail sites selling E10 increased steadily between January 2007 (around 250 sites) and September 2010 (around 1530 sites)
• since then the number of retail sites selling E10 has declined to around 1250 sites in October 2013 (a decrease of around 280 retail sites or around 16 per cent)
• from July 2011 the number of sites selling E10 has been relatively stable, generally ranging between 1200 and 1300 sites.
The average number of retail sites selling E10 in Australia in 2012−13 was around 1250 sites. This was 35 sites lower than the average in 2011−12.
Monitoring of the Australian petroleum industry December 2013 53

Chart 5.4 Number of retail sites selling E10 in Australia: January 2007 to October 2013nu
mber of retail s
ites
0
200
400
600
800
1000
1200
1400
1600
1800
Oct–13Jul–13Apr–13Jan–13Oct–12Jul–12Apr–12Jan–12Oct–11Jul–11Apr–11Jan–11Oct–10Jul–10Apr–10Jan–10Oct–09Jul–09Apr–09Jan–09Oct–08Jul–08Apr–08Jan–08Oct–07Jul–07Apr–07Jan–07
Oct
–13
Jul–
13
Apr
–13
Jan–
13
Oct
–12
Jul–
12
Apr
–12
Jan–
12
Oct
–11
Jul–
11
Apr
–11
Jan–
11
Oct
–10
Jul–
10
Apr
–10
Jan–
10
Oct
–09
Jul–
09
Apr
–09
Jan–
09
Oct
–08
Jul–
08
Apr
–08
Jan–
08
Oct
–07
Jul–
07
Apr
–07
Jan–
07Introduction of NSW ethanol mandate
Source: ACCC calculations based on Informed Sources data.
Note: Data is based on the number of retail sites selling RULP, E10, and E10 but not RULP for which Informed Sources has price data.
Charts 5.5 and 5.6 show the number of retail sites selling E10, RULP and E10 but not RULP (referred to as E10 only) in Sydney and Brisbane from July 2007 to October 2013.
Chart 5.5 Number of sites selling RULP, E10 and E10 only in Sydney: July 2007 to October 2013
number of retail s
ites
0
100
200
300
400
500
600
700
Oct–13Jul–13Apr–13Jan–13Oct–12Jul–12Apr–12Jan–12Oct–11Jul–11Apr–11Jan–11Oct–10Jul–10Apr–10Jan–10Oct–09Jul–09Apr–09Jan–09Oct–08Jul–08Apr–08Jan–08Oct–07Jul–07
Oct
–13
Jul–
13
Apr
–13
Jan–
13
Oct
–12
Jul–
12
Apr
–12
Jan–
12
Oct
–11
Jul–
11
Apr
–11
Jan–
11
Oct
–10
Jul–
10
Apr
–10
Jan–
10
Oct
–09
Jul–
09
Apr
–09
Jan–
09
Oct
–08
Jul–
08
Apr
–08
Jan–
08
Oct
–07
Jul–
07
RULPE10 onlyE10
Source: ACCC calculations based on Informed Sources data.
Note: Data is based on the number of retail sites selling RULP, E10, and E10 but not RULP for which Informed Sources has price data.
54 Monitoring of the Australian petroleum industry December 2013

Over the last 12 months the number of retail sites selling E10 only in Sydney has decreased by 70 sites to around 330 sites. The numbers of retail sites selling RULP and E10 have been volatile. Retail sites selling E10 in Sydney over the last 12 months have ranged between 490 and 555 retail sites and retail sites selling RULP have ranged between 200 and 280 retail sites.
As the number of sites selling E10 only in Sydney during 2012-13 has decreased, this diminishes the adverse impact of the NSW ethanol mandate on those consumers that wish to purchase RULP.
Chart 5.6 Number of sites selling RULP, E10 and E10 only in Brisbane: July 2007 to October 2013
number of retail s
ites
0
100
200
300
400
500
600
700
Oct–13Jul–13Apr–13Jan–13Oct–12Jul–12Apr–12Jan–12Oct–11Jul–11Apr–11Jan–11Oct–10Jul–10Apr–10Jan–10Oct–09Jul–09Apr–09Jan–09Oct–08Jul–08Apr–08Jan–08Oct–07Jul–07
Oct
–13
Jul–
13
Apr
–13
Jan–
13
Oct
–12
Jul–
12
Apr
–12
Jan–
12
Oct
–11
Jul–
11
Apr
–11
Jan–
11
Oct
–10
Jul–
10
Apr
–10
Jan–
10
Oct
–09
Jul–
09
Apr
–09
Jan–
09
Oct
–08
Jul–
08
Apr
–08
Jan–
08
Oct
–07
Jul–
07
RULPE10 onlyE10
Source: ACCC calculations based on Informed Sources data.
Note: Data is based on the number of retail sites selling RULP, E10, and E10 but not RULP for which Informed Sources has price data.
In Brisbane the number of retail sites selling E10 has decreased significantly since the peak of around 340 retail sites in September 2010. In October 2013 there were around 165 retail sites selling E10 in Brisbane—a decrease of around 175 retail sites (52 per cent). During that time a number of retailers—including BP and Coles Express—significantly reduced the number of retail sites selling E10.
5.5 Price differentialsThe ACCC commenced monitoring and reporting on the price differential between RULP and E10 in October 2006. Under this monitoring program, E10 prices are collected from various retail sites in a particular location and compared with the RULP prices at those retail sites. To be included in the analysis retail sites must sell both E10 and RULP.
Retail RULP prices have tended to be higher than E10 prices. This may reflect that:
• the ethanol component of E10 is effectively excise free
• the energy component of ethanol is lower compared with RULP
• motorists will not purchase E10 unless it is cheaper than RULP.
Monitoring of the Australian petroleum industry December 2013 55

Chart 5.7 shows the monthly average differential—in both nominal and real terms—between RULP and E10 prices, across all of the locations monitored by the ACCC, over the period January 2007 to September 2013. It indicates that the differential in real terms was 3.5 cpl at the beginning of January 2007 and decreased to a low of 1.7 cpl between July and September 2011 before increasing to 2.2 cpl in August and September 2013.
In 2012−13 average nominal RULP prices were higher than average nominal E10 prices by around 2.0 cpl. This was a slight increase on 2011−12 (1.8 cpl).95
Chart 5.7 Monthly average real and nominal RULP–E10 differentials, all monitored locations: January 2007 to September 2013
cpl
1.0
1.5
2.0
2.5
3.0
3.5
4.0
4.5
5.0
Jul–13Apr–13Jan–13Oct–12Jul–12Apr–12Jan–12Oct–11Jul–11Apr–11Jan–11Oct–10Jul–10Apr–10Jan–10Oct–09Jul–09Apr–09Jan–09Oct–08Jul–08Apr–08Jan–08Oct–07Jul–07Apr–07Jan–07
Jul–
13
Sep–
13
Apr
–13
Jan–
13
Oct
–12
Jul–
12
Apr
–12
Jan–
12
Oct
–11
Jul–
11
Apr
–11
Jan–
11
Oct
–10
Jul–
10
Apr
–10
Jan–
10
Oct
–09
Jul–
09
Apr
–09
Jan–
09
Oct
–08
Jul–
08
Apr
–08
Jan–
08
Oct
–07
Jul–
07
Apr
–07
Jan–
07
Real di�erentialsNominal di�erentials
Sources: ACCC calculations based on Informed Sources and Australian Bureau of Statistics, 6401.0 Consumer Price Index, Australia, Table 1. CPI: All Groups, Index Numbers and Percentage Changes, at http://www.abs.gov.au/AUSSTATS, accessed 31 October 2013.
Note: The base year is 2012–13.
The number of retail sites selling both RULP and E10 has been decreasing over time—particularly in NSW. The most widely used types of petrol in NSW are E10 and PULP. Chart 5.8 shows monthly average differentials between PULP 95 prices and E10 prices in Sydney and Brisbane over the period October 2010 to September 2013. It also shows the monthly average differences between the differential in Sydney and the differential in Brisbane.
There are a couple of methodological points to note about this chart:
• sales of EBP accounted for around 35 per cent of total petrol sales in NSW in 2012−13 and sales of PULP accounted for around 38 per cent, whereas in Queensland sales of EBP accounted for only around 10 per cent of total petrol sales and sales of PULP accounted for around 23 per cent
• the prices are for all retail sites that sell E10 and all retail sites that sell PULP 95 in each of the cities.
95 Additional information on the RULP-E10 price differential for each of the locations included in the ACCC’s monitoring, and a description of the methodology used, is at appendix D.
56 Monitoring of the Australian petroleum industry December 2013

Chart 5.8 Monthly average differentials between PULP 95 prices and E10 prices in Sydney and Brisbane, and the difference between the two cities, October 2010 to September 2013
cpl
5
6
7
8
9
10
11
12
13
14
15
Jul–13Apr–13Jan–13Oct–12Jul–12Apr–12Jan–12Oct–11Jul–11Apr–11Jan–11Oct–10
cpl
cpl
0.0
0.5
1.0
1.5
2.0
2.5
3.0
3.5
4.0
4.5
5.0
Sep–13Aug–13Jul–13Jun–13May–13Apr–13Mar–13Feb–13Jan–13Dec–12Nov–12Oct–12Sep–12Aug–12Jul–12Jun–12May–12Apr–12Mar–12Feb–12Jan–12Dec–11Nov–11Oct–11Sep–11Aug–11Jul–11Jun–11May–11Apr–11Mar–11Feb–11Jan–11Dec–10Nov–10Oct–10
Jul–
13
Apr
–13
Jan–
13
Oct
–12
Jul–
12
Apr
–12
Jan–
12
Oct
–11
Jul–
11
Apr
–11
Jan–
11
Oct
–10
Sep–
13
Brisbane di�erentials (LHS)Sydney di�erentials (LHS)
Di�erence between Sydney and Brisbane di�erentials (RHS)
Source: ACCC calculations based on Informed Sources data.
Chart 5.8 shows that:
• Between October 2010 and September 2013 the PULP 95–E10 price differential increased gradually in both cities (by around 1.0 cpl in Brisbane and 0.6 cpl in Sydney).
• The PULP 95–E10 price differential in Sydney was generally higher than the differential in Brisbane. However, the difference between the two cities was broadly stable over the entire period, with the average difference being 0.5 cpl.
In 2012−13 the average PULP 95–E10 price differential in Sydney was 13.2 cpl (an increase of 0.4 cpl on 2011−12) and in Brisbane it was 12.7 cpl (also an increase of 0.4 cpl on 2011−12).
5.6 Ethanol supply and demandIn 2010 and 2011 the ACCC expressed concern about the supply of fuel grade ethanol. However, in 2012 there was sufficient supply to meet demand. This situation continued in 2012−13.
There are currently three fuel grade ethanol producers in Australia: Manildra (which produces ethanol from wheat starch); Wilmar (which produces ethanol from molasses); and Dalby (which produces ethanol from sorghum).
The APAC biofuels consultants report Australian Biofuels 2013–14 (APAC report), released in October 2013, assessed the state of the ethanol market in Australia. It noted that:
…the aggregate capacity of [the] three main fuel ethanol producers now well exceeds fuel ethanol demand in Australia.96
[and]
96 APAC biofuel consultants, Australian Biofuels 2013–14, p. 13.
Monitoring of the Australian petroleum industry December 2013 57

…the fuel ethanol plants that APAC has been tracking over the years have surplus capacity to supply the industrial market as well as the fuel market.97
It also commented that:
The current economics are not favourable for new projects if their justification is to supply the domestic fuel market.98
According to the APAC report, ethanol production capacity in Australia in 2012−13 was estimated to be 450 ML, up by 30 ML (or around 7 per cent) from 2011−12. Demand for ethanol in 2012−13 was 284 ML, a decrease of 18 ML (or around 6 per cent) on 2011−12.99 This represents a 63 per cent plant utilisation rate (down from 72 per cent in 2011−12). As noted in section 5.3, demand for EBP in 2012−13 decreased in NSW and Queensland, and increased marginally in Victoria (from a low base).
The APAC report provides estimates of existing ethanol production capacity and forecast planned production capacity to 2018. These are shown in table 5.2. Three new producers are forecast to come on stream in 2016. Total production capacity is forecast to increase from 450 ML in 2013 to 800 ML in 2018. Furthermore, as noted in last years’ ACCC petrol monitoring report, the three existing producers would also have the ability to increase production in the medium term in the event that demand increased significantly.100
Table 5.2 Australian ethanol production capacity (ML): 2013 to 2018
Operator 2013 2014 2015 2016 2017 2018
Manildra—Nowra, NSW 300 300 300 300 300 300
Wilmar—Sarina, Qld 60 60 60 60 60 60
Dalby Biorefinery—Dalby, Qld 90 90 90 90 90 90
Total from existing plants 450 450 450 450 450 450
Total from planned plants - - - 175 350 350
Total from existing and planned plants 450 450 450 625 800 800
Source: APAC biofuel consultants, Australian Biofuels 2013−14, p.43.
Some caveats about these estimates, noted in the APAC report, are:
• Not all of the planned plants are necessarily dedicated to producing fuel ethanol. However, as they are assumed to have the ‘potential capacity’ to produce fuel grade ethanol, they have been treated as ‘planned’ in the report.
• There has been not been a new greenfield ethanol plant constructed in Australia since 2009 when Dalby was commissioned. Since then, some planned plants reported by APAC in previous reports have either been deferred or dropped.
• The current soft fuel ethanol market will make it more difficult for the planned plants to proceed if their target is the fuel market.101
97 Ibid, p. 42.
98 Ibid, p. 42.
99 Ibid, p. 11. This estimate is based on funding provided under the EPGP scheme in 2012–13. It is higher than the implied volume of ethanol (257 ML) in 2012–13 in EBP data in the Australian Petroleum Statistics (which is shown in table 5.1). The APAC report notes (p.12) that this difference may be attributable to the Australian Petroleum Statistics not showing the ethanol amount contained in higher octane fuels, stock variation or an accounting adjustment.
100 2012 ACCC petrol monitoring report, p. 70.
101 APAC report, p. 43.
58 Monitoring of the Australian petroleum industry December 2013

Chart 5.9 shows a number of potential supply and demand scenarios for ethanol in the years 2012−13 to 2018−19. The various scenarios on the demand side differ according to whether NSW achieves ethanol sales of 5 per cent or 6 per cent of total petrol sales, and whether an ethanol mandate is introduced in Queensland. The scenarios on the supply side are based on the production capacity of the three existing producers and planned producers.
Chart 5.9 Estimated potential ethanol demand and supply, 2012−13 to 2018−19
meg
alitres
200
300
400
500
600
700
800
900
2018–192017–182016–172015–162014–152013–142012–13
D3 - Qld 5% + current NSW + Vic.D2 - NSW 6% + current Qld + Vic.D1 - NSW 5% + current Qld + Vic.
S2 - Existing and planned productionS1 - Existing productionD4 - NSW 6% + Qld 5% + current Vic.
S2
S1
D4
D3D2
D1
Sources: ACCC calculations based on BREE, Australian Petroleum Statistics, issue 205 August 2013 and APAC biofuel consultants, Australian Biofuels 2013−14, p. 43.102
These scenarios are indicative only. However, they show that:
• Existing supply capacity would be sufficient to meet the increased demand associated with NSW achieving ethanol sales of both 5 per cent and 6 per cent of total petrol sales in NSW, assuming that demand in Queensland and Victoria remained unchanged.
• Existing supply capacity would also be sufficient to meet the increased demand associated with Queensland introducing and achieving a 5 per cent ethanol mandate, assuming that demand in NSW and Victoria remained unchanged.
• If Queensland introduced and achieved a 5 per cent mandate, and NSW achieved 6 per cent ethanol sales, on the basis of current supply capacity there would be a shortage of ethanol in the short term of around 105 ML per year. However, it is likely that existing producers could increase production to fill the gap, even without the possibility of new producers entering the market.
102 Estimated potential ethanol supply is based on Australian ethanol production capacity reported in the APAC report for existing producers (S1) and for existing producers and planned producers (S2). Estimated potential ethanol demand is based on sales data in BREE’s Australian Petroleum Statistics, issue 205 August 2013 and RET Ethanol Production Grant data. Ethanol demand forecasts are based on 2012–13 sales volumes for RULP, PULP and EBP.
Monitoring of the Australian petroleum industry December 2013 59

5.7 Ethanol blended petrol: consumer and industry engagement
Throughout 2012−13 the ACCC actively engaged with consumers and industry stakeholders, and from this engagement it was informed of continuing consumer concerns about EBP.
5.7.1 ComplaintsandinquiriesThe ACCC received 23 complaints and inquiries about EBP in 2012−13. This represented only around 3 per cent of the total fuel-related complaints and inquiries to the ACCC in that year. Around four-fifths of these came from NSW and the remainder came from Victoria, Queensland and the ACT. This was a reduction on the number of complaints and inquiries about EBP in 2011–12 (38, or around 3 per cent of the total for that year).
The main issues that were brought to the ACCC’s attention in respect of EBP included consumer concerns about:
• price differences between EBP and RULP and/or PULP
• retailers selling EBP, but stating that it is RULP and/or PULP
• EBP advertising practices by retailers, such as only providing the price of EBP and not RULP on some roadside fuel price boards, or perceptions that the price of EBP is unduly emphasised compared with prices for other fuel types
• misleading representations as to the superiority of EBP over RULP
• the potential damage to some vehicles caused by EBP, particularly when consumers did not realise they were purchasing EBP.
While most consumer complaints and inquiries relating to EBP do not raise concerns under the Competition and Consumer Act 2010, the ACCC will take action where appropriate.
5.7.2 EngagementwithkeystakeholdersonEBPissuesDuring 2012–13, the Fuel Consultative Committee (FuelCC) continued to play a role in the ACCC’s engagement with key stakeholders about ethanol and EBP. The Biofuels Association of Australia has been a member of the FuelCC since 2011–12.103 During the meetings of the FuelCC, members raised concerns about a range of issues relevant to ethanol and other biofuels, including the impact of state-based ethanol mandates and the cost of meeting these mandates.
The ACCC also continued to engage with stakeholders outside the FuelCC, including liaising directly with fuel retailers, industry associations, motoring organisations and government agencies regarding EBP.
103 The FuelCC is described in section 2.5.1
60 Monitoring of the Australian petroleum industry December 2013

6 Wholesale prices
Key points• As a net importer of refined petrol, the import parity price (IPP) benchmark is the underlying
basis for wholesale prices in Australia.
• The estimated value for the IPP is based on the international price of refined unleaded petrol plus other import costs and forms an indicator for the national average costs of importing refined petrol into Australia.
• The IPP has been a reliable benchmark of the actual costs to companies importing petrol to Australia over the six years to June 2013.
• In 2012–13, movements in average wholesale prices tracked: – the IPP and – buy-sell prices.
6.1 IntroductionThis chapter considers the prices at which refined petrol products are bought and sold within the wholesale sector. Petrol pricing is examined at the point of entry to the wholesale sector as well as the point at which petrol leaves the wholesale sector and enters the retail sector.
The analysis builds on the information published in previous petrol monitoring reports but will concentrate on the 2012–13 financial year.
6.2 The wholesale sectorPetrol within the wholesale sector comes from either the production of domestic refineries by the refiner-wholesalers or from refined product imported to port terminals. The three broad categories of wholesale sector participant companies are:
• Refiner-wholesalers: BP, Caltex, Mobil and Shell. These companies supply petrol which has been produced in domestic refineries, bought from other refiner-wholesalers through ‘buy-sell’ transactions, and imported.104
• Independent wholesalers: including Neumann, Ausfuel (now both owned by Puma Energy), United and Liberty. These companies source petrol from Australian refiner-wholesalers and in some cases from overseas refineries.
• Independent importers: a small number of companies import low volumes of petrol and sell directly to independent wholesalers.
In 2012–13 the refiner-wholesalers supplied most of Australia’s petrol:
• about 84 per cent of wholesale volumes were refined domestically, with the balance sourced through imports105
• refiner-wholesalers imported around 74 per cent of total petrol imports while independent importers accounted for the balance.106
Thus the four refiner-wholesalers supplied about 95 per cent of total supplies of petrol.
104 Buy–sell transactions allow refiner-wholesalers to purchase large volumes of petrol in some cities and regional centres where they do not operate a refinery or import terminal (refer 6.3.3).
105 Bureau of Resources and Energy Economics (BREE), Australian Petroleum Statistics, issue 203 (June 2013).
106 ACCC estimates based on data obtained from firms monitored through ACCC’s monitoring process. Refer section 3.5.3 for more information.
Monitoring of the Australian petroleum industry December 2013 61
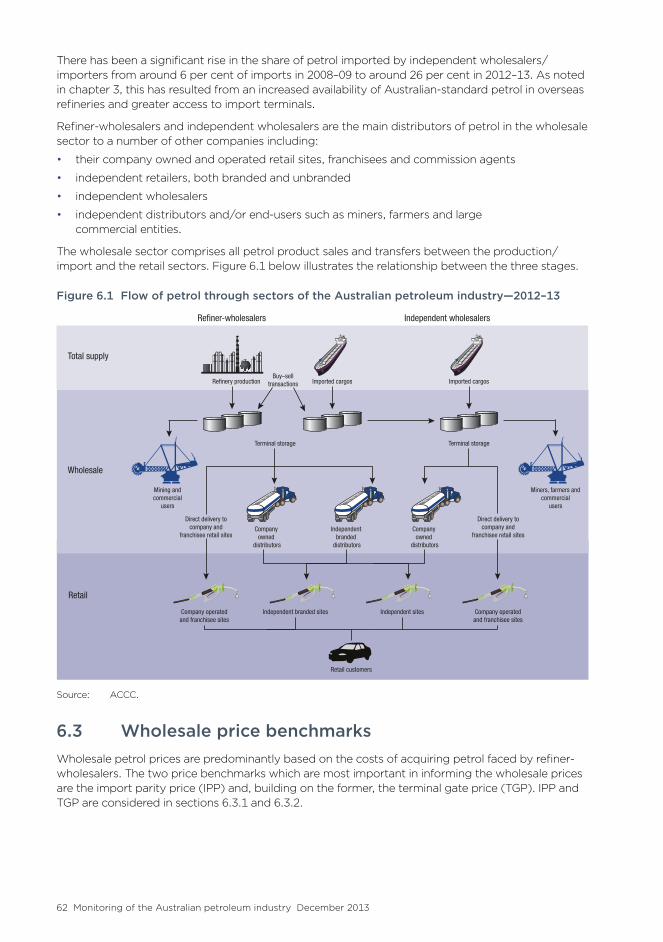
There has been a significant rise in the share of petrol imported by independent wholesalers/ importers from around 6 per cent of imports in 2008–09 to around 26 per cent in 2012–13. As noted in chapter 3, this has resulted from an increased availability of Australian-standard petrol in overseas refineries and greater access to import terminals.
Refiner-wholesalers and independent wholesalers are the main distributors of petrol in the wholesale sector to a number of other companies including:
• their company owned and operated retail sites, franchisees and commission agents
• independent retailers, both branded and unbranded
• independent wholesalers
• independent distributors and/or end-users such as miners, farmers and large commercial entities.
The wholesale sector comprises all petrol product sales and transfers between the production/ import and the retail sectors. Figure 6.1 below illustrates the relationship between the three stages.
Figure 6.1 Flow of petrol through sectors of the Australian petroleum industry—2012–13
Total supply
Refinery production Imported cargos
Terminal storage
Buy–selltransactions Imported cargos
Terminal storage
Company owned
distributors
Miners, farmers andcommercial
users
Company operatedand franchisee sites
Company operatedand franchisee sites
Independent sites
Retail customers
Independent branded sites
Company owned
distributors
Direct delivery tocompany and
franchisee retail sites
Direct delivery tocompany and
franchisee retail sitesIndependent
branded distributors
Refiner-wholesalers Independent wholesalers
Wholesale
Retail
Mining andcommercial
users
Source: ACCC.
6.3 Wholesale price benchmarksWholesale petrol prices are predominantly based on the costs of acquiring petrol faced by refiner-wholesalers. The two price benchmarks which are most important in informing the wholesale prices are the import parity price (IPP) and, building on the former, the terminal gate price (TGP). IPP and TGP are considered in sections 6.3.1 and 6.3.2.
62 Monitoring of the Australian petroleum industry December 2013

6.3.1 ImportparitypriceThe notional cost of importing refined petrol to Australia is the IPP and because Australia is a net importer of refined petrol, the IPP has the greatest impact on wholesale prices. There is no specific value for the IPP routinely published in Australia but it is based on the price of petrol product refined to Australian fuel standards as well as the transport costs of shipping the fuel to the relevant locations around Australia.
The IPP has three main components:
• the benchmark price of petrol at the main source of imports
• any quality premium required to account for the difference between the prices of petrol refined to Australian standards and of petrol meeting the benchmark specifications
• costs that would be incurred to import petrol, such as freight, wharfage and other incidental costs.
Singapore is the main source of petrol imported into Australia (refer table 3.1, chapter 3). The benchmark price used by the refiner-wholesalers to price regular unleaded petrol (RULP) in Australia is the Platts quote for Singapore Mogas 95 Unleaded, also known as MOPS 95 (Mean of Platts Singapore for Mogas 95).
MOPS 95 is an international benchmark price subject to supply and demand factors on the global market. The Australian fuel quality standards for RULP are generally higher than the Mogas 95 specifications; therefore to reflect this cost difference the IPP includes a quality premium.
The formula used to estimate the IPP for RULP varies from company to company, but may be expressed as:
IPP (RULP) = Benchmark RULP price (MOPS 95) + quality premium + freight + insurance and loss + wharfage + other costs
The price of Mogas 95 comprises the vast majority of the IPP. Over the six years of the ACCC monitoring reports, Mogas 95 has accounted for over 90 per cent of the annual average IPP for RULP. For the past two years it accounted for approximately 95 per cent of the IPP.
While the proportion of the prices of Mogas 95 to the IPP has increased since 2007–08, the contribution of freight costs to the IPP has fallen. In 2007–08 and 2008–09 freight represented 3.5 and 4.7 per cent respectively whereas in 2011–12 and 2012–13 freight contributed around 3 per cent to the total annual average IPP due to reductions in the actual cost per litre (chart 6.1).
Monitoring of the Australian petroleum industry December 2013 63

Chart 6.1 Components of annual average IPP for RULP in the five largest cities: 2007–08, 2008–09, 2011–12 and 2012–13
Source: ACCC analysis based on data obtained from firms monitored through the ACCC’s monitoring process.
Due to both the significance of the price of Mogas 95 in the IPP and its instability, changes in Mogas 95 prices drive changes in the IPP. Over the 2012–13 financial year, the monthly average IPP varied by over 13 cents per litre (cpl), while the other components remained essentially unchanged (chart 6.2).
64 Monitoring of the Australian petroleum industry December 2013

Chart 6.2 Components of monthly average IPP for RULP in the five largest cities: July 2012 to June 2013
0
10
20
30
40
50
60
70
80
90
Jun–13May–13Apr–13Mar–13Feb–13Jan–13Dec–12Nov–12Oct–12Sep–12Aug–12Jul–12
cpl
Other
Mogas 95
Wharfage
Insurance and loss
Total freight
Quality premium
Source: ACCC analysis based on data obtained from firms monitored through the ACCC’s monitoring process.
Mogas 95 has consistently been the key driver of changes in the IPP in the last three years (chart 6.3).
Chart 6.3 Components of monthly average IPP for RULP in the five largest cities: July 2010 to June 2013
0
10
20
30
40
50
60
70
80
90
100
Jun–13May–13Apr–13Mar–13Feb–13Jan–13Dec–12Nov–12Oct–12Sep–12Aug–12Jul–12Jun–12May–12Apr–12Mar–12Feb–12Jan–12Dec–11Nov–11Oct–11Sep–11Aug–11Jul–11Jun–11May–11Apr–11Mar–11Feb–11Jan–11Dec–10Nov–10Oct–10Sep–10Aug–10Jul–10
cpl
Other
Mogas 95
Wharfage
Insurance and loss
Total freight
Quality premium
Jun–
13M
ay–1
3A
pr–1
3M
ar–1
3Fe
b–13
Jan–
13D
ec–1
2N
ov–1
2O
ct–1
2Se
p–12
Aug
–12
Jul–
12Ju
n–12
May
–12
Apr
–12
Mar
–12
Feb–
12Ja
n–12
Dec
–11
Nov
–11
Oct
–11
Sep–
11A
ug–1
1Ju
l–11
Jun–
11M
ay–1
1A
pr–1
1M
ar–1
1Fe
b–11
Jan–
11D
ec–1
0N
ov–1
0O
ct–1
0Se
p–10
Aug
–10
Jul–
10
Source: ACCC analysis based on data obtained from firms monitored through the ACCC’s monitoring process.
Monitoring of the Australian petroleum industry December 2013 65

Another influence contributing to the fluctuations in the IPP is the exchange rate between the Australian dollar and the US dollar. IPP components, most importantly Mogas 95 prices, are quoted in USD and are thus subject to the variability of the currency markets affecting the AUD/USD exchange rate (table 6.1).
Over 2012–13 the IPP was highest in February 2013 at 85.23 cpl and lowest in July 2012 at 72.04 cpl. This movement in the IPP coincided with the monthly high and low for the price of Mogas 95 during the 12 months to 30 June 2013. The exchange rate, on the other hand, moved from a monthly low of 0.94 in June 2013 to a monthly high of 1.04 in August and December 2012 and January 2013. The relatively high levels of the AUD/USD exchange rate over most 2012–13 held Mogas 95 prices and the IPP in Australian cents per litre lower than would have otherwise been the case.
The quality premium component of the IPP has decreased in recent years. The average monthly quality premium for regular unleaded petrol was 1.83 cpl in July 2010, but has since fallen around one third to 1.24 cpl in June 2013.
Table 6.1 Components of monthly average IPP for RULP in the five largest cities: July 2012 to June 2013
Exchange rate
1AUD = USD
Mogas 95
cpl
Quality premium
cpl
Total freight
cpl
Insurance and loss
cpl
Wharfage
cpl
Other
cpl
IPP cpl
Jul 12 1.01 68.01 1.22 2.05 0.29 0.29 0.19 72.04
Aug 12 1.04 76.19 1.19 1.97 0.32 0.29 0.19 80.16
Sep 12 1.03 77.04 1.20 2.01 0.32 0.29 0.19 81.05
Oct 12 1.02 77.54 1.21 2.31 0.32 0.29 0.19 81.88
Nov 12 1.03 72.60 1.23 2.44 0.31 0.29 0.19 77.06
Dec 12 1.04 72.12 1.22 2.57 0.30 0.29 0.19 76.71
Jan 13 1.04 73.75 1.19 2.53 0.31 0.29 0.21 78.28
Feb 13 1.03 80.83 1.20 2.36 0.34 0.29 0.21 85.23
Mar 13 1.02 77.69 1.20 2.68 0.33 0.29 0.21 82.40
Apr 13 1.03 70.76 1.16 2.64 0.30 0.29 0.21 75.37
May 13 1.00 71.78 1.19 2.41 0.30 0.29 0.21 76.19
Jun 13 0.94 78.54 1.24 2.36 0.33 0.29 0.21 82.97
2012–13 average 1.02 74.69 1.20 2.36 0.31 0.29 0.20 79.06
Source: ACCC analysis based on data obtained from firms monitored through the ACCC’s monitoring process.
Note: The data in table 6.1, including exchange rates, is not comparable with data in table 7.1 (PULP IPP—chapter 7) as one refiner-wholesaler calculates its PULP IPP differently. Components of table 7.1 have been adjusted to reflect this.
66 Monitoring of the Australian petroleum industry December 2013

6.3.1.1 IPPandactualcostsofimporting
Although the IPP is the notional price of imported petrol, differences between the IPP and actual import costs may occur for a number of reasons including: differences in payment timings for import cargoes; movements in the exchange rate; and periods during which there may be relatively small numbers of import transactions. 107
Generally the average actual cost of importing RULP into the five largest Australian cities has closely followed the IPP (chart 6.4). The difference between average actual import costs and average IPP over the last three years is around one cpl which demonstrates that the IPP is generally a reasonable approximation of actual import costs.
Chart 6.4 Monthly average import costs and IPP for RULP in the five largest cities: July 2010 to June 2013
0
10
20
30
40
50
60
70
80
90
100
Jun–13May–13Apr–13Mar–13Feb–13Jan–13Dec–12Nov–12Oct–12Sep–12Aug–12Jul–12Jun–12May–12Apr–12Mar–12Feb–12Jan–12Dec–11Nov–11Oct–11Sep–11Aug–11Jul–11Jun–11May–11Apr–11Mar–11Feb–11Jan–11Dec–10Nov–10Oct–10Sep–10Aug–10Jul–10
cpl
0
10
20
30
40
50
60
70
80
90
100
Jun–13May–13Apr–13Mar–13Feb–13Jan–13Dec–12Nov–12Oct–12Sep–12Aug–12Jul–12Jun–12May–12Apr–12Mar–12Feb–12Jan–12Dec–11Nov–11Oct–11Sep–11Aug–11Jul–11Jun–11May–11Apr–11Mar–11Feb–11Jan–11Dec–10Nov–10Oct–10Sep–10Aug–10Jul–10
cpl
Import costs (weighted by volume) IPP
Jun–
13M
ay–1
3A
pr–1
3M
ar–1
3Fe
b–13
Jan–
13D
ec–1
2N
ov–1
2O
ct–1
2Se
p–12
Aug
–12
Jul–
12Ju
n–12
May
–12
Apr
–12
Mar
–12
Feb–
12Ja
n–12
Dec
–11
Nov
–11
Oct
–11
Sep–
11A
ug–1
1Ju
l–11
Jun–
11M
ay–1
1A
pr–1
1M
ar–1
1Fe
b–11
Jan–
11D
ec–1
0N
ov–1
0O
ct–1
0Se
p–10
Aug
–10
Jul–
10
Source: ACCC analysis based on data obtained from firms monitored through the ACCC’s monitoring process.
6.3.1.2 IPPandtransactionsbetweenrefiner-wholesalers
In those locations where a refiner-wholesaler does not operate a refinery but maintains a presence in the wholesale market, it is faced with three options from which to source refined petrol:
• import petrol to its own or another company’s terminal
• transport petrol from a refinery or terminal it operates in another location
• obtain petrol from a refinery or terminal in the local area, operated by a different refiner-wholesaler.
107 A more extensive analysis of IPP is available in chapter 6 of the 2009 ACCC petrol monitoring report and in: ‘The method and basis of the setting of the import parity price for unleaded petrol and diesel in Australia’ by McLennan, Magasanik and Associates, available from the ACCC website:
http://www.accc.gov.au/content/item.phtml?itemId=906685&nodeId=a1d61acd4d02faf7ffd66f0970aecbf4&fh=Petrol%20and%20Diesel%20IPP%20Report%20-%20MMA.pdf
Monitoring of the Australian petroleum industry December 2013 67

Often this third option of purchasing from a locally operating refiner-wholesaler is the most efficient process for a refiner-wholesaler to access local supplies in those locations where it does not operate a refinery. Referred to as “buy-sell” transactions, these are considered pre-wholesale transactions, occurring in the supply sector along with production and import activities (refer figure 6.1).
Buy-sell prices also closely track the IPP (chart 6.5). If buy-sell prices were to move significantly out of line with the IPP, then this would create incentives for either imports or exports. For example, if buy-sell prices were noticeably higher than the IPP, refiner-wholesalers could opt to import petrol at the lower cost of import parity. The strong relationship between the IPP and buy-sell prices infers that buy-sell prices are generally competitive with the costs of importing.
Chart 6.5 Monthly average net buy–sell prices and IPP for RULP in the five largest cities: July 2010 to June 2013
0
10
20
30
40
50
60
70
80
90
100
Jun–13May–13Apr–13Mar–13Feb–13Jan–13Dec–12Nov–12Oct–12Sep–12Aug–12Jul–12Jun–12May–12Apr–12Mar–12Feb–12Jan–12Dec–11Nov–11Oct–11Sep–11Aug–11Jul–11Jun–11May–11Apr–11Mar–11Feb–11Jan–11Dec–10Nov–10Oct–10Sep–10Aug–10Jul–10
cpl
0
10
20
30
40
50
60
70
80
90
100
Jun–13May–13Apr–13Mar–13Feb–13Jan–13Dec–12Nov–12Oct–12Sep–12Aug–12Jul–12Jun–12May–12Apr–12Mar–12Feb–12Jan–12Dec–11Nov–11Oct–11Sep–11Aug–11Jul–11Jun–11May–11Apr–11Mar–11Feb–11Jan–11Dec–10Nov–10Oct–10Sep–10Aug–10Jul–10
cpl
Net buy–sell price (weighted by volume) IPP
Jun–
13M
ay–1
3A
pr–1
3M
ar–1
3Fe
b–13
Jan–
13D
ec–1
2N
ov–1
2O
ct–1
2Se
p–12
Aug
–12
Jul–
12Ju
n–12
May
–12
Apr
–12
Mar
–12
Feb–
12Ja
n–12
Dec
–11
Nov
–11
Oct
–11
Sep–
11A
ug–1
1Ju
l–11
Jun–
11M
ay–1
1A
pr–1
1M
ar–1
1Fe
b–11
Jan–
11D
ec–1
0N
ov–1
0O
ct–1
0Se
p–10
Aug
–10
Jul–
10
Source: ACCC analysis based on data obtained from firms monitored through the ACCC’s monitoring process.
6.3.2 TerminalgatepricesTerminal gate prices (TGPs) are the spot prices at which petrol can be bought from a refinery or terminal. As most wholesale transactions are governed by a contract, or similar negotiated agreement, few transactions actually occur at the terminal gate, and at the published TGP.
Despite this, TGPs are an informative point of reference for analysing trends in average wholesale prices. Each refiner-wholesaler and other independent wholesalers publish their TGPs online daily in keeping with the provisions in the Oilcode.
TGPs are calculated with reference to the IPP and by adding tax components, other operating costs incurred in the wholesale sector (including storage and local transportation) and a wholesale margin.
The TGP formula, which may vary from company to company, may be commonly expressed as:
TGP = IPP + excise + GST + wholesale margin + wholesale operating costs
The IPP has been the largest component of and contributor to changes in the TGP in the last three years. Chart 6.6 shows the components of the monthly average TGPs for RULP since July 2010.
68 Monitoring of the Australian petroleum industry December 2013
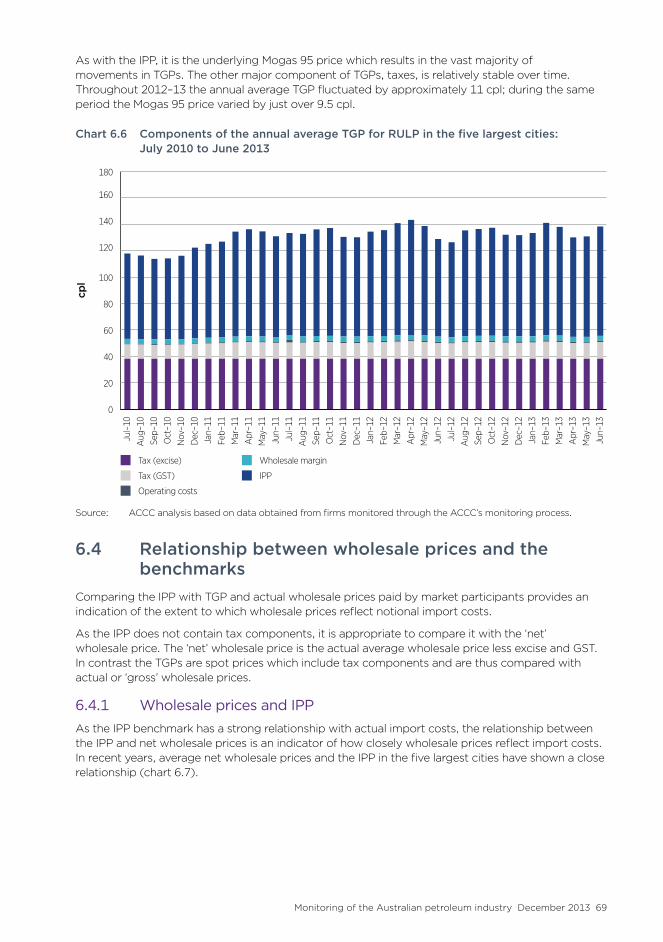
As with the IPP, it is the underlying Mogas 95 price which results in the vast majority of movements in TGPs. The other major component of TGPs, taxes, is relatively stable over time. Throughout 2012–13 the annual average TGP fluctuated by approximately 11 cpl; during the same period the Mogas 95 price varied by just over 9.5 cpl.
Chart 6.6 Components of the annual average TGP for RULP in the five largest cities: July 2010 to June 2013
0
20
40
60
80
100
120
140
160
180
Jun–13May–13Apr–13Mar–13Feb–13Jan–13Dec–12Nov–12Oct–12Sep–12Aug–12Jul–12Jun–12May–12Apr–12Mar–12Feb–12Jan–12Dec–11Nov–11Oct–11Sep–11Aug–11Jul–11Jun–11May–11Apr–11Mar–11Feb–11Jan–11Dec–10Nov–10Oct–10Sep–10Aug–10Jul–10
cpl
IPP
Wholesale margin
Operating costs
Tax (GST)
Tax (excise)
Jun–
13M
ay–1
3A
pr–1
3M
ar–1
3Fe
b–13
Jan–
13D
ec–1
2N
ov–1
2O
ct–1
2Se
p–12
Aug
–12
Jul–
12Ju
n–12
May
–12
Apr
–12
Mar
–12
Feb–
12Ja
n–12
Dec
–11
Nov
–11
Oct
–11
Sep–
11A
ug–1
1Ju
l–11
Jun–
11M
ay–1
1A
pr–1
1M
ar–1
1Fe
b–11
Jan–
11D
ec–1
0N
ov–1
0O
ct–1
0Se
p–10
Aug
–10
Jul–
10
Source: ACCC analysis based on data obtained from firms monitored through the ACCC’s monitoring process.
6.4 Relationship between wholesale prices and the benchmarks
Comparing the IPP with TGP and actual wholesale prices paid by market participants provides an indication of the extent to which wholesale prices reflect notional import costs.
As the IPP does not contain tax components, it is appropriate to compare it with the ‘net’ wholesale price. The ‘net’ wholesale price is the actual average wholesale price less excise and GST. In contrast the TGPs are spot prices which include tax components and are thus compared with actual or ‘gross’ wholesale prices.
6.4.1 WholesalepricesandIPPAs the IPP benchmark has a strong relationship with actual import costs, the relationship between the IPP and net wholesale prices is an indicator of how closely wholesale prices reflect import costs. In recent years, average net wholesale prices and the IPP in the five largest cities have shown a close relationship (chart 6.7).
Monitoring of the Australian petroleum industry December 2013 69

Chart 6.7 Monthly average net wholesale prices and IPP for RULP in the five largest cities: July 2010 to June 2013
0
10
20
30
40
50
60
70
80
90
100
Jun–13May–13Apr–13Mar–13Feb–13Jan–13Dec–12Nov–12Oct–12Sep–12Aug–12Jul–12Jun–12May–12Apr–12Mar–12Feb–12Jan–12Dec–11Nov–11Oct–11Sep–11Aug–11Jul–11Jun–11May–11Apr–11Mar–11Feb–11Jan–11Dec–10Nov–10Oct–10Sep–10Aug–10Jul–10
cpl
0
10
20
30
40
50
60
70
80
90
100
Jun–13May–13Apr–13Mar–13Feb–13Jan–13Dec–12Nov–12Oct–12Sep–12Aug–12Jul–12Jun–12May–12Apr–12Mar–12Feb–12Jan–12Dec–11Nov–11Oct–11Sep–11Aug–11Jul–11Jun–11May–11Apr–11Mar–11Feb–11Jan–11Dec–10Nov–10Oct–10Sep–10Aug–10Jul–10
cpl
Net wholesale price IPP
Jun–
13M
ay–1
3A
pr–1
3M
ar–1
3Fe
b–13
Jan–
13D
ec–1
2N
ov–1
2O
ct–1
2Se
p–12
Aug
–12
Jul–
12Ju
n–12
May
–12
Apr
–12
Mar
–12
Feb–
12Ja
n–12
Dec
–11
Nov
–11
Oct
–11
Sep–
11A
ug–1
1Ju
l–11
Jun–
11M
ay–1
1A
pr–1
1M
ar–1
1Fe
b–11
Jan–
11D
ec–1
0N
ov–1
0O
ct–1
0Se
p–10
Aug
–10
Jul–
10
Source: ACCC analysis based on data obtained from firms monitored through the ACCC’s monitoring process.
Note: Wholesale prices have been notionally adjusted to exclude excise and GST to allow a comparison with IPP, which excludes taxes.
The difference between net wholesale prices and the IPP is comprised of wholesale operating costs, including storage and local transportation, and the wholesale profit margin in the five cities. The average differential has remained fairly constant in the last three years.
Table 6.2 shows the differentials between the net average wholesale price and the IPP for each of the five largest cities for the first half of 2012–13. Sydney (2.0 cpl) experienced the smallest differential. Melbourne and Adelaide had similar differentials (2.7 cpl and 2.5 cpl respectively), whereas Brisbane and Perth both had differentials of closer to 4 cpl (3.8 and 3.7 cpl respectively). While the IPP in Perth (78.1 cpl) was on average at least 1 cpl lower than in the other cities, net average wholesale prices were comparable to wholesale prices in the other four capital cities (81.8 cpl).
Table 6.2 Annual average net wholesale prices and IPP for RULP in the five largest cities: July 2012 to June 2013
Net wholesale price cpl
IPP cpl
Difference cpl
Sydney 81.6 79.6 2.0
Melbourne 82.0 79.3 2.7
Brisbane 82.9 79.1 3.8
Adelaide 81.7 79.2 2.5
Perth 81.8 78.1 3.7
Source: ACCC analysis based on data obtained from firms monitored through the ACCC’s monitoring process.
Note: Wholesale prices have been notionally adjusted to exclude excise and GST to allow a comparison with IPP, which excludes taxes.
70 Monitoring of the Australian petroleum industry December 2013

The differentials in Sydney and Adelaide for 2012–13 were almost the same as for 2011–12 while all other cities experienced an increase in their respective differentials. In Melbourne the increase in the differential was small (0.2 cpl) but in Brisbane the differential rose from 2.6 cpl to 3.8 cpl while in Perth it increased from 2.5 cpl to 3.7 cpl.
6.4.2 WholesalepricesandTGPGross wholesale prices can be compared with the TGP to illustrate how actual wholesale prices reflect the spot price benchmark for wholesale transactions. On a daily basis, this relationship varies as few wholesale sales are actually made at the TGP and practical arrangements for purchasing petrol in the wholesale sector differ across companies.
Overall, however, chart 6.8 shows that the movements of gross wholesale prices and TGPs tracked each other closely and consistently over the time series.
Chart 6.8 Daily average wholesale prices and TGPs for RULP in the five largest cities: July 2010 to June 2013
cpl
60
70
80
90
100
110
120
130
140
150
Jun–13May–13Apr–13Mar–13Feb–13Jan–13Dec–12Nov–12Oct–12Sep–12Aug–12Jul–12Jun–12May–12Apr–12Mar–12Feb–12Jan–12Dec–11Nov–11Oct–11Sep–11Aug–11Jul–11Jun–11May–11Apr–11Mar–11Feb–11Jan–11Dec–10Nov–10Oct–10Sep–10Aug–10Jul–10
Jun–
13
May
–13
Apr
–13
Mar
–13
Feb–
13
Jan–
13
Dec
–12
Nov
–12
Oct
–12
Sep–
12
Aug
–12
Jul–
12Ju
n–12
May
–12
Apr
–12
Mar
–12
Feb–
12
Jan–
12
Dec
–11
Nov
–11
Oct
–11
Sep–
11
Aug
–11
Jul–
11Ju
n–11
May
–11
Apr
–11
Mar
–11
Feb–
11
Jan–
11
Dec
–10
Nov
–10
Oct
–10
Sep–
10
Aug
–10
Jul–
10
TGPGross wholesale price
Source: ACCC analysis based on data obtained from firms monitored through the ACCC’s monitoring process.
During 2012–13 gross wholesale prices tended to be marginally lower than TGPs (chart 6.9). The average absolute difference in 2012–13 was 1.0 cpl which equates to 0.8 per cent of the average gross wholesale price.
Monitoring of the Australian petroleum industry December 2013 71

Chart 6.9 Daily average wholesale prices and TGPs for RULP in the five largest cities: July 2012 to June 2013
cpl
60
70
80
90
100
110
120
130
140
150
Jun–13May–13Apr–13Mar–13Feb–13Jan–13Dec–12Nov–12Oct–12Sep–12Aug–12Jul–12
Jun–
13
May
–13
Apr
–13
Mar
–13
Feb–
13
Jan–
13
Dec
–12
Nov
–12
Oct
–12
Sep–
12
Aug
–12
Jul–
12
TGPGross wholesale price
Source: ACCC analysis based on data obtained from firms monitored through the ACCC’s monitoring process.
During the first half of 2012–13 average gross wholesale prices were below the corresponding TGPs in all of the five largest cities (table 6.3) and were the same in the Melbourne. This was similar to the differentials observed in 2011–12 when wholesale prices were below TGPs in the same four cities. In contrast to the situation in 2012–13, wholesale prices in Melbourne in 2011–12 were marginally higher than TGP (0.1 cpl).
Table 6.3 Annual average gross wholesale prices and TGPs for RULP in the five largest cities: July 2012 to June 2013
Gross wholesale price cpl
TGP cpl
Difference cpl
Sydney 133.2 134.6 -1.4
Melbourne 134.0 134.1 -0.1
Brisbane 133.9 134.1 -0.2
Adelaide 133.1 134.3 -1.2
Perth 133.9 134.2 -0.3
Source: ACCC analysis based on data obtained from firms monitored through the ACCC’s monitoring process.
72 Monitoring of the Australian petroleum industry December 2013
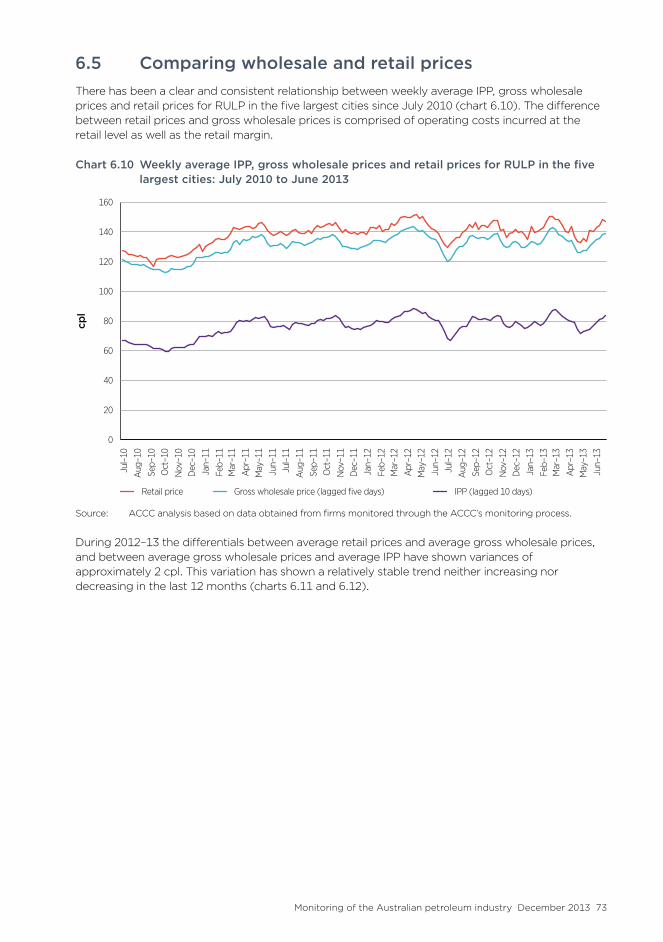
6.5 Comparing wholesale and retail pricesThere has been a clear and consistent relationship between weekly average IPP, gross wholesale prices and retail prices for RULP in the five largest cities since July 2010 (chart 6.10). The difference between retail prices and gross wholesale prices is comprised of operating costs incurred at the retail level as well as the retail margin.
Chart 6.10 Weekly average IPP, gross wholesale prices and retail prices for RULP in the five largest cities: July 2010 to June 2013
cpl
0
20
40
60
80
100
120
140
160
Jun–13May–13Apr–13Mar–13Feb–13Jan–13Dec–12Oct–12Oct–12Sep–12Aug–12Jul–12Jun–12May–12Apr–12Mar–12Feb–12Jan–12Dec–11Nov–11Oct–11Sep–11Aug–11Jul–11Jun–11May–11Apr–11Mar–11Feb–11Jan–11Dec–10Nov–10Oct–10Sep–10Aug–10Jun–10
Jun–
13
May
–13
Apr
–13
Mar
–13
Feb–
13
Jan–
13
Dec
–12
Nov
–12
Oct
–12
Sep–
12
Aug
–12
Jul–
12Ju
n–12
May
–12
Apr
–12
Mar
–12
Feb–
12
Jan–
12
Dec
–11
Nov
–11
Oct
–11
Sep–
11
Aug
–11
Jul–
11Ju
n–11
May
–11
Apr
–11
Mar
–11
Feb–
11
Jan–
11
Dec
–10
Nov
–10
Oct
–10
Sep–
10
Aug
–10
Jul–
10
Gross wholesale price (lagged five days) IPP (lagged 10 days)Retail price
Source: ACCC analysis based on data obtained from firms monitored through the ACCC’s monitoring process.
During 2012–13 the differentials between average retail prices and average gross wholesale prices, and between average gross wholesale prices and average IPP have shown variances of approximately 2 cpl. This variation has shown a relatively stable trend neither increasing nor decreasing in the last 12 months (charts 6.11 and 6.12).
Monitoring of the Australian petroleum industry December 2013 73

Chart 6.11 Weekly average IPP, gross wholesale prices and retail prices for RULP in the five largest cities: January 2012 to June 2013
cpl
0
20
40
60
80
100
120
140
160
Jun–13Jun–13May–13Apr–13Mar–13Feb–13Jan–13Dec–12Oct–12Oct–12Sep–12Aug–12Jul–12Jun–12May–12Apr–12Mar–12Feb–12Jan–12
Jun–
13
May
–13
Apr
–13
Mar
–13
Feb–
13
Jan–
13
Dec
–12
Oct
–12
Oct
–12
Sep–
12
Aug
–12
Jul–
12
Jun–
12
May
–12
Apr
–12
Mar
–12
Feb–
12
Jan–
12
Gross wholesale price (lagged five days) IPP (lagged 10 days)Retail price
Source: ACCC analysis based on data obtained from firms monitored through the ACCC’s monitoring process.
Chart 6.12 Differential between weekly average retail and gross wholesale prices, and weekly average gross wholesale prices and IPP for RULP, five largest cities: January 2012 to June 2013
cpl
0
10
20
30
40
50
60
Jun–13Jun–13May–13Apr–13Mar–13Feb–13Jan–13Dec–12Oct–12Oct–12Sep–12Aug–12Jul–12Jun–12May–12Apr–12Mar–12Feb–12Jan–12
Jun–
13
May
–13
Apr
–13
Mar
–13
Feb–
13
Jan–
13
Dec
–12
Oct
–12
Oct
–12
Sep–
12
Aug
–12
Jul–
12
Jun–
12
May
–12
Apr
–12
Mar
–12
Feb–
12
Jan–
12
Di�erence gross wholesale price and IPPDi�erence retail and gross wholesale price
Source: ACCC analysis based on data obtained from firms monitored through the ACCC’s monitoring process.
74 Monitoring of the Australian petroleum industry December 2013
6.6 Observations on wholesale pricesAs has been the case in previous ACCC petrol monitoring reports, wholesale prices of RULP in the largest capital cities have closely tracked movements in the IPP during 2012–13. In addition, prices for refined petrol under buy-sell transactions have also closely reflected the IPP. Hence the IPP continues to be the basis for setting wholesale prices in the Australian petrol industry.
The close relationship between the IPP and actual import costs illustrates that the IPP is a close approximation of the actual costs associated with importing refined petrol products into Australia. The main driver of the IPP continues to be the international benchmark price of Mogas 95.
Monitoring of the Australian petroleum industry December 2013 75

76 Monitoring of the Australian petroleum industry December 2013
7 Premium unleaded petrol
Key points• Sales of premium unleaded petrol (PULP) have grown steadily over the last five years. Over
the same time sales of regular unleaded petrol (RULP) have decreased by around one-fifth.
• In New South Wales PULP sales have doubled over the last five years, and now constitute almost half of total PULP sales in Australia.
– This increase has been significantly influenced by the ethanol mandate in that state, which has reduced the availability of RULP to consumers.
• In 2012−13 PULP 95 retail prices in the five largest cities were on average 10.4 cents per litre (cpl) higher than RULP retail prices, and PULP 98 retail prices were on average 15.4 cpl higher than RULP retail prices.
– These differentials were marginally higher than in 2011−12.
• In 2012−13 costs and margins made up 16 per cent of the average pump price of PULP 95 in the five largest cities.
– This was 5 percentage points higher than for RULP.
7.1 IntroductionThis chapter provides information on premium unleaded petrol (PULP) prices in the five largest cities (Sydney, Melbourne, Brisbane, Adelaide and Perth).108 It analyses the components that make up the retail price of PULP and compares these with the components of regular unleaded petrol (RULP) prices. It also discusses the supply of and demand for PULP in Australia; in particular, it focuses on PULP demand in New South Wales (NSW), which has doubled over the last five years.
7.2 Features of premium unleaded petrolIn Australia the two main grades of PULP are PULP 95 and PULP 98. Other grades of PULP are also available but they are sold in much lower volumes. For example, United markets ‘Premium 100’, which is a high performance fuel containing ethanol with a 100 research octane number (RON).
Under the Australian fuel standards, there are three differences between PULP and RULP:109
• the RON
• the motor octane number (MON) and
• the maximum sulphur content.
The Australian fuel standards do not differentiate between different grades of PULP.
7.2.1 ResearchoctanenumberandmotoroctanenumberThe RON and MON are measures of a fuel’s resistance to auto-ignition, which may cause engine knock. The RON measures the fuel at low engine speeds, while MON measures the fuel under load and at higher engine speeds. Some vehicles, such as European or performance cars, are designed to run on a higher RON fuel than RULP. Using lower octane fuel in these cars can lead to engine damage.
The Australian fuel standard for PULP requires a minimum 95 RON and a minimum 85 MON. PULP 98 contains a minimum 98 RON.
108 All prices in this chapter are nominal prices unless otherwise specified.
109 Fuel quality standards are maintained by the Department of Environment and are available at: http://www.environment.gov.au/atmosphere/fuelquality/standards/petrol.html, accessed 1 October 2013.
Monitoring of the Australian petroleum industry December 2013 77

The Australian standard for RULP has a lower octane rating, which means it is less resistant to auto-ignition. It requires a minimum 91 RON and a minimum 81 MON.
7.2.2 SulphurcontentSulphur occurs naturally in crude oil and if not removed in the refining process it will contaminate refined fuel. Sulphur has a large impact on vehicle emissions as it forms toxic gases on combustion in the engine, and affects the efficiency of vehicles’ catalytic converters. PULP is required to contain a maximum of 50 parts per million (ppm) sulphur, compared with 150 ppm for RULP.
7.2.3 OtherdifferencesIn contrast to RULP, which is sold as a generic product, companies attempt to distinguish their PULP products from those of their competitors. While the PULP products of different companies may contain the same octane level, and in some cases have similar features, they are often marketed as a proprietary retail product with additives unique to that brand.
PULP requires a more complex refining process compared with RULP. This is primarily due to the lower sulphur content. As the desulphurisation process reduces the octane rating, PULP may require additional refining in order to achieve 95 or 98 RON. Adding a cleaning agent or other proprietary additives also requires further processing.
7.3 Retail premium unleaded petrol prices
7.3.1 Retailpricemovementsin2012−13Retail PULP prices move in a similar pattern to retail RULP prices in the five largest cities. Price cycles for PULP occur in the five largest cities and other markets where regular RULP price cycles occur.
In 2012−13 in the five largest cities:
• the annual average retail price of PULP 95 was 151.7 cents per litre (cpl), a decrease of 1.3 cpl from 2011−12
• the annual average retail price of PULP 98 was 156.7 cpl, which was 0.9 cpl lower than in 2011−12.
By way of comparison, the annual average retail RULP price in 2012−13 in the five largest cities was 141.3 cpl (a decrease of 1.5 cpl from the previous year).
Chart 7.1 shows daily average retail prices for RULP, PULP 95 and PULP 98 across the five largest cities for the period 1 July 2012 to 30 September 2013.
78 Monitoring of the Australian petroleum industry December 2013

Chart 7.1 Daily average retail prices of RULP, PULP 95 and PULP 98 in the five largest cities: 1 July 2012 to 30 September 2013
cpl
120
130
140
150
160
170
180
Sep–13Aug–13Jul–13Jun–13May–13Apr–13Mar–13Feb–13Jan–13Dec–12Nov–12Oct–12Sep–12Aug–12Jul–12
Sep–
13
Aug
–13
Jul–
13
Jun–
13
May
–13
Apr
–13
Mar
–13
Feb–
13
Jan–
13
Dec
–12
Nov
–12
Oct
–12
Sep–
12
Aug
–12
Jul–
12
RULPPULP 98PULP 95
Source: ACCC calculations based on Informed Sources data.
Chart 7.1 shows that in the five largest cities:
• PULP 95 and PULP 98 retail prices moved in a very similar pattern to RULP retail prices throughout the period
• daily average PULP 95 prices reached a low of 136.4 cpl on 8 July 2012 and a high of 172.2 cpl on 25 July 2013
• daily average PULP 98 prices reached a low of 141.2 cpl on 8 July 2012 and a high of 177.7 cpl on 25 July 2013
• by way of comparison, daily average RULP prices reached a low of 126.3 cpl on 8 July 2012 and a high of 161.7 cpl on 25 July 2013
• the difference between the price levels of each grade of petrol was broadly consistent over the period.
7.3.2 RetailpricedifferentialsChart 7.2 shows the monthly average retail price differential between RULP, PULP 95 and PULP 98 from July 2012 to September 2013.
• The PULP 95–RULP price differential was 10.4 cpl in 2012−13, an increase of 0.2 cpl on 2011−12. – It was broadly stable over the 15 months to September 2013.
• The PULP 98–RULP price differential was 15.4 cpl in 2012−13, an increase of 0.6 cpl on 2011−12. – It was broadly stable in the second half of 2012, and then increased from 15.2 cpl in December 2012 to 16.0 cpl in September 2013.
• The PULP 98–PULP 95 price differential was 5.0 cpl in 2012−13, an increase of 0.4 cpl on 2011−12.
– It was broadly stable in the second half of 2012 and then increased from 4.9 cpl in December 2012 to 5.6 cpl in September 2013.
Monitoring of the Australian petroleum industry December 2013 79
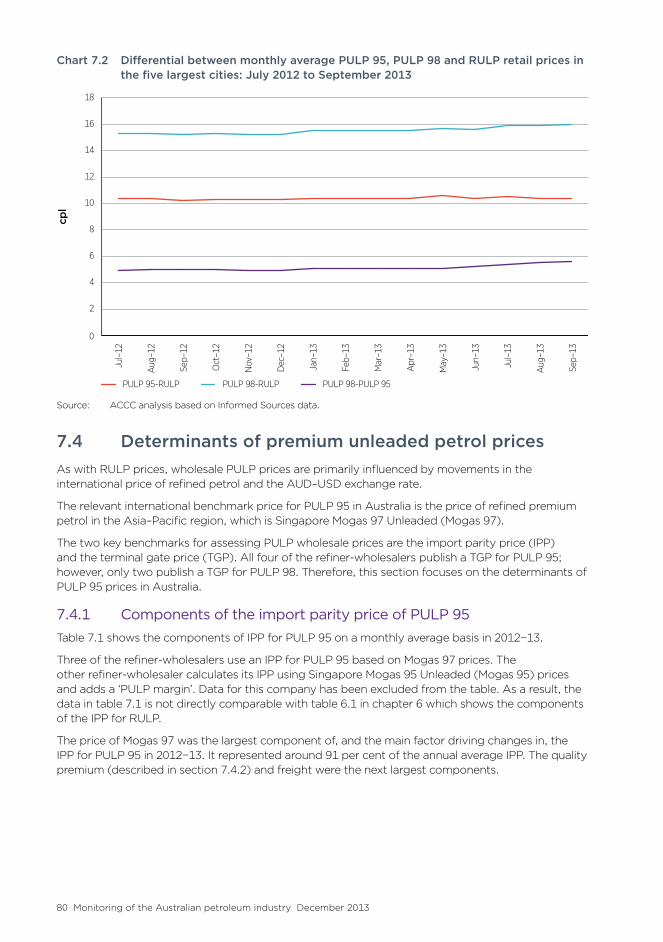
Chart 7.2 Differential between monthly average PULP 95, PULP 98 and RULP retail prices in the five largest cities: July 2012 to September 2013
cpl
0
2
4
6
8
10
12
14
16
18
Sep–13Aug–13Jul–13Jun–13May–13Apr–13Mar–13Feb–13Jan–13Dec–12Nov–12Oct–12Sep–12Aug–12Jul–12
Sep–
13
Aug
–13
Jul–
13
Jun–
13
May
–13
Apr
–13
Mar
–13
Feb–
13
Jan–
13
Dec
–12
Nov
–12
Oct
–12
Sep–
12
Aug
–12
Jul–
12
PULP 98-PULP 95PULP 98-RULPPULP 95-RULP
Source: ACCC analysis based on Informed Sources data.
7.4 Determinants of premium unleaded petrol pricesAs with RULP prices, wholesale PULP prices are primarily influenced by movements in the international price of refined petrol and the AUD–USD exchange rate.
The relevant international benchmark price for PULP 95 in Australia is the price of refined premium petrol in the Asia–Pacific region, which is Singapore Mogas 97 Unleaded (Mogas 97).
The two key benchmarks for assessing PULP wholesale prices are the import parity price (IPP) and the terminal gate price (TGP). All four of the refiner-wholesalers publish a TGP for PULP 95; however, only two publish a TGP for PULP 98. Therefore, this section focuses on the determinants of PULP 95 prices in Australia.
7.4.1 ComponentsoftheimportparitypriceofPULP95Table 7.1 shows the components of IPP for PULP 95 on a monthly average basis in 2012−13.
Three of the refiner-wholesalers use an IPP for PULP 95 based on Mogas 97 prices. The other refiner-wholesaler calculates its IPP using Singapore Mogas 95 Unleaded (Mogas 95) prices and adds a ‘PULP margin’. Data for this company has been excluded from the table. As a result, the data in table 7.1 is not directly comparable with table 6.1 in chapter 6 which shows the components of the IPP for RULP.
The price of Mogas 97 was the largest component of, and the main factor driving changes in, the IPP for PULP 95 in 2012−13. It represented around 91 per cent of the annual average IPP. The quality premium (described in section 7.4.2) and freight were the next largest components.
80 Monitoring of the Australian petroleum industry December 2013

Table 7.1 Components of monthly and annual average IPP for PULP 95 in the five largest cities: 2012−13
Exchange rate
1 AUD = USDMogas 97
cpl
Quality premium
cpl
Total freight
cpl
Insurance and loss
cpl
Wharfage cpl
Other cpl
IPP cpl
Jul-12 1.03 68.94 4.49 2.03 0.32 0.28 0.02 76.08
Aug-12 1.05 78.16 4.44 1.95 0.35 0.29 0.02 85.22
Sep-12 1.04 77.96 4.49 1.99 0.35 0.29 0.02 85.10
Oct-12 1.03 78.73 4.52 2.28 0.36 0.29 0.02 86.21
Nov-12 1.04 73.52 4.53 2.41 0.34 0.29 0.02 81.11
Dec-12 1.05 72.54 4.49 2.55 0.33 0.29 0.02 80.22
Jan-13 1.05 74.00 4.53 2.49 0.34 0.29 0.05 81.69
Feb-13 1.03 81.07 4.58 2.34 0.37 0.29 0.05 88.70
Mar-13 1.03 78.98 4.61 2.64 0.36 0.29 0.05 86.93
Apr-13 1.04 71.97 4.52 2.62 0.33 0.29 0.05 79.78
May-13 0.99 72.86 4.68 2.38 0.34 0.29 0.05 80.59
Jun-13 0.94 79.41 4.95 2.33 0.36 0.29 0.05 87.38
2012−13 1.03 75.68 4.57 2.33 0.35 0.29 0.04 83.25
Source: ACCC analysis based on data obtained from firms monitored through the ACCC’s monitoring process.
7.4.2 ComparisonofIPPsforPULP95andRULPIn 2012−13 the annual average IPP for PULP 95 was 83.3 cpl, which was 4.2 cpl higher than the annual average IPP for RULP.110 For most refiner-wholesalers the two key differences between these IPPs are the differences in international benchmark prices and the quality premiums.
International benchmark prices
Chart 7.3 shows movements in weekly average Mogas 95 prices (which is the relevant international benchmark price for RULP) and Mogas 97 prices for the period July 2012 to September 2013 in Australian cents per litre. It also shows the weekly average differential between the two prices.
110 The components of the IPP for RULP are described in section 6.3.
Monitoring of the Australian petroleum industry December 2013 81

Chart 7.3 Weekly average Mogas 97 and Mogas 95 prices and the differential, Australian cents per litre: July 2012 to September 2013
cpl
50
55
60
65
70
75
80
85
90
Sep–13Aug–13Jul–13Jun–13May–13Apr–13Mar–13Feb–13Jan–13Dec–12Nov–12Oct–12Sep–12Aug–12Jul–12
cpl
cpl
0
1
2
3
4
5
6
7
8
Sep–13Aug–13Jul–13Jun–13May–13Apr–13Mar–13Feb–13Jan–13Dec–12Nov–12Oct–12Sep–12Aug–12Jul–12
Sep–
13
Aug
–13
Jul–
13
Jun–
13
May
–13
Apr
–13
Mar
–13
Feb–
13
Jan–
13
Dec
–12
Nov
–12
Oct
–12
Sep–
12
Aug
–12
Jul–
12
Mogas 97 (LHS)Mogas 95 (LHS) Di�erential (RHS)
Sources: ACCC calculations based on Platts and RBA data.
Movements in Mogas 97 prices over the period were similar to movements in Mogas 95 prices. In 2012−13 Mogas 97 prices were on average around 1.7 cpl higher than Mogas 95 prices. On a weekly basis, the differential ranged from a low of around 0.8 cpl to a high of around 3.6 cpl. The difference between the two grades of Mogas varies due to changes in the supply-demand fundamentals for the two grades of petrol.
Quality premiums
The quality premiums for RULP and PULP primarily reflect the difference between the international benchmark prices of Mogas 95 and Mogas 97 and the prices of RULP and PULP refined to Australian standards, respectively. The quality premiums are influenced by the relative bargaining strengths of buyers and sellers and general market conditions for the two fuels.
Chart 7.4 shows the monthly average quality premiums for the IPPs for RULP and PULP 95, and the differential, from July 2012 to June 2013.111
In 2012−13 the average quality premium for PULP 95 was around 4.6 cpl. It increased from 4.5 cpl in July 2012 to 4.9 cpl in June 2013.
The average differential between the quality premiums for PULP 95 and RULP in 2012−13 was 3.4 cpl. It was broadly stable through most of the year at between 3.3−3.4 cpl, and increased to a high of 3.8 cpl in June 2013.
111 As noted in section 7.4.1 one refiner-wholesaler calculates its IPP on a different basis to the other companies. Its data is excluded from the calculations of the average quality premium for PULP 95.
82 Monitoring of the Australian petroleum industry December 2013

Chart 7.4 Monthly average quality premiums for PULP 95 and RULP in the five largest cities, and the differential, Australian cents per litre: July 2012 to June 2013
cpl
0
1
2
3
4
5
6
Jun–13May–13Apr–13Mar–13Feb–13Jan–13Dec–12Nov–12Oct–12Sep–12Aug–12Jul–12
cpl
0
1
2
3
4
5
6
Jun–13May–13Apr–13Mar–13Feb–13Jan–13Dec–12Nov–12Oct–12Sep–12Aug–12Jul–12
Jun–
13
May
–13
Apr
–13
Mar
–13
Feb–
13
Jan–
13
Dec
–12
Nov
–12
Oct
–12
Sep–
12
Aug
–12
Jul–
12
RULPPULP 95 Di erential
Source: ACCC analysis based on data obtained from firms monitored through the ACCC’s monitoring process.
7.4.3 WholesaleandterminalgatepricesChart 7.5 shows daily average IPPs, actual wholesale prices and TGPs for PULP 95 in 2012−13. It also shows net wholesale prices (i.e. actual wholesale prices less taxes (excise and GST)).
The TGP represents the spot price of purchasing PULP 95 from a wholesaler at the terminal gate. As with RULP, relatively few PULP transactions are made at the terminal gate; instead, they are negotiated in advance with prices struck slightly above or below TGP depending on volumes and additional services.
The actual wholesale prices are derived from the monitored companies.
The chart shows that, in 2012−13:
• movements in net wholesale prices for PULP 95 closely tracked movements in the IPP for PULP 95
– net wholesale prices were on average around 4.5 cpl higher than the IPP for PULP 95
• movements in actual wholesale prices and TGPs for PULP 95 also tracked each other closely – TGPs were on average around 1.6 cpl higher than actual wholesale prices.
A comparison with RULP prices shows that:
• the annual average actual wholesale price for PULP 95 in 2012−13 was 141.1 cpl, which was 7.5 cpl higher than the annual average actual wholesale price for RULP
• the annual average PULP 95 TGP in 2012−13 was 142.7 cpl, which was 8.5 cpl higher than the annual average RULP TGP.
Monitoring of the Australian petroleum industry December 2013 83

Chart 7.5 Daily average PULP 95 IPPs, actual and net wholesale prices and TGPs, five largest cities: July 2012 to June 2013
cpl
60
70
80
90
100
110
120
130
140
150
160
Jun–13May–13Apr–13Mar–13Feb–13Jan–13Dec–12Nov–12Oct–12Sep–12Aug–12Jul–12
Jun–
13
May
–13
Apr
–13
Mar
–13
Feb–
13
Jan–
13
Dec
–12
Nov
–12
Oct
–12
Sep–
12
Aug
–12
Jul–
12
TGP Actual wholesale price Net wholesale price IPP
Source: ACCC analysis based on data obtained from firms monitored through the ACCC’s monitoring process.
A similar chart is not provided for PULP 98 as only two refiner-wholesalers publish a PULP 98 TGP. In 2012−13 actual and net wholesale prices for PULP 98 moved in line with PULP 95 prices, albeit at a higher level:
• net wholesale prices for PULP 98 were on average 4.4 cpl higher than for PULP 95
• gross wholesale prices for PULP 98 were on average 5.0 cpl higher than for PULP 95.
7.4.4 GrossindicativeretaildifferencesforPULP95Gross indicative retail differences (GIRDs) are calculated by subtracting average TGPs from average retail petrol prices.
GIRDs should be treated only as a useful approximate benchmark for the difference between wholesale and retail prices. They should not be confused with actual retail profits.112
Table 7.2 shows annual average GIRDs for PULP 95, in both nominal and real terms, in the five largest cities from 2008−09 to 2012−13.
112 Chapter 12 presents data on retail profits derived from financial data provided by the monitored companies.
84 Monitoring of the Australian petroleum industry December 2013

Table 7.2 Annual average PULP 95 retail petrol prices, terminal gate prices and gross indicative retail differences in both nominal and real terms, five largest cities: 2008−09 to 2012−13
Average retail price
cpl
Average TGP cpl
Gross indicative retail difference (nominal)
cpl
Gross indicative retail difference (real)
cpl
2008−09 135.3 129.0 6.3 7.0
2009−10 133.4 126.7 6.7 7.2
2010−11 141.3 133.5 7.8 8.2
2011−12 153.0 145.1 7.9 8.1
2012−13 151.7 142.7 9.0 9.0
Sources: ACCC calculations based on Informed Sources, WA FuelWatch, information provided by the monitored companies and Australian Bureau of Statistics, 6401.0 Consumer Price Index, Australia, Table 1. CPI: All Groups, Index Numbers and Percentage Changes, http://www.abs.gov.au/AUSSTATS, accessed 4 October 2013.
Note: The base year is 2012−13.
Table 7.2 indicates that GIRDs for PULP 95 increased over the five years to 2012−13:
• in nominal terms, GIRDs increased by 2.7 cpl—from 6.3 cpl in 2008−09 to 9.0 cpl in 2012−13
• in real terms, GIRDs increased by 2.0 cpl—from 7.0 cpl in 2008−09 to 9.0 cpl in 2012−13.
A comparison with RULP GIRDs shows that:113
• in each of the four years to 2011−12 PULP 95 GIRDs were not materially different from RULP GIRDs (in both nominal and real terms)
• however, in 2012−13 PULP 95 GIRDs were 1.9 cpl higher than RULP GIRDs (in both nominal and real terms)
– while in nominal terms the differential between PULP 95 and RULP retail prices increased by 0.2 cpl, the differential between TGPs decreased by 1.5 cpl.
7.4.5 ComponentsoftheretailPULP95priceChart 7.6 shows the three main components of the annual average retail PULP 95 price across the five largest cities in 2012−13. The two largest components of the pump price—Mogas 97 and taxes (excise and the GST)—accounted for 84 per cent of the price of PULP 95. Half of the pump price of PULP 95 was the cost of international refined petrol. Other costs and margins made up 16 per cent of the pump price, compared with 11 per cent for RULP.114
113 RULP GIRDs are shown in table 8.1 in chapter 8.
114 Components of the retail RULP price are described in section 8.4.
Monitoring of the Australian petroleum industry December 2013 85

Chart 7.6 Components of annual average retail PULP 95 price in the five largest cities: 2012−13
Other costs and marginsTaxesMogas 97
PULP 95151.7 cpl
cpl %
23.9 16
51.9 34
75.9 50
Sources: ACCC calculations based on Informed Sources, Platts and RBA data.
7.5 Supply of premium unleaded petrolPULP in Australia is either refined locally or imported. Chart 7.7 shows the breakdown of annual sales volumes of PULP (95 and 98 combined) into domestic production and imports for the five years to 2012−13. It also shows these volumes as a percentage of total sales volumes. The chart indicates that:
• sales of PULP in Australia steadily increased over the five years to 2012−13
• while domestic production continues to be the main source of supply for PULP, imports increased over the last two years to make up 29 per cent of supply in 2012−13
• in 2012−13 PULP sales were 5000 megalitres (ML), an increase of 265 ML from 2011−12. Imports accounted for almost 90 per cent of this increase.
86 Monitoring of the Australian petroleum industry December 2013

Chart 7.7 Volume and percentage of PULP sales by source: 2008−09 to 2012−13
0
500
1000
1500
2000
2500
3000
3500
4000
4500
5000
5500
2012–132011–122010–112009–102008–09
meg
alitres
Imports (estimated)Domestic refinery production
Sources: ACCC analysis based on data obtained from firms monitored through the ACCC’s monitoring process; Department of Resources, Energy and Tourism (RET) and Bureau of Resources and Energy Economics (BREE), Australian Petroleum Statistics, various issues.
7.6 Demand for premium unleaded petrolDemand for PULP has increased steadily over the past five years. The main driver for this increase has been the NSW ethanol mandate introduced in October 2007. In NSW many motorists have substituted PULP for RULP, which is less readily available than in previous years.
7.6.1 Nationwide
Sales of premium unleaded petrol compared with other grades of petrol
Chart 7.8 shows monthly sales of PULP (95 and 98 combined), RULP and ethanol blended petrol (EBP) in Australia over the period July 2008 to June 2013. On a monthly basis, sales of PULP increased from 243 ML in July 2008 to 399 ML in June 2013—an increase of 156 ML or 64 per cent. Over the same period, EBP sales increased by 91 ML (80 per cent) and RULP sales decreased by 338 ML (28 per cent).
Monitoring of the Australian petroleum industry December 2013 87
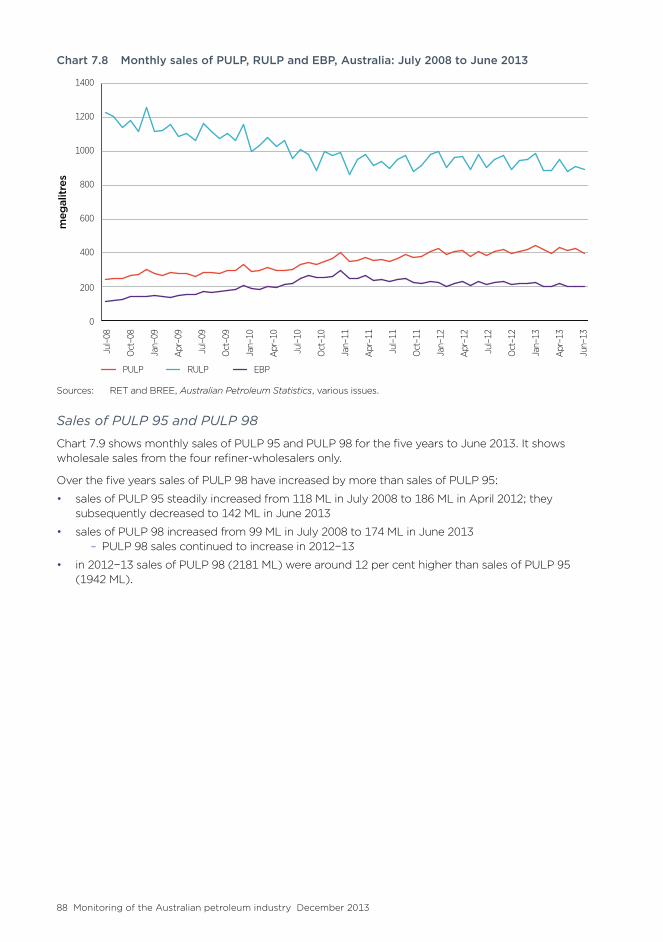
Chart 7.8 Monthly sales of PULP, RULP and EBP, Australia: July 2008 to June 2013meg
alitres
0
200
400
600
800
1000
1200
1400
Apr–13Jan–13Oct–12Jul–12Apr–12Jan–12Oct–11Jul–11Apr–11Jan–11Oct–10Jul–10Apr–10Jan–10Oct–09Jul–09Apr–09Jan–09Oct–08Jul–08
Apr
–13
Jan–
13
Oct
–12
Jul–
12
Apr
–12
Jan–
12
Oct
–11
Jul–
11
Apr
–11
Jan–
11
Oct
–10
Jul–
10
Apr
–10
Jan–
10
Oct
–09
Jul–
09
Apr
–09
Jan–
09
Oct
–08
Jul–
08
Jun–
13
EBPRULPPULP
Sources: RET and BREE, Australian Petroleum Statistics, various issues.
Sales of PULP 95 and PULP 98
Chart 7.9 shows monthly sales of PULP 95 and PULP 98 for the five years to June 2013. It shows wholesale sales from the four refiner-wholesalers only.
Over the five years sales of PULP 98 have increased by more than sales of PULP 95:
• sales of PULP 95 steadily increased from 118 ML in July 2008 to 186 ML in April 2012; they subsequently decreased to 142 ML in June 2013
• sales of PULP 98 increased from 99 ML in July 2008 to 174 ML in June 2013 – PULP 98 sales continued to increase in 2012−13
• in 2012−13 sales of PULP 98 (2181 ML) were around 12 per cent higher than sales of PULP 95 (1942 ML).
88 Monitoring of the Australian petroleum industry December 2013

Chart 7.9 Monthly volumes of PULP 95 and PULP 98, Australia: July 2008 to June 2013
meg
alitres
80
100
120
140
160
180
200
220
Apr–13Jan–13Oct–12Jul–12Apr–12Jan–12Oct–11Jul–11Apr–11Jan–11Oct–10Jul–10Apr–10Jan–10Oct–09Jul–09Apr–09Jan–09Oct–08Jul–08
Apr
–13
Jan–
13
Oct
–12
Jul–
12
Apr
–12
Jan–
12
Oct
–11
Jul–
11
Apr
–11
Jan–
11
Oct
–10
Jul–
10
Apr
–10
Jan–
10
Oct
–09
Jul–
09
Apr
–09
Jan–
09
Oct
–08
Jul–
08
Jun–
13
PULP 98PULP 95
Source: ACCC analysis based on data obtained from firms monitored through the ACCC’s monitoring process.
7.6.2 NSWcomparedwithotherstatesOne of the key drivers of demand growth for PULP in the last five years has been the NSW Government’s ethanol mandate. The mandate has reduced the availability of RULP in that state, and many motorists have switched to using PULP instead of EBP.
Table 7.3 shows annual sales of PULP (including PULP 95 and PULP 98), RULP and EBP for each of the states and the Northern Territory from 2008−09 to 2012−13. It also shows sales as a percentage of total petrol sold. It shows that:
• PULP sales as a proportion of total petrol sales increased in all states and the Northern Territory over the five-year period
• while this increase has been modest in most states, in NSW PULP sales as a proportion of total petrol sales doubled from 19 per cent in 2008−09 to 38 per cent in 2012−13.
In 2012−13 NSW (2288 ML) accounted for almost half of PULP sales in Australia (5000 ML).
Monitoring of the Australian petroleum industry December 2013 89
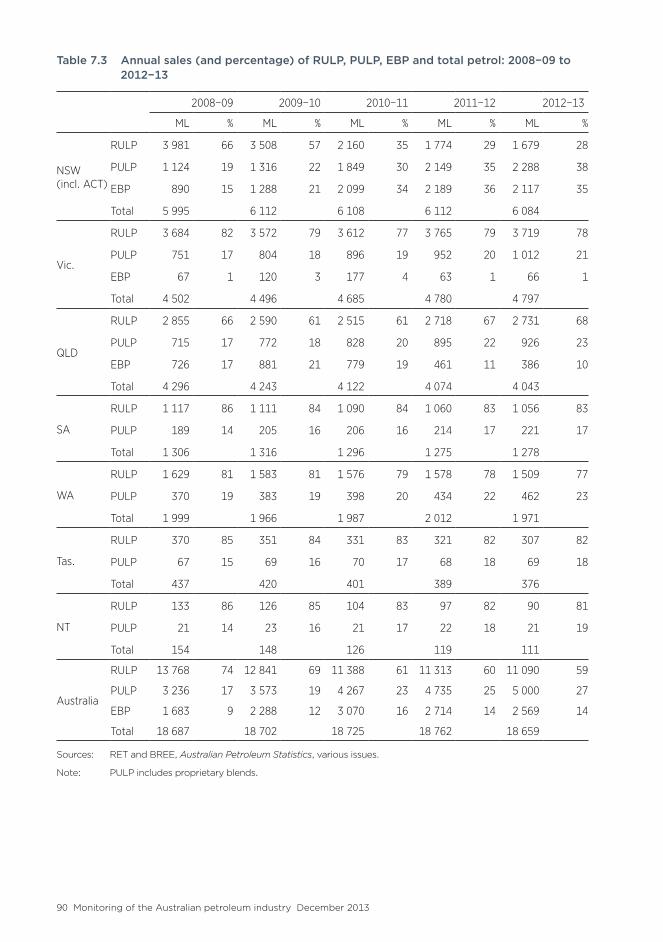
Table 7.3 Annual sales (and percentage) of RULP, PULP, EBP and total petrol: 2008−09 to 2012−13
2008−09 2009−10 2010−11 2011−12 2012−13
ML % ML % ML % ML % ML %
NSW (incl. ACT)
RULP 3 981 66 3 508 57 2 160 35 1 774 29 1 679 28
PULP 1 124 19 1 316 22 1 849 30 2 149 35 2 288 38
EBP 890 15 1 288 21 2 099 34 2 189 36 2 117 35
Total 5 995 6 112 6 108 6 112 6 084
Vic.
RULP 3 684 82 3 572 79 3 612 77 3 765 79 3 719 78
PULP 751 17 804 18 896 19 952 20 1 012 21
EBP 67 1 120 3 177 4 63 1 66 1
Total 4 502 4 496 4 685 4 780 4 797
QLD
RULP 2 855 66 2 590 61 2 515 61 2 718 67 2 731 68
PULP 715 17 772 18 828 20 895 22 926 23
EBP 726 17 881 21 779 19 461 11 386 10
Total 4 296 4 243 4 122 4 074 4 043
SA
RULP 1 117 86 1 111 84 1 090 84 1 060 83 1 056 83
PULP 189 14 205 16 206 16 214 17 221 17
Total 1 306 1 316 1 296 1 275 1 278
WA
RULP 1 629 81 1 583 81 1 576 79 1 578 78 1 509 77
PULP 370 19 383 19 398 20 434 22 462 23
Total 1 999 1 966 1 987 2 012 1 971
Tas.
RULP 370 85 351 84 331 83 321 82 307 82
PULP 67 15 69 16 70 17 68 18 69 18
Total 437 420 401 389 376
NT
RULP 133 86 126 85 104 83 97 82 90 81
PULP 21 14 23 16 21 17 22 18 21 19
Total 154 148 126 119 111
Australia
RULP 13 768 74 12 841 69 11 388 61 11 313 60 11 090 59
PULP 3 236 17 3 573 19 4 267 23 4 735 25 5 000 27
EBP 1 683 9 2 288 12 3 070 16 2 714 14 2 569 14
Total 18 687 18 702 18 725 18 762 18 659
Sources: RET and BREE, Australian Petroleum Statistics, various issues.
Note: PULP includes proprietary blends.
90 Monitoring of the Australian petroleum industry December 2013

Chart 7.10 shows the relative change in monthly volumes of PULP and RULP in NSW and the rest of Australia in the five years to June 2013. The chart shows wholesale sales from the four refiner-wholesalers only.
• Sales of PULP in NSW doubled between July 2008 and June 2013, with much of the growth in volumes occurring in 2010.
• RULP sales in NSW fell by around 70 per cent over the five years to June 2013.
In contrast, sales of PULP 95 in the rest of Australia fell slightly, while RULP sales fell by around one-fifth over the period.
Chart 7.10 Changes in monthly volume sales of PULP 95 and RULP sold in NSW and the rest of Australia (Index): July 2008 to June 2013
Index
(bas
e = 10
0)
0
50
100
150
200
250
300
Apr–13Jan–13Oct–12Jul–12Apr–12Jan–12Oct–11Jul–11Apr–11Jan–11Oct–10Jul–10Apr–10Jan–10Oct–09Jul–09Apr–09Jan–09Oct–08Jul–08
Apr
–13
Jan–
13
Oct
–12
Jul–
12
Apr
–12
Jan–
12
Oct
–11
Jul–
11
Apr
–11
Jan–
11
Oct
–10
Jul–
10
Apr
–10
Jan–
10
Oct
–09
Jul–
09
Apr
–09
Jan–
09
Oct
–08
Jul–
08
Jun–
13
NSW - RULPNSW - PULP 95 Rest of Australia - RULPRest of Australia - PULP 95
Source: ACCC analysis based on data obtained from firms monitored through the ACCC’s monitoring process.
Note: Base period for the index is July 2008.
Sales of PULP 98—not shown in the chart—increased significantly in NSW and the rest of Australia:
• in NSW, sales of PULP 98 doubled in the five years to June 2013
• in the rest of Australia, they increased by around 60 per cent.
Monitoring of the Australian petroleum industry December 2013 91

92 Monitoring of the Australian petroleum industry December 2013

8 Retail prices
Key points• The annual average retail price of regular unleaded petrol (RULP) in the five largest cities in
2012−13 was 141.3 cents per litre (cpl), a decrease of 1.5 cpl from 2011−12.
• In 2012−13 daily average retail RULP prices (on a seven-day rolling average basis) across the five largest cities ranged from a low of around 128 cpl in July 2012 to a high of around 151 cpl in February 2013—a range of 23 cpl.
– they subsequently increased to around 159 cpl in July 2013 – in Brisbane and Perth daily average retail prices—in nominal terms—reached their highest ever levels at 165.1 cpl and 160.6 cpl, respectively.
• Movements in Australian retail RULP prices are primarily determined by movements in the international price of refined petrol (Singapore Mogas 95 Unleaded) and the AUD–USD exchange rate.
• For most of 2012−13 motorists were protected from higher petrol prices by the relatively strong AUD–USD exchange rate (which, for most of the year, was above parity).
– however, the decrease in the value of the Australian dollar from early May 2013 by around 16 per cent meant that retail petrol prices in the September quarter 2013 were around 12 cpl higher than they otherwise would have been.
• As in previous years, the main components of retail RULP prices in 2012−13 were the international price of refined petrol (53 per cent), and excise and the GST (36 per cent).
8.1 IntroductionThis chapter primarily focuses on regular unleaded petrol (RULP) prices across the five largest cities (Sydney, Melbourne, Brisbane, Adelaide and Perth).115 However, it also examines:
• the prices of other grades of petrol—premium unleaded petrol (PULP) 95, PULP 98, and E10 (i.e. RULP with up to 10 per cent ethanol)—and diesel and automotive liquefied petroleum gas (LPG)
• retail prices in the three smaller capital cities (Canberra, Hobart and Darwin).
Petrol prices in regional locations across Australia are analysed in chapter 9.
While the analysis of petrol price movements in this chapter largely focuses on average prices across the five largest cities, price levels and price movements are not uniform across these cities. This is because factors specific to each city influence the extent of competition (and therefore prices).
8.2 Retail petrol price movements
8.2.1 July2012toSeptember2013Chart 8.1 shows daily average retail petrol prices, and seven-day rolling average retail petrol prices, across the five largest cities for the period 1 July 2012 to 30 September 2013.
A seven-day rolling average price is the average of the current day’s price and prices on the six previous days. Traditionally, the ACCC has used a seven-day rolling average to smooth out the influence of the regular petrol price cycles in the larger capital cities on price movements. This has
115 References to petrol in this chapter are to RULP unless otherwise specified. Prices in this chapter are expressed in nominal terms unless otherwise specified.
Monitoring of the Australian petroleum industry December 2013 93

been less effective in recent years because the duration of price cycles in most of the larger capital cities has become greater than seven days (see chapter 10).
Chart 8.1 Daily average retail petrol prices and seven-day rolling average retail petrol prices, five largest cities: 1 July 2012 to 30 September 2013
cpl
125
130
135
140
145
150
155
160
165
Sep–13Aug–13Jul–13Jun–13May–13Apr–13Mar–13Feb–13Jan–13Dec–12Nov–12Oct–12Sep–12Aug–12Jul–12
Sep–
13
Aug
–13
Jul–
13
Jun–
13
May
–13
Apr
–13
Mar
–13
Feb–
13
Jan–
13
Dec
–12
Nov
–12
Oct
–12
Sep–
12
Aug
–12
Jul–
12
Seven-day rolling averageDaily average
Source: ACCC calculations based on Informed Sources data.
Chart 8.1 shows that:
• retail prices were quite volatile
• the period began with prices on a seven-day rolling average basis at around 132 cents per litre (cpl)
• between July 2012 and late-October 2012 prices increased by 18 cpl to around 150 cpl, before decreasing to around 135 cpl in early January 2013
• from then prices increased to around 151 cpl in late-February 2013 before falling to a trough of around 132 cpl in mid-May 2013
• subsequently prices increased by 27 cpl to a peak of around 159 cpl in late-July 2013, before decreasing to around 149 cpl at the end of September.
In 2012−13 daily average retail petrol prices (on a seven-day rolling average basis) across the five largest cities ranged from a low of around 128 cpl in July 2012 to a high of around 151 cpl in February 2013—a range of 23 cpl. The average annual price of petrol across the five largest cities in 2012−13 was 141.3 cpl, which was 1.5 cpl lower than in 2011−12 (142.8 cpl).
8.2.2 July2007toSeptember2013Chart 8.2 shows seven-day rolling average retail petrol prices across the five largest cities, in both nominal and real terms, over a longer period, i.e. 1 July 2007 to 30 September 2013.
94 Monitoring of the Australian petroleum industry December 2013

Chart 8.2 Seven-day rolling average retail petrol prices in nominal and real terms, five largest cities: 1 July 2007 to 30 September 2013
cpl
90
100
110
120
130
140
150
160
170
180
190
Sep–13Jul–13May–13Mar–13Jan–13Nov–12Sep–12Jul–12May–12Mar–12Jan–12Nov–11Sep–11Jul–11May–11Mar–11Jan–11Nov–10Sep–10Jul–10May–10Mar–10Jan–10Nov–09Sep–09Jul–09May–09Mar–09Jan–09Nov–08Sep–08Jul–08May–08Mar–08Jan–08Nov–07Sep–07Jul–07
Sep–
13Ju
l–13
May
–13
Mar
–13
Jan–
13N
ov–1
2Se
p–12
Jul–
12M
ay–1
2M
ar–1
2Ja
n–12
Nov
–11
Sep–
11Ju
l–11
May
–11
Mar
–11
Jan–
11N
ov–1
0Se
p–10
Jul–
10M
ay–1
0M
ar–1
0Ja
n–10
Nov
–09
Sep–
09Ju
l–09
May
–09
Mar
–09
Jan–
09N
ov–0
8Se
p–08
Jul–
08M
ay–0
8M
ar–0
8Ja
n–08
Nov
–07
Sep–
07Ju
l–07
Seven-day rolling average (real)Seven-day rolling average
Sources: ACCC calculations based on Informed Sources and Australian Bureau of Statistics, 6401.0 Consumer Price Index, Australia, Table 1. CPI: All Groups, Index Numbers and Percentage Changes, http://www.abs.gov.au/AUSSTATS, accessed 31 October 2013.
Note: The base year is 2012−13.
The jagged appearance of the movements in petrol prices from around mid-2011 onwards reflects the significant increase in price cycle durations from this time (which has reduced the smoothing effect of using seven-day rolling averages).
Chart 8.2 shows that petrol prices in nominal terms:
• exhibited a similar degree of volatility in 2012−13 to that in 2011−12 – the range between the highest and lowest prices in 2012−13 was 23 cpl, which was almost the same as in 2011−12 (22 cpl)
• increased in July 2013 to be 158.9 cpl – in nominal terms, this was 3.6 cpl below the record high levels in July 2008 of 162.5 cpl – in real terms, it was 24.4 cpl below the record high of 183.3 cpl
• between July 2007 and July 2008 retail prices increased rapidly (by around 38 cpl), and then decreased substantially in the second half of 2008 (by around 62 cpl) at the time of the Global Financial Crisis (GFC), before recovering in early 2009 and entering a period of relative stability in 2009−10
• between mid-September 2010 and early May 2011 prices increased by around 31 cpl, following geopolitical tensions and supply disruptions in Libya and the Middle East
• for most of the period since January 2011 retail prices largely ranged between 130 cpl and 150 cpl.
Monitoring of the Australian petroleum industry December 2013 95

8.2.3 PricesinthethreesmallercapitalcitiesChart 8.3 shows monthly average retail petrol prices in Canberra, Hobart and Darwin from July 2012 to September 2013, compared with prices across the five largest cities.
Chart 8.3 Monthly average retail petrol prices in Canberra, Hobart and Darwin and the five largest cities: July 2012 to September 2013
cpl
130
135
140
145
150
155
160
165
170
Sep–13Aug–13Jul–13Jun–13May–13Apr–13Mar–13Feb–13Jan–13Dec–12Nov–12Oct–12Sep–12Aug–12Jul–12
Sep–
13
Aug
–13
Jul–
13
Jun–
13
May
–13
Apr
–13
Mar
–13
Feb–
13
Jan–
13
Dec
–12
Nov
–12
Oct
–12
Sep–
12
Aug
–12
Jul–
12
Darwin Five largest citiesHobartCanberra
Source: ACCC calculations based on Informed Sources data.
The chart shows that:
• prices in the three smaller capital cities were always higher than in the five largest cities
• prices in Darwin were always higher than those in Hobart and Canberra
• prices in the smaller capital cities tended to follow similar trends to those in the five largest cities
• price relativities between the smaller capital cities and the five largest cities vary over time.
Factors that may be influencing the relatively higher prices in Canberra, Hobart and Darwin are similar to those factors relating to smaller markets outlined in section 9.2.
8.3 Determinants of petrol pricesMovements in retail petrol prices in Australia are primarily influenced by two factors:
• movements in the international price of refined petrol (which itself is driven by the price of crude oil)
• the AUD–USD exchange rate (as the international prices of crude oil and refined petrol are expressed in US dollars).
Other influences on retail prices include the degree of competition at the wholesale and retail levels (including the regular retail price cycles that occur in the largest cities), the level of excise and taxes, international and domestic freight costs, the fuel quality premium (which includes a component for producing petrol to Australian fuel quality standards), and other wholesale and retail costs and margins.
96 Monitoring of the Australian petroleum industry December 2013

8.3.1 InternationalpriceofrefinedpetrolThe price of refined petrol in Australia is set with reference to international benchmark prices. The relevant international benchmark price for petrol in Australia is the price of refined petrol in the Asia-Pacific region, the price of Singapore Mogas 95 Unleaded (Mogas 95).
July 2012 to September 2013
Chart 8.4 shows movements in weekly average Mogas 95 prices for the period July 2012 to September 2013.
Chart 8.4 Weekly average Mogas 95 prices: July 2012 to September 2013
USD
per bl
100
105
110
115
120
125
130
135
140
Sep–13Aug–13Jul–13Jun–13May–13Apr–13Mar–13Feb–13Jan–13Dec–12Nov–12Oct–12Sep–12Aug–12Jul–12
Sep–
13
Aug
–13
Jul–
13
Jun–
13
May
–13
Apr
–13
Mar
–13
Feb–
13
Jan–
13
Dec
–12
Nov
–12
Oct
–12
Sep–
12
Aug
–12
Jul–
12
Source: ACCC calculations based on Platts data.
Over the period Mogas 95 prices were influenced by a range of factors:
• Between July 2012 and August 2012 Mogas 95 prices increased by around USD 24 per barrel (22 per cent) to around USD 131 per barrel. This increase was influenced by supply disruptions in the North Sea, and on-going instability in the Middle East (particularly in Syria) heightening concern over potential disruptions to supply.
• From mid-August 2012 to early November 2012 Mogas 95 prices fell by around USD 15 per barrel (11 per cent) to around USD 116 per barrel. This decrease was influenced by falls in crude oil prices due to negative US economic data, weak seasonal demand heading into the northern hemisphere winter, ample regional supply and the return of a number of refineries from their turnarounds.
• Prices remained volatile until mid-January 2013 when prices increased by around USD 16 per barrel (13 per cent) to a peak of around US 136 per barrel. This increase was influenced by strong regional demand and increases in crude oil prices due to positive economic news from the US and Europe, as well as supply concerns regarding Middle East geopolitical tensions and expectations of lower North Sea crude production.
• From mid-February 2013 to mid-April 2013 Mogas 95 prices fell by around USD 26 per barrel (19 per cent) following falls in crude oil prices influenced by weak economic data from Europe and China, higher US crude stocks and weak global demand.
Monitoring of the Australian petroleum industry December 2013 97

• From mid-April 2013 to mid-July 2013 Mogas 95 prices increased by around USD 17 per barrel (15 per cent) influenced by increases in regional demand, tightening of regional supply and increases in crude oil prices due to geopolitical concerns over Syria.
• From mid-July 2013 to the beginning of August 2013 Mogas 95 prices decreased by around USD 11 per barrel (9 per cent) as regional demand fell amid an increase in gasoline stock levels.
July 2007 to September 2013
Chart 8.5 shows movements in monthly average Mogas 95 prices, in both nominal and real terms, for the period July 2007 to September 2013.
Chart 8.5 Monthly average Mogas 95 prices: July 2007 to September 2013 in nominal and real terms
USD
per bl
30
50
70
90
110
130
150
170
Sep–13Jul–13Apr–13Jan–13Oct–12Jul–12Apr–12Jan–12Oct–11Jul–11Apr–11Jan–11Oct–10Jul–10Apr–10Jan–10Oct–09Jul–09Apr–09Jan–09Oct–08Jul–08Apr–08Jan–08Oct–07Jul–07
Jul–
13
Apr
–13
Jan–
13
Oct
–12
Jul–
12
Apr
–12
Jan–
12
Oct
–11
Jul–
11
Apr
–11
Jan–
11
Oct
–10
Jul–
10
Apr
–10
Jan–
10
Oct
–09
Jul–
09
Apr
–09
Jan–
09
Oct
–08
Jul–
08
Apr
–08
Jan–
08
Oct
–07
Jul–
07
Sep–
13
Monthly average Mogas 95 prices (real)Monthly average Mogas 95 prices
Sources: ACCC calculations based on Platts and U.S. Department of Labor, Bureau of Labor Statistics, Consumer price index for all urban consumers, http://www.dlt.ri.gov/lmi/pdf/cpi.pdf, accessed 31 October 2013.
Note: The base year is 2012−13.
Monthly average Mogas 95 prices in nominal terms reached a record high in July 2008 at around USD 140 per barrel. As a result of the GFC, prices subsequently decreased sharply to around USD 40 per barrel in December 2008, a decrease of around USD 100 per barrel (over 70 per cent).
In real terms the record high was around USD 153 per barrel and the lowest level was USD 44 per barrel, a difference of USD 109 per barrel.
Prices steadily increased from early 2009 through to 2012. In May 2012 nominal prices reached around USD 137 per barrel.
Despite the volatility, monthly average Mogas 95 prices were persistently high throughout 2011−12. The annual average nominal Mogas 95 price was around USD 123 per barrel, the highest level on record. This volatility continued into 2012−13 (with the annual average Mogas 95 price at around USD 121 per barrel).
Refined petrol and crude oil prices
The price of crude oil is the major determinant of Mogas 95 prices. However, like the prices of most internationally traded commodities, the price of Mogas 95 is also determined by global and regional supply and demand conditions.
98 Monitoring of the Australian petroleum industry December 2013

Mogas 95 generally trades at a premium to Tapis crude oil. However, at times Mogas 95 may be cheaper than Tapis crude oil, when demand for refined petrol is relatively low compared with demand for crude oil. Conversely, the premium can be large when demand for refined petrol is relatively high compared with demand for crude oil. In 2012−2013 Mogas prices were always above Tapis crude oil prices.
Chart 8.6 shows the relationship between Mogas 95 prices and Tapis crude oil prices in the period July 2012 to September 2013.116 While Mogas 95 prices and Tapis crude oil prices generally moved in a similar fashion over the year, the differential between weekly average Mogas 95 prices and Tapis crude oil prices varied from a low of around minus USD 2 per barrel (in August 2013) to a high of around USD 14 per barrel (in August 2012). Between mid-August 2013 and the end of September 2013 Tapis crude oil prices were higher than Mogas 95 prices, due to weak demand for refined petrol.
Chart 8.6 Weekly average Mogas 95 and Tapis crude oil prices: July 2012 to September 2013
USD
per bl
100
105
110
115
120
125
130
135
140
Sep–13Aug–13Jul–13Jun–13May–13Apr–13Mar–13Feb–13Jan–13Dec–12Nov–12Oct–12Sep–12Aug–12Jul–12
Sep–
13
Aug
–13
Jul–
13
Jun–
13
May
–13
Apr
–13
Mar
–13
Feb–
13
Jan–
13
Dec
–12
Nov
–12
Oct
–12
Sep–
12
Aug
–12
Jul–
12
Tapis crude oilMogas 95
Source: ACCC calculations based on Platts data.
8.3.2 AUD–USDexchangerateThe AUD–USD exchange rate is an important influence on domestic retail petrol prices because the international benchmark prices of refined petrol are expressed in US dollars.
Chart 8.7 shows movements in the daily AUD–USD exchange rate between 1 July 2012 and 30 September 2013.
Between July 2012 and early-May 2013 the value of the Australian dollar fluctuated within a USD 0.05 range—from a high of around USD 1.06 in early August 2012 to a low of around USD 1.01 in early March 2013.
However, from early May 2013 the AUD–USD exchange rate fell sharply to a low of around USD 0.89 at the beginning of August 2013. This was a decrease of USD 0.17 (or 16 per cent) from the peak exchange rate in August 2012.
116 As noted in chapter 4, Australian refiner-wholesalers are increasingly using Brent crude oil as the appropriate international benchmark price.
Monitoring of the Australian petroleum industry December 2013 99

Since then, the AUD–USD exchange rate increased by around USD 0.06 to around USD 0.95 in mid-September 2013, before ending the month at around USD 0.93.
Chart 8.7 Daily AUD–USD exchange rates: 1 July 2012 to 30 September 2013
USD
0.88
0.90
0.92
0.94
0.96
0.98
1.00
1.02
1.04
1.06
1.08
30-Sep-1327-Sep-1326-Sep-1325-Sep-1324-Sep-1323-Sep-1320-Sep-1319-Sep-1318-Sep-1317-Sep-1316-Sep-1313-Sep-1312-Sep-1311-Sep-1310-Sep-139-Sep-136-Sep-135-Sep-134-Sep-133-Sep-132-Sep-1330-Aug-1329-Aug-1328-Aug-1327-Aug-1326-Aug-1323-Aug-1322-Aug-1321-Aug-1320-Aug-1319-Aug-1316-Aug-1315-Aug-1314-Aug-1313-Aug-1312-Aug-139-Aug-138-Aug-137-Aug-136-Aug-132-Aug-131-Aug-1331-Jul-1330-Jul-1329-Jul-1326-Jul-1325-Jul-1324-Jul-1323-Jul-1322-Jul-1319-Jul-1318-Jul-1317-Jul-1316-Jul-1315-Jul-1312-Jul-1311-Jul-1310-Jul-139-Jul-138-Jul-135-Jul-134-Jul-133-Jul-132-Jul-131-Jul-1328-Jun-1327-Jun-1326-Jun-1325-Jun-1324-Jun-1321-Jun-1320-Jun-1319-Jun-1318-Jun-1317-Jun-1314-Jun-1313-Jun-1312-Jun-1311-Jun-137-Jun-136-Jun-135-Jun-134-Jun-133-Jun-1331-May-1330-May-1329-May-1328-May-1327-May-1324-May-1323-May-1322-May-1321-May-1320-May-1317-May-1316-May-1315-May-1314-May-1313-May-1310-May-139-May-138-May-137-May-136-May-133-May-132-May-131-May-1330-Apr-1329-Apr-1326-Apr-1324-Apr-1323-Apr-1322-Apr-1319-Apr-1318-Apr-1317-Apr-1316-Apr-1315-Apr-1312-Apr-1311-Apr-1310-Apr-139-Apr-138-Apr-135-Apr-134-Apr-133-Apr-132-Apr-1328-Mar-1327-Mar-1326-Mar-1325-Mar-1322-Mar-1321-Mar-1320-Mar-1319-Mar-1318-Mar-1315-Mar-1314-Mar-1313-Mar-1312-Mar-1311-Mar-138-Mar-137-Mar-136-Mar-135-Mar-134-Mar-131-Mar-1328-Feb-1327-Feb-1326-Feb-1325-Feb-1322-Feb-1321-Feb-1320-Feb-1319-Feb-1318-Feb-1315-Feb-1314-Feb-1313-Feb-1312-Feb-1311-Feb-138-Feb-137-Feb-136-Feb-135-Feb-134-Feb-131-Feb-1331-Jan-1330-Jan-1329-Jan-1325-Jan-1324-Jan-1323-Jan-1322-Jan-1321-Jan-1318-Jan-1317-Jan-1316-Jan-1315-Jan-1314-Jan-1311-Jan-1310-Jan-139-Jan-138-Jan-137-Jan-134-Jan-133-Jan-132-Jan-1331-Dec-1228-Dec-1227-Dec-1224-Dec-1221-Dec-1220-Dec-1219-Dec-1218-Dec-1217-Dec-1214-Dec-1213-Dec-1212-Dec-1211-Dec-1210-Dec-127-Dec-126-Dec-125-Dec-124-Dec-123-Dec-1230-Nov-1229-Nov-1228-Nov-1227-Nov-1226-Nov-1223-Nov-1222-Nov-1221-Nov-1220-Nov-1219-Nov-1216-Nov-1215-Nov-1214-Nov-1213-Nov-1212-Nov-129-Nov-128-Nov-127-Nov-126-Nov-125-Nov-122-Nov-121-Nov-1231-Oct-1230-Oct-1229-Oct-1226-Oct-1225-Oct-1224-Oct-1223-Oct-1222-Oct-1219-Oct-1218-Oct-1217-Oct-1216-Oct-1215-Oct-1212-Oct-1211-Oct-1210-Oct-129-Oct-128-Oct-125-Oct-124-Oct-123-Oct-122-Oct-1228-Sep-1227-Sep-1226-Sep-1225-Sep-1224-Sep-1221-Sep-1220-Sep-1219-Sep-1218-Sep-1217-Sep-1214-Sep-1213-Sep-1212-Sep-1211-Sep-1210-Sep-127-Sep-126-Sep-125-Sep-124-Sep-123-Sep-1231-Aug-1230-Aug-1229-Aug-1228-Aug-1227-Aug-1224-Aug-1223-Aug-1222-Aug-1221-Aug-1220-Aug-1217-Aug-1216-Aug-1215-Aug-1214-Aug-1213-Aug-1210-Aug-129-Aug-128-Aug-127-Aug-123-Aug-122-Aug-121-Aug-1231-Jul-1230-Jul-1227-Jul-1226-Jul-1225-Jul-1224-Jul-1223-Jul-1220-Jul-1219-Jul-1218-Jul-1217-Jul-1216-Jul-1213-Jul-1212-Jul-1211-Jul-1210-Jul-129-Jul-126-Jul-125-Jul-124-Jul-123-Jul-122-Jul-12
Sep–
13
Aug
–13
Jul–
13
Jun–
13
May
–13
Apr
–13
Mar
–13
Feb–
13
Jan–
13
Dec
–12
Nov
–12
Oct
–12
Sep–
12
Aug
–12
Jul–
12
Source: RBA data.
Note: Exchange rates are the daily RBA 4.00 pm closing rates. See: http://www.rba.gov.au/statistics/frequency/exchangerates.html.
The average AUD–USD exchange rate in 2012−13 was USD 1.03, the same as in 2011−12. It averaged USD 0.94 over the five-year period 2008−09 to 2012−13.
Influence of the exchange rate—July 2012 to September 2013
Chart 8.8 shows actual seven-day rolling average retail prices in the five largest cities in the period 1 July 2012 to 30 September 2013 and retail prices if the exchange rate was held constant at the highest daily exchange rate in the period (i.e. around USD 1.06), everything else being equal (referred to as ‘calculated retail prices’).
100 Monitoring of the Australian petroleum industry December 2013

Chart 8.8 Seven-day rolling average retail petrol prices in the five largest cities with actual and constant AUD–USD exchange rates: 1 July 2012 to 30 September 2013
cpl
120
125
130
135
140
145
150
155
160
165
Sep–13Aug–13Jul–13Jun–13May–13Apr–13Mar–13Feb–13Jan–13Dec–12Nov–12Oct–12Sep–12Aug–12Jul–12
Sep–
13
Aug
–13
Jul–
13
Jun–
13
May
–13
Apr
–13
Mar
–13
Feb–
13
Jan–
13
Dec
–12
Nov
–12
Oct
–12
Sep–
12
Aug
–12
Jul–
12
Seven-day rolling average: AUD = USD 1.06Seven-day rolling average (actual)
Sources: ACCC calculations based on Informed Sources and RBA data.
Chart 8.8 shows that the difference between actual and calculated retail prices was broadly stable over the first 11 months of 2012−13. If the exchange rate was held constant at USD 1.06 over the period, calculated retail prices from July 2012 to May 2013 would have been on average 1.7 cpl lower than actual retail prices.
However, from early June 2013, following the significant decrease in the value of the Australian dollar from early May 2013, the difference between actual and calculated retail prices increased substantially. The decrease in the exchange rate meant that calculated retail prices in the September quarter 2013 would have been on average around 12 cpl lower than actual retail prices.
Influence of the exchange rate—July 2007 to September 2013
Over the period 1 July 2007 to 30 September 2013 the lowest daily AUD–USD exchange rate was around USD 0.61 on 28 October 2008 and the highest daily exchange rate was around USD 1.11 on 28 July 2011.
Chart 8.9 shows the importance of the AUD–USD exchange rate on (nominal) retail petrol prices in Australia over a longer period:
• the red line shows actual seven-day rolling average retail prices across the five largest cities from 1 July 2007 to 30 September 2013
• the upper line shows what retail prices would have been if the AUD–USD exchange rate was held constant at the lowest daily exchange rate over this period (i.e. around USD 0.61), everything else being equal
• the lower line shows what retail prices would have been if the AUD–USD exchange rate was held constant at the highest daily exchange rate over this period (i.e. around USD 1.11), everything else being equal.
Monitoring of the Australian petroleum industry December 2013 101

Chart 8.9 Seven-day rolling average retail petrol prices in the five largest cities—based on actual, minimum and maximum AUD–USD exchange rates over the period: 1 July 2007 to 30 September 2013
cpl
70
90
110
130
150
170
190
210
230
Sep–13Aug–13Jul–13Jun–13May–13Apr–13Mar–13Feb–13Jan–13Dec–12Nov–12Oct–12Sep–12Aug–12Jul–12Jun–12May–12Apr–12Mar–12Feb–12Jan–12Dec–11Nov–11Oct–11Sep–11Aug–11Jul–11Jun–11May–11Apr–11Mar–11Feb–11Jan–11Dec–10Nov–10Oct–10Sep–10Aug–10Jul–10Jun–10May–10Apr–10Mar–10Feb–10Jan–10Dec–09Nov–09Oct–09Sep–09Aug–09Jul–09Jun–09May–09Apr–09Mar–09Feb–09Jan–09Dec–08Nov–08Oct–08Sep–08Aug–08Jul–08Jun–08May–08Apr–08Mar–08Feb–08Jan–08Dec–07Nov–07Oct–07Sep–07Aug–07Jul–07
Sep–
13Ju
l–13
May
–13
Mar
–13
Jan–
13N
ov–1
2Se
p–12
Jul–
12M
ay–1
2M
ar–1
2Ja
n–12
Nov
–11
Sep–
11Ju
l–11
May
–11
Mar
–11
Jan–
11N
ov–1
0Se
p–10
Jul–
10M
ay–1
0M
ar–1
0Ja
n–10
Nov
–09
Sep–
09Ju
l–09
May
–09
Mar
–09
Jan–
09N
ov–0
8Se
p–08
Jul–
08M
ay–0
8M
ar–0
8Ja
n–08
Nov
–07
Sep–
07Ju
l–07
Price range bound by highest and lowest exchange ratesActual seven-day rolling average retail prices
Sources: ACCC calculations based on Informed Sources, Platts and RBA data.
The chart indicates that in 2012−13:
• Retail prices were at their highest at the end of February 2013 at around 151 cpl. The AUD–USD exchange rate was around USD 1.03 at this time. If the exchange rate had been at its six-year minimum level at this time (i.e. around USD 0.61), retail prices would have been around 213 cpl (or 62 cpl higher).
• Retail prices were at their lowest in early July 2012 at around 128 cpl. The AUD–USD exchange rate was around USD 1.02 at this time. If the exchange rate had been at its six-year maximum level at this time, retail prices would have been around 122 cpl (or 6 cpl lower).
In 2012−13, the annual average retail price in the five largest cities was around 141 cpl and the annual average AUD–USD exchange rate was around USD 1.03.
• If the exchange rate had instead been at the six-year minimum level (i.e. around USD 0.61) throughout 2012−2013, the annual average retail price would have been around 196 cpl (or 55 cpl higher).
• If the exchange rate had been at the six-year maximum level (i.e. USD 1.11) throughout 2012−2013, the annual average retail price would have been around 136 cpl (or 5 cpl lower).
This analysis shows how a strong Australian dollar generally protected consumers from the very high international petrol prices seen throughout 2012−13.
102 Monitoring of the Australian petroleum industry December 2013

8.3.3 RetailpetrolpricescomparedwithMogas95pricesChart 8.10 shows seven-day rolling average retail petrol prices in the five largest cities, and seven-day rolling average Mogas 95 prices (lagged by 10 days), over the period 1 July 2012 to 30 September 2013.117 For comparison purposes, it also shows retail prices with excise and GST removed (referred to as ‘adjusted retail prices’).
Chart 8.10 Seven-day rolling average retail petrol prices, adjusted retail prices and Mogas 95 prices: 1 July 2012 to 30 September 2013
cpl
50
70
90
110
130
150
170
Sep–13Aug–13Jul–13Jun–13May–13Apr–13Mar–13Feb–13Jan–13Dec–12Nov–12Oct–12Sep–12Aug–12Jul–12
Sep–
13
Aug
–13
Jul–
13
Jun–
13
May
–13
Apr
–13
Mar
–13
Feb–
13
Jan–
13
Dec
–12
Nov
–12
Oct
–12
Sep–
12
Aug
–12
Jul–
12
Adjusted retail petrol price (i.e. with excise and GST removed)—five largest cities, seven-day rolling averageMogas 95—seven working-day rolling average, lagged 10 days
Retail petrol price—five largest cities, seven-day rolling average
Source: ACCC calculations based on Informed Sources, Platts and RBA data.
The chart shows that in the period 1 July 2012 to 30 September 2013 retail prices in the five largest cities closely followed movements in Mogas 95 prices in AUD terms. This demonstrates that, in aggregate, changes in domestic retail prices are overwhelmingly driven by changes in the international price of refined petrol.
Chart 8.11 shows the daily differential between seven-day rolling average adjusted retail petrol prices in the five largest cities and seven-day rolling average Mogas 95 prices (lagged by 10 days) in Australian cents per litre over the period 1 July 2012 to 30 September 2013.
The differential between adjusted retail prices and international refined petrol prices is influenced by a range of other factors, including changes in the fuel quality premium, freight costs, wholesale and retail costs, and the level of local competition (including the state of price cycles).
117 For retail prices the seven-day rolling average is the average of calendar days, but for Mogas 95 it is the average of working days (i.e. Monday to Friday). The refiner-wholesalers use a rolling average for Mogas 95 prices when determining their wholesale prices. Mogas 95 prices are lagged by 10 days as there is generally around a one to two-week lag between changes in international prices and changes in retail prices in the five largest cities. This is because of the averaging formula used by refiners in Australia when setting their wholesale prices, and the lag between changes in wholesale prices and retail prices. The lag may be more pronounced during times of significant price volatility.
Monitoring of the Australian petroleum industry December 2013 103

Chart 8.11 Daily differential between seven-day rolling average adjusted retail petrol prices in the five largest cities and Mogas 95 prices: 1 July 2012 to 30 September 2013
cpl
11
12
13
14
15
16
17
18
19
20
21
22
Sep–13Aug–13Jul–13Jun–13May–13Apr–13Mar–13Feb–13Jan–13Dec–12Nov–12Oct–12Sep–12Aug–12Jul–12
Sep–
13
Aug
–13
Jul–
13
Jun–
13
May
–13
Apr
–13
Mar
–13
Feb–
13
Jan–
13
Dec
–12
Nov
–12
Oct
–12
Sep–
12
Aug
–12
Jul–
12
Average di�erential over the periodDaily di�erential between adjusted retail petrol prices and Mogas 95 prices
Sources: ACCC calculations based on Informed Sources, Platts and RBA data.
Between 1 July 2012 and 30 September 2013 the average daily differential between adjusted retail prices and Mogas 95 prices was 16.7 cpl.118 This is similar to the average in the period 1 July 2011 to 30 September 2012 (16.5 cpl).
Chart 8.11 shows that the differential between Australian retail prices and the price of Mogas 95 moves up and down rapidly as a result of the influence of price cycles. Over the medium term, the differential varies around the average for the period. Therefore, comparisons between domestic retail prices and international benchmark prices should not focus on the differential on a particular day but consider the trend of the differential over a longer period of time.
8.4 Components of retail petrol pricesThere are three broad components of the retail price of petrol: the international price of refined petrol, domestic taxes (excise and the GST), and other costs and margins at the wholesale and retail levels.
Chart 8.12 shows the components of the annual average retail petrol price across the five largest cities in 2012−13. The two largest components of the pump price—Mogas 95 and taxes (excise and the GST)—accounted for 89 per cent of the price of petrol. These components are largely outside the control of the local petrol retailers.
118 The average differential in 2012−13 was 16.6 cpl which is slightly higher than the ‘Other costs and margins’ component in the petrol bowser in chart 8.12 (16.1 cpl). This is because there are differences in the way these estimates have been calculated. Firstly, there is a 10-day lag in the Mogas 95 data in chart 8.11, whereas no lag is used in chart 8.12. Furthermore, seven-day rolling average prices are used in chart 8.11, whereas annual data is used in chart 8.12.
104 Monitoring of the Australian petroleum industry December 2013

Chart 8.12 Components of annual average retail petrol price in the five largest cities: 2012−13
Other costs and marginsTaxesMogas 95
PETROL141.3 cpl
cpl %
16.1 11
51.0 36
74.2 53
Source: ACCC calculations based on Informed Sources, Platts and RBA data.
The proportions of the annual average price in 2012−13 represented by each of Mogas 95, taxes and other costs and margins were broadly similar to those in 2011−12. In 2012−13 the cost of refined petrol (Mogas 95) represented 53 per cent of the annual average retail price of petrol (an increase of 1 percentage point from 2011−12).
Chart 8.13 shows a more detailed breakdown of the components of the annual average retail petrol prices across the five largest cities over the three year period 2010−11 to 2012−13. Each bar represents the annual average retail price disaggregated into the following:
• Tapis crude oil—the benchmark for crude oil in the Asia-Pacific region (including Australia)
• excise (which is set at a constant 38.14 cpl) and the GST
• gasoline crack—the difference between the prices of Mogas 95 and Tapis crude oil
• wholesale costs and margins (excluding excise and the GST)
• retail costs and margins (excluding the GST).
Monitoring of the Australian petroleum industry December 2013 105

Chart 8.13 Components of annual average retail petrol prices in the five largest cities: 2010−11 to 2012−13
0
20
40
60
80
100
120
140
160
2012–132011–122010–11
cpl
Wholesale costs and margins (excl excise and GST)
Excise and GST
Retail costs and margins (excl GST)
Gasoline crack
Tapis crude oil
avg. 131.7 cpl avg. 142.8 cpl avg. 141.3 cpl
Sources: ACCC calculations based on Informed Sources, Platts, RBA and WA FuelWatch data, and information provided by the monitored companies.
The chart shows that, over the last three years:
• the price of Tapis crude oil has been the largest component of the retail price of petrol
• wholesale and retail costs and margins (excluding GST) have remained broadly stable over the last three years.
8.5 Gross indicative retail differences for petrolGross indicative retail differences (GIRDs) are calculated by subtracting average terminal gate prices (TGPs) from average retail petrol prices.
TGPs are the prices at which petrol can be purchased from wholesalers in the spot market and are posted on a regular basis on the websites of the major wholesalers. Not all wholesale transactions are at TGPs—some will be at higher prices and some will be at lower prices, depending on the specific commercial arrangements. However, TGPs can be regarded as indicative wholesale prices. Furthermore, TGPs reflect the price of petrol only, and exclude other retail operating costs (such as branding, transportation, labour, etc.).
As a result, GIRDs should be treated only as a useful approximate benchmark for the difference between wholesale and retail prices. They should not be confused with actual retail profits.119
Table 8.1 shows annual GIRDs in the five largest cities, in both nominal and real terms, over the five-year period 2008−09 to 2012−13.
119 Chapter 12 presents data on retail profits derived from financial data provided by the monitored companies.
106 Monitoring of the Australian petroleum industry December 2013

Table 8.1 Annual average retail petrol prices, terminal gate prices and nominal and real gross indicative retail differences, five largest cities: 2008−09 to 2012−13
Average retail price
cpl
Average TGP cpl
Gross indicative retail difference (nominal)
cpl
Gross indicative retail difference (real)
cpl
2008−09 127.1 120.4 6.7 7.4
2009−10 124.2 117.2 7.0 7.6
2010−11 131.7 124.1 7.6 8.0
2011−12 142.8 135.1 7.7 7.9
2012−13 141.3 134.2 7.1 7.1
Sources: ACCC calculations based on Informed Sources, Australian Bureau of Statistics, 6401.0 Consumer Price Index, Australia, Table 1. CPI: All Groups, Index Numbers and Percentage Changes, http://www.abs.gov.au/AUSSTATS, accessed 31 October 2013, WA FuelWatch and information provided by the monitored companies.
Note: The base year is 2012−13.
Table 8.1 shows that GIRDs:
• decreased in 2012−13 by 0.6 cpl in nominal terms and by 0.8 cpl in real terms
• have been broadly stable over the last five years in real terms (moving within a 0.9 cpl range).
Appendix E provides monthly and annual data on GIRDs in each of the five largest cities.
8.6 Other grades of petrolThe retail prices of the different grades of unleaded petrol—RULP, PULP 95 and 98, and E10—tend to move in a similar manner.
Chart 8.14 shows monthly average retail prices for these four grades of petrol in the five largest cities from July 2012 to September 2013.120
120 E10 has only been available in Perth since March 2013.
Monitoring of the Australian petroleum industry December 2013 107

Chart 8.14 Monthly average retail prices of RULP, PULP 95, PULP 98 and E10 in the five largest cities: July 2012 to September 2013
cpl
125
130
135
140
145
150
155
160
165
170
175
Sep–13Aug–13Jul–13Jun–13May–13Apr–13Mar–13Feb–13Jan–13Dec–12Nov–12Oct–12Sep–12Aug–12Jul–12
Sep–
13
Aug
–13
Jul–
13
Jun–
13
May
–13
Apr
–13
Mar
–13
Feb–
13
Jan–
13
Dec
–12
Nov
–12
Oct
–12
Sep–
12
Aug
–12
Jul–
12
RULPE10 PULP 98PULP 95
Source: ACCC calculations based on Informed Sources data.
Retail prices of the different grades of petrol move in a similar manner because they are all set according to international refined petrol benchmark prices (which primarily move in line with changes in the price of crude oil). However, the price differentials between the various types of petrol vary over time. For example, retailers will generally set the price of PULP at a fixed premium to RULP. They will then adjust this premium from time to time reflecting changes in international benchmark differentials, local supply and demand factors, and other factors.
In 2012−13 across the five largest cities the average differential between:
• RULP and PULP 95 prices was 10.4 cpl. This was an increase of 0.2 cpl from the difference in 2011−12
• the average differential between RULP prices and PULP 98 in 2012−13 was 15.4 cpl, which was an increase of 0.6 cpl from the difference in 2011−12
• the average differential between RULP and E10 prices in 2012−13 was 2.7 cpl. This was an increase of 0.5 cpl from 2011−12.
For a discussion of the markets for E10 and PULP, including movements in average retail prices, see chapters 5 and 7, respectively.
8.7 Diesel and LPG prices
8.7.1 DieselandLPGpricescomparedwithpetrolpricesRetail prices of petrol, diesel and LPG generally move in line with their respective international benchmark prices, which are influenced by different supply and demand factors.
The appropriate international benchmark price for diesel is the price of Singapore Gasoil with 10 parts per million sulphur content (Gasoil 10 ppm). International demand for diesel is different to that for petrol, in part because of diesel’s off-road, industrial and electricity generation uses. However, both petrol and diesel are refined from crude oil and their prices will tend to follow broadly similar movements over the long term.
108 Monitoring of the Australian petroleum industry December 2013

The appropriate benchmarks for LPG are the Saudi Aramco Contract Prices for propane and butane (Saudi CP). These prices only change at the start of each month. International LPG prices only very loosely move in line with international refined petrol or diesel prices.
Chart 8.15 shows monthly average retail petrol, diesel and LPG prices in the five largest cities from July 2012 to September 2013.
Chart 8.15 Monthly average retail prices of petrol, diesel and LPG in the five largest cities: July 2012 to September 2013
cpl
50
60
70
80
90
100
110
120
130
140
150
160
170
Sep–13Aug–13Jul–13Jun–13May–13Apr–13Mar–13Feb–13Jan–13Dec–12Nov–12Oct–12Sep–12Aug–12Jul–12
Sep–
13
Aug
–13
Jul–
13
Jun–
13
May
–13
Apr
–13
Mar
–13
Feb–
13
Jan–
13
Dec
–12
Nov
–12
Oct
–12
Sep–
12
Aug
–12
Jul–
12
DieselPetrol LPG
Source: ACCC calculations based on Informed Sources data.
The chart shows that over 2012−13:
• petrol and diesel prices broadly moved in line with each other (generally following movements in the price of crude oil)
• diesel prices were always higher than petrol prices. This reflected relatively higher demand for diesel compared with petrol, particularly from China and India.
• LPG prices were significantly lower than petrol and diesel prices. – A major reason for this is that excise is imposed on petrol and diesel at a rate of 38.14 cpl, whereas excise on LPG in 2012−13 was imposed at a rate of 5.0 cpl.
8.7.2 Dieselprices
Retail diesel prices compared with Gasoil prices
Chart 8.16 shows seven-day rolling average retail diesel prices in the five largest cities and Gasoil 10 ppm prices over the period 1 July 2012 to 30 September 2013. Retail diesel prices broadly followed movements in Gasoil 10 ppm prices throughout the period.
Monitoring of the Australian petroleum industry December 2013 109

Chart 8.16 Seven-day rolling average retail diesel prices in the five largest cities and Gasoil 10 ppm prices: 1 July 2012 to 30 September 2013
cpl
120
125
130
135
140
145
150
155
160
xSep–13Aug–13Jul–13Jun–13May–13Apr–13Mar–13Feb–13Jan–13Dec–12Nov–12Oct–12Sep–12Aug–12Jul–12
cpl
cpl
60
65
70
75
80
85
90
95
100
Sep–13Aug–13Jul–13Jun–13May–13Apr–13Mar–13Feb–13Jan–13Dec–12Nov–12Oct–12Sep–12Aug–12Jul–12
Sep–
13
Aug
–13
Jul–
13
Jun–
13
May
–13
Apr
–13
Mar
–13
Feb–
13
Jan–
13
Dec
–12
Nov
–12
Oct
–12
Sep–
12
Aug
–12
Jul–
12
Gasoil 10 ppm (seven-day rolling average, lagged 11 days) (RHS)
Retail diesel price — five largest cities (seven-day rolling average) (LHS)
Sources: ACCC calculations based on Informed Sources, Platts and RBA data.
Components of diesel prices
Chart 8.17 shows the components of the annual average retail price of diesel across the five largest cities in 2012−13.
Chart 8.17 Components of annual average retail diesel price in the five largest cities: 2012−13
Other costs and marginsTaxesGasoil 10ppm
DIESEL147.4 cpl
cpl %
18.6 13
51.5 35
77.3 52
Sources: ACCC calculations based on Informed Sources, Platts and RBA data.
110 Monitoring of the Australian petroleum industry December 2013

The international price of refined diesel (Gasoil 10 ppm) accounted for more than half of the average price of diesel in 2012−13. The proportion of the average pump price represented by other costs and margins in 2012−13 (13 per cent) was 1 percentage point higher than in 2011−12.
8.7.3 LPGprices
Retail LPG prices compared with the Saudi CP benchmarks
Chart 8.18 shows seven-day rolling average retail LPG prices in the five largest cities and monthly Saudi CP benchmarks over the period 1 July 2012 to 30 September 2013. As the Saudi CP benchmarks only change at the start of each month, the relationship between movements in the international benchmark prices and retail prices for LPG is somewhat different from petrol and diesel.
Chart 8.18 Seven-day rolling average retail LPG prices in the five largest cities and monthly Saudi CP benchmarks: 1 July 2012 to 30 September 2013
cpl
30
40
50
60
70
80
90
Sep–13Aug–13Jul–13Jun–13May–13Apr–13Mar–13Feb–13Jan–13Dec–12Nov–12Oct–12Sep–12Aug–12Jul–12
Sep–
13
Aug
–13
Jul–
13
Jun–
13
May
–13
Apr
–13
Mar
–13
Feb–
13
Jan–
13
Dec
–12
Nov
–12
Oct
–12
Sep–
12
Aug
–12
Jul–
12
Saudi Contract Price benchmarksRetail LPG price — five largest cities (seven-day rolling average)
Sources: ACCC calculations based on Informed Sources, RBA and Gas Energy Australia data.
The chart shows that LPG retail prices broadly tracked movements in the international benchmark prices over the period.
The Saudi CP benchmarks increased steadily in the second half of 2012 to around 54 cpl, following higher crude oil prices and a tightening of propane and butane supplies. Benchmark prices then steadily fell from December 2012 to May 2013 to a low of around 40 cpl, influenced by ample supply and weak spot demand in Asia and Europe. Since May 2013 Saudi CP benchmarks increased steadily to around 52 cpl, influenced by an increase in crude oil prices and demand for propane. A further factor influencing retail LPG prices was the increase in the LPG excise by 2.5 cpl to 7.5 cpl from 1 July 2013.
Components of LPG prices
Chart 8.19 shows the components of the annual average retail price of LPG across the five largest cities in 2012−13.
Monitoring of the Australian petroleum industry December 2013 111

Chart 8.19 Components of annual average retail LPG price in the five largest cities: 2012−13
Other costs and marginsTaxesSaudi CP
LPG70.7 cpl
cpl %
13.5 19
11.4 16
45.8 65
Sources: ACCC calculations based on Informed Sources, Gas Energy Australia and RBA data.
Almost two-thirds of the average price of LPG in 2012−13 was accounted for by the Saudi CP benchmarks. The proportion of the price accounted for by other costs and margins in 2012−13 (19 per cent) was 2 percentage points lower than in 2011−12 (21 per cent).
Other costs and margins make up a relatively larger proportion of the retail price for LPG compared with those for petrol and diesel, because of higher transportation and storage costs for LPG, and the low rate of excise.
8.8 Australian prices compared with other countriesThe Bureau of Resources and Energy Economics (BREE) publishes a ranking of Australia’s petrol, diesel and LPG retail prices relative to prices of other countries in the Organisation for Economic Cooperation and Development (OECD).
Chart 8.20 shows the retail price of petrol—both including and excluding taxes—among countries in the OECD in the June quarter 2013.121 It shows that Australia had the fourth lowest retail petrol prices in the OECD.
The main determinant of lower retail petrol prices in Australia is the relatively low rate of taxation on fuel. In the June quarter 2013 tax represented around 36 per cent of the retail price of petrol in Australia, compared with an OECD average of around 49 per cent. Tax as a percentage of the retail petrol price in OECD countries ranged from a high of around 59 per cent in the UK, Norway and the Netherlands to a low of around 14 per cent in the US and Mexico. When retail prices are assessed without the tax component, Australia ranks around the average of OECD countries (the red line in the chart).
121 Care must be taken when making international comparisons of fuel prices because fuel quality standards (including octane rating and the components of fuel) can differ between countries.
112 Monitoring of the Australian petroleum industry December 2013

Chart 8.20 Petrol prices and taxes in OECD countries: Australian cents per litre, June quarter 2013
0 25 50 75 100 125 150 175 200 225 250 275
Mexico
United States
Canada
Australia
Japan
Poland
New Zealand
Luxembourg
Korea
Austria
Czech Republic
Spain
Hungary
Switzerland
Slovak Republic
France
United Kingdom
Germany
Ireland
Portugal
Finland
Belgium
Sweden
Denmark
Greece
Netherlands
Italy
Norway
Turkey
cplTax component Average price less taxPrice less tax
Source: BREE, Australian Petroleum Statistics, issue 205, August 2013.
The retail prices of diesel and LPG in Australia also compare favourably with other OECD countries. Charts 8.21 and 8.22 respectively show that, in the June quarter 2013, Australian retail diesel prices were the sixth lowest in the OECD and LPG prices were the lowest in the OECD.
Monitoring of the Australian petroleum industry December 2013 113

Chart 8.21 Diesel prices and taxes in OECD countries: Australian cents per litre, June quarter 2013
0 25 50 75 100 125 150 175 200 225 250 275
Mexico
United States
New Zealand
Canada
Japan
Australia
Korea
Luxembourg
France
Spain
Austria
Poland
Czech Republic
Germany
Greece
Hungary
Portugal
Slovak Republic
Netherlands
Denmark
Finland
Belgium
Ireland
Switzerland
United Kingdom
Italy
Sweden
Norway
Turkey
cplTax componentPrice less tax Average price less tax
Source: BREE, Australian Petroleum Statistics, issue 205, August 2013.
114 Monitoring of the Australian petroleum industry December 2013

Chart 8.22 LPG prices and taxes in OECD countries: Australian cents per litre, June quarter 2013
0 25 50 75 100 125 150 175 200
Australia
Poland
Slovak Republic
Luxembourg
Czech Republic
Germany
Spain
Belgium
Netherlands
Portugal
Hungary
Italy
France
Turkey
cplTax componentPrice less tax Average price less tax
Source: BREE, Australian Petroleum Statistics, issue 205, August 2013.
Monitoring of the Australian petroleum industry December 2013 115

116 Monitoring of the Australian petroleum industry December 2013

9 Retail prices in regional locations
Key points• Retail petrol prices in regional locations in Australia are typically higher than those in the
capital cities, although they generally tend to follow the same overall price movements. – 97 per cent of regional locations monitored by the ACCC in 2012−13 had annual average retail petrol prices higher than the prices in their respective capital cities.
• Movements in retail petrol prices in regional locations are largely driven by changes in international refined petrol prices and the AUD–USD exchange rate, just as they are in the five largest cities.
• However, the extent to which petrol prices in each regional location are influenced by changes in these factors varies between locations, depending on the specific characteristics of each regional location.
• Petrol prices in regional locations are generally higher than in the five largest cities for a number of reasons, including:
– lower number of retail sites and therefore a lower level of local competition – lower volumes of fuel sold – distance/location factors – lower convenience store sales.
• These factors also explain differences in petrol prices between regional locations.
• Movements in petrol prices in regional locations—both up and down—tend to lag those in the five largest cities.
9.1 IntroductionThis chapter examines retail petrol prices in regional locations in Australia and the city–country price differential.122 The ACCC currently monitors fuel prices in all capital cities and around 180 regional locations.123
Retail petrol prices in regional locations in Australia are typically higher than those in the capital cities, although they generally tend to follow the same overall price movements. In 2012−13, of the 167 regional locations for which petrol price data was reliably available, 162 regional locations (97 per cent) had higher average annual petrol prices than their respective capital city.124
Furthermore, in many regional locations there is a lag between movements in capital city prices and local prices. This lag arises because the turnover of petrol stocks is generally lower in the country than in the capital cities due to lower volume of sales in regional areas. As a result, price changes in the five largest cities take some time to be passed on to regional locations. This lag occurs both when prices are increasing and when they are decreasing.
122 All references to petrol in this chapter are to regular unleaded petrol (RULP). All prices in this chapter are in nominal terms.
The city-country price differential for each state and the Northern Territory is the difference between the arithmetic average of prices in each regional location in the state and Northern Territory and the average capital city price.
123 The specific regional locations in each state and the Northern Territory which are monitored by the ACCC are listed in appendix F, which also provides average annual retail prices for petrol, diesel, automotive LPG and E10 in 2012−13 for all capital cities and regional locations.
124 To be considered reliable the price data for a regional location had to meet a number of quality thresholds. In general, there had to be a price observation on at least 75 per cent of days over the year, with no break in price data of more than 30 consecutive days.
Monitoring of the Australian petroleum industry December 2013 117

9.2 Influences on prices in regional locationsMovements in retail petrol prices in regional locations are largely driven by changes in international refined petrol prices and the AUD–USD exchange rate, just as they are in the five largest cities. However, prices are generally higher in regional locations. A number of factors contribute to these higher prices and they are outlined below. The influence of these factors varies significantly from location to location. This means that there may be substantial differences in prices between specific regional locations.
9.2.1 Lowernumberofretailsitesandthereforealowerleveloflocalcompetition
In general, the degree of competition in a market will be greater if there are a large number of sellers. Therefore, everything else being equal, the higher the number of retail sites in a location, the greater the level of competition.
Smaller populations in regional locations generally have fewer vehicles, and therefore less retail sites, compared with the larger cities. Often this results in less competition in regional locations. In small country towns with a small number of retail sites there may be little incentive to reduce prices. This is because competitors will also quickly reduce their prices and the net result is the same volume of petrol sold at each retail site but with a lower margin.
9.2.2 LowervolumesoffuelsoldThe volume of fuel sold at any particular retail site can significantly influence the price. Generally, the greater the volume of fuel sold the lower the price.
Certain costs of running a retail site (such as rent and maintenance) may be fixed irrespective of the volume of fuel sold. However, retail sites in regional locations generally sell lower volumes of fuel than retail sites in larger cities because they have comparatively fewer customers. Retail sites with higher volume sales can spread their fixed costs over this greater volume, which reduces the unit cost of supplying their fuel compared with retail sites with lower volumes of sales.
9.2.3 Distance/locationfactorsIt generally costs more to deliver fuel to regional locations than it does to the largest capital cities. In regional locations, fuel needs to be moved further from the fuel terminals, leading to higher freight costs. Additional storage costs may also be necessary if the fuel is stored in a local storage facility before being supplied to retail sites.
Regional locations which are situated along a major highway may have lower prices due to increased competition. This is because they may sell higher volumes due to the passing traffic on the highway, and may also have lower delivery and storage costs.
9.2.4 LowerconveniencestoresalesThe margin on convenience store sales is usually significantly higher than on fuel sales. In the five largest cities convenience store sales generally make a greater contribution to the overall returns of a retail site than they do in regional locations. These retail sites can remain profitable on much lower margins on fuel sales. As a result, upward pressure is put on retail petrol prices in retail sites with lower convenience store sales, such as in regional locations.
9.2.5 LagsinpricemovementsinregionallocationsPrice movements in regional locations generally lag behind movements in the five largest cities. This is due in part to a lower volume of sales in these locations, and hence slower replenishment of fuel stocks by wholesalers and retailers. Consequently, prices in regional locations often take more time to reflect changes in international prices than those in the five largest cities. Furthermore, retail
118 Monitoring of the Australian petroleum industry December 2013

prices in some regional locations are “sticky”, i.e. they are less responsive—both up and down—to movements in international prices.
Chart 9.1 shows monthly average petrol prices in the five largest cities, regional locations in aggregate, and the monthly average price of Mogas 95 in Australian cents per litre (cpl) in the period July 2012 to September 2013.
Chart 9.1 Monthly average retail petrol prices in the five largest cities and regional locations in aggregate, and Mogas 95 prices in Australian cents per litre: July 2012 to September 2013
cpl
125
130
135
140
145
150
155
160
Sep–13Aug–13Jul–13Jun–13May–13Apr–13Mar–13Feb–13Jan–13Dec–12Nov–12Oct–12Sep–12Aug–12Jul–12
cpl
cpl
65
70
75
80
85
90
95
100
Sep–13Aug–13Jul–13Jun–13May–13Apr–13Mar–13Feb–13Jan–13Dec–12Nov–12Oct–12Sep–12Aug–12Jul–12
Sep–
13
Aug
–13
Jul–
13
Jun–
13
May
–13
Apr
–13
Mar
–13
Feb–
13
Jan–
13
Dec
–12
Nov
–12
Oct
–12
Sep–
12
Aug
–12
Jul–
12
Regional locations (LHS) Mogas 95 (RHS)Five largest cities (LHS)
Sources: ACCC calculations based on Informed Sources, Platts and RBA data.
Note: Retail prices are shown on the left hand side of the chart and Mogas 95 prices are shown on the right hand side of the chart (with different starting and ending values). This is done to show clearly the relative movements in the price series.
One example of the lag and sticky prices is the period August 2012 to January 2013:
• monthly average Mogas 95 prices peaked in August 2012 and subsequently decreased by 5.2 cents per litre (cpl) over the next four months
• average prices across regional locations peaked in October 2012 and decreased by only 2.6 cpl over a three-month period.
Another example is the period December 2012 to March 2013:
• monthly average Mogas 95 prices troughed in December 2012 and increased by 9.7 cpl over two months
• average prices across regional locations troughed one month later (in January 2013) and peaked in March 2013—the increase in prices was only 5.6 cpl.
Monitoring of the Australian petroleum industry December 2013 119
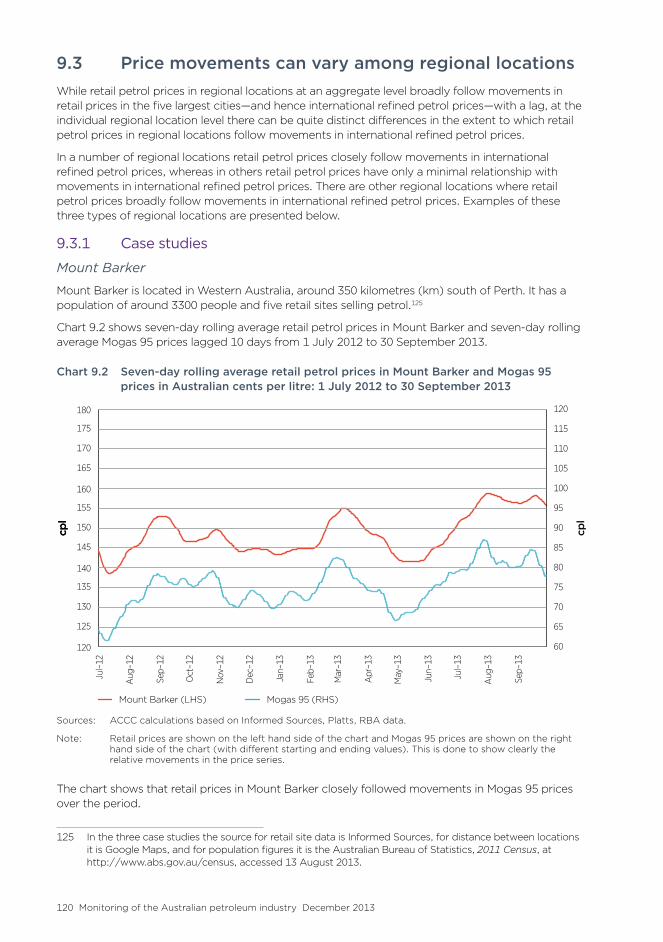
9.3 Price movements can vary among regional locationsWhile retail petrol prices in regional locations at an aggregate level broadly follow movements in retail prices in the five largest cities—and hence international refined petrol prices—with a lag, at the individual regional location level there can be quite distinct differences in the extent to which retail petrol prices in regional locations follow movements in international refined petrol prices.
In a number of regional locations retail petrol prices closely follow movements in international refined petrol prices, whereas in others retail petrol prices have only a minimal relationship with movements in international refined petrol prices. There are other regional locations where retail petrol prices broadly follow movements in international refined petrol prices. Examples of these three types of regional locations are presented below.
9.3.1 Casestudies
Mount Barker
Mount Barker is located in Western Australia, around 350 kilometres (km) south of Perth. It has a population of around 3300 people and five retail sites selling petrol.125
Chart 9.2 shows seven-day rolling average retail petrol prices in Mount Barker and seven-day rolling average Mogas 95 prices lagged 10 days from 1 July 2012 to 30 September 2013.
Chart 9.2 Seven-day rolling average retail petrol prices in Mount Barker and Mogas 95 prices in Australian cents per litre: 1 July 2012 to 30 September 2013
cpl
120
125
130
135
140
145
150
155
160
165
170
175
180
xSep–13Aug–13Jul–13Jun–13May–13Apr–13Mar–13Feb–13Jan–13Dec–12Nov–12Oct–12Sep–12Aug–12Jul–12
cpl
cpl
60
65
70
75
80
85
90
95
100
105
110
115
120
Sep–13Aug–13Jul–13Jun–13May–13Apr–13Mar–13Feb–13Jan–13Dec–12Nov–12Oct–12Sep–12Aug–12Jul–12
Sep–
13
Aug
–13
Jul–
13
Jun–
13
May
–13
Apr
–13
Mar
–13
Feb–
13
Jan–
13
Dec
–12
Nov
–12
Oct
–12
Sep–
12
Aug
–12
Jul–
12
Mogas 95 (RHS)Mount Barker (LHS)
Sources: ACCC calculations based on Informed Sources, Platts, RBA data.
Note: Retail prices are shown on the left hand side of the chart and Mogas 95 prices are shown on the right hand side of the chart (with different starting and ending values). This is done to show clearly the relative movements in the price series.
The chart shows that retail prices in Mount Barker closely followed movements in Mogas 95 prices over the period.
125 In the three case studies the source for retail site data is Informed Sources, for distance between locations it is Google Maps, and for population figures it is the Australian Bureau of Statistics, 2011 Census, at http://www.abs.gov.au/census, accessed 13 August 2013.
120 Monitoring of the Australian petroleum industry December 2013

Katherine
Katherine is located on the Katherine River in the Northern Territory, around 320 km south-east of Darwin. It has a population of around 7600 people and seven retail sites selling petrol.
Chart 9.3 shows seven-day rolling average retail petrol prices in Katherine and seven-day rolling average Mogas 95 prices lagged 10 days from 1 July 2012 to 30 September 2013.
Chart 9.3 Seven-day rolling average retail petrol prices in Katherine and Mogas 95 prices in Australian cents per litre: 1 July 2012 to 30 September 2013
cpl
120
125
130
135
140
145
150
155
160
165
170
175
180
xSep–13Aug–13Jul–13Jun–13May–13Apr–13Mar–13Feb–13Jan–13Dec–12Nov–12Oct–12Sep–12Aug–12Jul–12
cpl
cpl
60
65
70
75
80
85
90
95
100
105
110
115
120
Sep–13Aug–13Jul–13Jun–13May–13Apr–13Mar–13Feb–13Jan–13Dec–12Nov–12Oct–12Sep–12Aug–12Jul–12
Sep–
13
Aug
–13
Jul–
13
Jun–
13
May
–13
Apr
–13
Mar
–13
Feb–
13
Jan–
13
Dec
–12
Nov
–12
Oct
–12
Sep–
12
Aug
–12
Jul–
12
Mogas 95 (RHS)Katherine (LHS)
Sources: ACCC calculations based on Informed Sources, Platts, RBA data.
Note: Retail prices are shown on the left hand side of the chart and Mogas 95 prices are shown on the right hand side of the chart (with different starting and ending values). This is done to show clearly the relative movements in the price series.
Retail petrol prices in Katherine remained largely unchanged between July 2012 and February 2013, despite substantial movements in Mogas 95 prices during that period. Prices in Katherine increased by around 3.0 cpl in early-March 2013 and subsequently remained around that price to the end of June 2013.
The chart shows that between July 2012 and September 2013 retail prices in Katherine had only a minimal relationship with movements in international refined petrol prices.
Portland
Portland is located in Victoria, around 360 km west of Melbourne. It has a population of around 12 700 people and five retail sites selling petrol.
Chart 9.4 shows seven-day rolling average retail petrol prices in Portland and seven-day rolling average Mogas 95 prices lagged 10 days from 1 July 2012 to 30 September 2013.
Monitoring of the Australian petroleum industry December 2013 121
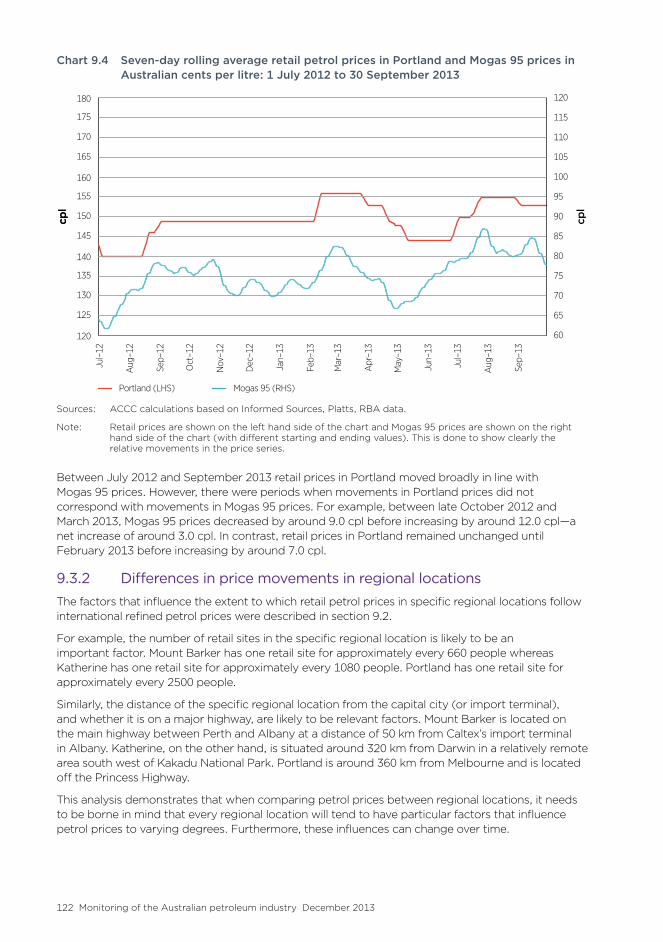
Chart 9.4 Seven-day rolling average retail petrol prices in Portland and Mogas 95 prices in Australian cents per litre: 1 July 2012 to 30 September 2013
cpl
120
125
130
135
140
145
150
155
160
165
170
175
180
xSep–13Aug–13Jul–13Jun–13May–13Apr–13Mar–13Feb–13Jan–13Dec–12Nov–12Oct–12Sep–12Aug–12Jul–12
cpl
cpl
60
65
70
75
80
85
90
95
100
105
110
115
120
Sep–13Aug–13Jul–13Jun–13May–13Apr–13Mar–13Feb–13Jan–13Dec–12Nov–12Oct–12Sep–12Aug–12Jul–12
Sep–
13
Aug
–13
Jul–
13
Jun–
13
May
–13
Apr
–13
Mar
–13
Feb–
13
Jan–
13
Dec
–12
Nov
–12
Oct
–12
Sep–
12
Aug
–12
Jul–
12
Mogas 95 (RHS)Portland (LHS)
Sources: ACCC calculations based on Informed Sources, Platts, RBA data.
Note: Retail prices are shown on the left hand side of the chart and Mogas 95 prices are shown on the right hand side of the chart (with different starting and ending values). This is done to show clearly the relative movements in the price series.
Between July 2012 and September 2013 retail prices in Portland moved broadly in line with Mogas 95 prices. However, there were periods when movements in Portland prices did not correspond with movements in Mogas 95 prices. For example, between late October 2012 and March 2013, Mogas 95 prices decreased by around 9.0 cpl before increasing by around 12.0 cpl—a net increase of around 3.0 cpl. In contrast, retail prices in Portland remained unchanged until February 2013 before increasing by around 7.0 cpl.
9.3.2 DifferencesinpricemovementsinregionallocationsThe factors that influence the extent to which retail petrol prices in specific regional locations follow international refined petrol prices were described in section 9.2.
For example, the number of retail sites in the specific regional location is likely to be an important factor. Mount Barker has one retail site for approximately every 660 people whereas Katherine has one retail site for approximately every 1080 people. Portland has one retail site for approximately every 2500 people.
Similarly, the distance of the specific regional location from the capital city (or import terminal), and whether it is on a major highway, are likely to be relevant factors. Mount Barker is located on the main highway between Perth and Albany at a distance of 50 km from Caltex’s import terminal in Albany. Katherine, on the other hand, is situated around 320 km from Darwin in a relatively remote area south west of Kakadu National Park. Portland is around 360 km from Melbourne and is located off the Princess Highway.
This analysis demonstrates that when comparing petrol prices between regional locations, it needs to be borne in mind that every regional location will tend to have particular factors that influence petrol prices to varying degrees. Furthermore, these influences can change over time.
122 Monitoring of the Australian petroleum industry December 2013

9.4 Petrol prices in regional locations
9.4.1 PricesinaggregateChart 9.5 shows daily average retail prices across all the monitored regional locations in Australia in aggregate and daily average retail prices in the five largest cities (i.e. Sydney, Melbourne, Brisbane Adelaide and Perth) from 1 July 2012 to 30 September 2013. It can be seen that:
• prices in the regional locations in aggregate broadly follow prices in the five largest cities
• regional locations in aggregate do not have the regular retail price cycles that are evident in the five largest cities
• prices in the regional locations in aggregate were generally higher than those in the five largest cities.
Chart 9.5 Daily average petrol prices in the five largest cities and the regional locations in aggregate: 1 July 2012 to 30 September 2013
cpl
120
125
130
135
140
145
150
155
160
165
170
175
180
Sep–13Aug–13Jul–13Jun–13May–13Apr–13Mar–13Feb–13Jan–13Dec–12Nov–12Oct–12Sep–12Aug–12Jul–12
Sep–
13
Aug
–13
Jul–
13
Jun–
13
May
–13
Apr
–13
Mar
–13
Feb–
13
Jan–
13
Dec
–12
Nov
–12
Oct
–12
Sep–
12
Aug
–12
Jul–
12
Regional locationsFive largest cities
Source: ACCC calculations based on Informed Sources data.
9.4.2 PricesineachofthestatesandtheNorthernTerritoryCharts 9.6 to 9.12 show daily average retail petrol prices for the monitored regional locations in aggregate in each state and the Northern Territory, along with the relevant capital city prices, from 1 July 2012 to 30 September 2013.126
The charts show that:
• Apart from the fluctuations associated with regular price cycles in the larger capital cities, prices in regional locations on average have generally followed movements in prices in their respective capital cities.
• In states with capital cities that have regular price cycles, the city-country price differential varies significantly on a daily basis.
126 Note that there are no prices available for locations in the Australian Capital Territory other than Canberra.
Monitoring of the Australian petroleum industry December 2013 123

• There were times when the city-country price differentials were larger than usual. These are particularly evident when there are periods of discounting in the capital cities.
– For example, in Sydney in April 2013 (chart 9.6); the average city-country price differential in April 2013 in New South Wales was 13.8 cpl, compared with an average differential of 8.3 cpl for the remaining 11 months of 2012−13.
• Prices in regional locations in Western Australia, where many locations are a long way from a refinery and import terminals, are significantly higher than those in Perth. Conversely, in Tasmania, where distances from terminals are smaller, prices in regional locations are relatively close to those in Hobart.
Chart 9.6 Daily average petrol prices in Sydney and New South Wales regional locations: 1 July 2012 to 30 September 2013
cpl
120
125
130
135
140
145
150
155
160
165
170
175
180
Sep–13Aug–13Jul–13Jun–13May–13Apr–13Mar–13Feb–13Jan–13Dec–12Nov–12Oct–12Sep–12Aug–12Jul–12
Sep–
13
Aug
–13
Jul–
13
Jun–
13
May
–13
Apr
–13
Mar
–13
Feb–
13
Jan–
13
Dec
–12
Nov
–12
Oct
–12
Sep–
12
Aug
–12
Jul–
12
NSW regional locationsSydney
Source: ACCC calculations based on Informed Sources data.
124 Monitoring of the Australian petroleum industry December 2013

Chart 9.7 Daily average petrol prices in Melbourne and Victorian regional locations: 1 July 2012 to 30 September 2013
cpl
120
125
130
135
140
145
150
155
160
165
170
175
180
Sep–13Aug–13Jul–13Jun–13May–13Apr–13Mar–13Feb–13Jan–13Dec–12Nov–12Oct–12Sep–12Aug–12Jul–12
Sep–
13
Aug
–13
Jul–
13
Jun–
13
May
–13
Apr
–13
Mar
–13
Feb–
13
Jan–
13
Dec
–12
Nov
–12
Oct
–12
Sep–
12
Aug
–12
Jul–
12
Vic. regional locationsMelbourne
Source: ACCC calculations based on Informed Sources data.
Chart 9.8 Daily average petrol prices in Brisbane and Queensland regional locations: 1 July 2012 to 30 September 2013
cpl
120
125
130
135
140
145
150
155
160
165
170
175
180
Sep–13Aug–13Jul–13Jun–13May–13Apr–13Mar–13Feb–13Jan–13Dec–12Nov–12Oct–12Sep–12Aug–12Jul–12
Sep–
13
Aug
–13
Jul–
13
Jun–
13
May
–13
Apr
–13
Mar
–13
Feb–
13
Jan–
13
Dec
–12
Nov
–12
Oct
–12
Sep–
12
Aug
–12
Jul–
12
Qld regional locationsBrisbane
Source: ACCC calculations based on Informed Sources data.
Monitoring of the Australian petroleum industry December 2013 125

Chart 9.9 Daily average petrol prices in Adelaide and South Australian regional locations: 1 July 2012 to 30 September 2013
cpl
120
125
130
135
140
145
150
155
160
165
170
175
180
Sep–13Aug–13Jul–13Jun–13May–13Apr–13Mar–13Feb–13Jan–13Dec–12Nov–12Oct–12Sep–12Aug–12Jul–12
Sep–
13
Aug
–13
Jul–
13
Jun–
13
May
–13
Apr
–13
Mar
–13
Feb–
13
Jan–
13
Dec
–12
Nov
–12
Oct
–12
Sep–
12
Aug
–12
Jul–
12
SA regional locationsAdelaide
Source: ACCC calculations based on Informed Sources data.
Chart 9.10 Daily average petrol prices in Perth and Western Australian regional locations: 1 July 2012 to 30 September 2013
cpl
120
125
130
135
140
145
150
155
160
165
170
175
180
Sep–13Aug–13Jul–13Jun–13May–13Apr–13Mar–13Feb–13Jan–13Dec–12Nov–12Oct–12Sep–12Aug–12Jul–12
Sep–
13
Aug
–13
Jul–
13
Jun–
13
May
–13
Apr
–13
Mar
–13
Feb–
13
Jan–
13
Dec
–12
Nov
–12
Oct
–12
Sep–
12
Aug
–12
Jul–
12
WA regional locationsPerth
Source: ACCC calculations based on Informed Sources data.
126 Monitoring of the Australian petroleum industry December 2013

Chart 9.11 Daily average petrol prices in Hobart and Tasmanian regional locations: 1 July 2012 to 30 September 2013
cpl
120
125
130
135
140
145
150
155
160
165
170
175
180
Sep–13Aug–13Jul–13Jun–13May–13Apr–13Mar–13Feb–13Jan–13Dec–12Nov–12Oct–12Sep–12Aug–12Jul–12
Sep–
13
Aug
–13
Jul–
13
Jun–
13
May
–13
Apr
–13
Mar
–13
Feb–
13
Jan–
13
Dec
–12
Nov
–12
Oct
–12
Sep–
12
Aug
–12
Jul–
12
Tas. regional locationsHobart
Source: ACCC calculations based on Informed Sources data.
Chart 9.12 Daily average petrol prices in Darwin and Northern Territory regional locations: 1 July 2012 to 30 September 2013
cpl
120
125
130
135
140
145
150
155
160
165
170
175
180
Sep–13Aug–13Jul–13Jun–13May–13Apr–13Mar–13Feb–13Jan–13Dec–12Nov–12Oct–12Sep–12Aug–12Jul–12
Sep–
13
Aug
–13
Jul–
13
Jun–
13
May
–13
Apr
–13
Mar
–13
Feb–
13
Jan–
13
Dec
–12
Nov
–12
Oct
–12
Sep–
12
Aug
–12
Jul–
12
NT regional locationsDarwin
Source: ACCC calculations based on Informed Sources data.
Monitoring of the Australian petroleum industry December 2013 127

9.4.3 PricedifferentialsovertimeThe city–country price differential varies between states and over time. Table 9.1 provides data on nominal annual average price differentials between the capital city and regional locations for each state and the Northern Territory. It also shows two aggregate indicators of the city–country price differential: five-city and eight-city.127
Table 9.1 Annual average petrol price differentials between the capital city and the monitored regional locations in each state and the Northern Territory: 2011−12, 2012−13 and the 10-year average
State/Territory 2011−12cpl
2012−13cpl
10-year avg.cpl
NSW 6.1 8.7 5.3
Vic. 4.1 6.3 3.9
Qld 2.6 5.8 3.5
SA 5.2 7.2 4.7
WA 9.4 12.3 12.2
Tas. 0.6 1.1 0.4
NT 6.4 4.0 6.2
Aggregate indicators
5-city 5.5 8.3 5.7
8-city 2.7 3.6 3.0
Source: ACCC calculations based on Informed Sources data.
2012−13 compared with 2011−12
Table 9.1 shows that in 2012−13, compared with 2011−12:
• the city-country price differential increased in all states—with the magnitude of the increase ranging from 3.2 cpl in Queensland to 0.5 cpl in Tasmania
• there was a decrease in the city–country price differential in the Northern Territory of 2.4 cpl
• the five-city price differential increased by 2.8 cpl and the eight-city price differential increased by 0.9 cpl.
2012−13 compared with the 10-year average
Table 9.1 shows that in 2012−13, compared with the 10-year average:
• the city-country price differential was higher in all states and lower in the Northern Territory
• the five-city and the eight-city price differentials were higher.
127 The five-city city-country price differential is the difference between the arithmetic average of prices in the monitored regional locations in the six states and the Northern Territory and the arithmetic average price in the five largest cities (Sydney, Melbourne, Brisbane, Adelaide and Perth).
The eight-city city-country price differential is the difference between the arithmetic average of prices in the monitored regional locations in the six states and the Northern Territory and the arithmetic average price in the eight capital cities (the five largest cities plus Canberra, Hobart and Darwin).
128 Monitoring of the Australian petroleum industry December 2013

10 Retail pricing analysis
Key points• In 2013 petrol price cycles in the four eastern mainland capital cities—Sydney, Melbourne,
Brisbane and Adelaide—were characterised by considerable variability: – the day of the week on which price cycles peaked and troughed changed frequently – the duration of price cycles increased—by the September quarter 2013 they ranged between 13 and 19 days on average.
• Perth was the exception to this pattern: – it had stable price cycles, with each price cycle lasting seven days – the day of the week on which price cycles peaked and troughed was unchanged.
• Wednesday was always the cheapest day of the price cycle in Perth, and Thursday the most expensive. In the other major cities there was no particular cheap or expensive day of the week.
• In recent years consumers have taken advantage of the relatively cheaper days in the price cycle to a lesser extent than they did in previous years (when price cycles were regularly of seven days duration).
• As in previous years, price cycle increases before public holidays in 2012−13 were on average no larger than the price increases in other weeks of the year.
10.1 IntroductionThis chapter provides detailed analysis on a number of issues relating to the regular petrol price cycles that occur in Australia’s largest cities.128
Detailed analysis of petrol price cycles was undertaken in previous ACCC petrol monitoring reports. This chapter extends that analysis to the end of September 2013. In particular, it considers the following elements of petrol price cycles in the five largest cities (i.e. Sydney, Melbourne, Brisbane, Adelaide and Perth):
• average price cycle increases
• the days of the week on which prices peak and trough
• the duration of price cycles
• consumer buying patterns during price cycles
• gross indicative retail differences (i.e. retail prices less wholesale prices) across price cycles over time
• the size of price cycle increases before public holidays.
128 All references to petrol in this chapter are to regular unleaded petrol (RULP). All references to the year 2013 are for the period 1 January to 30 September 2013. All prices are in nominal terms unless otherwise specified.
Monitoring of the Australian petroleum industry December 2013 129
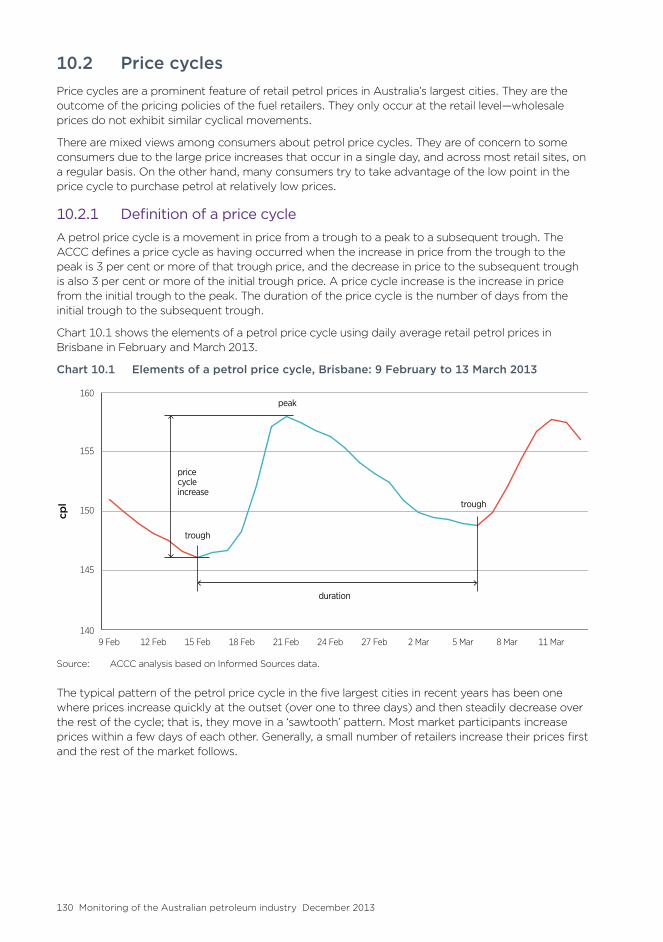
10.2 Price cyclesPrice cycles are a prominent feature of retail petrol prices in Australia’s largest cities. They are the outcome of the pricing policies of the fuel retailers. They only occur at the retail level—wholesale prices do not exhibit similar cyclical movements.
There are mixed views among consumers about petrol price cycles. They are of concern to some consumers due to the large price increases that occur in a single day, and across most retail sites, on a regular basis. On the other hand, many consumers try to take advantage of the low point in the price cycle to purchase petrol at relatively low prices.
10.2.1 DefinitionofapricecycleA petrol price cycle is a movement in price from a trough to a peak to a subsequent trough. The ACCC defines a price cycle as having occurred when the increase in price from the trough to the peak is 3 per cent or more of that trough price, and the decrease in price to the subsequent trough is also 3 per cent or more of the initial trough price. A price cycle increase is the increase in price from the initial trough to the peak. The duration of the price cycle is the number of days from the initial trough to the subsequent trough.
Chart 10.1 shows the elements of a petrol price cycle using daily average retail petrol prices in Brisbane in February and March 2013.
Chart 10.1 Elements of a petrol price cycle, Brisbane: 9 February to 13 March 2013
cpl
140
145
150
155
160
11 Mar8 Mar5 Mar2 Mar27 Feb24 Feb21 Feb18 Feb15 Feb12 Feb9 Feb
peak
trough
trough
duration
pricecycleincrease
Source: ACCC analysis based on Informed Sources data.
The typical pattern of the petrol price cycle in the five largest cities in recent years has been one where prices increase quickly at the outset (over one to three days) and then steadily decrease over the rest of the cycle; that is, they move in a ‘sawtooth’ pattern. Most market participants increase prices within a few days of each other. Generally, a small number of retailers increase their prices first and the rest of the market follows.
130 Monitoring of the Australian petroleum industry December 2013

In previous ACCC petrol monitoring reports price cycles have been classified into three broad categories: regular, truncated and failed.129 However, in this report the ACCC no longer uses the concept of a failed price cycle. This is because, with the duration of price cycles becoming longer and more variable, it is becoming increasingly difficult to determine the time when an increase in price may have been expected.
10.2.2 ExampleofpricecyclesinthefivelargestcitiesIn previous years, price cycles in most cities were seven days in duration. Moreover, the price cycle peak and trough occurred on or around the same day in most cities each week. In 2012 and 2013 price cycles in each city have generally moved independently of each other. This is clearly shown in chart 10.2.
Chart 10.2 Daily average retail petrol prices in the five largest cities: June 2013
cpl
130
135
140
145
150
155
160
29 Jun22 Jun15 Jun8 Jun1 Jun
BrisbaneMelbourne PerthAdelaideSydney
Source: ACCC analysis based on Informed Sources data.
10.3 Data on price cycles
10.3.1 MagnitudeofpricecycleincreasesandnumberofcyclesPrice cycle increases are calculated from daily average prices in each city. This means that the actual increase in price at any individual retail site in that city may differ from the average price cycle increase for the city.
There are three main influences on the size of price cycle increases:
• changes in wholesale prices—price cycle increases tend to be higher than average when underlying wholesale prices are increasing and lower than average when underlying wholesale prices are decreasing
129 See ACCC, Monitoring of the Australian petrol industry, December 2012, pp. 151–3. A regular price cycle was one which met the 3 per cent definition, where the peak occurred at a time when a peak might have been expected, and where the regular sawtooth pattern was apparent. A truncated price cycle was one which met the 3 per cent definition, where the peak occurred at a time when a peak might have been expected, but the typical sawtooth pattern was shortened (that is, there was a return to a lower price within one or two days of the trough to peak movement). A failed price cycle was where there was a small (or no) increase in price, at a time when an increase might have been expected, and the magnitude of the price increase (if any) did not meet the 3 per cent definition.
Monitoring of the Australian petroleum industry December 2013 131

• the extent of discounting before the price cycle increase
• the overall price level—for example, the absolute magnitude of the price cycle increase when prices are around 150 cents per litre (cpl) is likely to be higher than when prices are around 100 cpl.
Data on the number of price cycles and average price cycle increases in the five largest cities for the period 1 January 2012 to 30 September 2013 is shown in table 10.1.130
Table 10.1 Annual average price cycle increase in cents per litre and as a percentage of average price, and number of price cycles—five largest cities: 2012 and 2013
Sydney Melbourne Brisbane Adelaide Perth
Average price cycle increase (cpl)
2012 12.0 12.8 10.4 16.1 8.4
2013* 14.1 14.9 13.3 16.2 9.9
Annual average price (cpl)
2012 141.4 140.7 145.4 141.8 143.0
2013* 144.2 143.9 147.2 143.3 145.7
Price cycle increase as per cent of annual average price (%)
2012 8.5 9.1 7.1 11.4 5.9
2013* 9.8 10.4 9.1 11.3 6.8
Number of price cycles
2012 28 23 28 26 52
2013* 15 16 15 20 39
Source: ACCC analysis based on Informed Sources data.
Note: * 2013 is for period 1 January to 30 September.
In 2012 the average price cycle increase was largest in Adelaide (16.1 cpl) and smallest in Perth (8.4 cpl). In 2013 the average price cycle increases were greater than in 2012 in all cities.
As in 2012, Adelaide had the largest average price cycle increase (16.2 cpl) in 2013 and Perth had the smallest (9.9 cpl). As a percentage of annual average prices, the average price cycle increases were larger in 2013 compared with 2012 in all cities except Adelaide (where it decreased marginally).
In 2012 Perth had a price cycle every week of the year, while in the other cities price cycles occurred roughly every two weeks. In 2013 Perth again had a price cycle every week. The number of price cycles in the other cities was significantly smaller: Sydney, Melbourne and Brisbane had a price cycle on average around every two and a half weeks.
Table 10.1 shows that compared with the four eastern cities, Perth had more price cycles with smaller average price cycle increases in both 2012 and 2013. Unlike other states, Western Australia has fuel price regulations under which retail sites must keep their prices constant for a 24-hour
130 The number of price cycles in a year is recorded as the number of peaks that occurred in that year. When comparing data across these cities, some locally specific factors need to be considered. For example, in Sydney, the number of retail sites selling regular unleaded petrol has been declining since October 2007 following the introduction of an ethanol mandate in New South Wales (see section 5.2).
132 Monitoring of the Australian petroleum industry December 2013

period and the price at each retail site is publicly available on the FuelWatch website.131 Because of these arrangements, petrol retailers may adopt different pricing strategies from those employed in the eastern cities.
10.3.2 DiscountingatpricecycletroughsOne consequence of petrol price cycle movements is that motorists have the opportunity to purchase petrol at or below the average wholesale price. ACCC analysis has found that retail prices most often fall below wholesale prices when wholesale prices are increasing, or when there is a period of heavy discounting.
Table 10.2 shows, for each of the five largest cities, the number of days in 2012 and 2013 when the daily average retail petrol price was equal to or below the daily average terminal gate price (TGP).
Table 10.2 Number of days when the daily average retail petrol price was equal to or below the daily average terminal gate price—five largest cities: 2012 and 2013
Sydney Melbourne Brisbane Adelaide Perth
2012 32 49 0 69 0
2013* 39 32 1 73 1
Sources: ACCC analysis based on data from Informed Sources, BP, Caltex, Gull, Mobil and Shell.
Note: * 2013 is for period 1 January to 30 September.
In 2012 and 2013 across the five cities there were a total of 296 days when the daily average retail price was at or below the daily average TGP. Adelaide (with 142 days, or 22 per cent of the time) had the most days. There were 81 days (13 per cent) where daily average retail prices were at or below average TGPs in Melbourne, and 71 days (11 per cent) in Sydney.
In Brisbane and Perth there were no days in 2012, and only one day in 2013, when the daily average retail price was at or below the average TGP. However, there were several days in these cities when individual retail sites were selling petrol at a price lower than the average TGP.
10.4 Peaks and troughs by day of the weekThis section examines the days of the week on which price cycles peaked and troughed in 2012 and 2013 and discusses the changes that have occurred.
10.4.1 NumberofpeaksandtroughsbydayoftheweekPrior to 2010 there were long periods when price cycle peaks and troughs generally occurred on the same day each week. Analysis in the 2011 ACCC petrol monitoring report showed that, in all cities, the price cycle trough in 2009 was Wednesday on all but a few occasions, and the peak was always on Thursday or Friday.132
However, from 2011 the troughs and peaks have varied over the week in the four eastern cities, because of the longer duration of price cycles. In contrast, price cycles in Perth have become more regular and predictable compared with previous years.
Table 10.3 shows the number of troughs and peaks (and percentage of the annual total) on each day of the week in each of the five largest cities in 2012 and 2013.
131 See: http://www.fuelwatch.wa.gov.au/fuelwatch/pages/home.jspx.
132 See ACCC, Monitoring of the Australian petroleum industry, December 2011, pp. 192–5.
Monitoring of the Australian petroleum industry December 2013 133

Table 10.3 Number of troughs and peaks (and percentage of annual total) in petrol prices on each day of the week, five largest cities: 2012 and 2013
Mon Tue Wed Thu Fri Sat Sun Total
Sydney
Trough
2012 5 (18%) 7 (25%) 5 (18%) 2 (7%) 5 (18%) 4 (14%) 28
2013 2 (13%) 5 (33%) 4 (27%) 1 (7%) 3 (20%) 15
Peak
2012 4 (14%) 1 (4%) 5 (18%) 6 (21%) 7 (25%) 5 (18%) 28
2013 2 (13%) 2 (13%) 2 (13%) 2 (13%) 1 (7%) 3 (20%) 3 (20%) 15
Melbourne
Trough
2012 3 (13%) 5 (22%) 6 (26%) 2 (9%) 5 (22%) 1 (4%) 1 (4%) 23
2013 2 (13%) 2 (13%) 3 (19%) 4 (25%) 1 (6%) 1 (6%) 3 (19%) 16
Peak
2012 3 (13%) 2 (9%) 1 (4%) 4 (17%) 6 (26%) 2 (9%) 5 (22%) 23
2013 1 (6%) 3 (19%) 1 (6%) 2 (13%) 1 (6%) 2 (13%) 6 (38%) 16
Brisbane
Trough
2012 8 (29%) 4 (14%) 6 (21%) 4 (14%) 4 (14%) 1 (4%) 1 (4%) 28
2013 3 (20%) 5 (33%) 1 (7%) 1 (7%) 2 (13%) 2 (13%) 1 (7%) 15
Peak
2012 5 (18%) 1 (4%) 1 (4%) 5 (18%) 7 (25%) 5 (18%) 4 (14%) 28
2013 4 (27%) 4 (27%) 1 (7%) 2 (13%) 1 (7%) 1 (7%) 2 (13%) 15
Adelaide
Trough
2012 2 (8%) 4 (15%) 7 (27%) 2 (8%) 4 (15%) 7 (27%) 26
2013 5 (25%) 5 (25%) 1 (5%) 2 (10%) 4 (20%) 3 (15%) 20
Peak
2012 3 (12%) 1 (4%) 6 (23%) 5 (19%) 7 (27%) 2 (8%) 2 (8%) 26
2013 3 (15%) 3 (15%) 3 (15%) 6 (30%) 1 (5%) 1 (5%) 3 (15%) 20
Perth
Trough
2012 52 (100%) 52
2013 39 (100%) 39
Peak
2012 49 (94%) 3 (6%) 52
2013 39 (100%) 39
Source: ACCC analysis based on Informed Sources data.
134 Monitoring of the Australian petroleum industry December 2013

The table shows that in the four eastern cities:
• price cycle peaks and troughs occurred in each city on at least six different days of the week in 2012
• in 2012 the trough occurred most often on a Wednesday (23 per cent of troughs) and the peak most often on a Friday (25 per cent of peaks)
• in 2013 price cycle peaks and troughs again occurred on at least six different days of the week
• in 2013 the most common trough day was Tuesday (26 per cent of troughs) and the most common peak day was Sunday (21 per cent of peaks), although in general peak and trough days were distributed throughout the week.
In Perth:
• the price cycle trough always occurred on a Wednesday in both 2012 and 2013
• the price cycle peak occurred on all but three Thursdays in 2012 (on these three occasions the peak occurred on a Friday) and on every Thursday in 2013.
10.4.2 ChangesindaysoftheweekofpeaksandtroughsCharts 10.3 to 10.12 identify the day of the week on which each price cycle peak and trough occurred in the five largest cities in the period week ending 1 January 2012 to week ending 29 September 2013. Each square in the charts represents a peak (in red) or a trough (in blue) in each price cycle.
The charts highlight that in 2012 and 2013—with the exception of Perth—there has been no consistent pattern for peak and trough days. As a result, peak and trough days have been quite unpredictable for consumers in the four eastern cities.
On the other hand, in Perth peak and trough days have been extremely predictable throughout 2012 and 2013. They have not varied from week to week as they have in the four eastern cities.
The stability of the weekly price cycle in Perth has been a characteristic since March 2009. Price cycles were largely absent in Perth for nearly a year prior to March 2009 and before that price cycles were around fourteen days in duration. In contrast, price cycles in all four eastern cities were generally seven days in duration prior to mid-2010.
Section 10.5 discusses the changing duration of price cycles in more detail.
Monitoring of the Australian petroleum industry December 2013 135
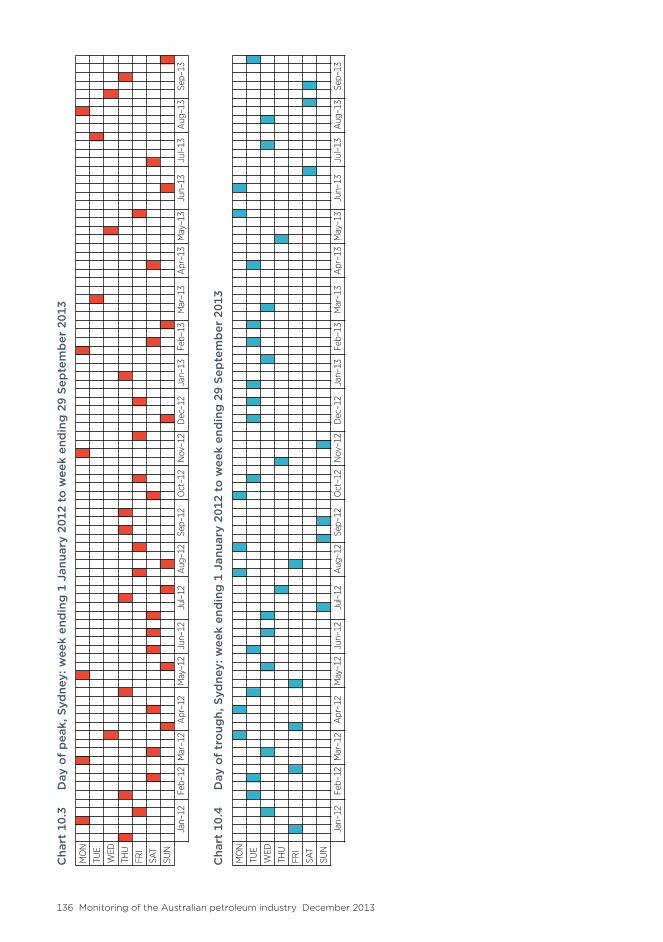
Cha
rt 1
0.3
Day
of
pea
k, S
ydne
y: w
eek
end
ing
1 J
anua
ry 2
012
to w
eek
end
ing
29
Sep
tem
ber
201
3
MO
N
TUE
WED
THU
FRI
SAT
SUN
Mar
–12
Apr
–12
May
–12
Jun–
13Ju
l–13
Aug
–13
Sep–
13D
ec–1
2Ja
n–13
Feb–
13M
ar–1
3A
pr–1
3M
ay–1
3Ju
n–12
Jul–
12A
ug–1
2Se
p–12
Oct
–12
Nov
–12
Jan–
12Fe
b–12
Cha
rt 1
0.4
Day
of
tro
ugh,
Syd
ney:
wee
k en
din
g 1
Jan
uary
201
2 to
wee
k en
din
g 2
9 Se
pte
mb
er 2
013
MO
N
TUE
WED
THU
FRI
SAT
SUN
Mar
–12
Apr
–12
May
–12
Jun–
13Ju
l–13
Aug
–13
Sep–
13D
ec–1
2Ja
n–13
Feb–
13M
ar–1
3A
pr–1
3M
ay–1
3Ju
n–12
Jul–
12A
ug–1
2Se
p–12
Oct
–12
Nov
–12
Jan–
12Fe
b–12
136 Monitoring of the Australian petroleum industry December 2013

Cha
rt 1
0.5
Day
of
pea
k, M
elb
our
ne: w
eek
end
ing
1 J
anua
ry 2
012
to w
eek
end
ing
29
Sep
tem
ber
201
3
MO
N
TUE
WED
THU
FRI
SAT
SUN
Mar
–12
Apr
–12
May
–12
Jun–
13Ju
l–13
Aug
–13
Sep–
13D
ec–1
2Ja
n–13
Feb–
13M
ar–1
3A
pr–1
3M
ay–1
3Ju
n–12
Jul–
12A
ug–1
2Se
p–12
Oct
–12
Nov
–12
Jan–
12Fe
b–12
Cha
rt 1
0.6
Day
of
tro
ugh,
Mel
bo
urne
: wee
k en
din
g 1
Jan
uary
201
2 to
wee
k en
din
g 2
9 Se
pte
mb
er 2
013
MO
N
TUE
WED
THU
FRI
SAT
SUN
Mar
–12
Apr
–12
May
–12
Jun–
13Ju
l–13
Aug
–13
Sep–
13D
ec–1
2Ja
n–13
Feb–
13M
ar–1
3A
pr–1
3M
ay–1
3Ju
n–12
Jul–
12A
ug–1
2Se
p–12
Oct
–12
Nov
–12
Jan–
12Fe
b–12
Monitoring of the Australian petroleum industry December 2013 137

Cha
rt 1
0.7
Day
of
pea
k, B
risb
ane:
wee
k en
din
g 1
Jan
uary
201
2 to
wee
k en
din
g 2
9 Se
pte
mb
er 2
013
MO
N
TUE
WED
THU
FRI
SAT
SUN
Mar
–12
Apr
–12
May
–12
Jun–
13Ju
l–13
Aug
–13
Sep–
13D
ec–1
2Ja
n–13
Feb–
13M
ar–1
3A
pr–1
3M
ay–1
3Ju
n–12
Jul–
12A
ug–1
2Se
p–12
Oct
–12
Nov
–12
Jan–
12Fe
b–12
Cha
rt 1
0.8
Day
of
tro
ugh,
Bri
sban
e: w
eek
end
ing
1 J
anua
ry 2
012
to w
eek
end
ing
29
Sep
tem
ber
201
3
MO
N
TUE
WED
THU
FRI
SAT
SUN
Mar
–12
Apr
–12
May
–12
Jun–
13Ju
l–13
Aug
–13
Sep–
13D
ec–1
2Ja
n–13
Feb–
13M
ar–1
3A
pr–1
3M
ay–1
3Ju
n–12
Jul–
12A
ug–1
2Se
p–12
Oct
–12
Nov
–12
Jan–
12Fe
b–12
138 Monitoring of the Australian petroleum industry December 2013

Cha
rt 1
0.9
Day
of
pea
k, A
del
aid
e: w
eek
end
ing
1 J
anua
ry 2
012
to w
eek
end
ing
29
Sep
tem
ber
201
3
MO
N
TUE
WED
THU
FRI
SAT
SUN
Mar
–12
Apr
–12
May
–12
Jun–
13Ju
l–13
Aug
–13
Sep–
13D
ec–1
2Ja
n–13
Feb–
13M
ar–1
3A
pr–1
3M
ay–1
3Ju
n–12
Jul–
12A
ug–1
2Se
p–12
Oct
–12
Nov
–12
Jan–
12Fe
b–12
Cha
rt 1
0.10
D
ay o
f tr
oug
h, A
del
aid
e: w
eek
end
ing
1 J
anua
ry 2
012
to w
eek
end
ing
29
Sep
tem
ber
201
3
MO
N
TUE
WED
THU
FRI
SAT
SUN
Mar
–12
Apr
–12
May
–12
Jun–
13Ju
l–13
Aug
–13
Sep–
13D
ec–1
2Ja
n–13
Feb–
13M
ar–1
3A
pr–1
3M
ay–1
3Ju
n–12
Jul–
12A
ug–1
2Se
p–12
Oct
–12
Nov
–12
Jan–
12Fe
b–12
Monitoring of the Australian petroleum industry December 2013 139

Cha
rt 1
0.11
D
ay o
f p
eak,
Per
th: w
eek
end
ing
1 J
anua
ry 2
012
to w
eek
end
ing
29
Sep
tem
ber
201
3
MO
N
TUE
WED
THU
FRI
SAT
SUN
Mar
–12
Apr
–12
May
–12
Jun–
13Ju
l–13
Aug
–13
Sep–
13D
ec–1
2Ja
n–13
Feb–
13M
ar–1
3A
pr–1
3M
ay–1
3Ju
n–12
Jul–
12A
ug–1
2Se
p–12
Oct
–12
Nov
–12
Jan–
12Fe
b–12
Cha
rt 1
0.12
D
ay o
f tr
oug
h, P
erth
: wee
k en
din
g 1
Jan
uary
201
2 to
wee
k en
din
g 2
9 Se
pte
mb
er 2
013
MO
N
TUE
WED
THU
FRI
SAT
SUN
Mar
–12
Apr
–12
May
–12
Jun–
13Ju
l–13
Aug
–13
Sep–
13D
ec–1
2Ja
n–13
Feb–
13M
ar–1
3A
pr–1
3M
ay–1
3Ju
n–12
Jul–
12A
ug–1
2Se
p–12
Oct
–12
Nov
–12
Jan–
12Fe
b–12
So
urce
: A
CC
C a
naly
sis
bas
ed o
n In
form
ed S
our
ces
dat
a.
No
te:
Eac
h re
d s
qua
re r
epre
sent
s th
e p
eak
of
a p
rice
cycl
e an
d e
ach
blu
e sq
uare
rep
rese
nts
the
tro
ugh
of
a p
rice
cycl
e.
140 Monitoring of the Australian petroleum industry December 2013

10.5 Duration of price cyclesA feature of petrol price cycles in recent years has been the increase in, and variability of, the duration of price cycles in Sydney, Melbourne, Brisbane and Adelaide. Price cycle durations in Perth have decreased over this time. This section analyses the change in the duration of price cycles in the five largest cities from the beginning of 2009.
As noted in section 10.2, a price cycle is a movement in price from the trough to a peak to a subsequent trough. The duration of a price cycle is therefore the number of days from trough to trough.133
Table 10.4 shows the average duration of price cycles in each of the five largest cities from 2009 to 2013. It also shows the average number of days from trough to peak and the average number of days from peak to trough.134 Chart 10.13 shows the annual average price cycle duration for each city over the period.
133 The methodology used in this analysis is slightly different to that used in the section on the duration of price cycles in the 2012 ACCC petrol monitoring report. The latter analysis excluded the influence of failed price cycles (which are described in footnote 132). In the event of a failed price cycle, the duration of the price cycle immediately preceding or succeeding it will be much larger than it otherwise would have been. These longer price cycles are included in the current analysis.
134 As this section is based on daily average price data, it may over-estimate the actual duration of the trough to peak increase (or restoration phase) of the price cycle. For example, suppose that prices started to increase at a number of retail sites around 4.00 pm one day and that most retail sites had moved to a similar price by around 4.00 pm the next day. In this case, the daily average price data may show that the trough to peak increase was two or three days, even though it had only taken 24 hours for prices to go up. Therefore, this analysis should not be used to indicate the changing duration of the phases of actual price cycles.
Monitoring of the Australian petroleum industry December 2013 141

Table 10.4 Annual average trough–peak duration, peak–trough duration, and price cycle duration, five largest cities: 2009 to 2013
Average price cycle durations (days) Sydney Melbourne Brisbane Adelaide Perth
2009
Average duration trough–peak 1.8 1.8 2.0 1.4 4.5
Average duration peak–trough 5.2 5.2 5.0 5.6 4.7
Average cycle duration 7.0 7.0 7.0 7.0 9.2
2010
Average duration trough–peak 2.2 2.1 2.0 2.3 2.6
Average duration peak–trough 6.0 5.8 5.7 5.2 5.1
Average cycle duration 8.2 7.9 7.7 7.5 7.7
2011
Average duration trough–peak 2.5 2.1 2.5 2.9 1.0
Average duration peak–trough 6.3 6.7 6.9 7.0 6.0
Average cycle duration 8.8 8.8 9.4 9.9 7.0
2012
Average duration trough–peak 3.4 3.3 3.2 3.3 1.1
Average duration peak–trough 9.5 12.5 9.7 10.9 5.9
Average cycle duration 12.9 15.8 12.9 14.2 7.0
2013
Average duration trough–peak 5.4 4.8 6.0 2.8 1.0
Average duration peak–trough 13.6 12.7 12.9 10.4 6.0
Average cycle duration 19.0 17.5 18.9 13.2 7.0
Source: ACCC analysis based on Informed Sources data.
142 Monitoring of the Australian petroleum industry December 2013

Chart 10.13 Annual average price cycle duration, five largest cities: 2009 to 2013
day
s
5
7
9
11
13
15
17
19
21
20132012201120102009
BrisbaneMelbourne PerthAdelaideSydney
Source: ACCC analysis based on Informed Sources data.
In the four eastern cities:
• In 2009 the average duration of price cycles was seven days. This increased slightly over the next two years (to around eight days in 2010 and to around nine to 10 days in 2011).
• In 2012 the average duration increased substantially in each city. – The increase from 2011 ranged from 7.0 days in Melbourne to 3.5 days in Brisbane.
• In 2013 average price cycle durations continued to increase substantially in each city except Adelaide.
– Sydney and Brisbane had the highest average durations of around 19 days. The average duration in Melbourne was around 18 days.
– The average duration in Adelaide decreased from around 14 days to around 13 days. This was due to a substantial decrease in price cycle durations from April 2013.
• Between 2009 and 2013, the average trough to peak duration (that is, the increase or restoration phase of the price cycle) has been substantially shorter than the peak to trough duration (the decrease or discounting phase).
In Perth:
• average price cycle durations decreased from around nine days in 2009 to seven days in 2011
• the average duration remained at seven days in 2012 and 2013
• over the last three years the average trough to peak duration has been around one day and the peak to trough duration has been around 6 days.
Longer price cycles can have an adverse impact on price-sensitive consumers. An ANOP survey commissioned by the ACCC for the 2007 petrol inquiry found that:
• 50 per cent of motorists purchased petrol once a week, and 26 per cent purchased petrol more than once a week
• the most price sensitive motorists are most likely to buy petrol once a week (61 per cent)
• 71 per cent of motorists fill up their tank when they purchase petrol
• the most price sensitive motorists are more likely to fill up the tank (76 per cent). 135
135 Summary of the ANOP consumer survey in November 2007 commissioned by the ACCC, in ACCC, Petrol prices and Australian consumers, December 2007, p. 285.
Monitoring of the Australian petroleum industry December 2013 143

Therefore, a significant proportion of Australian motorists purchase petrol on a weekly basis, and can take full advantage of petrol price cycles when they are roughly a week in duration by timing their weekly purchase at or near the trough price. However, when price cycles become longer than a week motorists cannot do this and must fill up when prices are relatively higher.
10.6 Consumer buying patterns during the price cycleThis section provides information on the volume of retail petrol sales and the average price of petrol by day of the week in the five largest cities in 2012–13.
10.6.1 Averagepetrolsalesvolumesandpricesbydayoftheweek
Four eastern capital cities
The days of the week on which price cycles peaked and troughed in the four eastern capital cities varied from week to week in 2012–13. As noted in section 10.5 the average duration of petrol price cycles in these cities was between two to three weeks in 2012–13. Therefore, there were a number of weeks which had neither a peak nor a trough.
Charts 10.14 to 10.17 show average retail volumes as a percentage of total volumes, and average petrol prices by day of the week, in 2012–13 in Sydney, Melbourne, Brisbane and Adelaide.
Chart 10.14 Average retail sales volumes and prices by day of the week, Sydney: 2012–13
per cen
t
0
6
12
18
24
30
SaturdayFridayThursdayWednesdayTuesdayMondaySunday
cpl
133
136
139
142
145
148
Sydney—daily average retail price (RHS)Sydney—volume sold (LHS)
Sources: ACCC analysis based on Informed Sources data and information provided by the monitored companies.
144 Monitoring of the Australian petroleum industry December 2013

Chart 10.15 Average retail sales volumes and prices by day of the week, Melbourne: 2012–13
per cen
t
0
6
12
18
24
30
SaturdayFridayThursdayWednesdayTuesdayMondaySunday
cpl
133
136
139
142
145
148
Melbourne—daily average retail price (RHS)Melbourne—volume sold (LHS)
Sources: ACCC analysis based on Informed Sources data and information provided by the monitored companies.
Chart 10.16 Average retail sales volumes and prices by day of the week, Brisbane: 2012–13
per cen
t
0
6
12
18
24
30
SaturdayFridayThursdayWednesdayTuesdayMondaySunday
cpl
133
136
139
142
145
148
Brisbane—daily average retail price (RHS)Brisbane—volume sold (LHS)
Sources: ACCC analysis based on Informed Sources data and information provided by the monitored companies.
Monitoring of the Australian petroleum industry December 2013 145

Chart 10.17 Average retail sales volumes and prices by day of the week, Adelaide: 2012–13 per cen
t
0
6
12
18
24
30
SaturdayFridayThursdayWednesdayTuesdayMondaySunday
cpl
133
136
139
142
145
148
Adelaide—daily average retail price (RHS)Adelaide—volume sold (LHS)
Sources: ACCC analysis based on Informed Sources data and information provided by the monitored companies.
In the four eastern capital cities:
• there was little variation in the average price for each day of the week – the city with the highest variation in price was Sydney (1.4 cpl), which varied between a low of 139.5 cpl (on Tuesday) and a high of 140.9 cpl (on Saturday and Sunday)
– the city with the lowest variation was Brisbane (0.7 cpl), which varied between 143.7 cpl on Wednesday and 144.4 cpl on Sunday
• the highest volumes were sold on Thursday, and the lowest volumes were sold on Sunday, regardless of the relative price level for those days
– the variation in average volumes by day was between three and five percentage points in each city.
Perth
In Perth the cheapest day of the week to buy petrol in 2012–13 was always Wednesday, and the most expensive day was always Thursday. Therefore, consumers in Perth had the opportunity to take advantage of regular petrol price cycles by buying relatively cheap petrol on Wednesday each week.
Chart 10.18 shows average retail volumes as a percentage of total volumes, and average petrol prices by day of the week, in 2012–13 in Perth.
146 Monitoring of the Australian petroleum industry December 2013

Chart 10.18 Average retail sales volumes and prices by day of the week, Perth: 2012–13
per cen
t
0
6
12
18
24
30
SaturdayFridayThursdayWednesdayTuesdayMondaySunday
cpl
133
136
139
142
145
148
Perth—daily average retail price (RHS)Perth—volume sold (LHS)
Sources: ACCC analysis based on Informed Sources data and information provided by the monitored companies.
Because of the timing and consistency of price cycles in Perth, the variation in prices by day of the week was much greater than in the four eastern cities. There was also a greater variation in volume sold by day.
In Perth:
• the range of average prices across the days of the week was 9.3 cpl—it was lowest on Wednesday (137.1 cpl) and highest on Thursday (146.4 cpl)
• Wednesday also had the highest average sales of 23 per cent
• the lowest sales were on Sunday (10 per cent) even though Thursday had the highest average prices.
10.6.2 DailyaveragepetrolsalesvolumesandpricesinAdelaide, MarchandJunequarters2013
Charts 10.19 and 10.20 show daily average retail prices and daily volumes of petrol sold in Adelaide in the March and June quarters of 2013, respectively.
The average duration of petrol price cycles in Adelaide was around 18 days in the March quarter 2013—this was broadly in line with the average durations in Sydney, Melbourne and Brisbane. However, the average duration decreased to around 10 days in the June quarter 2013.
Monitoring of the Australian petroleum industry December 2013 147

Chart 10.19 Average retail sales volumes and prices by day of the week, Adelaide: March quarter 2013
per cen
t
0.0
0.3
0.6
0.9
1.2
1.5
1.8
2.1
26 Mar19 Mar12 Mar5 Mar26 Feb19 Feb12 Feb5 Feb29 Jan22 Jan15 Jan8 Jan1 Jan
cpl
90
100
110
120
130
140
150
160
26 Mar19 Mar12 Mar5 Mar26 Feb19 Feb12 Feb5 Feb29 Jan22 Jan15 Jan8 Jan1 Jan
Adelaide—daily average retail price (RHS)Adelaide—volume sold (LHS)
26 M
ar
19 M
ar
12 M
ar
5 M
ar
26 F
eb
19 F
eb
12 F
eb
5 Fe
b
29 J
an
22 J
an
15 J
an
8 Ja
n
1 Ja
n
Sources: ACCC analysis based on Informed Sources data and information provided by the monitored companies.
Chart 10.19 shows that generally in the March quarter 2013 higher volumes of petrol were sold on the cheaper days in the price cycle, and lower volumes on the more expensive days. However:
• the highest daily volume sold in each price cycle occurred on average four days before the trough
• there were two or more peaks in volume sold during each price cycle.
This suggests that when price cycles in Adelaide were longer and more variable, it was difficult for consumers to pick the cheapest days to buy petrol.
148 Monitoring of the Australian petroleum industry December 2013

Chart 10.20 Average retail sales volumes and prices by day of the week, Adelaide: June quarter 2013
per cen
t
0.0
0.3
0.6
0.9
1.2
1.5
1.8
2.1
24 Jun17 Jun10 Jun3 Jun27 May20 May13 May6 May29 Apr22 Apr15 Apr8 Apr1 Apr
cpl
90
100
110
120
130
140
150
160
24 Jun17 Jun10 Jun3 Jun27 May20 May13 May6 May29 Apr22 Apr15 Apr8 Apr1 Apr
Adelaide—daily average retail price (RHS)Adelaide—volume sold (LHS)
24 J
un
17 J
un
10 J
un
3 Ju
n
27 M
ay
20 M
ay
13 M
ay
6 M
ay
29 A
pr
22 A
pr
15 A
pr
8 A
pr
1 A
pr
Sources: ACCC analysis based on Informed Sources data and information provided by the monitored companies.
Chart 10.20 shows that from early May 2013 price cycle durations on average decreased to around nine days, from around 18 days in the March quarter 2013. From May 2013:
• the highest daily volume sold for each price cycle occurred on average one day before the trough
• there was generally a single peak in volume sold during each price cycle
• while price cycles were significantly shorter compared with previous months, their duration continued to be variable.
This pattern of buying suggests that between May and June 2013 consumers in Adelaide, despite the variability in the duration of one price cycle to the next, were more able to buy petrol at or around the price cycle trough price.
10.7 Gross indicative retail differences over the price cycleSection 8.5 and appendix E analysed annual average gross indicative retail differences (GIRDs), in nominal and real terms, over the last five years. GIRDs are the difference between average retail petrol prices and average terminal gate prices.
Section 10.5 described the changing duration of the petrol price cycle in the five largest capital cities since 2009. In particular, between January 2009 and June 2013:
• price cycles moved from consistently being seven days to becoming much longer and more variable in duration in Sydney, Melbourne, Brisbane and Adelaide (the four eastern capital cities)
• in Perth price cycles became increasingly consistent in duration and regularity (seven days).
Monitoring of the Australian petroleum industry December 2013 149

The ACCC has analysed average GIRDs per petrol price cycle in each of the five largest cities since the beginning of 2009.136
10.7.1 GrossindicativeretaildifferencesTable 10.5 shows, for each of the five largest cities, nominal and real half-yearly average GIRDs per price cycle from the first half of 2009 to the first half of 2013.
Table 10.5 Half-yearly average gross indicative retail differences in the five largest cities, nominal and real: first half of 2009 to first half of 2013
PeriodSydney Melbourne Brisbane Adelaide Perth
Nominal Real Nominal Real Nominal Real Nominal Real Nominal Real
1H 2009 5.5 6.1 7.8 8.6 9.8 10.8 6.6 7.3 4.4 4.9
2H 2009 7.1 7.7 9.3 10.1 9.7 10.6 6.0 6.6 4.0 4.3
1H 2010 6.1 6.6 8.2 8.8 9.2 9.9 6.3 6.7 5.2 5.6
2H 2010 7.4 7.9 8.4 8.9 10.0 10.6 5.8 6.2 6.3 6.7
1H 2011 8.1 8.4 8.1 8.4 10.5 10.9 6.9 7.2 7.3 7.5
2H 2011 7.1 7.3 7.2 7.4 10.5 10.8 7.1 7.3 7.8 8.0
1H 2012 6.1 6.2 6.3 6.4 10.4 10.6 7.0 7.2 7.9 8.0
2H 2012 5.9 5.9 6.4 6.4 10.6 10.7 6.2 6.2 7.5 7.6
1H 2013 5.5 5.5 5.7 5.7 9.4 9.4 5.6 5.6 8.2 8.2
Sources: ACCC analysis based on data from Informed Sources, Australian Bureau of Statistics, 6401.0 Consumer Price Index, Australia, Table 1. CPI: All Groups, Index Numbers and Percentage Changes, http://www.abs.gov.au/AUSSTATS, accessed 4 October 2013, and information provided by the monitored companies.
Note: The base year is 2012–13.
Table 10.5 shows that real average GIRDs per price cycle varied significantly over the half-year periods and differed considerably across cities:
• in Melbourne they peaked in the second half of 2009 and then steadily decreased
• in Perth they troughed in the second half of 2009 and then steadily increased
• in Brisbane and Adelaide they were broadly stable (within a range of less than 2.0 cpl)
• in Sydney there was no discernible trend over the period
• in all eastern capital cities the smallest average GIRDs per price cycle in real terms occurred in the first half of 2013.
10.7.2 Volume-weightedgrossindicativeretaildifferencesThe average GIRDs per cycle in table 10.5 take no account of the volume of petrol sold on the day and implicitly assume consistent sales per day over the price cycle. Using the volumes data noted in section 10.6 average volume-weighted GIRDs per price cycle were calculated.137 These reflect the buying habits of consumers over the price cycle.
136 Some methodological points to note are:• For each day over a price cycle we have calculated a daily GIRD and then averaged those GIRDs for each
price cycle. These GIRDs were then averaged over half-year periods. • Brisbane GIRDs for the first half of 2009 were adjusted to account for the Queensland state fuel subsidy at
the retail level (which was around 9.2 cpl including GST) which applied prior to 1 July 2009.• A price cycle was included in the six-month period if the peak of the price cycle occurred in that period.
Each price cycle received an equal weight regardless of its duration. As a result, the GIRDs calculated in this section may differ slightly from those provided in appendix E.
137 Each daily GIRD was weighted by the volume of fuel sold on that day.
150 Monitoring of the Australian petroleum industry December 2013

Table 10.6 shows, for each of the five largest cities, nominal and real half-yearly average volume-weighted GIRDs per price cycle from the first half of 2009 to the first half of 2013. Table 10.7 shows the difference between the average unweighted GIRDs per price cycle in table 10.5 and the average volume-weighted GIRDs per price cycle in table 10.6.
Table 10.6 Half-yearly average volume-weighted gross indicative retail differences in the five largest cities, nominal and real: first half of 2009 to first half of 2013
PeriodSydney Melbourne Brisbane Adelaide Perth
Nominal Real Nominal Real Nominal Real Nominal Real Nominal Real
1H 2009 4.3 4.7 6.6 7.3 9.0 10.0 4.9 5.5 4.3 4.7
2H 2009 5.7 6.2 8.1 8.8 8.9 9.7 4.3 4.7 3.7 4.1
1H 2010 5.2 5.6 7.1 7.6 8.3 8.9 4.6 4.9 5.0 5.4
2H 2010 6.8 7.2 7.5 8.0 9.4 9.9 4.4 4.7 5.9 6.2
1H 2011 7.6 7.9 7.4 7.7 10.1 10.5 5.6 5.8 6.8 7.1
2H 2011 6.6 6.8 6.6 6.8 10.1 10.4 6.0 6.2 7.3 7.5
1H 2012 5.7 5.8 5.8 6.0 10.0 10.2 6.1 6.3 7.4 7.6
2H 2012 5.5 5.5 6.0 6.0 10.2 10.3 5.1 5.1 7.1 7.1
1H 2013 5.1 5.1 5.2 5.2 9.1 9.1 4.8 4.8 7.6 7.6
Sources: ACCC analysis based on data from Informed Sources, Australian Bureau of Statistics, 6401.0 Consumer Price Index, Australia, Table 1. CPI: All Groups, Index Numbers and Percentage Changes, http://www.abs.gov.au/AUSSTATS, accessed 4 October 2013, and information provided by the monitored companies.
Note: The base year is 2012–13.
Table 10.7 Difference between unweighted and volume-weighted half-yearly average gross indicative retail differences in the five largest cities, nominal and real: first half of 2009 to first half of 2013
PeriodSydney Melbourne Brisbane Adelaide Perth
Nominal Real Nominal Real Nominal Real Nominal Real Nominal Real
1H 2009 1.2 1.4 1.2 1.3 0.8 0.8 1.7 1.8 0.1 0.2
2H 2009 1.4 1.5 1.2 1.3 0.8 0.9 1.7 1.9 0.3 0.2
1H 2010 0.9 1.0 1.1 1.2 0.9 1.0 1.7 1.8 0.2 0.2
2H 2010 0.6 0.7 0.9 0.9 0.6 0.7 1.4 1.5 0.4 0.5
1H 2011 0.5 0.5 0.7 0.7 0.4 0.4 1.3 1.4 0.5 0.4
2H 2011 0.5 0.5 0.6 0.6 0.4 0.4 1.1 1.1 0.5 0.5
1H 2012 0.4 0.4 0.5 0.4 0.4 0.4 0.9 0.9 0.5 0.4
2H 2012 0.4 0.4 0.4 0.4 0.4 0.4 1.1 1.1 0.4 0.5
1H 2013 0.4 0.4 0.5 0.5 0.3 0.3 0.8 0.8 0.6 0.6
Sources: ACCC analysis based on data from Informed Sources, Australian Bureau of Statistics, 6401.0 Consumer Price Index, Australia, Table 1. CPI: All Groups, Index Numbers and Percentage Changes, http://www.abs.gov.au/AUSSTATS, accessed 4 October 2013, and information provided by the monitored companies.
Note: The base year is 2012–13.
Monitoring of the Australian petroleum industry December 2013 151

A comparison of average unweighted and volume-weighted GIRDs per price cycle indicates that:
• the movements in the two series were broadly similar
• average volume-weighted GIRDs per price cycle were lower than average unweighted GIRDs per price cycle in every period in all cities (in both nominal and real terms)
– this reflects the fact that sales of petrol are generally higher on days when prices are relatively low and lower when prices are relatively high
• between the first half of 2009 and the first half of 2013 the real half-yearly average difference between unweighted and volume-weighted GIRDs per cycle decreased in all cities except Perth
– the difference decreased by 1.0 cpl in Sydney and Adelaide, by 0.8 cpl in Melbourne, and by 0.5 cpl in Brisbane
– in Perth, the difference increased by 0.4 cpl.
The narrowing difference between average unweighted and volume-weighted GIRDs per price cycle in the four eastern capital cities suggests that, in recent years, consumers are taking advantage of the relatively cheaper days in the price cycle to a lesser extent than they did in previous years (when price cycles were regularly of seven days duration).
This may be for a number of reasons, including:
• motorists are finding it more difficult to pick the cheap days in the price cycle due to the increasing variability and duration of price cycles
• as price cycles are now generally more than two weeks in duration, many motorists need to refill their tanks mid-cycle, at a time when they otherwise would not if the price cycles were shorter.
In Perth the increase in the difference between average unweighted and volume-weighted GIRDs per price cycle may indicate that consumers are taking greater advantage of the relatively cheaper days in the price cycle now that they are regularly of seven days duration.
10.8 Price cycle increases and public holidaysIt is often claimed that retail petrol prices always increase before public holidays, and in particular long weekends. These price increases are not surprising given the regularity of petrol price cycle increases in the five largest cities. It is also often claimed that the price increases before public holidays are always higher than the price cycle increases when there is no public holiday.
The 2012 ACCC petrol monitoring report examined petrol price increases before public holidays in each of the five largest cities for the period January 2007 to June 2012. It found that during this period the average price cycle increase before public holidays was equal to or above the annual average price cycle increase less than half (48 per cent) of the time.138
As noted in section 10.3 there are three main influences on the size of price cycle increases: changes in wholesale prices, the extent of discounting before the price cycle increase and the overall price level. These factors are not influenced by the timing of public holidays.
In this monitoring report the analysis of price cycle increases has been updated to cover the five-year period July 2008 to June 2013. Over that period the price cycle increase before a public holiday was compared with the relevant yearly average price cycle increase (or half yearly in the case of 2008 and 2013). The results are shown in table 10.8. Charts showing price cycle increases and public holidays in the five largest cities in 2012−13 are provided in appendix G.
138 See ACCC, Monitoring of the Australian petroleum industry, December 2012, pp. 159–160.
152 Monitoring of the Australian petroleum industry December 2013

Table 10.8 shows that during this period the price cycle increases before public holidays were equal to or above the yearly average price cycle increase less than half (48 per cent) of the time.139
Table 10.8 Number (and percentage) of price cycle increases before public holidays for the five largest cities: July 2008 to June 2013
Total Greater than or equal to calendar year average
Less than calendar year average
Less than calendar year maximum
Sydney 33 16 (48%) 17 (52%) 33 (100%)
Melbourne 34 11 (32%) 23 (68%) 33 (97%)
Brisbane 33 18 (55%) 15 (45%) 32 (97%)
Adelaide 37 24 (65%) 13 (35%) 36 (97%)
Perth 33 13 (39%) 20 (61%) 32 (97%)
Total 170 82 (48%) 88 (52%) 166 (98%)
Source: ACCC analysis based on Informed Sources data.
The table shows that in the five years to June 2013:
• in total, a majority of price cycles before public holidays had smaller price increases than the calendar year average price cycle increase
• in Sydney, Melbourne and Perth, price cycle increases before public holidays were below the calendar year average price cycle increase more than half of the time
• in Brisbane and Adelaide, price cycle increases before public holidays were below the calendar year average price cycle increase less than half of the time
• in all cities except Sydney, there was one occasion when the price cycle increase before a public holiday was the highest price cycle increase for the year—in Sydney there were none.
The results from this analysis are consistent with the conclusions from previous ACCC petrol monitoring reports and show that there is little evidence to support the claim that price cycle increases before public holidays are always higher than the price cycle increases when there is no public holiday. Furthermore, there is little evidence that public holidays affect the timing of price cycle increases in any city.
139 In the eastern capital cities a price cycle increase before a public holiday has been defined as having occurred within the week up to and including the day of the public holiday in the years 2008 to 2010, and within two weeks from 2011. In Perth a price cycle increase before a public holiday has been defined as having occurred within two weeks up to and including the day of the public holiday prior to 2009 and within one week subsequently. The change to the methodology reflects the increasing duration of price cycles in the eastern capital cities since late 2010 and a decreasing duration in Perth since 2009. The price increase before (or on) the New Year’s Day public holiday is compared with the average price cycle increase for the previous year. This is because the price increase usually occurs in the last week of the previous year.
Monitoring of the Australian petroleum industry December 2013 153

154 Monitoring of the Australian petroleum industry December 2013

11 Financial performance of the consolidated downstream petroleum industry
Key points• Profits for the Australian downstream petroleum industry across all products and services
increased by 86 per cent in real terms to $775 million or 0.86 cents per litre (cpl) during 2012−13.
– This compares with a real net profit of $418 million or 0.47 cpl in 2011−12.
• The industry sold 90 billion litres of fuel products in 2012−13, earning $80 billion in revenue. – This compares with sale volumes of 89.6 billion litres of fuel and revenues of $81.0 billion in real terms in 2011−12
• Since the Global Financial Crisis (GFC) in 2007−08, the financial performance of the downstream petroleum industry has been affected by lower and more variable profits in the refinery and total supply sectors.
– These sectors have the greatest exposure to international factors: volatility in international prices of crude oil and refined petrol, movements in the exchange rate and competition from overseas refineries.
• In contrast, net profits in the wholesale and retail sectors have been higher and more consistent since the GFC.
• In 2012−13 petrol products (that is, RULP, PULP and EBP) recorded a profit of $1010 million, compared with a real loss of $9.7 million in 2011−12.
11.1 IntroductionThis chapter presents the consolidated financial results (revenues, costs and profits) for 2012−13 of monitored firms in the Australian downstream petroleum industry.
The downstream petroleum industry is involved in the following activities: converting crude oil into refined automotive petrol and other products; distributing refined products to the wholesale/commercial sector; on-selling refined fuel to the public; and selling products at convenience stores (attached to retail sites).
An analysis of the financial performances of individual sectors, including the total supply (refinery, imports and buy-sell transactions), wholesale and retail sectors, is presented in chapter 12.
For the purposes of analysing the financial results of monitored firms’ operating performance, earnings before interest and taxes (EBIT) is used as a measure of net profits. EBIT excludes the effects of decisions taken about how firms’ activities are financed and focuses on operating results. EBIT is further adjusted to exclude costs and revenues associated with activities that are one-off and not part of firms’ normal business operations. Adjusted EBIT excludes refinery impairment costs associated with a write-down of refinery asset values. During 2012−13 Shell had an impairment expense of $203 million on its Geelong refinery.140 Impairment charges had a particularly significant
140 Chambers, M. (2013), ‘Geelong writedown hits Shell for $203m’, in The Australian, 4 June
Monitoring of the Australian petroleum industry December 2013 155

impact on 2011−12 results when Caltex and Shell had combined impairment expenses of around $2.14 billion.141
The major product categories for which financial data is presented are:
• petrol products, that is, regular unleaded (RULP), premium unleaded (PULP) and ethanol blended petrol (EBP)
• petroleum products, that is, petrol products plus diesel and automotive LPG
• all fuel products, that is, petrol products, petroleum products plus lubricants and other fuels
• all products and services, that is, all fuel products and retail convenience store sales.
While the level of analysis does not systematically extend beyond the above product categories, where relevant for the analysis of the broader results, data may also be presented for individual products, such as RULP, PULP and diesel.
Due to adjustments made for inter-sector transactions by integrated companies, combined sectorial and product groups’ financial results may not be comparable with estimates for the consolidated performance of the entire downstream industry. Financial data is presented in real terms with 2012−13 as the base year. Section 11.7 provides details of the ACCC’s data collection process and methodology.
11.2 Overview of the financial performance of the downstream petroleum industry
Table 11.1 shows sales volumes, revenues and net profits for the total downstream industry, for all products and services, for petrol products, that is, for regular unleaded (RULP), premium unleaded (PULP) and ethanol blended petrol (EBP), and for diesel.
The key observations on financial outcomes for all products and services in the entire downstream petroleum industry for 2012−13 include:
• total revenue was $79.9 billion, which was 1.4 per cent lower than 2011−12 in real terms (however, in nominal terms total revenue increased 0.82 per cent on 2011−12).
• total sales volumes were 90.3 billion litres, 0.79 per cent higher than 2011−12.
• total net profits (adjusted EBIT) for the industry increased by 85.6 per cent in real terms to $775 million relative to 2011−12 (this represented an 89.9 per cent increase in nominal terms).
• unit net profits were 0.86 cents per litre (cpl), a real increase of 84.2 per cent (or a 88.4 per cent nominal increase) on the previous year.
Key observations on revenues, costs and profits associated with petrol products, for 2012−13 include:
• total revenue on petrol products was $32.7 billion, a real decrease of 1.7 per cent from the previous year (or a 0.6 per cent nominal increase).
• total sales volumes of petrol products were 37.2 billion litres representing a decrease of 0.7 per cent on the previous year.
• net profits on petrol products for the industry increased to $1010 million up from a real loss of $9.7 million in 2011−12 (the nominal loss in 2011−12 was $9.5 million). Unit net petrol profits were 2.72 cpl in 2012−13.
141 Caltex (2012), 2011 Preliminary Final Report, Results for announcement to the market, 27 February, http://www.caltex.com.au/Media%20Items/ASX%20Announcement%20 – %202011%20Preliminary%20Final%20Report%20and%202011%20Financial%20Report.pdf. See also Chambers, M (2012), ‘Shell units shed $495 million after huge refinery write-down’, in The Australian, 11 May
156 Monitoring of the Australian petroleum industry December 2013

Table 11.1 Sale volumes, revenues and net profits in the downstream petroleum industry in real terms: 2012−13 and average for 2002−03 to 2012−13
2012−13 2002−03 to 2012−13 average in real terms
All products and services Sale volumes (ML) 90 291 80 868
Total revenue ($ million) 79 892 64 421
EBIT ($ million) 775 1 616
Unit EBIT (cpl) 0.86 2.00
Petrol products(RULP, PULP and EBP)
Sales volumes (ML) 37 154 36 390
Total revenue ($ million) 32 687 28 186
EBIT ($ million) 1 010 648
Unit EBIT (cpl) 2.72 1.78
Diesel Sales volumes (ML) 36 384 28 030
Total revenue ($ million) 30 974 22 301
EBIT ($ million) 213 697
Unit EBIT (cpl) 0.58 2.49
Sources: ACCC calculations based on data obtained from firms monitored through the ACCC’s monitoring process; Australian Bureau of Statistics (ABS), 6401.0 Consumer Price Index, Australia, Table 1. CPI: All Groups, Index Numbers and Percentage Changes.
Note: Real values in 2012−13 dollars.
Other significant product contributions to overall downstream industry results for 2012−13 included:
• PULP with $804 million in adjusted EBIT in 2012−13, a real increase of 269 per cent (or a 278 per cent nominal increase) on the previous year.
• RULP with a net profit of $171 million compared with a real loss of $170.3 million on the previous year (or a nominal loss of $166.5 million).
Monitoring of the Australian petroleum industry December 2013 157

11.3 Revenues, costs and profits in the downstream industry: all products
11.3.1 Revenuesandcosts,allproductsChart 11.1 shows total revenues and costs for all products and services in the downstream petroleum industry for the period 2002−03 to 2012−13.
Chart 11.1 Downstream industry revenues and costs in real terms, all products and services: 2002−03 to 2012−13
0
10
20
30
40
50
60
70
80
90
2012–132011–122010–112009–102008–092007–082006–072005–062004–052003–042002–03
$ billion
Downstream costsDownstream revenue
Sources: ACCC calculations based on data obtained from firms monitored through the ACCC’s monitoring process; ABS, 6401.0 Consumer Price Index, Australia, Table 1. CPI: All Groups, Index Numbers and Percentage Changes.
Note: Included in total costs are all expenses including impairment, amortisation and profit or loss on the sale of assets. These items are excluded from net profit calculations.
Real values in 2012−13 dollars.
Key observations on total industry revenue and costs for 2012−13 include:
• total revenues and costs were around $79.9 billion and $79.7 billion respectively.
• revenues were 1.4 per cent lower in real terms than 2011−12 (however, in nominal terms revenues were 0.82 per cent higher), while costs were 3.9 per cent lower than the previous year in real terms (or 1.8 per cent lower in nominal terms).
• unit revenues for 2012−13 were 88.5 cpl, which was 2.2 per cent lower than 2011−12 in real terms (or 0.02 per cent lower in nominal terms). Unit costs were 88.2 cpl, which was 4.7 per cent lower than 2011−12 in real terms (and 2.5 per cent lower in nominal terms).
• since 2002−03, revenue has increased by 209 per cent in nominal terms. However, when adjusted for inflation over that period, the real increase in revenue since 2002−03 has been 136 per cent. This largely reflects higher international fuel prices.
158 Monitoring of the Australian petroleum industry December 2013

11.3.2 Totalandunitnetprofits,allproductsandservices
Total net profits
Chart 11.2 shows adjusted EBIT for all products and services in the entire downstream industry from 2002−03 to 2012−13.
Chart 11.2 Downstream industry net profit in real terms, all products and services: 2002−03 to 2012−13
-1.5
-1.0
-0.5
0.0
0.5
1.0
1.5
2.0
2.5
3.0
3.5
4.0
2012–132011–122010–112009–102008–092007–082006–072005–062004–052003–042002–03
$ billion
Average: 2002–03 to 2012–13
Sources: ACCC calculations based on data obtained from firms monitored through the ACCC’s monitoring process; ABS, 6401.0 Consumer Price Index, Australia, Table 1. CPI: All Groups, Index Numbers and Percentage Changes.
Note: Real values in 2012−13 dollars.
Key observations on total industry net profit for 2012−13 include:
• adjusted EBIT for the entire downstream petroleum industry was $775 million, representing a real increase of 85.6 per cent (and an 89.9 per cent nominal increase) on profits earned in 2011−12142
• the higher profits for 2012−13 compared with 2011−12 in part reflected lower losses in the refinery sector: net losses on refinery operations were $107 million in 2012−13 compared with real net losses of $609 million (or nominal losses of $596 million) in the previous year
• the refiner-wholesalers contributed $252 million (32.5 per cent) of profits to the downstream industry’s 2012−13 profits—after contributing no profits in 2011−12 when they recorded a real loss of $3.4 million (or a nominal loss of $3.3 million). Businesses which only operate in the retail sector continued to contribute the largest share of total net profits with 52.3 per cent of total industry profits
• since 2002−03, average annual net profit in nominal terms was $1.39 billion, while real net profits have averaged $1.62 billion per annum.
Unit net profit
Unit net profit is expressed in terms of cents per litre and is derived by dividing total net profit by total volume.143 Key observations on unit net profit for the downstream industry for 2012−13 include:
• average unit net profit was 0.86 cpl in 2012−13, up from 2011−12 when real unit net profit was 0.47 cpl (and 0.46 cpl in nominal terms)
142 Note that the overall industry result for 2012−13 including impairment charges is a net profit of $452 million.
143 Total industry volume is derived after the elimination of intra-company transfers.
Monitoring of the Australian petroleum industry December 2013 159
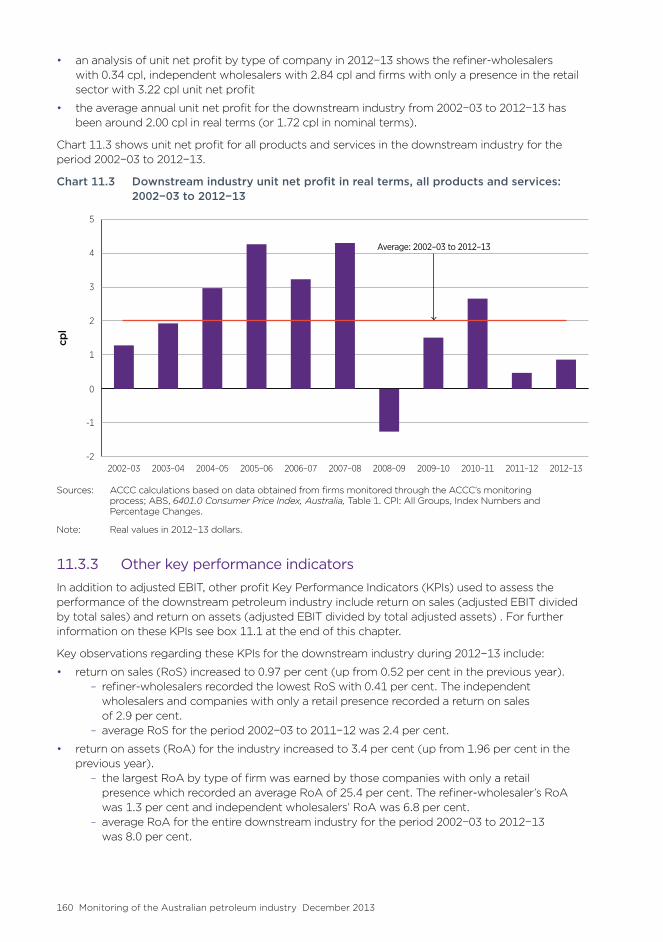
• an analysis of unit net profit by type of company in 2012−13 shows the refiner-wholesalers with 0.34 cpl, independent wholesalers with 2.84 cpl and firms with only a presence in the retail sector with 3.22 cpl unit net profit
• the average annual unit net profit for the downstream industry from 2002−03 to 2012−13 has been around 2.00 cpl in real terms (or 1.72 cpl in nominal terms).
Chart 11.3 shows unit net profit for all products and services in the downstream industry for the period 2002−03 to 2012−13.
Chart 11.3 Downstream industry unit net profit in real terms, all products and services: 2002−03 to 2012−13
-2
-1
0
1
2
3
4
5
2012–132011–122010–112009–102008–092007–082006–072005–062004–052003–042002–03
cpl
Average: 2002–03 to 2012–13
Sources: ACCC calculations based on data obtained from firms monitored through the ACCC’s monitoring process; ABS, 6401.0 Consumer Price Index, Australia, Table 1. CPI: All Groups, Index Numbers and Percentage Changes.
Note: Real values in 2012−13 dollars.
11.3.3 OtherkeyperformanceindicatorsIn addition to adjusted EBIT, other profit Key Performance Indicators (KPIs) used to assess the performance of the downstream petroleum industry include return on sales (adjusted EBIT divided by total sales) and return on assets (adjusted EBIT divided by total adjusted assets) . For further information on these KPIs see box 11.1 at the end of this chapter.
Key observations regarding these KPIs for the downstream industry during 2012−13 include:
• return on sales (RoS) increased to 0.97 per cent (up from 0.52 per cent in the previous year). – refiner-wholesalers recorded the lowest RoS with 0.41 per cent. The independent wholesalers and companies with only a retail presence recorded a return on sales of 2.9 per cent.
– average RoS for the period 2002−03 to 2011−12 was 2.4 per cent.
• return on assets (RoA) for the industry increased to 3.4 per cent (up from 1.96 per cent in the previous year).
– the largest RoA by type of firm was earned by those companies with only a retail presence which recorded an average RoA of 25.4 per cent. The refiner-wholesaler’s RoA was 1.3 per cent and independent wholesalers’ RoA was 6.8 per cent.
– average RoA for the entire downstream industry for the period 2002−03 to 2012−13 was 8.0 per cent.
160 Monitoring of the Australian petroleum industry December 2013

Chart 11.4 shows average RoS and RoA for the period 2002−03 to 2012−13.
Chart 11.4 Downstream industry return on sales and return on assets, all products and services: 2002−03 to 2012−13
-10
-5
0
5
10
15
20
2012–132011–122010–112009–102008–092007–082006–072005–062004–052003–042002–03
per cen
t
RoARoS
Source: ACCC analysis based on data obtained from firms monitored through the ACCC’s monitoring process.
11.4 Revenues, costs and profits in the downstream industry: petrol products
This section assesses financial results on petrol products for the downstream petroleum industry. As noted, petrol products are RULP, PULP and EBP.
The methodology used to allocate expenses and estimate individual product profits is discussed in section 11.7.4.
11.4.1 Revenuesandcosts,petrolproductsKey observations on total industry revenue and costs relating to petrol products include:
• total revenue on petrol products decreased by 1.7 per cent in real terms (and increased by 0.6 per cent in nominal terms) in 2012−13 to $32.7 billion, while total costs decreased by 7.2 per cent in real terms (and by 5.1 per cent in nominal terms) to $31.8 billion.
• the decrease in total costs in part reflected a real decrease in refiner-wholesalers’ costs of 9.9 per cent (or a nominal decrease of 7.9 per cent).
• while aggregate petrol product revenues during 2012−13 decreased slightly from 2011−12, there were material differences in performance by individual fuel types:
– RULP revenues decreased by 4.4 per cent in real terms (and 2.2 per cent in nominal terms) compared with 2011−12
– EBP revenues had a real decrease of 6.0 per cent (and a nominal decrease of 3.9 per cent) from 2011−12
– in contrast, PULP revenues increased by 6.7 per cent in real terms (and 9.1 per cent in nominal terms) compared with 2011−12.
Monitoring of the Australian petroleum industry December 2013 161

11.4.2 Totalandunitnetprofits,petrolproducts
Total net profits
Chart 11.5 shows total net profits on petrol products for the years 2002−03 to 2012−13. Key observations on industry petrol profits include:
• petrol products recorded a net profit of $1010 million in 2012−13, after incurring a real net loss of $9.7 million (and a nominal net loss of $9.5 million) in 2011−12.
• the average annual petrol profit over the time series has been around $648 million in real terms (or $563 million in nominal terms).
Chart 11.5 Downstream industry net profit in real terms, petrol products: 2002−03 to 2012−13
-1000
-500
0
500
1000
1500
2012–132011–122010–112009–102008–092007–082006–072005–062004–052003–042002–03
$ million
Average: 2002–03 to 2012–13
Sources: ACCC calculations based on data obtained from firms monitored through the ACCC’s monitoring process; ABS, 6401.0 Consumer Price Index, Australia, Table 1. CPI: All Groups, Index Numbers and Percentage Changes.
Note: Real values in 2012−13 dollars.
Unit net profit
Chart 11.6 shows unit net profit for petrol products for the period 2002−03 to 2012−13. Key observations from the chart include:
• unit net profit for petrol products in the downstream industry was 2.72 cpl in 2012−13, compared with a real and nominal unit net loss of 0.03 cpl in 2011−12.
• average annual unit net profit for petrol products over the time series has been estimated to be around 1.78 cpl in real terms (or 1.55 cpl in nominal terms).
162 Monitoring of the Australian petroleum industry December 2013

Chart 11.6 Downstream industry unit net profit, in real terms, petrol products: 2002−03 to 2012−13
-2
-1
0
1
2
3
4
2012–132011–122010–112009–102008–092007–082006–072005–062004–052003–042002–03
cpl
Average: 2002–03 to 2012–13
Sources: ACCC calculations based on data obtained from firms monitored through the ACCC’s monitoring process; ABS, 6401.0 Consumer Price Index, Australia, Table 1. CPI: All Groups, Index Numbers and Percentage Changes.
Note: Real values in 2012−13 dollars.
11.5 Profits by sector: all products This section assesses and compares rates of profitability in each of the sectors in the Australian downstream petroleum industry. These sectors are: total supply (that is refining, imports and buy sell transactions), wholesale and retail. Further detailed financial information on these sectors is presented in chapter 12.
11.5.1 Sectorialnetprofits,allproductsAs not all monitored companies structure their accounts in accordance with the ACCC’s sectorial split, some adjustments are required to companies’ financial data before it is submitted to the ACCC. This may mean that internal allocations and accounting arrangements (especially for the integrated firms) can affect the profit results of individual sectors.
Total net profit by sector is shown in chart 11.7. Key observations from the chart include:
• during 2012−13, the wholesale sector earned net profits of $863 million. The result for 2012−13 represents a real decrease of 22.2 per cent (and a nominal decrease of 20.4 per cent) from net profits earned in 2011−12. However, the wholesale sector has been the most profitable sector of the Australian downstream industry in each of the past five financial years.
• the retail sector earned $535 million during 2012−13, up 18.9 per cent in real terms (and 21.6 per cent in nominal terms) from 2011−12.
• the refinery sector recorded a net loss of $107 million during 2012−13, representing a real improvement of $503 million (and a nominal improvement of $489 million) on the loss recorded in 2011−12. Over the past 11 years the financial performance of the refinery sector can be considered in terms of two distinct phases anchored around the GFC: the six years leading up to the GFC were profitable but the five years since the GFC have been largely characterised by losses. Average annual profits in the refinery sector prior to the GFC were $1346 million in real terms (and $1119 million in nominal terms), while since the GFC the refinery sector has incurred average annual losses of $153 million in real terms (and $146 million in nominal terms).
Monitoring of the Australian petroleum industry December 2013 163

• an inter-sectorial analysis over the entire time series shows that the wholesale sector has had the highest average annual profit in real terms of $812 million (or $725 million in nominal terms). The refinery sector has been, on average, the second most profitable sector with $665 million real average annual profits (and $544 million nominal annual profits). However, as noted, this average profit for the refinery sector is not necessarily representative of individual annual performances over the course of the time series.
Chart 11.7 Downstream industry net profits by sector in real terms, all products: 2002−03 to 2012−13
-3.0
-2.0
-1.0
0
1.0
2.0
3.0
2012–132011–122010–112009–102008–092007–082006–072005–062004–052003–042002–03
$ billion
2.5
1.5
0.5
-0.5
-1.5
-2.5
RetailWholesaleRefiningTotal supply
Sources: ACCC calculations based on data obtained from firms monitored through the ACCC’s monitoring process; ABS, 6401.0 Consumer Price Index, Australia, Table 1. CPI: All Groups, Index Numbers and Percentage Changes.
Note: Refinery is a sub-sector of total supply.
Real values in 2012−13 dollars.
11.6 Profits by sector: petrol productsThis section analyses financial performance on petrol products alone in each sector of the downstream industry. Further detailed financial information on petrol products is presented in chapter 12.
11.6.1 Sectorialnetprofits,petrolproductsChart 11.8 displays sectorial net profits on petrol products. Key observations from the chart include:
• the retail sector recorded the largest net profit from petrol products with $297.5 million, up 21.8 per cent in real terms (and 24.6 per cent in nominal terms) from 2011−12.
• the total supply sector had the second largest net profit from petrol products with $503 million during 2012−13, compared with a real loss of $416 million (or $407 million in nominal terms) in 2011−12.
164 Monitoring of the Australian petroleum industry December 2013

Chart 11.8 Downstream industry, net profits by sector in real terms, petrol products: 2002−03 to 2012−13
-1000
-500
0
500
1000
1500
2012–132011–122010–112009–102008–092007–082006–072005–062004–052003–042002–03
$ million
RetailWholesaleRefineryTotal supply
Sources: ACCC calculations based on data obtained from firms monitored through the ACCC’s monitoring process; ABS, 6401.0 Consumer Price Index, Australia, Table 1. CPI: All Groups, Index Numbers and Percentage Changes.
Note: Refinery is a sub-sector of total supply.
Real values in 2012−13 dollars.
11.7 Methodology note for assessing profitability in the Australian downstream petroleum industry
11.7.1 DatavariabilityMonitoring of the Australian downstream petroleum industry over the last six years has shown that the financial performance of the industry, particularly at the refinery and total supply levels is affected by many factors and can be volatile. Financial performance can also be affected by one-off events.
The operating performance of the downstream petroleum industry is affected by the behaviour of prices of its key inputs and outputs, that is, crude oil and refined petrol products. Crude oil and refined petrol are globally traded commodities and their prices are subject to considerable volatility. As transactions for these commodities are undertaken in USD, changes in the USD–AUD exchange rate can also affect financial outcomes expressed in Australian currency.
At any one time the refinery production and distribution process may involve significant holdings of inventories of both crude and refined products. Changes in commodity prices and the USD–AUD exchange rate can impact on the values of inventory holdings.
The effects of changes in the values of inventory holdings and foreign exchange transactions are reflected in the adjusted EBIT data. Only the effects of foreign exchange transactions are reported separately to the ACCC as part of the monitoring of the total supply sector, which is the sector with the greatest exposure to foreign currency fluctuations.
Monitoring of the Australian petroleum industry December 2013 165

Financial performance can also be affected by one-off events such as impairment charges resulting from re-assessments of assets’ future earnings potential. These costs have been reported separately to the ACCC but as they are not associated with monitored firms’ normal business operations they have been excluded from the calculation of adjusted EBIT.
11.7.2 DatacollectionprocessData presented in all financial chapters was collected from monitored firms through financial data templates established in consultation with the companies. The templates are comprehensive and collect data on revenues and cost of goods sold by product. Monitored companies include: the four refiner-wholesalers, Mobil, Caltex, BP and Shell; independent wholesalers including Neumann Petroleum, United Petroleum, Ausfuel and Liberty Oil; and retailers including 7-Eleven, On the Run, Coles Express and Woolworths Petrol.
11.7.3 Datacollectionmethodology
Historical and replacement cost measures
Data collected from monitored companies is on a historical cost basis (as was the case for the past five ACCC petrol monitoring reports). Historical cost accounting records all revenues, costs and profits at the actual or original cost of the transaction. With rising oil prices this can mean companies can earn profits simply because of the fact that prices may rise between the time that product was purchased and when it is sold.
Replacement cost on the other hand is a popular measure used in the oil industry by those participants who usually have a refinery operation. This measure excludes the impact of changes in the price of oil and refined products which are seen as external factors impacting profits outside the control of management. The ACCC collects data based on historical costs for a number of reasons. These include the fact that not all monitored companies report on a replacement cost basis, historical cost accounting is consistent with Australian standards, and finally, it allows the ACCC to compare monitored companies with other Australian and overseas industries.
Long-term perspective in data collection
As noted, crude oil and petroleum prices have traditionally been volatile. As data is collected on a historical cost basis, reported profits can produce large movements in time of substantial price changes. Because of this volatility, the ACCC have collected financial data going back to the 2002−03 financial year so as to provide a long term perspective. In a number of charts, the ACCC have averaged the KPI over this time series so as to smooth out the historical cost profits.
11.7.4 EstimationofprofitsbysectorandproductorservicetypeMany costs in the petroleum industry are shared or common among different products. This means that estimating profits by product requires some estimation of individual product costs. The methodology the ACCC has adopted to allocate common costs in the 2013 monitoring report is consistent with that used in previous monitoring reports. Product volumes have been used as a proxy for splitting common costs. The assumption is that costs indirectly associated with refining or selling petrol and other products tend to be proportional to the volumes of these products. This methodology has also been used in respect of the total supply (including refining) and wholesale sectors.
The allocation of costs in the retail sector differs slightly due to the convenience store activities. In the retail sector, common costs are first allocated on the basis of gross profit on petroleum sales and on convenience sales. Costs estimated for petroleum product activities are then further allocated to individual products on the basis of their respective sales volumes.
Many of the firms monitored by the ACCC have operations in more than one of the sectors of the downstream petroleum industry. Some companies are integrated through all sectors. Transactions across sectors within integrated companies can potentially distort the consolidated net results
166 Monitoring of the Australian petroleum industry December 2013

for the entire downstream industry. Due to adjustments made for inter-sector transactions by integrated companies, combined sectorial and product groups’ financial results may not be comparable with estimates for the consolidated performance of the entire downstream industry.
11.7.5 Keyperformanceindicatorsforassessingtheprofitabilityandperformanceofthedownstreampetroleumindustry
Box 11.1 Key performance indicators
Gross profit Gross profit is a measure of profit calculated by deducting the costs of goods or services sold from sales revenues.
Gross margin Gross margin is the ratio of gross profit to sales and indicates how much is left from each dollar of sales after costs of goods sold have been subtracted.
Adjusted EBIT (net profit) EBIT is a common accounting measure of profit and measures the total returns to the firm before interest incomes or expenses and taxes are taken into account. The ACCC uses an adjusted EBIT profit measure. Adjusted EBIT excludes non-operating incomes, amortisation, impairment charges, and profits or losses on sales of fixed assets.
Adjusted EBIT to sales (return on sales)
The ratio of adjusted EBIT relative to sales revenue calculates the extent to which profit is earned from each dollar of revenue after deducting all relevant operating costs, other than interest and tax.
Return on adjusted total assets (return on assets)
The ratio of adjusted EBIT to total assets calculates the extent to which profit is earned relative to assets used in the business. Total assets have been adjusted to exclude deferred tax assets as they are not relevant to an after-tax profit assessment. Intangibles are excluded since those values have not been consistently provided by the monitored companies, and usually arise from the acquisition of other companies (as opposed to growth solely by increasing sales). It is expressed as a percentage of total assets.
Monitoring of the Australian petroleum industry December 2013 167

168 Monitoring of the Australian petroleum industry December 2013

12 Financial performance of the refinery, total supply, wholesale and retail sectors
Key pointsRefining• During 2012−13, the Australian refinery sector recorded a net loss of $106.8 million, or
0.30 cents per litre (cpl) on the sale of all products.
• The refining sector’s total revenue for 2012−13 was $27.2 billion earned on sales of 35.1 billion litres.
• Petrol products (that is, RULP, PULP and EBP) recorded a net profit of $126 million in the refinery sector, compared with a loss of $148 million in real terms in 2011−12 ($145 million nominal).
Total supply• The total supply sector recorded a net loss of $623 million during 2012−13, or 0.86 cpl on all
products.
• The total supply sector’s total revenue for 2012−13 was $57.3 billion earned on sales of 72.7 billion litres.
• Petrol products recorded a net profit of $502.8 million in 2012−13, compared to a loss of $416.2 million in real terms in 2011−12 ($407 million nominal).
Wholesale• During 2012−13, the wholesale sector recorded a net profit of $863 million, or 1.65 cpl on
total revenue of $45 billion and total sales volumes of 52.4 billion litres.
• Profits for petrol products were $209.6 million, up 29.1 per cent on 2011−12 in real terms (32.0 per cent nominal increase).
• Other products, including lubricants and oils, were the largest contributor to total wholesale net profits earning $523.3 million in 2012−13.
Retail• The retail sector recorded a net profit of $534.9 million during 2012−13, or 2.92 cpl, on total
revenue of $20 billion and total fuel (that is, petrol products, diesel, automotive LPG and other fuels and lubricants) volumes of 18.3 billion litres.
• Profits from petrol products were $297.5 million, up 21.8 per cent from 2011−12 (24.6 per cent nominal increase).
• Convenience store sales earned a total net profit of $205.2 million, up 17.1 per cent on 2011−12 profits in real terms (19.7 per cent nominal increase). This profit was earned on total revenues of $3.2 billion, up 2.9 per cent on 2011−12 in real terms (5.2 per cent in nominal terms).
Monitoring of the Australian petroleum industry December 2013 169

12.1 IntroductionThis chapter considers the financial performance of each of the sectors of the Australian downstream petroleum industry: the refinery, total supply, wholesale and retail sectors of the downstream petroleum industry for the year ended 30 June 2013.
The refinery sector as at 30 June 2013 consisted of six refineries operated by the refiner-wholesalers BP, Caltex, Mobil and Shell in all mainland state capitals except Adelaide. For the purposes of financial reporting and monitoring, the refinery sector is considered a sub sector of total supply. The total supply sector includes refining, importing and buy-sell transactions among the refiner-wholesalers.
The wholesale sector is comprised of the four refiner-wholesalers and a number of independent wholesalers who either source petroleum products locally from one of the refiner-wholesalers or other wholesalers or through direct imports. Companies from which wholesale financial data has been collected for this monitoring report include the four refiner-wholesalers, Liberty, Ausfuel, Neumann and United. The refiner-wholesalers account for the majority of total wholesale sales.
The Australian retail sector is comprised of the retail operations of refiner-marketers, the supermarkets, some independent wholesalers, a number of large independent retailers and a large number of smaller independent owner operators.144 For the purposes of this monitoring report, financial data is presented in respect of the retail operations of Caltex, BP, Coles, Woolworths, United, Neumann, Ausfuel, 7-Eleven and On the Run. Mobil no longer operates in the retail sector while Shell has a small number of re-fueller sites that also sell to the public.145
As with the approach in chapter 11, earnings before interest and taxes (EBIT) is used as a measure of net profits. Where there are costs and revenues associated with activities that are one-off and not part of firms’ normal business operations, these are excluded from adjusted EBIT. For example, adjusted EBIT excludes refinery impairment costs associated with a write-down of refinery asset values.
The major product categories for which financial data is presented are:
• petrol products, that is, regular unleaded (RULP), premium unleaded (PULP) and ethanol blended petrol (EBP)
• petroleum products, that is, petrol products plus diesel and automotive LPG
• all fuel products, that is, petrol products, petroleum products plus lubricants and other fuels
• all products and services, that is, all fuel products and retail convenience store sales.
While the level of analysis does not systematically extend beyond the above product categories, where relevant for the analysis of broader results, data may also be presented for individual products, such as RULP and PULP and diesel.
Financial data is presented in real terms with 2012−13 as the base year.
144 Note that the smaller independent owner operators are excluded from the scope of monitored firms operating in the retail sector.
145 These Shell sites are not included in the monitoring of the retail sector.
170 Monitoring of the Australian petroleum industry December 2013

12.2 Overview of financial performance in the refinery, total supply, wholesale and retail sectors
Table 12.1 displays key observations on revenues, costs and profits in the refinery, total supply, wholesale and retail sectors for 2012−13.
Table 12.1 Sales, volumes and profits in the refinery, total supply, wholesale and retail sectors in real terms: 2012−13 and average from 2002−03 to 2012−13
2012−13 2002−03 to 2012−13 average in real terms
Refinery sector
All products
Sale volumes (ML) 35 138 37 673
EBIT ($ million) -107 665
Unit EBIT (cpl) -0.30 1.76
Petrol
Sales volumes (ML) 15 020 16 053
EBIT ($ million) 126 426
Unit EBIT (cpl) 0.84 2.65
Diesel
Sales volumes (ML) 12 006 12 039
EBIT ($ million) 197 511
Unit EBIT (cpl) 1.64 4.25
Total supply sector
All products
Sale volumes (ML) 72 701 66 824
EBIT ($ million) -623 542
Unit EBIT (cpl) -0.86 0.81
Petrol
Sales volumes (ML) 25 568 26 549
EBIT ($ million) 503 482
Unit EBIT (cpl) 1.97 1.82
Diesel
Sales volumes (ML) 31 964 25 423
EBIT ($ million) 61 480
Unit EBIT (cpl) 0.19 1.89
Wholesale sector
All products
Sale volumes (ML) 52 418 47 537
EBIT ($ million) 863 812
Unit EBIT (cpl) 1.65 1.71
Petrol
Sales volumes (ML) 18 302 19 039
EBIT ($ million) 210 55
Unit EBIT (cpl) 1.15 0.29
Diesel
Sales volumes (ML) 23 325 18 345
EBIT ($ million) 65 162
Unit EBIT (cpl) 0.28 0.88
Monitoring of the Australian petroleum industry December 2013 171

2012−13 2002−03 to 2012−13 average in real terms
Retail sector
All products and services
Sale volumes (ML) 18 294 14 723
EBIT ($ million) 535 262
Unit EBIT (cpl) 2.92 1.78
Petrol
Sales volumes (ML) 12 621 10 753
EBIT ($ million) 297 111
Unit EBIT (cpl) 2.36 1.03
Diesel
Sales volumes (ML) 4 538 2 721
EBIT ($ million) 87 55
Unit EBIT (cpl) 1.91 2.03
Sources: ACCC calculations based on data obtained from firms monitored through the ACCC’s monitoring process; Australian Bureau of Statistics (ABS), 6401.0 Consumer Price Index, Australia, Table 1. CPI: All Groups, Index Numbers and Percentage Changes.
Note: Real values in 2012−13 dollars.
12.3 Refinery sector: revenues, costs and profits for all products
12.3.1 Refinerysector:revenuesandcosts,allproductsChart 12.1 shows the total revenues and costs for all refineries in Australia.
Chart 12.1 Refinery sector revenues and costs in real terms, all products: 2002−03 to 2012−13
0
5
10
15
20
25
30
35
2012–132011–122010–112009–102008–092007–082006–072005–062004–052003–042002–03
$ billion
Refining costs Refining revenue
Sources: ACCC calculations based on data obtained from firms monitored through the ACCC’s monitoring process; ABS, 6401.0 Consumer Price Index, Australia, Table 1. CPI: All Groups, Index Numbers and Percentage Changes.
Notes: Refining costs include impairment expenses for the years 2010−11, 2011−12 and 2012−13.
Real values in 2012−13 dollars.
172 Monitoring of the Australian petroleum industry December 2013
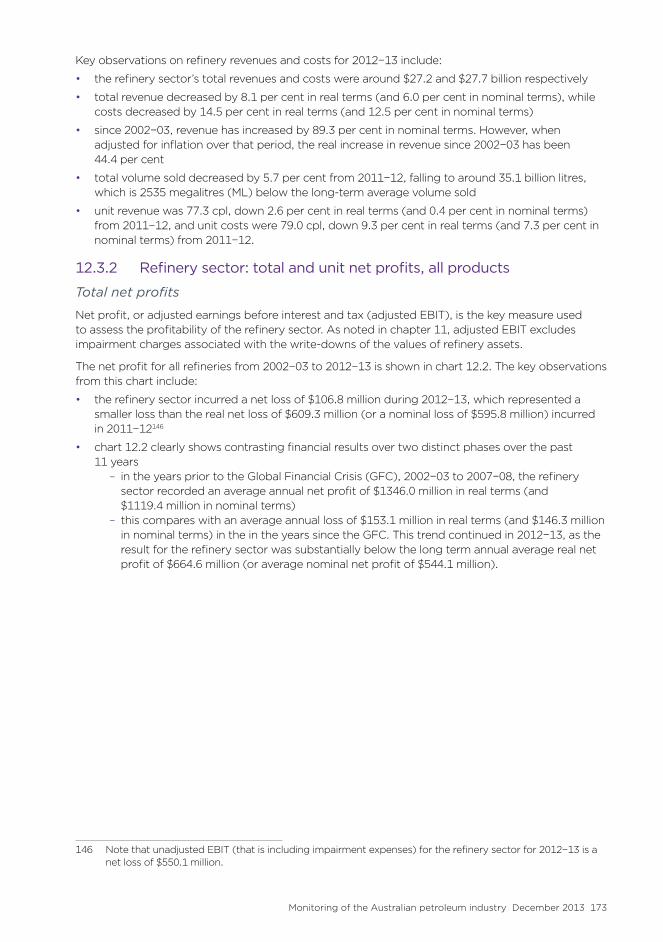
Key observations on refinery revenues and costs for 2012−13 include:
• the refinery sector’s total revenues and costs were around $27.2 and $27.7 billion respectively
• total revenue decreased by 8.1 per cent in real terms (and 6.0 per cent in nominal terms), while costs decreased by 14.5 per cent in real terms (and 12.5 per cent in nominal terms)
• since 2002−03, revenue has increased by 89.3 per cent in nominal terms. However, when adjusted for inflation over that period, the real increase in revenue since 2002−03 has been 44.4 per cent
• total volume sold decreased by 5.7 per cent from 2011−12, falling to around 35.1 billion litres, which is 2535 megalitres (ML) below the long-term average volume sold
• unit revenue was 77.3 cpl, down 2.6 per cent in real terms (and 0.4 per cent in nominal terms) from 2011−12, and unit costs were 79.0 cpl, down 9.3 per cent in real terms (and 7.3 per cent in nominal terms) from 2011−12.
12.3.2 Refinerysector:totalandunitnetprofits,allproducts
Total net profits
Net profit, or adjusted earnings before interest and tax (adjusted EBIT), is the key measure used to assess the profitability of the refinery sector. As noted in chapter 11, adjusted EBIT excludes impairment charges associated with the write-downs of the values of refinery assets.
The net profit for all refineries from 2002−03 to 2012−13 is shown in chart 12.2. The key observations from this chart include:
• the refinery sector incurred a net loss of $106.8 million during 2012−13, which represented a smaller loss than the real net loss of $609.3 million (or a nominal loss of $595.8 million) incurred in 2011−12146
• chart 12.2 clearly shows contrasting financial results over two distinct phases over the past 11 years
– in the years prior to the Global Financial Crisis (GFC), 2002−03 to 2007−08, the refinery sector recorded an average annual net profit of $1346.0 million in real terms (and $1119.4 million in nominal terms)
– this compares with an average annual loss of $153.1 million in real terms (and $146.3 million in nominal terms) in the in the years since the GFC. This trend continued in 2012−13, as the result for the refinery sector was substantially below the long term annual average real net profit of $664.6 million (or average nominal net profit of $544.1 million).
146 Note that unadjusted EBIT (that is including impairment expenses) for the refinery sector for 2012−13 is a net loss of $550.1 million.
Monitoring of the Australian petroleum industry December 2013 173

Chart 12.2 Refinery sector net profit in real terms, all products: 2002−03 to 2012−13
-1000
-500
0
500
1000
1500
2000
2500
2012–132011–122010–112009–102008–092007–082006–072005–062004–052003–042002–03
$ million
Average: 2002–03 to 2007–08
Average: 2008–09 to 2012–13
Sources: ACCC calculations based on data obtained from firms monitored through the ACCC’s monitoring process; ABS, 6401.0 Consumer Price Index, Australia, Table 1. CPI: All Groups, Index Numbers and Percentage Changes.
Note: Real values in 2012−13 dollars.
Accounting data is provided to the ACCC on a historical cost basis. This means that the financial performance of the refinery sector can be affected by movements in international prices and exchange rates. In times of rapidly changing international prices of crude oil/refined petrol and exchange rates, the refinery sector can experience volatility in net earnings owing to the timing differential between the time that crude oil is purchased and the time that refined petrol is sold.
Unit net profit
Unit profits are expressed in cents per litre (cpl) and are calculated by dividing total net profits by total volumes. Unit net profits for the refinery sector are presented in chart 12.3. Key observations from the chart include:
• the refining sector incurred a unit net loss of around 0.30 cpl in 2012−13, compared with a real unit net loss of 1.64 cpl (or a nominal unit net loss of 1.60 cpl) in 2011−12
• over the time series, the average annual real unit net profit was around 1.76 cpl (or an average annual nominal unit net profit of 1.4 cpl)
• as with total net profits, there are two distinct trends for refinery unit net profits – prior to the GFC the average annual unit net profit in the years was 3.45 cpl in real terms (or 2.87 cpl in nominal terms)
– in the years after the GFC the refinery sector incurred an average annual net loss of 0.43 cpl in real terms (or a nominal loss of 0.41 cpl).
174 Monitoring of the Australian petroleum industry December 2013

Chart 12.3 Refinery sector unit net profit in real terms, all products: 2002−03 to 2012−13
-3
-2
-1
0
1
2
3
4
5
6
7
2012–132011–122010–112009–102008–092007–082006–072005–062004–052003–042002–03
cpl
Average: 2002–03 to 2007–08
Average: 2008–09 to 2012–13
Sources: ACCC calculations based on data obtained from firms monitored through the ACCC’s monitoring process ABS, 6401.0 Consumer Price Index, Australia, Table 1. CPI: All Groups, Index Numbers and Percentage Changes.
Note: Real values in 2012−13 dollars.
12.3.3 Refinerysector:otherkeyperformanceindicators,allproductsThis section considers return on sales (RoS), and return on assets (RoA) for the refinery sector. For further details on these KPIs, see section 11.7.5.
The write-down of the value of refinery assets during 2011−12 and 2012−13 has reduced the overall refinery asset base which, all other things equal, will affect the final calculation of the RoA for 2012−13. Chart 12.4 shows RoS and RoA for the period 2002−03 to 2012−13.
Key observations regarding these profit KPIs for the refinery sector during 2012−13 include:
• RoA for the refinery sector was around –2.28 per cent for 2012−13, up from –12.09 per cent in 2011−12
– the average annual RoA for the time series was around 8.79 per cent – pre-GFC RoA averaged around 18.48 per cent, while post-GFC RoA averaged –2.30 per cent
• RoS increased from –2.06 per cent in 2011−12 to –0.39 per cent in 2012−13 – the average RoS for the entire time series was 2.37 per cent – average annual RoS pre-GFC was 5.39 per cent while post-GFC RoS has been 0.57 per cent.
There are a number of caveats concerning the RoA and RoS for this industry, including:
• the RoS is affected by a firm’s cost structure. For example, a firm with high fixed costs will rely on volumes to achieve adequate RoS and will tend to have low rates of RoS
• in the Australian refinery sector, the value of assets is not market-based as refinery assets are not generally traded in a liquid market
• the absence of market-based values for refinery assets complicates comparisons of RoA data with industries where firms’ asset values are market-based
• the absence of market-based values for refinery assets means that RoA may be influenced by asset evaluation methodologies and accounting depreciation rates
• over the past three years, there have been significant write downs of asset values and impairment charges against four refineries
Monitoring of the Australian petroleum industry December 2013 175

• some Australian refineries may have assets with an older age profile than the average for other industries. All else equal, this may have the effect of inflating RoA measures in the downstream petroleum industry relative to other industries.
Chart 12.4 Refinery sector return on sales and return on assets, all products: 2002−03 to 2012−13
-15
-10
-5
0
5
10
15
20
25
30
2012–132011–122010–112009–102008–092007–082006–072005–062004–052003–042002–03
per cen
t
RoARoS
Source: ACCC calculations based on data obtained from firms monitored through the ACCC’s monitoring process.
12.4 Refinery sector: revenues, costs and profits, petrol products
This section presents financial data on the refinery sector’s production of petrol products, that is, RULP and PULP.147
The methodology for the estimation of costs and derivation of profits associated with petrol products is outlined in sections 12.16 and 11.7.4.
12.4.1 Refinerysector:revenuesandcosts,petrolproductsKey observations on total refinery sector revenue and costs relating to petrol products include:
• petrol revenues and costs both decreased to around $11.9 billion during 2012−13, following increases over the past two years. Petrol revenues fell 5.9 per cent in real terms (and 3.7 per cent in nominal terms) relative to 2011−12, while petrol costs fell by 13.9 per cent in real terms (and 11.9 per cent in nominal terms) from 2011−12148
• petrol volumes sold by Australian refineries during 2012−13 was around 15.0 billion litres representing a decrease of around 3.7 per cent relative to 2011−12.
147 EBP is not blended in the refinery sector and not considered in the calculation of petrol profits for this sector.
148 Total refinery costs include impairment expenses.
176 Monitoring of the Australian petroleum industry December 2013

12.4.2 Refinerysector:totalandunitnetprofit,petrolproducts
Total net profits
Chart 12.5 shows net profit on petrol products for all Australian refineries from 2002−03 to 2012−13.
Key observations on total refinery petrol net profits include:
• in 2012−13 refineries earned a net profit of $126.0 million on petrol products, compared with a real net loss of $148.0 million (or a nominal net loss of $145.0 million) in 2011−12
– PULP products were more profitable in 2012−13 compared with 2011−12, while RULP products incurred a significantly smaller loss in 2012−13 relative to the previous year
• the average yearly profit for petrol products over the time series has been around $425.8 million in real terms (or $356.8 million in nominal terms).
Chart 12.5 Refinery sector net profit in real terms, petrol products: 2002−03 to 2012−13
-400
-200
0
200
400
600
800
1000
1200
2012–132011–122010–112009–102008–092007–082006–072005–062004–052003–042002–03
$ million
Average: 2002–03 to 2012–13
Sources: ACCC calculations based on data obtained from firms monitored through the ACCC’s monitoring process; ABS, 6401.0 Consumer Price Index, Australia, Table 1. CPI: All Groups, Index Numbers and Percentage Changes.
Note: Real values in 2012−13 dollars.
Monitoring of the Australian petroleum industry December 2013 177

Unit net profit
Refinery unit net profits for petrol products from 2002−03 to 2012−13 are presented in chart 12.6.
Chart 12.6 Refinery sector unit net profit in real terms, petrol products: 2002−03 to 2012−13
-2
-1
0
1
2
3
4
5
6
7
8
2012–132011–122010–112009–102008–092007–082006–072005–062004–052003–042002–03
cpl
Average: 2002–03 to 2012–13
Sources: ACCC calculations based on data obtained from firms monitored through the ACCC’s monitoring process; ABS, 6401.0 Consumer Price Index, Australia, Table 1. CPI: All Groups, Index Numbers and Percentage Changes.
Note: Real values in 2012−13 dollars.
Key observations on total refinery net unit profits for petrol products include:
• refinery petrol products recorded a unit net profit of 0.84 cpl in 2012−13, up from a real unit net loss of 0.95 cpl (or a nominal unit net loss 0.93 cpl) in 2011−12.
• refinery unit net profits on petrol products have been lower in the five years since 2008−09 than in the six years to 2007−08.
• average unit net profit for petrol over the time series is around 2.65 cpl in real terms (or 2.22 cpl in nominal terms).
12.5 Total supply sectorThe total supply sector covers the following activities:
• refinery operations (the refinery sector is a sub-sector of total supply)
• imports of refined fuel products (and some exports)
• purchase and coordination of crude imports for the refinery sector
• transactions between the refiner-wholesalers through buy-sell arrangements.149
Before assessing the revenues, costs and profits of the total supply sector, the following caveats must be taken into consideration:
• not all refiner-wholesalers’ operations are structured with a separate total supply sector. Refiner-wholesalers that do not have a total supply sector may carry out their importing function within the refinery operations while the buy-sell transactions may be included in the wholesale sector
149 Buy-sell arrangements are bilateral arrangements between domestic refiners to supply those refiners with refined product where they do not have a refinery. For example, BP does not have a refinery in Victoria, though by having buy-sell agreements with one of the Victorian refineries, BP can supply refined petrol in Victoria.
178 Monitoring of the Australian petroleum industry December 2013

• this structural variation among refiner-wholesalers prompted the ACCC to adopt the concept of a separate total supply sector to bring consistency to the sectorial analysis. This decision was taken in consultation with the industry
• those companies that did have a total supply sector did not necessarily operate it as a separate cost centre
• achieving consistency in sectorial reporting meant some companies were required to make allocations not normally undertaken in their internal accounting systems.
12.6 Total supply sector: revenues, costs and profits, all products
Total supply sector transactions include the sale of locally produced crude oil to refineries, the sale of imported and domestically produced refined product and the purchase and sale of refined petrol through buy-sell transactions. This sector has the greatest exposure to international factors due to the fact that this sector arranges importation of crude and refined product. This sector is also required to hold and store product as it coordinates the purchase, sale and distribution of products. Volatile and rapidly changing international prices and exchange rates can impact significantly on the financial results for this sector.
12.6.1 Totalsupply:revenuesandcosts,allproductsRevenues and costs in the total supply sector are displayed in chart 12.7 over the period 2002−03 to 2012−13. Key observations about revenues and costs in the total supply sector include:
• in 2012−13 total revenues increased marginally to $57.3 billion, which represents a real decrease 1.8 per cent (or a 0.4 per cent nominal increase) over 2011−12. Total costs decreased to $58.4 billion in 2012−13, a real decrease of 5.4 per cent (or a nominal decrease of 3.3 per cent) compared with 2011−12
• total volumes increased by 0.5 per cent to 72.7 billion litres during 2012−13 – diesel volumes increased 2.5 per cent, while PULP products increased 1.8 per cent, and RULP volumes decreased 2.2 per cent
• since 2002−03, revenue has increased by 166.2 per cent in nominal terms, or 103.0 per cent in real terms.
Monitoring of the Australian petroleum industry December 2013 179

Chart 12.7 Total supply sector revenues and costs in real terms, all products: 2002−03 to 2012−13
0
10
20
30
40
50
60
70
2012–132011–122010–112009–102008–092007–082006–072005–062004–052003–042002–03
$ billion
Supply costs Supply revenue
Sources: ACCC calculations based on data obtained from firms monitored through the ACCC’s monitoring process; ABS, 6401.0 Consumer Price Index, Australia, Table 1. CPI: All Groups, Index Numbers and Percentage Changes.
Note: Real values in 2012−13 dollars.
12.6.2 Totalsupplysector:totalandunitnetprofits,allproducts
Total net profits
Chart 12.8 presents net profit for the total supply sector for all products from 2002−03 to 2012−13.
Key observations from chart 12.8 include:
• total supply recorded a net loss of $0.62 billion during 2012−13, compared with a real and nominal net loss of $1.1 billion in 2011−12150
• total supply net profits across all products have been lower and exhibited greater variability in the five years since 2008−09 than in the six years from 2002−03 to 2007−08
• the total supply sector has experienced net losses in four out of the past five years, with the largest loss of $2.5 billion in real terms (or $2.2 billion in nominal terms) occurring in 2008−09
• since 2002−03, average annual net profit in nominal terms was $423.6 million or $541.8 million in real terms.
150 Note that if all expenses including impairment costs were included in the EBIT calculation, the total loss for the total supply sector would have been $0.83 billion during 2012−13.
180 Monitoring of the Australian petroleum industry December 2013

Chart 12.8 Total supply sector net profit in real terms, all products: 2002−03 to 2012−13
-3000
-2000
-1000
0
1000
2000
3000
2012–132011–122010–112009–102008–092007–082006–072005–062004–052003–042002–03
$ million
Average: 2002–03 to 2012–13
Sources: ACCC calculations based on data obtained from firms monitored through the ACCC’s monitoring process; ABS, 6401.0 Consumer Price Index, Australia, Table 1. CPI: All Groups, Index Numbers and Percentage Changes.
Note: Real values in 2012−13 dollars.
Unit net profit
Chart 12.9 shows unit net profits for the total supply sector since 2002−03. Total supply recorded a net loss of 0.86 cpl in 2012−13, compared with a real loss in 2011−12 of 1.58 cpl (or a nominal loss of 1.54 cpl). Average annual unit net profit in the supply sector for the period 2002−03 to 2012−13 was 0.81 cpl in real terms (or 0.63 cpl in nominal terms).
Chart 12.9 Total supply sector unit net profit in real terms, all products: 2002−03 to 2012−13
-5
-4
-3
-2
-1
0
1
2
3
4
5
2012–132011–122010–112009–102008–092007–082006–072005–062004–052003–042002–03
cpl
Average: 2002–03 to 2012–13
Sources: ACCC calculations based on data obtained from firms monitored through the ACCC’s monitoring process; ABS, 6401.0 Consumer Price Index, Australia, Table 1. CPI: All Groups, Index Numbers and Percentage Changes.
Note: Real values in 2012−13 dollars.
Monitoring of the Australian petroleum industry December 2013 181

12.7 Total supply sector: revenues, costs and profits, petrol products
As noted, petrol products include RULP, PULP and EBP. However little EBP is traded at the total supply level as EBP is normally blended with RULP in the wholesale sector. Sections 12.16 and 11.7.4 discuss issues relating to the sectorial and product allocation of data which should be taken into account when assessing petrol profits in the total supply sector.
12.7.1 Totalsupplysector:revenuesandcosts,petrolproductsKey observations on total supply revenue and costs relating to petrol products include:
• in 2012−13 total petrol revenue decreased to $20.9 billion, which represented a real fall of 2.1 per cent (or a nominal fall of 0.2 per cent) on 2011−12. Total costs fell to $20.5 billion, representing a real fall of 9.9 per cent (or a nominal fall of 7.8 per cent) on 2011−12
• total petrol volumes increased to 25 568 ML, representing a decrease of 2.0 per cent on 2011−12 – RULP volumes decreased by 2.2 per cent while PULP volumes increased 1.77 per cent.
12.7.2 Totalsupply:totalandunitnetprofit,petrolproducts
Total net profits
Chart 12.10 shows net profit for petrol products for the total supply sector since 2002−03. Key observations from this chart include:
• net profit in the total supply sector for petrol products rose from a real loss of $416.2 million (or a nominal loss of $407.0 million) in 2011−12 to a profit of $502.8 million in 2012−13.
• the long-term annual average for petrol net profits is around $482.0 million in real terms (or $402.9 million in nominal terms).
Chart 12.10 Total supply sector net profit in real terms, petrol products: 2002−03 to 2012−13
-1000
-500
0
500
1000
1500
2012–132011–122010–112009–102008–092007–082006–072005–062004–052003–042002–03
$ million
Average: 2002–03 to 2012–13
Sources: ACCC calculations based on data obtained from firms monitored through the ACCC’s monitoring process; ABS, 6401.0 Consumer Price Index, Australia, Table 1. CPI: All Groups, Index Numbers and Percentage Changes.
Note: Real values in 2012−13 dollars.
Unit net profit
Chart 12.11 presents unit net profits in total supply for petrol products for the period 2002−03 and 2012−13.
182 Monitoring of the Australian petroleum industry December 2013

Chart 12.11 Total supply sector unit net profit in real terms, petrol products: 2002−03 to 2012−13
-3
-2
-1
0
1
2
3
4
5
2012–132011–122010–112009–102008–092007–082006–072005–062004–052003–042002–03
cpl
Average: 2002–03 to 2012–13
Sources: ACCC calculations based on data obtained from firms monitored through the ACCC’s monitoring process; ABS, 6401.0 Consumer Price Index, Australia, Table 1. CPI: All Groups, Index Numbers and Percentage Changes.
Note: Real values in 2012−13 dollars.
Key observations on total supply unit net profit on petrol products include:
• petrol products recorded a unit net profit of 1.97 cpl during 2012−13, up from a real unit net loss of 1.60 cpl (or a nominal unit net loss of 1.56 cpl) in 2011−12
• as with other measures of performance in total supply, unit net profits for petrol products have been lower and more variable in the five years since 2008−09 than in the six years to 2007−08
• a significant movement among petrol products occurred with PULP which recorded a net profit of 3.02 cpl in 2012−13 after incurring a real net loss of 1.13 cpl (or a nominal net loss of 1.11 cpl) in the previous year.
12.8 Total supply sector: foreign exchange gains and losses
As noted, the total supply sector, among other things, coordinates the purchase (and sale) of domestic and imported crude oil and processed product. Not only has this sector the largest exposure to international factors, it is also required to hold and store product as it coordinates its purchase, sale and distribution activities. As such, this sector has the highest exposure of any sector in the downstream industry to the effects of rapid changes in international prices and exchange rates.151
Chart 12.12 shows foreign exchange gains and losses for the period 2006−07 to 2012−13. Key observations from this chart include:
• during 2012−13, the total supply sector experienced broadly similar losses in foreign exchange transactions for the second consecutive year
• foreign exchange transactions resulted in net losses of $219.1 million in 2012−13 compared with real losses of $221.7 million in 2011−12 (or $216.7 million in nominal terms).
151 ACCC (2011), Monitoring of the Australian petroleum industry—Report of the ACCC into the prices, costs and profits of unleaded petrol in Australia, December, p. 39.
Monitoring of the Australian petroleum industry December 2013 183

Chart 12.12 Total supply sector, foreign exchange gains and losses in real terms: 2006−07 to 2012−13
-800
-600
-400
-200
0
200
400
600
2012–132011–122010–112009–102008–092007–082006–07
$ million
Sources: ACCC calculations based on data obtained from firms monitored through the ACCC’s monitoring process; ABS, 6401.0 Consumer Price Index, Australia, Table 1. CPI: All Groups, Index Numbers and Percentage Changes.
Note: Real values in 2012−13 dollars.
12.9 Wholesale sectorMonitored firms operating in the wholesale sector source refined petroleum products locally from one of the refiner-wholesalers or other wholesalers or through direct imports and on-sell to other distributors/wholesalers and to retailers.
12.10 Wholesale sector: revenues, costs and profits, all products
In 2012−13, revenues and costs in the wholesale sector increased slightly relative to those recorded in the previous 12 months. Chart 12.13 shows total revenues and costs for the monitored firms in the wholesale sector.
184 Monitoring of the Australian petroleum industry December 2013

Chart 12.13 Wholesale sector revenues and costs in real terms, all products: 2002−03 to 2012−13
0
5
10
15
20
25
30
35
40
45
50
2012–132011–122010–112009–102008–092007–082006–072005–062004–052003–042002–03
$ billion
Wholesale costs Wholesale revenue
Sources: ACCC calculations based on data obtained from firms monitored through the ACCC’s monitoring process; ABS, 6401.0 Consumer Price Index, Australia, Table 1. CPI: All Groups, Index Numbers and Percentage Changes.
Note: Real values in 2012−13 dollars.
Key observations on wholesale sector revenues and costs for 2012−13 include:
• total wholesale revenues and costs were around $45.0 billion and $44.1 billion respectively
• revenues were 2.1 per cent lower in real terms than 2011−12 (however, in nominal terms, revenues were 0.2 per cent higher). Costs were 1.6 per cent lower in real terms than 2011−12 (however, in nominal terms, costs were 0.7 per cent higher)
• total volume traded in 2012−13 was around 52.4 billion litres which is about five billion litres higher than the long term average
• unit revenues were 85.8 cpl in 2012−13, which represented a decrease of 0.2 per cent in real terms (or a 0.2 per cent rise in nominal terms) on 2011−12. Unit costs were 84.2 cpl in 2012−13, which represented a decline of 1.5 per cent in real terms (or a 0.8 per cent rise in nominal terms) compared to 2011−12
• since 2002−03, revenue has increased by 147.0 per cent in nominal terms. However, when adjusted for inflation over that period, the real increase in revenue since 2002−03 has been 88.4 per cent.
12.10.1 Wholesalesector:totalandunitnetprofits,allproducts
Total net profits
Chart 12.14 presents net profit data (adjusted EBIT) across all products for the wholesale sector since 2002−03.
Key observations from chart 12.14 include:
• net profit across all products was $863.0 million, representing a decrease of 22.2 per cent in real terms (or 20.4 per cent in nominal terms) on 2011−12
• in contrast with the results observed in the refinery and total supply sectors, the wholesale sector’s financial performance has continued to improve since the GFC in 2007−08 and is now the most profitable sector in the Australian downstream petroleum industry
Monitoring of the Australian petroleum industry December 2013 185

• in real terms, the net profit for 2012−13 is $51.1 million above the long term average (since 2002−03) of $811.9 million. In nominal terms, the net profit for 2012−13 is $137.6 million above the long term average profit of $725.4 million.
Chart 12.14 Wholesale sector net profit in real terms, all products: 2002−03 to 2012−13
0
200
400
600
800
1000
1200
1400
2012–132011–122010–112009–102008–092007–082006–072005–062004–052003–042002–03
$ million
Average: 2002–03 to 2012–13
Sources: ACCC calculations based on data obtained from firms monitored through the ACCC’s monitoring process; ABS, 6401.0 Consumer Price Index, Australia, Table 1. CPI: All Groups, Index Numbers and Percentage Changes.
Note: Real values in 2012−13 dollars.
Unit net profit
Unit net profit across all products for the wholesale sector since 2002−03 is presented in chart 12.15. Key observations from this chart include:
• unit net profit for the wholesale sector was around 1.65 cpl in 2012−13, down 22.1 per cent in real terms (or 20.4 per cent in nominal terms) from the previous year
• the average annual unit net profit from 2002−03 to 2012−13 was around 1.71 cpl in real terms (or 1.53 cpl in nominal terms)
• unit net profits in the wholesale sector were generally lower and more variable prior to the GFC in 2007−08 than in the five years since the GFC. Prior to 2008−09, the average annual unit net profit was 1.39 cpl in real terms (1.14 cpl in nominal terms) compared to 2.05 cpl in real terms (1.95 cpl in nominal terms) in the five years since 2008−09.
186 Monitoring of the Australian petroleum industry December 2013

Chart 12.15 Wholesale sector unit net profit in real terms, all products: 2002−03 to 2012−13
0.0
0.5
1.0
1.5
2.0
2.5
3.0
2012–132011–122010–112009–102008–092007–082006–072005–062004–052003–042002–03
cpl
Average: 2002–03 to 2012–13
Sources: ACCC calculations based on data obtained from firms monitored through the ACCC’s monitoring process; ABS, 6401.0 Consumer Price Index, Australia, Table 1. CPI: All Groups, Index Numbers and Percentage Changes.
Note: Real values in 2012−13 dollars.
12.10.2 Wholesalesector:otherkeyperformanceindicatorsThis section presents data on RoS and RoA to assess the performance of the wholesale sector.
As noted, there are a number of caveats that should be taken into account when using RoA and RoS as indicators of financial performance. Return on sales can be affected by a firm’s cost structure. Generally, firms with operations that have significant fixed costs rely on volumes to produce adequate returns and will therefore tend to have a lower return on sales. Return on assets can be affected by different approaches to measuring asset values, the allocation of corporate assets across sectors and asset age profiles. For further details on these KPIs refer to Box 11.1 in section 11.7.5.
Chart 12.16 shows RoS and RoA for the period 2002−03 to 2012−13. Key observations from this chart include:
• return on assets for the wholesale sector was around 11.1 per cent in 2012−13, down from 15.6 per cent in 2011−12. An increase in the wholesale sector asset base of 11.7 per cent along with reduced profits resulted in a lower RoA
– the average RoA for the entire time series was 13.2 per cent – average RoA during the pre-GFC years was 10 per cent compared to the post-GFC RoA of 16.6 per cent
• return on sales was 1.9 per cent in 2012−13, down from 2.4 per cent in 2011−12 – the average RoS over the time series was around 2.2 per cent – during 2012−13, the refiner-wholesalers average RoS was around 2.0 per cent compared to around 1.4 per cent for independent wholesalers
– the average for the time series was 2.2 per cent for the refiner-wholesalers and 1.1 per cent for the independent wholesalers.
Monitoring of the Australian petroleum industry December 2013 187

Chart 12.16 Wholesale sector return on sales and return on assets, all products: 2002−03 to 2012−13
0
5
10
15
20
25
2012–132011–122010–112009–102008–092007–082006–072005–062004–052003–042002–03
per cen
t
RoARoS
Source: ACCC calculations based on data obtained from firms monitored through the ACCC’s monitoring process.
12.11 Wholesale sector: revenues, costs and profits, petrol products
This section presents wholesale sector net profit data on petrol products.
It should be noted that monitored companies do not provide cost data for individual products. The ACCC has estimated costs for each product by allocating total costs on the basis of relative product volumes. The ACCC’s methodology for the allocation of costs and derivation of profits on individual petrol products is outlined in sections 12.16 and 11.7.4.
12.11.1 Wholesalesector:revenuesandcosts,petrolproductsKey observations on the wholesale sector revenue and costs relating to petrol products include:
• in 2012−13, total revenues and costs on petrol products were around $15.7billion and $15.5 billion respectively
• total revenue on petrol products fell by 2.9 per cent in real terms (or 0.7 per cent in nominal terms) compared to 2011−12, while total costs fell by 3.2 per cent in real terms (or 1.0 per cent in nominal terms) compared to 2011−12
• total petrol sale volumes continued to fall in 2012−13 with sale volumes falling 1.6 per cent from 2011−12 levels, continuing the trend of generally declining petrol sales since 2004−05
– EBP volumes decreased 5.5 per cent while PULP volumes decreased by 1.1 per cent from 2011−12.
188 Monitoring of the Australian petroleum industry December 2013

12.11.2 Wholesalesector:totalandunitnetprofits,petrolproducts
Total net profits
Chart 12.17 shows net profit on petrol products sold in the wholesale sector for the period 2002−03 to 2012−13.
Key observations from chart 12.17 include:
• total profits on petrol products during 2012−13 were $209.6 million, representing an increase of 29.1 per cent in real terms (or 32.0 per cent in nominal terms) relative to 2011−12
• in the last four years, wholesale sector total net profits on petrol products have been higher and more stable than in the seven years to 2008−09
– the main driver of increased profits among petrol products in recent years has been PULP, which on average has contributed 82.9 per cent of petrol net profit over the past three years in real terms
– the financial performance of RULP products changed significantly in 2012−13 with a net profit of $19.9 million compared with a real net loss in 2011−12 of $53.1 million (or a nominal net loss of $51.9 million).
Chart 12.17 Wholesale sector net profit in real terms, petrol products: 2002−03 to 2012−13
-200
-150
-100
-50
0
50
100
150
200
250
300
2012–132011–122010–112009–102008–092007–082006–072005–062004–052003–042002–03
$ million
Average: 2002–03 to 2012–13
Sources: ACCC calculations based on data obtained from firms monitored through the ACCC’s monitoring process; ABS, 6401.0 Consumer Price Index, Australia, Table 1. CPI: All Groups, Index Numbers and Percentage Changes.
Note: Real values in 2012−13 dollars.
The wholesale sector’s total net profits over the entire time series has been more stable than for petrol products (see chart 12.14). Prior to 2008−09 the wholesale sector earned a greater proportion of its profits from non-petrol products, that is, diesel, lubricants and other fuels.
Monitoring of the Australian petroleum industry December 2013 189

Unit net profit
Chart 12.18 presents data on unit net profits earned in the wholesale sector on petrol products since 2002−03.
Chart 12.18 Wholesale sector unit net profit in real terms, petrol products: 2002−03 to 2012−13
-1.0
-0.5
0.0
0.5
1.0
1.5
2012–132011–122010–112009–102008–092007–082006–072005–062004–052003–042002–03
cpl
Average: 2002–03 to 2012–13
Sources: ACCC calculations based on data obtained from firms monitored through the ACCC’s monitoring process; ABS, 6401.0 Consumer Price Index, Australia, Table 1. CPI: All Groups, Index Numbers and Percentage Changes.
Note: Real values in 2012−13 dollars.
Key observations on the wholesale sector’s unit net profit on petrol products include:
• unit net profit for petrol products increased to 1.5 cpl during 2012−13, representing a rise of 31.1 per cent in real terms (or 34.1 per cent in nominal terms) from 2011−12
• unit net profit on petrol products has averaged around one cpl in real and nominal terms over the past four financial years. This is in contrast with the lower and more variable net profits recorded in the seven years to 2008−09
– unit net profit on RULP improved in 2012−13 to 0.2 cpl compared with a real unit loss in 2011−12 of 0.48 cpl (or a nominal unit loss of 0.47 cpl)
– unit net profit on PULP fell in 2012−13 to 3.1 cpl after earning a unit net profit of 3.44 cpl in real terms in 2011−12 (or 3.36 cpl in nominal terms)
• since 2002−03 average annual unit net profit for petrol products has been around 0.29 cpl in real and nominal terms).
12.12 Retail sectorOver the past decade the retail sector has seen substantial change. Refiner-wholesalers have scaled back their retail operations and specialist retailers have emerged. Recent years have seen the growing presence of the supermarkets, and other independent retail operators such as 7-Eleven and On The Run, as well as the continued consolidation of the retail operations of the major independent wholesalers, Neumann, United and Ausfuel.152
152 ACCC, 2011, Monitoring of the Australian petroleum industry—Report of the ACCC into the prices, costs and profits of unleaded petrol in Australia, December, p. 39.
190 Monitoring of the Australian petroleum industry December 2013

12.13 Retail sector: revenues, costs and profitsThe retail sector has undergone profound changes in recent years. With two of the four refiner-wholesalers having essentially withdrawn from retailing, the combined market share of the integrated petrol companies’ retail sales of branded petrol products has fallen from around 83 per cent in 2002−03 to 35 per cent in 2012−13 (see section 3.7 in chapter 3). At the same time specialist retailers and the supermarket alliances have increased their market share.
One of the distinguishing characteristics of the modus operandi of new entrants is that they do not see fuel retailing as just a platform for selling fuel to motorists. Instead petrol is only one of an increasing range of products and services offered to the public. Indeed, the retail sector’s offerings of non-fuel products and services have become increasingly important for its overall profitability. In addition to the more conventional services such as the hire of trailers, gas bottle exchange and ATM services the following non-fuel product and services have become increasingly available at fuel retail outlets:
• normal convenience store sales
• car and animal wash services
• franchised businesses within the convenience store: for example, bread, coffee and fast food franchises
Retail fuel outlets have traditionally delivered their range of products and services to the public through a variety of business models, including:
• refiner-wholesaler owned and operated sites
• commission agent sites
• franchise sites
• independent but refiner-wholesaler branded sites
• alliances between supermarket chains
• independently owned and operated sites.153
12.13.1 Retailsector:revenues,costsandvolumes,allproductsandservices
Chart 12.19 shows total revenues and costs for all products and services sold in the retail sector over the period 2005−06 to 2012−13.154 Key observations from chart 12.19 include:
• total retail revenues and costs in 2012−13 were around $19.99 billion and $19.47 billion respectively
• revenues were 0.8 per cent lower in real terms than 2011−12 (however, in nominal terms, revenues were 1.5 per cent higher). Costs were 1.2 per cent lower in real terms than 2011−12 (however, in nominal terms, costs were 1.0 per cent higher)
• during 2012−13, total sector volumes increased to 18.3 billion litres, up 1.3 per cent on 2011−12. Total retail sales volumes (that is across all fuel products) by monitored retail companies have increased annually since 2005−06
153 Refer to table 3.7 in chapter 3 for a breakdown of retail sites by branding and type of business operator.
154 The majority of data presented in this section covers the period from 2005−06 to the present. Only selected data is presented for the years 2002−03 and 2003−04. Structural changes in the retail sector during 2002−03 and 2003−04 mean that data for this period is not comparable with data for later years. Where data are expressed as ratios, such as RoS and RoA, the analysis extends to 2002−03.
Monitoring of the Australian petroleum industry December 2013 191

• unit revenues for 2012−13 were $1.09 per litre, which represented a 2.1 per cent fall in real terms compared to 2011−12 (however, in nominal terms, unit revenues were 0.2 per cent higher). Unit costs were $1.06 per litre, which represented a 2.5 per cent fall in real terms (and a 0.3 per cent fall in nominal terms) compared to 2011−12
– RULP volumes decreased by 1.3 per cent to 7.1 billion litres in 2012−13. RULP’s contribution to total volumes has continued to fall in the last few years, from 63.3 per cent of all retail fuel sales in 2005−06, to 39.0 per cent in 2012−13
– PULP volumes increased 5.4 per cent in 2012−13 to 3.3 billion litres. Since 2005−06, PULP volume retail sales have increased 82.9 per cent and their share of total retail sale volumes have increased from 12.7 to 18.2 per cent
– EBP sales volumes decreased by 2.7 per cent in 2012−13 to 2.16 billion litres. EBP’s share of total retail sales volumes has decreased from less than 1 per cent In 2005−06 to 11.8 per cent in 2012−13
• since 2005−06, total retail revenue has increased by 61.3 per cent in nominal terms, or 33.2 per cent in real terms.
Chart 12.19 Retail sector, total revenues and costs in real terms, all products and services 2005−06 to 2012−13
0
5
10
15
20
25
2012–132011–122010–112009–102008–092007–082006–072005–06
$ billion
Retail costs Retail revenue
Sources: ACCC calculations based on data obtained from firms monitored through the ACCC’s monitoring process; ABS, 6401.0 Consumer Price Index, Australia, Table 1. CPI: All Groups, Index Numbers and Percentage Changes.
Note: Real values in 2012−13 dollars.
12.13.2 Retailsector:totalandunitnetprofits,allproductsandservices
Total net profits
In the retail sector, total net profit includes profits from the sale of fuel and non-fuel products and services sold through the convenience stores attached to the retail outlets. Chart 12.20 presents data on total net profits from 2005−06 to 2012−13.
Key observations from chart 12.20 include:
• outcomes in 2012−13 continued the general trend of rising profits since 2005−06 (apart from 2008−09) with total retail net profits reaching $534.9 million. This represents a real increase of 18.9 per cent (and a nominal increase of 21.6 per cent) on 2011−12
192 Monitoring of the Australian petroleum industry December 2013

• the average annual net profit over the period 2005−06 to 2012−13 was $305.4 million in nominal terms or $327.3 million in real terms.
Chart 12.20 Retail sector, total net profit in real terms, all products and services: 2005−06 to 2012−13
0
100
200
300
400
500
600
2012–132011–122010–112009–102008–092007–082006–072005–06
$ million
Average: 2005–06 to 2012–13
Sources: ACCC calculations based on data obtained from firms monitored through the ACCC’s monitoring process; ABS, 6401.0 Consumer Price Index, Australia, Table 1. CPI: All Groups, Index Numbers and Percentage Changes.
Note: Real values in 2012−13 dollars.
Unit net profit
This section provides data on unit net profits in the retail sector that highlights the impact of convenience store profits on overall profitability.
Unit net profit data for the retail sector including and excluding convenience store profits are presented in chart 12.21. Key observations from chart 12.21 include:
• unit net profit from sales of all products and services, including convenience store sales, during 2012−13 was around 2.9 cpl, up 17.3 per cent in real terms (or 20.0 per cent in nominal terms) on 2011−12
• unit net profit from sales of all fuel products (that is, all petrol products, petroleum products, lubricants and other fuels) was 1.8 cpl during 2012−13, accounting for 62 per cent of total unit net profits
• in 2012−13 convenience store sales contributed the equivalent of 1.1 cpl to the overall unit net profit of 2.9 cpl across all products and services
• in the period 2005−06 to 2012−13 average annual unit net profit across all products and services, including convenience store sales, was around 1.99 cpl in real terms (or 1.86 cpl in nominal terms), while average annual unit net profit from fuel sales only (that is, petrol, petroleum and other fuel products and lubricants) was around 1.21 cpl in real terms (or 1.13 cpl in nominal terms)
• retail unit net profits have been rising more strongly in the five years since 2008−09 than in the four years prior to 2008−09.
Monitoring of the Australian petroleum industry December 2013 193

Chart 12.21 Retail sector, unit net profit in real terms, all fuel products (petrol, petroleum, lubricants and other fuel products) and convenience store sales: 2005−06 to 2012−13
0.0
0.5
1.0
1.5
2.0
2.5
3.0
3.5
2012–132011–122010–112009–102008–092007–082006–072005–06
cpl
All profitFuel profit
Average (fuel + convenience): 2005–06 to 2012–13Average (fuel): 2005–06 to 2012–13
Sources: ACCC calculations based on data obtained from firms monitored through the ACCC’s monitoring process; ABS, 6401.0 Consumer Price Index, Australia, Table 1. CPI: All Groups, Index Numbers and Percentage Changes.
Note: Real values in 2012−13 dollars.
12.13.3 Retailsector:otherkeyperformanceindicators—allproductsandservices
This section considers RoS and RoA. The discussion in section 11.7.5 provides further details on these KPIs.
Chart 12.22 displays RoS and RoA for the period 2002−03 to 2012−13. Key observations regarding these profit KPIs for the retail sector include:
• return on sales increased to 2.7 per cent in 2012−13, up from 2.2 per cent RoS for 2011−12 – RoS for specialist retailers was 2.94 per cent while independent wholesalers with a retail presence recorded a RoS of 4.0 per cent
– the average annual RoS for the entire time series was around 1.8 per cent
• return on assets for the retail sector was around 12.9 per cent in 2012−13, down from 14.7 per cent in 2011−12
– during 2012−13 RoA was 5.96 per cent for independent wholesalers and about 25.4 per cent for specialist retailers
– the average annual RoA for the time series was around 12.2 per cent.
194 Monitoring of the Australian petroleum industry December 2013

Chart 12.22 Retail sector, return on sales and return on assets, all petroleum products and convenience store products and services: 2002−03 to 2012−13
0
2
4
6
8
10
12
14
16
18
2012–132011–122010–112009–102008–092007–082006–072005–062004–052003–042002–03
per cen
t
RoARoS
Source: ACCC calculations based on data obtained from firms monitored through the ACCC’s monitoring process.
As noted, there are a number of caveats pertaining to data on return on sales and return on assets that should be taken into account when analysing these KPIs. Return on sales is affected by a firm’s cost structure. This means that firms with significant fixed costs rely on volumes to produce adequate returns and will tend to have low returns on sales. Return on assets is affected by different approaches to valuing assets, the allocation of assets across relevant sectors and the asset age profiles.
12.14 Retail sector: revenues, costs and profits, petrol products
This section presents profit data on the sale of petrol products. Refer to sections 11.7.4 and 12.16 for further details on the ACCC methodology used to allocate costs to individual products.
12.14.1 Retailsector:revenues,costs,petrolproductsKey observations on the retail sector’s revenue and costs relating to petrol products include:
• in 2012−13, total revenues and costs on petrol products were around $11.8 billion and $11.5 billion respectively
• total revenues on petrol products fell by 3.1 per cent in real terms (or 0.9 per cent in nominal terms) compared to 2011−12, while total costs on petrol products fell by 3.6 per cent in real terms (or 1.4 per cent in nominal terms)
• total petrol sales volumes increased marginally by 0.1 per cent during 2012−13 – in contrast PULP volumes increased 5.4 per cent.
Monitoring of the Australian petroleum industry December 2013 195

12.14.2 Retailsector:totalandunitnetprofits,petrolproducts
Total net profits
Chart 12.23 shows total retail net profit for petrol products over the seven years to 2012−13. Key observations from this chart include:
• total profits earned from petrol products in 2012−13 was around $297.5 million, which was 21.8 per cent higher in real terms (and 24.6 per cent higher in nominal terms) than 2011−12
• Annual average net profit for petrol products since 2005−06 has been around $137.0 million in nominal terms, or $144.9 million in real terms
• total profits on petrol products have risen more than four-fold since 2008−09 after being relatively stable in the years from 2005−06 to 2008−09.
Chart 12.23 Retail sector, net profit in real terms, petrol products: 2005−06 to 2012−13
0
50
100
150
200
250
300
350
2012–132011–122010–112009–102008–092007–082006–072005–06
$ million
Average: 2005–06 to 2012–13
Sources: ACCC calculations based on data obtained from firms monitored through the ACCC’s monitoring process; ABS, 6401.0 Consumer Price Index, Australia, Table 1. CPI: All Groups, Index Numbers and Percentage Changes.
Note: Real values in 2012−13 dollars.
196 Monitoring of the Australian petroleum industry December 2013

Unit net profit
Chart 12.24 shows unit net profit for monitored firms in the retail sector over the seven years to 2012−13.
Chart 12.24 Retail sector, unit net profit in real terms, petrol products: 2005−06 to 2012−13
0.0
0.5
1.0
1.5
2.0
2.5
2012–132011–122010–112009–102008–092007–082006–072005–06
cpl
Average: 2005–06 to 2012–13
Sources: ACCC calculations based on data obtained from firms monitored through the ACCC’s monitoring process; ABS, 6401.0 Consumer Price Index, Australia, Table 1. CPI: All Groups, Index Numbers and Percentage Changes.
Note: Real values in 2012−13 dollars.
Key observations on the retail sector’s unit net profit on petrol products include:
• unit net profit for petrol products was around 2.36 cpl in 2012−13, representing an increase of 21.7 per cent in real terms (or 24.5 per cent in nominal terms) on 2011−12
• similar to the trend observed with total net profits, unit net profits have risen markedly in the last five years, rising more than four-fold in real terms from 0.58 cpl in 2008−09
• average annual unit net profit from 2005−06 to 2008−09 was around 0.63 cpl in real terms (0.55 cpl in nominal terms) compared to 1.74 cpl in real terms (1.70 cpl in nominal terms) for the four years to 2012−13.
12.15 Retail sector: the importance of convenience store sales
This section considers the significance of convenience store sales and profitability in the petrol retail sector. As noted in sections 3.7 and 12.3, monitored retail companies have a wide variety of business models which can affect convenience store profits. In some cases a profit sharing arrangement exists with the franchisee, while in others a third party operates the convenience store and shares petrol profits. A more conventional business model may exist in other cases where all convenience store revenues and profits are to the account of the owner of the site.
12.15.1 Retailsector:conveniencestoregrossprofitsandmarginsThis section analyses gross margin for retailing and includes data on gross margins on both fuel and convenience store products.
Gross margins are calculated by subtracting the cost of goods (purchases and usually transport costs in the retail sector) from revenue. Gross margins are typically expressed as a percentage of revenue. This provides a percentage measure that highlights the core profitability of a company
Monitoring of the Australian petroleum industry December 2013 197

before operating expenses are deducted. The gross margin expressed as a percentage of revenue represents the proportion of each revenue dollar that a retailer retains after deducting the direct costs associated with the sale of the good. The higher the percentage, the more a retailer retains from each sales dollar.
Chart 12.25 shows gross margins on petroleum products and convenience store sales for the period 2006−07 to 2012−13. Key observations from chart 12.25 include:
• convenience store sales have a larger gross margin than petroleum products: – in 2012−13 gross margins on convenience store sales were 32.0 per cent, consistent with gross margins achieved in previous years155
– in contrast, gross margins on diesel were around 8.6 per cent during 2012−13 while gross margins on petrol products were around 8.7 per cent.
Chart 12.25 Retail sector, gross margins for petrol products, diesel, automotive LPG and convenience store sales: 2006−07 to 2012−13
0
5
10
15
20
25
30
35
40
2012–132011–122010–112009–102008–092007–082006–07
per cen
t
Convenience storeAuto LPG Diesel Petrol
Source: ACCC analysis based on data obtained from firms monitored through the ACCC’s monitoring process.
12.15.2 Retailsector:conveniencestorenetprofitsThis section considers net profits on convenience store sales compared with net profits on sales of petrol products and petroleum products. The methodology for allocating costs among individual retail products and services is outlined in section 11.7.4.
Chart 12.26 presents net profit on sales of convenience store and petrol and petroleum products in the retail sector. Key observations from this chart include:
• in 2012−13 convenience store net profit accounted for around 38.4 per cent of total retail profits. During 2012−13, total convenience store profits increased 17.1 per cent in real terms (or 19.7 per cent in nominal terms) to $205.2 million
• apart from 2006−07, when convenience store profits were around 34.8 per cent of total net profits, convenience store profits as a share of total profits has averaged around 38.7 per cent over the time series
155 Note that the time series for convenience store profits can only be calculated from 2006−07 onwards. A shortened template was used for earlier years and convenience store KPIs cannot be calculated from this shortened template.
198 Monitoring of the Australian petroleum industry December 2013

• net profit from sales of petrol products has increased from 30.2 per cent of total profits in 2006−07 to around 55.6 per cent for 2012−13.
• for the past four years, retailers have on average, incurred losses on the sale of LPG.
Chart 12.26 Retail sector, total net profit for petrol products, diesel, automotive LPG and convenience store sales in real terms: 2006−07 to 2012−13
-100
-50
0
50
100
150
200
250
300
350
2012–132011–122010–112009–102008–092007–082006–07
$ million
Convenience storeAuto LPG Diesel Petrol
Sources: ACCC analysis based on data obtained from firms monitored through the ACCC’s monitoring process; ABS, 6401.0 Consumer Price Index, Australia, Table 1. CPI: All Groups, Index Numbers and Percentage Changes.
Note: Real values in 2012−13 dollars.
12.16 Methodology noteThe assessment of the downstream petroleum industry is based on data included total company returns for each monitored company and also company returns by sector.
For the purposes of this monitoring program the ACCC segmented the industry into four broad sectors. Three of these sectors, refining, wholesaling and retailing, directly align with the Australian and New Zealand Standard Industrial Classification 2006 (ANZSIC06). The ANZSIC06 classes are Petroleum and Coal Product Fuel Manufacturing class 1701, Petroleum Product Wholesaling class 3321 and Fuel Retailing class 4000. Note that comparisons with Australian Bureau of Statistics industry data may be misleading due to the scope of monitored units compared to all Australian units that operate in those sectors and also due to the allocation of activities to total supply. The total supply sector used by the ACCC to monitor the Australian downstream petroleum industry does not directly align to any ANZSIC class.
While Australian refineries report revenues by product, it is often not possible to measure costs by product. This means that total costs must be allocated to individual products. Cost allocation is complicated by the fact that different petroleum products are produced from the same barrel of oil and using the same refining facilities. Some companies have not provided cost splits for these reasons. As outlined in section 11.7.4, the ACCC has used sales volumes to prorate costs across products so that costs and profits can be estimated for each type of product.
Monitoring of the Australian petroleum industry December 2013 199

Wholesale allocations
The data presented for the Australian wholesale sector includes imports by independent wholesalers. It was not methodologically possible to allocate these imports to the total supply sector as with the refiner-wholesalers’ imports. The revenues and costs associated with these volumes are included in the independents’ wholesale financial data.
The assessment of revenues in the wholesale sector is complicated by the provision of price support. Price support is a mechanism used by some fuel suppliers to provide assistance to linked retailers during times of heavy price discounting (normally at the trough of a retail price cycle). Among other things, price support allows the supplier to partly control or influence the setting of prices for certain products at certain retail sites. For the purposes of assessing revenues, price support has been deducted from each product’s sales revenue.
Retail sector sample
The ACCC’s monitoring program does not encompass the entire retail sector, due to the very large number of small businesses. The ACCC has collected data from retail businesses operated by the refiner-marketers, major independent wholesalers and importers, supermarkets and the larger specialist retailers. The retail sector is also comprised of many single and multi-site independent retail site owners. Although the ACCC does not collect data from every retail outlet, it does consider that the scope of the monitoring program is sufficiently wide to capture a significant proportion of retail outlets.
Convenience store profit calculation
To calculate convenience store profits, the ACCC has adjusted the methodology that is used in the refinery, total supply and wholesale sectors. While sales and purchases by type of product in the retail sector can be measured without difficulty, estimating net profits is complicated by the presence of common costs.
In order to calculate net profits by product, common costs were allocated through a two-stage process. Firstly, gross profit by convenience store and fuel sales were used to prorate costs between these two broad activities. Secondly, costs were then split by product on the basis of the relative product volumes sold.
200 Monitoring of the Australian petroleum industry December 2013

Appendix A: Minister’s Direction
Monitoring of the Australian petroleum industry December 2013 201

Appendix B: Major infrastructure schematics
Figure B.1 New South Wales oil flow schematic
Bank
smea
dow
Cal
tex
Kurn
ell
Ref
iner
yC
alte
x
Term
inal
Ref
iner
y
Tran
spor
t Rou
te
Ship
Tra
nspo
rt
Roa
d Tr
ansp
ort
Pipe
line
Lege
nd
Silv
erw
ater
Cal
tex/
Mob
il
New
cast
le (3
)BP
, She
ll, C
alte
x
Dis
tribu
tion
Mul
ti-Pr
oduc
t Pip
elin
eC
alte
x
Dis
tribu
tion
Dis
tribu
tion
Sydn
eyAi
rpor
t
Gor
e Ba
ySh
ell
Dis
tribu
tion
SMP
Cal
tex/
Mob
il
Port
Kem
bla
Park
Pty
Ltd
Die
sel f
rom
inte
rnat
iona
l sou
rces
Rai
l Tra
nspo
rt
Parra
mat
taSh
ell
Bota
nyVo
pak
Dis
tribu
tion
Ref
ined
fuel
from
in
tern
atio
nal s
ourc
es
Now
ra E
than
ol
Plan
tM
anild
raAu
burn
Eth
anol
D
epot
Park
Pty
Ltd
Petro
l cou
ld b
e fro
m d
omes
tic a
ndin
tern
atio
nal s
ourc
es (B
P on
ly)
Dis
tribu
tion
Area
(s)
-Bris
bane
-Ade
laid
e-M
elbo
urne
- NSW
Dis
tribu
tion
Dis
tribu
tion
Dis
tribu
tion
Ref
ined
fuel
from
dom
estic
and
inte
rnat
iona
l sou
rces
Petro
l sen
t int
erst
ate
Cru
de o
il fro
m d
omes
tican
d in
tern
atio
nal s
ourc
esPe
trol f
rom
dom
estic
and
inte
rnat
iona
l so
urce
s
Dis
tribu
tion
Biod
iese
l
Source: Prepared by the ACCC and RLMS Pty Ltd.
202 Monitoring of the Australian petroleum industry December 2013

Figure B.2 Queensland oil flow schematic
Term
inal
Ref
iner
y
Dis
tribu
tion
Area
Tran
spor
t Rou
te
Oil
Fiel
d
Ship
Tra
nspo
rt
Roa
d Tr
ansp
ort
Pipe
line
Lege
nd
SE Q
ld &
N
orth
ern
NSW
Mul
ti-Pr
oduc
tJa
ckso
n Pr
oces
sing
Fac
ility
Sant
os
Jack
son
Jack
son
Sout
hN
acco
wla
hW
ilson
Moo
mba
G
athe
ring
and
Proc
essi
ng F
acili
ty
Moo
nie
Bulw
er Is
land
Ref
iner
yBP
Lytto
n R
efin
ery
Cal
tex
Whi
nsta
nes
BP
Pink
enba
Shel
l
Eagl
e Fa
rmN
eum
ann
Dis
tribu
tion
Dis
tribu
tion
Dis
tribu
tion
Cai
rns
(3)
BP, S
hell,
Cal
tex
Tow
nsvi
lle (2
)C
alte
x/Sh
ell &
BP
Mac
kay
(3)
BP, S
hell,
Cal
tex
Port
Alm
aSt
olth
aven
Gla
dsto
ne (2
)C
alte
x/M
obil
& BP
/She
ll
Bund
aber
gSt
olth
aven
(unu
sed)
Dis
tribu
tion
Dis
tribu
tion
Dis
tribu
tion
Dis
tribu
tion
Dis
tribu
tion
Mou
nt Is
a
Wes
tern
Q
ueen
slan
d
Erom
anga
Min
i-Ref
iner
yIn
land
Oil
Kenm
ore
Nap
tha
Cen
tral Q
ueen
slan
d
QUEENSLAND
SOUTH AUSTRALIA
Bris
bane
Airp
ort
Lytto
nC
alte
x
Cru
de o
il fro
m in
tern
atio
nal s
ourc
esR
efin
ed fu
el fr
om in
tern
atio
nal s
ourc
es
Dis
tribu
tion
Ref
ined
fuel
from
inte
rnat
iona
l sou
rces
Die
sel
Moo
nie
Term
inal
Sant
os
Rai
l Tra
nspo
rt
Ref
ined
fuel
als
o fro
m
inte
rnat
iona
l sou
rces
Ref
ined
fuel
als
o fro
m
inte
rnat
iona
l sou
rces
Petro
l als
o fro
m
inte
rnat
iona
l sou
rces
Petro
l als
o fro
m
inte
rnat
iona
l sou
rces
Dal
by E
than
ol
Plan
tU
nite
d
Sarin
a Et
hano
l Pl
ant
Sucr
ogen
Dis
tribu
tion
Res
t of Q
ld
and
inte
rsta
te
-Bris
bane
-Syd
ney
Res
t of Q
ld
Dis
tribu
tion
Dis
tribu
tion
Lytto
n(c
rude
)Sa
ntos
Cru
de(lo
w v
olum
e)
Dis
tribu
tion
Dis
tribu
tion
Die
sel
Inte
rsta
te
Source: Prepared by the ACCC and RLMS Pty Ltd.
Monitoring of the Australian petroleum industry December 2013 203
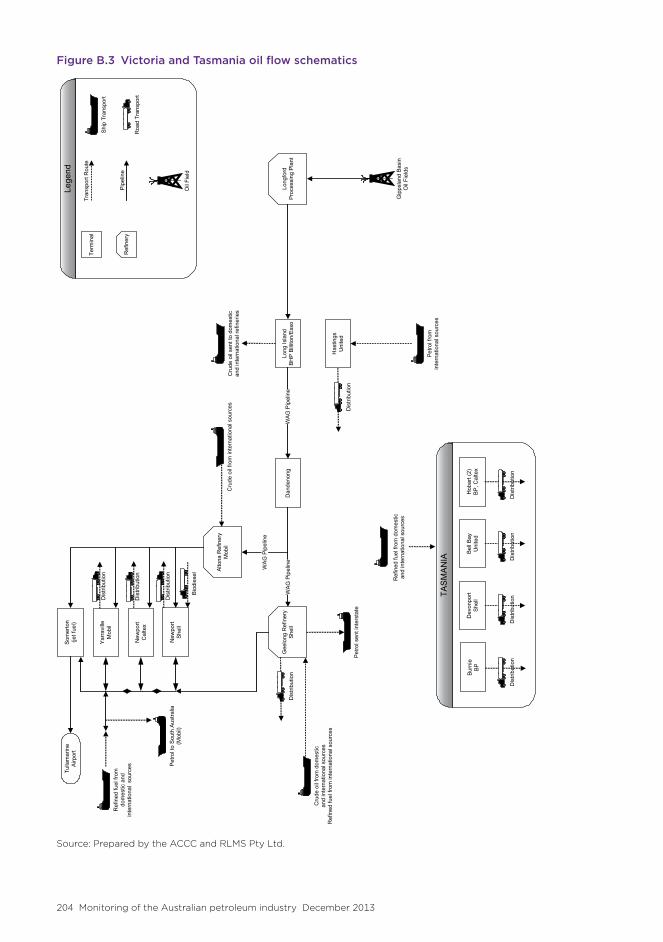
Figure B.3 Victoria and Tasmania oil flow schematics
New
port
Cal
tex
Alto
na R
efin
ery
Mob
il
Yarra
ville
Mob
il
Long
Isla
ndBH
P Bi
llito
n/Es
so
Gip
psla
nd B
asin
Oil
Fiel
ds
Gee
long
Ref
iner
ySh
ell
WAG
Pip
elin
e
WAG
Pip
elin
e
Long
ford
Pr
oces
sing
Pla
nt
Cru
de o
il fro
m d
omes
tican
d in
tern
atio
nal s
ourc
esR
efin
ed fu
el fr
om in
tern
atio
nal s
ourc
es
Dan
deno
ngW
AG P
ipel
ine
Has
tings
Uni
ted
Bell
Bay
Uni
ted
Dev
onpo
rtSh
ell
Burn
ieBP
Hob
art (
2)BP
, Cal
tex
TAS
MA
NIA
Som
erto
n(je
t fue
l)Tu
llam
arin
eAi
rpor
t
Dis
tribu
tion
Cru
de o
il fro
m in
tern
atio
nal s
ourc
es
Term
inal
Ref
iner
y
Tran
spor
t Rou
te
Oil
Fiel
d
Ship
Tra
nspo
rt
Roa
d Tr
ansp
ort
Pipe
line
Lege
nd
Cru
de o
il se
nt to
dom
estic
and
inte
rnat
iona
l ref
iner
ies
Ref
ined
fuel
from
do
mes
tic a
nd
inte
rnat
iona
l so
urce
s
Petro
l fro
m
inte
rnat
iona
l sou
rces
Dis
tribu
tion
Ref
ined
fuel
from
dom
estic
and
inte
rnat
iona
l sou
rces
Petro
l sen
t int
erst
ate
New
port
Shel
l
Dis
tribu
tion
Dis
tribu
tion
Dis
tribu
tion
Petro
l to
Sout
h Au
stra
lia(M
obil)
Dis
tribu
tion
Dis
tribu
tion
Dis
tribu
tion
Dis
tribu
tion
Biod
iese
l
Source: Prepared by the ACCC and RLMS Pty Ltd.
204 Monitoring of the Australian petroleum industry December 2013

Figure B.4 Western Australia, Northern Territory and South Australia oil flow schematics
Kwin
ana
Ref
iner
yBP
Ger
aldt
on (2
)BP
, She
ll
Alba
nyC
alte
x
Espe
ranc
e (2
)BP
, She
llC
rude
oil
Port
Hed
land
(2)
BP, C
alte
x
Broo
me
(2)
BP, S
hell
Car
narv
on B
asin
Nor
th W
est S
helf
Cru
de o
il fro
m in
tern
atio
nal s
ourc
esR
efin
ed fu
el fr
om in
tern
atio
nal s
ourc
es
HM
AS S
tirlin
g
WE
ST
ER
N A
US
TR
AL
IA
Term
inal
Ref
iner
y
Tran
spor
t Rou
te
Oil
Fiel
d
Ship
Tra
nspo
rt
Roa
d Tr
ansp
ort
Pipe
line
Lege
nd
Mer
eeni
eO
il Fi
elds
Brew
er E
stat
eAl
ice
Sprin
gs
Dar
win
Vopa
kR
efin
ed fu
el fr
om d
omes
tican
d in
tern
atio
nal s
ourc
es
Gro
ote
Eyla
ndt
Shel
l
NO
RT
HE
RN
TE
RR
ITO
RY
& S
OU
TH
AU
ST
RA
LIA
Larg
s N
orth
BP
Birk
enhe
ad (2
)M
obil,
Cal
tex
Port
Linc
oln
(2)
Shel
l, C
alte
x
Port
Bony
thon
Proc
essi
ng F
acili
ty
Coo
per B
asin
Oil
Fiel
ds
Moo
mba
G
athe
ring
and
Proc
essi
ng F
acili
ty
NO
RTH
ERN
TER
RIT
OR
YSO
UTH
AU
STR
ALIA
Cru
de o
il ex
porte
d an
d se
nt to
dom
estic
refin
erie
s Ref
ined
fuel
from
dom
estic
and
inte
rnat
iona
l sou
rces
From
Que
ensl
and
Dis
tribu
tion
Dis
tribu
tion
Dis
tribu
tion
Dis
tribu
tion
Dis
tribu
tion
Kew
dale
BP
Kwin
ana
Coo
gee
Che
mic
als
Mer
eeni
ePr
oces
sing
Fac
ility
Rai
l Tra
nspo
rt
Petro
l fro
m d
omes
tican
d in
tern
atio
nal s
ourc
es
Petro
l sen
t int
erst
ate
Petro
l als
o fro
min
tern
atio
nal s
ourc
es
(Mob
il on
ly)
(She
ll on
ly)
Cru
de o
il se
nt to
dom
estic
and
inte
rnat
iona
l ref
iner
ies
Nor
th F
rem
antle
BPD
istri
butio
n
Perth
Airp
ort
Dis
tribu
tion
Dis
tribu
tion
Dis
tribu
tion
Dis
tribu
tion
Dis
tribu
tion
Dis
tribu
tion
Source: Prepared by the ACCC and RLMS Pty Ltd.
Monitoring of the Australian petroleum industry December 2013 205
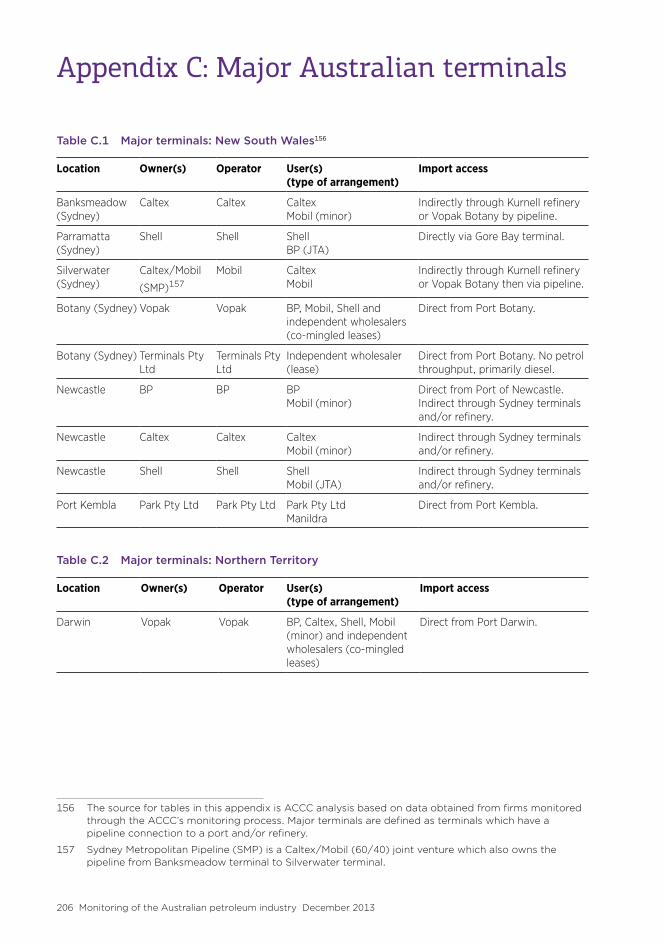
Appendix C: Major Australian terminals
Table C.1 Major terminals: New South Wales156
Location Owner(s) Operator User(s) (type of arrangement)
Import access
Banksmeadow (Sydney)
Caltex Caltex Caltex Mobil (minor)
Indirectly through Kurnell refinery or Vopak Botany by pipeline.
Parramatta (Sydney)
Shell Shell Shell BP (JTA)
Directly via Gore Bay terminal.
Silverwater (Sydney)
Caltex/Mobil
(SMP)157Mobil Caltex
MobilIndirectly through Kurnell refinery or Vopak Botany then via pipeline.
Botany (Sydney) Vopak Vopak BP, Mobil, Shell and independent wholesalers (co-mingled leases)
Direct from Port Botany.
Botany (Sydney) Terminals Pty Ltd
Terminals Pty Ltd
Independent wholesaler (lease)
Direct from Port Botany. No petrol throughput, primarily diesel.
Newcastle BP BP BP Mobil (minor)
Direct from Port of Newcastle. Indirect through Sydney terminals and/or refinery.
Newcastle Caltex Caltex Caltex Mobil (minor)
Indirect through Sydney terminals and/or refinery.
Newcastle Shell Shell Shell Mobil (JTA)
Indirect through Sydney terminals and/or refinery.
Port Kembla Park Pty Ltd Park Pty Ltd Park Pty Ltd Manildra
Direct from Port Kembla.
Table C.2 Major terminals: Northern Territory
Location Owner(s) Operator User(s) (type of arrangement)
Import access
Darwin Vopak Vopak BP, Caltex, Shell, Mobil (minor) and independent wholesalers (co-mingled leases)
Direct from Port Darwin.
156 The source for tables in this appendix is ACCC analysis based on data obtained from firms monitored through the ACCC’s monitoring process. Major terminals are defined as terminals which have a pipeline connection to a port and/or refinery.
157 Sydney Metropolitan Pipeline (SMP) is a Caltex/Mobil (60/40) joint venture which also owns the pipeline from Banksmeadow terminal to Silverwater terminal.
206 Monitoring of the Australian petroleum industry December 2013

Table C.3 Major terminals: Queensland
Location Owner(s) Operator User(s) (type of arrangement)
Import access
Lytton (Brisbane)
Caltex Caltex Caltex Indirect through Lytton refinery.
Pinkenba (Brisbane)
Shell Shell Shell Direct from own port. Indirect through both Brisbane refineries.
Whinstanes (Brisbane)
BP BP BP Mobil (JTA)
Indirect through Bulwer Island refinery. Import by Mobil not allowed under current JTA.
Eagle Farm (Brisbane)
Neumann Neumann Neumann Independent wholesalers (hosted)
Direct from own port. Indirect through both Brisbane refineries.
Bundaberg Stolthaven Stolthaven Unused Direct from port.
Cairns BP BP BP Mobil (hosted)
Direct from port.
Cairns Caltex Caltex Caltex Mobil (minor)
Direct from port.
Cairns Shell Shell Shell Mobil (minor)
Direct from port.
Gladstone BP/Shell BP BP Shell
Direct from port.
Gladstone Caltex Caltex Caltex Mobil
Direct from port.
Mackay BP BP BP Mobil (hosted)
Direct from port.
Mackay Caltex Caltex Caltex Mobil (minor)
Direct from port.
Mackay Shell Shell Shell Direct from port.
Port Alma Stolthaven Stolthaven Independent wholesaler Direct from port. No petrol throughput, diesel only.
Townsville BP BP BP Mobil (hosted)
Direct from port.
Townsville Caltex/Shell Shell Caltex, Shell Mobil (minor)
Direct from port.
Monitoring of the Australian petroleum industry December 2013 207

Table C.4 Major terminals: South Australia
Location Owner(s) Operator User(s) (type of arrangement)
Import access
Birkenhead (Adelaide)
Caltex Caltex Caltex Direct from port.
Birkenhead (Adelaide)
Mobil Mobil Mobil Shell (JTA) Caltex (minor)
Direct from port.
Largs North (Adelaide)
BP BP BP Caltex (minor) Mobil (minor)
Direct from port.
Port Lincoln Caltex Caltex Caltex Direct from port.
Port Lincoln Shell Shell Shell Mobil (hosted) BP (minor) (hosted)
Direct from port.
Table C.5 Major terminals: Tasmania
Location Owner(s) Operator User(s) (type of arrangement)
Import access
Hobart BP BP BP Direct from port.
Hobart Caltex Caltex Caltex Shell (hosted) Mobil (minor)
Direct from port.
Bell Bay United United United Direct from port.
Burnie BP BP BP Caltex (minor) (hosted)
Direct from port.
Devonport Shell Shell Shell Caltex (JTA)
Direct from port.
Table C.6 Major terminals: Victoria
Location Owner(s) Operator User(s) (type of arrangement)
Import access
Newport (Melbourne)
Caltex Caltex Caltex Direct from Holden Dock.
Newport (Melbourne)
Shell Shell Shell Caltex (minor)
Direct from Holden Dock.
Yarraville (Melbourne)
Mobil Mobil Mobil BP (JTA) Caltex (minor)
Direct from Holden Dock.
Coode Island (Melbourne)
Terminals Pty Ltd
Terminals Pty Ltd
Third party (lease) Direct from port. No petrol throughput; has ethanol capacity.
Corio (Geelong) Shell Shell Shell Caltex
Indirect through refinery. Terminal is truck gantry at Geelong refinery.
Hastings United United United Direct from port.
208 Monitoring of the Australian petroleum industry December 2013

Table C.7 Major terminals: Western Australia
Location Owner(s) Operator User(s) (type of arrangement)
Import access
Kewdale (Perth) BP BP BP Caltex (hosted)
Indirect through Kwinana refinery.
North Fremantle (Perth)
BP BP BP Indirect through Kwinana refinery. Minimal petrol throughput.
Kwinana (Perth) Coogee Coogee Caltex, Mobil, Shell, and independent wholesalers (hosted)
Direct from port.
Albany Caltex Caltex Caltex Direct from port.
Broome BP BP BP Caltex (minor) (hosted)
Direct from port.
Broome Shell Shell Shell Direct from port.
Esperance BP BP BP Direct from port.
Esperance Shell Shell Shell Caltex (hosted)
Direct from port.
Geraldton BP BP BP Caltex (hosted)
Direct from port.
Geraldton Shell Shell Shell Caltex (hosted)
Direct from port.
Port Hedland BP BP BP Caltex
Direct from port.
Port Hedland Caltex Caltex Caltex Direct from port. No petrol throughput.
Monitoring of the Australian petroleum industry December 2013 209

Appendix D: E10 price monitoring
This appendix presents information on the ACCC’s E10 price monitoring for the period October 2012 to September 2013.158
E10 is regular unleaded petrol (RULP) which includes up to 10 per cent ethanol. The prices monitored are those for RULP and regular E10. The monitoring therefore excludes premium unleaded petrol that contains ethanol and E85.
E10 prices are collected from various retail sites in a particular location and compared with the RULP prices at those retail sites. To be included in this analysis retail sites must sell both E10 and RULP.159
Eight regional locations have been added to the monitoring programme since last years’ report and nine regional locations have dropped out. In addition, Perth, Hobart and Darwin have been added.160 Over the period October 2012 to September 2013 the ACCC received data for all capital cities and 29 regional locations.
Some methodological issues relating to the collection and reporting of this price data are outlined at the end of this appendix.
Aggregate categoriesTable D.1 shows quarterly average differentials between RULP and E10 prices across all of the locations included in the ACCC’s E10 price monitoring program for the period October 2012 to September 2013. It also breaks this down into two further categories: capital cities in aggregate and regional locations in aggregate.
Table D.1 Quarterly average RULP – E10 differentials: December 2012 to September 2013
Quarter
All locations cpl
Capital cities cpl
Regional locations cpl
Dec-12 2.0 2.3 2.0
Mar-13 2.0 2.1 2.0
Jun-13 2.0 2.0 2.0
Sep-13 2.1 2.1 2.1
Table D.1 shows that the monthly average differential between RULP and E10 prices across all the locations in the ACCC’s E10 price monitoring program was broadly stable at around 2.0 cents per litre over the period.
158 E10 price monitoring reports for the December 2006 quarter and the March, June and September 2007 quarters are available from the ACCC website at: http://www.accc.gov.au/publications/ethanol-pricing-quarterly-reports. Data from October 2007 to September 2012 can be found in past ACCC petrol monitoring reports.
The source for all data in this appendix is ACCC and Informed Sources. Note that some figures in the tables may not add exactly due to rounding. Where data is not available it is identified in the tables as ‘n/a’.
159 This is different from the RULP-E10 differential in chapter 8, which compares market average RULP prices with market average E10 prices.
160 These are identified in the methodological section at the end of this appendix.
210 Monitoring of the Australian petroleum industry December 2013

Specific locationsTable D.2 shows quarterly average RULP and E10 prices and the differential for each capital city and regional location across Australia included in the monitoring program in the period October 2012 to September 2013. For a location to be included in the table, price data over the full quarter had to be available.161
The table includes all eight capital cities and 25 regional locations (13 in New South Wales (NSW) and 12 in Queensland).
161 Regional locations not included in the table because price data for a full quarter was not available were: Moree in NSW and Ayr, Childers and Home Hill in Queensland.
Monitoring of the Australian petroleum industry December 2013 211

Table D.2 Quarterly average RULP and E10 prices and the differential: December 2012 to September 2013
Location Quarter RULP cpl
E10 cpl
Differential cpl
Sydney Dec-12 140.4 138.1 2.3
Mar-13 143.2 140.8 2.4
Jun-13 139.1 136.7 2.4
Sep-13 150.1 147.8 2.3
Melbourne Dec-12 140.7 138.3 2.4
Mar-13 142.9 140.3 2.6
Jun-13 138.4 136.1 2.3
Sep-13 149.1 146.9 2.2
Brisbane Dec-12 143.6 141.6 2.0
Mar-13 146.3 144.1 2.2
Jun-13 141.4 139.4 2.0
Sep-13 151.6 149.4 2.2
Adelaide Dec-12 139.8 137.1 2.7
Mar-13 141.5 138.9 2.6
Jun-13 137.1 134.8 2.3
Sep-13 147.8 145.6 2.2
Perth Dec-12 n/a n/a n/a
Mar-13 n/a n/a n/a
Jun-13 137.2 135.2 2.0
Sep-13 148.2 146.2 2.0
Canberra Dec-12 152.4 150.7 1.7
Mar-13 151.1 149.3 1.8
Jun-13 150.6 148.9 1.7
Sep-13 157.0 155.2 1.8
Hobart Dec-12 152.2 151.0 1.2
Mar-13 152.9 151.9 1.0
Jun-13 150.2 149.2 1.0
Sep-13 160.0 159.0 1.0
Darwin Dec-12 n/a n/a n/a
Mar-13 n/a n/a n/a
Jun-13 n/a n/a n/a
Sep-13 165.1 161.8 3.3
212 Monitoring of the Australian petroleum industry December 2013
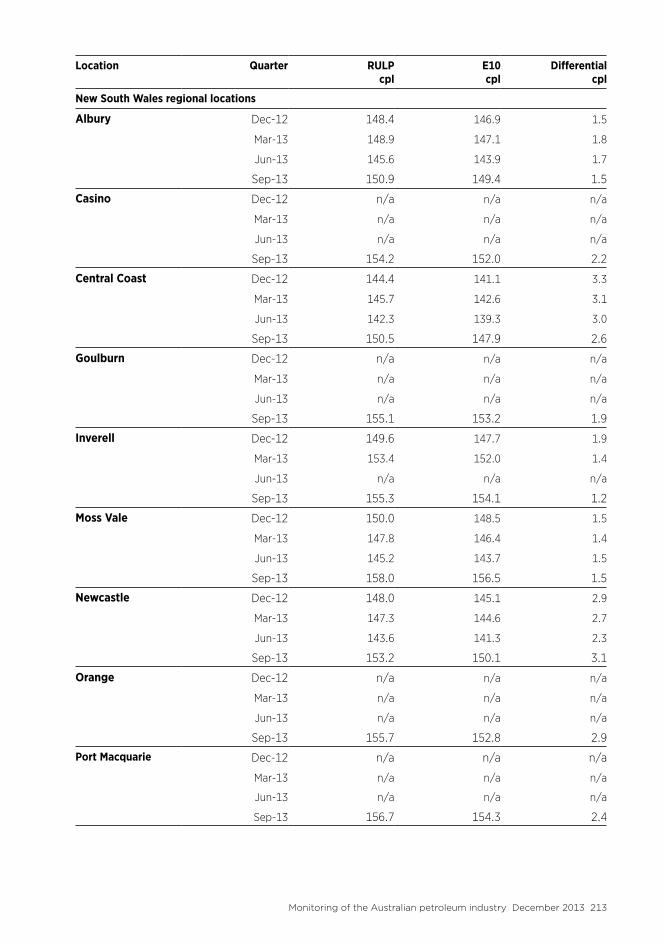
Location Quarter RULP cpl
E10 cpl
Differential cpl
New South Wales regional locations
Albury Dec-12 148.4 146.9 1.5
Mar-13 148.9 147.1 1.8
Jun-13 145.6 143.9 1.7
Sep-13 150.9 149.4 1.5
Casino Dec-12 n/a n/a n/a
Mar-13 n/a n/a n/a
Jun-13 n/a n/a n/a
Sep-13 154.2 152.0 2.2
Central Coast Dec-12 144.4 141.1 3.3
Mar-13 145.7 142.6 3.1
Jun-13 142.3 139.3 3.0
Sep-13 150.5 147.9 2.6
Goulburn Dec-12 n/a n/a n/a
Mar-13 n/a n/a n/a
Jun-13 n/a n/a n/a
Sep-13 155.1 153.2 1.9
Inverell Dec-12 149.6 147.7 1.9
Mar-13 153.4 152.0 1.4
Jun-13 n/a n/a n/a
Sep-13 155.3 154.1 1.2
Moss Vale Dec-12 150.0 148.5 1.5
Mar-13 147.8 146.4 1.4
Jun-13 145.2 143.7 1.5
Sep-13 158.0 156.5 1.5
Newcastle Dec-12 148.0 145.1 2.9
Mar-13 147.3 144.6 2.7
Jun-13 143.6 141.3 2.3
Sep-13 153.2 150.1 3.1
Orange Dec-12 n/a n/a n/a
Mar-13 n/a n/a n/a
Jun-13 n/a n/a n/a
Sep-13 155.7 152.8 2.9
Port Macquarie Dec-12 n/a n/a n/a
Mar-13 n/a n/a n/a
Jun-13 n/a n/a n/a
Sep-13 156.7 154.3 2.4
Monitoring of the Australian petroleum industry December 2013 213

Location Quarter RULP cpl
E10 cpl
Differential cpl
Tamworth Dec-12 n/a n/a n/a
Mar-13 n/a n/a n/a
Jun-13 n/a n/a n/a
Sep-13 155.7 152.5 3.2
Taree Dec-12 n/a n/a n/a
Mar-13 n/a n/a n/a
Jun-13 n/a n/a n/a
Sep-13 155.8 153.8 2.0
Tweed Heads South Dec-12 145.6 143.8 1.8
Mar-13 147.2 145.4 1.8
Jun-13 141.1 139.3 1.8
Sep-13 149.1 147.4 1.7
Wollongong Dec-12 144.9 142.3 2.6
Mar-13 147.7 145.5 2.2
Jun-13 143.1 141.0 2.1
Sep-13 153.8 151.7 2.1
Queensland regional locations
Bowen Dec-12 150.4 148.2 2.2
Mar-13 153.5 150.9 2.6
Jun-13 150.7 148.2 2.5
Sep-13 157.9 155.4 2.5
Bundaberg Dec-12 146.0 144.0 2.0
Mar-13 146.7 144.7 2.0
Jun-13 148.8 146.8 2.0
Sep-13 155.6 153.4 2.2
Cairns Dec-12 150.1 148.5 1.6
Mar-13 153.4 151.7 1.7
Jun-13 n/a n/a n/a
Sep-13 n/a n/a n/a
Gympie Dec-12 145.3 143.3 2.0
Mar-13 145.9 143.9 2.0
Jun-13 n/a n/a n/a
Sep-13 n/a n/a n/a
Hervey Bay Dec-12 146.8 145.3 1.5
Mar-13 n/a n/a n/a
Jun-13 n/a n/a n/a
Sep-13 n/a n/a n/a
214 Monitoring of the Australian petroleum industry December 2013

Location Quarter RULP cpl
E10 cpl
Differential cpl
Ingham
Dec-12 151.4 149.4 2.0
Mar-13 153.9 151.9 2.0
Jun-13 151.3 149.3 2.0
Sep-13 155.3 153.3 2.0
Maryborough Dec-12 n/a n/a n/a
Mar-13 n/a n/a n/a
Jun-13 n/a n/a n/a
Sep-13 155.6 154.1 1.5
Rockhampton Dec-12 149.8 148.2 1.6
Mar-13 152.4 150.8 1.6
Jun-13 n/a n/a n/a
Sep-13 155.7 153.7 2.0
Toowoomba Dec-12 146.3 144.5 1.8
Mar-13 145.7 143.9 1.8
Jun-13 141.0 139.2 1.8
Sep-13 151.4 149.6 1.8
Townsville Dec-12 145.2 142.6 2.6
Mar-13 149.6 147.0 2.6
Jun-13 149.0 146.6 2.4
Sep-13 154.6 152.2 2.4
Warwick Dec-12 n/a n/a n/a
Mar-13 n/a n/a n/a
Jun-13 n/a n/a n/a
Sep-13 149.1 147.1 2.0
Whitsunday Dec-12 147.1 145.5 1.6
Mar-13 150.7 149.2 1.5
Jun-13 146.8 145.2 1.6
Sep-13 152.7 151.2 1.5
Methodology
CoverageThe ACCC obtains petrol price data from Informed Sources. Informed Sources price monitoring involves sampling. Informed Sources currently monitors fuel prices at around 4200 retail sites in Australia. There are currently around 6400 retail sites in Australia. Therefore, the Informed Sources monitoring covers around two thirds of the total number of retail sites. All of the capital cities and most of the major regional centres are included in the Informed Sources price monitoring, as are a representative sample of other regional locations.
Monitoring of the Australian petroleum industry December 2013 215

Informed Sources collects E10 price data from all states and territories. As at early October 2013 Informed Sources collected E10 prices from around 1250 retail sites across Australia. Of this total, around 44 per cent of these retail sites are included in the locations covered in this appendix.
The number of locations included in the E10 monitoring program in 2012−13 increased by two locations from last year to 37 locations.
• Regional locations which were included in last year’s E10 monitoring program but which have since dropped out are: Bathurst, Bulahdelah, Dubbo, Kempsey, Moruya and Tweed Heads in NSW, and Dalby, Gladstone and Mackay in Queensland.
• Regional locations which were added in 2012−13 are: Casino, Goulburn, Orange, Port Macquarie, Moree and Tamworth in NSW and Ayr and Home Hill in Queensland.
• Perth, Hobart and Darwin were added to the E10 monitoring program in 2012−13.
DatacollectionInformed Sources obtains daily average E10 and RULP prices for the locations included in this appendix. The monthly averages are derived from daily average prices. E10 prices collected are for regular E10. They do not include premium unleaded petrol that contains ethanol or E85.
The daily E10 price for these locations is the average price at retail sites selling E10 that are monitored by Informed Sources. The daily RULP price is the average price at those retail sites. Therefore, the average RULP price for a particular location included in this report may be different from the overall average RULP price in that location.
To ensure the robustness of the price data:
• Locations are only included in the tables where Informed Sources obtains daily E10 prices from two or more retail sites in that location.
• Daily price data is only included in the monthly average where both E10 and RULP prices for that day are available. To derive a monthly average price, daily average prices need to be available for at least 14 days in that month.
• Informed Sources may exclude data from some retail sites where it has concerns about the robustness and accuracy of either the E10 or RULP price data.
In some locations there are significant variations in the quarterly price differential between RULP and E10. These variations are influenced by factors such as the specific retail sites included in the monitoring each month and changes to the pricing policies at retail sites.
216 Monitoring of the Australian petroleum industry December 2013

Appendix E: Gross indicative retail differences
This appendix provides data on gross indicative retail differences (subsequently referred to as ‘differences’) for petrol.162 These differences are calculated by subtracting average terminal gate prices (TGPs) from average retail prices.
Differences for the five largest cities in aggregate were discussed in chapter 8. This appendix provides differences for each of the cities individually.163 They are shown annually for the period 2008−09 to 2012−13 in both nominal and real terms (relative to 2012−13 prices).164 They are also shown monthly for 2012−13.
It is important to remember that these differences are a useful benchmark only and they should not be confused with actual profits.
162 All references to petrol in this appendix are to RULP.
163 Sources for the data in this appendix are: ACCC, Informed Sources, BP, Caltex, Mobil, Shell, WA FuelWatch, and Australian Bureau of Statistics.
164 Australian Bureau of Statistics, 6401.0 Consumer Price Index, Australia, Table 1. CPI: All Groups, Index Numbers and Percentage Changes, http://www.abs.gov.au/AUSSTATS, accessed 4 October 2013.
Monitoring of the Australian petroleum industry December 2013 217

Sydney
Table E.1 Annual average retail petrol prices, TGPs and differences, Sydney: 2008−09 to 2012−13
Average retail price cpl
Average TGP cpl
Difference(nominal)
cpl
Difference(real)
cpl
2008−09 128.2 122.1 6.1 6.7
2009−10 123.4 117.0 6.4 6.9
2010−11 131.7 124.1 7.6 8.0
2011−12 141.9 135.2 6.7 6.9
2012−13 140.4 134.6 5.8 5.8
Average difference 6.5 6.8
The annual average real difference over the five years was 6.8 cents per litre (cpl). It ranged from a low of 5.8 cpl in 2012−13 to a high of 8.0 cpl in 2010−11.
Table E.2 Monthly average retail petrol prices, TGPs and differences, Sydney: July 2012 to June 2013
Average retail price cpl
Average TGP cpl
Difference cpl
Jul-12 131.3 126.7 4.6
Aug-12 140.8 135.5 5.3
Sep-12 142.8 136.6 6.2
Oct-12 144.5 137.6 6.9
Nov-12 138.5 132.5 6.0
Dec-12 139.2 132.1 7.1
Jan-13 139.1 133.8 5.3
Feb-13 146.2 141.5 4.7
Mar-13 144.9 138.5 6.4
Apr-13 137.1 130.6 6.5
May-13 136.9 131.3 5.6
Jun-13 143.6 138.9 4.7
Average difference 5.8
The monthly average difference in 2012−13 ranged from a low of 4.6 cpl in July 2012 to a high of 7.1 cpl in December 2012.
218 Monitoring of the Australian petroleum industry December 2013

Melbourne
Table E.3 Annual average retail petrol prices, TGPs and differences, Melbourne: 2008−09 to 2012−13
Average retail price cpl
Average TGP cpl
Difference(nominal)
cpl
Difference(real)
cpl
2008−09 129.9 121.8 8.1 8.9
2009−10 125.3 116.7 8.6 9.3
2010−11 131.6 123.6 8.0 8.4
2011−12 141.1 134.7 6.4 6.5
2012−13 140.2 134.1 6.1 6.1
Average difference 7.4 7.8
The annual average real difference over the five years was 7.8 cpl. It ranged from a low of 6.1 cpl in 2012−13 to a high of 9.3 cpl in 2009−10.
Table E.4 Monthly average retail petrol prices, TGPs and differences, Melbourne: July 2012 to June 2013
Average retail price cpl
Average TGP cpl
Difference cpl
Jul-12 131.5 126.0 5.5
Aug-12 138.7 135.1 3.6
Sep-12 142.4 136.1 6.3
Oct-12 145.0 137.1 7.9
Nov-12 138.8 132.0 6.8
Dec-12 139.6 131.6 8.0
Jan-13 139.4 133.3 6.1
Feb-13 147.1 141.0 6.1
Mar-13 143.8 138.0 5.8
Apr-13 135.9 130.0 5.9
May-13 136.2 130.7 5.5
Jun-13 144.5 138.3 6.2
Average difference 6.1
The monthly average difference over 2012−13 ranged from a low of 3.6 cpl in August 2012 to a high of 8.0 cpl in December 2012.
Monitoring of the Australian petroleum industry December 2013 219
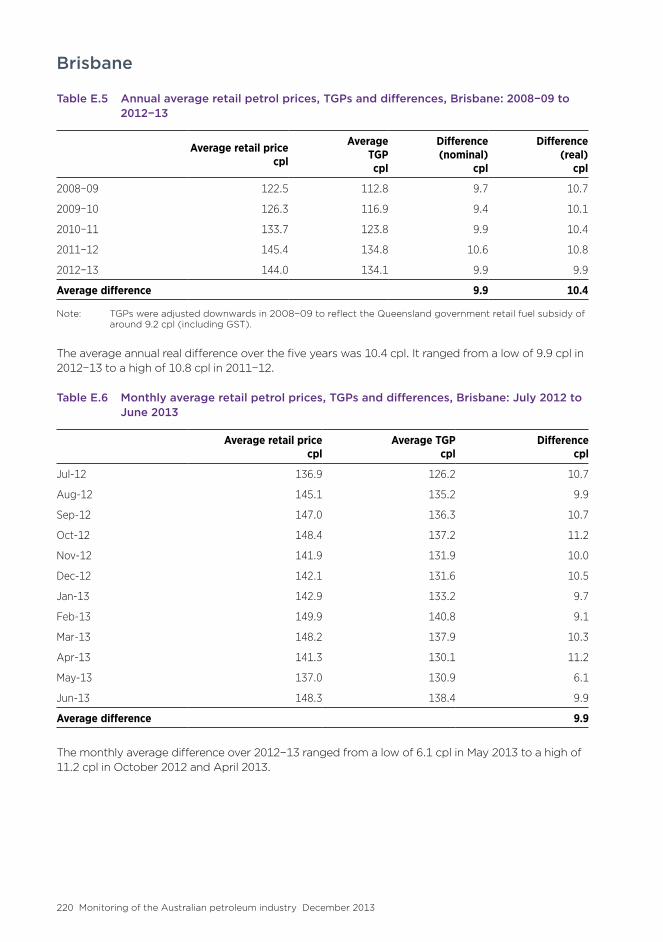
Brisbane
Table E.5 Annual average retail petrol prices, TGPs and differences, Brisbane: 2008−09 to 2012−13
Average retail price cpl
Average TGP cpl
Difference(nominal)
cpl
Difference(real)
cpl
2008−09 122.5 112.8 9.7 10.7
2009−10 126.3 116.9 9.4 10.1
2010−11 133.7 123.8 9.9 10.4
2011−12 145.4 134.8 10.6 10.8
2012−13 144.0 134.1 9.9 9.9
Average difference 9.9 10.4
Note: TGPs were adjusted downwards in 2008−09 to reflect the Queensland government retail fuel subsidy of around 9.2 cpl (including GST).
The average annual real difference over the five years was 10.4 cpl. It ranged from a low of 9.9 cpl in 2012−13 to a high of 10.8 cpl in 2011−12.
Table E.6 Monthly average retail petrol prices, TGPs and differences, Brisbane: July 2012 to June 2013
Average retail price cpl
Average TGP cpl
Difference cpl
Jul-12 136.9 126.2 10.7
Aug-12 145.1 135.2 9.9
Sep-12 147.0 136.3 10.7
Oct-12 148.4 137.2 11.2
Nov-12 141.9 131.9 10.0
Dec-12 142.1 131.6 10.5
Jan-13 142.9 133.2 9.7
Feb-13 149.9 140.8 9.1
Mar-13 148.2 137.9 10.3
Apr-13 141.3 130.1 11.2
May-13 137.0 130.9 6.1
Jun-13 148.3 138.4 9.9
Average difference 9.9
The monthly average difference over 2012−13 ranged from a low of 6.1 cpl in May 2013 to a high of 11.2 cpl in October 2012 and April 2013.
220 Monitoring of the Australian petroleum industry December 2013

Adelaide
Table E.7 Annual average retail petrol prices, TGPs and differences, Adelaide: 2008−09 to 2012−13
Average retail price cpl
Average TGP cpl
Difference(nominal)
cpl
Difference(real)
cpl
2008−09 128.7 122.6 6.1 6.7
2009−10 123.6 117.4 6.2 6.7
2010−11 130.0 124.1 5.9 6.2
2011−12 142.1 135.1 7.0 7.2
2012−13 140.1 134.3 5.8 5.8
Average difference 6.2 6.5
The average annual real difference over the five years was 6.5 cpl. It ranged from a low of 5.8 cpl in 2012−13 to a high of 7.2 cpl in 2011−12.
Table E.8 Monthly average retail petrol prices, TGPs and differences, Adelaide: July 2012 to June 2013
Average retail price cpl
Average TGP cpl
Difference cpl
Aug-12 141.5 135.5 6.0
Sep-12 143.1 136.6 6.5
Oct-12 144.3 137.5 6.8
Nov-12 138.1 132.2 5.9
Dec-12 138.9 131.8 7.1
Jan-13 139.1 133.4 5.7
Feb-13 142.1 141.0 1.1
Mar-13 144.6 138.1 6.5
Apr-13 137.2 130.3 6.9
May-13 135.5 131.0 4.5
Jun-13 144.2 138.6 5.6
Average difference 5.8
The monthly average difference over 2012−13 ranged from a low of 1.1 cpl in February 2013 to a high of 7.1 cpl in December 2012.
Monitoring of the Australian petroleum industry December 2013 221

Perth
Table E.9 Annual average retail petrol prices, TGPs and differences, Perth: 2008−09 to 2012−13
Average retail price cpl
Average TGP cpl
Difference(nominal)
cpl
Difference(real)
cpl
2008−09 126.2 122.7 3.5 3.9
2009−10 122.3 118.2 4.1 4.4
2010−11 131.5 124.8 6.7 7.0
2011−12 143.3 135.4 7.9 8.1
2012−13 141.9 134.0 7.9 7.9
Average difference 6.0 6.3
The average annual real difference over the five years was 6.3 cpl. It ranged from a low of 3.9 cpl in 2008−09 to a high of 8.1 cpl in 2011−12.
Table E.10 Monthly average retail petrol prices, TGPs and differences, Perth: July 2012 to June 2013
Average retail price cpl
Average TGP cpl
Difference cpl
Jul-12 133.5 126.5 7.0
Aug-12 142.4 135.6 6.8
Sep-12 145.0 136.7 8.3
Oct-12 145.1 137.5 7.6
Nov-12 139.7 132.0 7.7
Dec-12 139.7 131.6 8.1
Jan-13 140.5 133.2 7.3
Feb-13 147.5 140.9 6.6
Mar-13 147.5 137.6 9.9
Apr-13 138.9 129.4 9.5
May-13 137.8 130.2 7.6
Jun-13 145.9 137.8 8.1
Average difference 7.9
The monthly average difference over 2012−13 ranged from a low of 6.6 cpl in February 2013 to a high of 9.9 cpl in March 2013.
222 Monitoring of the Australian petroleum industry December 2013

Appendix F: Annual retail fuel prices in all monitored locations
The ACCC monitors fuel prices in all capital cities and around 180 regional locations across Australia.
Annual average regular unleaded petrol, diesel, automotive LPG and E10 retail prices in these locations in 2012−13 are shown in table F.1.165
165 For a price to be included in the table it had to meet a number of quality thresholds. In general, there had to be a price observation on at least 75 per cent of days over the year, with no break in price data of more than 30 consecutive days. In cases where this threshold was not met, a price has still been included in the table if there was an even spread of missing data observations which would mean that a broadly reliable average price could be estimated. Prices in the latter category have been identified for automotive LPG in Hay in New South Wales and Kingaroy, Miles and Mt Isa in Queensland. A degree of caution is required in using the prices of these locations.
E10 price data is only available for the capital cities and a number of regional locations in New South Wales and Queensland.
The source for all prices in this appendix is ACCC calculations based on Informed Sources data.
Monitoring of the Australian petroleum industry December 2013 223

Table F.1 Annual average regular unleaded petrol, diesel, automotive LPG and E10 retail prices in cents per litre: 2012−13
Location RULP Diesel LPG E10 RULP Diesel LPG E10
New South Wales
Sydney 140.4 146.6 70.2 138.8 Lismore 147.3 150.8 83.6 144.7
Albury 145.5 149.3 69.8 144.2 Lithgow 150.5 151.3 82.1 145.6
Armidale 153.6 85.1 149.9 Merimbula 152.9 85.0
Ballina 152.6 80.0 146.3 Mittagong 159.4 78.2 149.2
Batemans Bay 156.0 86.8 151.4 Moama 145.2 147.1 73.3
Bathurst 148.9 151.5 80.0 145.9 Moree 150.7 151.1 91.4
Bega 153.1 155.9 92.3 Moruya 151.1 154.5 95.7 149.5
Broken Hill 150.9 154.6 86.4 Moss Vale 149.6 154.3 72.8 146.7
Bulahdelah 147.1 150.4 146.9 Mudgee 154.6 155.1 83.8 150.6
Buronga 147.0 149.9 75.1 Murwillumbah 147.5 152.6 84.4
Canberra 149.6 150.4 77.4 147.7 Muswellbrook 146.9 152.0 86.5
Casino 146.7 149.7 85.6 144.0 Narrabri 151.8 155.2 93.9
Central Coast 143.3 149.5 72.8 140.5 Newcastle 145.2 149.2 77.3 142.7
Coffs Harbour 150.9 152.2 81.9 149.5 Nowra 147.4 152.4 79.4 145.7
Cooma 153.9 160.6 95.0 Nyngan 103.1
Cootamundra 152.3 154.3 91.8 Orange 147.0 152.3 87.9 147.5
Cowra 151.3 92.0 144.7 Parkes 149.0 150.5 88.4
Deniliquin 148.5 151.0 87.3 Port Macquarie 151.9 155.2 85.1 149.9
Dubbo 149.0 151.3 81.4 Queanbeyan 148.5 148.3 78.7 147.0
Forbes 149.6 150.6 92.4 Singleton 144.8 150.0 80.3 143.1
Forster 149.6 154.8 82.9 148.0 Tamworth 152.6 154.7 83.7 149.0
Gilgandra 150.0 152.7 86.2 Taree 149.6 148.6 68.2 147.5
Glen Innes 146.0 79.9 142.5 Temora 149.4 152.2 91.5
Goulburn 149.6 76.5 145.2 Tumut 155.3 160.2 84.4
Grafton 146.1 150.9 86.7 Tweed Heads South
144.5 148.9 70.0 142.3
Griffith 148.6 153.3 88.8 Ulladulla 85.8 148.4
Gundagai 149.4 151.2 85.5 Wagga Wagga 151.0 151.9 81.3 149.0
Gunnedah 149.9 151.8 91.5 148.6 Wauchope 149.7 152.5 86.4
Hay 149.6 151.9 Wellington 151.7 152.1 81.8
Inverell 149.5 151.6 94.4 148.6 West Wyalong 150.0 153.2 92.3 148.7
Jerilderie 149.5 147.8 85.8 Wollongong 146.3 149.0 75.1 141.7
Kempsey 147.0 150.2 80.5 Woolgoolga 151.9 154.3
Leeton 148.6 152.2 84.0 Yass 149.9 151.6 76.5 144.3
224 Monitoring of the Australian petroleum industry December 2013

Location RULP Diesel LPG E10 RULP Diesel LPG E10
Northern Territory
Darwin 160.1 161.1 107.2 156.1 Katherine 155.2 157.9 109.9
Alice Springs 168.4 171.4 114.2 Tennant Creek 168.6 169.8
Queensland
Brisbane 144.0 148.5 72.2 141.5 Innisfail 152.8 155.4
Atherton 150.1 152.6 Kingaroy 146.8 150.5
Ayr 149.5 149.1 93.4 Longreach 156.8 158.6
Biloela 149.0 152.8 Mackay 147.1 151.0 89.9
Blackall 161.5 162.7 99.1 Mareeba 151.2 153.6 94.8
Blackwater 151.4 151.8 98.7 Maryborough 145.8 148.7 92.0
Bowen 150.8 149.1 95.0 148.2 Miles 155.5 154.2
Bundaberg 146.5 150.8 88.6 144.3 Moranbah 154.2 156.2
Cairns 151.7 154.5 96.1 148.9 Mt Isa 154.2 156.8
Charters Towers 151.6 151.3 95.8 Rockhampton 150.0 151.1 91.7
Childers 147.2 148.9 91.8 Roma 149.6 151.8 97.3
Dalby 147.5 148.5 89.6 Toowoomba 144.3 149.1 72.6 142.7
Emerald 151.8 151.7 92.4 Townsville 147.4 147.4 91.1 144.5
Gladstone 147.9 151.6 92.6 Tully 153.1 153.2
Goondiwindi 150.3 149.4 84.7 Warwick 142.7 148.1 84.1
Gympie 145.1 147.7 82.7 Whitsunday 143.0 148.8 85.0 146.3
Hervey Bay 146.4 150.3 84.8 144.2 Yeppoon 148.5 150.6 88.5
Ingham 151.0 150.4 91.6 149.0
South Australia
Adelaide 140.1 147.5 71.7 136.8 Murray Bridge 144.4 149.6 76.4
Bordertown 148.9 150.8 83.6 Naracoorte 145.9 148.2 76.0
Ceduna 153.9 154.5 87.3 Port Augusta 149.0 149.1 83.8
Clare 144.1 147.8 80.8 Port Lincoln 147.4 151.6 81.8
Coober Pedy 162.7 Port Pirie 144.6 148.0 81.8
Gawler 141.2 149.0 72.1 Renmark 144.6 147.5 80.7
Kadina 144.9 148.0 81.8 Tailem Bend 146.3 152.5 83.1
Keith 149.3 151.3 86.0 Victor Harbour 145.5 150.6 73.4
Loxton 146.6 151.0 84.7 Whyalla 147.8 152.9 79.0
Mt Gambier 146.4 151.5 77.6
Tasmania
Hobart 151.6 155.1 87.6 149.0 Queenstown 155.4 156.8
Burnie 152.4 154.1 90.2 Smithton 152.1 153.5
Devonport 151.9 154.9 89.2 Sorell 150.3 154.3 87.4
Huonville 153.0 155.6 91.1 Ulverstone 151.9 155.0 89.4
Launceston 152.5 155.3 87.1 Wynyard 154.6 156.4 88.7
New Norfolk 152.6 155.8 89.6
Monitoring of the Australian petroleum industry December 2013 225
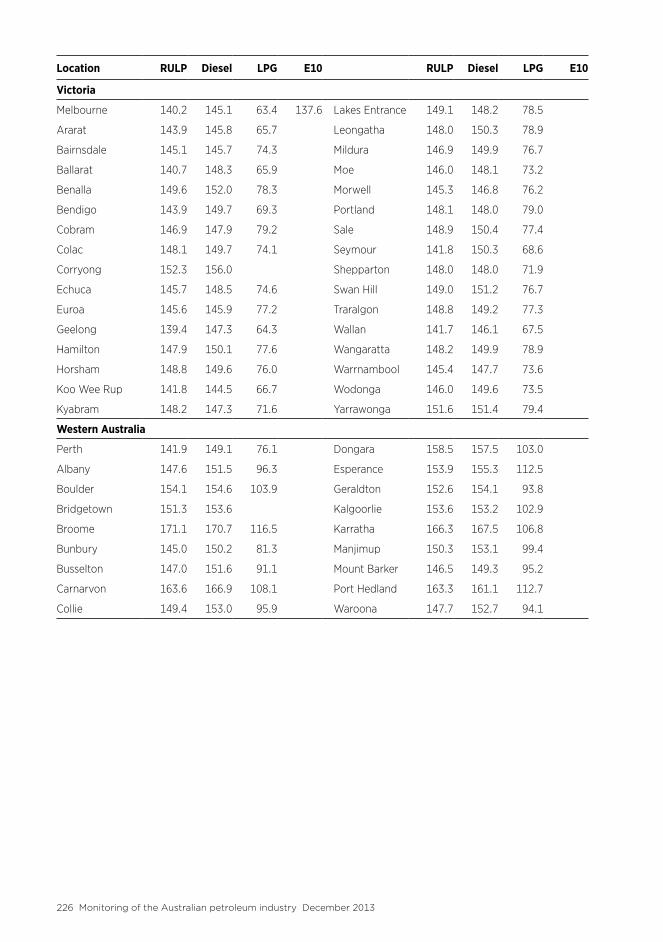
Location RULP Diesel LPG E10 RULP Diesel LPG E10
Victoria
Melbourne 140.2 145.1 63.4 137.6 Lakes Entrance 149.1 148.2 78.5
Ararat 143.9 145.8 65.7 Leongatha 148.0 150.3 78.9
Bairnsdale 145.1 145.7 74.3 Mildura 146.9 149.9 76.7
Ballarat 140.7 148.3 65.9 Moe 146.0 148.1 73.2
Benalla 149.6 152.0 78.3 Morwell 145.3 146.8 76.2
Bendigo 143.9 149.7 69.3 Portland 148.1 148.0 79.0
Cobram 146.9 147.9 79.2 Sale 148.9 150.4 77.4
Colac 148.1 149.7 74.1 Seymour 141.8 150.3 68.6
Corryong 152.3 156.0 Shepparton 148.0 148.0 71.9
Echuca 145.7 148.5 74.6 Swan Hill 149.0 151.2 76.7
Euroa 145.6 145.9 77.2 Traralgon 148.8 149.2 77.3
Geelong 139.4 147.3 64.3 Wallan 141.7 146.1 67.5
Hamilton 147.9 150.1 77.6 Wangaratta 148.2 149.9 78.9
Horsham 148.8 149.6 76.0 Warrnambool 145.4 147.7 73.6
Koo Wee Rup 141.8 144.5 66.7 Wodonga 146.0 149.6 73.5
Kyabram 148.2 147.3 71.6 Yarrawonga 151.6 151.4 79.4
Western Australia
Perth 141.9 149.1 76.1 Dongara 158.5 157.5 103.0
Albany 147.6 151.5 96.3 Esperance 153.9 155.3 112.5
Boulder 154.1 154.6 103.9 Geraldton 152.6 154.1 93.8
Bridgetown 151.3 153.6 Kalgoorlie 153.6 153.2 102.9
Broome 171.1 170.7 116.5 Karratha 166.3 167.5 106.8
Bunbury 145.0 150.2 81.3 Manjimup 150.3 153.1 99.4
Busselton 147.0 151.6 91.1 Mount Barker 146.5 149.3 95.2
Carnarvon 163.6 166.9 108.1 Port Hedland 163.3 161.1 112.7
Collie 149.4 153.0 95.9 Waroona 147.7 152.7 94.1
226 Monitoring of the Australian petroleum industry December 2013

Appendix G: Petrol price cycles and public holidays in the five largest cities
Charts G.1 to G.10 show daily average retail prices for regular unleaded petrol for the second half of 2012 and the first half of 2013 in each of the five largest cities.166 They also identify the price increase of each price cycle during the period and the dates of public holidays. The charts also provide information on the average, minimum and maximum price cycle increases in 2012 and the first half of 2013.167
166 Source for all charts: ACCC calculations based on Informed Sources data.
167 Similar charts for the period January 2007 to June 2012 are available in past ACCC petrol monitoring reports.
Monitoring of the Australian petroleum industry December 2013 227

Chart G.1 Sydney, daily average retail prices—price cycles and public holidays: 1 July to 31 December 2012
cpl
120
125
130
135
140
145
150
155
160
30–Dec–1223–Dec–1216–Dec–1209–Dec–1202–Dec–1225–Nov–1218–Nov–1211–Nov–1204–Nov–1228–Oct–1221–Oct–1214–Oct–1207–Oct–1230–Sep–1223–Sep–1216–Sep–1209–Sep–1202–Sep–1226–Aug–1219–Aug–1212–Aug–1205–Aug–1229–Jul–1222–Jul–1215–Jul–1208–Jul–1201–Jul–12
30–D
ec–1
2
23–D
ec–1
2
16–D
ec–1
2
9–D
ec–1
2
2–D
ec–1
2
25–N
ov–1
2
18–N
ov–1
2
11–N
ov–1
2
4–N
ov–1
2
28–O
ct–1
2
21–O
ct–1
2
14–O
ct–1
2
7–O
ct–1
2
30–S
ep–1
2
23–S
ep–1
2
16–S
ep–1
2
9–Se
p–12
2–Se
p–12
26–A
ug–1
2
19–A
ug–1
2
12–A
ug–1
2
5–A
ug–1
2
29–J
ul–1
2
22–J
ul–1
2
15–J
ul–1
2
8–Ju
l–12
1–Ju
l–12
2012 minimum price cycle increase: 8.1 cpl2012 maximum price cycle increase: 16.6 cpl2012 average price cycle increase: 12.0 cpl
Mon 6 AugBank Holiday
Mon 1 OctLabour Day
Tue 25 DecChristmas Day
16.612.8
12.6
12.8
12.5
15.015.8
13.4
16.2
8.114.7 12.0
9.5
Chart G.2 Sydney, daily average retail prices—price cycles and public holidays: 1 January to 30 June 2013
cpl
120
125
130
135
140
145
150
155
160
25–Jun–1318–Jun–1311–Jun–1304–Jun–1328–May–1321–May–1314–May–1307–May–1330–Apr–1323–Apr–1316–Apr–1309–Apr–1302–Apr–1326–Mar–1319–Mar–1312–Mar–1305–Mar–1326–Feb–1319–Feb–1312–Feb–1305–Feb–1329–Jan–1322–Jan–1315–Jan–1308–Jan–1301–Jan–13
25–J
un–1
3
18–J
un–1
3
11–J
un–1
3
4–Ju
n–13
28–M
ay–1
3
21–M
ay–1
3
14–M
ay–1
3
7–M
ay–1
3
30–A
pr–1
3
23–A
pr–1
3
16–A
pr–1
3
9–A
pr–1
3
2–A
pr–1
3
26–M
ar–1
3
19–M
ar–1
3
12–M
ar–1
3
5–M
ar–1
3
26–F
eb–1
3
19–F
eb–1
3
12–F
eb–1
3
5–Fe
b–13
29–J
an–1
3
22–J
an–1
3
15–J
an–1
3
8–Ja
n–13
1–Ja
n–13
1st half 2013 minimum price cycle increase: 10.7 cpl1st half 2013 maximum price cycle increase: 17.3 cpl1st half 2013 average price cycle increase: 14.2 cpl
Mon 28 JanAustralia Day
Mon 1 JanNew Year’s Day
Fri 29 MarEaster
Thu 25 AprAnzac Day
Mon 10 JunQueen’s Birthday
15.213.2
14.7
13.4 10.7
13.1
14.3
16.3
17.3
228 Monitoring of the Australian petroleum industry December 2013

Chart G.3 Melbourne, daily average retail prices—price cycles and public holidays: 1 July to 31 December 2012
cpl
120
125
130
135
140
145
150
155
160
30–Dec–1223–Dec–1216–Dec–1209–Dec–1202–Dec–1225–Nov–1218–Nov–1211–Nov–1204–Nov–1228–Oct–1221–Oct–1214–Oct–1207–Oct–1230–Sep–1223–Sep–1216–Sep–1209–Sep–1202–Sep–1226–Aug–1219–Aug–1212–Aug–1205–Aug–1229–Jul–1222–Jul–1215–Jul–1208–Jul–1201–Jul–12
30–D
ec–1
2
23–D
ec–1
2
16–D
ec–1
2
9–D
ec–1
2
2–D
ec–1
2
25–N
ov–1
2
18–N
ov–1
2
11–N
ov–1
2
4–N
ov–1
2
28–O
ct–1
2
21–O
ct–1
2
14–O
ct–1
2
7–O
ct–1
2
30–S
ep–1
2
23–S
ep–1
2
16–S
ep–1
2
9–Se
p–12
2–Se
p–12
26–A
ug–1
2
19–A
ug–1
2
12–A
ug–1
2
5–A
ug–1
2
29–J
ul–1
2
22–J
ul–1
2
15–J
ul–1
2
8–Ju
l–12
1–Ju
l–12
2012 minimum price cycle increase: 6.7 cpl2012 maximum price cycle increase: 17.9 cpl2012 average price cycle increase: 12.8 cpl
Tue 6 NovMelbourne Cup Day
Tue 25 DecChristmas Day
15.3
15.7
16.0
11.813.3 13.0 9.1
16.2
8.513.6
13.9
8.8
Chart G.4 Melbourne, daily average retail prices—price cycles and public holidays: 1 January to 30 June 2013
cpl
120
125
130
135
140
145
150
155
160
25–Jun–1318–Jun–1311–Jun–1304–Jun–1328–May–1321–May–1314–May–1307–May–1330–Apr–1323–Apr–1316–Apr–1309–Apr–1302–Apr–1326–Mar–1319–Mar–1312–Mar–1305–Mar–1326–Feb–1319–Feb–1312–Feb–1305–Feb–1329–Jan–1322–Jan–1315–Jan–1308–Jan–1301–Jan–13
25–J
un–1
3
18–J
un–1
3
11–J
un–1
3
4–Ju
n–13
28–M
ay–1
3
21–M
ay–1
3
14–M
ay–1
3
7–M
ay–1
3
30–A
pr–1
3
23–A
pr–1
3
16–A
pr–1
3
9–A
pr–1
3
2–A
pr–1
3
26–M
ar–1
3
19–M
ar–1
3
12–M
ar–1
3
5–M
ar–1
3
26–F
eb–1
3
19–F
eb–1
3
12–F
eb–1
3
5–Fe
b–13
29–J
an–1
3
22–J
an–1
3
15–J
an–1
3
8–Ja
n–13
1–Ja
n–13
1st half 2013 minimum price cycle increase: 12.6 cpl1st half 2013 maximum price cycle increase: 20.2 cpl1st half 2013 average price cycle increase: 15.5 cpl
Mon 28 JanAustralia Day
Mon 1 JanNew Year’s Day
Fri 29 MarEaster
Mon 11 MarLabour Day
Thu 25 AprAnzac Day
Mon 10 JunQueen’s Birthday
16.9 13.812.7
12.6 13.7
13.8
17.9
20.215.3
17.9
Monitoring of the Australian petroleum industry December 2013 229

Chart G.5 Brisbane, daily average retail prices—price cycles and public holidays: 1 July to 31 December 2012
cpl
120
125
130
135
140
145
150
155
160
30–Dec–1223–Dec–1216–Dec–1209–Dec–1202–Dec–1225–Nov–1218–Nov–1211–Nov–1204–Nov–1228–Oct–1221–Oct–1214–Oct–1207–Oct–1230–Sep–1223–Sep–1216–Sep–1209–Sep–1202–Sep–1226–Aug–1219–Aug–1212–Aug–1205–Aug–1229–Jul–1222–Jul–1215–Jul–1208–Jul–1201–Jul–12
30–D
ec–1
2
23–D
ec–1
2
16–D
ec–1
2
9–D
ec–1
2
2–D
ec–1
2
25–N
ov–1
2
18–N
ov–1
2
11–N
ov–1
2
4–N
ov–1
2
28–O
ct–1
2
21–O
ct–1
2
14–O
ct–1
2
7–O
ct–1
2
30–S
ep–1
2
23–S
ep–1
2
16–S
ep–1
2
9–Se
p–12
2–Se
p–12
26–A
ug–1
2
19–A
ug–1
2
12–A
ug–1
2
5–A
ug–1
2
29–J
ul–1
2
22–J
ul–1
2
15–J
ul–1
2
8–Ju
l–12
1–Ju
l–12
2012 minimum price cycle increase: 4.7 cpl2012 maximum price cycle increase: 13.3 cpl2012 average price cycle increase: 10.4 cpl
Wed 15 AugShow Day
Tue 25 DecChristmas Day
6.0
11.9
10.8 10.9
11.4
11.1 11.911.4 12.5
11.9
8.311.7
10.4
6.9
Chart G.6 Brisbane, daily average retail prices—price cycles and public holidays: 1 January to 30 June 2013
cpl
120
125
130
135
140
145
150
155
160
25–Jun–1318–Jun–1311–Jun–1304–Jun–1328–May–1321–May–1314–May–1307–May–1330–Apr–1323–Apr–1316–Apr–1309–Apr–1302–Apr–1326–Mar–1319–Mar–1312–Mar–1305–Mar–1326–Feb–1319–Feb–1312–Feb–1305–Feb–1329–Jan–1322–Jan–1315–Jan–1308–Jan–1301–Jan–13
25–J
un–1
3
18–J
un–1
3
11–J
un–1
3
4–Ju
n–13
28–M
ay–1
3
21–M
ay–1
3
14–M
ay–1
3
7–M
ay–1
3
30–A
pr–1
3
23–A
pr–1
3
16–A
pr–1
3
9–A
pr–1
3
2–A
pr–1
3
26–M
ar–1
3
19–M
ar–1
3
12–M
ar–1
3
5–M
ar–1
3
26–F
eb–1
3
19–F
eb–1
3
12–F
eb–1
3
5–Fe
b–13
29–J
an–1
3
22–J
an–1
3
15–J
an–1
3
8–Ja
n–13
1–Ja
n–13
1st half 2013 minimum price cycle increase: 8.9 cpl1st half 2013 maximum price cycle increase: 15.9 cpl1st half 2013 average price cycle increase: 12.3 cpl
Mon 28 JanAustralia Day
Mon 1 JanNew Year’s Day
Fri 29 MarEaster
Thu 25 AprAnzac Day
Mon 6 MayLabour Day
Mon 10 JunQueen’s Birthday
13.7 11.3
11.6
11.9 8.9
13.1
11.315.9
12.9
12.4
230 Monitoring of the Australian petroleum industry December 2013

Chart G.7 Adelaide, daily average retail prices—price cycles and public holidays: 1 July to 31 December 2012
cpl
120
125
130
135
140
145
150
155
160
30–Dec–1223–Dec–1216–Dec–1209–Dec–1202–Dec–1225–Nov–1218–Nov–1211–Nov–1204–Nov–1228–Oct–1221–Oct–1214–Oct–1207–Oct–1230–Sep–1223–Sep–1216–Sep–1209–Sep–1202–Sep–1226–Aug–1219–Aug–1212–Aug–1205–Aug–1229–Jul–1222–Jul–1215–Jul–1208–Jul–1201–Jul–12
30–D
ec–1
2
23–D
ec–1
2
16–D
ec–1
2
9–D
ec–1
2
2–D
ec–1
2
25–N
ov–1
2
18–N
ov–1
2
11–N
ov–1
2
4–N
ov–1
2
28–O
ct–1
2
21–O
ct–1
2
14–O
ct–1
2
7–O
ct–1
2
30–S
ep–1
2
23–S
ep–1
2
16–S
ep–1
2
9–Se
p–12
2–Se
p–12
26–A
ug–1
2
19–A
ug–1
2
12–A
ug–1
2
5–A
ug–1
2
29–J
ul–1
2
22–J
ul–1
2
15–J
ul–1
2
8–Ju
l–12
1–Ju
l–12
2012 minimum price cycle increase: 9.8 cpl2012 maximum price cycle increase: 19.2 cpl2012 average price cycle increase: 16.1 cpl
Mon 1 OctLabour Day
Tue 25 DecChristmas Day
17.8
19.2 17.2
15.4
16.315.7
18.2 18.6
17.9
17.2 16.5
15.7
Chart G.8 Adelaide, daily average retail prices—price cycles and public holidays: 1 January to 30 June 2013
cpl
120
125
130
135
140
145
150
155
160
25–Jun–1318–Jun–1311–Jun–1304–Jun–1328–May–1321–May–1314–May–1307–May–1330–Apr–1323–Apr–1316–Apr–1309–Apr–1302–Apr–1326–Mar–1319–Mar–1312–Mar–1305–Mar–1326–Feb–1319–Feb–1312–Feb–1305–Feb–1329–Jan–1322–Jan–1315–Jan–1308–Jan–1301–Jan–13
25–J
un–1
3
18–J
un–1
3
11–J
un–1
3
4–Ju
n–13
28–M
ay–1
3
21–M
ay–1
3
14–M
ay–1
3
7–M
ay–1
3
30–A
pr–1
3
23–A
pr–1
3
16–A
pr–1
3
9–A
pr–1
3
2–A
pr–1
3
26–M
ar–1
3
19–M
ar–1
3
12–M
ar–1
3
5–M
ar–1
3
26–F
eb–1
3
19–F
eb–1
3
12–F
eb–1
3
5–Fe
b–13
29–J
an–1
3
22–J
an–1
3
15–J
an–1
3
8–Ja
n–13
1–Ja
n–13
1st half 2013 minimum price cycle increase: 10.3 cpl1st half 2013 maximum price cycle increase: 20.2 cpl1st half 2013 average price cycle increase: 16.1 cpl
Mon 28 JanAustralia Day
Mon 1 JanNew Year’s Day
Fri 29 MarEaster
Fri 11 MarAdelaide Cup
Thu 25 AprAnzac Day
Mon 10 JunVolunteer’s Day
16.613.6
16.2
17.7
16.8
14.5
10.318.5
20.2
16.216.6
17.215.1 15.4
Monitoring of the Australian petroleum industry December 2013 231

Chart G.9 Perth, daily average retail prices—price cycles and public holidays: 1 July to 31 December 2012
cpl
120
125
130
135
140
145
150
155
160
30–Dec–1223–Dec–1216–Dec–1209–Dec–1202–Dec–1225–Nov–1218–Nov–1211–Nov–1204–Nov–1228–Oct–1221–Oct–1214–Oct–1207–Oct–1230–Sep–1223–Sep–1216–Sep–1209–Sep–1202–Sep–1226–Aug–1219–Aug–1212–Aug–1205–Aug–1229–Jul–1222–Jul–1215–Jul–1208–Jul–1201–Jul–12
30–D
ec–1
2
23–D
ec–1
2
16–D
ec–1
2
9–D
ec–1
2
2–D
ec–1
2
25–N
ov–1
2
18–N
ov–1
2
11–N
ov–1
2
4–N
ov–1
2
28–O
ct–1
2
21–O
ct–1
2
14–O
ct–1
2
7–O
ct–1
2
30–S
ep–1
2
23–S
ep–1
2
16–S
ep–1
2
9–Se
p–12
2–Se
p–12
26–A
ug–1
2
19–A
ug–1
2
12–A
ug–1
2
5–A
ug–1
2
29–J
ul–1
2
22–J
ul–1
2
15–J
ul–1
2
8–Ju
l–12
1–Ju
l–12
2012 minimum price cycle increase: 4.4 cpl2012 maximum price cycle increase: 11.7 cpl2012 average price cycle increase: 8.4 cpl
Mon 1 OctQueen’s Birthday
Tue 25 DecChristmas Day
8.8
10.6
10.59.0
7.48.7
10.8
10.5 8.3 8.3 8.5 8.77.8
10.3 9.39.9
7.3
5.9
8.2 9.011.7
10.4 8.28.3
9.3 9.7
Chart G.10 Perth, daily average retail prices—price cycles and public holidays: 1 January to 30 June 2013
cpl
120
125
130
135
140
145
150
155
160
25–Jun–1318–Jun–1311–Jun–1304–Jun–1328–May–1321–May–1314–May–1307–May–1330–Apr–1323–Apr–1316–Apr–1309–Apr–1302–Apr–1326–Mar–1319–Mar–1312–Mar–1305–Mar–1326–Feb–1319–Feb–1312–Feb–1305–Feb–1329–Jan–1322–Jan–1315–Jan–1308–Jan–1301–Jan–13
25–J
un–1
3
18–J
un–1
3
11–J
un–1
3
4–Ju
n–13
28–M
ay–1
3
21–M
ay–1
3
14–M
ay–1
3
7–M
ay–1
3
30–A
pr–1
3
23–A
pr–1
3
16–A
pr–1
3
9–A
pr–1
3
2–A
pr–1
3
26–M
ar–1
3
19–M
ar–1
3
12–M
ar–1
3
5–M
ar–1
3
26–F
eb–1
3
19–F
eb–1
3
12–F
eb–1
3
5–Fe
b–13
29–J
an–1
3
22–J
an–1
3
15–J
an–1
3
8–Ja
n–13
1–Ja
n–13
1st half 2013 minimum price cycle increase: 6.3 cpl1st half 2013 maximum price cycle increase: 12.3 cpl1st half 2013 average price cycle increase: 9.7 cpl
Mon 28 JanAustralia Day
Mon 1 JanNew Year’s Day
Fri 29 MarEaster
Mon 4 MarLabour Day
Thu 25 AprAnzac Day
Mon 3 JunFoundation Day
10.9 9.4 7.7 9.711.1
12.3
12.0
11.1 9.67.5
8.28.0
7.3 9.2
7.1
6.39.3 11.1 9.2
11.8
11.7
11.3 9.1
11.49.8
10.9
232 Monitoring of the Australian petroleum industry December 2013

ACCC contacts
ACCC Infocentre: business and consumer inquiries: 1300 302 502
Website: www.accc.gov.au
Translating and Interpreting Service: call 13 1450 and ask for 1300 302 502
TTY users phone: 1300 303 609
Speak and Listen users phone 1300 555 727 and ask for 1300 302 502
Internet relay users connect to the NRS (see www.relayservice.com.au and ask for 1300 302 502)
ACCC addresses
National office
23 Marcus Clarke Street Canberra ACT 2601
GPO Box 3131 Canberra ACT 2601
Tel: 02 6243 1111 Fax: 02 6243 1199
New South Wales
Level 20 175 Pitt Street Sydney NSW 2000
GPO Box 3648 Sydney NSW 2001
Tel: 02 9230 9133 Fax: 02 9223 1092
Victoria
Level 35, The Tower 360 Elizabeth Street
Melbourne Central Melbourne Vic 3000
GPO Box 520 Melbourne Vic 3001
Tel: 03 9290 1800 Fax: 03 9663 3699
Queensland
Brisbane
Level 24 400 George Street Brisbane Qld 4000
PO Box 12241 George Street Post Shop Brisbane Qld 4003
Tel: 07 3835 4666 Fax: 07 3835 4653
Townsville
Suite 2, Level 9 Suncorp Plaza 61–73 Sturt Street Townsville Qld 4810
PO Box 2016 Townsville Qld 4810
Tel: 07 4729 2666 Fax: 07 4721 1538
South Australia
Level 2 19 Grenfell Street Adelaide SA 5000
GPO Box 922 Adelaide SA 5001
Tel: 08 8213 3444 Fax: 08 8410 4155
Western Australia
3rd floor, East Point Plaza 233 Adelaide Terrace
Perth WA 6000 PO Box 6381 East Perth WA 6892
Tel: 08 9325 0600 Fax: 08 9325 5976
Northern Territory
Level 8, National Mutual Centre 9−11 Cavenagh St Darwin NT 0800
GPO Box 3056 Darwin NT 0801
Tel: 08 8946 9666 Fax: 08 8946 9600
Tasmania
Level 2 70 Collins Street Cnr Collins and Argyle Streets Hobart Tas 7000
GPO Box 1210 Hobart Tas 7001
Tel: 03 6215 9333 Fax: 03 6234 7796
Monitoring of the Australian petroleum industry December 2013 233

234 Monitoring of the Australian petroleum industry December 2013