monitoring it services for supporting usiness · monitoring it services for supporting business ......
TRANSCRIPT
MONITORING IT SERVICES FOR SUPPORTING BUSINESS
PROCESSES
Jorge Manuel de Oliveira Vicente
Tese de Mestrado em
Engenharia Informática e de Computadores
Júri
Presidente: Professor Alberto Manuel Rodrigues da Silva
Orientador: Professor Miguel Leitão Bignolas Mira da Silva
Vogal: Professor Luís Velez Lapão
Novembro 2007

II
III
Acknowledgments
I would like to thank my parents and all my friends for all their support throughout my
academic path.
I would like to thank all members of Business Service Monitoring and from Business
Support Division on Millennium bcp. I must say that being part of such a friendly, cohesive and
willing to help team makes me very happy. Without forgetting anyone I would like to particularly
thank:
Dr. Nicolau Romão (Millennium bcp), for the opportunity to do the Case study and all the
great mind challenging discussions we have and for his to the point analysis of problems that
often makes me see things from a different perspective
Dr. Joaquim Calhau (Millennium bcp), for his never-ending patience in listening my requests
and for his guidance when the path to take was uncertain.
João Costa (Millennium bcp), for all the technical and business know-how support.
Artur Carvalho and João Carlota (IST), my teammates in the Millennum bcp “adventure” for
their patience, friendship, help and support.
To all the people that helped me during this dissertation and throw the course, thank you.
Finally, I would like to thank my supervisor Miguel Mira da Silva for the challenge given to
me with this project and for all the guidelines that kept me on track, always available and a
mentor in and out the University.

IV
V
Abstract
IT drives to the goal of acting as a service provider to the rest of the business. However,
responsible IT Service owners are challenged by the fact they often don’t have a clear
perspective of the business health of critical processes that their IT systems are supporting.
Most event data from infrastructure management tools is IT-centric, and has little relation to
relevant business conditions. By enabling IT to gain visibility and a better understanding of the
condition of business services and processes that are key to the business, IT Service managers
and service owners will have a better business perspective and the right level of knowledge to
respond to, and negotiate with the business. The link between Business Processes and IT
Services goes far as the granularity goes, and, it is proposed the relation between activities and
transactions the bound that connects them. This relation can be used to measure costs and
performance. Regardless the form that companies calculates this indicators, it’s now possible to
create bullet proof SLA reports that are non-repudiation efficient. Providers could in the future
be obligated to respond for their performance and customers and users could be more satisfied
with their IT Services since they will be aware the right price to pay and demand the right
service-level.
Keywords: IT Governance, COBIT, ITSM, IT Service Monitorization, BPM
Resumo
SI direcciona para o objectivo de agir como um fornecedor de serviços para o resto do
negócio. Em todo o caso, os responsáveis pelos SI são desafiados pelo facto de que
normalmente não têm uma perspectiva clara da saúde de processos críticos para o negócio
assim como dos sistemas que o suportam. Maior parte da informação e infra-estrutura é gerida
por ferramentas centradas nos SIs, tendo pouca relação para as condições do negócio. Ao
possibilitar que os SI ganhem visibilidade e uma melhor compreensão das condições dos
serviços e processos que são chave para o negócio, os gestores e os fornecedores dos
serviços de SI terão uma melhor perspectiva de negócio e o nível de conhecimento certo para
responder e negociar com o negócio. A ligação entre processos de negocio e os serviços de SI
vão até à granularidade vai, e proposto que a relação entre actividades e transacções sejam
essa ligação. Esta relação pode ser usada para medir custos e desempenho.
Independentemente da forma como cada empresa calcula estes indicadores, é agora possível
criar relatórios consistentes de SLA que são resistentes à não repudiação. Fornecedores
puderam no futuro ser obrigados a responder pela sua performance e os clientes e utilizadores
estarem mais satisfeitos com os seus serviços de SI, a partir do momento que sintam que
pagam o preço certo e tenham os níveis de serviço certos.
Palavras-chave: Governação de SI, COBIT, Gestão de Serviços de SI, Monitorização de
Serviços de SI, Gestão de Processos de Negócio

VI
VII
Table of Contents
Acknowledgments ........................................................................................................................ III
Abstract ......................................................................................................................................... V
Resumo .......................................................................................................................................... V
Table of Contents ........................................................................................................................ VII
List of Figures ............................................................................................................................... IX
List of Tables ................................................................................................................................. XI
Acronyms & Abbreviations ......................................................................................................... XIII
1. Introduction .......................................................................................................................... 1
1.1. IT Governance & IT Service Management ..................................................................... 1
1.2. Service Level Management ........................................................................................... 4
1.3. Business Process Management ..................................................................................... 4
1.4. Summary ....................................................................................................................... 5
2. IT Service Level Management ............................................................................................... 7
2.1. Introduction .................................................................................................................. 7
2.2. State of the art .............................................................................................................. 7
2.2.1. Definition ............................................................................................................... 8
2.2.2. Terminology .......................................................................................................... 8
2.2.3. Roles and Responsibilities ................................................................................... 12
2.2.4. Implementation ................................................................................................... 13
2.2.5. Costs and Benefits ............................................................................................... 17
2.2.6. Problems ............................................................................................................. 21
2.2.7. Frameworks and Best Practices .......................................................................... 23
3. Problem ............................................................................................................................... 27
3.1. IT Problems and Priorities ........................................................................................... 27
3.2. Legal Obligations ......................................................................................................... 27
3.3. Business Process Management Needs ........................................................................ 28
3.4. Customer-Provider IT Service Relation ....................................................................... 30
3.5. IT Investments ............................................................................................................. 31
3.6. IT Monitorization ......................................................................................................... 32
3.7. Conclusion ................................................................................................................... 33
4. Proposal ............................................................................................................................... 35

VIII
4.1. Introduction ................................................................................................................ 35
4.2. Framework .................................................................................................................. 36
4.3. Pre-requirements ........................................................................................................ 38
4.4. Implementation ........................................................................................................... 38
4.5. Monitorization ............................................................................................................. 42
4.6. Evaluation .................................................................................................................... 43
5. Case Study ........................................................................................................................... 45
5.1. Introduction ................................................................................................................ 45
5.2. Project ......................................................................................................................... 46
5.2.1. Application .......................................................................................................... 48
5.3. Conclusion ................................................................................................................... 51
5.4. Results and Analysis .................................................................................................... 51
6. Conclusion ........................................................................................................................... 53
6.1. Future Work ................................................................................................................ 55
References ................................................................................................................................... 57

IX
List of Figures
Figure 1 – Strategic Business/IT Alignment Model (source:[2]). ............................................ 1
Figure 2 – Evolution of the IT Function within organizations (source:[4]). .............................. 3
Figure 3 – IT Governance and IT Management (source: [5]). ................................................ 3
Figure 4 - Business view Vs Service view. ............................................................................. 6
Figure 5 – Level of knowledge for the thesis. ......................................................................... 7
Figure 6 – The SLA Contract (source: [15]). ........................................................................... 9
Figure 7 – Five essential steps to a successful SLM program (source:[15]). ....................... 14
Figure 8 – Service and Associated SLA Life Cycle (source: [16]). ....................................... 15
Figure 9 - IT-service performance management framework (source:[20]). .......................... 16
Figure 10 - ITIL Processes (source:[22]). ............................................................................. 24
Figure 11 - Overall COBIT Framework (source:[1]). ............................................................. 25
Figure 12 – Problems and Priorities of CEO’s and CIO’s (source: [27]). ............................. 27
Figure 13 – Porter’s Value Chain (source:[28]). ................................................................... 28
Figure 14 – Relations and the systems that support them. .................................................. 29
Figure 15 – Customer-Provider cycle. .................................................................................. 31
Figure 16 – Cycle supported by COBIT, ITIL and BPM. ....................................................... 36
Figure 17 – Conceptual Overview. ....................................................................................... 37
Figure 18 – Logical relation of the Framework. .................................................................... 39
Figure 19 – Business Process Monitorization and IT Service Monitorization relation. ......... 41
Figure 20 – Millennium bcp IT Global Division. .................................................................... 45
Figure 21 – Millennium bcp Business Support Division. ....................................................... 45
Figure 22 – Screenshot 1 MIS: Business Process Overview. .............................................. 49
Figure 23 – Screenshot 2 MIS: Business Process Management. ........................................ 49

X
Figure 24 – Screenshot 3 MIS: Activity Management. ......................................................... 50
Figure 25 – Screenshot 4 MIS: Activity Management. ......................................................... 50
Figure 26 – Framework benefits. .......................................................................................... 54

XI
List of Tables
Table 1 – Scenario 1: IT Service and Activities relation. ...................................................... 42
Table 2 – Scenario 2: IT Service and Activities relation. ...................................................... 42
Table 3 – Business and SLA impact. .................................................................................... 44
Table 4 – Relation between Millennium bcp Business Processes and IT Services. ............ 47

XII

XIII
Acronyms & Abbreviations
BAM – Business Activity Monitoring
BAM – Millennium bcp Business Service Monitoring
BP – Business Process
BPM – Business Process Management
BSC – Balanced Scorecard
BSD – Millennium bcp Business Support Division
BU – Business Unit
CEO – Chief Executive Officer
CIO – Chief Information Officer
CMDB – Configuration Management Database
COBIT - Control Objectives for Information and related Technology
CSF – Critical Success Factors
IT – Information Technologies
ITGI – Information Technology Governance Institute
ITIL – Information Technology Infrastructure Library
ITIM – Information Technology Infrastructure Management
ITS – Information Technology Service
ITSM – Information Technology Service Management
KPI – Key Performance Indicators
MIS – Management Information System
NSS – Negotiation Support Systems
OSS – Operations Support Systems
ROI – Return On Investment

XIV
SLA – Service Level Agreement
SLI – Service Level Indicators
SLM – Service Level Management
SLO – Service Level Objectives
TMF – TeleManagement Forum
1
1. Introduction
In our days most of Enterprises could not survive without the help and support from
Information Systems. For many Enterprises Information Systems represent their most value, but
often the least understood assets. Successful enterprises recognize the benefits of information
technology and use it to drive their stakeholders’ value [1].
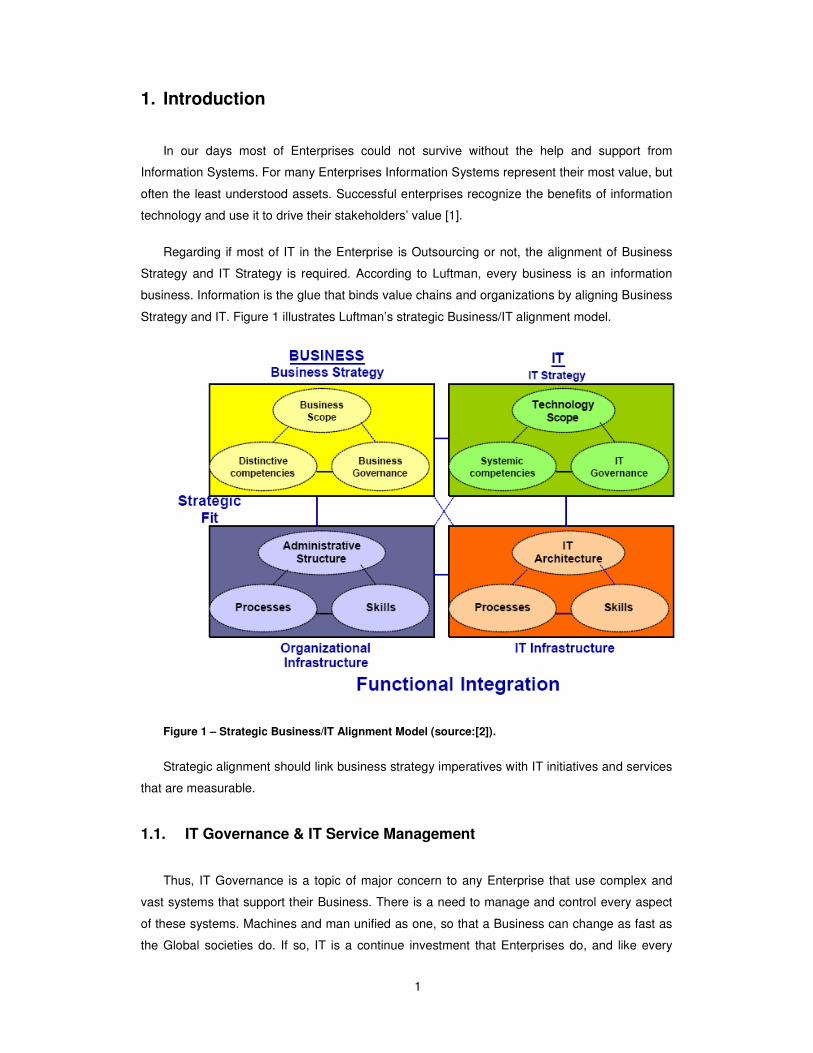
Regarding if most of IT in the Enterprise is Outsourcing or not, the alignment of Business
Strategy and IT Strategy is required. According to Luftman, every business is an information
business. Information is the glue that binds value chains and organizations by aligning Business
Strategy and IT. Figure 1 illustrates Luftman’s strategic Business/IT alignment model.
Figure 1 – Strategic Business/IT Alignment Model (source:[2]).
Strategic alignment should link business strategy imperatives with IT initiatives and services
that are measurable.
1.1. IT Governance & IT Service Management
Thus, IT Governance is a topic of major concern to any Enterprise that use complex and
vast systems that support their Business. There is a need to manage and control every aspect
of these systems. Machines and man unified as one, so that a Business can change as fast as
the Global societies do. If so, IT is a continue investment that Enterprises do, and like every
2
investment must have a return. So, CEO normally asked to himself: I’d invested heavily in
technology but where is the payoff?
This is the main question that drives CIO’s every day. Every meeting with the CEO is a
quest to prove that investing in IT really pays off when Business needs to update, change or
survive. This is a “war” that is far to an end, and CIO’s have lost most of the battles. The difficult
to measure and dived costs to its users is an issue that is on every CIO’s agenda. Technology
still’s the worst nightmare to all the Companies that cannot survive without IT, since it’s very
hard to measure and with that, to manage. A “Black Hole” that always need more investment
and seems out of control. A constant change that implicates a continue metanoia in peoples’
minds.
In general, IT is defined by applications, network, infrastructure, machines etc. that when
integrated creates Systems, Systems that support Business, and Business that have goals. The
non accomplishment of these Goals, probably implicates the end to a Company. Thus, the need
to create accurate tools that permits a successful IT Management increase every day.
Methodologies and Frameworks where created to an effective Governance. Align IT with
Business Goals is fundamental to a successful integration of Systems in a Company and its
survival.
In this continues line, internal Clients make demands to a better and more complete set of
tools from IT Systems every day, so that they can be more efficient and win in the specific
Business.
On a CIO’s point a view, this Systems reflects as Services in IT Governance. There are
many variables that need to be defined so that the alignment between IT and Business is
consistent and at the same time flexible to always be updated and align with Business Goals.
With Globalization and the growth of competitiveness of Service Providers, Outsourcing gains a
primary role on CIO’s agenda. The reduction of costs that specialization brings is a sufficient
issue to consider Outsourcing as an alternative to in-house production. In some cases, this
alternative becomes the unique solution, when Companies do not have infrastructure or the
capacity to do it itself [3].
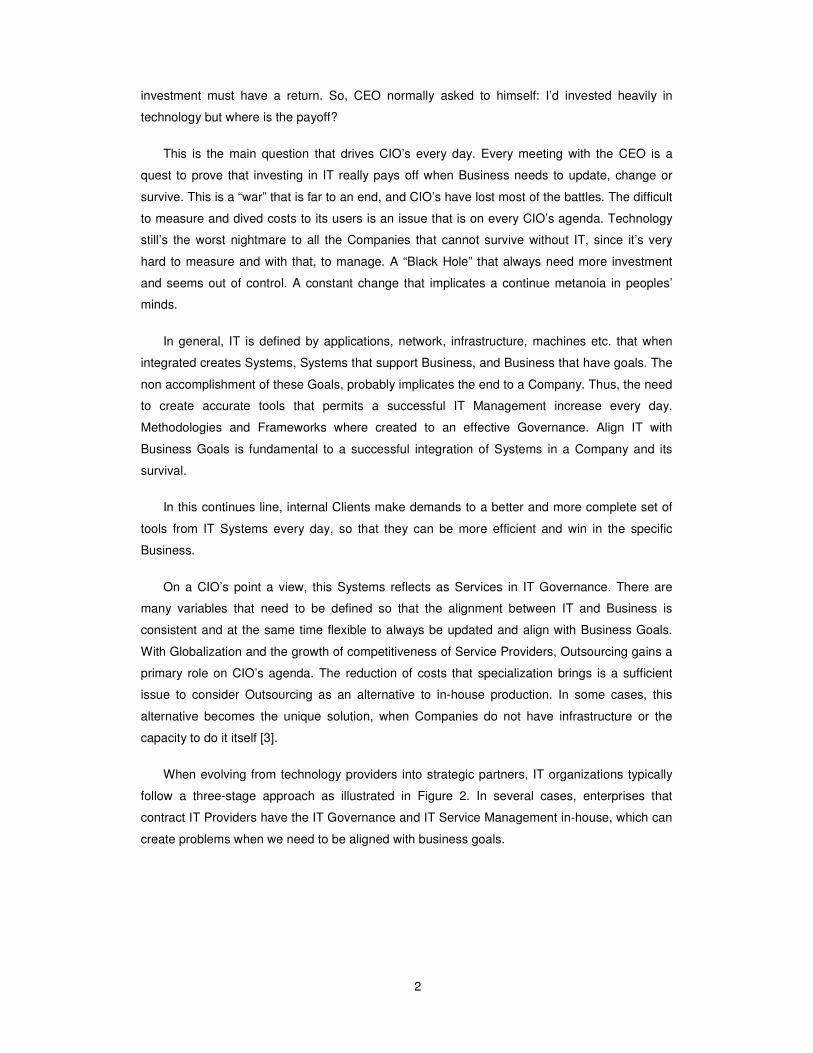
When evolving from technology providers into strategic partners, IT organizations typically
follow a three-stage approach as illustrated in Figure 2. In several cases, enterprises that
contract IT Providers have the IT Governance and IT Service Management in-house, which can
create problems when we need to be aligned with business goals.
3
Figure 2 – Evolution of the IT Function within organizations (source:[4]).
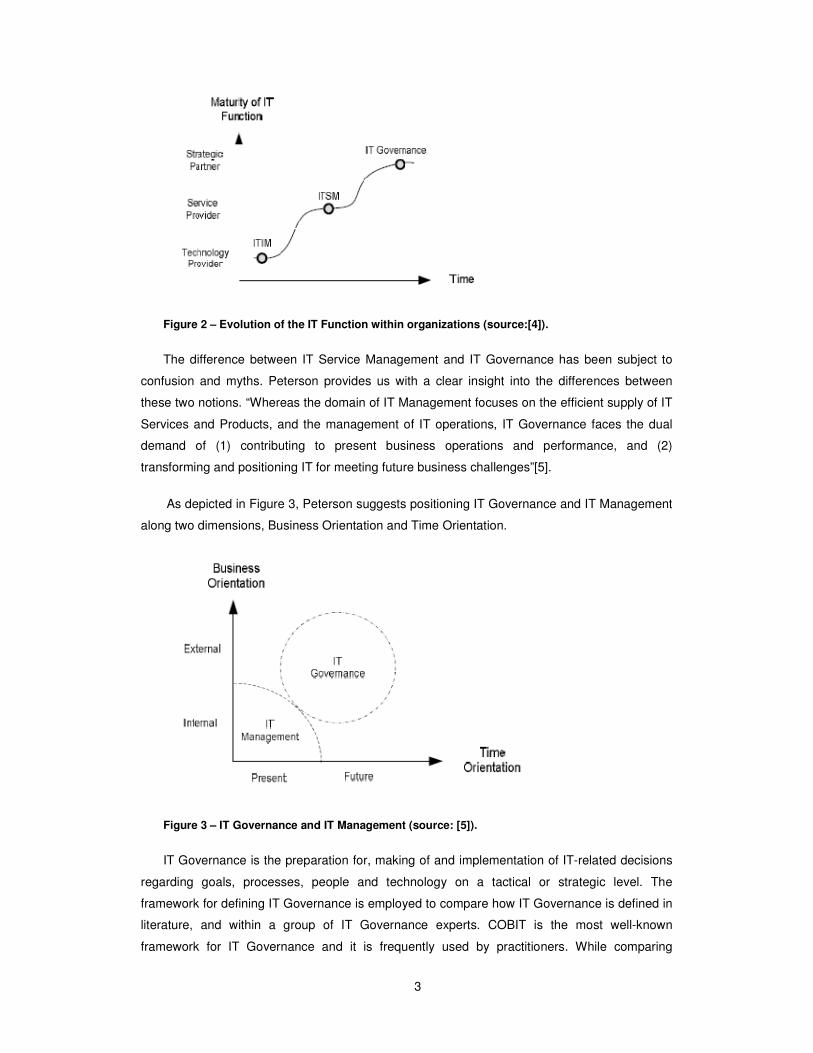
The difference between IT Service Management and IT Governance has been subject to
confusion and myths. Peterson provides us with a clear insight into the differences between
these two notions. “Whereas the domain of IT Management focuses on the efficient supply of IT
Services and Products, and the management of IT operations, IT Governance faces the dual
demand of (1) contributing to present business operations and performance, and (2)
transforming and positioning IT for meeting future business challenges”[5].
As depicted in Figure 3, Peterson suggests positioning IT Governance and IT Management
along two dimensions, Business Orientation and Time Orientation.
Figure 3 – IT Governance and IT Management (source: [5]).
IT Governance is the preparation for, making of and implementation of IT-related decisions
regarding goals, processes, people and technology on a tactical or strategic level. The
framework for defining IT Governance is employed to compare how IT Governance is defined in
literature, and within a group of IT Governance experts. COBIT is the most well-known
framework for IT Governance and it is frequently used by practitioners. While comparing
4
COBIT’s definition of IT Governance to the previously identified concerns of literature and
practitioners, it showed that COBIT does support most needs, but lacks in providing information
on how decision-making structures should be implemented [6].
1.2. Service Level Management
In this quest are several issues that need attention, and one problem is already identified:
the alignment between Service Level Agreements and IT Governance. IT Service Management
integrates on IT Governance and must respond to an investment made in a Service that is
bought and must proof that is a good investment. These Services must be aligned with one or
more Business Goals and to do this alignment, metrics must be defined so that this
management can be made. The Service Level Agreement is as contract that specifies the level
of service that must be provided [7]. There are very roles on this negotiation and different views
that have to be converged.
Service Level Management is often regarded as one of the most important management
disciplines in IT Service Management, vital for customer-orientation and provision of high-quality
IT Services. SLM is responsible for determining, monitoring and reporting IT Service quality
metrics in line with the commercial business goals of the entire organization. It is important for
an improved relationship between s service provider and costumer [8].
After the negotiation and the implementation, the “health” of a Service must be monitored.
Business Service Monitoring normally provides the technological monitorization of the services,
with the goal to see the Services as the Client and provide information that permits an overview
of the Service and allows decision support when a problem and incidents occurs and data to
foolproof reports to a possible re-negotiation of a Service.
ITIL is the most used framework on this matter and the academic programs also points ITIL
as the best framework to teach in business-schools and Management Information Systems
curricula in Universities [9].
In an ITSM point of view the information produced by SLM improves IT Services but in
Business point of view, there is lack of information regarding how the ITSM performance
integrates the Business performance.
1.3. Business Process Management
Any enterprise—corporation, government, or nonprofit organization—can be viewed as the
sum of its business processes. Each process delivers value to customers, suppliers,
employees, or other stakeholders. BPM, the discipline for enabling and automating business

5
processes, is in a period of rapid growth and will fundamentally change the way computing
power is applied in organizations.
Whereas BPM has already delivered considerable value in many companies, the
components of the full BPM solution are still evolving and are the subject of ongoing research
and development [10].
Business Process Management is an old discipline that allows you to model the
organizational structure, define the business processes, and show the interactions between
them, from design to automation.
The whole point of automating business processes is to improve operations—in cost, time,
or quality. Once a process has been developed and deployed, how can we know if it is meeting
the intended goals? We know how to instrument IT systems and monitor them with a high
degree of precision. These statistics, however, do not generally provide a business-process
context around this information. The challenge is to aggregate and present execution data at
the business-process level. Gartner coined the term business activity monitoring (BAM) for this
capability. It defines BAM as providing “real-time access to critical business performance
indicators to improve the speed and effectiveness of business operations.
Without BAM, operational managers have no way of determining whether the processes for
which they are responsible are meeting their objectives [11].
1.4. Summary
Today a business process has some activities that have one or more service that fully
supports them. If that service stops and we ask to the operational manager why, consulting a
BAM dashboard it’s possible that he can identify the reason “pointing the finger” to the Service
Manager. At the other side, the service manager and the Business Support team work in the
way to solve the incident, and in the end, service manager congratulates himself and his team
because they solve the incident rapidly maintaining the performance, but is operational
manager satisfied?
Thus, we have two types of indicators that are sensible to an incident: the business-level
and the service-level. But are they aligned? What is the cost of that service to both managers?
What is the cost to the business when a service stops?
Normally we encounter 2 different visions (1) focus on the business processes (2) focus on
the services. Regardless the business goals, it’s possible that the BPM and ITSM aren’t aligned.
Figure 4 shows the different views between business and services. A manager has a view
concerned with business and with the objective to maintain business running no matter what

6
and with best performance possible. Thus, Service 1 failed! What is the implication with the
business? Which processes are affected? And what can I do to keep the business running? I’m
paying the right price for this Service 1? How many business processes are affected by this
Service 1? Do I have the right Service?
Instead, service view is different. Service management is concerned with the resolution and
management of the incidents and problems and with the objective to restore service as soon as
possible. Thus, Service 1 failed! What is the incident? It’s a problem? How can we solve this
incident? When will be the service restored? It’s our KPI’s accomplished?
Service1
Service 2
Service 3
Business Process 1
Business Process 2
Service
View
Business
View
Figure 4 - Business view Vs Service view.
Each one of these views has different frameworks and different tools to monitor and support
them. But there are needs to create a view from a top that permits to those who evaluates and
choose services that support the business, which creates information to define the real value of
a service and who is responsible to pay the costs, in a process-oriented way.
In 1996 Magill and his group of researchers stated that “While the importance of a mission
statement is well understood by most organizations, the process from which the mission
statement springs has been neglected. As organizations move toward tapping individual talent
and commitment while empowering skilled individuals to respond rapidly to a changing
environment, the bottom-up approach to mission creation is a natural step.” [12].
This thesis is an approach to align these two levels of monitorization accordingly with the
business goals, based on COBIT, ITIL and BPM and on the information provided by the service
monitorization.

7
2. IT Service Level Management
2.1. Introduction
In Figure 5 is illustrated the know-how in each areas getter during the thesis. To achieve an
acceptable result to this thesis, it was imperative to know well the area of IT Management and
IT Governance as well COBIT framework and IT Service Level Management and ITIL
framework, in a way to comprehend and gather the better information to deliver to operational
managers
Figure 5 – Level of knowledge for the thesis.
At the same time, BPM was an area to study, but since the objective was to deliver
information from SLM to BPM was not imperative to know as well BPM area. In these bases,
only SLM had a profound investigation. This chapter is described the most important information
gather to create de proposal.
2.2. State of the art
There are several aspects that need to be in consideration in an approach to IT Service
Level Management.

8
2.2.1. Definition
SLM is the process of setting, measuring, and ensuring the maintenance of service goals.
Whatever the service, SLM helps enterprises make sure that the key targets for service
success—such as performance, quality, or number of transactions—are being met. SLM
defines the metrics for measuring service success, a means for monitoring those metrics, and a
process for responding when the metrics are not being met or are at risk of not being met[13].
SLM is a concept often associated with complex IT operations, but it can be applied to any
business or service. Some years ago, Domino’s Pizza created one of the most recognizable
examples of SLM when it promised to deliver each pizza in less than 30 minutes—or give it to
the customer free of charge. This simple promise defined all the key elements of SLM by:
• Defining the service (delivery of a customer-selected pizza)
• Providing metrics for measuring the service (30 minutes from phone call to delivery)
• Making a guarantee of performance (100% delivery within the established
parameters)
• Specifying a penalty/incentive if the defined service level was not met (free pizza)
Enterprise IT organizations are increasingly being called upon to define and deliver the
same sorts of guarantees. To ensure end-user satisfaction, or to meet overall cost and
efficiency goals, an enterprise IT team must define the services it intends to deliver, metrics for
measuring their success, a means for monitoring and ensuring service performance, and a
method of responding if service levels are not met[14].
2.2.2. Terminology
Service Level Management (SLM)
Service level management (SLM) is a set of tools and disciplined, proactive procedures
used to ensure that adequate levels of service are delivered to users in accordance with
business priorities and at acceptable cost. IT needs to define parameters, establish a baseline,
set objectives, monitor and assess objectives, and refine and improve service levels.
Clear and open communication between customer and service provider is essential for
effective SLM. The service provider, whether internal to the enterprise or an external third party,
must understand what the customer perceives as good service. In tandem, the customer must
understand what is reasonable to expect of IT, given limitations in hardware, staffing, and other
resources[15].
Service Level Agreements (SLAs)

9
Service Level Agreements (SLAs) are an agreement between the customer and the service
provider. An SLA usually contains:
• A statement of intent
• A description of the service
• The approval process for changes to the agreement
• A definition of terms
• Identification of the primary service users
• Service metrics, which are defined in service level objectives (SLOs) and indicators
(SLIs) – Figure 6.
Figure 6 – The SLA Contract (source: [15]).
There are two basic types of SLAs:
• In-house SLA - an agreement negotiated between an IT department and an in-
house user group or business unit.
• External SLA - an agreement between a company that is purchasing IT services
and an external provider, like a carrier or any one of the many kinds of service
providers.
By involving business users in active negotiations about service levels and what it takes to
achieve them, IT can educate business as to the true cost of providing any given level of
service. SLAs should be revisited periodically to refresh everyone’s memory. If service levels
erode, IT can point to changes in these circumstances as clear reasons why, and both parties
can go back to the table to renegotiate the agreement [15].
Service Level Objectives (SLOs)

10
Service Level Objectives (SLO) defines the level of service that is to be provided, as agreed
to by the parties involved. An SLA covering a service typically contains several SLOs. SLOs are
articulated in the context of business goals and contain one or more Service Level Indicators
(SLIs).
Some of the more common SLOs include:
• Availability
• Performance
• Mean Time to Repair (MTTR)
• Accuracy
• End-User Response Time
In addition, higher-level, business-oriented SLOs (i.e. transactions completed or number of
orders pending) are increasingly more common in today’s SLAs.
SLO definition can be a complex exercise. If an SLA is going to be valuable, it must have
good SLOs, which should:
• Identify what aspects of service are covered by the SLA
• Relate to specific business objectives
• Identify indicator(s) for each aspect of service
• Define the target level for each aspect of service
While there is no right number of SLOs in an SLA, planners should aim for between 5 and
10, with the goal of keeping SLOs simple[15].
Service Level Guarantees
The distinction between SLOs and service level guarantees is slight. Both represent the
level of service that the parties in the SLA have agreed will be delivered. The key difference is
that SLOs determine what is being measured, and Service Level Guarantees define the
outcome if services should fail [15].
Service Level Indicators (SLIs)
Service Level Indicators (SLIs) are at the heart of any SLA. They allow SLM to be measured
and quantified, and provide the “yes/no” assessment of whether or not a commitment is being
met. Each aspect or objective (SLO) of the SLA, such as availability, will have a target level to
achieve. But the SLA might include multiple SLI for each SLO. Typical SLIs are a percentage of
time available or level of performance for a single aspect of a single type of technology.
Ideally, SLIs should:

11
• Allow quality to be quantified
• Reflect users’ pain points and priorities
• Include availability, performance, and accuracy metrics
• Take into account security features and systems
• Be realistic and affordable
The best way to measure service levels is from the user’s perspective. How available were
the services that users need to do their jobs and how responsive were the services? Whichever
way these user perceptions are measured, the SLA will need to document each SLI used to
measure the SLOs, and to specify the data source for each.
For example, a Web-based application may define the user response time as the key SLI. It
may be the case that the response time is to be measured from the time the “submit” button is
pressed to the time a refreshed screen showing confirmation is received. In this case, the user
perception is translated into a performance metric that must be measured by an underlying
technology, such as a synthetic transaction, where a transaction is created to mimic user
behavior for the purpose of measuring results at a given point in time [15].
Availability and Performance Metrics
Performance and availability metrics are essential for SLAs since they provide necessary
metrics for measurement.
Availability is usually a simple thing to measure—was the service available when it was
supposed to be or not? If it was available, but did not perform properly, then that is a
performance problem, not an availability problem. In addition, look at the availability from the
perspective of the user, not the service provider. In the SLA, do not include separate metrics for
the network, servers, and applications. Rather, represent availability by such things as total
hours of availability, hours or minutes of outage, or mean time to repair.
Performance is significantly more difficult to measure than availability. The trick is deciding
which aspect of performance is appropriate for the SLA that you are writing and maintaining the
end-user perspective—that is, what the SLA is about. And, as with availability, keep it simple—
only go as deep as is necessary to accurately reflect the user experience.
When discussing performance for an SLA, the critical question is whether the service
functioned as well as it was supposed to. Usually, performance has a speed dimension to it.
Speed may be represented by response time, data transfer rate, or other measures. Another
common performance characteristic is volume. Volume may be reflected in the amount of data
transferred, the number of transactions processed, and so forth.
Unfortunately, as the size and complexity of the infrastructure for providing a service
increases, so does the challenge of assessing the availability and performance of service.
12
Therefore, inevitably, even moderately large or complex environments dictate the use of tools to
assist with the data capture. It is important to remember that tools will not tell you which metrics
to use. In fact, before you begin to consider purchasing additional tools, you need to know what
data you need to capture. Otherwise, you run a high risk of wasting money on tools that fail to
satisfy your needs, and end up being little more than shelf ware [15].
Service Level Reporting
Service level reporting should provide a mechanism for contrasting actual results with SLAs
and distributing that information to all relevant constituencies.
The output from SLM tools serves two major purposes:
1. Service level reporting demonstrates the value of IT services, and is a way to
promote the quality of service provided by the internal or external service provider;
2. Real-time reporting also creates a way to proactively address service difficulties and
reduce the negative impact of a service outage or degradation.
Periodic reporting is still very common for meeting the first purpose; however, a recent
study by EMA[15] found a high demand for ad-hoc reporting in SLM. Real-time reporting, or
continuously updated dashboards and scorecards, is used by operations so they can monitor
services being provided.
The format and detail of service level reports will vary according to the intended audience.
For example, executive management reports should be highly summarized and outline the
performance experienced by the users of the service and reports to individuals with line-of-
business responsibilities should relate service levels to business transaction volumes,
personnel productivity, and, when possible, customer satisfaction.
2.2.3. Roles and Responsibilities
EMA [15] research shows that enterprises have targeted three core constituencies with their
SLM initiatives:
• Business units
• End users
• The IT organization
In addition to these three stakeholders, we can add the external service provider, who
clearly also needs SLM to excel.
Business units need SLM to measure the performance and effectiveness of IT-based
services. Many companies use SLM to benchmark quality of service or to measure end-user

13
satisfaction, and business units recognize that effective IT services can make the difference
between keeping and losing a customer. IT-oriented metrics also can help measure the
efficiency of a business process or service, making it easier to prioritize the steps needed to
streamline the business.
End users need SLM in order to gain a better understanding of the IT-based services they
receive, particularly from the perspectives of reliability and performance. Enterprise IT
organizations often use SLM to set and manage internal end-user expectations. SLM is highly
effective in reducing the number of calls made by end users to complain that a service “seems
slow” or “isn’t working right.” Measuring the end-user experience is even more critical when IT
services are exposed directly to external customers. SLM is essential for ensuring customer
satisfaction, efficient supplier/trading partner relationships, and overall end-user productivity.
IT organizations need SLM in order to prove their value to the enterprise— service level
goals, reached in accordance with business and end-user objectives, provide the means to
measure IT’s performance. In an environment where IT budgets and expenditures on
equipment or personnel are being questioned at every turn, SLM data provides a quantitative,
reliable benchmark for measuring the value of IT services and the cost of those services. SLM
metrics can help the IT organization build a return on investment (ROI) case for new
expenditures. Perhaps just as importantly, SLM data can help quantify IT performance in a way
that keeps IT focused on identifying and managing the most cost-effective ways to meet service
requirements.
Service provider companies have a great need to set up, deliver, manage, and report on
services for their customers. This is the “bread and butter” of these companies, and requires
additional capabilities, such as penalty calculation, SLA contract tracking, differentiable service
levels, and customizable reporting by customer. Service providers that cannot manage the
service they deliver to customers, or provide high levels of service, will be overtaken by those
who can. SLM provides for both better cost control and can contribute to revenue generation
capabilities—an unbeatable combination in the current business environment [14].
2.2.4. Implementation
The core constituencies for SLM (business units, end users, and the IT organization) share
a common goal: deliver the service at a level that is affordable and that will provide value to
business. In the end of the day, that is what SLM and its enabling technologies are about—
business value [15].
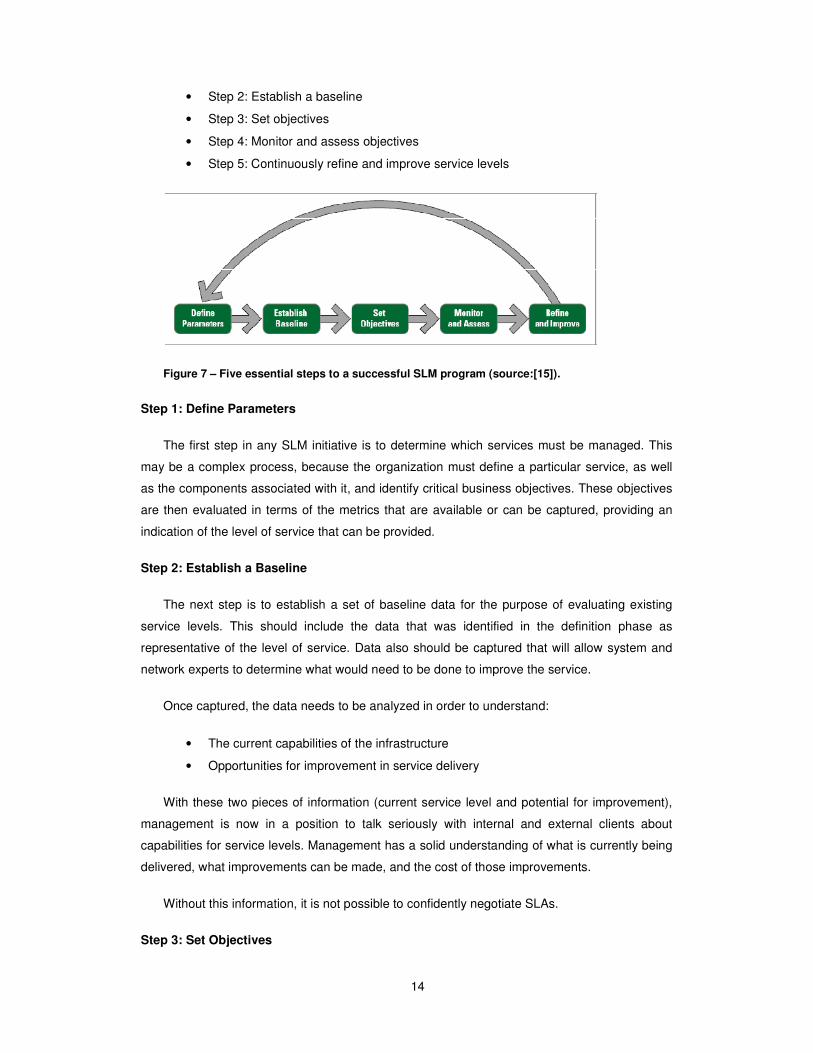
In this section, we provide a high-level overview of the five steps that are absolutely
essential to a successful SLM program (consult Figure 7):
• Step 1: Define parameters
14
• Step 2: Establish a baseline
• Step 3: Set objectives
• Step 4: Monitor and assess objectives
• Step 5: Continuously refine and improve service levels
Figure 7 – Five essential steps to a successful SLM program (source:[15]).
Step 1: Define Parameters
The first step in any SLM initiative is to determine which services must be managed. This
may be a complex process, because the organization must define a particular service, as well
as the components associated with it, and identify critical business objectives. These objectives
are then evaluated in terms of the metrics that are available or can be captured, providing an
indication of the level of service that can be provided.
Step 2: Establish a Baseline
The next step is to establish a set of baseline data for the purpose of evaluating existing
service levels. This should include the data that was identified in the definition phase as
representative of the level of service. Data also should be captured that will allow system and
network experts to determine what would need to be done to improve the service.
Once captured, the data needs to be analyzed in order to understand:
• The current capabilities of the infrastructure
• Opportunities for improvement in service delivery
With these two pieces of information (current service level and potential for improvement),
management is now in a position to talk seriously with internal and external clients about
capabilities for service levels. Management has a solid understanding of what is currently being
delivered, what improvements can be made, and the cost of those improvements.
Without this information, it is not possible to confidently negotiate SLAs.
Step 3: Set Objectives
15
Negotiating SLAs is normally the best way to go about setting SLOs. Through the SLA
process, the objectives are set jointly. The result should be something that is realistic,
attainable, and meaningful to the client. The targets that are set also must be affordable. While
service providers can pass along the cost for infrastructure investments to their clients,
enterprises must evaluate the affordability of an infrastructure investment in terms of the priority
and importance to the business itself.
Internal business users must understand the costs involved in delivering a certain service
level. The use of charge-back for the cost of IT services is growing, making IT into a profit
center instead of a cost center. This also helps allocate IT’s limited resources. If this approach is
not used, then executive management will need to be involved to determine the overall priorities
of the organization, and allocate IT resources accordingly.
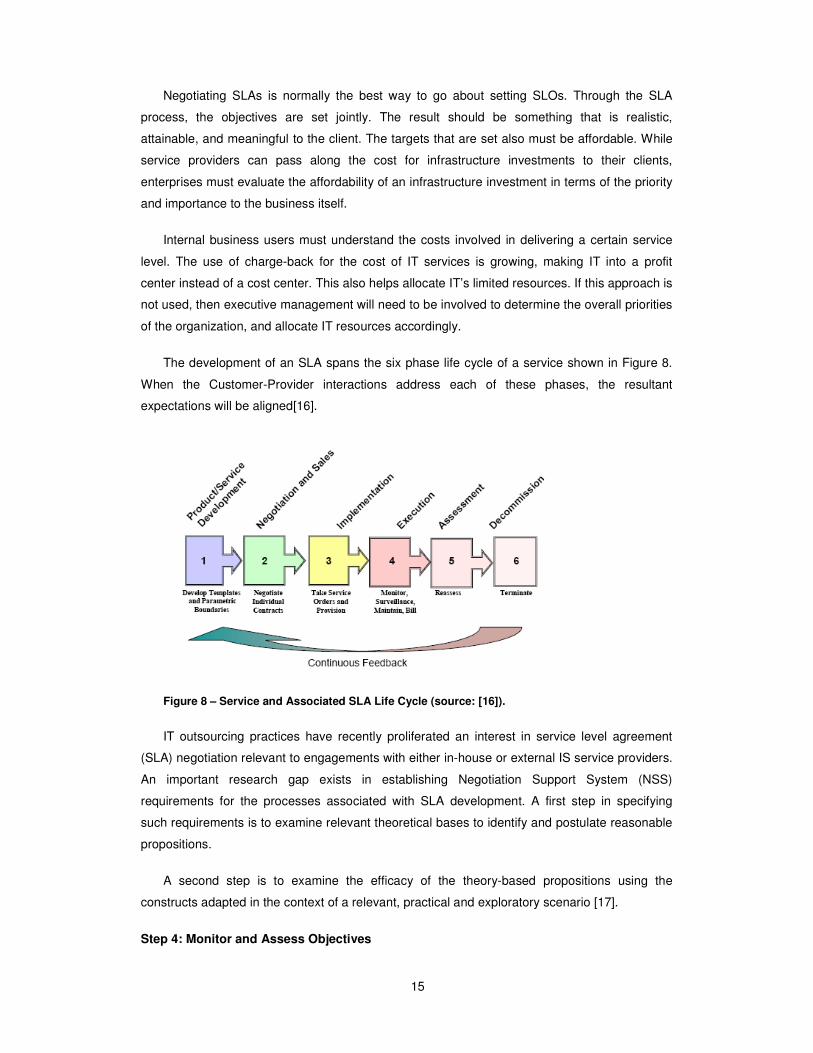
The development of an SLA spans the six phase life cycle of a service shown in Figure 8.
When the Customer-Provider interactions address each of these phases, the resultant
expectations will be aligned[16].
Figure 8 – Service and Associated SLA Life Cycle (source: [16]).
IT outsourcing practices have recently proliferated an interest in service level agreement
(SLA) negotiation relevant to engagements with either in-house or external IS service providers.
An important research gap exists in establishing Negotiation Support System (NSS)
requirements for the processes associated with SLA development. A first step in specifying
such requirements is to examine relevant theoretical bases to identify and postulate reasonable
propositions.
A second step is to examine the efficacy of the theory-based propositions using the
constructs adapted in the context of a relevant, practical and exploratory scenario [17].
Step 4: Monitor and Assess Objectives

16
Once the objectives have been established, the service provider must take steps to ensure
that the SLOs are met. This is an ongoing process of monitoring the level of service being
delivered and comparing it to the SLO. While existing management tools may be sufficient, in
practice, many organizations find that the monitoring and reporting part of the SLM process is
improved (or made possible) with the addition of some specialized tools aimed at that function.
Real-time monitoring and alerting allows for proactive measures to ensure SLAs are met.
Regarding network-based IT Services, agent technology is used to automate Monitorization
processes. With the aid of training scenarios and experiences from current processes, the agent
should learn its behavior to optimize its work-flow. This ability would go far beyond working
along predefined formats. It could increase performance and add the characteristic
``intelligence'' to the agents[18].
The Balanced Scorecard (BSC) is the most widely adopted performance management
methodology. It is a concept to plan, execute and monitor business strategies. BSC uses a mix
of financial and nonfinancial indicators for performance measurement and management. The
Balanced Scorecard is designed to transfer strategy into objectives and consider the four
perspectives: financial, internal processes, customer and learning [19]. This is used to
projecting IT Service Management into IT Governance.
Figure 9 - IT-service performance management framework (source:[20]).
At the technological level, there are several companies that have developed systems that
permit, monitor the service “health” like IBM Tivoli or Cisco IP SLA’s [15].
Step 5: Refine and Improve Service Levels
A service provider (whether an IT organization, carrier, or xSP) should never be satisfied
with any given level of service, even if that level completely satisfies its obligations to its clients.
For competitive reasons, an effort aimed at continuous improvement of the level of service
17
being delivered is in order. It also may be seen as a way to add more value to the service and,
ultimately, derive more revenue.
Furthermore, SLAs will need to be renegotiated as volume grows. Growth will also lead to
improvements in the infrastructure and the ability to raise service levels. New services will be
created, and SLM will expand into other areas of the business and other areas of the
infrastructure. Services may be outsourced, or brought in-house.
Finally, the unstated sixth step of the SLM process is “Repeat.” The process must be
regularly scrutinized for relevance, accuracy, etc. The manager or executive responsible for
providing the service covered by the SLM process must always be examining both the process
and the service, looking for ways to improve both.
2.2.5. Costs and Benefits
What value can SLM bring to the enterprise? This is a critical question, not only because it
justifies the decision to invest in SLM, but also because it asks enterprises to evaluate the
effectiveness of SLM technologies and processes after they have been deployed. A truly
effective SLM initiative will not only deliver a quick return on investment (ROI) on the initial
technology and resource investment, but will continue to produce cost savings, improved
productivity, and greater customer satisfaction throughout its lifetime [2].
When weighing the value of SLM to your organization, it is important to consider:
• The direct and indirect costs
• The tangible and intangible benefits
• The real and perceived risks
In general, the costs of SLM can be broken into two categories:
• IT costs
• Business unit/user costs
IT Costs
While an effective SLM initiative will involve both IT and business groups, it is IT that
generally bears the brunt of the resource costs associated with SLM implementation. It is IT that
will be called upon not only to help establish and maintain service levels, but to provide the
instrumentation required to measure and monitor them.
There are several categories of direct IT costs in SLM:
18
• Time and personnel. For IT, the chief cost of implementing SLM is time. The
processes of defining a service, base lining the service’s performance, establishing
SLOs and SLAs, and monitoring and tuning service levels can be resource-
intensive.
• Software. No matter what the SLOs or service level metrics, any IT-based service
level agreement will require some method of base lining, measuring, and monitoring
service reliability and performance. The “sticker price” of additional tools and
technologies, as well as the cost of maintaining them, must be factored in the SLM
value equation.
• Hardware. In some cases, the aforementioned SLM applications and agents will
require the addition of servers or workstations to operate them. Instrumenting
services for SLM often requires a hardware investment. Again, a list price is usually
sufficient to account for these costs.
• Administrative costs. Aside from the time and personnel required to execute the
initiative itself, SLM often entails related administrative costs, such as SLM training
for IT personnel, time spent to justify or “make the case” for an SLM initiative,
evaluation/procurement time for new products, and so forth.
• Maintenance and repair. If SLAs are violated or general thresholds exceeded, IT
must initiate an effort to find the source of the problem and perform the required
tuning or repairs to get the service back into compliance. The cost of this effort,
while difficult to estimate, should be factored into the equation.
Business Unit/User Costs
For any SLM effort to be successful, it requires participation by those who have a stake in
the performance of the service. This will generally include representatives from the business
units that deliver the service and, in some cases, users or customers of the service as well.
SLM initiatives typically require a manpower investment for several key functions:
• Service definition. In some cases, the SLM initiative will prompt the first joint
meetings of all the contributors to a given business service. The process of defining
the service, identifying its component parts and processes, and establishing its
target user base can be time-and resource-intensive.
• Setting service objectives. Once the service has been defined, some participants
must provide input on the means of measuring its success. After broad performance
goals have been set, participants may give guidance that helps IT set the proper
metrics for measuring service performance, and may even participate in the testing
of SLM tools and processes.
• Ongoing service monitoring. Most SLM initiatives require monitoring not only by
IT, but also by the business units involved in service delivery. Whether the business

19
staff plays a primary or secondary role in monitoring, there is a business personnel
cost associated with the SLM monitoring function.
While SLM costs are relatively easy to quantify in dollars or hours, its benefits are more
difficult to place a value upon. There is usually general agreement that improved service levels
will increase user productivity, lower IT costs, or improve customer satisfaction, but it is often
hard to quantify SLM’s potential impact on these areas [13].
In general, the benefits of SLM can be broken into three categories:
• Direct IT benefits
• Direct business unit/user benefits
• Indirect benefits that may be felt by both IT and business groups
Direct IT Benefits
For the IT organization, SLM provides an opportunity to carve out a group of systems,
services, and people, and to establish them as a single “service” that can be benchmarked and
monitored separately from the rest of the IT infrastructure. Not only does this make the service
easier to measure and monitor, but it also helps IT establish processes and tools for building
and maintaining the service components.
Among the direct benefits of SLM for the IT organization are:
• Improved planning. Once a service has been identified and goals set, the IT
organization no longer has to guess what tools, equipment, or services might be
required to support it in the future. This leads to more intelligent decisions on
personnel deployment, equipment/software procurement, and services contracting.
• Improved instrumentation. The implementation of SLM often enables IT
organizations to justify investment in tools and practices that provide essential data
about infrastructure and applications. This data, which often extends beyond the
specific service to shed light on the entire IT infrastructure, helps to optimize
operations and prevent problems before they occur.
• Improved diagnostics. The implementation of SLM often provides the opportunity
for IT to purchase and/or integrate new tools and practices for event management,
with the goal of finding and diagnosing problems in interconnected components that
each contribute to a single service. These technologies and practices often help in
improving diagnostics and maintenance practices across the IT infrastructure.
• Improved use of staff resources. As a result of the above three benefits, IT
organizations often find that IT operations personnel who were previously devoted
to planning, monitoring, and/or diagnostics have reduced their workload and may
now be available for other duties. Outside the IT operations center, many
20
enterprises also see a drop-off in calls to the IT service desk, because SLM creates
more realistic end-user expectations and helps eliminate nebulous complaints about
service performance.
Direct Benefits
Since the primary goals of SLM are to improve business services and increase user
productivity (and/or customer satisfaction), the direct benefits to business units and end users,
should be readily evident in any SLM implementation.
Among the key areas of benefit to watch for are:
• Improved service availability. A key goal of most SLM efforts is to ensure that the
service is available when users need it. An improvement in availability—typically
easily measured by checking successful logon attempts or completed
transactions—generally translates to improved end-user productivity, greater
customer satisfaction, and/or a better overall impression of service quality.
• Improved service performance. Although there are many different definitions of
service performance and quality, an effective SLM effort generally will refine those
definitions to focus on the most critical metrics, and then find ways to improve upon
them. Some of these metrics, such as end-user response time, may be relatively
easy to measure. Others, such as quality of end-user experience or customer
satisfaction, may be more subjective.
• Improved end-user satisfaction. Whether the service is internal or customer-
facing, SLM generally helps define end-user needs and expectations more
concretely, so that they can be met more consistently. The result of any SLM effort
should be happier users of the service. However, this level of satisfaction may be
difficult to measure, because end users’ evaluations of a service are subjective and
dynamic.
Indirect Benefits
Another way to view the value of an SLM initiative is to measure the benefits of SLM against
the costs of not implementing it. In other words, if SLM eliminates one service failure per month,
or 100 abandoned electronic shopping carts, how does that problem avoidance translate into
cost or revenue savings? These are difficult benefits to quantify, because in each case, the
enterprise is attempting to identify the cost of an event that might have otherwise happened, but
was avoided. However, these considerations are important in assessing the overall value of
SLM.
Some examples of the indirect benefits of SLM include:

21
• Downtime avoided. In many cases, SLM will help IT to recognize potential service
problems before they occur, perform diagnostics, and/or fix problems before they
result in service failure. If there is a historical record of service failures, the
organization can benchmark the frequency of failure before SLM against the
frequency of failure after SLM, and use the delta to show the benefit of the SLM
initiative.
• Business improvement. In some cases, such as online retailing, the effects of IT
service improvements on the success of the business may be readily measured.
However, in many other cases, IT service quality may be only one of many
components that affect business success. If a company makes product
improvements simultaneously with IT service improvements, which of those
improvements should get the credit for increased sales? Like many other business
initiatives, SLM’s impact on overall business performance may be positive, yet
difficult to isolate.
• Productivity gained. If service performance and/or reliability are improved, then it
stands to reason that end users will become more productive. However, the impact
of improved IT service on a specific user’s productivity may be difficult to measure.
One way to estimate this metric is to simply count the number of users affected and
the number of hours/minutes gained, and then multiply this by the average end
user’s salary/benefit figure.
2.2.6. Problems
Despite the many valid benefits of SLM, there are still a number of barriers that cause
organizations to hesitate on implementing an SLM program[2], including:
• Economic issues – A reluctance to allocate budget for new management software
and perhaps hardware and personnel to support it.
• Technical issues – A common misperception that SLM solutions are difficult to
implement, and create even more of a burden once installed.
• Cultural issues – Political tension created by the fact that SLM demands a
connection between business goals and IT.
In addition to these barriers, there is a considerable amount of fear, uncertainty, and doubt
surrounding SLM. Some managers may fear SLM because they have already had painful
experiences with service level agreements. Instead of treating the SLA as a means of
communication and collaboration, customers or clients have used it as a club to attack the IT
manager or service provider.
The IT group may also have committed to SLAs that were unreasonable because they
lacked a good understanding of what service could actually be provided, given the current
22
infrastructure. There are also managers who are uncertain as to where they should begin—they
do not know how to go about establishing and managing a program for SLM or how to negotiate
SLAs. In addition, some managers may doubt the wisdom of spending money on SLM, or that
SLM can provide significant benefits.
Although there is much evidence about the role and importance of SLAs in the context of
Service Management, SLAs show many shortcomings in practice. From empirical research
major problems have been identified[8]:
• Specification of effort versus specification of results - Most SLAs focus on
agreements regarding the effort that will be spent by an SIS provider in case a
problem occurs. However, no commitments are specified regarding the
effectiveness of a service for a customer’s business processes and business
objectives. Instead of “services regarding system X will support your company with
reaching business objectives Y ,” an SLA usually states “we will be at the problem
location within a certain amount of time in case system X breaks down.”
• Unclear service specifications - Agreements on for instance “the availability of a
network” are usually specified using a metric called the availability percentage. It is
often hard to determine what the precise meaning of such a metric is in the context
of a specific business location. For instance, what is the difference between an
availability percentage of 98% and 99%? And does 98%, on a yearly basis, mean
that the network is allowed to go “down” for a whole week, after being “up” for the
last 51 weeks?
• Incomplete service specifications - It is difficult to make complete agreements on
particular services, for instance on services such as security control and disaster
prevention. A key problem is that it is often difficult to describe and to quantify the
consequences of fraud and disasters and to determine what type of services is
needed and to what extent.
• Insufficient cost management - Cost management is often expressed as “making
agreements on a fixed price each year for an integrated set of SIS services.” In
what way these costs can be differentiated and can be related to specific SIS
services, in conformance with the needs of a customer, is often unclear. As a
consequence it is very difficult to determine a price/performance optimum for each
particular service for a customer.
• “Dead-end” SLA documents - A Service Level Agreement is often a technical
document regarding concepts and terminology that can only be understood by a
small group of technology oriented specialists. Often, evaluation and improvement
does not take place on a regular basis. Such a ‘static’ or ‘dead-end’ document has a
very restricted meaning for end-users and their management. The latter are not
able to interpret the ‘agreed’ service specifications nor are they able to tune or
23
enrich the agreed service level agreements. After some time the specification of an
SLA tends to become ‘just an unsatisfying tradition.’
2.2.7. Frameworks and Best Practices
ITIL
Driven by the U.K. government’s Central Computing and Telecommunications Agency, ITIL
is a set of definitions or best practices for IT organizations. While it covers other areas, ITIL
main focus is service management.
ITIL is based on defining best practice processes for IT Service Management and Support,
rather than on defining a broad-based control framework and focuses on the method and
defines a more comprehensive set of processes [21].
ITIL views service management as a single discipline with multiple aspects, and advocates
taking an integrated approach to implementing service management. ITIL service management
is generally divided into two subcategories: service delivery and service support [14].
The disciplines under service delivery are:
• Service level management
• Capacity management
• Contingency planning
• Availability management
• Cost management for IT services
Service support is made up of five disciplines:
• Configuration management
• Problem management
• Change management
• Help desk
• Software control and distribution
In Figure 10 it’s possible to see how the users and costumers relate with the different ITIL
processes.

24
Figure 10 - ITIL Processes (source:[22]).
This approach defines IT quality as the level of alignment between IT services and actual
business needs. As a result, organizations can mature their best practices without regard to
specific technologies [22].
COBIT
For IT to be successful in delivering against business requirements, management should
put an internal control system or framework in place. The COBIT control framework contributes
to these needs by [1]:
• Making a link to the business requirements
• Organizing IT activities into a generally accepted process model
• Identifying the major IT resources to be leveraged
• Defining the management control objectives to be considered
The IT Governance Institute has developed a framework for IT Governance and control
called “Control Objectives for Information and related Technology” (COBIT).
While addressing the management of IT, it is written for business executives and couched
in business terms, such as key performance indicators (KPIs), key goal indicators (KGIs), and
critical success factors (CSFs). The framework contains 34 high-level control objectives, and
318 corresponding detailed objectives. Its focus is to help business management gain IT
alignment with business goals and manage risk in IT [23].
25
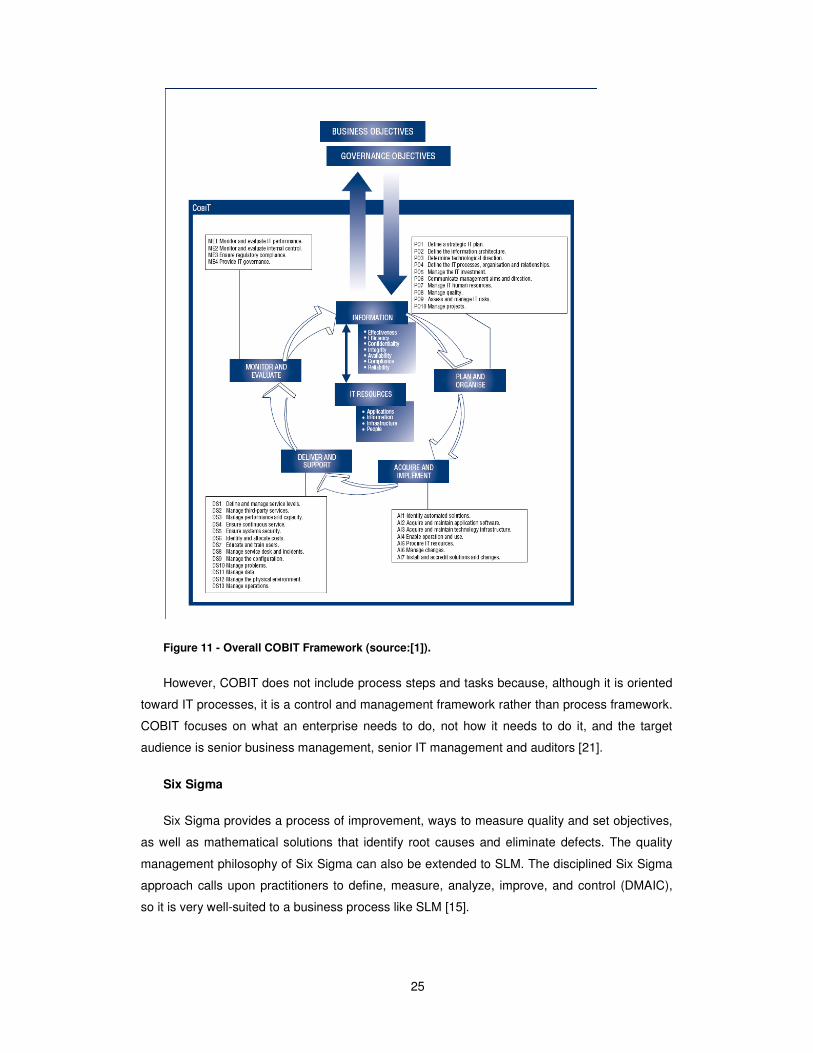
Figure 11 - Overall COBIT Framework (source:[1]).
However, COBIT does not include process steps and tasks because, although it is oriented
toward IT processes, it is a control and management framework rather than process framework.
COBIT focuses on what an enterprise needs to do, not how it needs to do it, and the target
audience is senior business management, senior IT management and auditors [21].
Six Sigma
Six Sigma provides a process of improvement, ways to measure quality and set objectives,
as well as mathematical solutions that identify root causes and eliminate defects. The quality
management philosophy of Six Sigma can also be extended to SLM. The disciplined Six Sigma
approach calls upon practitioners to define, measure, analyze, improve, and control (DMAIC),
so it is very well-suited to a business process like SLM [15].
26
In contrast, applications of Six Sigma that focus on the design or redesign or products and
services and their enabling processes so that from the beginning customer needs and
expectations are fulfilled are known as Design for Six Sigma (DFSS). The focal aim of DFSS is
to create designs that are resource efficient, capable of exceptionally high yields, and are robust
to process variations. This aim produces a recasting of DMAIC that can be aptly characterized
as Define–Measure–Analyze–Design–Verify and described as follows [24].
• Define customer requirements and goals for the process, product, or service.
• Measure and match performance to customer requirements.
• Analyze and assess the design for the process, product, or service.
• Design and implement the array of new processes required for the new process,
product, or service.
• Verify results and maintain performance.
Six Sigma can be integrated with the Balance Scorecard since it has been used by senior
executives for more than a decade and represents excellent tool for strategy development [25].
TeleManagement Forum (TMF)
The TeleManagement Forum [15], an industry association composed mostly of carriers and
service providers, was formed in order to improve the management and operation of
communications services. TMF focuses its efforts on improving the performance of operations
support systems (OSS): the operations, administration, management, and provisioning systems
of most carriers and service providers. Many of the SLM concepts developed to ensure the
quality of telecommunications services are now being applied to enterprise services, so the
TMF’s activities and specifications are worth watching as they evolve.

27
3. Problem
3.1. IT Problems and Priorities
Several concepts have been developed during the last few years such as IT governance, IT
score-cards, and benchmarking that have been considered by IT and business executives. But
surprisingly, a recent study by the IT Governance Institute (ITGI) that covered 335 CEOs and
CIOs in 21 countries, reported “while more than 91 percent of executives recognize that
information technology (IT) is vital to the success of their businesses, more than two-thirds of
CEOs are not comfortable answering questions about governance and control over their IT
processes.” The study validates that the major problem continues to be “the in-adequate view of
how well IT is performing” [26]. Figure 12 illustrates this analysis.
Figure 12 – Problems and Priorities of CEO’s and CIO’s (source: [27]).
It’s imperative for the success of Companies now and in the future, to have a better control
of the IT and IS. This control it’s only possible if IT were manageable. To conquest this goal, it’s
necessary to measure.
3.2. Legal Obligations
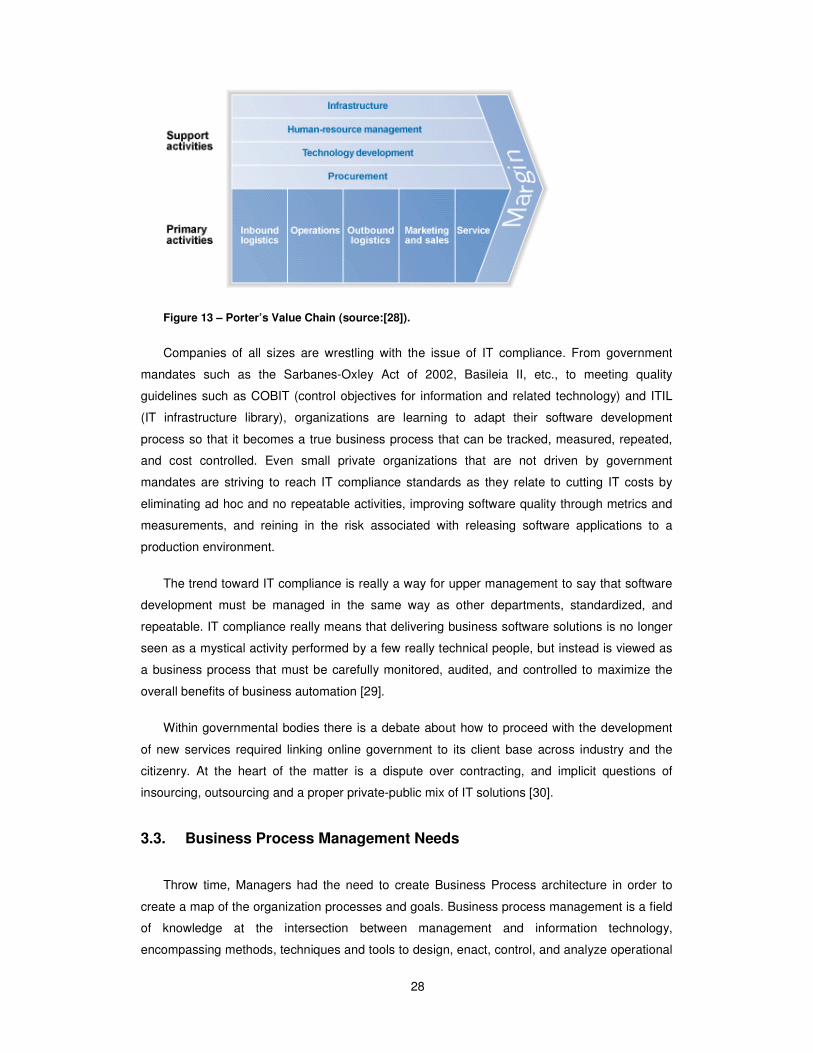
It’s a fact that the IT needs to be aligned with business and not the other way around.
Business can be represented as a Value Chain that organizes the business horizontally,
dividing in areas from providers, throw transformation into customers. Figure 13 illustrates the
Porter’s Value Chain in a Strategic Management point of view.
28
Figure 13 – Porter’s Value Chain (source:[28]).
Companies of all sizes are wrestling with the issue of IT compliance. From government
mandates such as the Sarbanes-Oxley Act of 2002, Basileia II, etc., to meeting quality
guidelines such as COBIT (control objectives for information and related technology) and ITIL
(IT infrastructure library), organizations are learning to adapt their software development
process so that it becomes a true business process that can be tracked, measured, repeated,
and cost controlled. Even small private organizations that are not driven by government
mandates are striving to reach IT compliance standards as they relate to cutting IT costs by
eliminating ad hoc and no repeatable activities, improving software quality through metrics and
measurements, and reining in the risk associated with releasing software applications to a
production environment.
The trend toward IT compliance is really a way for upper management to say that software
development must be managed in the same way as other departments, standardized, and
repeatable. IT compliance really means that delivering business software solutions is no longer
seen as a mystical activity performed by a few really technical people, but instead is viewed as
a business process that must be carefully monitored, audited, and controlled to maximize the
overall benefits of business automation [29].
Within governmental bodies there is a debate about how to proceed with the development
of new services required linking online government to its client base across industry and the
citizenry. At the heart of the matter is a dispute over contracting, and implicit questions of
insourcing, outsourcing and a proper private-public mix of IT solutions [30].
3.3. Business Process Management Needs
Throw time, Managers had the need to create Business Process architecture in order to
create a map of the organization processes and goals. Business process management is a field
of knowledge at the intersection between management and information technology,
encompassing methods, techniques and tools to design, enact, control, and analyze operational
29
business processes involving humans, organizations, applications, documents and other
sources of information [31].
Business Activity Monitoring (BAM) is software that aids in monitoring of business
processes, as those processes are implemented in BPM systems. BAM is an enterprise solution
primarily intended to provide a real-time summary of business processes to operations
managers and upper management. As such, BAM presents dashboards that contain key
performance indicators (KPI) that support root cause analysis and alerts that warn of impending
problems. Trouble notification functions are integral to most BAM solutions and these are many
and varied. For example, whole groups of people can be sent e-mails, voice or text messages,
according to the nature of the problem. Automated problem solving, where feasible, can correct
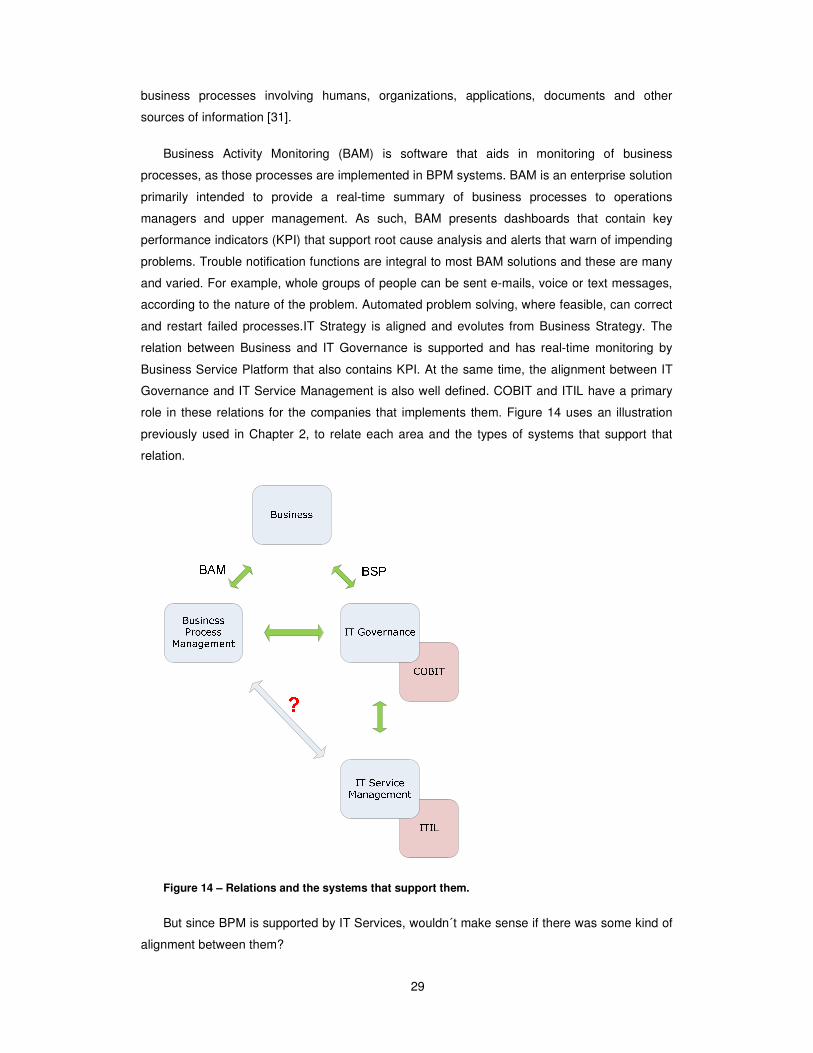
and restart failed processes.IT Strategy is aligned and evolutes from Business Strategy. The
relation between Business and IT Governance is supported and has real-time monitoring by
Business Service Platform that also contains KPI. At the same time, the alignment between IT
Governance and IT Service Management is also well defined. COBIT and ITIL have a primary
role in these relations for the companies that implements them. Figure 14 uses an illustration
previously used in Chapter 2, to relate each area and the types of systems that support that
relation.
Figure 14 – Relations and the systems that support them.
But since BPM is supported by IT Services, wouldn´t make sense if there was some kind of
alignment between them?

30
3.4. Customer-Provider IT Service Relation
With time and with the need to divide costs throw business units, the relation between
internal customers, internal business support and service providers got more complex.
Today, IT services are delivered through a mix of structured and unstructured work
activities. Structured activities rely primarily on standardized processes, procedures, and tools.
In IT service support and delivery, an increasingly popular standardization effort is embodied by
Information Technology Infrastructure Libraries (ITIL) [32] [33], which prescribe processes for
capacity management, availability management, service-level management, and financial
management to achieve high quality IT services.
Unstructured activities involve local work practices, custom developed tools, ad hoc
collaborations with colleagues, and informal procedures. These activities include seeking
information from colleagues or external sources, writing custom scripts, troubleshooting,
renegotiating policies, seeking approvals, discovering change impacts, and sharing information
on demand [34]. Results from the studies of IT service delivery suggest that considerable time
is spent on unstructured work activities [35] [36], which are not surprising as knowledge work is
typically collaborative, informal, and situated [37].
Customer orientation is one of the most important strategic orientations in the context of
strategic IT management in today’s enterprises [33]. Enterprises need to manage the delivery of
services that support users in conducting their activities in the context of business processes.
They have to achieve a common understanding between the customer/user and provider
through managing service level expectations and service level delivery, and delivering and
supporting desired results [38].
External IT providers as well as internal IT departments are no longer sheer technology
providers. Instead, most of them act increasingly as service providers for IT users. These IT
users, respectively customers, demand functionality with a defined quality that supports their
activities within business processes and improves their productivity [39].
In order to specify IT provider / IT customer coordination, IT services need to be defined.
Service and quality characteristics for such IT services are negotiated between service
providers and customers and specified by means of a service level agreement (SLA) [40].
Thereby, it makes no difference whether the user receives the service from an internal IT
department or from an external service provider. This transformation from a technology oriented
IT shop towards a customer oriented service provider that engineers its IT processes in a
systematic, methodical manner can only be done in terms of a service oriented IT management
[33].
Figure 15 illustrates a customer-provider cycle example.
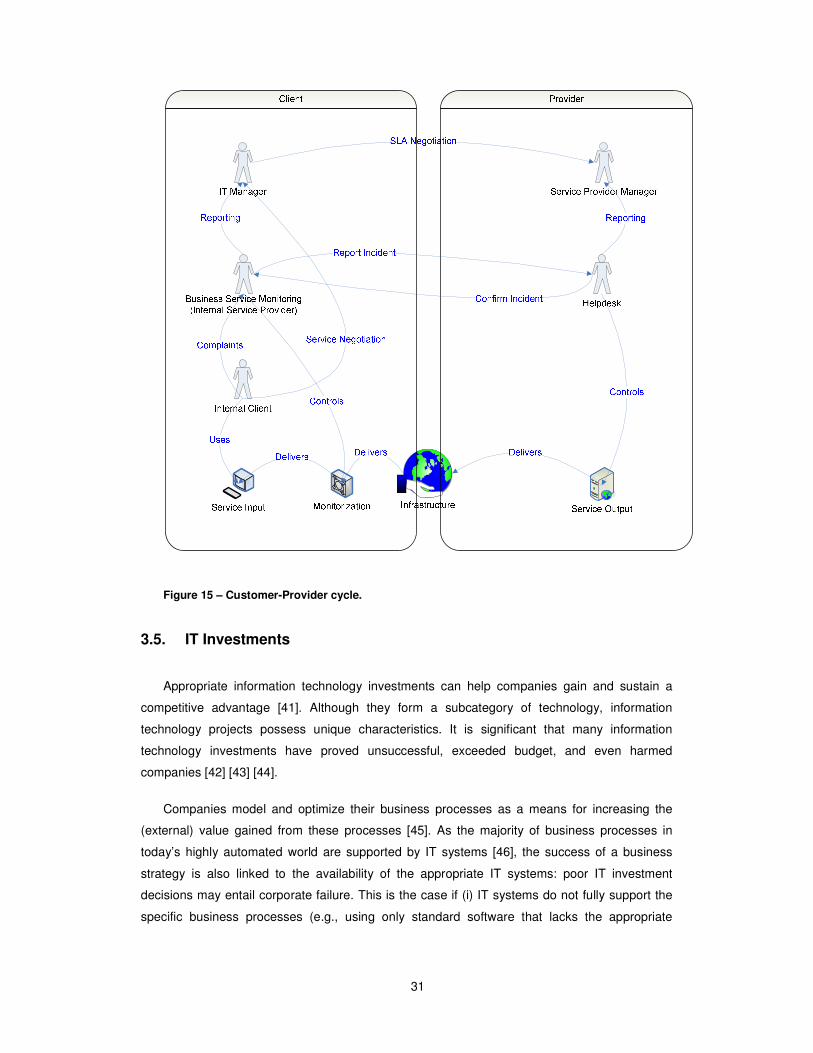
31
Figure 15 – Customer-Provider cycle.
3.5. IT Investments
Appropriate information technology investments can help companies gain and sustain a
competitive advantage [41]. Although they form a subcategory of technology, information
technology projects possess unique characteristics. It is significant that many information
technology investments have proved unsuccessful, exceeded budget, and even harmed
companies [42] [43] [44].
Companies model and optimize their business processes as a means for increasing the
(external) value gained from these processes [45]. As the majority of business processes in
today’s highly automated world are supported by IT systems [46], the success of a business
strategy is also linked to the availability of the appropriate IT systems: poor IT investment
decisions may entail corporate failure. This is the case if (i) IT systems do not fully support the
specific business processes (e.g., using only standard software that lacks the appropriate
32
adaptations), (ii) the IT systems are inefficient with respect to the firm’s strategic objectives, or
(iii) the core functions are shared and freely available [47].
Thereby, the decision of the right service has a major importance. How can we better the
information delivered for this proposal?
3.6. IT Monitorization
On day to day monitorization BAM systems gather information of the state of each Business
Process. At the same time and when a business process is affected by one activities that is
suspended because an incident on a service, BAM system only into the Activity or in a good
case to the task.
In the same time that this service fails, Business Service Monitoring areas, integrated in ITIL
Service Support, focus on resolving that incident and gather information to identify if that
incident is a problem.
A plethora of service oriented IT management concepts have been developed in the past.
The IT Infrastructure Library (ITIL) is the de-facto-standard for IT service provider and it is
probably the most extensive concept for IT Service Management (ITSM) [48]. ITIL can be
defined as a generic reference model that supports planning, monitoring and controlling of IT
services [33]. Its most important components are “Service Delivery“, “Application Management“,
“Service Support“ and “ICT Infrastructure Management“ [48]. Concepts for the provision of IT
services can be found in “Service Support” and “Service Delivery”, especially within the process
definition for service level management (SLM).
The performance optimization tools used to accurately gauge performance, as with all the
software tools used by the organization, have to be in the organization's CMDB (Configuration
Management Database). Configuration management is the implementation of a database that
contains details of the organization’s elements that are used in the provision and management
of its IT services. This also is known as an asset register. Now, that we have the tool, the basis
of usage is guided by the SLA. The application should comply with the service level agreements
(SLA) before it passes out of the hands of the performance analysis team. An SLA is framed
and finalized after discussions with the intended client, and it shall contain the kind of results
expected in specific terms and the level of severity [49].

33
3.7. Conclusion
IT drives to the goal of acting as a service provider to the rest of the business. However,
responsible IT Service owners are challenged by the fact they often don’t have a clear
perspective of the business health of critical processes that their IT systems are supporting. And
although service owners need business-significant metrics to really understand business health,
most event data from infrastructure management tools is IT-centric, and has little relation to
relevant business conditions.
At the same time, business operations teams are trying to use information provided by IT to
help them understand how their key business processes and services are performing. When an
IT problem is reported, business personnel need to verify that they have the information
required to understand the implications of the problem on key business processes and
customers, and ultimately on the business itself. By enabling IT to gain visibility and a better
understanding of the condition of business services and processes that are key to the business,
IT Service managers and service owners will have a better business perspective and the right
level of knowledge to respond to, and negotiate with the business [50].

34
35
4. Proposal
4.1. Introduction
The introduction to the proposal begins with the conclusion of the problem in Chapter 3.
After the analysis, some facts can be stated as needs or problems which probably an IT System
solution could help.
In order to help to focus and organize, 4 points were defined as the back bone of this
proposal:
• Types of companies aimed: Governments, big companies with or without a large
percentage of IT Outsourcing and Service Providers.
• Legal Obligations: Sarbanes-Oxley and Basel II.
• Management needs: IT and Business Strategy’s alignment; SLA’s implementation
in a customer-oriented process; IT measurement and payoff; choose the right
Service;
• Best practices used in IT: COBIT, ITIL and BPM
Resuming, there’s a needed of a Business Process-oriented IT Services Monitorization,
which permits a better measurement of IT Services performance and costs in order to respond
to the Legal Obligations and Management needs, interacting directly with the Business
Processes.
After the study of the areas related with this work, and particularly the Service Level
Management, the proposal that help aligned the monitorization of IT Services on a Business
Process perspective was clearly.
Probably the best way to espouse this idea is in the form of a Framework, which is used in
research to outline possible courses of action or to present a preferred approach to an idea. To
create this Framework I propose 6 steps:
1. Framework;
2. Pre-requirements;
3. Implementation;
4. Monitorization;
5. Evaluation;
During this Chapter I’ll try to explain the proposal in a way to aggregate Management needs
with IT Service monitorization.
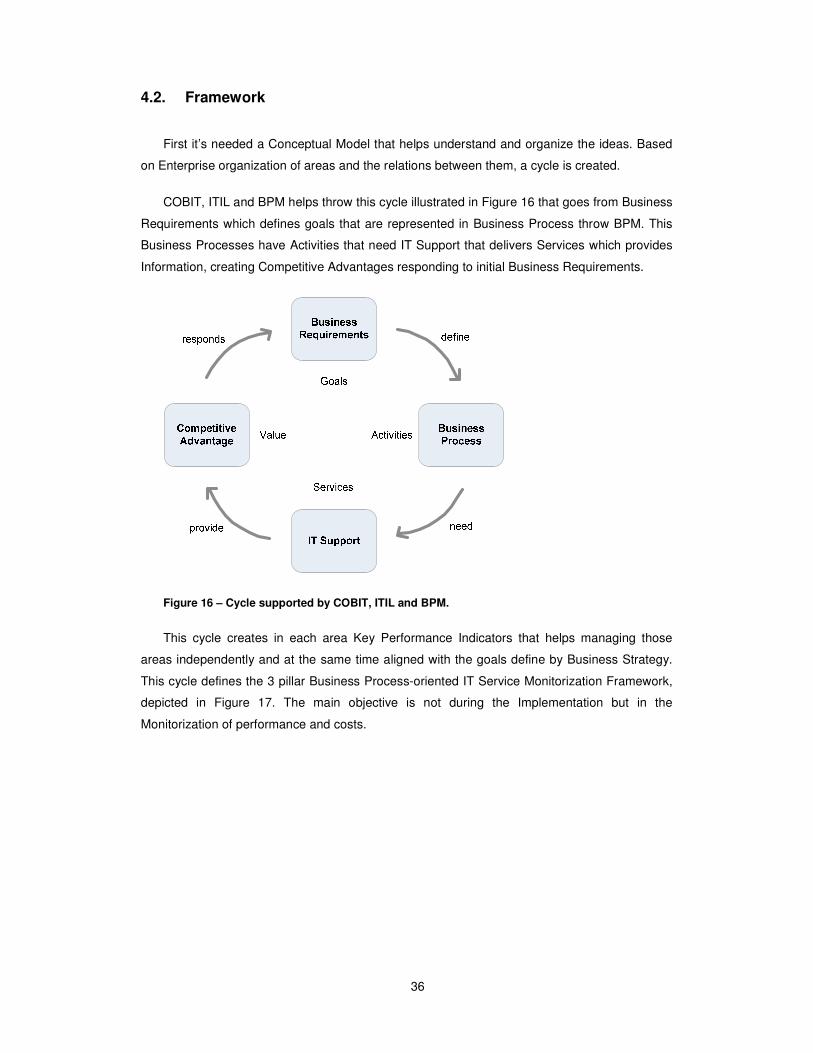
36
4.2. Framework
First it’s needed a Conceptual Model that helps understand and organize the ideas. Based
on Enterprise organization of areas and the relations between them, a cycle is created.
COBIT, ITIL and BPM helps throw this cycle illustrated in Figure 16 that goes from Business
Requirements which defines goals that are represented in Business Process throw BPM. This
Business Processes have Activities that need IT Support that delivers Services which provides
Information, creating Competitive Advantages responding to initial Business Requirements.
Figure 16 – Cycle supported by COBIT, ITIL and BPM.
This cycle creates in each area Key Performance Indicators that helps managing those
areas independently and at the same time aligned with the goals define by Business Strategy.
This cycle defines the 3 pillar Business Process-oriented IT Service Monitorization Framework,
depicted in Figure 17. The main objective is not during the Implementation but in the
Monitorization of performance and costs.
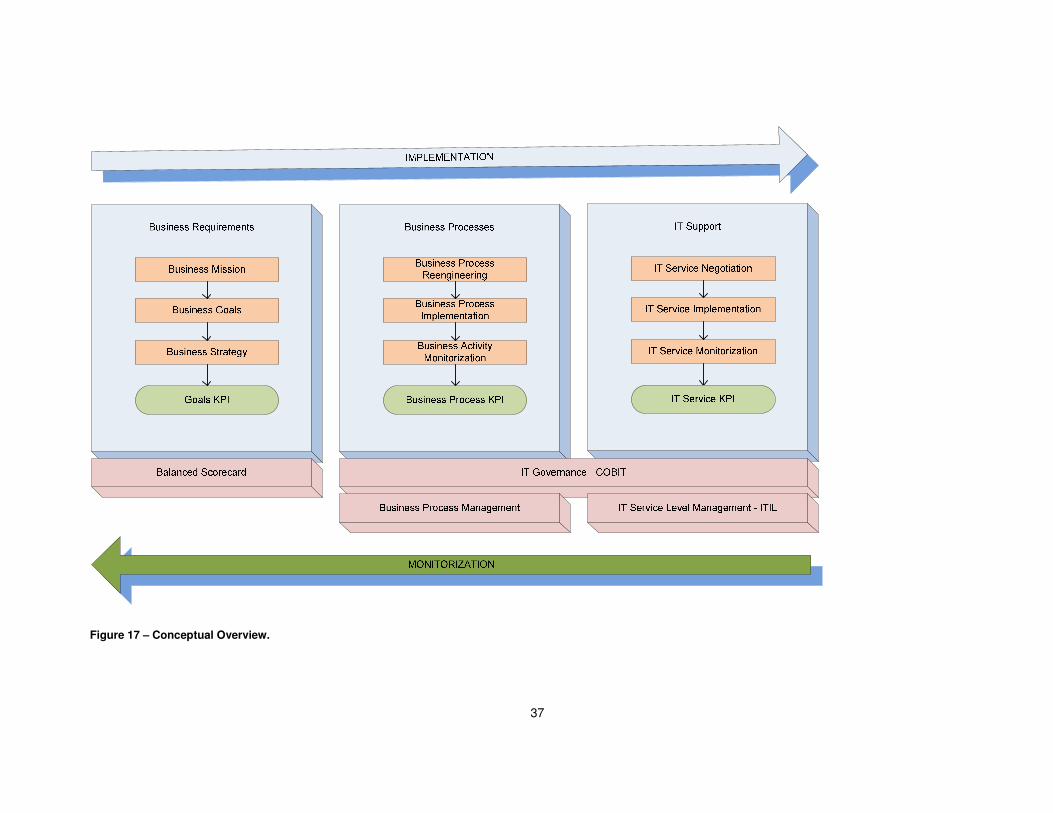
37
Figure 17 – Conceptual Overview.
38
The Relation between Customers and Providers and the SLA is one of the problems. It’s
very hard to define costs on a Service since IT doesn’t know how the costs can be divided
between customers.
At the same time, IT Service doesn’t know which services are costing more to the business
in that specific time when several are stopped. Enough information and systems are available to
manage IT Service Support as to manage Business Process Management. The problem is in
the monitorization and in the evaluation on relation between IT Services and Business
Processes.
4.3. Pre-requirements
For greater success on the implementation of the proposal, some pre-requirements are
expected. These requirements are essential and the better are the know-how and state of
maturity of the requirements, greater are the success factor. Such as:
• A IT Governance Framework such as COBIT to a better BPM and ITIL integration
and Management;
• A Business Process Management must have well defined and normalized Business
Processes which represent the strategic goals and needs;
• A IT Service Management Framework such as ITIL to good IT Service Delivery and
Support and a CMDB that support them;
• KPI’s must be Specific, Measurable, Achievable, Relevant and Timely;
• A Balanced Scorecard which:
o Translates the vision into operational goals;
o Communicates the vision and link it to individual performance;
o Business planning;
o Feedback and learning and adjusting the strategy accordingly;
Normally, the CIO has these competences and has the better comprehension of these
requirements. It’s essential that Managers have Dashboards that permit interact, configure and
manage information of the KPI’s and the Monitorization. An IT Governance and IT Service
Management mature. A CMDB which permits centralized and organized information of
information systems.
4.4. Implementation
For the implementation independently of the physical architecture used by companies, it’s
needed that the Logical architecture respects the relations as depicted in Figure 18.

39
Figure 18 – Logical relation of the Framework.
40
SLA will permit to divide costs and evaluates the performance of each service as a
singularity. In the other hand, KPI’s will permit no measure performance of each area and
relation between them will permit an impact analysis from IT Service to Business Goals.
Each entity can have particularities of the business in hands, but in this relation are several
points to be attention:
1. SLA Definition;
2. KPI Definition;
3. Business Process – Activity – Transaction – Service Relation;
SLA Negotiation and Definition
SLA must have three types of information: (i) Service, (ii) Business Unit and (iii) the relation
between Transaction and Activity.
(i) In the Service Information must be defined:
• Total Cost = Base Cost x Availability;
• Hierarchy of Service Transactions;
(ii) In the Business Unit
• Activities and the related Business Process that will use this Service;
(iii) Activity x Transaction Relation;
• Which Activity uses which Transaction;
This information is essential to cost division and performance measurement proposed on
Evaluation step.
KPI Definition
The KPI’s should have a hierarchy. A Goal KPI can be affected by 1 or more Business
Process KPI, and at the same time a IT Service KPI can affect 1 or more Business Processes.
This relation will permit to measure performance in a Business Process-oriented way,
proposed on Evaluation step.
Business Process – Activity – Transaction – Service Relation
This relation will permit a macro view of the relation between all Services and Business
Process in order to have an exact measurement of an IT Service impact. The finer the
granularity we have, the more will be the Evaluation precision.
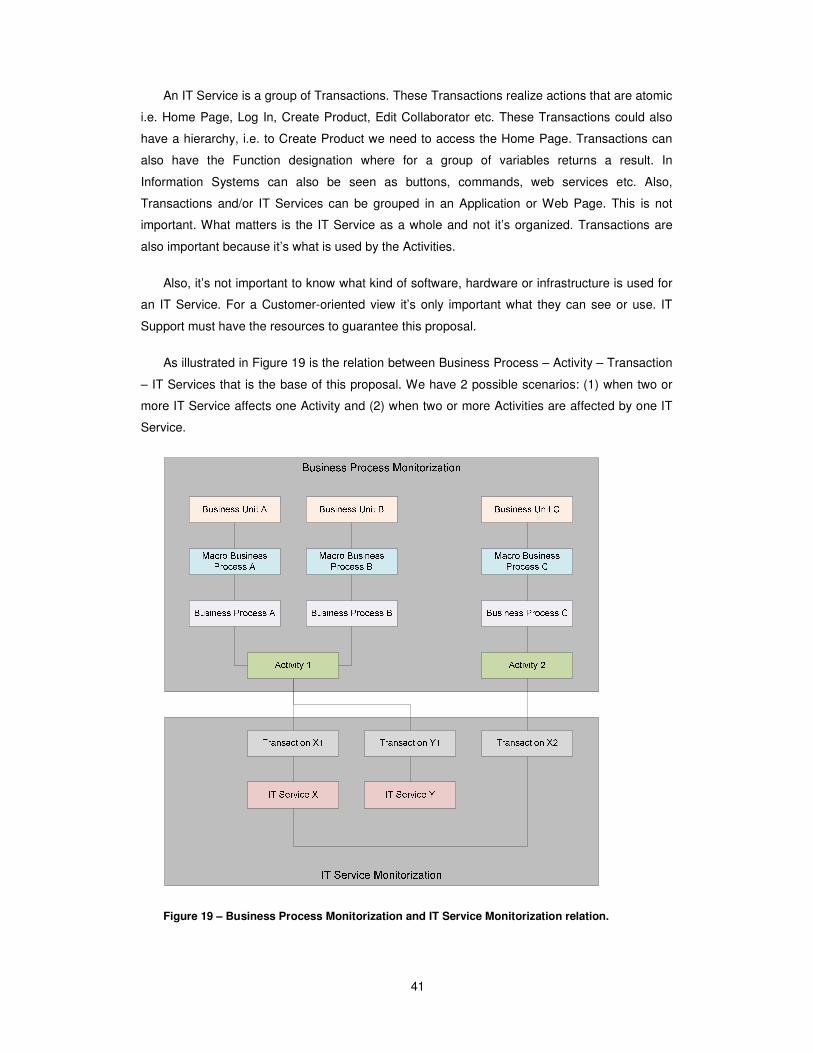
41
An IT Service is a group of Transactions. These Transactions realize actions that are atomic
i.e. Home Page, Log In, Create Product, Edit Collaborator etc. These Transactions could also
have a hierarchy, i.e. to Create Product we need to access the Home Page. Transactions can
also have the Function designation where for a group of variables returns a result. In
Information Systems can also be seen as buttons, commands, web services etc. Also,
Transactions and/or IT Services can be grouped in an Application or Web Page. This is not
important. What matters is the IT Service as a whole and not it’s organized. Transactions are
also important because it’s what is used by the Activities.
Also, it’s not important to know what kind of software, hardware or infrastructure is used for
an IT Service. For a Customer-oriented view it’s only important what they can see or use. IT
Support must have the resources to guarantee this proposal.
As illustrated in Figure 19 is the relation between Business Process – Activity – Transaction
– IT Services that is the base of this proposal. We have 2 possible scenarios: (1) when two or
more IT Service affects one Activity and (2) when two or more Activities are affected by one IT
Service.
Figure 19 – Business Process Monitorization and IT Service Monitorization relation.
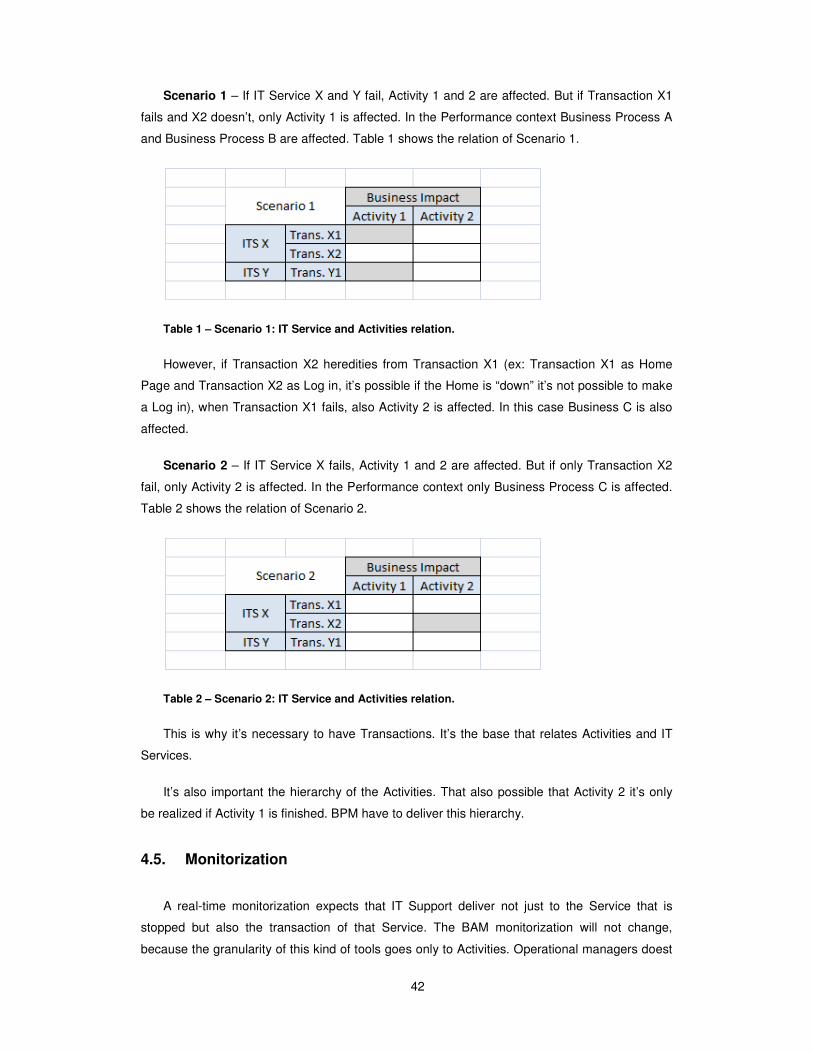
42
Scenario 1 – If IT Service X and Y fail, Activity 1 and 2 are affected. But if Transaction X1
fails and X2 doesn’t, only Activity 1 is affected. In the Performance context Business Process A
and Business Process B are affected. Table 1 shows the relation of Scenario 1.
Table 1 – Scenario 1: IT Service and Activities relation.
However, if Transaction X2 heredities from Transaction X1 (ex: Transaction X1 as Home
Page and Transaction X2 as Log in, it’s possible if the Home is “down” it’s not possible to make
a Log in), when Transaction X1 fails, also Activity 2 is affected. In this case Business C is also
affected.
Scenario 2 – If IT Service X fails, Activity 1 and 2 are affected. But if only Transaction X2
fail, only Activity 2 is affected. In the Performance context only Business Process C is affected.
Table 2 shows the relation of Scenario 2.
Table 2 – Scenario 2: IT Service and Activities relation.
This is why it’s necessary to have Transactions. It’s the base that relates Activities and IT
Services.
It’s also important the hierarchy of the Activities. That also possible that Activity 2 it’s only
be realized if Activity 1 is finished. BPM have to deliver this hierarchy.
4.5. Monitorization
A real-time monitorization expects that IT Support deliver not just to the Service that is
stopped but also the transaction of that Service. The BAM monitorization will not change,
because the granularity of this kind of tools goes only to Activities. Operational managers doest
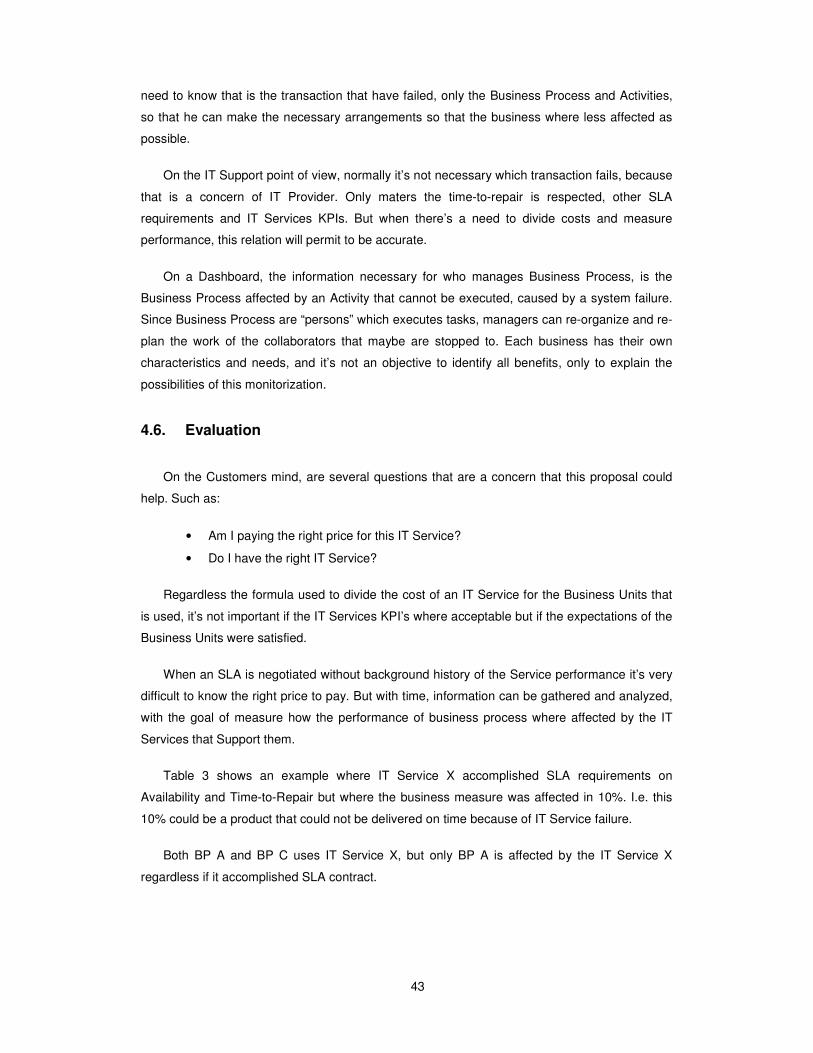
43
need to know that is the transaction that have failed, only the Business Process and Activities,
so that he can make the necessary arrangements so that the business where less affected as
possible.
On the IT Support point of view, normally it’s not necessary which transaction fails, because
that is a concern of IT Provider. Only maters the time-to-repair is respected, other SLA
requirements and IT Services KPIs. But when there’s a need to divide costs and measure
performance, this relation will permit to be accurate.
On a Dashboard, the information necessary for who manages Business Process, is the
Business Process affected by an Activity that cannot be executed, caused by a system failure.
Since Business Process are “persons” which executes tasks, managers can re-organize and re-
plan the work of the collaborators that maybe are stopped to. Each business has their own
characteristics and needs, and it’s not an objective to identify all benefits, only to explain the
possibilities of this monitorization.
4.6. Evaluation
On the Customers mind, are several questions that are a concern that this proposal could
help. Such as:
• Am I paying the right price for this IT Service?
• Do I have the right IT Service?
Regardless the formula used to divide the cost of an IT Service for the Business Units that
is used, it’s not important if the IT Services KPI’s where acceptable but if the expectations of the
Business Units were satisfied.
When an SLA is negotiated without background history of the Service performance it’s very
difficult to know the right price to pay. But with time, information can be gathered and analyzed,
with the goal of measure how the performance of business process where affected by the IT
Services that Support them.
Table 3 shows an example where IT Service X accomplished SLA requirements on
Availability and Time-to-Repair but where the business measure was affected in 10%. I.e. this
10% could be a product that could not be delivered on time because of IT Service failure.
Both BP A and BP C uses IT Service X, but only BP A is affected by the IT Service X
regardless if it accomplished SLA contract.
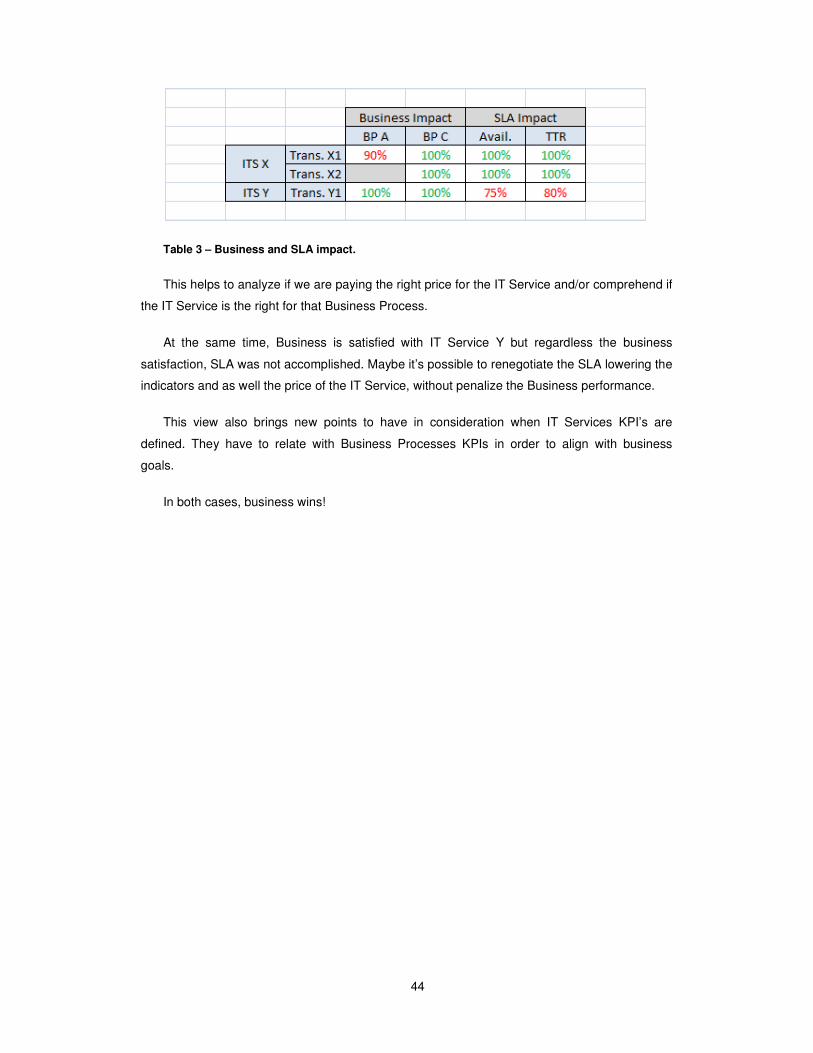
44
Table 3 – Business and SLA impact.
This helps to analyze if we are paying the right price for the IT Service and/or comprehend if
the IT Service is the right for that Business Process.
At the same time, Business is satisfied with IT Service Y but regardless the business
satisfaction, SLA was not accomplished. Maybe it’s possible to renegotiate the SLA lowering the
indicators and as well the price of the IT Service, without penalize the Business performance.
This view also brings new points to have in consideration when IT Services KPI’s are
defined. They have to relate with Business Processes KPIs in order to align with business
goals.
In both cases, business wins!

45
5. Case Study
Note: In this Chapter there can be some information appearing as XXXX or not
explicit. This mark will appear for all information marked as confidential by Millennium
bcp.
5.1. Introduction
The Case Study based on this proposal was made in Millennium bcp, the biggest
Portuguese bank. Millennium bcp has an IT Global Division that is responsible for the IT in the
bank. IT Global Division is organized as depicted in Figure 20.
Figure 20 – Millennium bcp IT Global Division.
Business Support Division is responsible in part for the IT Service Management. This
Division has other sub-divisions as illustrated Figure 21. Business Service Monitoring is
responsible for the Negotiation, Client Support (as a Helpdesk 1st line) and Problem and
Incident Management.
Figure 21 – Millennium bcp Business Support Division.
46
BSM is the area that is responsible for IT Services information delivering and managing the
information needed for this proposal. Basileia II come as a legal obligation and in the IT
concern, was a need to define the Business Process for the risk and capital analysis. Each
Business Unit is responsible to deliver those Business Processes. After the Business Processes
pass on Quality Division, they are ready to use.
The goal of the project was unique: to prove if this approach brings value to Millennium bcp.
This work was made by direct supervision of BSD and BSM Direction.
It’s also relevant to inform that Millennium bcp has part of the IT supported by an
outsourcing agreement with IBM. The Group continues to be responsible for the management of
IT Service Management [51].
5.2. Project
The project was based on the proposal and two kinds of information where required: (i)
Business Process that already passed quality and (ii) IT Services information.
There was delivered 80 Business Processes and 413 IT Services. For the purpose of this
work, it was necessary to filter this information for a smaller number of data. Thus, Dr. Joaquim
Calhau, Director of Business Service Monitoring, gave the information that from the 413, 76
were considered “critical” for business. From those 76, 20 are referred as the ITGD 20, the most
important indicator for Business Service Monitoring.
After gathering information of those 20 IT Services, was made a cross-reference with the
information from the Business Processes delivered. From this relation, 21 Business Processes
where identified as the primary users of the IT Services defined earlier as the ITGD 20 from
Business Service Monitoring.
Nevertheless, some information was not available. There was no indication of the
Transactions used by the Activities in the Business Processes, only the name of the
applications used by the users. This is perfectly normal, since the Business Processes where
made by Business Units and customers/users don’t have the information beyond the
applications used. On the time available for this project few information where delivered by
application management.
Thus, five Business Processes and five IT Services where used on this trial. The relations
between them are depicted on Table 4.

47
Table 4 – Relation between Millennium bcp Business Processes and IT Services.
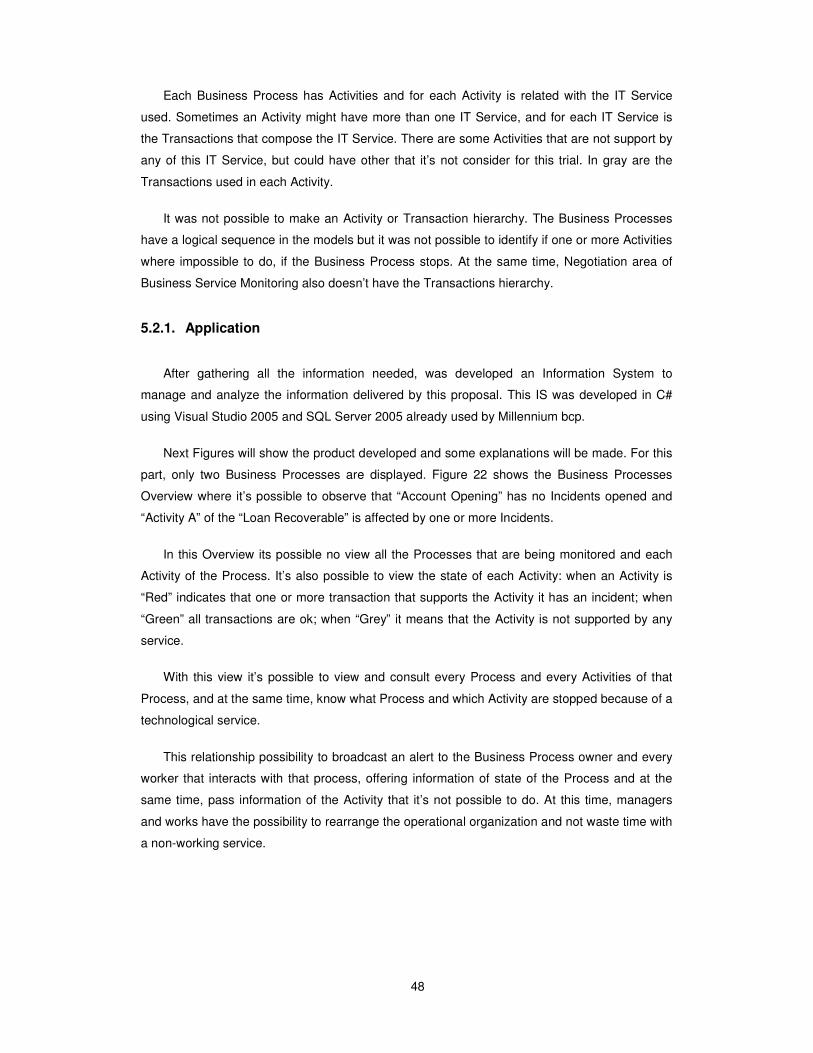
48
Each Business Process has Activities and for each Activity is related with the IT Service
used. Sometimes an Activity might have more than one IT Service, and for each IT Service is
the Transactions that compose the IT Service. There are some Activities that are not support by
any of this IT Service, but could have other that it’s not consider for this trial. In gray are the
Transactions used in each Activity.
It was not possible to make an Activity or Transaction hierarchy. The Business Processes
have a logical sequence in the models but it was not possible to identify if one or more Activities
where impossible to do, if the Business Process stops. At the same time, Negotiation area of
Business Service Monitoring also doesn’t have the Transactions hierarchy.
5.2.1. Application
After gathering all the information needed, was developed an Information System to
manage and analyze the information delivered by this proposal. This IS was developed in C#
using Visual Studio 2005 and SQL Server 2005 already used by Millennium bcp.
Next Figures will show the product developed and some explanations will be made. For this
part, only two Business Processes are displayed. Figure 22 shows the Business Processes
Overview where it’s possible to observe that “Account Opening” has no Incidents opened and
“Activity A” of the “Loan Recoverable” is affected by one or more Incidents.
In this Overview its possible no view all the Processes that are being monitored and each
Activity of the Process. It’s also possible to view the state of each Activity: when an Activity is
“Red” indicates that one or more transaction that supports the Activity it has an incident; when
“Green” all transactions are ok; when “Grey” it means that the Activity is not supported by any
service.
With this view it’s possible to view and consult every Process and every Activities of that
Process, and at the same time, know what Process and which Activity are stopped because of a
technological service.
This relationship possibility to broadcast an alert to the Business Process owner and every
worker that interacts with that process, offering information of state of the Process and at the
same time, pass information of the Activity that it’s not possible to do. At this time, managers
and works have the possibility to rearrange the operational organization and not waste time with
a non-working service.
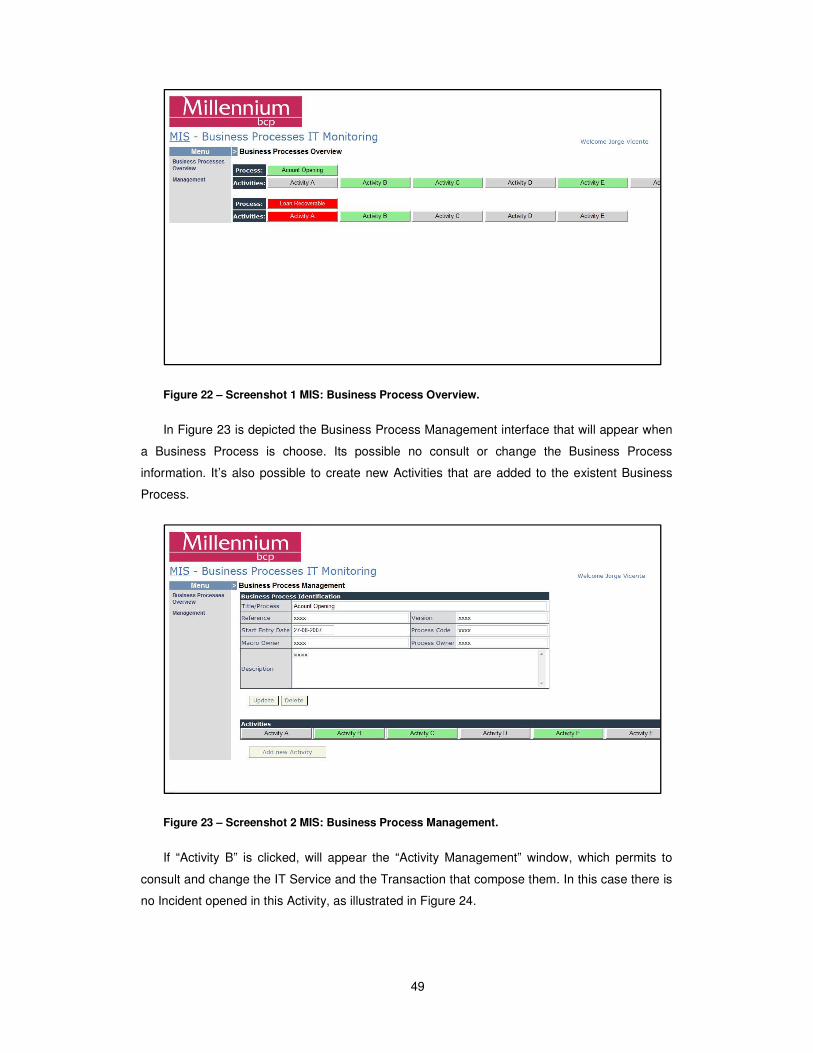
49
Figure 22 – Screenshot 1 MIS: Business Process Overview.
In Figure 23 is depicted the Business Process Management interface that will appear when
a Business Process is choose. Its possible no consult or change the Business Process
information. It’s also possible to create new Activities that are added to the existent Business
Process.
Figure 23 – Screenshot 2 MIS: Business Process Management.
If “Activity B” is clicked, will appear the “Activity Management” window, which permits to
consult and change the IT Service and the Transaction that compose them. In this case there is
no Incident opened in this Activity, as illustrated in Figure 24.
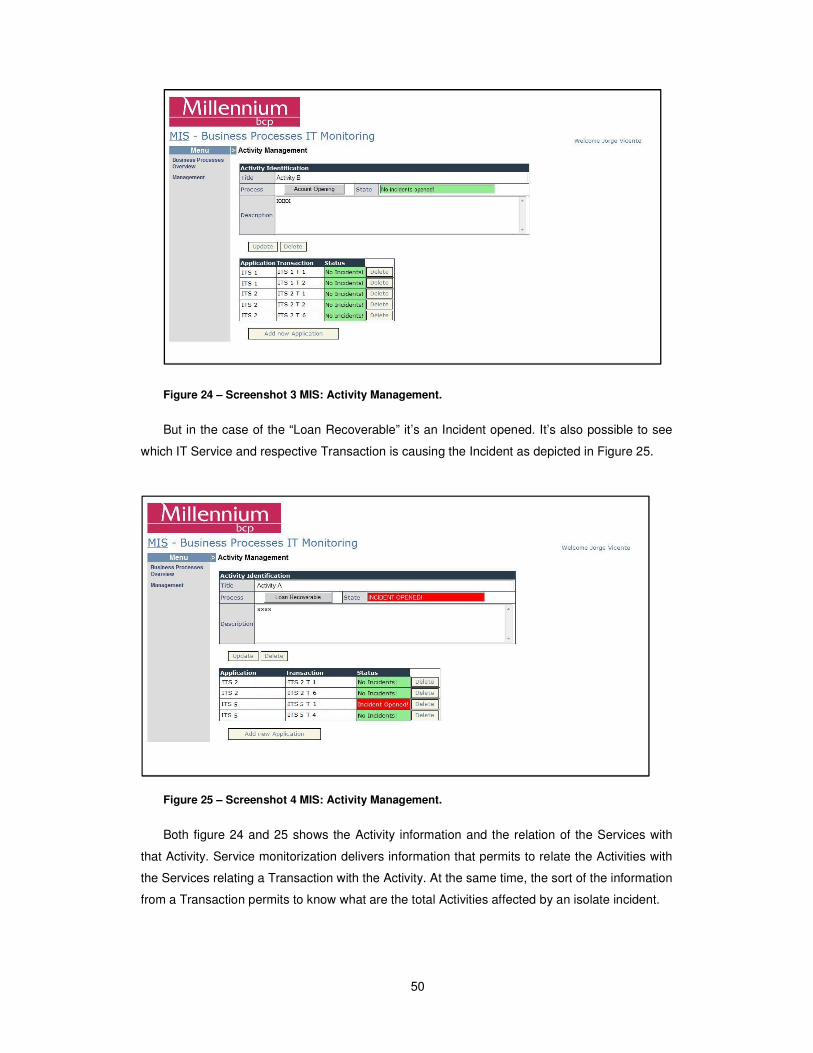
50
Figure 24 – Screenshot 3 MIS: Activity Management.
But in the case of the “Loan Recoverable” it’s an Incident opened. It’s also possible to see
which IT Service and respective Transaction is causing the Incident as depicted in Figure 25.
Figure 25 – Screenshot 4 MIS: Activity Management.
Both figure 24 and 25 shows the Activity information and the relation of the Services with
that Activity. Service monitorization delivers information that permits to relate the Activities with
the Services relating a Transaction with the Activity. At the same time, the sort of the information
from a Transaction permits to know what are the total Activities affected by an isolate incident.

51
5.3. Conclusion
Although the application were intended to help Business Support Division to measure the
impact of IT Services incidents and problems to the business, this application was requested by
Operation Managers from the branches as well. The fact of knowing in real-time what activities
are affected by the IT Service incident permits to change people coordination to a better branch
performance.
Business Process IT Monitoring is now available to Management Information System portal
of BSD. These tools already have requests to add functionalities in order to improve and be as
customable as possible.
The project was considered a success despite the information available was somehow
limited.
5.4. Results and Analysis
Unfortunately it wasn’t possible to go further in gathering all the information regarding
business processes and IT Services. When I obtain all the information delivered, I observe that
the business processes models weren’t normalized. At the same time only the applications
names were available in the business processes.
It was very hard to get a cross-reference between activities and transitions since each
business process had different model and I expend a lot of time normalizing the information. I
also made an effort to define activities and transactions hierarchy, but in the time available was
not possible. To do this is necessary to interview all the business process owners and define
the hierarchy, but when I try to do the first, the business process owner had doubts on this
subject.
Also SLA is far for being in mature state and little information about cost and performance
was available.
It may seem that BSD and BSM responsible doesn’t help, but the truths is that gathering
this information and make a cross-reference it’s very hard and time consuming. Millennium bcp
delivered all the information requested and BSD inclusively pay the bill.
When the application passed production, little time was left available and the results
obtained don’t get to any conclusion. The only big result was the satisfaction and acceptance of
the proposal and the application.
Dr. Nicolau Romão, BSD director and Dr. Joaquim Calhau, BSM director, were very
satisfied with the solution and I also get the feedback that this monitorization was a step forward

52
in the mind shifting, that IT must have on the business impact. BSM team was also sensible to
this subject and supported the idea, especially the negotiation team.
The application will be maintained and engineer João Costa is now responsible for the
solution.

53
6. Conclusion
IT drives to the goal of acting as a service provider to the rest of the business. However,
responsible IT Service owners are challenged by the fact they often don’t have a clear
perspective of the business health of critical processes that their IT systems are supporting. And
although service owners need business-significant metrics to really understand business health,
most event data from infrastructure management tools is IT-centric, and has little relation to
relevant business conditions.
At the same time, business operations teams are trying to use information provided by IT to
help them understand how their key business processes and services are performing. When an
IT problem is reported, business personnel need to verify that they have the information
required to understand the implications of the problem on key business processes and
customers, and ultimately on the business itself.
By enabling IT to gain visibility and a better understanding of the condition of business
services and processes that are the key to the business, IT Service managers and service
owners will have a better business perspective and the right level of knowledge to respond to,
and negotiate with the business
Regardless the difficulty in getting references for this thesis on the matter of monitorization,
the need for this kind of tools is demanding every day. In the study of IT Governance and IT
Service Management areas, it was possible to conclude that the future passes throw a precise
and sustainable measurement and analysis of business and IT performance.
Business modulates itself as business processes and Business Process Management is the
base for a well a consistently measure of business performance. IT is increasing every day in
enterprises because the competitiveness in the markets today, and few activities developed by
companies aren’t supported by any kind of IT Service.
The link between Business Processes and IT Services goes far as the granularity goes, and
in form on conclusion, I define the relation between activities and transactions the bound that
connects them,
This relation can be used to measure costs and performance. Regardless the form that
companies calculates this indicators, it’s now possible to create bullet proof SLA reports that are
non-repudiation efficient. Providers could in the future be obligated to respond for their
performance. At the same time, customers and users could be more satisfied with their IT
Services since they will be aware the right price to pay for an IT Service and have tools to
demand the right service-level.

54
I also conclude that companies aren’t probably ready to deliver this kind of information.
Business Process Management and IT Service Management work separated and for this
alignment companies probably need the way they work. Companies are ready to rapidly IS
implementation that support the monitorization. The bottle neck will be the creation of
information architecture for this kind of solution.
Figure 26 depicts a resume of the framework benefits.
Figure 26 – Framework benefits.
ITIL and COBIT is fundamental to this line of work. The success factor of this proposal
passes throw a well managed and governed IT Service area. It’s possible that in the long run
the results could get confused if the business weren’t well aligned with the business. The
awareness of an actualize CMDB would also help to support this architecture.
After a great number of information gathered from the monitorization, Data Mining could be
the future to try to forecast, business bottle necks and IT Service critical periods. There is also
very important the companies where process and customer-oriented. If the results were not
toward in this way, it’s possible that this is not the best way to analyze this matter.
Though the case study was made in a bank, the results are not only to this line of business.
Business processes are organized practically in the same way everywhere. At the same time so
does the IT Services. These areas are running to a uniformed architectures and frameworks,
and I think this proposal is base of the future ahead.
Based on the results and the fact that the biggest Portuguese Bank sees the importance on
this matter, I congratulate myself for this work. Never the need for IT and Business alignment

55
were stronger and for a sustainable management, it’s necessary to monitor and measure
performance. SLAs are the base for an effective outsourcing and strong customer-provider
relation.
6.1. Future Work
I hope that this thesis would help in defining a better monitorization set of tools with the
purpose to align business and IT needs. Millenium bcp could help on this matter, since they
already have a very good Business Support Division and probably is the best and better
prepared company in Portugal to advance in this area.
Future work for the BSD team: get more and better information in the MIS and start to
produce enough information to get provable results.
I think that only enterprises and universities that have very tight relations with these
enterprises can improve this line of work. For the universities, I resume some points that can be
addressed:
• Actualize the MIS curricula, in order to get aligned with business needs and
concerns;
• Foment more MSc. and PhD. in the area and outside the university;
In summary, IT Governance and IT Service Management is the future of IT. IT needs to
payoff and it’s time to do so.

56
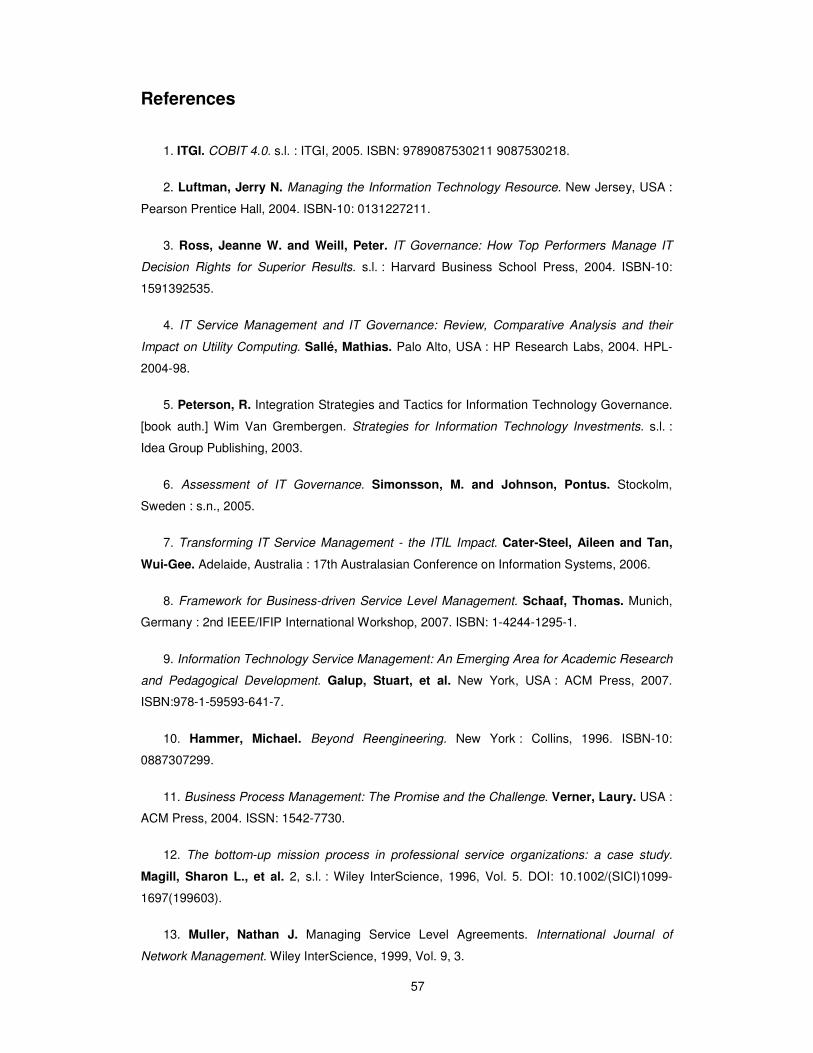
57
References
1. ITGI. COBIT 4.0. s.l. : ITGI, 2005. ISBN: 9789087530211 9087530218.
2. Luftman, Jerry N. Managing the Information Technology Resource. New Jersey, USA :
Pearson Prentice Hall, 2004. ISBN-10: 0131227211.
3. Ross, Jeanne W. and Weill, Peter. IT Governance: How Top Performers Manage IT
Decision Rights for Superior Results. s.l. : Harvard Business School Press, 2004. ISBN-10:
1591392535.
4. IT Service Management and IT Governance: Review, Comparative Analysis and their
Impact on Utility Computing. Sallé, Mathias. Palo Alto, USA : HP Research Labs, 2004. HPL-
2004-98.
5. Peterson, R. Integration Strategies and Tactics for Information Technology Governance.
[book auth.] Wim Van Grembergen. Strategies for Information Technology Investments. s.l. :
Idea Group Publishing, 2003.
6. Assessment of IT Governance. Simonsson, M. and Johnson, Pontus. Stockolm,
Sweden : s.n., 2005.
7. Transforming IT Service Management - the ITIL Impact. Cater-Steel, Aileen and Tan,
Wui-Gee. Adelaide, Australia : 17th Australasian Conference on Information Systems, 2006.
8. Framework for Business-driven Service Level Management. Schaaf, Thomas. Munich,
Germany : 2nd IEEE/IFIP International Workshop, 2007. ISBN: 1-4244-1295-1.
9. Information Technology Service Management: An Emerging Area for Academic Research
and Pedagogical Development. Galup, Stuart, et al. New York, USA : ACM Press, 2007.
ISBN:978-1-59593-641-7.
10. Hammer, Michael. Beyond Reengineering. New York : Collins, 1996. ISBN-10:
0887307299.
11. Business Process Management: The Promise and the Challenge. Verner, Laury. USA :
ACM Press, 2004. ISSN: 1542-7730.
12. The bottom-up mission process in professional service organizations: a case study.
Magill, Sharon L., et al. 2, s.l. : Wiley InterScience, 1996, Vol. 5. DOI: 10.1002/(SICI)1099-
1697(199603).
13. Muller, Nathan J. Managing Service Level Agreements. International Journal of
Network Management. Wiley InterScience, 1999, Vol. 9, 3.

58
14. Classifying ITIL Processes: A Taxanomy under Tool Support Aspects. Brenner,
Michael. 3, Munich : IEEE, 2006, Vols. 1-4244-0176-3. ISBN: 1-4244-0176-3.
15. Erickson-Harris, Lisa. Service Level Management (SLM) 101: A Primer for Enterprise
IT Professionals. [Document] s.l. : Enterprise Management Association, 2006.
16. A Framework for Service Level Agreement Management. Trygar, T. and Bain, G.
Piscataway, USA : Military Communications Conference, IEEE, 2005. ISBN: 0-7803-9393-7.
17. Service Level Agreement Negotiation: A Theory-based Exploratory Study as a Starting
Point for Identifying Negotiation Support System Requirements. Goul, Michael e Demirkan,
Daniel S. Soper Haluk. Hawaii, USA : 38th Hawaii International Conference on System
Sciences, 2005. ISBN: 0-7695-2268-8.
18. Service Level Management with Agent Technology. Bissel, Torsten, et al. 6, s.l. :
Elsevier, 2000, Vol. 34. DOI: 10.1016/S1389-1286(00)00154-7.
19. Kaplan, R.S. The Balanced Scorecard - Translating Strategy into Action. Boston :
Harvard Business School Press, 1996. ISBN-10: 0875846513.
20. Certificate as an Instrument for increasing transparency in IT Service Management.
Praeg, C.P. Mainz, Germany : Effective IT-Service Provider Management, 2005. ISBN: 0-7695-
2507-5.
21. OGC and itSMF ITGI. Aligning COBIT, ITIL and ISO 17799 for Business Benefit. s.l. :
OGC, 2005.
22. IT Governance: Reviewing 17 IT Governance Tools and Analysing the Case of
Novozymes. Pederson, Mogens Kuhn, Andersen, Kim Viborg and Larsen, Michael Holm.
Hawaii, USA : 39th Hawaii International Conference on Systems Science, 2006. ISBN: 0-7695-
2507-5.
23. Quantified Model of COIT for Corporate IT Governance. Hussain, Syed Jamal. 6,
Pakistan : IEEE, 2005, Vols. 0-7803-9421-6.
24. Bigio, David, Ferleman, Thomas and Edgeman, Rick L. Six Sigma and Business
Excellence: Strategic and Tactical Examination of IT Service Level Management. Quality and
Reliability Engineering International. Wiley InterScience, 2005, Vol. 21, 3.
25. Gupta, Praveen. Six Sigma Business Scorecard. s.l. : McGraw-Hill, 2004. ISBN:
0071479430 / 9780071479431.

59
26. Designing a Process-Oriented Framework for IT Performance Management Systems.
Son, Sertac, Weitzel, Tim and Francois. 3, Reading, England : Academic Conferences
Limited, 2005, Vol. 8. ISSN 1566-6379.
27. ITGI. IT Governance Global Status Report. Rolling Meadows, IL, USA : ITGI, 2004.
ISBN 1-893209-32-6.
28. Porter, Michael E. Competitive Advantage. New York : The Free Press, 1998. ISBN-10:
0684841460.
29. Keeping Score in the IT Compliance Game. Ragan, Tracy. s.l. : ACM Press, 2006.
ISBN: 1-1542-7730.
30. Impact of Configuration on IT Outsourcing Relationships. Alborz, S., Seddon, P. B.
and Scheepers, R. New York, NY, USA : 2004 Americas Conference on Information Systems,
2004.
31. Business Process Management: A Survey. Aalst, W.M.P.van der, Hofstede, A.H.M.
ter and Weske, M. Eindhoven, The Netherlands : Springer, 2003. ISBN-10: 3540403183.
32. Office of Government Commerce. Best Practice for Service Delivery - ITIL The Key to
Managing IT Services. Engels, UK : The Stationary Office Books, 2001. ISBN: 9780113300174
/ 0113300174 .
33. ITIL as Comon-Practice Reference Model for IT Service Management - Formal
assessment and implications for practice. Hochstein, A., Zarnekow, R. and Brenner, W. Hong
Kong, China : Proceedings of the 2005 IEEE International Conference on E-Technology, E-
Commerce and E-Service, 2005. ISBN: 0-7695-2274-2.
34. Activity-based Management of IT Service Delivery. Bailey, John, et al. Cambridge, MA,
USA : ACM Press, 2007. ISBN: 1-59593-635-6.
35. Field studies of computer system administrators: analysis of system management tools
and practices. Barret, R., et al. Chicago, Illinois, USA : Proceedings of the 2004 ACM
Conference on Computer Supported Cooperative Work, 2004. ISBN:1-58113-810-5.
36. Case Studies in IT Management: On Formal Processes and Informal Activities in
Service Delivery. Maglio, P. P., Kandogan, E. and Bailey, J. Brisbane, Australia : 15th Annual
AMA Frontiers in Service Conference, 2006.
37. Office procedures as practical action. Suchman, L. 4, New York, NY, USA : ACM
Transactions on Information Systems (TOIS), 1983, Vol. 1. ISSN:1046-8188.
60
38. Schekkeman, J. Enterprise Architecture & Services Oriented Enterprise / Service
Oriented Architecture, Institute For Enterprise Architecture Developments (IFEAD). Institute For
Enterprise Architecture Developments. [Online] [Cited: August 16, 2007.] http://www.enterprise-
architecture.info/EA_Services-Oriented-Enterprise.htm.
39. System-Supported Method to Design IT Services. Abeck, S., et al. Poster Session :
Proceedings of the IEEE Conference on Integrated Network and Systems Management (IM),
2005.
40. Service-oriented IT Management - Benefit, Cost and Sucess Factors. Hochstein, A.,
Tamm, G. and Brenner, W. Regensburg, Germany : Proceedings of the 13th European
Conference on Information Systems, 2005.
41. Information technology and organizational performance: an integrative model of it
business value. Melville, N., Kraemer, K. and Gurbaxani, V. 2, Minneapolis, MN, USA : MIS
Quarterly, 2004, Vol. 28.
42. Critical issues affecting an ERP implementation. Bingi, P., Sharma, M. K. and Godla,
J. K. 1, Amsterdam, The Netherlands : Information and Management Elsevier Science
Publishers B. V. , 2002, Vol. 40. ISSN:0378-7206 .
43. Planning for ERP systems: analysis and future trend. Chen, I. J. 5, s.l. : Business
Process Management Journal, Emerald Group Publishing Limited, 2001, Vol. 7. ISSN: 1463-
7154.
44. The impact of strategy and integration mechanisms on enterprise system value:
empirical evidence from manufacturing firms. Somers, T. M. and Nelson, K. G. 2, Detroit, MI,
USA : European Journal of Operational Research, Elsevier, 2003, Vol. 146. ISSN: 0377-2217.
45. Loeffler, H. and Oman, M. IT-Survey 2004. Austria : KPMG, 2004.
46. Witty, R., et al. The Price of Information Security. s.l. : Gartner Strategic Analysis
Report, 2001.
47. Extending Business Process Management to Determine Efficient IT Investments.
Neubaur, Thomas and Stummer, Christian. Seoul, Korea : ACM Press, 2007. 1-59593-480-4.
48. Office of Government Commerce. Service Support (IT Infrastructure Library).
London : The Stationary Office, 2000. ISBN-10: 0113300158 .
49. Software Performance in the Real Worl: Personal Lessons from the Performance
Trauma Team. Sankarasetty, Jayshankar, et al. Buenos Aires, Argentina : ACM Press, 2007.
ISBN: 1-59593-297-6.
61
50. Business value of IT. Simkova, Eva and Basl, Josef. Praha, Czech : Conference
Systems Integration 2007, 2006.
51. Millennium bcp. www.millenniumbcp.pt. www.millenniumbcp.pt. [Online] January 10,
2005. [Cited: August 24, 2007.]
http://www.millenniumbcp.pt/multimedia/archive/00365/V1_RD_19_Technology_365657a.pdf.
52. Bouman, Jacques J., Zwan, Mark Van der e Trienekens, Jos J. M. Specification of
Service Level Agreements: Problems, Principles and Practices. Software Quality Journal.
Springer, 2004, Vol. 12, 1.
53. IT-Service Cachet - Managing IT-Service Performance and IT-Service Quality. Praeg,
Claus-P. and Schnabel, Ulrich. Hawaii, USA : 39th Hawaii International Conference on
System Sciences, 2006. ISBN: 0-7695-2507-5.