monitoring food security and nutrition in support of the ... · 1 monitoring food security and...
TRANSCRIPT

Monitoring Food Security and Nutrition in Support of the 2030 Agenda
for Sustainable DevelopmentTaking stock and looking ahead
INFORMATION NOTE

The designations employed and the presentation of material in this information productdo not imply the expression of any opinion whatsoever on the part of the Food andAgriculture Organization of the United Nations (FAO), the International Fund forAgricultural Development (IFAD) or of the World Food Programme (WFP) concerning thelegal or development status of any country, territory, city or area or of its authorities,or concerning the delimitation of its frontiers or boundaries. The mention of specificcompanies or products of manufacturers, whether or not these have been patented,does not imply that these have been endorsed or recommended by FAO, IFAD or WFP inpreference to others of a similar nature that are not mentioned.
The designations employed and the presentation of material in the maps do not implythe expression of any opinion whatsoever on the part of FAO, IFAD or WFP concerningthe legal or constitutional status of any country, territory or sea area, or concerning thedelimitation of frontiers.
ISBN 978-92-5-109432-7 (FAO)
FAO encourages the use, reproduction and dissemination of material in this informationproduct. Except where otherwise indicated, material may be copied, downloaded andprinted for private study, research and teaching purposes, or for use in non-commercialproducts or services, provided that appropriate acknowledgement of FAO as the sourceand copyright holder is given and that FAO’s endorsement of users’ views, products orservices is not implied in any way.
All requests for translation and adaptation rights, and for resale and other commercialuse rights should be made via www.fao.org/contact-us/licence-request or addressed [email protected].
FAO information products are available on the FAO website (www.fao.org/publications)and can be purchased through [email protected].
© FAO, 2016
Required citation:FAO, IFAD and WFP. 2016. Monitoring Food Security and Nutrition in Support of the 2030 Agenda for Sustainable Development: Taking stock and looking ahead. Rome, FAO.
Cover photo: ©Sebastian Liste/NOOR for FAO

FOOD AND AGRICULTURE ORGANIZATION OF THE UNITED NATIONS
Rome, 2016
INFORMATION NOTE
Monitoring Food Security and Nutrition in Support of the 2030 Agenda
for Sustainable DevelopmentTaking stock and looking ahead


iii
v Executive summary
1 The state of food security and nutrition in the world
1 The new sustainable development agenda and its monitoring framework
1 Monitoring food security and nutrition under the new global agenda
3 Overview of progress in food security and nutrition
6 Challenges in conducting an integrated analysis of food security and nutrition indicators
8 Information gaps and measurement challenges
8 Monitoring Target 2.1
9 Monitoring Target 2.2
9 The road ahead
10 How to monitor an integrated agenda?
10 Linkages between SDG 2-related targets
10 Linkages between SDG 2 and other SDGs
12 Implications for monitoring food security and nutrition
Contents

iv
T his information note reports on the state of food security and nutrition at the beginning of the 2030 Agenda for Sustainable Development. It identifies key measurement challenges for monitoring progress towards the second Sustainable Development Goal (SDG 2), which aims to end hunger, achieve food security and improve nutrition,
and promote sustainable agriculture. It also identifies the most important linkages both across the elements comprised under SDG 2 and between SDG 2 and other SDGs and lays out the challenges in monitoring progress towards improved food security and nutrition and sustainable agricultural systems.
■ The state of food security and nutrition
• The world has seen significant progress in reducing hunger over the past 15 years. Yet, nearly 793 million people worldwide still lack access, on a regular basis, to adequate amounts of dietary energy. This means that we are far from achieving the goal of eradicating hunger.
• The Food Insecurity Experience Scale (FIES) provides a new and improved measure of food insecurity, focusing on the access to food. Based on a preliminary assessment of worldwide data collected at the individual level, sub-Saharan Africa is the region with the highest prevalence of food insecurity, followed by Southern Asia. FIES-based results also suggest that food insecurity is more prevalent among adult women than among adult men almost everywhere.
• Between 2000 and 2015, the number of stunted children has fallen in all regions except sub-Saharan Africa, where it increased.
• Worldwide, the share of children under five years of age considered overweight increased from 5.1 percent to 6.2 percent between 2000 and 2015.
■ Monitoring an integrated agenda
International agreement has been reached on key indicators to monitor progress towards SDG 2, but considerable data gaps and methodological challenges remain that need to be overcome to measure food security and nutrition effectively, in a timely and cross-country comparable way.
A possibly even larger challenge is to find effective ways to monitor implementation of the new agenda in its integrity. SDG 2 and its related targets reflect the notion that hunger and malnutrition are multifaceted concepts and that achieving the goal will require attention to all four dimensions of food security and malnutrition as defined by the Committee on World Food Security (CFS) and the 1996 World Food Summit (WFS). What holds for the goals within SDG 2 also holds for the linkages to other SDGs.
The 2030 Agenda fully recognizes that progress towards many other SDGs will depend on the extent to which food insecurity and malnutrition are effectively reduced and sustainable agriculture is promoted. Likewise, progress towards SDG 2 will depend on progress made towards several of the other goals. This means that policy makers will need to consider the inter-linkages within SDG 2 and the interactions of SDG 2 and other goals in pursuing the overall Agenda. This will require integrated policy approaches. This involves identifying synergies across goals, as well as possible trade-offs. While moving towards such an integral policy approach will be essential, it will also reveal the complexity of the overall endeavour.
An integrated overall agenda also requires an integrated monitoring framework, able to identify and ideally to quantify synergies and trade-offs. Future reports on the State of Food Security and Nutrition in the World will contribute to an integrated monitoring of progress towards ending hunger and eradicating all forms of malnutrition (Targets 2.1 and 2.2). The reports will assess synergies and trade-offs within SDG 2 and across other relevant SDGs.
Executive summary
THE STATE OF FOOD SECURITY AND NUTRITION IN THE WORLD
1
The state of food security and nutrition in the world
■ The new sustainable development agenda and its monitoring framework
On 25 September 2015, the 193 Member States of the United Nations adopted the 2030 Agenda for Sustainable Development. It includes 17 Sustainable Development Goals (SDGs) and 169 targets that will guide the actions of governments, international agencies, civil society and other institutions over the next 15 years. Following the Millennium Development Goals (MDGs), the 2030 Agenda provides a global vision, which covers the entire development spectrum. The 17 SDGs aim to end poverty and hunger, while restoring and sustainably managing natural resources. They integrate the three dimensions of sustainable development – economic, social and environmental – with closely interwoven targets. The SDGs are indivisible – no single goal is separate from the others, and they are based on comprehensive and participatory approaches. The SDGs are universal and the 2030 Agenda is as relevant to developed countries as it is to developing nations.
The breadth and complexity of the 17 SDGs and their 169 targets has brought with it a critical challenge in defining a workable monitoring framework. The UN Statistical Commission, mandated by the UN General Assembly to select the indicators to monitor the 2030 Agenda, had to face the dilemma of ensuring that the total number of SDG indicators was limited, while simultaneously ensuring that it did not alter or reshape the Agenda. As a result, 230 unique global indicators were selected to track progress against the SDG targets. Given their breadth and complexity, these global indicators are supposed to only capture the main thrust of the relevant targets; they can be complemented by thematic and regional/national indicators.
International agencies have an important role to play in global reporting, as they are not only responsible for collecting data from national sources and aggregating them at sub-regional, regional and global levels ensuring their comparability, but also for producing annual global progress reports for the SDG targets under their mandate, for further improving the methodology of certain SDG indicators, and for contributing to strengthening the statistical capacity in countries to produce SDG data.
■ Monitoring food security and nutrition under the new global agenda
The 2030 Agenda has a stronger focus on Food Security and Nutrition than was the case under the MDGs. A specific goal has been defined to “End hunger, achieve food security and improved nutrition and promote sustainable agriculture” (SDG 2). The goal is comprehensive and articulated around eight targets: five on development outcomes and three on means of implementation. The outcome targets include concepts that range from hunger, malnutrition, smallholder agricultural productivity and income, sustainability of agricultural practices, to the protection of crop and livestock genetic resources, covering in large part all four dimensions of food security and nutrition (food availability, access, utilization and stability).
The broadened scope has implications for the monitoring of food security and nutrition and for the contents of future reports on The State of Food Security and Nutrition in the World. The plans are to broaden the scope of the traditional State of Food Insecurity in the World (SOFI) report to include a comprehensive global assessment on malnutrition, thereby monitoring progress towards SDG Targets 2.1 and 2.2. This will only be possible by expanding the partnership that is responsible for producing this flagship publication beyond the Rome-based agencies (FAO, IFAD and WFP) to include also WHO, UNICEF and the World Bank, which have a primary responsibility to monitor malnutrition at the global level. The new publication will support the Committee on World Food Security (CFS) in reviewing progress towards the SDGs related to food security and nutrition and will provide a basis for its policy recommendations and actions.
The new The State of Food Security and Nutrition in the World report will help identify issues and contribute to monitoring globally the progress towards the SDGs. For this reason it focuses attention on the internationally agreed targets and indicators. Global indicators, however, may not be suited to reflect fluid and quickly changing acute food insecurity situations, such as during conflict and emergency situations. Additional indicators, including the Food Consumption Score (FCS) or the Coping Strategies Index (CSI), may be useful for national and sub-national monitoring and their use can be justified in the context of systematic
MONITORING FOOD SECURITY AND NUTRITION IN SUPPORT OF THE 2030 AGENDA FOR SUSTAINABLE DEVELOPMENT
2
analyses such as the Integrated Food Security Phase Classification (IPC) when data availability impedes reliance on the internationally agreed indicators.
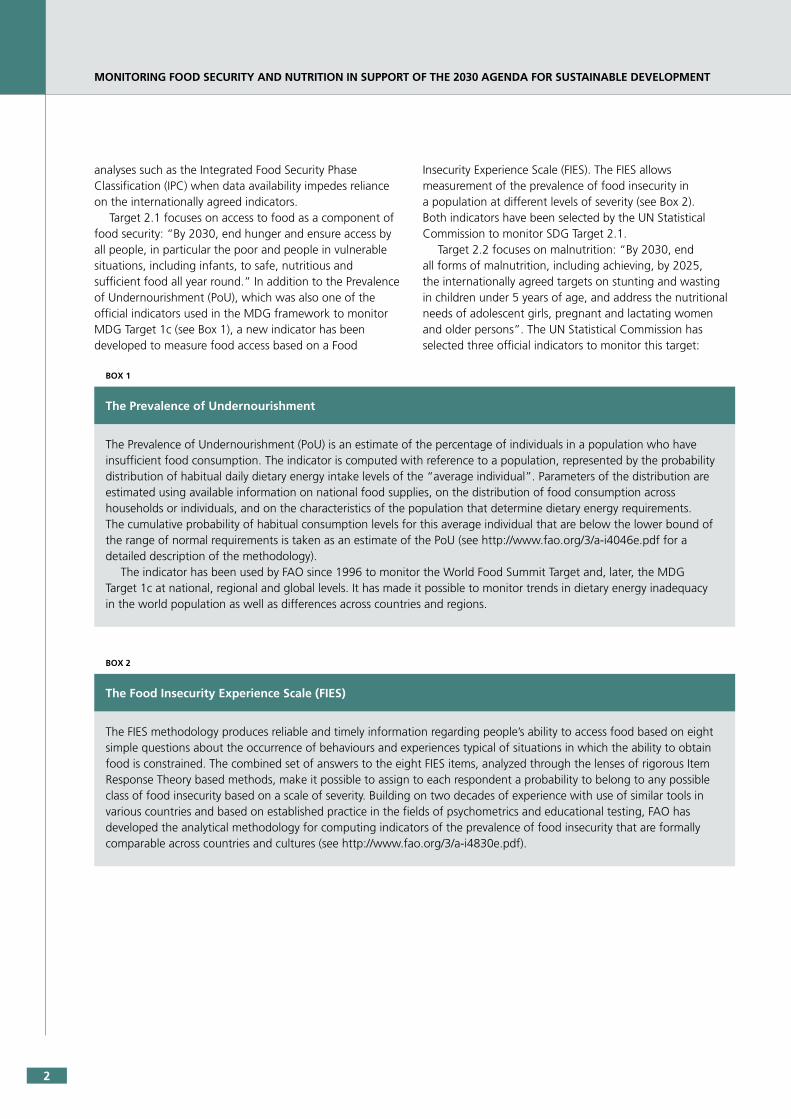
Target 2.1 focuses on access to food as a component of food security: “By 2030, end hunger and ensure access by all people, in particular the poor and people in vulnerable situations, including infants, to safe, nutritious and sufficient food all year round.” In addition to the Prevalence of Undernourishment (PoU), which was also one of the official indicators used in the MDG framework to monitor MDG Target 1c (see Box 1), a new indicator has been developed to measure food access based on a Food
Insecurity Experience Scale (FIES). The FIES allows measurement of the prevalence of food insecurity in a population at different levels of severity (see Box 2). Both indicators have been selected by the UN Statistical Commission to monitor SDG Target 2.1.
Target 2.2 focuses on malnutrition: “By 2030, end all forms of malnutrition, including achieving, by 2025, the internationally agreed targets on stunting and wasting in children under 5 years of age, and address the nutritional needs of adolescent girls, pregnant and lactating women and older persons”. The UN Statistical Commission has selected three official indicators to monitor this target:
BOX 1
The Prevalence of Undernourishment
The Prevalence of Undernourishment (PoU) is an estimate of the percentage of individuals in a population who have insufficient food consumption. The indicator is computed with reference to a population, represented by the probability distribution of habitual daily dietary energy intake levels of the “average individual”. Parameters of the distribution are estimated using available information on national food supplies, on the distribution of food consumption across households or individuals, and on the characteristics of the population that determine dietary energy requirements. The cumulative probability of habitual consumption levels for this average individual that are below the lower bound of the range of normal requirements is taken as an estimate of the PoU (see http://www.fao.org/3/a-i4046e.pdf for a detailed description of the methodology).
The indicator has been used by FAO since 1996 to monitor the World Food Summit Target and, later, the MDG Target 1c at national, regional and global levels. It has made it possible to monitor trends in dietary energy inadequacy in the world population as well as differences across countries and regions.
BOX 2
The Food Insecurity Experience Scale (FIES)
The FIES methodology produces reliable and timely information regarding people’s ability to access food based on eight simple questions about the occurrence of behaviours and experiences typical of situations in which the ability to obtain food is constrained. The combined set of answers to the eight FIES items, analyzed through the lenses of rigorous Item Response Theory based methods, make it possible to assign to each respondent a probability to belong to any possible class of food insecurity based on a scale of severity. Building on two decades of experience with use of similar tools in various countries and based on established practice in the fields of psychometrics and educational testing, FAO has developed the analytical methodology for computing indicators of the prevalence of food insecurity that are formally comparable across countries and cultures (see http://www.fao.org/3/a-i4830e.pdf).

THE STATE OF FOOD SECURITY AND NUTRITION IN THE WORLD
3
BOX 3
The child stunting and malnutrition indicators
Stunting – defined as low height for age (height for age <-2 standard deviation from the median of the WHO Child Growth Standards) among children under 5 years of age – reflects the cumulative effects of undernutrition and infection during the critical 1,000-day period from pregnancy to the child’s second birthday.
The prevalence of overweight and wasting are measured as the weight for height status of children under the age of five years, using, respectively, as cut offs >+2 or <-2 standard deviation from the median of the WHO Child Growth Standards among children under 5. Wasting is a strong predictor of mortality among children under five and typically is the result of acute significant food shortage and/or disease. Overweight in childhood is associated with a wide range of serious health complications and an increased risk of premature onset of illnesses, including diabetes and heart disease.
Child malnutrition estimates are produced by UNICEF-WHO-World Bank employing a joint dataset and published methods. This joint dataset as well as global and regional estimates have been updated on an annual basis since 2012. The joint dataset contains data from nearly 800 surveys conducted between 1990 and 2015 from over 150 countries, representing over 90 percent of the global under-five population, though population coverage varies by region (at present, joint estimates of the total national, regional and global values are available at http://apps.who.int/gho/data/view.main.NUTUNOVERWEIGHTv?lang=en). A joint UNICEF-WHO-World Bank dataset including various levels of disaggregation is currently under development and there are plans to invest in the development of methods to allow for joint global and regional disaggregated estimates. Support to countries related to methods and analysis is available through UNICEF, WHO and the World Bank.
■ Overview of progress in food security and nutrition
Target 2.1: Indicator 2.1.1 - Prevalence of undernourishmentThe world has seen significant progress in reducing hunger over the past 15 years (Table 1), but clearly much more needs to be done. For the developing regions as a whole, the MDG target to halve the proportion of undernourished in the total population was nearly achieved (the PoU decreased from 23.3 percent in 1990-92 to 12.9 percent in 2014-16). The more ambitious target set by the World Food Summit (WFS) in 1996, to halve the number of people suffering from hunger, however, was missed by a large margin. According to the latest estimates, nearly 793 million people, or 10.8 percent of the global population (Table 1) still lack access to adequate amounts of dietary energy.

MONITORING FOOD SECURITY AND NUTRITION IN SUPPORT OF THE 2030 AGENDA FOR SUSTAINABLE DEVELOPMENT
4
TABLE 1
Estimated prevalence of undernourishment in the world over the last 25 years
REGIONS/SUB-REGIONS 1990-92 2000-02 2005-07 2010-12 2014-16*
WORLD 18.6 14.9 14.3 11.8 10.8
Developing regions 23.3 18.2 17.3 14.1 12.9
Northern Africa <5.0 <5.0 <5.0 <5.0 <5.0
Sub-Saharan Africa 33.2 30.0 26.5 24.2 22.9
Latin America and the Caribbean 14.7 11.4 8.4 6.4 5.5
Caribbean 27.0 24.4 23.5 19.8 19.8
Latin America 13.9 10.5 7.3 5.5 <5.0
Eastern Asia 23.2 16.0 15.2 11.8 9.6
Eastern Asia excluding China 9.6 14.6 13.9 15.1 14.6
Southern Asia 23.9 18.5 20.1 16.1 15.7
Southern Asia excluding India 24.5 21.0 19.0 17.5 17.0
South-Eastern Asia 30.6 22.3 18.3 12.1 9.6
Western Asia 6.4 8.6 9.3 8.9 8.4
Oceania 15.7 16.5 15.4 13.5 14.2
Caucasus and Central Asia 14.1 15.3 11.3 8.9 7.0
Developed regions <5.0 <5.0 <5.0 <5.0 <5.0
Least Developed Countries (LDCs) 40.0 36.5 31.4 28.0 26.5
Landlocked Developing Countries (LLDCs) 35.6 33.6 28.1 24.5 22.7
Small Island Developing States (SIDS) 24.5 22.5 21.3 18.2 18.0
* Projections.
As shown in Table 1, progress towards food security was uneven across regions. The MDG hunger target was achieved in Latin America, the eastern and south-eastern regions of Asia, the Caucasus and Central Asia and the northern and western regions of Africa. In total, 73 developing countries out of the 129 monitored reached the target. In sub-Saharan Africa, Southern Asia, the Caribbean and Oceania progress was too slow and the prevalence of undernourishment is still relatively high (over 14 percent of the total population).
Target 2.1: Indicator 2.1.2 - Prevalence of moderate or severe food insecurityThe estimates concerning this new indicator are based on FIES data collected through the Gallup World Poll in 2014 and 2015.1 Based on preliminary estimates presented in Table 2, more that 20 percent of the world population was moderately or severely food insecure. Sub-Saharan Africa is the region where food insecurity is more acute worldwide, with more than half of the adult population facing food insecurity at moderate or severe level, and one quarter at severe level. Southern Asia, particularly when excluding India, and Western Asia also show very high prevalence rates of moderate or severe food insecurity, at around 37 percent and 30 percent respectively.
1 The full dataset of results is available through the SDG Indicators database (available at http://unstats.un.org/sdgs/indicators/database).

THE STATE OF FOOD SECURITY AND NUTRITION IN THE WORLD
5
TABLE 2
Prevalence of food insecurity in the adult population2 in 2014/2015, computed using the FIES
Moderate or severe food insecurity (*)
Total Female Male Diff. in % points (Female – Male)
REGIONS/SUB-REGIONS/COUNTRIES (%)
WORLD 18.56 23.04 21.72 1.32
Developing regions 28.1 29.12 27.07 2.05
Northern Africa 24.01 25.27 22.82 2.45
Sub-Saharan Africa 55.67 55.97 55.35 0.62
Latin America and the Caribbean n.a. n.a. n.a. –
Caribbean n.a. n.a. n.a. –
Latin America 10.3 n.a. n.a. –
Eastern Asia 4.23 6.31 6.02 0.29
Eastern Asia excluding China 6.27 6.31 6.02 0.29
Southern Asia 26.55 28.49 24.73 3.76
Southern Asia excluding India 37.45 39.91 35.06 4.85
South-Eastern Asia 19.82 19.98 19.62 0.36
Western Asia 29.68 30.59 28.72 1.87
Oceania n.a. n.a. n.a. –
Caucasus and Central Asia 12.84 13.68 11.72 1.96
Developed regions n.a. n.a. n.a. –
Least Developed Countries (LDCs) 47.27 47.83 46.68 1.15
Landlocked Developing Countries (LLDCs) 43.32 43.47 43.08 0.39
Small Island Developing States (SIDS) n.a. n.a. n.a. –
(*) Provisional data, pending refinement of the global FIES reference scale in 2016.
As the FIES was administered in an individual survey, one important feature of the results produced by FAO’s Voices of the Hungry project is that they are available at the individual, rather than the household level. This makes it possible to conduct gender disaggregated analysis of food insecurity. Based on the preliminary assessment for 2014–2015, gender disparities in food insecurity appear to be relatively low, with adult women being more affected than adult men almost everywhere. Southern Asia is the only region where the difference is substantial (3.8 percentage points).
2 The Gallup World Poll covers the population aged 15 years or older.
All prevalence rates thus refer to the proportion of individuals in the
national population of 15 or more years of age, which we refer at here
as the “adult population”.

MONITORING FOOD SECURITY AND NUTRITION IN SUPPORT OF THE 2030 AGENDA FOR SUSTAINABLE DEVELOPMENT
6
If trends between 2000 and 2015 continue in a similar direction, sub-Saharan Africa will continue to see an increase in the number of affected children and also increased share of the global burden, as the share from Southern Asia decreases. However stunting, which reflects the cumulative effects of undernutrition and infection during the first years of life, still affected 156 million, or nearly one in four children under the age of five years in the world, in 2015.
An analysis of disaggregated estimates for child malnutrition suggests that children from the poorest 20 percent of the population are more than twice as likely to be stunted as those from the richest quintile; in Latin America and the Caribbean, stunting is three times more prevalent among the poorest.4 Furthermore, while the gap appears to have narrowed in the majority of upper-middle-income countries over the past 15 years, it has increased or remained unchanged in almost all low income countries for which trend data are available.5 The poorest children in the poorest countries are farthest behind. The identification of the most affected population groups at sub-national level will be key to ensuring that no child is left behind.
Target 2.2: Indicator 2.2.2a – Prevalence of wastingWith only sparsely available data, a trend analysis for wasting is currently not possible. The latest estimates show that 15 percent of the total population was affected by wasting in the developing regions. The highest prevalence rates for wasting are seen in Southern Asia (14 percent), Northern Africa (16 percent) and Caucasus and Central Asia (12 percent).
Target 2.2: Indicator 2.2.2b – Prevalence of overweightTime series are available for measures of children overweight, indicating an increase between 2000 and 2015 from 5 percent to 6 percent. While nearly every region in the world has witnessed a rise in child overweight over this time period, there are notable differences across and within regions. Increases in Africa (from 5 percent to 6 percent) have been small compared to Oceania (from 5 percent to 9 percent) and South-Eastern Asia (from 3 percent to 8 percent), where the prevalence has almost doubled. In 2015 the highest prevalence of overweight children can be found in Southern and Northern Africa (15 percent and 11 percent, respectively), with percentages much bigger than that of the other African regions. Also Central Asia has much higher rates (12 percent) compared to the rest of Asia.
4 United Nations Children’s Fund (UNICEF). 2015. UNICEF Data: Monitoring the Situation of Children and Women (available at http://data.unicef.org/nutrition/malnutrition.html).
5 WHO. Global Health Observatory data repository. Global and regional trends by UN Regions, Overweight: 1990–2015. Joint child malnutrition estimates (UNICEF/WHO/World Bank) (available at http://apps.who.int/gho/data/view.main.NUTUNOVERWEIGHTv?lang=en).
■ Challenges in conducting an integrated analysis of food security and nutrition indicators
Although they are clearly linked, estimates of the prevalence of undernourishment and of the prevalence of experienced food insecurity reflect different concepts, and therefore the two indicators should not be considered substitutes, or expected to be perfectly correlated across countries. They provide different, but complementary information.
The FIES provides estimates of the proportion of the population facing difficulties in obtaining enough food, based on data collected through direct interviews. Prevalence rates can be computed for food insecurity at moderate or severe levels, and at severe levels only. The distinction is important, as different levels of severity of food insecurity imply distinctively different consequences in terms of welfare for the affected population. The PoU, on the other hand, is a population-level estimate of the proportion of the population facing serious food deprivation, as inferred from the triangulation of information on food supply, the distribution of food consumption and the population characteristics that determine dietary energy requirements (such as the age/sex structure and level of physical activity).
In general, the PoU and the estimated prevalence of experienced food insecurity based on the FIES (at any level of severity, but particularly at severe levels), would be expected to show similar trends. Obviously, though, the total number of people having experienced any form of food insecurity in any population is expected to be greater (and possibly much greater) than the number of those who are estimated to be undernourished (i.e., not obtaining enough energy from food). In fact, people may be in a situation of food insecurity, yet still be able to meet their dietary energy needs, for example by consuming less expensive, low quality, energy dense foods, or by cutting back on other basic needs, with potentially negative consequences for their health and general well-being.
While properly understanding and interpreting the relationship between these two Target 2.1 indicators of food access can be difficult, examining their links with the SDG Target 2.2 indicators for child nutrition poses an even greater challenge. The multi-dimensional nature of SDG 2 “End hunger, achieve food security and improved nutrition and promote sustainable agriculture” calls for an integrated perspective. However, analyses of relationships between food access and child nutritional status, for example, poses conceptual as well as practical challenges.
Child stunting and obesity reflect cumulative effects over a period of years while child wasting is typically associated with recent acute food shortage and/or disease. Among the practical obstacles, in examining their relationship with food security indicators, one must consider the different reference periods in which data were collected, keeping in mind that the prevalence of undernourishment reflects a 3-year
THE STATE OF FOOD SECURITY AND NUTRITION IN THE WORLD
7
reporting period and that the prevalence of experienced food insecurity refers to the one year period preceding data collection.
In investigating the relationships between food security and nutrition, is also important to keep in mind that improvements in food access alone do not guarantee improved child nutrition, as infections caused by lack of access to clean water, basic sanitation and health services can generate nutrition failures manifest in high levels of wasting and stunting. Additionally, poor diets can give rise to overweight and diet-related non-communicable diseases, which are increasingly prevalent among the poor. Obesity has been found to be associated with food insecurity in some adult population groups and is known to be associated with poverty. The coexistence of under- and over-nutrition has taken a heavy toll on countries undergoing rapid transformations, resulting in the double burden of malnutrition.6
Experienced food insecurity is a good predictor of child stunting as well as the other, more moderate nutritional deficiencies that precede the often irreversible outcomes of stunting.7,8 Regarding the relationship between experienced food insecurity and overweight among children, the evidence is inconclusive, although the range of other harmful impacts of food insecurity on children, including less healthy diets and negative psycho-social consequences, are well-documented.9
As countries embrace the 2030 Sustainable Development Agenda and monitoring efforts are stepped up, the expectation is that national and sub-national food security and child nutrition data will become more readily and more widely available. This will make it easier to fill many of the knowledge gaps about the inter-relationship between food access and nutrition as well as the other dimensions of food insecurity.
6 FAO, IFAD & WFP. 2014. The State of Food Insecurity in the World 2014. Strengthening the enabling environment for food security and nutrition. Rome, FAO.
7 Fram, M.S., Bernal, J. & Frongillo E.A. 2015. The Measurement of Food Insecurity among Children: Review of literature and concept note, Innocenti Working Paper No. 2015-08, UNICEF Office of Research, Florence.
8 FAO. 2016. Methods for estimating comparable rates of food insecurity experienced by adults throughout the world. Rome, FAO (see page 28).
9 IOM (Institute of Medicine). 2011. Hunger and Obesity: Understanding a Food Insecurity Paradigm: Workshop Summary. Washington, DC: The National Academies Press.

8
MONITORING FOOD SECURITY AND NUTRITION IN SUPPORT OF THE 2030 AGENDA FOR SUSTAINABLE DEVELOPMENT
Entering the SDG era, there are still considerable data gaps and methodological challenges to be overcome to measure food security and nutrition effectively, in a timely and cross-country comparable way.
■ Monitoring Target 2.1
Prevalence of undernourishmentThe model-based approach to estimate the PoU integrates information that is available, with sufficient regularity, from different sources for most countries in the world, in a theoretically consistent way, thus providing one of the most reliable tools to monitor progress towards reducing global hunger. However, due to reliance on national Food Balance Sheet data to estimate mean caloric consumption levels available to a population, the global monitoring of MDG Target 1c and of the WFS Target has, thus far, been based on national estimates only. Moreover, the overall precision of the PoU estimates can be low, a reason why FAO publishes national level PoU estimates only when they are above 5 percent, which should not be confounded with, let alone used for a possible threshold for eradicating hunger.
The 2030 Agenda aims to leave no one behind. Monitoring and reporting efforts must therefore be able to identify groups within a country that are at high risk of hunger and food insecurity. In principle, the PoU indicator can be computed for any specific population group, and at a higher level of precision, if accurate information for all necessary parameters is available. The scope for increased precision and for disaggregation thus crucially depends on the availability of data from large household surveys that collect complete information on access to food and that are designed to be representative at the level of sub-national population groups.10
10 Given prevailing practice in the design of national household surveys, sufficient reliable information is seldom available for disaggregation beyond the level of macro area of residence (urban-rural) and of the main Provinces/Divisions in a country. To the extent that most of the surveys used are designed to accurately capture the distribution of income and consumption, inference can be drawn on the PoU in different income classes of the population. Gender disaggregation is limited by the possibility to identify and group households by gender-related information (such as sex of the head of the household, or male/female ratio).
Together with other UN agencies, FAO is working to improve the design and to promote use of a harmonized version of the questionnaire for food consumption data collection, tapping into over a decade worth of experience in household food consumption data collection by the World Bank, WFP, and national partners. As part of the programme to assist countries in monitoring progress towards the SDGs, through initiatives such as the Global Strategy to Improve Agricultural and Rural Statistics, FAO and its partners will enhance its collaboration with national and regional statistical authorities to improve food consumption measurement and to implement analytic methods that would enable meaningful disaggregation and differential analysis by subnational population.
Food Insecurity Experience ScaleFor a world-wide application of the FIES, FAO collects data through the Gallup World Poll®, a survey of nationally representative samples of the adult population conducted annually in nearly 150 countries, covering 90 percent of the world population.11 Due to the relatively small size of the samples used in the GWP however, this allows computation of reliable estimates of the prevalence of food insecurity in the national population only, though disaggregation by socio-demographic characteristics, such as sex and area of residence (urban/rural) is typically possible.
FAO is actively promoting the adoption of the FIES by national governmental institutions to collect the relevant data within large-scale household survey programmes and is providing technical assistance to strengthening their capacity to analyze the data. This will enable more nuanced analyses of the food insecurity situation and its relationships with socio-economic status, gender, age, race, ethnicity, migratory status, disability, geographic location and other policy-relevant characteristics of a population.
11 FAO. 2016. Voices of the Hungry: Methods for estimating comparably prevalence rates of food insecurity experienced by adults throughout the world. Technical Report No.1, April 2016. Rome (available at http://www.fao.org/3/a-i4830e.pdf). The full dataset of results is available through the SDG Indicators database at http://unstats.un.org/sdgs/indicators/database
Information gaps and measurement challenges
INFORMATION GAPS AND MEASUREMENT CHALLENGES
9
■ Monitoring Target 2.2
While malnutrition encompasses multiple manifestations of nutritional failures, the SDG 2 nutrition indicators only include cause-unspecific outcome measures such as child height-for-age (stunting) and child weight-for-height (wasting and overweight). Indicators of micronutrient deficiencies, notably of minerals and vitamins, typically measured by biochemical tests or clinical manifestations, are not considered. Moreover, neither the WHO Global Health Assembly targets nor SDG nutrition monitoring indicators comprise measures of dietary quality,12 which are major determinants both of under- and of over-nutrition.
Reviews of existing simple proxy indicators that gather policy-relevant information on several aspects of diet quality and dietary diversity, and promotion of their use on a regular basis within national survey and surveillance systems, would be a welcome achievement in overcoming this obvious gap in nutrition information available to countries.
Other limitations in the anthropometric indicators are that national data on child anthropometry are not available every year and that they provide only partial country coverage; moreover, they do not provide any information on age groups other than children under 5 years of age. Efforts to increase the frequency and coverage of the data collected are to be stepped up.
■ The road ahead
The 2030 Agenda for Sustainable Development is the result of three years of global participatory efforts to make sure that the complex nature of sustainable development is fully recognized. The most daunting measurement challenge is to disentangle these complex phenomena into measureable parts without losing sight of the integrated whole, the relationships among them and the many important aspects that elude measurement. Many proposed indicators are yet to be developed and many important and widely-used indicators are not included in the SDG global monitoring framework, although they can still be adopted by countries for national monitoring. The PoU, the FIES-based methodology and child anthropometric indicators are tested and reliable measures for which comparability across countries - one of the biggest challenges for global monitoring – is guaranteed by the role played by custodian agencies in ensuring harmonization of data collection and treatment. While trend data for wasting are not currently available, their availability will improve as countries begin to incorporate these indicators into their national monitoring efforts. To this end, adequate capacities to for data collection must be established at the country level, while ensuring coordination of reporting and preserving harmonized methodologies across countries. Countries should also be
12 With the exception of exclusive breastfeeding in the first six months of life.
supported in aligning their national SDG indicators to the global indicators, in order to avoid drastically increasing their reporting burden.
There is also a need to promote innovative ways of data collection, including through tablets and mobile phones, particularly in remote and inaccessible areas.13 Improved collaboration among agencies is needed to share costs of data collection, ensure quality control, and the validation of indicators used for global monitoring of food security and nutrition in the context of a universal agenda. The international community has entrusted this role of coordination and technical oversight to the Interagency and Expert Group (IAEG) on SDG indicators under the auspices of UN Statistical Commission.
It is hoped that the incentives created by the need to effectively monitor the 2030 Agenda for Sustainable Development will promote data collection efforts capable of producing results that can be disaggregated at the sub-national level, which will enable analyses of the food insecurity and nutrition situation according to socio-economic status, gender, age, race, ethnicity, migratory status, disability, geographic location and other policy-relevant characteristics of the population. This will require political will and allocation of human and financial resources.
The work done thus far in establishing a core set of indicators for global monitoring is certainly an important first step, but there is clearly still more to do. To better study the relationship between food insecurity and child malnutrition, for example, more information is needed on individual food consumption, particularly of women in reproductive age and children, and on the quality of the diets. FAO is working with other development partners to improve the data available on food consumption, which can contribute tools to increase our understanding about the relationship between food access, food consumption and nutritional outcomes, including the double burden of malnutrition.
The information gaps are many, complicated by the limitations of the methods at our disposal and the considerable human and financial resources required to collect high quality data on a regular basis in all countries of the world. However, the commitment of FAO, IFAD and WFP is to significantly step up efforts to address the many inequalities at the root of hunger and food insecurity. As we move forward on the 2030 Sustainable Development Agenda, it will be important to work hand-in-hand with Member States to implement a monitoring process linked with decision-making and capable of building political will.
13 For instance, WFP, in collaboration with national governments and partners, is currently experimenting with monitoring the food security situation in twelve countries in protracted crisis through cost-effective and timely methods.

10
MONITORING FOOD SECURITY AND NUTRITION IN SUPPORT OF THE 2030 AGENDA FOR SUSTAINABLE DEVELOPMENT
The 2030 Agenda for Sustainable Development calls for a world free of hunger and all forms of malnutrition. SDG 2 explicitly aims to end hunger and achieve food security and improved nutrition and promote sustainable agriculture by 2030. SDG 2 and its related targets also reflect the notion that hunger and malnutrition are multifaceted concepts and that overcoming these forms of deprivation is a multi-sectoral challenge.
The 2030 Agenda further recognizes that progress towards many other SDGs will depend on the extent to which food insecurity and malnutrition are effectively reduced and sustainable agriculture is promoted. Conversely, progress towards SDG 2 will depend on progress made to several of the other goals. In other words, in order to make progress on SDG 2, policy makers will need to consider inter-linkages and critical interactions between SDG 2 and all other goals.
Taking advantage of the existence of such linkages (both between the SDG targets and between SDG 2 and other SDGs) will require integrated policy approaches. This involves identifying synergies across goals (e.g. on poverty, health, education, gender and sustainable consumption and production patterns), as well as possible trade-offs (e.g. on water, energy, climate, oceans, land use, forestry, biodiversity and ecosystems). Moving towards more integral policy approaches will be essential, but also challenging given the complexities involved. Inevitably also monitoring frameworks should take proper account of the integral nature of the SDGs and facilitate identification of synergies and trade-offs.
■ Linkages between SDG 2-related targets
Achieving SDG 2 requires attention to all four dimensions of food security and nutrition as defined by CFS and the 1996 World Food Summit:
• End hunger – access to food at all times (Targets 2.1 and 2.3).
• Achieve improved nutrition – food utilization and complementary actions to end malnutrition (Target 2.2).
• Achieve food security – availability of food (Targets 2.3 and 2.b) and stability of food systems (Targets 2.4 and 2.b).
• Promote sustainable agriculture – stability of food systems (Target 2.4) and inputs (Targets 2.3 and 2.5).
The challenges to meet all of these targets will vary from context to context, but in many settings they will be highly interdependent. For instance, in contexts where many of the food insecure depend on agriculture for a living, improvements in agricultural productivity and incomes of small-scale food producers (Target 2.3) will also be a vehicle to improve access to food (target 2.1), while making agriculture more resilient and sustainable (Target 2.4) and will strongly influence the future availability and stability of food supplies (Targets 2.3 and 2.4). Doubling productivity and incomes of small-scale food producers (Target 2.3) may not suffice to end hunger and secure adequate food availability. In other words, progress towards each of these targets will have to be assessed in conjunction with progress towards the others. Singly, none of these targets will be sufficient to achieve SDG 2.
■ Linkages between SDG 2 and other SDGs
Progress towards the various SDG 2 targets will further depend on progress in other domains of the 2030 Agenda. Policies and programmes would need to be cognizant of those linkages and possible trade-offs. However, as the linkages are multiple and complex, doing so may be challenging. In the below examples are some of the key linkages as they relate to the four dimensions of food security and nutrition.
Access to food
• SDG 1 on ending poverty: Lack of income is the most significant factor for many food-insecure people. Many of the world’s food producers are unable to provide themselves with adequate nutrition, and often have reduced or no access to land, water and other productive and financial resources. Functioning markets and sufficient incomes are essential in ensuring that all
How to monitor an integrated agenda?
HOW TO MONITOR AN INTEGRATED AGENDA?
11
people everywhere have access to nutritious food for healthy lives. When people are unable to work because of poor health, age, gender inequalities or disability, or simply because of a lack of jobs, appropriate means of social protection are necessary to ensure that they and their families have access to food. Social protection programmes provide benefits that have been found to directly improve food security and nutrition among low-income households, as well as serving as vehicles towards other benefits, such as infrastructure improvements and health care and education for children.
• Other goals relevant to access to food include SDG 8 on promoting sustained and inclusive economic growth and SDG 10 on reducing inequality.
Food availability and markets
• SDG 12 on ensuring responsible consumption and production directly links to promotion of sustainable agriculture and food supplies and emphasizes the importance of reducing food waste and losses at the farm level and along the market chain (Target 12.3).
• SDG 13 on taking action to combat climate change: Climate risks have disproportionate effects on the poorest people, who are more exposed to climate- related disasters that increase hunger by destroying land, livestock, crops and food supplies and restricting people’s access to markets. Without rapid, inclusive and climate-smart development that incorporates efforts to reduce emissions and protects the poor, many more people will be affected by poverty and hunger. Trade-offs may exist as agriculture currently is a significant source of greenhouse gas emissions contributing to climate change, while certain mitigation efforts (e.g. energy from biofuels) may compete for resources needed for food production.
• SDG 14 on conserving and using marine resources responsibly and SDG 15 on conserving and using land responsibly and halting biodiversity loss are essential to long-term sustainability of food supplies. Halting land degradation, deforestation and desertification, and conserving and restoring terrestrial ecosystems such as forests, wetlands, drylands and mountains can be co-benefits of sustainable, resilient farming practices that increase smallholder farm productivity and generate additional off-farm employment. Trade-offs may exist as, for instance, reforestation and other conservation measures may divert land from agricultural use.
• Other goals relevant to adequate food availability include, SDG 6 on ensuring availability of water and sanitation for all, in particular water management
related aspects, SDG 7 on ensuring access to affordable and clean energy, and SDG 9 on building resilient infrastructure, promoting inclusive and sustainable industry and fostering innovation.
Nutrition and utilization of food
• SDG 6 on ensuring clean water and sanitation and SDG 3 on ensuring healthy lives and well-being are relevant to improved nutrition. Access to clean water and sanitation prevents the spread of diarrhoea and water-borne disease. Certain illnesses prevent people’s bodies from utilizing food effectively, leading to malnutrition. For instance, HIV treatment with anti-retroviral therapy requires good nutrition to be effective.
• SDG 4 on ensuring quality education: Education enhances people’s ability to adapt their behaviour, including their nutrition, hygiene, sanitation and health practices, and to demand appropriate services. As part of the essential package for schoolchildren’s health and nutrition, school meals programmes help ensure that children have access to education despite crises or chronic poverty, and thus contribute to breaking the intergenerational transmission of hunger.
Food stability
• The 2030 Agenda does not directly address the issue of stability of food availability, but achieving Targets 2.4 (making food systems resilient to climate change and extreme weather) and 2.b (correcting and preventing trade restrictions and distortions in world agricultural markets in accordance with the mandate of the Doha Development Round) may contribute to stability in food supplies and improved market access. Achieving goals and targets for improved infrastructure (e.g. Targets 2.a, 9.a, and 11.a), combatting climate change (SDG 13), promoting peace (SDG 16), and enhancing finance, trade and global macroeconomic stability (SDG 17) would also contribute.
Overarching linkages
• SDG 5 on achieving gender equality and empowering women and girls: The role of women in food security and nutrition is well documented: women feed their families, produce and market food, and have essential roles in ending the intergenerational cycle of hunger. In many contexts, improving agricultural productivity is hampered by unequal access to land, inputs, credits and other resources for women, who make up a significant share of the agricultural labour force. Improved access to water and energy services reduce the burden on women and young girls who often spend several hours each day

12
MONITORING FOOD SECURITY AND NUTRITION IN SUPPORT OF THE 2030 AGENDA FOR SUSTAINABLE DEVELOPMENT
collecting water and gathering biomass for cooking, thus freeing up time for their participation in education and income generation activities.
• SDG 16 on promoting peace, justice and strong institutions: Throughout the world, conflicts disrupt farming and food production. Conflicts force millions of people to flee their homes, leading to hunger emergencies as displaced populations and refugees find themselves without the means to feed themselves. Hunger causes and exacerbates risks to people’s safety and dignity, while these risks in turn affect people’s access to food. Reducing hunger and promoting transparent and participatory systems and mechanisms are central to addressing such rights violations. At the same time, food insecurity can be a contributing factor to conflict or the resumption of conflict.
• SDG 17 to strengthen the means of implementation and revitalize the global partnership for sustainable development: Enhanced finance, technology transfer, capacity development, and fair trading rules will all be essential to support food security and nutrition and promote sustainable agriculture, but will require strong coherence across these areas of international cooperation and with domestic policy efforts. Tracking compliance with international commitments and trends in financial flows will be important, but their effectiveness can only be properly assessed against the broader set of factors that determine the enabling environment for sustainable agricultural investments and how policy frameworks and incentive schemes are aligned with SDG 2. Monitoring of progress towards SDG 2 will further need to be aligned with that being undertaken under the flag of other platforms, such as, for instance, the financing for development follow-up on Addis Ababa Action Agenda and the follow-up mechanisms to the Paris Agreement on Climate Change, as coordinated through the United Nations Framework Convention on Climate Change (UNFCCC).
■ Implications for monitoring food security and nutrition
The SDGs were designed as part of a holistic vision for sustainable development. Consequently, in order to make progress on SDG 2, policy makers will need to consider inter-linkages and critical interactions between SDG 2 and all other goals. Monitoring frameworks will also need to facilitate identification of such linkages and the effectiveness of integral policies. They should go well beyond simple tracking of indicators and provide evaluation tools to identify how interventions across policy domains influence the key outcomes and how achievement towards one SDG is helping (or not) accelerate progress towards another. Future reports
on The State of Food Security and Nutrition in the World will contribute to the integrated monitoring of progress towards ending hunger and eradicating all forms of malnutrition (Targets 2.1 and 2.2) by assessing the synergies and trade-offs with efforts in achieving the other targets under SDG 2 and progress made on other SDGs. This will be done mostly at the global level through regional and country comparisons and through country case studies. Each successive report will address a sub-set of the relevant linkages.

This information note reports on the state of food security and nutrition at the beginning of the 2030 Agenda for Sustainable Development. It identifies key measurement challenges for monitoring progress towards the second Sustainable Development Goal (SDG 2), which aims to end hunger, achieve food security and improve nutrition, and promote sustainable agriculture.
It also identifies the most important linkages both across the elements comprised under SDG 2 and between SDG 2 and other SDGs and lays out the challenges in monitoring progress towards improved food security and nutrition and sustainable agricultural systems.
Monitoring Food Security and Nutrition in Support of the 2030 Agenda for Sustainable DevelopmentTaking stock and looking ahead
I6188E/1/09.16
ISBN 978-92-5-109432-7
9 7 8 9 2 5 1 0 9 4 3 2 7