monitoring and analysis of ground settlement induced by
TRANSCRIPT

Research ArticleMonitoring and Analysis of Ground Settlement Induced byTunnelling with Slurry Pressure-Balanced TunnelBoring Machine
Hyunku Park , Ju-Young Oh, Dohyung Kim, and Seokbue Chang
Civil Business Unit, Engineering and Construction Group, Samsung C&T Corporation, Seoul, Republic of Korea
Correspondence should be addressed to Hyunku Park; [email protected]
Received 7 December 2017; Accepted 22 March 2018; Published 12 April 2018
Academic Editor: Venu G. M. Annamdas
Copyright © 2018 Hyunku Park et al. *is is an open access article distributed under the Creative Commons Attribution License,which permits unrestricted use, distribution, and reproduction in any medium, provided the original work is properly cited.
A case study of monitoring and analysis of ground settlement caused by tunnelling of stacked twin tunnels for undergroundmetroline construction through the densely populated area using the slurry pressure-balanced TBM is presented. Detailed groundsettlement monitoring was carried out for the initial stage of down-track tunnelling in order to estimate trough width factor andvolume losses including face, shield, and tail losses. In addition, using the gap model, prediction of volume loss and groundsettlement was carried out with consideration of the ground condition, TBM configurations, and actual operation data. *epredictions of the gap model were compared with the observed results, and adjustment factors were determined for volume lossestimation. *e adjusted factors were applied to predict ground settlement of the up-track tunnel, and its results were comparedwith the field measurements.
1. Introduction
*e closed-type shield tunnel boring machine (TBM) hasbeen widely applied to the tunnelling works in urban area tominimize impact of tunnel construction on the adjacentfacilities and buildings. Compared to the conventional drilland blast tunnelling method, the shield TBM tunnelling hasseveral advantages in the control of ground settlement [1].First, the TBM excavates ground using a disc cutter or cutterbits mounted on the rigid steel cutterhead and imposes earthpressure or slurry pressure on the tunnel face to preventsqueezing movement of ground towards the tunnel face.After finishing excavation at the tunnel face, the shield TBMradially supports the inside of the excavated cavity based onthe reaction from the thick steel shield skin plate. *en,concrete segment lining is installed just rear of the shieldskin plate as a permanent ground supporting structure,where simultaneous backfilling of pressurized grout is alsoconducted at the annulus gap around the segment lining torestrict excessive radial contraction of the excavated ground.According to the field observations in the literatures [2–4],ground settlement during shield TBM tunnelling develops in
the following steps in accordance with the abovementionedground supporting mechanisms: (1) before and during tunnelface excavation, (2) during passage of the shield skin plate, and(3) after installation of segmental lining and backfill grouting.
In general, the ground settlement in tunnelling isthought to be caused by ground loss, which is defined asa difference between actual and theoretical excavationvolume. *e ground loss develops due to internal de-formation of the tunnel during excavation, which makes theactual amount of excavation to be larger than the theoreticalamount. Hence, for TBM tunnelling, ground loss can bedivided into three categories to be consistent with theabovementioned ground settlement steps as called face loss,shield loss, and tail loss [5]. *e face loss is the ground losscaused by deformation of ground into tunnel face, and theshield loss is induced by the radial contraction of groundalong the annular gap around the shield skin plate. *e tailloss occurs along the annular void between ground andconcrete segmental lining as a result of shrinkage or com-pression of backfill grout material. Because the closed-typeshield TBM has measures for reducing the ground de-formation at the tunnel face, around the shield skin plate and
HindawiAdvances in Civil EngineeringVolume 2018, Article ID 5879402, 10 pageshttps://doi.org/10.1155/2018/5879402

tail void, each ground losses can be estimated based on boththe ground and tunnel operation conditions including TBMdimensions, face pressure, and backfill grouting pressure.For quantitative estimation of ground loss during shieldTBM tunnelling, Lee et al. [5] proposed a gap model. *emodel estimates total ground loss as a linear sum of face loss,shield loss, and tail loss, where the each ground loss can becalculated based on simple elastic equations for thesqueezing of tunnel face and the contraction of excavatedcavity. However, the gap model has some limitations anduncertainties for practical use such as assumptions of iso-tropic stress condition of ground, friction between groundand shield skin plate, flow of bentonite slurry or backfillgrout around shield, and shrinkage rate in backfill grout attail void, which can be changed and affected by actual TBMoperation conditions. Accordingly, the gap model has notbeen applied in the analysis of the observed ground set-tlement during TBM tunnelling. Instead, many researcherstried to correlate the volume loss with TBM operation datadirectly. However, because the process around shield TBMtunnelling is very complicated, most of the studies could notprovide statistically meaningful relationships between thevolume loss and operation parameters [2–4, 6, 7].
In practice, TBM tunnelling-induced ground settlementis mostly estimated based on the empirical relationships orguidelines. *ose mostly provide site-specific or geologicallyspecific characteristic parameters for prediction of groundsettlement in terms of volume loss, that is, ground loss perunit area of tunnel excavation, and trough width, that is,distance from the tunnel centerline to the inflection point ofthe ground settlement trough [8–11]. However, the em-pirical methods are unable to consider effect of the sup-porting actions of the shield TBM in the calculation ofvolume loss, and consequently, the relatively conservativevalue of volume loss is usually adopted in ground settlementcontrol.*is will also lead conservative estimation of groundsettlement, which may require unnecessary ground im-provement or reinforcement as countermeasures. Hence, foreconomic design and planning of shield TBM tunnelling,reasonable prediction of volume loss based on reliableanalysis of monitored ground settlement is essential.
*is paper presents the results of monitoring and analysisof ground settlement induced by tunnelling of stacked twintubes (down- and up-track tubes) for underground metro lineconstruction through the densely populated area using theslurry pressure-balanced (SPB) TBM. For the initial stage ofdown-track tunnelling, comprehensive ground settlementmonitoring was carried out in both transverse and longitu-dinal sections against the tunnelling direction to figure out thetrough width factor and volume losses including face, shield,and tail losses. Besides, based on the ground condition, TBMconfiguration, and actual operation data, volume loss andground settlement were predicted using the gap model. *en,the gap model’s predictions were compared with the obser-vations and adjustment parameters for total volume loss es-timation, that is, linear summation of face, shield, and tail losswas introduced. At last, the adjusted gap model was applied topredict the ground settlement of up-track tunnelling andcompared with the monitored results.
2. Details of Shield TBM Tunnelling
2.1. Tunnel Alignment and Ground Condition. *e stackedtwin TBM tunnels were constructed in shallow depth bycrossing the densely populated area, and hence, it was re-quired to minimize ground settlement and consequentdamage to existing buildings.*e tunnel alignment, adjacentcondition of land occupation, and vertical geological profileare presented in Figure 1. Except for the launching stationand a few hundred meters of the initial driving section, mostof tunnel excavation was conducted below the heavy trafficroads with major transportation services. For TBM tunnelsection 1, springlines of both the up- and down-track tunnelsrange from 10m to 22m below ground surface, whichmeansmost of the tunnel excavation was carried out in low groundcover condition. On the other hand, TBM tunnel section 2shows the sufficient ground cover, where the TBM mostlypassed below mountainous area with increased rock-headlevel.
Ground condition could be characterized as three stratafrom ground level as follows: reclaimed fill layer; alluviallayer; and decomposed granite rock layer. Table 1 sum-marizes the geotechnical parameters of the ground at tunneldepth. Fill layer is loose silt and sand, and alluvium layer isgravelly medium silty sand with high clayey contents.Depending on the degree of weathering, the decomposedgranite layer was classified into four categories as moderately(MDG), highly (HDG), completely decomposed granite(CDG), and partially existing corestones, where MDG,HDG, and CDG could be classified very hard to hard rock,highly fractured normal to weak rock, and very weak rock toweathered soil, respectively. As can be seen from the lon-gitudinal profile, the TBMs mostly drove through fill, al-luvium, and CDG/HDG layers except for mountainous area,where the tunnel passes the MDG layer. Due to severevariation of rock-head level, mixed face conditions, that is,ground condition that soil and rock coexist within a tunnelface, frequently appeared along tunnel alignment which wascomposed of the alluvial layer and CDG/HDG layer orCDG/HDG layer and corestone layer. Groundwater levellocates one to three meters below ground level, and hence,maximum three bar of groundwater pressure was expectedat tunnel face.
2.2. TBM Specification and Instrumentation. Aforementionedground conditions imply that there were unfavourable con-ditions for ground settlement control in TBM tunnelling. *emixed face conditions at the tunnel face can cause over ex-cavation, and it will be resulted in additional ground settlement.In addition, severe groundwater inflow during excavation canbe occurred due to high groundwater pressure and severevariation of permeability of ground around tunnel depth.Moreover, the shallow ground cover for up-track tunnel at theinitial part of TBM tunnel section 1 was considered as mostproblematic. Besides, the CDG and HDG were found to beabrasive material for TBM excavation because the rocks havehigh content of quartz. In order to hedge the aforementionedunfavourable conditions for tunnelling, mixshield-type slurrypressure-balanced (SPB) TBMs were applied for both up- and
2 Advances in Civil Engineering

down-track tunnels. In general, compared to earthpressure-balanced (EPB) TBM, SPB TBM is more com-patible with both rock and soft ground and has advantagesin reducing not only the groundwater in�ow in permeableor fractured ground but also the abrasion of the cutting toolbased on the �ow of bentonite slurry around the cutter-head. Table 2 presents the main speci�cations of the tunnelboring machines.
Because most of the tunnel alignment was along theheavy tra c road crossing the dense commercial area, it was
hard to measure the ground settlement close to the tunnel.Hence, in this study, initial 300m section from the launchingstation, where the public park located, was chosen for in-stallation of settlement monitoring arrays and analysis ofground settlement behavior. �e longitudinal pro�le of themonitoring section is presented in Figure 2, where both thedown- and up-track tunnels were driven with low groundcover through the �ll, alluvium, and upper part of CDGlayers, which are thought to be susceptible to settlement. Inaddition, both of the tunnels were classi�ed as shallow
FillQuaternary depositsCDG to HDG
Corestone zoneMDG or better
Retrieval
Station Launching stationTBM tunnel section 2 TBM tunnel section 1
GraniteCorestone Weathered granite
Fill/alluvial layer
Down-track
Up-track
Initialdriving
LaunchingSTATION
STATION
Figure 1: Tunnel alignment and geological pro�le.
Table 1: Geotechnical design parameters of the ground.
Groundtype
Unit weight(kN/m3)
NSPT(down-track)
NSPT(up-track)
Young’smodulus (MPa)
Frictionangle (°) Ko
Permeability,k (m/sec)
Fill 19 <10 <101.5×NSPT
35 0.4 1× 10⁻⁷ to 4×10⁻⁴Alluvium 19 30∼35 24∼30 35 0.4 1× 10⁻⁸ to 4×10⁻⁵CDG 19 40∼60 35∼41 35 0.4 1× 10⁻⁷ to 4×10⁻⁵HDG 19 200 300 40 0.4MDG 22 UCS� 30∼200MPa∗ >1,000 45 0.4 1× 10⁻⁷∗UCS: uncon�ned compressive strength.
Table 2: Main speci�cation of the TBM.
Item ValueExcavation diameter (including overcut) (mm) 7,450Skin plate length (mm) 11,450Skin plate diameter (tail) (mm) 7,400Segment inner/outer diameter (mm) 6,500/7,100Maximum machine thrust (approximate) (kN) 47,000Maximum torque (approximate) (kNm) 5,000Operating slurry pressure (bar) 4.0Back�ll grout Bicomponent simultaneous injection
Advances in Civil Engineering 3

tunnels because cover depth of up-track and down-tracktunnels is less than twice of the excavation diameter, and inthe case of the up-track tunnel, cover depth was occasionallyless than the excavation diameter.
Figure 3 shows the plan views for the locations ofground settlement measurement points with reference totunnel alignment. Because the down-track tunnelling wasplanned to start several months earlier than the up-tracktunnel excavation, a detailed instrumentation layout wasadopted to the down-track tunnel in order to characterizeground settlement behavior and volume loss development.�e transverse settlement troughs were measured fromfourteen settlement arrays. In addition, to monitor se-quentially developing settlement at each stage of TBMadvance as face excavation, passage of the shield skin plate,segment ring build with tail void grouting, eleven crownsettlement points were instrumented directly above thetunnel centerline. Meanwhile, monitoring of only a fewground settlement points was allowed for the up-tracktunnel due to change of construction site utilization planaround the public park area after passing the TBM for the
down-track tunnel. As a result, along initial 100m sectionof the up-track tunnel, only 9 ground settlement pointscould be installed above tunnel crown.
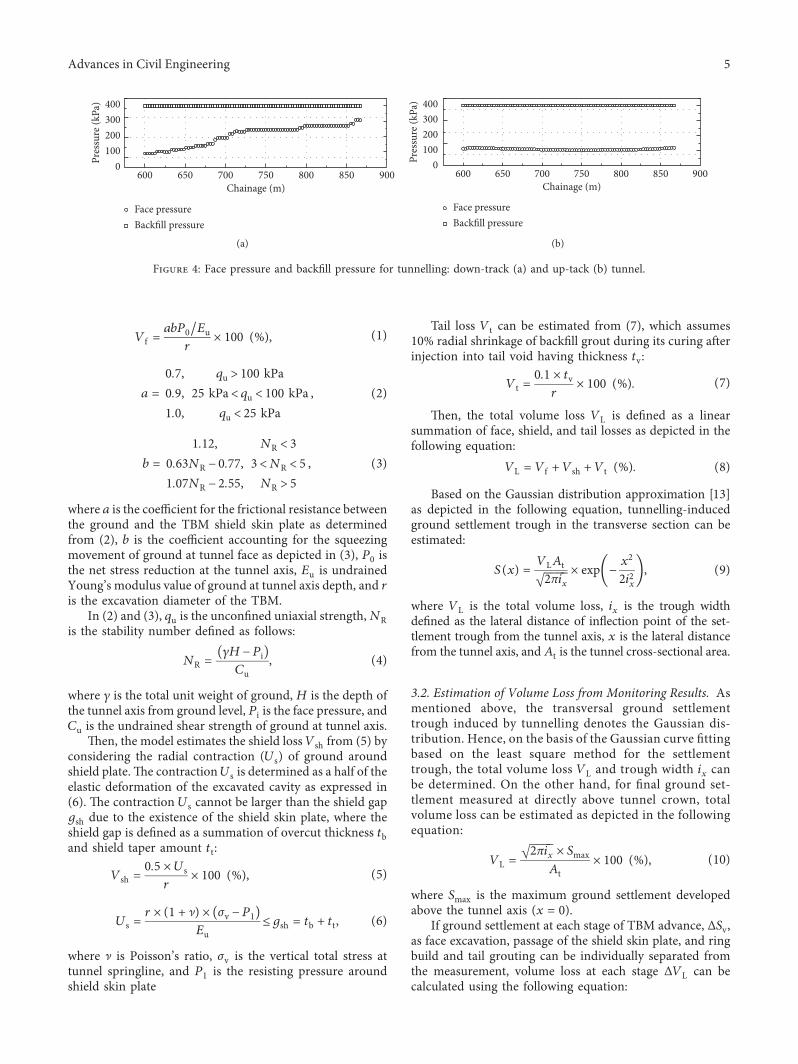
Figure 4 depicts the monitored face and back�ll pressureapplied in tunnelling for both up- and down-track tunnelling.In order to prevent ground heaving during the up-tracktunnel due to very shallow cover depth, actual face pres-sure was controlled less than 150 kPa. In the down-track case,low face pressure was maintained for the initial driving stageand then gradually increased with cover depth increase. Onthe other hand, 400 kPa of pressure was consistently appliedfor back�ll grouting to minimize ground settlement.
3. Analysis Methods
3.1. Ground Settlement Prediction Using Gap Model. For thetheoretical evaluation of the volume loss with considerationof ground characteristics, TBM’s dimensions, and actualTBM operation conditions, the modi�ed gap model byLoganathan [12] was applied in this study. Firstly, the modelcalculates the face loss Vf from the following equation:
Ch. 9
00
Ch. 6
00
Ch. 6
20
Ch. 6
40
Ch. 6
60
Ch. 6
80
Ch. 7
00
Ch. 7
20
Ch. 7
40
Ch. 7
60
Ch. 7
80
Ch. 8
00
Ch. 8
20
Ch. 8
40
Ch. 8
60
Ch. 8
80
0 m
–10 m
–20 m
–30 m
–40 m
–50 m
–60 m
FillAlluvium
Completelydecomposed
granite
Moderatelydecomposed granite
Corestonezone
Up-track
Down-track8 m 12.5 m
Figure 2: Longitudinal pro�le of the monitoring section.
Ch. 600Ch. 620Ch. 640Ch. 660Ch. 680Ch. 700Ch. 720Ch. 740Ch. 760Ch. 780Ch. 800Ch. 820Ch. 840Ch. 860
Ch. 600Ch. 620Ch. 640Ch. 660Ch. 680Ch. 700Ch. 720Ch. 740Ch. 760Ch. 780Ch. 800Ch. 820Ch. 840Ch. 860
+20 m+15 m+10 m
+5 m0 m
–5 m–10 m–15 m–20 m
+20 m+15 m+10 m
+5 m0 m–5 m–10 m–15 m–20 m
Down-track
Up-track
Ch. 590Ch. 720Ch. 740Ch. 760Ch. 780Ch. 800Ch. 820Ch. 840 Ch. 600Ch. 620Ch. 640Ch. 660Ch. 680Ch. 700
Cr 1
Cr 2
Cr3
Cr4
Cr 5
Cr 6
Cr 7
Cr 8
Cr 9
Ch. 600Ch. 620Ch. 640Ch. 660Ch. 680Ch. 700Ch. 720Ch. 740Ch. 760Ch. 780Ch. 800Ch. 820Ch. 840Ch. 860
ArCrCrArArCrCrCrArCrCrArArCrArCr 3 2 3 4 5 4 5 6 6 7 8 7 8 9 910
Ar10
Ar11
Ar12
Cr11
Ar13
Ar14
Ar1
Ar2
Cr1
Figure 3: Instrumentation for ground settlement measurement.
4 Advances in Civil Engineering
Vf �abP0/Eu
r× 100 (%), (1)
a �0.7, qu > 100 kPa0.9, 25 kPa< qu < 100 kPa1.0, qu < 25 kPa
, (2)
b �1.12, NR < 3
0.63NR − 0.77, 3<NR < 51.07NR − 2.55, NR > 5
, (3)
where a is the coe cient for the frictional resistance betweenthe ground and the TBM shield skin plate as determinedfrom (2), b is the coe cient accounting for the squeezingmovement of ground at tunnel face as depicted in (3), P0 isthe net stress reduction at the tunnel axis, Eu is undrainedYoung’s modulus value of ground at tunnel axis depth, and ris the excavation diameter of the TBM.
In (2) and (3), qu is the uncon�ned uniaxial strength,NRis the stability number de�ned as follows:
NR �cH−Pi( )Cu
, (4)
where c is the total unit weight of ground,H is the depth ofthe tunnel axis from ground level, Pi is the face pressure, andCu is the undrained shear strength of ground at tunnel axis.
�en, the model estimates the shield loss Vsh from (5) byconsidering the radial contraction (Us) of ground aroundshield plate.�e contractionUs is determined as a half of theelastic deformation of the excavated cavity as expressed in(6). �e contraction Us cannot be larger than the shield gapgsh due to the existence of the shield skin plate, where theshield gap is de�ned as a summation of overcut thickness tband shield taper amount tt:
Vsh �0.5 × Us
r× 100 (%), (5)
Us �r ×(1 + ]) × σv −P1( )
Eu≤gsh � tb + tt, (6)
where ] is Poisson’s ratio, σv is the vertical total stress attunnel springline, and P1 is the resisting pressure aroundshield skin plate
Tail loss Vt can be estimated from (7), which assumes10% radial shrinkage of back�ll grout during its curing afterinjection into tail void having thickness tv:
Vt �0.1 × tvr
× 100 (%). (7)
�en, the total volume loss VL is de�ned as a linearsummation of face, shield, and tail losses as depicted in thefollowing equation:
VL � Vf + Vsh + Vt (%). (8)
Based on the Gaussian distribution approximation [13]as depicted in the following equation, tunnelling-inducedground settlement trough in the transverse section can beestimated:
S(x) �VLAt����2πix√ × exp −
x2
2i2x( ), (9)
where VL is the total volume loss, ix is the trough widthde�ned as the lateral distance of in�ection point of the set-tlement trough from the tunnel axis, x is the lateral distancefrom the tunnel axis, andAt is the tunnel cross-sectional area.
3.2. Estimation of Volume Loss from Monitoring Results. Asmentioned above, the transversal ground settlementtrough induced by tunnelling denotes the Gaussian dis-tribution. Hence, on the basis of the Gaussian curve �ttingbased on the least square method for the settlementtrough, the total volume loss VL and trough width ix canbe determined. On the other hand, for �nal ground set-tlement measured at directly above tunnel crown, totalvolume loss can be estimated as depicted in the followingequation:
VL �����2πix√
× Smax
At× 100 (%), (10)
where Smax is the maximum ground settlement developedabove the tunnel axis (x � 0).
If ground settlement at each stage of TBM advance, ΔSv,as face excavation, passage of the shield skin plate, and ringbuild and tail grouting can be individually separated fromthe measurement, volume loss at each stage ΔVL can becalculated using the following equation:
600 650 700 750 800 850 900Chainage (m)
0100200300400
Face pressureBackfill pressure
Pres
sure
(kPa
)
(a)
600 650 700 750 800 850 900Chainage (m)
0100200300400
Face pressureBackfill pressure
Pres
sure
(kPa
)
(b)
Figure 4: Face pressure and back�ll pressure for tunnelling: down-track (a) and up-tack (b) tunnel.
Advances in Civil Engineering 5

ΔVL �����2πix√
× ΔSvAt
× 100 (%). (11)
4. Results and Discussion
4.1. Results of Monitoring and Analysis for Down-TrackTunnel. Figure 5 shows the transversal settlement troughsmeasured from the settlement point arrays installed alongthe down-track tunnel. In common, the settlement troughswere developed in the form of the Gaussian distribution,where the maximum ground settlement at the tunnel axis(x � 0) ranges from 5 to 13mm, and the width of the troughis less than 30m.
Based on the Gaussian curve �tting of the monitoredtransverse settlement troughs, total volume loss VL andtrough width factor k (� ix/H) were evaluated as summa-rized in Table 3. �e back-calculated total volume loss andtrough width factor range from 0.3% to 0.63% and from 0.35to 0.66, where their averages are 0.43% and 0.52%, re-spectively. �ose are similar to the values reported regardingtunnelling-induced volume loss in weathered granite groundaround this site [14].
Figure 6 illustrates the variation of ground settlementwith the elapsed time after TBM face arrival on the crown
settlement monitoring point, where settlement develop-ment can be divided into four stages. First, small precedingground heaving occurred in advance to arrival of the TBMface, which might be caused by face pressure. �en, im-mediate settlement developed as TBM face excavationinitiated on day zero. When the shield skin plate passedbelow the monitoring point in 1∼2 days, settlement rapidlyincreased, and �nally, there were gradual increases ofground settlement after ring build for several tens of days,which �nally converged to the constant value after severaltens of days.
For each curves in Figure 6, logistic curve �ttings werecarried out to approximate the measured settlement and toestimate the relative ratio of settlement induced at each stageof the TBM drive against total settlement. From Figure 7, it isfound that, on average, 6%, 30%, and 64% of �nal settlementwere developed during face excavation, skin plate passage,and ring build, respectively. �is result implies that, for theslurry pressure-balanced TBM, major ground settlementdevelops during shield advance and ring build period whileminor settlement is induced in face excavation.
�e total volume loss evaluated from the �eld moni-toring of the down-track tunnel was compared with the gapmodel’s prediction as presented in Figure 8(a). It is foundthat, in the most of monitoring area, the estimation of the
–30 –20 –10 0 10 20 30
–12
–8
–4
0
Ar03Ar06Ar09Ar12
Ar02Ar05Ar08Ar11Ar14
Lateral distance from tunnel axis (m)
Ar01Ar04Ar07 Ar10 Ar13
Gaussian fitting for Ar08Gaussian fitting for Ar10
Gro
und
settl
emen
t (m
m)
Figure 5: Transversal settlement troughs measured in down-track tunnelling.
Table 3: Estimated volume loss parameters from down-track tunnelling.
Parameter AverageSettlement arrays
1 2 3 4 5 6 7 8 9 10 11 12 13 14Smax (mm) −8.1 −7.3 −6.8 −9.1 −10 −12 −8.9 −6.7 −4.9 −6.3 −11 −9.1 −8 −5.5 −7.4VL (%) 0.44 0.32 0.3 0.44 0.46 0.49 0.47 0.35 0.24 0.42 0.43 0.59 0.63 0.47 0.58ix/H 0.52 0.48 0.49 0.5 0.44 0.41 0.5 0.49 0.46 0.67 0.35 0.54 0.63 0.66 0.61
6 Advances in Civil Engineering

gap model is larger than the observed result. In particular,for the section where the TBM operation was stopped forpreparation of the main drive, that is, from Chainage 670 toChainage 700, actually developed volume loss was muchlarger than the predictions. Figures 8(b) and 8(c) show thecomparisons of the shield and tail loss between �eld moni-toring and gapmodel, in which face loss was not considered tobe compared because its magnitude is negligible. �e gapmodel reasonably predicted the shield loss close to themeasured values which mostly ranges within 0.05 to 0.15%.
Especially, the gap model predicted very high large value ofshield loss up to 0.23% at the region where face pressure waslowered to 100 kPa for maintenance, of which observedvolume loss was nearly 0.3%. Meanwhile, as can be seen fromFigure 8(c), the gap model mostly overestimated the tail losscompared to the measurement, where 0.4 to 0.45% of tail losswas predicted while less than 0.3% of tail loss was observedfrom �eld monitoring. On the other hand, or the regionbetween Chainage 825 and Chainage 850, nearly 0.5% of tailloss occurred, which is almost 1.2 times of the predicted value.
–10 –5 0 5 10 15 20 25 30 35 40–14
–12
–10
–8
–6
–4
–2
0
2
4
6
Gro
und
settl
emen
t (m
m)
Elapsed time a�er face arrival date (day)
Preceding heaving A�er ring buildShield
passage
Face excavation
Ar01Ar04Cr07Cr10
Ar02Ar05Cr08Ar10
Cr01Cr04Ar07Ar11
Ar03Cr05Ar08Ar12
Cr03Ar06Ar09
Cr02Cr06Cr09Cr11
Fitting for Ar01 Fitting for Ar08 Fitting for Cr05
Figure 6: Variation of settlement above the tunnel crown with TBM drive sequences (down-track).
Ar1 Ar2 Cr1 Ar3 Cr2 Cr3 Cr4 Cr5 Cr6 Ar6 Cr7 Cr8 Ar7 Ar8 Cr9 Ar9 Cr10Ar10Ar11Ar12Cr110
2
4
6
8
10
12
14
16
Monitoring points
Sv,face
Sv,shield
Sv,tail
0
20
40
60
80
100
S v,st
age/S
v (%
)
Sv,face/Sv | average = 6.2%Sv,shield/Sv | average = 30.2%Sv,tail/Sv | average = 63.6%
Gro
und
settl
emen
t (m
m)
Figure 7: Settlement at face, shield, and tail and relative magnitude.
Advances in Civil Engineering 7
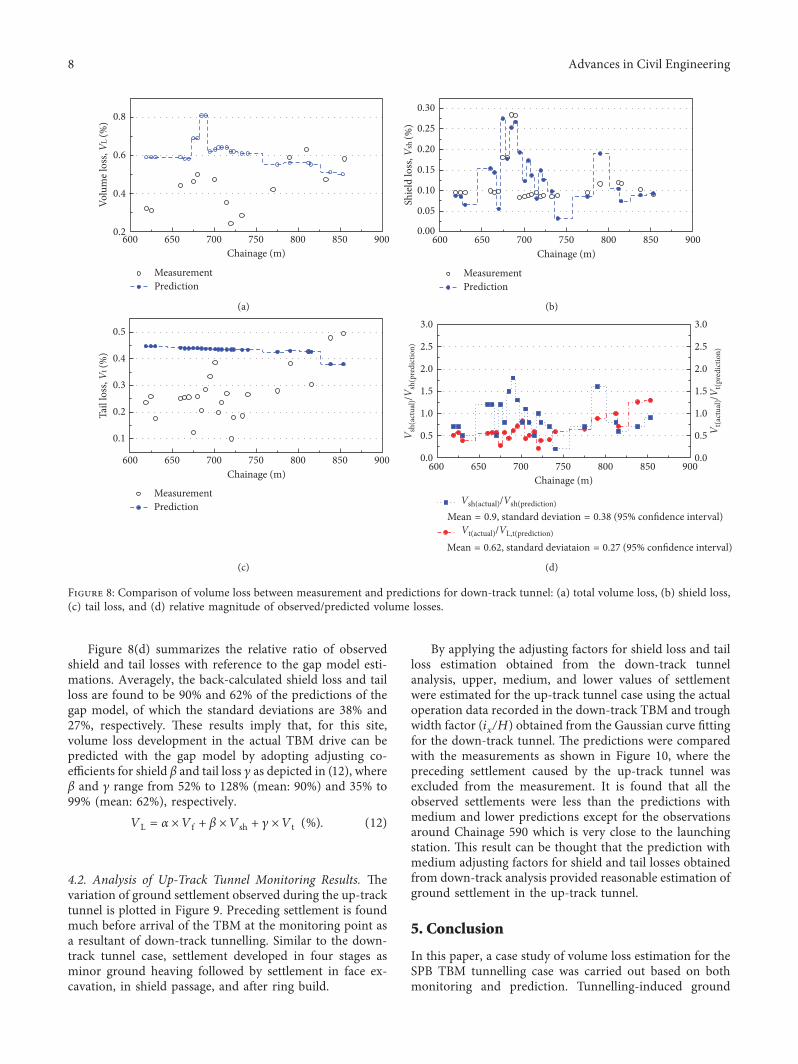
Figure 8(d) summarizes the relative ratio of observedshield and tail losses with reference to the gap model esti-mations. Averagely, the back-calculated shield loss and tailloss are found to be 90% and 62% of the predictions of thegap model, of which the standard deviations are 38% and27%, respectively. �ese results imply that, for this site,volume loss development in the actual TBM drive can bepredicted with the gap model by adopting adjusting co-e cients for shield β and tail loss c as depicted in (12), whereβ and c range from 52% to 128% (mean: 90%) and 35% to99% (mean: 62%), respectively.
VL � α × Vf + β × Vsh + c × Vt (%). (12)
4.2. Analysis of Up-Track Tunnel Monitoring Results. �evariation of ground settlement observed during the up-tracktunnel is plotted in Figure 9. Preceding settlement is foundmuch before arrival of the TBM at the monitoring point asa resultant of down-track tunnelling. Similar to the down-track tunnel case, settlement developed in four stages asminor ground heaving followed by settlement in face ex-cavation, in shield passage, and after ring build.
By applying the adjusting factors for shield loss and tailloss estimation obtained from the down-track tunnelanalysis, upper, medium, and lower values of settlementwere estimated for the up-track tunnel case using the actualoperation data recorded in the down-track TBM and troughwidth factor (ix/H) obtained from the Gaussian curve �ttingfor the down-track tunnel. �e predictions were comparedwith the measurements as shown in Figure 10, where thepreceding settlement caused by the up-track tunnel wasexcluded from the measurement. It is found that all theobserved settlements were less than the predictions withmedium and lower predictions except for the observationsaround Chainage 590 which is very close to the launchingstation. �is result can be thought that the prediction withmedium adjusting factors for shield and tail losses obtainedfrom down-track analysis provided reasonable estimation ofground settlement in the up-track tunnel.
5. Conclusion
In this paper, a case study of volume loss estimation for theSPB TBM tunnelling case was carried out based on bothmonitoring and prediction. Tunnelling-induced ground
600 650 700 750 800 850 9000.2
0.4
0.6
0.8
MeasurementPrediction
Chainage (m)
Volu
me l
oss, VL
(%)
(a)
MeasurementPrediction
600 650 700 750 800 850 9000.00
0.05
0.10
0.15
0.20
0.25
0.30
Chainage (m)
Shie
ld lo
ss, V
sh (%
)
(b)
MeasurementPrediction
600 650 700 750 800 850 900
0.1
0.2
0.3
0.4
0.5
Chainage (m)
Tail
loss
, Vt (
%)
(c)
600 650 700 750 800 850 9000.0
0.5
1.0
1.5
2.0
2.5
3.0
Chainage (m)
0.0
0.5
1.0
1.5
2.0
2.5
3.0
V t(a
ctua
l)/V t
(pre
dict
ion)
V sh(
actu
al)/V
sh(p
redi
ctio
n)
Mean = 0.62, standard deviataion = 0.27 (95% confidence interval)Vt(actual)/VL,t(prediction)
Vsh(actual)/Vsh(prediction)
Mean = 0.9, standard deviation = 0.38 (95% confidence interval)
(d)
Figure 8: Comparison of volume loss between measurement and predictions for down-track tunnel: (a) total volume loss, (b) shield loss,(c) tail loss, and (d) relative magnitude of observed/predicted volume losses.
8 Advances in Civil Engineering
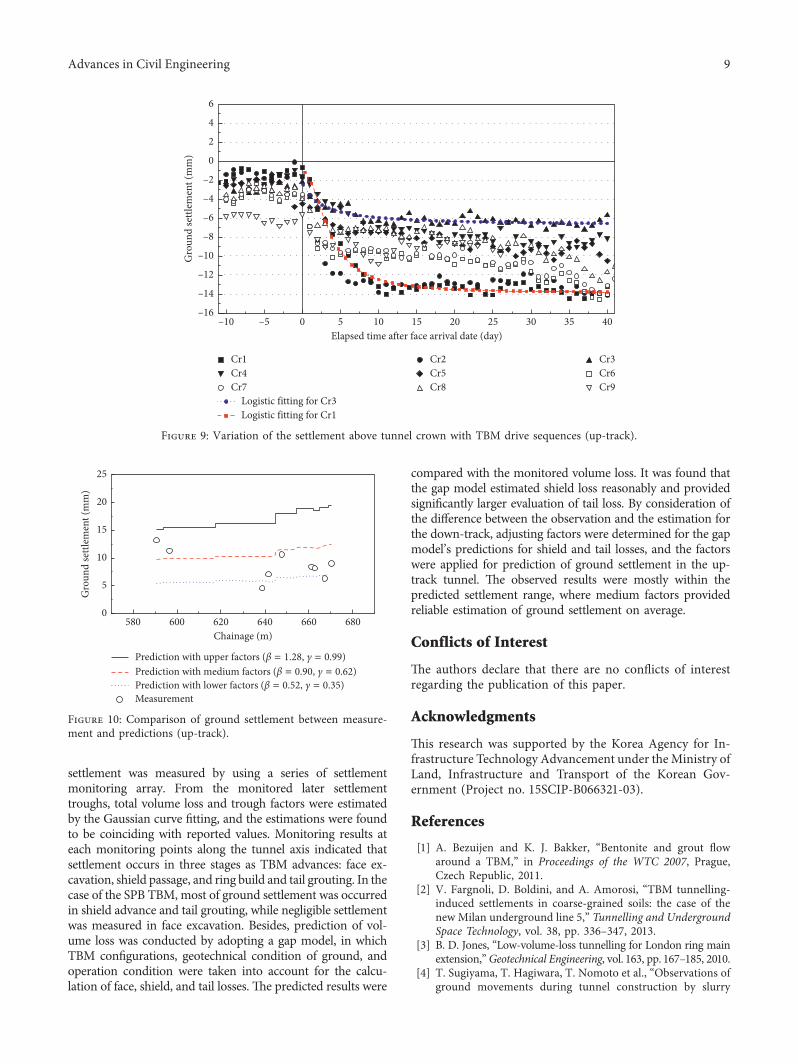
settlement was measured by using a series of settlementmonitoring array. From the monitored later settlementtroughs, total volume loss and trough factors were estimatedby the Gaussian curve �tting, and the estimations were foundto be coinciding with reported values. Monitoring results ateach monitoring points along the tunnel axis indicated thatsettlement occurs in three stages as TBM advances: face ex-cavation, shield passage, and ring build and tail grouting. In thecase of the SPB TBM, most of ground settlement was occurredin shield advance and tail grouting, while negligible settlementwas measured in face excavation. Besides, prediction of vol-ume loss was conducted by adopting a gap model, in whichTBM con�gurations, geotechnical condition of ground, andoperation condition were taken into account for the calcu-lation of face, shield, and tail losses. �e predicted results were
compared with the monitored volume loss. It was found thatthe gap model estimated shield loss reasonably and providedsigni�cantly larger evaluation of tail loss. By consideration ofthe di¨erence between the observation and the estimation forthe down-track, adjusting factors were determined for the gapmodel’s predictions for shield and tail losses, and the factorswere applied for prediction of ground settlement in the up-track tunnel. �e observed results were mostly within thepredicted settlement range, where medium factors providedreliable estimation of ground settlement on average.
Conflicts of Interest
�e authors declare that there are no con�icts of interestregarding the publication of this paper.
Acknowledgments
�is research was supported by the Korea Agency for In-frastructure Technology Advancement under theMinistry ofLand, Infrastructure and Transport of the Korean Gov-ernment (Project no. 15SCIP-B066321-03).
References
[1] A. Bezuijen and K. J. Bakker, “Bentonite and grout �owaround a TBM,” in Proceedings of the WTC 2007, Prague,Czech Republic, 2011.
[2] V. Fargnoli, D. Boldini, and A. Amorosi, “TBM tunnelling-induced settlements in coarse-grained soils: the case of thenew Milan underground line 5,” Tunnelling and UndergroundSpace Technology, vol. 38, pp. 336–347, 2013.
[3] B. D. Jones, “Low-volume-loss tunnelling for London ring mainextension,”Geotechnical Engineering, vol. 163, pp. 167–185, 2010.
[4] T. Sugiyama, T. Hagiwara, T. Nomoto et al., “Observations ofground movements during tunnel construction by slurry
–10 –5 0 5 10 15 20 25 30 35 40–16
–14
–12
–10
–8
–6
–4
–2
0
2
4
6
Elapsed time after face arrival date (day)
Gro
und
settl
emen
t (m
m)
Cr6Cr9
Cr3
Cr7
Cr1Cr4
Cr8
Cr2Cr5
Logistic fitting for Cr1Logistic fitting for Cr3
Figure 9: Variation of the settlement above tunnel crown with TBM drive sequences (up-track).
580 600 620 640 660 6800
5
10
15
20
25
Gro
und
settl
emen
t (m
m)
Chainage (m)
Prediction with upper factors (β = 1.28, γ = 0.99)Prediction with medium factors (β = 0.90, γ = 0.62)Prediction with lower factors (β = 0.52, γ = 0.35)Measurement
Figure 10: Comparison of ground settlement between measure-ment and predictions (up-track).
Advances in Civil Engineering 9

shield method at the Dockland Light Railway LewishamExtension–East London,” Soils and Foundations, vol. 39, no. 3,pp. 99–112, 1999.
[5] K. M. Lee, R. K. Rowe, and K. Y. Lo, “Subsidence owing totunneling. I. Estimating the gap parameter,” Canadian Geo-technical Journal, vol. 29, pp. 929–940, 1992.
[6] S. Suwansawat, Earth Pressure Balance (EPB) Shield Tunnelingin Bangkok: Ground Response and Prediction of Surface Set-tlements Using Artificial Neural Networks, Ph.D. thesis, De-partment of Civil and Environmental Engineering,Massachusetts Institute of Technology, Cambridge, MA, USA,2002.
[7] J. Wongsaroj, E. X. Borghi, K. Soga et al., “Effect of TBMdriving parameters on ground surface movements: channeltunnel rail link contract 220,” in Proceedings of the 5th In-ternational Symposium TC28, Amsterdam, Netherlands, June2005.
[8] FHWA, Road Tunnel Manual (FHWA-NHI-09-010), FederalHighway Administration, Washington, DC, USA, 2009.
[9] LTA, Particular Specification, Aomson Line Contract T212,LTA, Singapore, 2013.
[10] R. J. Mair and R. N. Taylor, “Bored tunnelling in the urbanenvironment,” in Proceedings of the 14th International Societyfor Soil Mechanics and Geotechnical Engineering (ISSMGE),Hamburg, Germany, 1997.
[11] MRTC, Consultancy Agreement no. C1105–Shatin to CentralLine, MRTC, Hong Kong, China, 2011.
[12] N. Loganathan, An Innovative Method for AssessingTunnelling-Induced Risks to Adjacent Structures”, ParsonsBrinckerhoff, Inc., New York, NY, USA, 2011.
[13] R. B. Peck, “Deep excavations and tunneling in soft ground,state-of-art report,” in Proceedings of the 7th InternationalConference on Soil Mechanics and Foundation Engineering(ISSMFE), Mexico City, Mexico, August 1969.
[14] R. A. Forth and C. B. B. *orley, “Ground and buildingsettlement due to tunnelling in Hong Kong,” Land Subsidence,vol. 234, pp. 149–160, 1995.
10 Advances in Civil Engineering

International Journal of
AerospaceEngineeringHindawiwww.hindawi.com Volume 2018
RoboticsJournal of
Hindawiwww.hindawi.com Volume 2018
Hindawiwww.hindawi.com Volume 2018
Active and Passive Electronic Components
VLSI Design
Hindawiwww.hindawi.com Volume 2018
Hindawiwww.hindawi.com Volume 2018
Shock and Vibration
Hindawiwww.hindawi.com Volume 2018
Civil EngineeringAdvances in
Acoustics and VibrationAdvances in
Hindawiwww.hindawi.com Volume 2018
Hindawiwww.hindawi.com Volume 2018
Electrical and Computer Engineering
Journal of
Advances inOptoElectronics
Hindawiwww.hindawi.com
Volume 2018
Hindawi Publishing Corporation http://www.hindawi.com Volume 2013Hindawiwww.hindawi.com
The Scientific World Journal
Volume 2018
Control Scienceand Engineering
Journal of
Hindawiwww.hindawi.com Volume 2018
Hindawiwww.hindawi.com
Journal ofEngineeringVolume 2018
SensorsJournal of
Hindawiwww.hindawi.com Volume 2018
International Journal of
RotatingMachinery
Hindawiwww.hindawi.com Volume 2018
Modelling &Simulationin EngineeringHindawiwww.hindawi.com Volume 2018
Hindawiwww.hindawi.com Volume 2018
Chemical EngineeringInternational Journal of Antennas and
Propagation
International Journal of
Hindawiwww.hindawi.com Volume 2018
Hindawiwww.hindawi.com Volume 2018
Navigation and Observation
International Journal of
Hindawi
www.hindawi.com Volume 2018
Advances in
Multimedia
Submit your manuscripts atwww.hindawi.com