mongolia quarterly update - world...
TRANSCRIPT

giveS
Mongolia Quarterly Economic Update
The World Bank
The World Bank’s Mongolia Quarterly Economic Update assesses recent economic and social developments and policies in Mongolia. It also presents findings of ongoing World Bank activities in Mongolia. The Update is prepared by a team from the World Bank’s Poverty Reduction and Economic Management (PREM) Sector Unit in the East Asia and Pacific Region Vice-Presidency, consisting of Munkhnasan Narmandakh, Tehmina Khan, Sriram Lakshman and Altantsetseg Shiilegmaa, and led by Rogier van den Brink. This Update also received contributions from Zahid Hasnain and Graeme Hancock. Copies can be downloaded from http://www.worldbank.org.mn. For further information, comments and questions, please contact Sunjidmaa Jamba ([email protected]).
April 2011

Mongolia Quarterly Update 2011
2
Contents
Executive Summary ....................................................................................................................................... 5
Real sector developments ............................................................................................................................ 7
Labor Markets and Poverty ........................................................................................................................... 8
Inflation ....................................................................................................................................................... 10
Fiscal developments .................................................................................................................................... 12
External sector ............................................................................................................................................ 16
Banking sector ............................................................................................................................................. 19
Capital markets ........................................................................................................................................... 22
Economic outlook ....................................................................................................................................... 23
Figures
Figure 1 The economic recovery was broad-based, with the exception of agriculture… ............................ 7
Figure 2 …but the rate of growth of industrial production slowed down ................................................... 7
Figure 3 Registered unemployment* has remained about the same .......................................................... 8
Figure 4 Real wages increased as inflation moderates ................................................................................ 9
Figure 5 Adequacy of wages relative to basic consumption needs .............................................................. 9
Figure 6 Reasons for working in these markets ............................................................................................ 9
Figure 7 Inflation drops due to decelerating food prices ........................................................................... 10
Figure 8 Meat exports by Mongolia ............................................................................................................ 10
Figure 9 International food prices remain high .......................................................................................... 11
Figure 10 World Bank Global Price Indices ................................................................................................. 11
Figure 11 China and Mongolia food prices ................................................................................................. 11
Figure 12 Fiscal balances have improved strongly in recent months … ..................................................... 12
Figure 13 …as revenues have risen strongly reflecting broad based economic recovery .......................... 12
Figure 14 Current transfers and wages and salaries constitute bulk of the expenditure.......................... 13
Figure 15 Headline budget numbers as percent of GDP ............................................................................ 14
Figure 16 Overall balances in absolute terms ............................................................................................. 14
Figure 17 Production estimates for the Eastern block............................................................................... 15
Figure 18 The trade deficit widened further… ............................................................................................ 16
Figure 19 driven mostly by transport equipment and machinery .............................................................. 16
Figure 20 Coal and copper exports rise strongly while gold exports finally pick up ................................... 17
Mongolia Quarterly Update 2011
3
Figure 21 Commodity prices continue to rebound… .................................................................................. 17
Figure 22 The exchange depreciated at the start of May 2011 .................................................................. 18
Figure 23 BoM international reserves are at record levels ........................................................................ 18
Figure 24 MNT deposits reached a new peak in March while FX deposits withdrawn .............................. 19
Figure 25 Real economy-wide interest rates picked up as inflation moderated ........................................ 19
Figure 26 Credit growth picking up… .......................................................................................................... 20
Figure 27 …while purchases of Central Bank bills retrieves from another peak ........................................ 20
Figure 28 NPLs still remain high as NPL volume increased in March by 3 percent mom… ...................... 21
Figure 29 …while loans to largest 50 borrowers continue to increase ....................................................... 21
Figure 30 NPL ratios subsided in the construction and agriculture sectors .............................................. 21
Figure 31 while the levels of mining and quarrying NPLs worsened on quarterly basis in 2010 Q4 .......... 21
Figure 32 Market capitalization in comparison… ........................................................................................ 22
Figure 33 … but increasing sharply in recent months along with the Top-20 Index .................................. 22
Figure 34 Listed companies by sectors ...................................................................................................... 23
Figure 35 China industrial production and imports from Mongolia ........................................................... 27
Tables
Table 1 Driver of change of major export commodities between March 2010 and March 2011 .............. 17
Table 2 Mongolia: Key Indicators ................................................................................................................ 29
Boxes
Box 1 Tavan Tolgoi Financing Agreements ................................................................................................. 14
Box 2: What is Dutch Disease? .................................................................................................................... 23
Box 3: Back to the future? .......................................................................................................................... 25
Box 4: Impact of Japan’s Earthquake on Mongolia ..................................................................................... 26

Mongolia Quarterly Update 2011
4
Abbreviations and acronyms
bn Billion
BoM Bank of Mongolia
CPI Consumer Price Index
FX Foreign currency
GDP Gross Domestic Product
HDF Human Development Fund
LC Local currency
LHS Left hand side
MFA Mongolian Financial Association
mn Million
MNT Mongolian togrog
MoF Ministry of Finance
mom Month-on-month
mt Metric ton
NPL Non-performing loan
NSO National Statistics Office
OT Oyu Tolgoi
RHS Right hand side
US$ United States Dollar
WPT Windfall Profit Tax
yoy Year-on-year
ytd Year-to-date
Mongolia Quarterly Update 2011
5
Executive Summary1
Mongolia’s prospects in the medium term look excellent from a growth perspective as well as a fiscal management perspective. Staying the course in the medium term means implementing the landmark Fiscal Stability Law (FSL) passed last year, and adopting a supportive integrated budget law this spring session of parliament. This ensures a path of counter-cyclical budgets, thereby avoiding some of the macroeconomic “Dutch Disease” issues typically seen in resource rich countries. Unfortunately, the crux of the FSL—abiding by a structural fiscal deficit of 2 percent of GDP calculated using long-term mineral price projections--does not come into force until 2013, after the 2012 election year. Until that time significant risks exist, emanating from both domestic as well as external sources.
The economy grew 6.1 percent year-on-year (yoy) in 2010, following a contraction of 1.3 percent in 2009. The last quarter of 2010 ended with a broad-based recovery, supported by transportation, construction and wholesale and retail trade. Unfortunately for the employment of the poorest segments of society, the agriculture sector (down 17 percent yoy in 2010) experienced double digit contractions in all four quarters in 2010. However, the upward trend in consumer prices was broken by declining meat prices—the result of sales under a government-subsidized meat reserve scheme. March data show a moderation in the headline UB inflation to 7.4 percent yoy, following a 11 percent yoy increase in the previous month. However, food prices are rising in Russia and China, from where Mongolia imports the bulk of its main food commodities.
The latest fiscal data show continued improvement in the budget outturns. On a 12-month rolling basis, the fiscal surplus increased to 2.4 percent of GDP in March 2011, up from a 5 percent deficit in March last year. This reflects the recovery in broad based economic activity, imports and favorable commodity prices. Revenues have improved markedly, increasingly annually by 56 percent in real terms in March. However, the 2011 Budget of Mongolia envisages a steep increase in government spending to an unprecedented MNT 779 billion (over 52 percent of GDP). The financing of the resulting deficit (around US$400 m) will be difficult as it depends mostly on yet uncertain revenues to be received from the Tavan Tolgoi (TT) agreement (discussed in Box 1). If the agreement fails to fund the deficit, and given that the government is cognizant of the difficult environment for sovereign bonds, the funding would have to come from the domestic market in its entirety. This could crowd out the private sector which is especially in need of credit during this period of economic expansion.
Imports increased to record levels of 86 percent yoy in March as the trade deficit continued to widen reaching US$ 646 million. Exports were up 71 percent yoy supported by the upward momentum in metal prices and large coal and copper imports by China, which absorbs 90 percent of Mongolia’s exports. As a result of the increased goods trade deficit, the current account deficit is expected to widen further in the first quarter of 2011. The average monthly exchange rate against the US$ appreciated by a percent in April, before depreciating by 6 percent in early May. The accumulation of reserves by the Central Bank leveled off as there was no need to intervene in the market.
In the banking sector, the steady rise in NPL ratios in 2009 has been reversed. However, there continue to exist solvency concerns for small and medium banks. Loans in arrears declined to MNT 81 billion in March from MNT 90 billion in December. However, the ratio of NPLs and loans in arrears to
1 The analysis is based on the most recent data (March 2011) from the Bank of Mongolia (monthly bulletin, loan report
and monthly consolidated banking system balance sheet), the National Statistical Office, National Tax Authority and the Ministry of Finance.

Mongolia Quarterly Update 2011
6
total outstanding loans still stand at high at 13 percent, and the actual stock of NPLs increased in March by 3.2 percent from February. Excluding the two failed banks, whose NPLs largely remain unresolved, NPLs increased to MNT 204 billion, up 8 percent in March from MNT 189 billion in February. In the meantime, the stock of loans outstanding is on the rise since December 2009, up 35 percent yoy in March 2011 or 29 percent in real terms. With credit growing this fast, as was the case prior to the 2008 crisis, regulatory and oversight issues among Mongolian banks (along with capital adequacy) remain crucial. MNT deposits continued to rise, and hit a new peak of above 2.3 trillion in March, fuelled by currency appreciation expectations and supported by the blanket deposit guarantee. Out of the total banking sector liabilities of MNT 6.3 trillion around MNT 4.5 trillion comprises deposits and current accounts for which the government has issued a blanket guarantee. Further reforms are needed to create an efficient, adequately capitalized and well-regulated banking sector.
The latest survey conducted in informal labor markets in March 2011 revealed no changes in the total number of casual workers compared to December. However, due to the increased activity in the construction sector, the number of informal workers in construction material markets rose while the number of informal workers declined in the other markets. Workers’ real informal market wages on average increased by about 18 percent from December to March 2011. The previous decline in real wages is attributable to reduced job opportunities during the winter months and rising inflation. This situation has improved with better weather and moderated inflation. However, of the most vulnerable in society, about 40 percent of those surveyed continue to indicate that their earnings do not meet their basic needs, while the rest rely on these markets for food and shelter only.
A comparison of the macroeconomy of Mongolia now with trends that prevailed in the country in 2008, prior to the crisis, suggest similarities. These similarities are in no small measure due to the expansionary 2011 budget plans. First, the plans include large cash handouts, exerting upward pressure on prices for the second half of 2011, with the risk of substantial second-round effects in the form of a wage-price spiral. Second, while real interest rates are currently positive due to the fall in inflation, upward pressure on prices warrants a close watch on these rates, which could return to negative territory as was the case before the crisis. Finally, as mentioned above, with the trade deficit continuing to widen with the mining boom, the current account is also in deficit—as was the case prior to the crisis. Consequently, there is a risk of returning to the boom-bust scenario that prevailed before 2008 (illustrated in Box 4). Additionally, high domestic inflation will cause the currency to appreciate in real terms, ultimately hurting the export sectors, and possibly creating a macroeconimic scenario called the Dutch Disease (discussed in Box 2).
Mongolia has promising growth prospects. It has the opportunity now to exercise prudent fiscal and macroeconomic policies so it can steer clear of the mistakes made by other resource rich economies and achieve its potential. The Integrated Budget Law, which reforms the budget process and supports the implementation of the FSL, will be debated in Parliament’s spring session and would be an important step in permanently locking in prudent fiscal policies and mechanisms.

Mongolia Quarterly Update 2011
7
Real sector developments
The year 2010 ended with a broad-based recovery, driven by transportation, construction, and wholesale and retail trade
The economy grew 6.1 percent year-on-year (yoy) in 2010 following a contraction of 1.3 percent yoy in 2009, when output had dropped sharply due to the crisis. The newly released quarterly GDP numbers show that the year ended with broad based recovery, led by transportation (16 percent yoy growth), construction sectors (38 percent), and wholesale and retail trade (23 percent). The mining sector actually contracted by 2 percent yoy in Q4 of 2010 (Figure 1).
Unfortunately for employment, the agriculture sector (down 17 percent yoy in 2010) experienced double digit contractions for all four quarters in 2010. Agricultural exports have been depressed by the impact of the past dzud2, which wiped out 22 percent of the total livestock herd, and the significant real appreciation of the currency. For instance, the volume of combed goat down decreased by 87 percent yoy in 2010.
The rate of growth of industrial production (on a 12-month moving average basis to control for seasonality) slowed down, starting in November 2010. However, industrial production seems to be picking up again in March 2011 to 10.6 percent yoy, compared to 1.4 percent yoy a year ago (Figure 2).
Figure 1 The economic recovery was broad-based, with the exception of agriculture…
Figure 2 …but the rate of growth of industrial production slowed down
% of GDP, yoy yoy real change, 12-month moving average
Source: NSO, WB staff estimates. Source: NSO, WB staff estimates.
2 Unusual winter conditions with extremely low temperatures and high wind velocity.
-6
-4
-2
0
2
4
6
8
10
Q3-08 Q4-08 Q1-09 Q2-09 Q3-09 Q4-09 Q1-10 Q2-10 Q3-10 Q4-10
AgricultureMiningManufacturingConstructionWholesale & retail tradeTransportationGross Domestic Product
-25
-15
-5
5
15
25
Sep-09 Mar-10 Sep-10 Mar-11
Mining and quarrying
Manufacturing
Utilities
Total
Mongolia Quarterly Update 2011
8
Labor Markets and Poverty
Unemployment fell to 9.4 percent
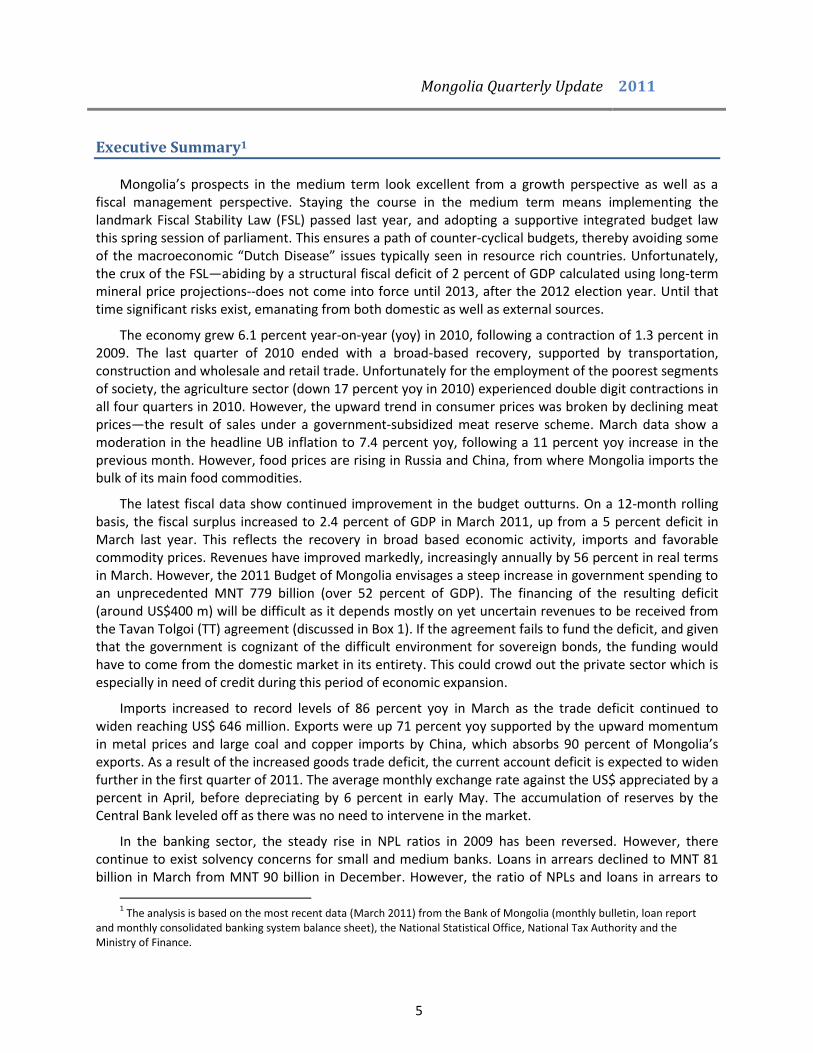
The formal unemployment rate, which includes only those who are registered with the Labor and Social Welfare Service Center, increased to 3.6 percent in March (Figure 3). This is slightly up from 3.3 percent in December 2010. The overall number of registered unemployed also stayed around 40 thousand persons since the second half of 2010.
The Q4 Labor Force Survey3 of 2010, which also takes into account those who are not officially registered as unemployed with the Labor and Social Welfare Service Centers, estimates the unemployment rate at 9.4 percent, down from 13 percent in December 2010, with some 106 thousand people unemployed from the total labor force4 of 1,147 thousand.
Real wages in informal markets
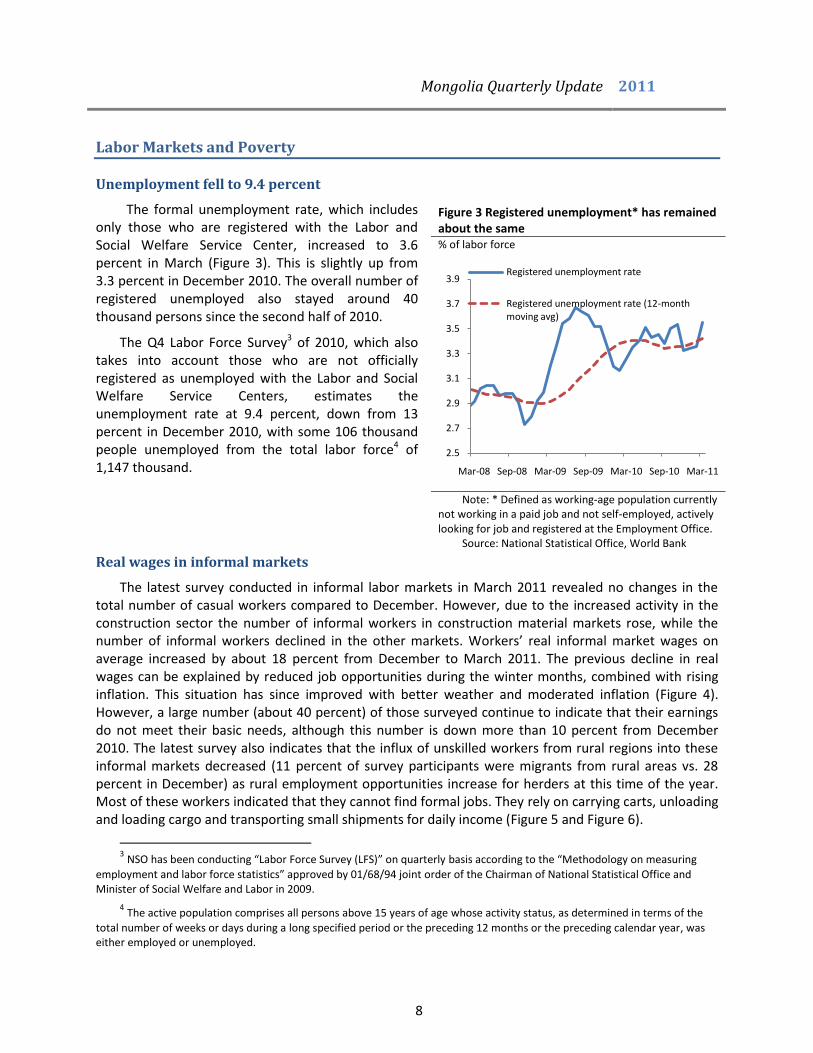
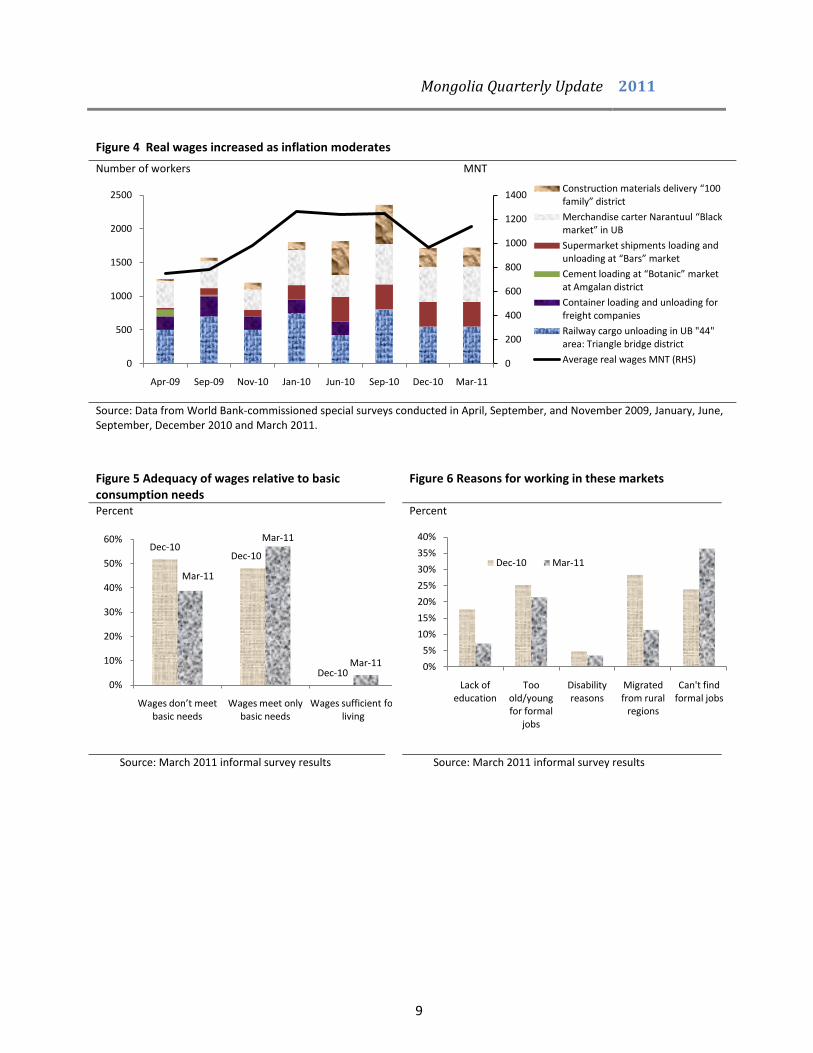
The latest survey conducted in informal labor markets in March 2011 revealed no changes in the total number of casual workers compared to December. However, due to the increased activity in the construction sector the number of informal workers in construction material markets rose, while the number of informal workers declined in the other markets. Workers’ real informal market wages on average increased by about 18 percent from December to March 2011. The previous decline in real wages can be explained by reduced job opportunities during the winter months, combined with rising inflation. This situation has since improved with better weather and moderated inflation (Figure 4). However, a large number (about 40 percent) of those surveyed continue to indicate that their earnings do not meet their basic needs, although this number is down more than 10 percent from December 2010. The latest survey also indicates that the influx of unskilled workers from rural regions into these informal markets decreased (11 percent of survey participants were migrants from rural areas vs. 28 percent in December) as rural employment opportunities increase for herders at this time of the year. Most of these workers indicated that they cannot find formal jobs. They rely on carrying carts, unloading and loading cargo and transporting small shipments for daily income (Figure 5 and Figure 6).
3 NSO has been conducting “Labor Force Survey (LFS)” on quarterly basis according to the “Methodology on measuring
employment and labor force statistics” approved by 01/68/94 joint order of the Chairman of National Statistical Office and Minister of Social Welfare and Labor in 2009.
4 The active population comprises all persons above 15 years of age whose activity status, as determined in terms of the
total number of weeks or days during a long specified period or the preceding 12 months or the preceding calendar year, was either employed or unemployed.
Figure 3 Registered unemployment* has remained about the same % of labor force
Note: * Defined as working-age population currently not working in a paid job and not self-employed, actively looking for job and registered at the Employment Office.
Source: National Statistical Office, World Bank
2.5
2.7
2.9
3.1
3.3
3.5
3.7
3.9
Mar-08 Sep-08 Mar-09 Sep-09 Mar-10 Sep-10 Mar-11
Registered unemployment rate
Registered unemployment rate (12-month moving avg)
Mongolia Quarterly Update 2011
9
Figure 5 Adequacy of wages relative to basic consumption needs
Figure 6 Reasons for working in these markets
Percent Percent
Source: March 2011 informal survey results Source: March 2011 informal survey results
Dec-10Dec-10
Dec-10
Mar-11
Mar-11
Mar-11
0%
10%
20%
30%
40%
50%
60%
Wages don’t meet basic needs
Wages meet only basic needs
Wages sufficient for living
0%
5%
10%
15%
20%
25%
30%
35%
40%
Lack of education
Too old/young for formal
jobs
Disability reasons
Migrated from rural
regions
Can't find formal jobs
Dec-10 Mar-11
Figure 4 Real wages increased as inflation moderates
Number of workers MNT
Source: Data from World Bank-commissioned special surveys conducted in April, September, and November 2009, January, June, September, December 2010 and March 2011.
0
200
400
600
800
1000
1200
1400
0
500
1000
1500
2000
2500
Apr-09 Sep-09 Nov-10 Jan-10 Jun-10 Sep-10 Dec-10 Mar-11
Construction materials delivery “100 family” district
Merchandise carter Narantuul “Black market” in UB
Supermarket shipments loading and unloading at “Bars” market
Cement loading at “Botanic” market at Amgalan district
Container loading and unloading for freight companies
Railway cargo unloading in UB "44" area: Triangle bridge district
Average real wages MNT (RHS)
Mongolia Quarterly Update 2011
10
Inflation
Inflation moderated due to decreased meat prices
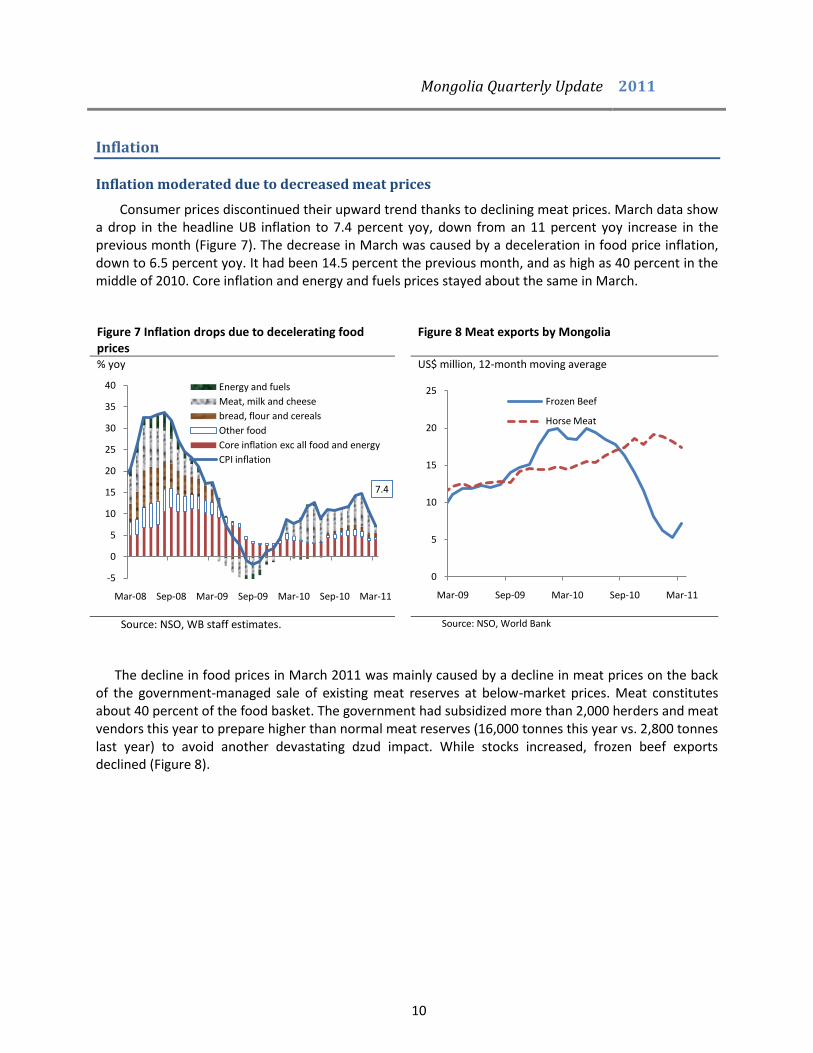
Consumer prices discontinued their upward trend thanks to declining meat prices. March data show a drop in the headline UB inflation to 7.4 percent yoy, down from an 11 percent yoy increase in the previous month (Figure 7). The decrease in March was caused by a deceleration in food price inflation, down to 6.5 percent yoy. It had been 14.5 percent the previous month, and as high as 40 percent in the middle of 2010. Core inflation and energy and fuels prices stayed about the same in March.
Figure 7 Inflation drops due to decelerating food prices
Figure 8 Meat exports by Mongolia
% yoy US$ million, 12-month moving average
Source: NSO, WB staff estimates. Source: NSO, World Bank
The decline in food prices in March 2011 was mainly caused by a decline in meat prices on the back of the government-managed sale of existing meat reserves at below-market prices. Meat constitutes about 40 percent of the food basket. The government had subsidized more than 2,000 herders and meat vendors this year to prepare higher than normal meat reserves (16,000 tonnes this year vs. 2,800 tonnes last year) to avoid another devastating dzud impact. While stocks increased, frozen beef exports declined (Figure 8).
7.4
-5
0
5
10
15
20
25
30
35
40
Mar-08 Sep-08 Mar-09 Sep-09 Mar-10 Sep-10 Mar-11
Energy and fuels
Meat, milk and cheese
bread, flour and cereals
Other food
Core inflation exc all food and energy
CPI inflation
0
5
10
15
20
25
Mar-09 Sep-09 Mar-10 Sep-10 Mar-11
Frozen Beef
Horse Meat

Mongolia Quarterly Update 2011
11
Figure 9 International food prices remain high Figure 10 World Bank Global Price Indices
2005=100 Nominal US$ prices, 2000 = 100
Source: NSO, World Bank Source: Haver, World Bank
Although the additional supply of reserve meat has helped to contain food inflation for now, prices are likely to rise back towards the second half of the year given the continued rise in food prices globally, but in particular in China and Russia from where Mongolia imports the bulk of its food. Global food prices remain high, partly due to increasing fuel prices, touching 2008 levels (Figures 9 and 10) and partly due to shrinking food supplies. Since June 2010, an additional 44 million people worldwide fell below the $1.25 poverty line as a result of higher food prices. The situation has been aggravated by weather conditions in Russia, Ukraine, North America and China. In China, the consumer price inflation was at 5.4 percent at the end of the first quarter of 2011, the fastest since July 2008, driven by the 11.7 percent increase in food costs. Typically, Mongolia’s food inflation lags China’s food inflation by about 3 months (Figure 11). Meat prices in Mongolia are likely to remain high for the foreseeable future, as domestic livestock herds will take time, possibly years, to recover from the dzud, and meat demand from China remains strong. Rising food prices hit the urban poor hard (roughly 22 percent5 of the UB population), because they spend most of their income on food.6
5 Mongolian National Statistics Office, Poverty Headcount 2007-2008
6 Food consumption patterns from the 2007/8 household survey show that the median household below the poverty line
allocates more than 80 percent of its food expenditure to meat and dairy products (46 percent), and to flour and bread (36 percent).
-40
-20
0
20
40
60
80
100
Jan-07 Sep-07 May-08 Jan-09 Sep-09 May-10 Jan-11
overall food exc alc drinks
bread and cereals
meat prices
Figure 11 China and Mongolia food prices
China food prices % yoy Mongolia food prices, % yoy
Source: NSO, Haver, World Bank
-20
-10
0
10
20
30
40
50
60
-10
-5
0
5
10
15
20
25
30
Mar-07 Mar-08 Mar-09 Mar-10 Mar-11
China: Food, 3 months ahead
Mongolia: Food exc alcohol, RHS
Mongolia Quarterly Update 2011
12
Fiscal developments
Fiscal balances improved strongly in step with mineral-related revenues…
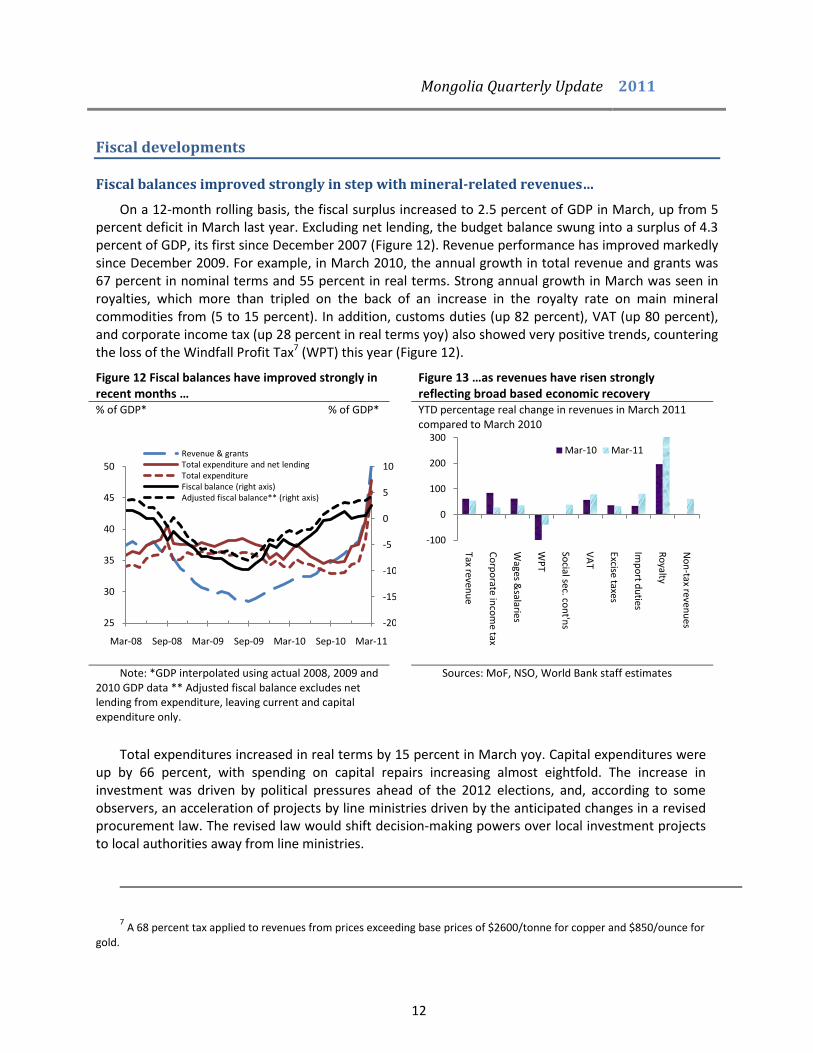
On a 12-month rolling basis, the fiscal surplus increased to 2.5 percent of GDP in March, up from 5 percent deficit in March last year. Excluding net lending, the budget balance swung into a surplus of 4.3 percent of GDP, its first since December 2007 (Figure 12). Revenue performance has improved markedly since December 2009. For example, in March 2010, the annual growth in total revenue and grants was 67 percent in nominal terms and 55 percent in real terms. Strong annual growth in March was seen in royalties, which more than tripled on the back of an increase in the royalty rate on main mineral commodities from (5 to 15 percent). In addition, customs duties (up 82 percent), VAT (up 80 percent), and corporate income tax (up 28 percent in real terms yoy) also showed very positive trends, countering the loss of the Windfall Profit Tax7 (WPT) this year (Figure 12).
Figure 12 Fiscal balances have improved strongly in recent months …
Figure 13 …as revenues have risen strongly reflecting broad based economic recovery
% of GDP* % of GDP* YTD percentage real change in revenues in March 2011 compared to March 2010
Note: *GDP interpolated using actual 2008, 2009 and 2010 GDP data ** Adjusted fiscal balance excludes net lending from expenditure, leaving current and capital expenditure only.
Sources: MoF, NSO, World Bank staff estimates
Total expenditures increased in real terms by 15 percent in March yoy. Capital expenditures were up by 66 percent, with spending on capital repairs increasing almost eightfold. The increase in investment was driven by political pressures ahead of the 2012 elections, and, according to some observers, an acceleration of projects by line ministries driven by the anticipated changes in a revised procurement law. The revised law would shift decision-making powers over local investment projects to local authorities away from line ministries.
7 A 68 percent tax applied to revenues from prices exceeding base prices of $2600/tonne for copper and $850/ounce for
gold.
-20
-15
-10
-5
0
5
10
25
30
35
40
45
50
Mar-08 Sep-08 Mar-09 Sep-09 Mar-10 Sep-10 Mar-11
Revenue & grantsTotal expenditure and net lendingTotal expenditureFiscal balance (right axis)Adjusted fiscal balance** (right axis)
-100
0
100
200
300
Tax revenu
e
Co
rpo
rate inco
me tax
Wages &
salaries
WP
T
Social sec. co
nt'n
s
VA
T
Excise taxes
Imp
ort d
uties
Ro
yalty
No
n-tax reven
ues
Mar-10 Mar-11

Mongolia Quarterly Update 2011
13
Current transfers went up by 47 percent, as a result of the cash distribution to each citizen (MNT 21,000) out of the Human Development Fund (MNT 160.5 bln) and tuition fee support to students (41.3 bln MNT). Finally, wages and salaries rise by 25 percent in real terms yoy). Current transfers and wages and salaries amounted to over 60 percent of the total expenditure in March. Spending categories that went down included net lending (by 93 percent) and subsidies (28 percent).
However, the financing of the 2011 budget could crowd out the private sector
The 2011 Budget of Mongolia envisages a steep increase in government spending by 35 percent to an unprecedented MNT 779 billion or over 52 percent of GDP (Figures). While the inflationary pressures from the expenditure side remain, a one-off upward revision of the GDP figures (based on new benchmarking using 2005 data), combined with a revision of the revenue numbers could, ceteris paribus, result in a smaller fiscal deficit than the 9.9 percent which was assumed in the 2011 Budget. In the last Article IV assessment, the IMF forecast the budget deficit for 2011 to be 3.5 percent of GDP. Below, we will use the IMF forecast to discuss the financing of the deficit.
In absolute numbers, according to the IMF, the budget shortfall for 2011 would then be around MNT 500 billion, or about US$ 400 million. At the moment, there are no concrete plans to issue foreign currency denominated debt in 2011, but the government expects some financing (around 0.8 percent of GDP) to be available from multilateral and bilateral donors. In addition, it projects to earn privatization income of around 1.5 percent of GDP (MNT 115 billion), including proceeds from the privatization of the State Bank. The bulk of the financing would depend on prepayments from the TT project currently under negotiation. However, some industry analysts raise questions about the willingness by bidding firms to commit to large prepayments at this point, as a number of key variables of the TT project will need to be clarified further (See Box 1).
If these prepayments do not materialize during 2011, the fiscal deficit would need to be financed almost in its entirety by the domestic market. The exact amount will depend on whether tax revenues continue to be buoyant, and whether or not parliament makes further amendments to the budget, further increasing spending to make good on political promises ahead of the 2012 elections. However, domestic borrowing by government implies a crowding out of the private sector during a period of rapid economic expansion when access to bank credit would be essential to finance the scaling-up of business operations.
Issuing a foreign bond would be expensive. It would also unnecessarily bring in even more capital into the economy during this boom period, when the economy already shows signs of overheating.
Figure 14 Current transfers and wages and salaries constitute bulk of the expenditure
% of total expenditure
Sources: MoF, World Bank staff estimates.
Wages & salaries,
23.1
Goods & services,
14.5
Subsidies, 2.8
Current transfers,
39.6
Capital expenditu
re, 9.0
Other, 10.0

Mongolia Quarterly Update 2011
14
Sovereign bonds’ yields are soaring for several Eurozone countries, and combined with other international developments, capital is shifting to safer markets. For a first time borrower like Mongolia, raising money through a sovereign bond issue would therefore be expensive. For instance, Greek 10 year bond yields increased from 11.2 percent in November 2010 to 15.7 percent in early May 2011. Venezuela (which has a similar credit rating to Mongolia) was at 12.26 percent in early May 2011. However, Chile, like Mongolia a major copper producer, is able to float a 10-year bond at only 1.31 percent, due to the consistent implementation of its structurally balanced budget.
Figure 15 Headline budget numbers as percent of GDP
Figure 16 Overall balances in absolute terms
percent of GDP percent of GDP MNT billion MNT billion
Source: World Bank, Budget document.* Using NSO’s updated GDP estimates
Source: World Bank, Budget document
Box 1 Tavan Tolgoi Financing Agreements
Tavan Tolgoi, a vast coal deposit in the Gobi desert, is arguably the second largest coal field in the world with an estimated total of 6.5 billion tonnes of reserves of both coking and thermal coal. The deposit is owned by the state-owned Erdenes TT LLC, a new company set up in December 2010 with ambitions of being listed on the Hong Kong or London Stock exchanges by the end of 2011, with a cross-listing in Mongolia. Investment banks have exhibited great enthusiasm to be commissioned to manage the floatation of this new company.
Erdenes TT will be the first direct offshore listing of any state owned company by the Mongolian government. The state intends to retain 51 percent of the company and divest 29 percent to international investors. Mongolian investors will be able to buy another 10 percent (at a discounted price) and the remaining 10 percent will be distributed to Mongolian citizens as part of the wealth distribution arrangements under the Human Development Fund (HDF).
The Tavan Tolgoi deposit is divided into East Tsankhi and West Tsankhi blocks with separate governance structures proposed by the company. The Eastern Block will be owned and operated by Erdenes TT. The company is currently in the process of hiring a mining contracting firm to continue the waste rock stripping of the block. To make the
0.0
-9.9
37.3
52.1
35.4
40.4-5.0
-12
-8
-4
0
4
25
30
35
40
45
50
55
20
03
20
04
20
05
20
06
20
07
20
08
20
09
20
10
20
11
ap
pro
ved
overall balance, RHSrevenuesexpenditurerevenues MTBF*expenditure MTBF*overall balance MTBF, RHS*
-462
-671-779
-1000
-800
-600
-400
-200
0
200
0
500
1000
1500
2000
2500
3000
3500
4000
4500
20
03
20
04
20
05
20
06
20
07
20
08
20
09
20
10
20
11
pla
nn
ed
20
11
ap
pro
ved
overall balance, RHS
revenues
expenditure
Mongolia Quarterly Update 2011
15
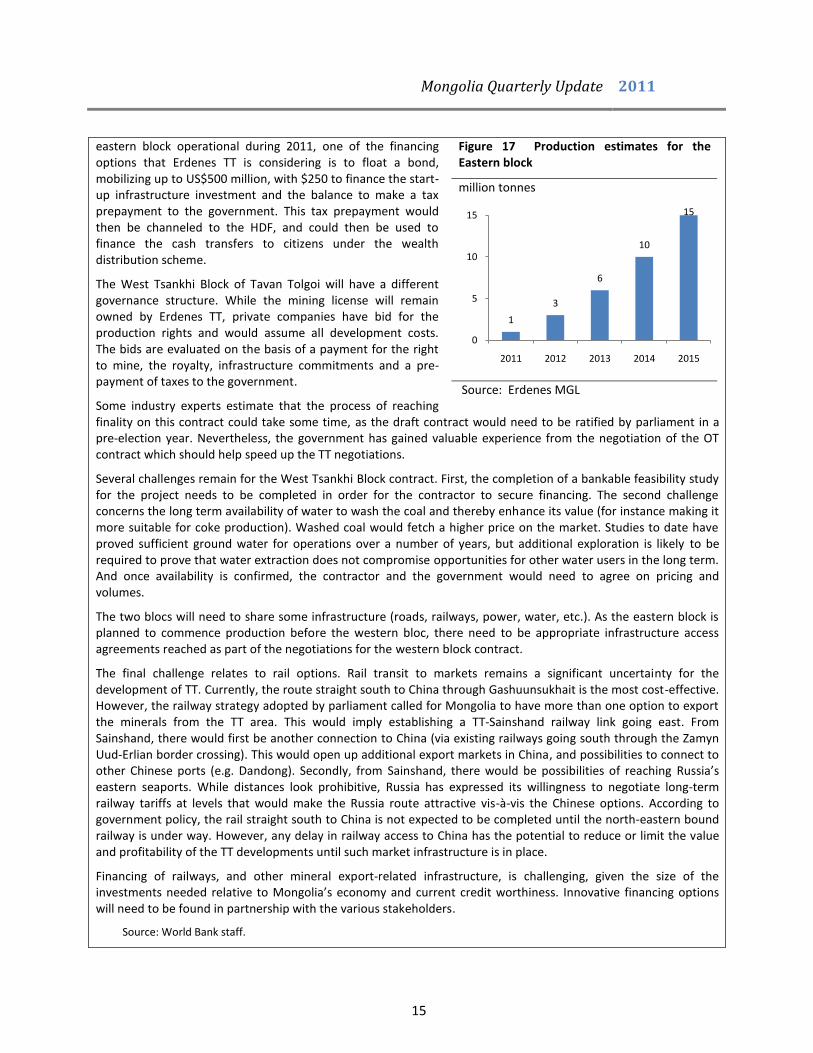
eastern block operational during 2011, one of the financing options that Erdenes TT is considering is to float a bond, mobilizing up to US$500 million, with $250 to finance the start-up infrastructure investment and the balance to make a tax prepayment to the government. This tax prepayment would then be channeled to the HDF, and could then be used to finance the cash transfers to citizens under the wealth distribution scheme.
The West Tsankhi Block of Tavan Tolgoi will have a different governance structure. While the mining license will remain owned by Erdenes TT, private companies have bid for the production rights and would assume all development costs. The bids are evaluated on the basis of a payment for the right to mine, the royalty, infrastructure commitments and a pre-payment of taxes to the government.
Some industry experts estimate that the process of reaching finality on this contract could take some time, as the draft contract would need to be ratified by parliament in a pre-election year. Nevertheless, the government has gained valuable experience from the negotiation of the OT contract which should help speed up the TT negotiations.
Several challenges remain for the West Tsankhi Block contract. First, the completion of a bankable feasibility study for the project needs to be completed in order for the contractor to secure financing. The second challenge concerns the long term availability of water to wash the coal and thereby enhance its value (for instance making it more suitable for coke production). Washed coal would fetch a higher price on the market. Studies to date have proved sufficient ground water for operations over a number of years, but additional exploration is likely to be required to prove that water extraction does not compromise opportunities for other water users in the long term. And once availability is confirmed, the contractor and the government would need to agree on pricing and volumes.
The two blocs will need to share some infrastructure (roads, railways, power, water, etc.). As the eastern block is planned to commence production before the western bloc, there need to be appropriate infrastructure access agreements reached as part of the negotiations for the western block contract.
The final challenge relates to rail options. Rail transit to markets remains a significant uncertainty for the development of TT. Currently, the route straight south to China through Gashuunsukhait is the most cost-effective. However, the railway strategy adopted by parliament called for Mongolia to have more than one option to export the minerals from the TT area. This would imply establishing a TT-Sainshand railway link going east. From Sainshand, there would first be another connection to China (via existing railways going south through the Zamyn Uud-Erlian border crossing). This would open up additional export markets in China, and possibilities to connect to other Chinese ports (e.g. Dandong). Secondly, from Sainshand, there would be possibilities of reaching Russia’s eastern seaports. While distances look prohibitive, Russia has expressed its willingness to negotiate long-term railway tariffs at levels that would make the Russia route attractive vis-à-vis the Chinese options. According to government policy, the rail straight south to China is not expected to be completed until the north-eastern bound railway is under way. However, any delay in railway access to China has the potential to reduce or limit the value and profitability of the TT developments until such market infrastructure is in place.
Financing of railways, and other mineral export-related infrastructure, is challenging, given the size of the investments needed relative to Mongolia’s economy and current credit worthiness. Innovative financing options will need to be found in partnership with the various stakeholders.
Source: World Bank staff.
Figure 17 Production estimates for the Eastern block
million tonnes
Source: Erdenes MGL
1
3
6
10
15
0
5
10
15
2011 2012 2013 2014 2015
Mongolia Quarterly Update 2011
16
External sector
Imports increased to a record level as trade deficit continued to widen
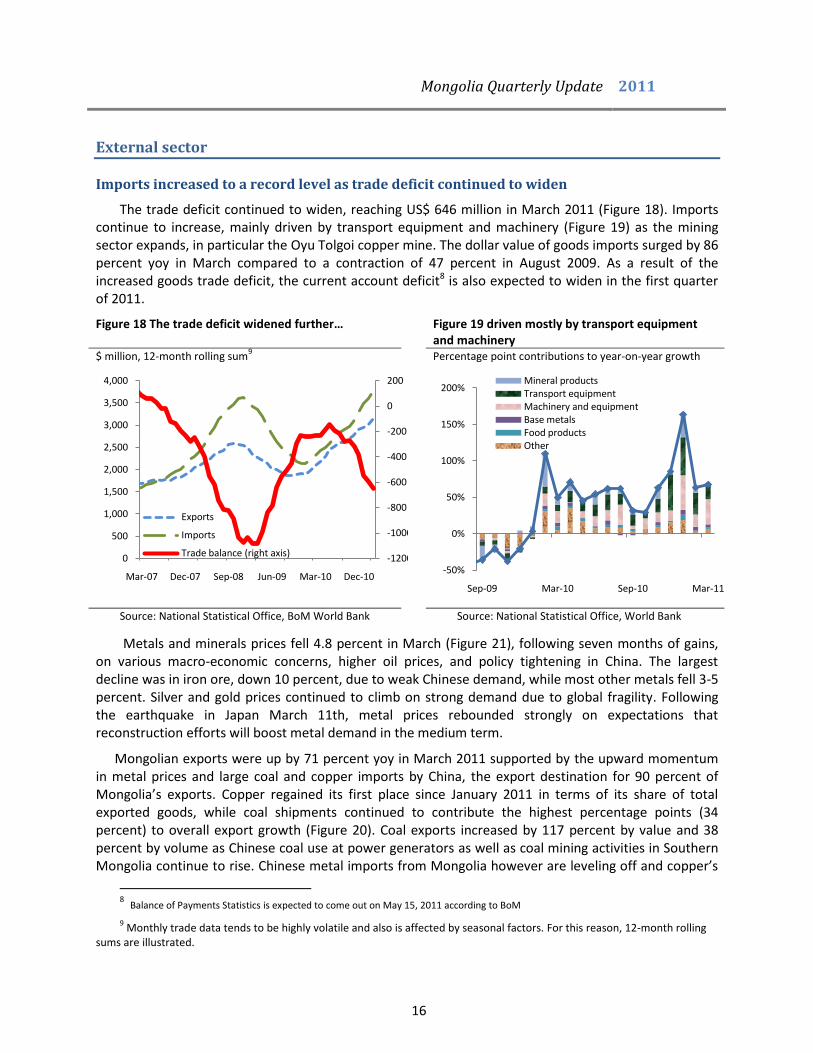
The trade deficit continued to widen, reaching US$ 646 million in March 2011 (Figure 18). Imports continue to increase, mainly driven by transport equipment and machinery (Figure 19) as the mining sector expands, in particular the Oyu Tolgoi copper mine. The dollar value of goods imports surged by 86 percent yoy in March compared to a contraction of 47 percent in August 2009. As a result of the increased goods trade deficit, the current account deficit8 is also expected to widen in the first quarter of 2011.
Figure 18 The trade deficit widened further… Figure 19 driven mostly by transport equipment and machinery
$ million, 12-month rolling sum9 Percentage point contributions to year-on-year growth
Source: National Statistical Office, BoM World Bank Source: National Statistical Office, World Bank
Metals and minerals prices fell 4.8 percent in March (Figure 21), following seven months of gains, on various macro-economic concerns, higher oil prices, and policy tightening in China. The largest decline was in iron ore, down 10 percent, due to weak Chinese demand, while most other metals fell 3-5 percent. Silver and gold prices continued to climb on strong demand due to global fragility. Following the earthquake in Japan March 11th, metal prices rebounded strongly on expectations that reconstruction efforts will boost metal demand in the medium term.
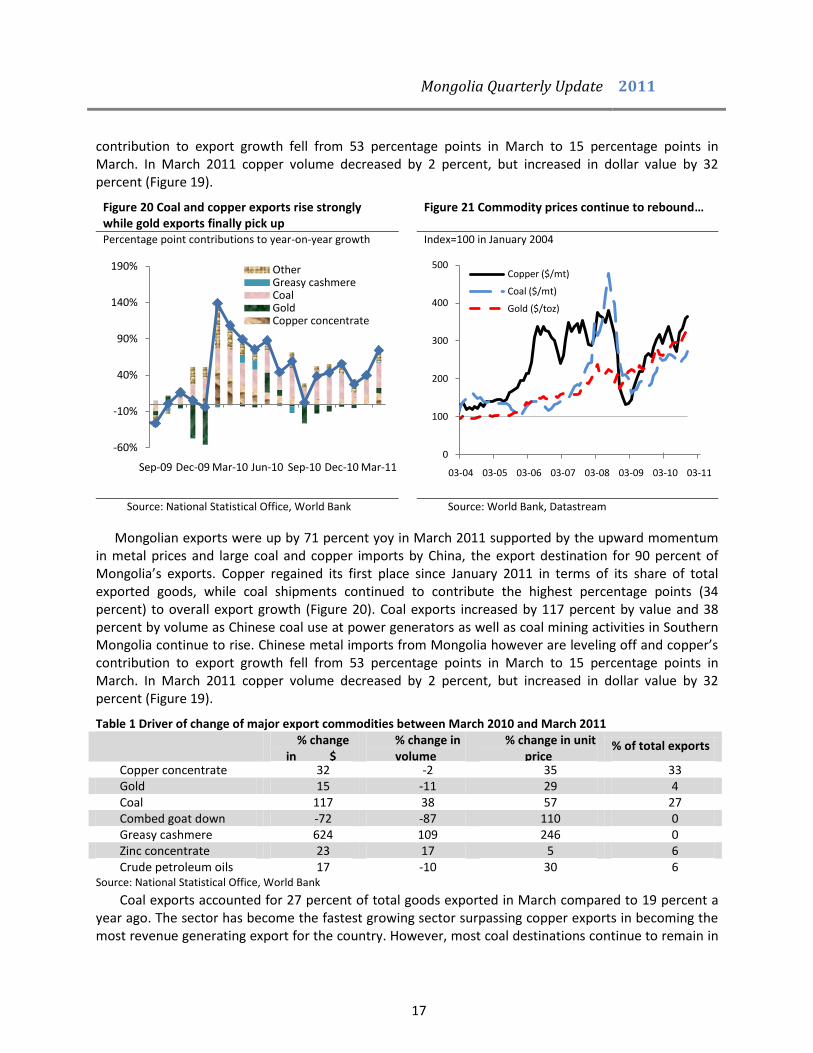
Mongolian exports were up by 71 percent yoy in March 2011 supported by the upward momentum in metal prices and large coal and copper imports by China, the export destination for 90 percent of Mongolia’s exports. Copper regained its first place since January 2011 in terms of its share of total exported goods, while coal shipments continued to contribute the highest percentage points (34 percent) to overall export growth (Figure 20). Coal exports increased by 117 percent by value and 38 percent by volume as Chinese coal use at power generators as well as coal mining activities in Southern Mongolia continue to rise. Chinese metal imports from Mongolia however are leveling off and copper’s
8 Balance of Payments Statistics is expected to come out on May 15, 2011 according to BoM
9 Monthly trade data tends to be highly volatile and also is affected by seasonal factors. For this reason, 12-month rolling
sums are illustrated.
-1200
-1000
-800
-600
-400
-200
0
200
0
500
1,000
1,500
2,000
2,500
3,000
3,500
4,000
Mar-07 Dec-07 Sep-08 Jun-09 Mar-10 Dec-10
Exports
Imports
Trade balance (right axis)
-50%
0%
50%
100%
150%
200%
Sep-09 Mar-10 Sep-10 Mar-11
Mineral productsTransport equipmentMachinery and equipmentBase metalsFood productsOther
Mongolia Quarterly Update 2011
17
contribution to export growth fell from 53 percentage points in March to 15 percentage points in March. In March 2011 copper volume decreased by 2 percent, but increased in dollar value by 32 percent (Figure 19).
Figure 20 Coal and copper exports rise strongly while gold exports finally pick up
Figure 21 Commodity prices continue to rebound…
Percentage point contributions to year-on-year growth Index=100 in January 2004
Source: National Statistical Office, World Bank Source: World Bank, Datastream
Mongolian exports were up by 71 percent yoy in March 2011 supported by the upward momentum in metal prices and large coal and copper imports by China, the export destination for 90 percent of Mongolia’s exports. Copper regained its first place since January 2011 in terms of its share of total exported goods, while coal shipments continued to contribute the highest percentage points (34 percent) to overall export growth (Figure 20). Coal exports increased by 117 percent by value and 38 percent by volume as Chinese coal use at power generators as well as coal mining activities in Southern Mongolia continue to rise. Chinese metal imports from Mongolia however are leveling off and copper’s contribution to export growth fell from 53 percentage points in March to 15 percentage points in March. In March 2011 copper volume decreased by 2 percent, but increased in dollar value by 32 percent (Figure 19).
Table 1 Driver of change of major export commodities between March 2010 and March 2011 % change
in $ value
% change in volume
% change in unit price
% of total exports
Copper concentrate 32 -2 35 33 Gold 15 -11 29 4 Coal 117 38 57 27 Combed goat down -72 -87 110 0 Greasy cashmere 624 109 246 0 Zinc concentrate 23 17 5 6 Crude petroleum oils 17 -10 30 6
Source: National Statistical Office, World Bank
Coal exports accounted for 27 percent of total goods exported in March compared to 19 percent a year ago. The sector has become the fastest growing sector surpassing copper exports in becoming the most revenue generating export for the country. However, most coal destinations continue to remain in
-60%
-10%
40%
90%
140%
190%
Sep-09 Dec-09 Mar-10 Jun-10 Sep-10 Dec-10 Mar-11
OtherGreasy cashmereCoalGoldCopper concentrate
0
100
200
300
400
500
03-04 03-05 03-06 03-07 03-08 03-09 03-10 03-11
Copper ($/mt)
Coal ($/mt)
Gold ($/toz)

Mongolia Quarterly Update 2011
18
China as the sector is still new and has not expanded geographically. Coal production doubled in the last 5 years and it is expected to grow even faster in the near future when large scare coal mining projects start production. China, the largest thermal coal consumer in the world, is the main market for coal as its domestic consumption totals 4 billion tonnes a year.
Gold and greasy cashmere exports finally picked up in March after a dismal year (Figure 20). Greasy cashmere export doubled its volume in March compared to the previous year gaining on a unit price increase (246 percent). However, exports of combed goat down remain depressed despite its unit price increase (110 percent). With the abolition of the Windfall Profit Tax (WPT) in January 2011, gold producers have started exporting without the 68 percent tax as seen in increased gold exports (15 percent) compared to a contraction of 47 percent in December 2010.
The exchange rate
In April 2011, the average monthly exchange rate against the US$ appreciated by about a percent, compared to the previous month, or 12 percent compared to April 2010 (Figure 22). However, May started with a depreciation of about 6 percent (to 1260 MNT per US$) compared to early April, when the togrog was at 1190 MNT per US$. In March, international reserves of the Bank of Mongolia leveled off at US$ 2,142 million as the Central Bank stopped intervening in the market (Figure 23).
Figure 22 The exchange depreciated at the start of May 2011
Figure 23 BoM international reserves are at record levels
MNT per US$ $ million, stock US$ million, mom change
Note: Parallel market rate is mid-point of bid and ask rates. Positive spread over official rate indicates relative depreciation. Ask-bid spread measured as percentage of mid-point of the two. Last observation: May 3, 2010.
Source: Mongolian Financial Association, World Bank.
Note: Number in box is end-March stock of BoM international reserves in US$ million.
Source: Bank of Mongolia, World Bank.
1100
1200
1300
1400
05/10 08/10 11/10 02/11 05/11
BoM official rate
Parallel market rate
Commercial bank rate
-200
-100
0
100
200
300
400
500
400
600
800
1,000
1,200
1,400
1,600
1,800
2,000
2,200
2,400
03/09 09/09 03/10 09/10 03/11
Stock of BoM international reserves
Month-on-month change (right axis)
2142

Mongolia Quarterly Update 2011
19
Banking sector
MNT deposits continue to rise fuelled by currency appreciation expectations and supported by the blanket deposit guarantee
The volume of MNT deposits hit a new peak of above MNT 2.3 trillion in March, up 70 percent from a year ago (Figure 24). This is mainly due to the combined effect of the public’s expectations of domestic currency appreciation and the “blanket guarantee law” covering bank deposits10 besides the post-crisis economic growth led by the mining sector. In addition, as inflation fell, real interest rates automatically improved and turned positive again (Figure 25). Deposits in foreign currency also hit a new peak of MNT 842 billion in February before falling to MNT 793 billion in March as depositors seem to slowly shift away from foreign currency deposits into domestic currency accounts in expectation of further currency appreciation. Nominal interest rates on US dollar deposits are very high by international standards with time deposits offering rates reaching above 14 percent, reflecting the continued perception of risk by the market.
Nominal interest rates on both lending and deposit rates seem to remain high mainly due to the search for funds by some banks facing liquidity difficulties. Given high deposit rates, real lending rates rose to about 16 percent in March.
Figure 24 MNT deposits reached a new peak in March while FX deposits withdrawn
Figure 25 Real economy-wide interest rates picked up as inflation moderated
MNT billion, month-on-month change MNT billion, stock Percent (annual rate)
Source: BoM, World Bank Source: BoM, National Statistical Office, World Bank.
10
Out of the total banking sector liabilities of MNT 6.3 trillion around MNT 4.5 trillion are comprised of deposits and current accounts for which the government has issued a blanket guarantee. This creates an uneven playing field in the sector, with weaker, undercapitalized banks being able to compete for deposits with well managed and capitalized banks. The work on new, limited deposit insurance scheme is currently underway.
0
500
1,000
1,500
2,000
2,500
3,000
3,500
-200
-100
0
100
200
300
400
09/08 02/09 07/09 12/09 05/10 10/10 03/11
FX deposits, stock RHS
MNT deposits, stock RHS
FX deposits, change
MNT deposits, change
-20
-10
0
10
20
30
40
Sep-08 Mar-09 Sep-09 Mar-10 Sep-10 Mar-11
CPI inflationReal maximum interest rate on LC time depositsReal average interest rate on LC time depositsReal interest rate on bank LC loans

Mongolia Quarterly Update 2011
20
Private external borrowing and private lending increasing fast
The stock of loans outstanding has been growing since December 2009, rising by a nominal 35 percent yoy in March 2011 (Figure 26) or 29 percent in real terms. With credit growing as fast as we have seen prior to the last crisis, it is critical that the BOM ensures full compliance of Mongolian banks with current prudential norms, particularly with respect to having adequate capital buffers to absorb the losses from current and possible future NPLs (non-performing loans)11. The domestic weighted average lending rate ranges between 18-21 percent, higher than the Central Bank bill rate (11 percent). Banks continued to buy Central Bank bills to a record high level of MNT 1,335 billion (Figure 27) in February but purchases fell in March because of a shift to private lending as real lending rates offer a higher profit margin.
External borrowing by the private sector (including commercial banks) increased by 66 percent in Q4 of 2010 compared to the previous quarter12. Together with commercial banks, firms have borrowed 50 percent of the country’s gross external debt, taking advantage of the large spreads between external and local borrowing rates. These trends warrant close monitoring by the Central Bank.
Figure 26 Credit growth picking up… Figure 27 …while purchases of Central Bank bills retrieves from another peak
MNT billion % year-on-year change MNT billion
Source: Bank of Mongolia, World Bank. Source: Bank of Mongolia, World Bank
NPL ratio declined as total loans expanded, but NPL volume continued to increase
The steady increase in recorded NPLs seen in 2009 appears has now reversed. However, solvency concerns remain for a number of medium-sized and small banks. Loans in arrears declined to MNT 81 billion from MNT 90 billion in December. The ratio of NPLs and loans in arrears to total outstanding loans now stands at 13 percent in March. This is an improvement from a peak of 24.6 percent in November 2009 (Figure 28). However, as total outstanding loans are increasing fast, NPL ratios hide the fact that the NPLs in terms of absolute volume terms continued to slowly increase (up by 3.4 percent between February and March). Excluding the two failed banks, whose NPLs largely remain unresolved, NPLs increased from MNT 189 billion in February to MNT 204 billion, up 8 percent in March. Meanwhile,
11
According to the bank loan classification regulation, loans with principal in arrears mechanically become NPLs after 90
days.
12 Bank of Mongolia. Gross External Debt Position 2010.
-10
0
10
20
30
40
50
60
70
80
0
500
1,000
1,500
2,000
2,500
3,000
3,500
4,000
Jun-07 Mar-08 Dec-08 Sep-09 Jun-10 Mar-11
Total loans outstandingAnnual growth %, RHS
0
200
400
600
800
1,000
1,200
1,400
1,600
03/09 07/09 11/09 03/10 07/10 11/10 03/11
Short-term bills
Claims on Government
Bills of exchange & Promissory notes
Mongolia Quarterly Update 2011
21
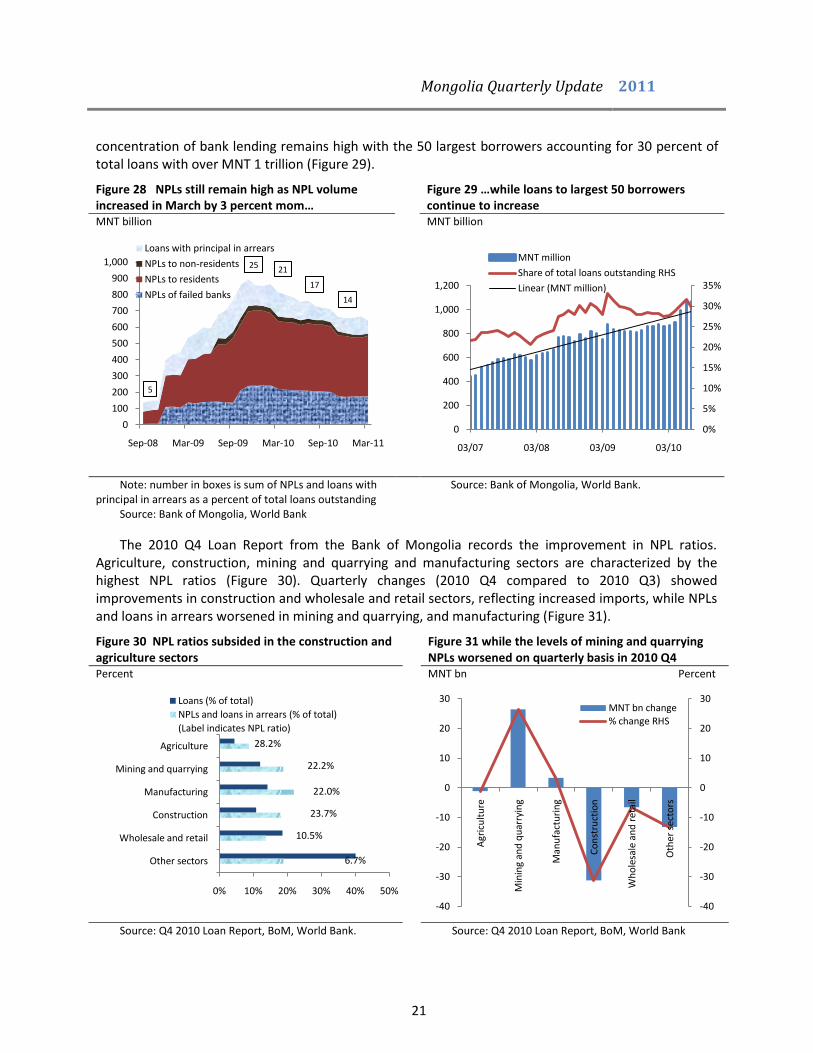
concentration of bank lending remains high with the 50 largest borrowers accounting for 30 percent of total loans with over MNT 1 trillion (Figure 29).
Figure 28 NPLs still remain high as NPL volume increased in March by 3 percent mom…
Figure 29 …while loans to largest 50 borrowers continue to increase
MNT billion MNT billion
Note: number in boxes is sum of NPLs and loans with principal in arrears as a percent of total loans outstanding
Source: Bank of Mongolia, World Bank
Source: Bank of Mongolia, World Bank.
The 2010 Q4 Loan Report from the Bank of Mongolia records the improvement in NPL ratios. Agriculture, construction, mining and quarrying and manufacturing sectors are characterized by the highest NPL ratios (Figure 30). Quarterly changes (2010 Q4 compared to 2010 Q3) showed improvements in construction and wholesale and retail sectors, reflecting increased imports, while NPLs and loans in arrears worsened in mining and quarrying, and manufacturing (Figure 31).
Figure 30 NPL ratios subsided in the construction and agriculture sectors
Figure 31 while the levels of mining and quarrying NPLs worsened on quarterly basis in 2010 Q4
Percent MNT bn Percent
Source: Q4 2010 Loan Report, BoM, World Bank. Source: Q4 2010 Loan Report, BoM, World Bank
5
25 21
17
14
0
100
200
300
400
500
600
700
800
900
1,000
Sep-08 Mar-09 Sep-09 Mar-10 Sep-10 Mar-11
Loans with principal in arrears
NPLs to non-residents
NPLs to residents
NPLs of failed banks
0%
5%
10%
15%
20%
25%
30%
35%
0
200
400
600
800
1,000
1,200
03/07 03/08 03/09 03/10
MNT million
Share of total loans outstanding RHS
Linear (MNT million)
28.2%
22.2%
22.0%
23.7%
10.5%
6.7%
0% 10% 20% 30% 40% 50%
Agriculture
Mining and quarrying
Manufacturing
Construction
Wholesale and retail
Other sectors
Loans (% of total)
NPLs and loans in arrears (% of total)
(Label indicates NPL ratio)
-40
-30
-20
-10
0
10
20
30
-40
-30
-20
-10
0
10
20
30
Agr
icu
ltu
re
Min
ing
and
qu
arry
ing
Man
ufa
ctu
rin
g
Co
nst
ruct
ion
Wh
ole
sale
an
d r
etai
l
Oth
er s
ecto
rs
MNT bn change% change RHS
Mongolia Quarterly Update 2011
22
Capital markets
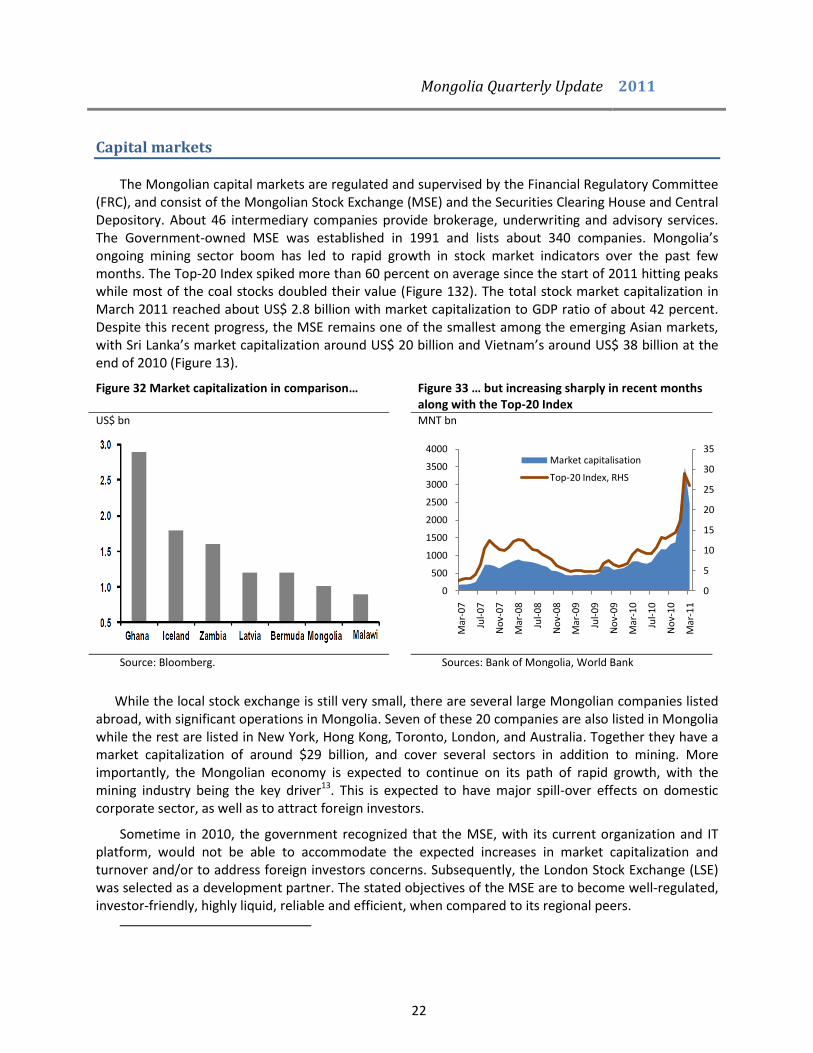
The Mongolian capital markets are regulated and supervised by the Financial Regulatory Committee (FRC), and consist of the Mongolian Stock Exchange (MSE) and the Securities Clearing House and Central Depository. About 46 intermediary companies provide brokerage, underwriting and advisory services. The Government-owned MSE was established in 1991 and lists about 340 companies. Mongolia’s ongoing mining sector boom has led to rapid growth in stock market indicators over the past few months. The Top-20 Index spiked more than 60 percent on average since the start of 2011 hitting peaks while most of the coal stocks doubled their value (Figure 132). The total stock market capitalization in March 2011 reached about US$ 2.8 billion with market capitalization to GDP ratio of about 42 percent. Despite this recent progress, the MSE remains one of the smallest among the emerging Asian markets, with Sri Lanka’s market capitalization around US$ 20 billion and Vietnam’s around US$ 38 billion at the end of 2010 (Figure 13).
Figure 32 Market capitalization in comparison… Figure 33 … but increasing sharply in recent months along with the Top-20 Index
US$ bn MNT bn
Source: Bloomberg. Sources: Bank of Mongolia, World Bank
While the local stock exchange is still very small, there are several large Mongolian companies listed abroad, with significant operations in Mongolia. Seven of these 20 companies are also listed in Mongolia while the rest are listed in New York, Hong Kong, Toronto, London, and Australia. Together they have a market capitalization of around $29 billion, and cover several sectors in addition to mining. More importantly, the Mongolian economy is expected to continue on its path of rapid growth, with the mining industry being the key driver13. This is expected to have major spill-over effects on domestic corporate sector, as well as to attract foreign investors.
Sometime in 2010, the government recognized that the MSE, with its current organization and IT platform, would not be able to accommodate the expected increases in market capitalization and turnover and/or to address foreign investors concerns. Subsequently, the London Stock Exchange (LSE) was selected as a development partner. The stated objectives of the MSE are to become well-regulated, investor-friendly, highly liquid, reliable and efficient, when compared to its regional peers.
0
5
10
15
20
25
30
35
0
500
1000
1500
2000
2500
3000
3500
4000M
ar-0
7
Jul-
07
No
v-0
7
Mar
-08
Jul-
08
No
v-0
8
Mar
-09
Jul-
09
No
v-0
9
Mar
-10
Jul-
10
No
v-1
0
Mar
-11
Market capitalisation
Top-20 Index, RHS

Mongolia Quarterly Update 2011
23
The MSE’s Board of Directors was changed and now includes experts and independent representation. A team from the LSE was selected to manage the MSE and to oversee implementation of the new IT platform for the trading floor, for settlement and clearing processes and for the depository. This platform will be similar to the one used by the LSE. Also planned are further improvements in governance structure, adjustments to the legal and regulatory framework, development of proper procedures that will support investors’ confidence, improved quality of the MSE’s human resources, major training and investor education campaigns and so forth. As more companies become listed in the local stock exchange, it is essential to develop an effective regulatory framework for protecting investors, ensuring fair access to market facilities, transparent information sharing, and sound management and oversight of financial intermediaries. The MSE is actively searching for partners for this exercise, including IFIs.
Mongolia's economy will undergo a structural transformation over the next few years as major mining projects come on-stream. Financial deepening is therefore high on the agenda, including the development of local bond markets, for companies and the government alike to tap into long term sources of financing. A deep and liquid domestic bond market also helps the monetary authorities’ impact long term interest rates in the economy (through the development of a yield curve). Once improvements in the MSE’s institutional and operational capacity are well under way, the focus will shift to bond markets and the Securities Clearing House.
Economic outlook
Mongolia’s medium-term prospects look excellent, both from an economic growth perspective as well as from a fiscal management perspective. The landmark fiscal legislation under the Fiscal Stability Law locks in strong counter-cyclical policies. These counter-cyclical fiscal policies are a key instrument to combat the “Dutch Disease” (Box 2).
Box 2: What is Dutch Disease?
Resource rich countries grow, on average, at a lower rate than their counterparts with fewer natural resources. This has been called the natural resource curse, and the literature suggests that countries under the curse, on average, experience a lower quality of political and economic institutions. The Dutch Disease is the macroeconomic part of the curse.
The term Dutch Disease comes from The Netherland’s experience with discovering vast reserves of natural gas in the 1960s. In general, when natural resources are discovered, foreign currency flows into the economy in exchange
Figure 34 Listed companies by sectors
% of total companies listed
Source: Mongolian Stock Exchange
28%
19%
20%
26%
17%
Mining
Manufacturing
Agriculture
Construction
Trade and Services

Mongolia Quarterly Update 2011
24
for these resources, driving up the nominal exchange rate, or the price of non-tradable goods and services (including wages, which are prices paid for labor) relative to traded goods and services. As a result there is a real appreciation in the currency. Labor and capital shift towards the non-traded sector in response to higher factor prices. And appreciating currency and high input costs cause the export and import competing sectors to decline in terms of competitiveness. In the Netherlands, the high oil (and natural gas) price shocks of 1973 and 1979 resulted in sharply higher wages, which undermined the competitiveness of the traditional export sectors, squeezing their profitability. The income share of capital fell from around 17 percent in 1970 to less than 6 percent by 1980 with the enterprise sector barely profitable according to some estimates. Average annual growth in the manufacturing sector, for example, fell from 4.2 percent in 1970-74 to 0.7 percent in the following half of the decade.
The real appreciation of the currency is one part of the Dutch Disease, the other being a ballooning government budget, as politicians usually cannot refrain from spending the high mineral revenues immediately, or from borrowing against future revenues. Excessive government expenditures also push inflation higher, further exacerbating high non-traded input prices. In the Netherlands, the excessive spending included generous unemployment benefits and other cash transfers for poorly conceived social programs. The country started functioning as a ‘welfare state’ with citizens receiving lifelong hand outs from the government, which financed these buy borrowing against future gas revenues. Public expenditure rose from 45 percent GDP in 1970 to 66 percent in 1982, mostly because of transfers and social welfare payments to households. Public sector employment increased by 25 percent in the 1970s, while private sector employment shrunk by 5 percent. The government also introduced the automatic adjustment of wages to inflation. This policy further contributed to making exports uncompetitive, overheating the economy, and setting off an upward wage price spiral and a housing boom which, when it went bust, contributed to a severe downturn in the 1980s.
The Netherlands embarked on a slow and painful process of structural reforms, fiscal consolidation, social security reform and labor market reform, including voluntary restraints in wage increases as well as the removal of barriers to temporary work, and the economy emerged, fully recovered but significantly restructured. The crux of this recovery was the tripartite pact between government, labor unions and firms. The essence of the agreement to lock in conservative fiscal policies and labor market flexibility forms the basis of the Polder Model, a model that is considered “best practice” in Europe and one that proved its resilience during the 2008 crisis.
Mongolia is a country with good economic and political institutions; a resource discovery is not likely to lead to resource capture by exploitative elites, but used to improve national welfare. The main challenge facing Mongolia is proper macroeconomic management so it does not go the way of The Netherlands in the 1970s. Recently, parliament passed the Fiscal Stability Law (FSL) with an overwhelming majority that requires limits on (i) the structural fiscal deficit (deficit correcting for volatility in the copper price), which has to be at or below 2% of GDP (ii) expenditure increases (iii) the public debt. The essence of the FSL, the 2% deficit limit, comes into force only in 2011, and Mongolia would do well to heed the lessons of Holland and stay clear of Dutch Disease, following instead a Polder Model type path.
Source: World Bank staff.
However, the core of the FSL—the structural balance of minus 2 percent of GDP—only starts in
2013. Hence, until its effective implementation risks exist. These risks are best illustrated by a comparison of current trends with the ones that prevailed before the 2008 crisis. These comparisons highlight significant similarities, and send a warning about the risks of returning to the boom-bust cycle, if no corrective policy action is taken in anticipation of an external shock (Box 3).
In addition, the global environment is at best described as fragile and significant risks exist. Global macroeconomic uncertainty is caused by the Eurozone debt crisis, the US housing market slump, political uncertainly in the Middle East and North Africa, and the devastating earthquake in Japan. The effect of Japan’s earthquake on Mongolia is discussed in (Box 4).

Mongolia Quarterly Update 2011
25
Box 3: Back to the future?
Budget balance, 2004-2008 Budget balance 2009-2011
% of GDP % of GDP
CPI inflation, 2007-2008 CPI inflation, 2009-2011
% year-on-year change % year-on-year change
Current account, 2006-2008 Current account, 2008-2010
% of GDP % of GDP
-15
-10
-5
0
5
10
15
2004 2005 2006 2007 2008
Mining-related revenue*Budget balanceNon-mining balance*Poly. (Budget balance)
-15
-10
-5
0
5
10
15
2009 2010 2011*
Mining-related revenue*Budget balanceNon-mining balance*Poly. (Budget balance)
0
5
10
15
20
25
30
35
01/07 04/07 07/07 10/07 01/08 04/08 07/08
Energy and fuelsMeat, milk and cheeseCore inflationCPI inflationCPI inflation (National)
-5
0
5
10
15
09/09 01/10 05/10 09/10 01/11
Energy and fuelsMeat, milk and cheeseCore inflationCPI inflationCPI inflation (National)
-1200
-1000
-800
-600
-400
-200
0
200
400
600
Q3-06 Q1-07 Q3-07 Q1-08 Q3-08 Q1-09
Merchandise trade balance
Services balance
Net income
Current transfers
Current account balance
-1200
-1000
-800
-600
-400
-200
0
200
Q4-08 Q1-09 Q2-09 Q3-09 Q4-09 Q1-10 Q2-10 Q3-10 Q4-10
Merchandise trade balance
Services balance
Net income
Current transfers
Current account balance

Mongolia Quarterly Update 2011
26
Real interest rates, 2007-2008 Real interest rates, 2009-20011
% annual % annual
Non-performing loans, 2009-2011 Credit growth, 2006-2011
MNT billion % year-on-year change
Source: BoM, MoF, NSO and WB staff estimates
Box 4: Impact of Japan’s Earthquake on Mongolia
The earthquake that hit Japan on March 11, of a record 9.0 magnitude, will have an impact on the economies not only of Japan but the entire Asia Pacific region, including Mongolia. This impact is likely to occur through the trade channel and possibly through the shifting of production to East Asia.
The impact on Mongolia is likely to be felt through indirect routes, especially via China, rather than directly. Japan accounts for less that 1 per cent of Mongolia’s exports and approximately 5 per cent of its imports. With regard to the short term impact, three nuclear reactors and ten coal fired reactors across Japan have been turned off, resulting in a substantial loss of baseline capacity and rolling blackouts through most of the country, including Tokyo. Together with the destruction of infrastructure (roads and electricity networks along the eastern coast), this has meant that Japanese exports to China have been impacted. Approximately 20 per cent
14 of Japan’s
14
Manufactured goods from Japan account for 30 percent of global exports of such items and machinery and transport equipment for
roughly half. Source: WITS database, World Bank
-20
0
20
40
Oct-07 Jan-08 Apr-08 Jul-08 Oct-08 Jan-09
CPI inflationReal maximum interest rate on LC time depositsReal average interest rate on LC time depositsReal interest rate on bank LC loans
-5
15
35
Oct-09 Jan-10 Apr-10 Jul-10 Oct-10 Jan-11
CPI inflationReal maximum interest rate on LC time depositsReal average interest rate on LC time depositsReal interest rate on bank LC loans
5
25 21
17
14
0
100
200
300
400
500
600
700
800
900
1,000
Sep-08 Mar-09 Sep-09 Mar-10 Sep-10 Mar-11
Loans with principal in arrears
NPLs to non-residents
NPLs to residents
NPLs of failed banks
-20
0
20
40
60
80
100
120
Mar-06 Mar-07 Mar-08 Mar-09 Mar-10 Mar-11
Total
Private
Individuals
Mongolia Quarterly Update 2011
27
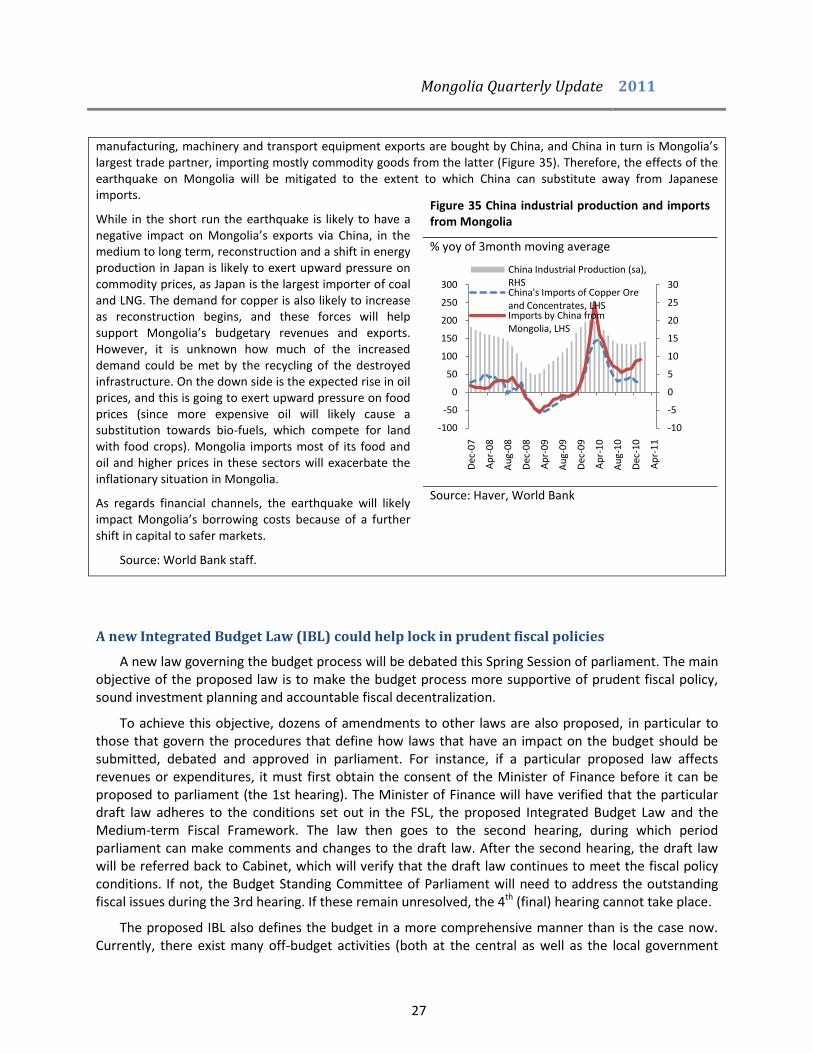
manufacturing, machinery and transport equipment exports are bought by China, and China in turn is Mongolia’s largest trade partner, importing mostly commodity goods from the latter (Figure 35). Therefore, the effects of the earthquake on Mongolia will be mitigated to the extent to which China can substitute away from Japanese imports.
While in the short run the earthquake is likely to have a negative impact on Mongolia’s exports via China, in the medium to long term, reconstruction and a shift in energy production in Japan is likely to exert upward pressure on commodity prices, as Japan is the largest importer of coal and LNG. The demand for copper is also likely to increase as reconstruction begins, and these forces will help support Mongolia’s budgetary revenues and exports. However, it is unknown how much of the increased demand could be met by the recycling of the destroyed infrastructure. On the down side is the expected rise in oil prices, and this is going to exert upward pressure on food prices (since more expensive oil will likely cause a substitution towards bio-fuels, which compete for land with food crops). Mongolia imports most of its food and oil and higher prices in these sectors will exacerbate the inflationary situation in Mongolia.
As regards financial channels, the earthquake will likely impact Mongolia’s borrowing costs because of a further shift in capital to safer markets.
Source: World Bank staff.
Figure 35 China industrial production and imports from Mongolia
% yoy of 3month moving average
Source: Haver, World Bank
A new Integrated Budget Law (IBL) could help lock in prudent fiscal policies
A new law governing the budget process will be debated this Spring Session of parliament. The main objective of the proposed law is to make the budget process more supportive of prudent fiscal policy, sound investment planning and accountable fiscal decentralization.
To achieve this objective, dozens of amendments to other laws are also proposed, in particular to those that govern the procedures that define how laws that have an impact on the budget should be submitted, debated and approved in parliament. For instance, if a particular proposed law affects revenues or expenditures, it must first obtain the consent of the Minister of Finance before it can be proposed to parliament (the 1st hearing). The Minister of Finance will have verified that the particular draft law adheres to the conditions set out in the FSL, the proposed Integrated Budget Law and the Medium-term Fiscal Framework. The law then goes to the second hearing, during which period parliament can make comments and changes to the draft law. After the second hearing, the draft law will be referred back to Cabinet, which will verify that the draft law continues to meet the fiscal policy conditions. If not, the Budget Standing Committee of Parliament will need to address the outstanding fiscal issues during the 3rd hearing. If these remain unresolved, the 4th (final) hearing cannot take place.
The proposed IBL also defines the budget in a more comprehensive manner than is the case now. Currently, there exist many off-budget activities (both at the central as well as the local government
-10
-5
0
5
10
15
20
25
30
-100
-50
0
50
100
150
200
250
300
Dec
-07
Ap
r-0
8
Au
g-0
8
Dec
-08
Ap
r-0
9
Au
g-0
9
Dec
-09
Ap
r-1
0
Au
g-1
0
Dec
-10
Ap
r-1
1
China Industrial Production (sa), RHSChina's Imports of Copper Ore and Concentrates, LHSImports by China from Mongolia, LHS

Mongolia Quarterly Update 2011
28
level), hidden liabilities, and laws that imply the use of fiscal resources without these having been secured in the budget. The new law defines the budget as encompassing all the state’s financial resources and responsibilities, outcomes and inputs, spending limits for each tier of government, and changes in the state’s assets and liabilities. This covers all government guarantees, loans and all types of financial obligations which are secured by budget revenues or financed from future revenues, including all contingent liabilities also. While special funds can be used to undertake certain development activities, the new IBL brings all these currently off-budget special funds into the budget.
The IBL ensures that the budget will be unified, comprising the state budget, all local budgets, the budget of the Social Insurance Fund and the Human Development Fund. The management of state property and assets is also brought under the authority of the Ministry of Finance, as the ultimate budget governor. Amending the budget will be made more difficult. An amendment will only be submitted if, due to unforeseen circumstances, the unified budget deficit is increased by 3 percent of GDP. At the same time, the unallocated portion of the budget is increased to 1 percent of GDP.
The idea that the budget should look beyond the short horizon of the coming financial year is further amplified by the condition that activities, or financial transactions, and their outcomes should not create inequality between current and future generations. This is in reference to the temptation to “mortgage” future mining revenues by current generations at the expense of future generations.
Additionally, under the IBL, public investment planning and budgeting is tightened considerably. Proposed investment will need to have been explicitly derived from the sector’s existing development strategy and planning documents. Furthermore, before a project is submitted to the budget, a feasibility study needs to have been conducted to demonstrate the economic and social benefits. For investments larger than MTN 30 billion, the NDIC will have had to have reviewed this feasibility study.
The IBL gives a detailed list of the functions and responsibilities of the aimag and soum tiers of government. To avoid local governments formulating budgets which would be inconsistent with the limits set for the unified budget, ceilings are set by each budget governor in line with the Medium Term Fiscal Framework. The budget will now also contain qualitative and quantitative performance indicators for which the budget governor will be held accountable, as part of a separate performance agreement. He will need to report on these in his budget execution report. This gives the public the opportunity to hold their government accountable based on their own performance measures.

Mongolia Quarterly Update 2011
29
Table 2 Mongolia: Key Indicators 2003 2004 2005 2006 2007 2008 2009 2010
Output, Employment and Prices
Real GDP (% yoy change) 7 10.6 7.3 8.6 10.2 8.9 -1.3 6.1p
Industrial production index .. .. .. 100 110.4 113.4 109.6 120.5
(% yoy change) .. .. .. .. 10.4 2.8 -3.3 10.0
Unemployment (%, eop) 3.4 3.6 3.3 3.2 2.8 2.8 3.3 3.3
CPI Ulaanbaatar (% yoy change, eop) 4.6 10.9 9.6 5.9 14.1 23.2 1.9 14.3
Public Sector
Government balance (% of GDP) -3.7 -1.8 2.6 3.3 2.8 -4.8 -5.7 0.0*
Non-mining balance (% of GDP)(1) -5.9 -5.8 -1.3 -7.3 -13.4 -15.1 -13.3 -10.1*
Public Sector Debt (% of GDP) (2) 88.0 73.7 59.7 44.3 39.4 33.8 56.4 62.7
Foreign Trade, BOP and External
Trade balance ($ mn) -199.6 -99.2 -99.5 136.2 -52.4 -613 -195 -378p
Exports of goods ($ mn) 627 872 1066 1542 1889 2534 1885 2899
(% yoy change) 19.7 39 22.2 44.8 22.4 34.0 -26.0 53.8
Copper exports (% yoy change) .. .. 14.7 94.8 27.7 3.0 -39.9 53.6
Imports of goods ($ mn) 826.9 971.3 1021.1 1485.6 2117.3 3244 2137 3277
(% yoy change) 21.6 17.5 16 25.4 42.5 53.2 -34.1 53.3
Current account balance ($ mn) -102.4 24.1 29.7 221.6 264.8 -722 -411 -805
(% of GDP) -7.1 1.3 1.3 7 6.7 -14 -9.8 -14
Foreign direct investment ($ mn) 131.5 128.9 257.6 289.6 360 836 496 422
External debt (% of GDP) (3) 87.3 73.7 59.7 44.3 38.9 33.7 47.1 40.0
Foreign exchange reserves, gross ($ mn) 204 208 333 718 1001 658 1328 2091
In month of imports of g&s 2.4 2 2.6 4.3 3.8 3.0 4.3 7.6
Financial Markets
Domestic credit (% yoy change) 157.3 25.8 18.8 -3.1 78.4 52.5 -7.6 23.2
Short-term interest rate (% per annum)(4) .. 15.8 3.7 5.1 8.4 9.8 … …
Exchange rate (MNT/US$, eop) 1168 1209 1221 1165 1170 1267.5 1442.8 1234
Real effective exchange rate 2006=100)(5) 94.2 93.9 99.6 102.8 104.8 124.4 102.4 …
(% yoy change) -4.8 -0.4 6.1 3.2 1.9 18.7 -17.7 …
Stock market index (2000=100)(6) 151.5 120.8 203.6 382 2048 1182 1229 1872
Memo:
Nominal GDP (MNT bn*) 1660 2152 2780 3715 4600 6020 6055 8255
Nominal GDP ($ mn*) 1448 1814 2307 3156 3930 5258 4203 6690
GDP per capita ($*) 583 722 900 1214 1491 1921 1552 2470
(1) Non-mining balance excludes revenues from corporate income tax and dividends from mining companies, the Windfall Profits Tax and royalties. (2) From the June 2010 IMF-World Bank Debt Sustainability Analysis (3) On public and publicly guaranteed debt. (4) Yield of 14-day bills until 2006 and of 7-day bills for 2007. (5) Increase is appreciation. (6) Top-20 index, end of year, index=100 in Dec-2000. * Estimates after 2009 based on NSO reweighted nominal GDP data.
Source: Bank of Mongolia, National Statistical Office, Ministry of Finance, IMF and World Bank staff estimates