money circulation, trackable items, and the emergence of
TRANSCRIPT
28 PERVASIVE computing Published by the IEEE CS 1536-1268/08/$25.00 © 2008 IEEE
U S E R - G E N E R A T E D C O N T E N T
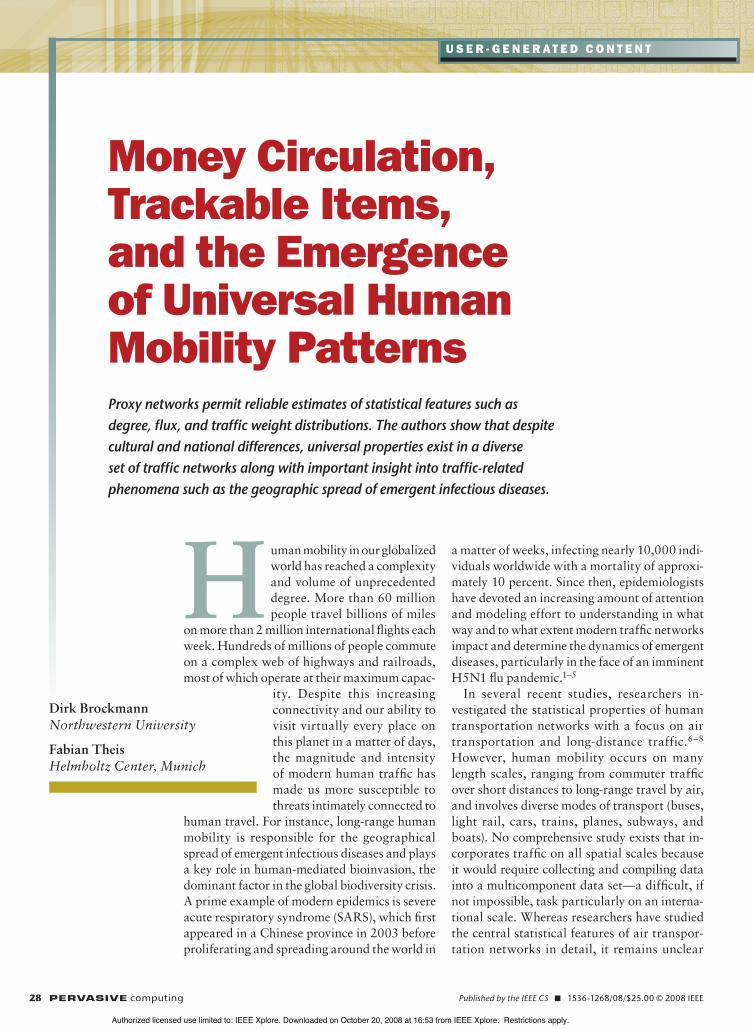
Money Circulation, Trackable Items, and the Emergence of Universal Human Mobility PatternsProxy networks permit reliable estimates of statistical features such as degree, flux, and traffic weight distributions. The authors show that despite cultural and national differences, universal properties exist in a diverse set of traffic networks along with important insight into traffic-related phenomena such as the geographic spread of emergent infectious diseases.
H uman mobility in our globalized world has reached a complexity and volume of unprecedented degree. More than 60 million people travel billions of miles
on more than 2 million international flights each week. Hundreds of millions of people commute on a complex web of highways and railroads, most of which operate at their maximum capac-
ity. Despite this increasing connectivity and our ability to visit virtually every place on this planet in a matter of days, the magnitude and intensity of modern human traffic has made us more susceptible to threats intimately connected to
human travel. For instance, long-range human mobility is responsible for the geographical spread of emergent infectious diseases and plays a key role in human-mediated bioinvasion, the dominant factor in the global biodiversity crisis. A prime example of modern epidemics is severe acute respiratory syndrome (SARS), which first appeared in a Chinese province in 2003 before proliferating and spreading around the world in
a matter of weeks, infecting nearly 10,000 indi-viduals worldwide with a mortality of approxi-mately 10 percent. Since then, epidemiologists have devoted an increasing amount of attention and modeling effort to understanding in what way and to what extent modern traffic networks impact and determine the dynamics of emergent diseases, particularly in the face of an imminent H5N1 flu pandemic.1–5
In several recent studies, researchers in-vestigated the statistical properties of human transportation networks with a focus on air transportation and long-distance traffic.6–8 However, human mobility occurs on many length scales, ranging from commuter traffic over short distances to long-range travel by air, and involves diverse modes of transport (buses, light rail, cars, trains, planes, subways, and boats). No comprehensive study exists that in-corporates traffic on all spatial scales because it would require collecting and compiling data into a multicomponent data set—a difficult, if not impossible, task particularly on an interna-tional scale. Whereas researchers have studied the central statistical features of air transpor-tation networks in detail, it remains unclear
Dirk BrockmannNorthwestern University
Fabian TheisHelmholtz Center, Munich
Authorized licensed use limited to: IEEE Xplore. Downloaded on October 20, 2008 at 16:53 from IEEE Xplore. Restrictions apply.

U S E R - G E N E R A T E D C O N T E N T
OCTOBER–DECEMBER 2008 PERVASIVE computing 29
whether these properties remain un-changed in traffic networks that com-prise all other means of transportation and spatial scales. How do these prop-erties depend on the length scale, for example? Are they universal? In what way do they change as a function of length scale? What are the national and regional differences and similari-ties? To understand human mobility in the 21st century and the dynamics of associated phenomena, particularly the geographic spread of modern diseases, answering these questions is of funda-mental importance.
In this article, we report on the dis-covery of statistical regularities, math-ematical laws, and universal charac-teristics underlying multiscale human mobility. Our study is based on the gen-eration of proxy networks for global hu-man travel behavior from pervasive user data collected at the world’s largest bill-tracking Web site (www.wheresgeorge.com) and trajectories of trackable items (known as travel bugs) recorded at a geocaching Web site (www.geocaching.com). From this pervasive data, we ex-tract multiscale human traffic networks for the US and European countries that cover distances of a few to a few thou-sand kilometers. These proxy networks permit reliable estimates of statistical features such as degree, flux, and traffic weight distributions; we show that, de-spite cultural and national differences, universal properties do exist, giving us insight into traffic-related phenomena.
Money Circulation and Human MobilityConfronted with the difficulty of com-piling a comprehensive data set of hu-man traffic, Dirk Brockmann and his colleagues proposed in 2006 using the geographic circulation of money as a proxy for human traffic, based on the idea that individuals transport money as they travel and that the total flux of money between a set of cities is proportional to the flux of individu-als.9 The researchers analyzed data col-lected at the online bill tracker www.
wheresgeorge.com, which Hank Eskin founded in 1998. The idea is simple: registered users mark individual dol-lars, which then enter circulation. When new users come into possession of a marked bill, they can register at the site and report the bill’s current loca-tion via the zip code. Successive reports of a bill yield a spatiotemporal trajec-tory with a very high resolution. Since 1998, www.wheresgeorge.com has be-come the largest bill-tracking Web site worldwide, with more than 3 million registered users and more than 140 mil-lion registered bills. Approximately 10 percent of all bills have had hits (defined as a second, third, and so on report af-ter the initial entry), yielding a total of more than 14 million single trajectories consisting of origin (initial entry loca-tion) and destination (hit location) X1 and X2, respectively.
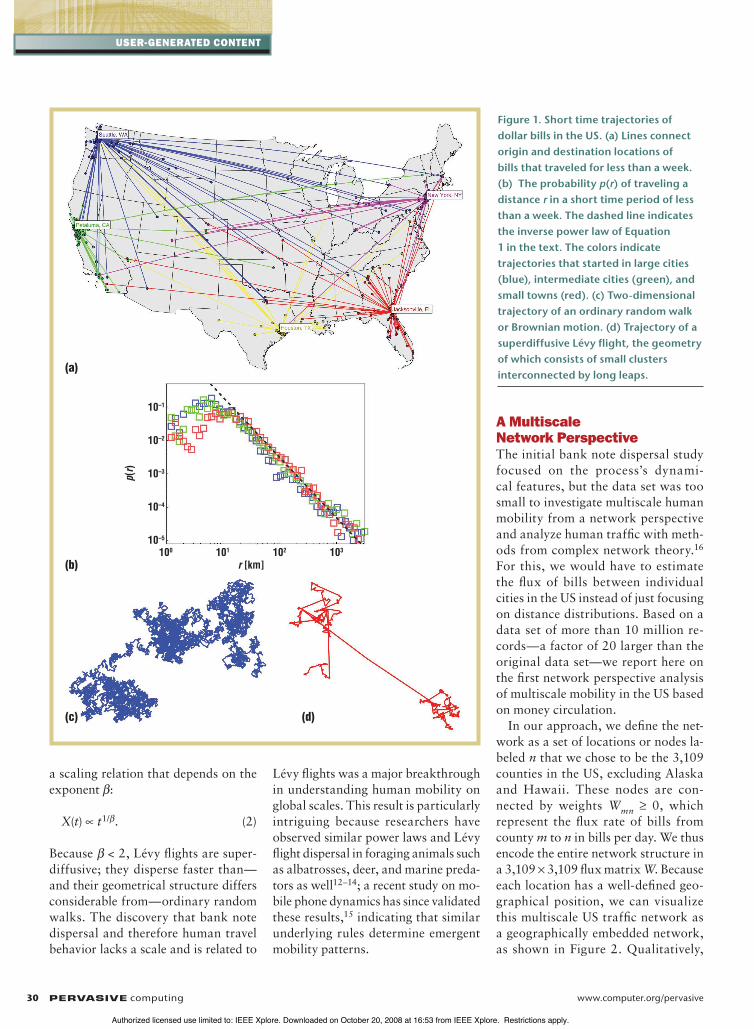
Figure 1 illustrates a sample of bill trajectories with initial entries in five US cities. Shown are bill journeys that lasted a week or less. Clearly, most bills remain in the vicinity of their initial en-try, yet a small but significant number have traversed distances of the order of the size of the US, consistent with the intuitive notion that short trips occur more frequently than long ones.
Anomalous Diffusion in Bank Note DispersalOne of the key results of the 2006 study was the first quantitative estimate of the probability p(r) of a bill traversing a dis-tance r in a short time period, a direct estimate of the probability of humans performing journeys of this distance in a short time period. The research-ers based their estimate on a data set of 464,670 individual bills. Over a range of distances between 10 and 3,500
km, this probability follows an inverse power law—that is,
p rr
( ) ,11
(1)
with an exponent 0.6. Despite the multitude of transportation options in-volved, the underlying complexity of human travel behavior, and the US’s strong spatial heterogeneity, the prob-ability p(r) follows this simple mathe-matical law, indicating that underlying universal rules govern human mobility. Moreover, the specific functional form of p(r) has important consequences. If we assume that individual bills per-form a spatial random walk with an arbitrary probability distribution p(r) for distances at every step, we can ask, what is the typical distance X(t) from the initial starting point as a function of time? For the ordinary random walks
(also known as Brownian motion) that are ubiquitous in the natural sciences, the behavior of X(t) is determined by the standard deviation of the single steps
r r2 2,
and irrespective of the particular shape of p(r), the distance X(t) scales accord-ing to the square-root law—that is, X t t( ) —a direct consequence of the central limit theorem.10
However, for a power law of the type observed in bank note dispersal (Equa-tion 1), the variance diverges for ex-ponents < 2, so the situation is more complex. It implies that bank note dis-persal lacks a typical length scale, is fractal, and the bill trajectories resem-ble a particular class of random walks known as Lévy flights.11 In contrast to ordinary random walks, Lévy flights are anomalously diffusive, exhibiting
Proxy networks permit reliable estimates
of statistical features such as degree, flux,
and traffic weight distributions.
Authorized licensed use limited to: IEEE Xplore. Downloaded on October 20, 2008 at 16:53 from IEEE Xplore. Restrictions apply.
30 PERVASIVE computing www.computer.org/pervasive
USER-GENERATED CONTENT
a scaling relation that depends on the exponent :
X(t) t1/ . (2)
Because < 2, Lévy flights are super-diffusive; they disperse faster than—and their geometrical structure differs considerable from—ordinary random walks. The discovery that bank note dispersal and therefore human travel behavior lacks a scale and is related to
Lévy flights was a major breakthrough in understanding human mobility on global scales. This result is particularly intriguing because researchers have observed similar power laws and Lévy flight dispersal in foraging animals such as albatrosses, deer, and marine preda-tors as well12–14; a recent study on mo-bile phone dynamics has since validated these results,15 indicating that similar underlying rules determine emergent mobility patterns.
A Multiscale Network PerspectiveThe initial bank note dispersal study focused on the process’s dynami-cal features, but the data set was too small to investigate multiscale human mobility from a network perspective and analyze human traffic with meth-ods from complex network theory.16 For this, we would have to estimate the flux of bills between individual cities in the US instead of just focusing on distance distributions. Based on a data set of more than 10 million re-cords—a factor of 20 larger than the original data set—we report here on the first network perspective analysis of multiscale mobility in the US based on money circulation.
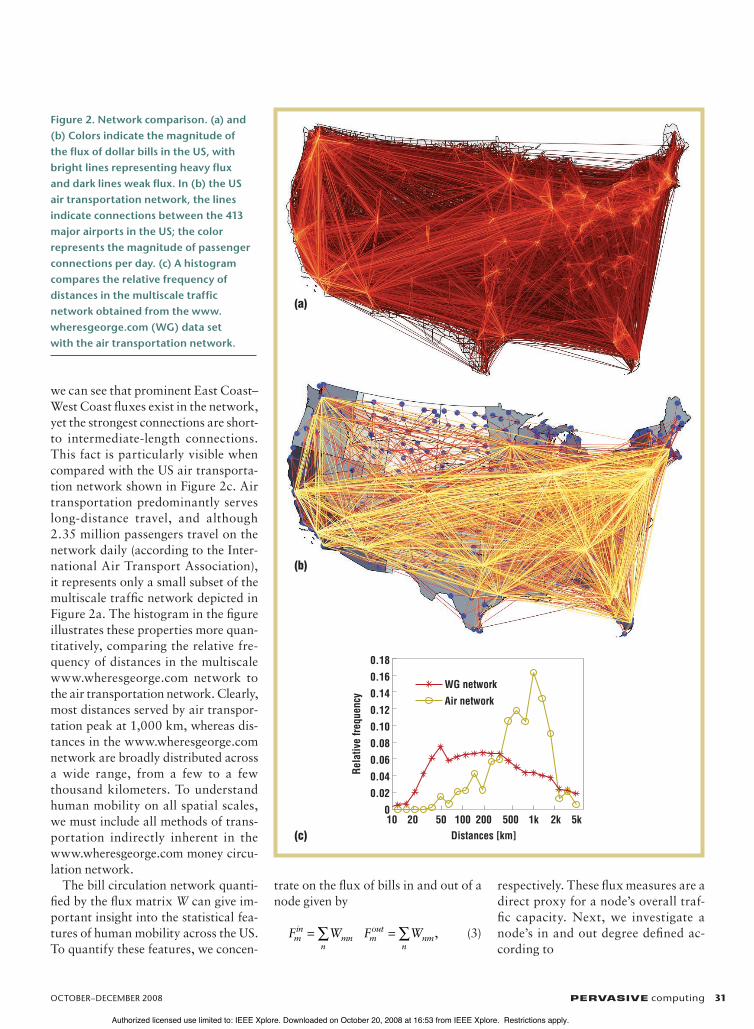
In our approach, we define the net-work as a set of locations or nodes la-beled n that we chose to be the 3,109 counties in the US, excluding Alaska and Hawaii. These nodes are con-nected by weights Wmn 0, which represent the flux rate of bills from county m to n in bills per day. We thus encode the entire network structure in a 3,109 3,109 flux matrix W. Because each location has a well-defined geo-graphical position, we can visualize this multiscale US traffic network as a geographically embedded network, as shown in Figure 2. Qualitatively,
(b)
(c) (d)
(a)
100 101 102 103
10–1
10–2
10–3
10–4
10–5
r [km]
p(r)
Figure 1. Short time trajectories of dollar bills in the US. (a) Lines connect origin and destination locations of bills that traveled for less than a week. (b) The probability p(r) of traveling a distance r in a short time period of less than a week. The dashed line indicates the inverse power law of Equation 1 in the text. The colors indicate trajectories that started in large cities (blue), intermediate cities (green), and small towns (red). (c) Two-dimensional trajectory of an ordinary random walk or Brownian motion. (d) Trajectory of a superdiffusive Lévy flight, the geometry of which consists of small clusters interconnected by long leaps.
Authorized licensed use limited to: IEEE Xplore. Downloaded on October 20, 2008 at 16:53 from IEEE Xplore. Restrictions apply.
OCTOBER–DECEMBER 2008 PERVASIVE computing 31
we can see that prominent East Coast–West Coast fluxes exist in the network, yet the strongest connections are short- to intermediate-length connections. This fact is particularly visible when compared with the US air transporta-tion network shown in Figure 2c. Air transportation predominantly serves long-distance travel, and although 2.35 million passengers travel on the network daily (according to the Inter-national Air Transport Association), it represents only a small subset of the multiscale traffic network depicted in Figure 2a. The histogram in the figure illustrates these properties more quan-titatively, comparing the relative fre-quency of distances in the multiscale www.wheresgeorge.com network to the air transportation network. Clearly, most distances served by air transpor-tation peak at 1,000 km, whereas dis-tances in the www.wheresgeorge.com network are broadly distributed across a wide range, from a few to a few thousand kilometers. To understand human mobility on all spatial scales, we must include all methods of trans-portation indirectly inherent in the www.wheresgeorge.com money circu-lation network.
The bill circulation network quanti-fied by the flux matrix W can give im-portant insight into the statistical fea-tures of human mobility across the US. To quantify these features, we concen-
trate on the flux of bills in and out of a node given by
F W F Wmin
mnn
mout
nmn
, (3)
respectively. These flux measures are a direct proxy for a node’s overall traf-fic capacity. Next, we investigate a node’s in and out degree defined ac-cording to
(b)
(c)
(a)
0.180.160.140.120.100.080.060.040.02
0
Rela
tive
frequ
ency
10 20 50 100 200Distances [km]
500 1k 2k 5k
WG networkAir network
Figure 2. Network comparison. (a) and (b) Colors indicate the magnitude of the flux of dollar bills in the US, with bright lines representing heavy flux and dark lines weak flux. In (b) the US air transportation network, the lines indicate connections between the 413 major airports in the US; the color represents the magnitude of passenger connections per day. (c) A histogram compares the relative frequency of distances in the multiscale traffic network obtained from the www.wheresgeorge.com (WG) data set with the air transportation network.
Authorized licensed use limited to: IEEE Xplore. Downloaded on October 20, 2008 at 16:53 from IEEE Xplore. Restrictions apply.
32 PERVASIVE computing www.computer.org/pervasive
USER-GENERATED CONTENT
k A k Amin
mnn
mout
nmn
,
(4)
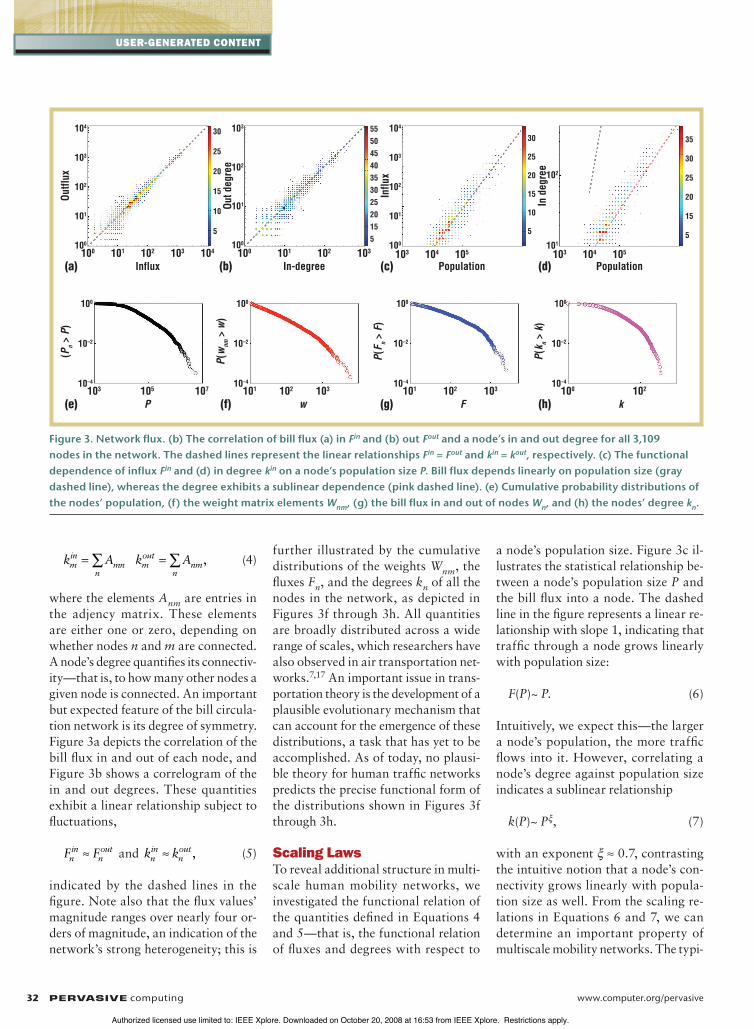
where the elements Anm are entries in the adjency matrix. These elements are either one or zero, depending on whether nodes n and m are connected. A node’s degree quantifies its connectiv-ity—that is, to how many other nodes a given node is connected. An important but expected feature of the bill circula-tion network is its degree of symmetry. Figure 3a depicts the correlation of the bill flux in and out of each node, and Figure 3b shows a correlogram of the in and out degrees. These quantities exhibit a linear relationship subject to fluctuations,
F Fnin
nout
and k kn
innout , (5)
indicated by the dashed lines in the figure. Note also that the flux values’ magnitude ranges over nearly four or-ders of magnitude, an indication of the network’s strong heterogeneity; this is
further illustrated by the cumulative distributions of the weights Wnm, the fluxes Fn, and the degrees kn of all the nodes in the network, as depicted in Figures 3f through 3h. All quantities are broadly distributed across a wide range of scales, which researchers have also observed in air transportation net-works.7,17 An important issue in trans-portation theory is the development of a plausible evolutionary mechanism that can account for the emergence of these distributions, a task that has yet to be accomplished. As of today, no plausi-ble theory for human traffic networks predicts the precise functional form of the distributions shown in Figures 3f through 3h.
Scaling LawsTo reveal additional structure in multi-scale human mobility networks, we investigated the functional relation of the quantities defined in Equations 4 and 5—that is, the functional relation of fluxes and degrees with respect to
a node’s population size. Figure 3c il-lustrates the statistical relationship be-tween a node’s population size P and the bill flux into a node. The dashed line in the figure represents a linear re-lationship with slope 1, indicating that traffic through a node grows linearly with population size:
F(P)~ P. (6)
Intuitively, we expect this—the larger a node’s population, the more traffic flows into it. However, correlating a node’s degree against population size indicates a sublinear relationship
k(P)~ P , (7)
with an exponent 0.7, contrasting the intuitive notion that a node’s con-nectivity grows linearly with popula-tion size as well. From the scaling re-lations in Equations 6 and 7, we can determine an important property of multiscale mobility networks. The typi-
(a) (b) (c) (d)
Outfl
ux
100 101 102
Influx103 104
104
103
102
101
100
(Pn >
P)
103 105
P107
100
10–2
10–4In
flux
103 104 105
Population
104
103
102
101
100
30
25
20
15
10
5
30
25
20
15
10
5
5550454035302520155
35
30
25
20
15
5
In d
egre
e
103 104 105
Population
102
101
Out d
egre
e
100 101 102
In-degree103
103
102
101
100
(e)
P(w
nm >
w)
101 102 103
w
100
10–2
10–4
(f)
P(F n >
F)
101 102 103
F
100
10–2
10–4
(g)
P(k n >
k)
100 102
k
100
10–2
10–4
(h)
Figure 3. Network flux. (b) The correlation of bill flux (a) in Fin and (b) out Fout and a node’s in and out degree for all 3,109 nodes in the network. The dashed lines represent the linear relationships Fin = Fout and kin = kout, respectively. (c) The functional dependence of influx Fin and (d) in degree kin on a node’s population size P. Bill flux depends linearly on population size (gray dashed line), whereas the degree exhibits a sublinear dependence (pink dashed line). (e) Cumulative probability distributions of the nodes’ population, (f) the weight matrix elements Wnm, (g) the bill flux in and out of nodes Wn, and (h) the nodes’ degree kn.
Authorized licensed use limited to: IEEE Xplore. Downloaded on October 20, 2008 at 16:53 from IEEE Xplore. Restrictions apply.
OCTOBER–DECEMBER 2008 PERVASIVE computing 33
cal strength of a connection W is given by the ratio of flux and degree, so we obtain heuristically
W P P( ) .1 (8)
Equations 7 and 8 imply that larger counties aren’t only connected to a larger number of other counties but also that every connection’s typical strength is stronger. The universal ex-ponent determines both relations, and they hold over nearly four orders of magnitude, a surprising regularity. Again, no theory exists that can predict these scaling relations and the value of the exponent .
Topological US HierarchiesThe www.wheresgeorge.com network encodes US travel information in the form of money fluxes, so each node—in this case, a county—is geographically embedded and hence is a node in a geog-raphy distance network. An important question lies in the similarities and dif-ferences between these two networks. In Figure 3, we observed that the www.wheresgeorge.com network encodes at least some information about geogra-
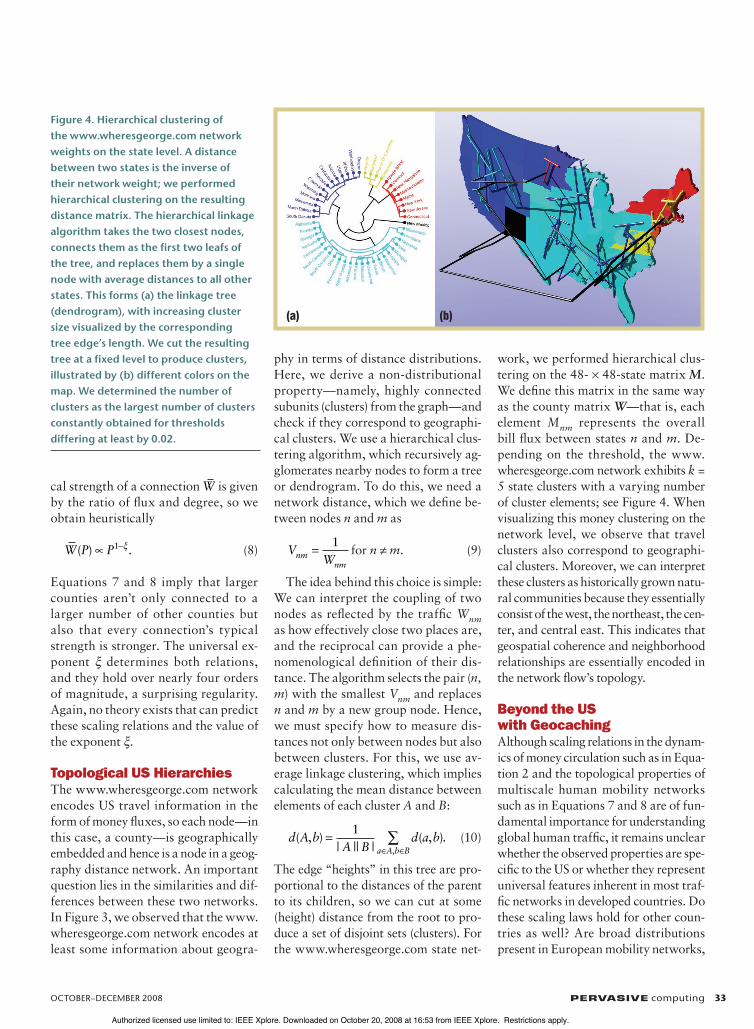
phy in terms of distance distributions. Here, we derive a non-distributional property—namely, highly connected subunits (clusters) from the graph—and check if they correspond to geographi-cal clusters. We use a hierarchical clus-tering algorithm, which recursively ag-glomerates nearby nodes to form a tree or dendrogram. To do this, we need a network distance, which we define be-tween nodes n and m as
VWnm
nm
1for n m. (9)
The idea behind this choice is simple: We can interpret the coupling of two nodes as reflected by the traffic Wnm as how effectively close two places are, and the reciprocal can provide a phe-nomenological definition of their dis-tance. The algorithm selects the pair (n, m) with the smallest Vnm and replaces n and m by a new group node. Hence, we must specify how to measure dis-tances not only between nodes but also between clusters. For this, we use av-erage linkage clustering, which implies calculating the mean distance between elements of each cluster A and B:
d A bA B
d a ba A b B
( , )| || |
( , ).,
1 (10)
The edge “heights” in this tree are pro-portional to the distances of the parent to its children, so we can cut at some (height) distance from the root to pro-duce a set of disjoint sets (clusters). For the www.wheresgeorge.com state net-
work, we performed hierarchical clus-tering on the 48- 48-state matrix M. We define this matrix in the same way as the county matrix W—that is, each element Mnm represents the overall bill flux between states n and m. De-pending on the threshold, the www. wheresgeorge.com network exhibits k = 5 state clusters with a varying number of cluster elements; see Figure 4. When visualizing this money clustering on the network level, we observe that travel clusters also correspond to geographi-cal clusters. Moreover, we can interpret these clusters as historically grown natu-ral communities because they essentially consist of the west, the northeast, the cen-ter, and central east. This indicates that geospatial coherence and neighborhood relationships are essentially encoded in the network flow’s topology.
Beyond the US with GeocachingAlthough scaling relations in the dynam-ics of money circulation such as in Equa-tion 2 and the topological properties of multiscale human mobility networks such as in Equations 7 and 8 are of fun-damental importance for understanding global human traffic, it remains unclear whether the observed properties are spe-cific to the US or whether they represent universal features inherent in most traf-fic networks in developed countries. Do these scaling laws hold for other coun-tries as well? Are broad distributions present in European mobility networks,
(b)(a)
Figure 4. Hierarchical clustering of the www.wheresgeorge.com network weights on the state level. A distance between two states is the inverse of their network weight; we performed hierarchical clustering on the resulting distance matrix. The hierarchical linkage algorithm takes the two closest nodes, connects them as the first two leafs of the tree, and replaces them by a single node with average distances to all other states. This forms (a) the linkage tree (dendrogram), with increasing cluster size visualized by the corresponding tree edge’s length. We cut the resulting tree at a fixed level to produce clusters, illustrated by (b) different colors on the map. We determined the number of clusters as the largest number of clusters constantly obtained for thresholds differing at least by 0.02.
Authorized licensed use limited to: IEEE Xplore. Downloaded on October 20, 2008 at 16:53 from IEEE Xplore. Restrictions apply.
34 PERVASIVE computing www.computer.org/pervasive
USER-GENERATED CONTENT
and do they exhibit the same shape? To what extent can we expect national dif-ferences and similarities? One impor-tant hypothesis to test is to what extent national differences and cultural diver-sity in Europe affect the structure of hu-man mobility networks. Unfortunately, www.wheresgeorge.com is a US-specific site, so these questions are beyond the data set’s reach.
To circumvent this difficulty and ad-dress some of these questions, we ana-lyzed data from another Web site called www.geocaching.com, which is a mod-ern treasure hunt based on GPS technol-ogy. In geocaching, players hide boxes (caches) containing items of more or less value in geographically interesting places and publish the longitude/latitude coordinates on the site. Other players
then use this positional information to locate the cache within 10 meters using their GPS devices; when found, they log their visit and exchange gifts by taking items out of the cache and placing other items in it. Superimposed on geocach-ing are trackable items or “travel bugs” that have become a major component of the game. Travel bugs are marked with a unique identifier or tag registered at www.geocaching.com. When found in a cache, players take them out and put them in the next cache they find. The bug’s entire trajectory is recorded on the Web site and can be monitored by its owner. Because geocaching is popular in many countries, travel bugs cross na-tional boundaries and can help address questions about human mobility on an international level. We analyzed the
dispersal characteristics of more than 200,000 travel bugs that visited more than 200 countries worldwide over a to-tal distance of more than 1 billion km.
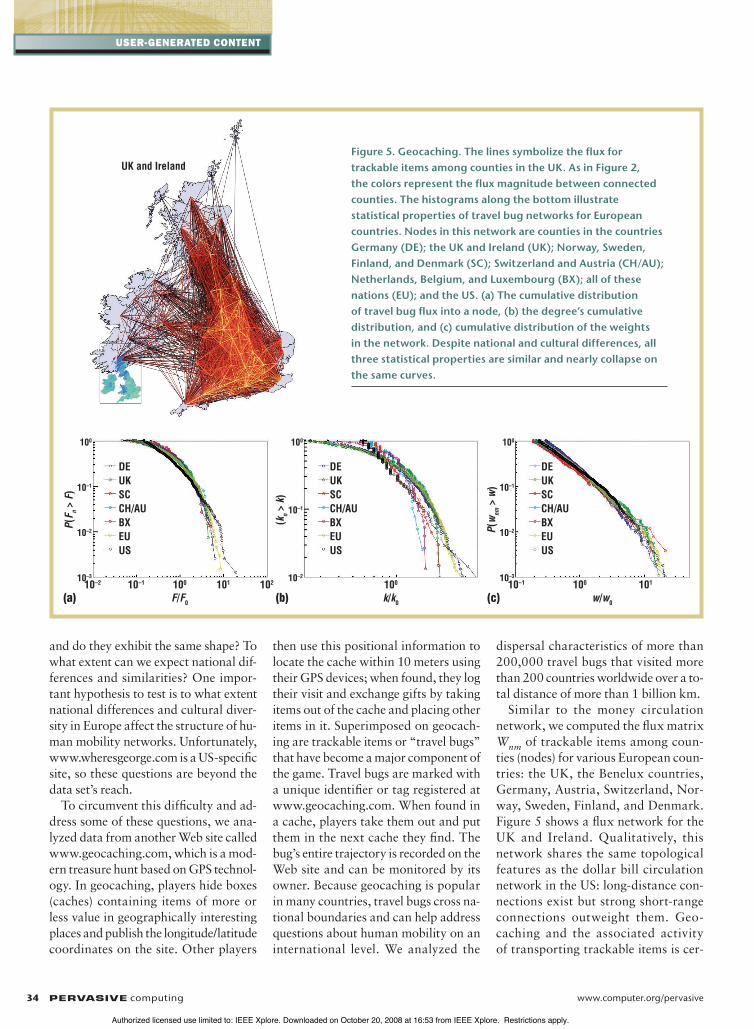
Similar to the money circulation network, we computed the flux matrix Wnm of trackable items among coun-ties (nodes) for various European coun-tries: the UK, the Benelux countries, Germany, Austria, Switzerland, Nor-way, Sweden, Finland, and Denmark. Figure 5 shows a flux network for the UK and Ireland. Qualitatively, this network shares the same topological features as the dollar bill circulation network in the US: long-distance con-nections exist but strong short-range connections outweight them. Geo-caching and the associated activity of transporting trackable items is cer-
P(F n >
F)
10–2 10–1 100 101
DEUKSCCH/AUBXEUUS
F/F0
102
100
10–1
10–2
10–3
(a)
(kn >
k)
100
DEUKSCCH/AUBXEUUS
k/k0
100
10–1
10–2
(b)
P(w
nm >
w)
100 10110–1
DEUKSCCH/AUBXEUUS
w/w0
100
10–1
10–2
10–3
(c)
UK and IrelandFigure 5. Geocaching. The lines symbolize the flux for trackable items among counties in the UK. As in Figure 2, the colors represent the flux magnitude between connected counties. The histograms along the bottom illustrate statistical properties of travel bug networks for European countries. Nodes in this network are counties in the countries Germany (DE); the UK and Ireland (UK); Norway, Sweden, Finland, and Denmark (SC); Switzerland and Austria (CH/AU); Netherlands, Belgium, and Luxembourg (BX); all of these nations (EU); and the US. (a) The cumulative distribution of travel bug flux into a node, (b) the degree’s cumulative distribution, and (c) cumulative distribution of the weights in the network. Despite national and cultural differences, all three statistical properties are similar and nearly collapse on the same curves.
Authorized licensed use limited to: IEEE Xplore. Downloaded on October 20, 2008 at 16:53 from IEEE Xplore. Restrictions apply.
OCTOBER–DECEMBER 2008 PERVASIVE computing 35
tainly not representative of the entire population; the data set is subject to the behavioral biases of the individu-als who participate in the game. But we can address an important issue by analyzing the flux network of trackable items not so much by what systematic deviations these biases introduce but rather what statistical features are ro-bust against such biases. The bottom of Figure 5 shows a surprising result of our analysis of travel bug flow net-works across various European coun-tries, with the cumulative distributions of the total flux F of trackable items into a node, the degrees k of the nodes, and the weights W of the network for various European countries. Surpris-ingly, weights, fluxes, and degrees ex-hibit nearly identical distributions in all countries considered, and the travel bug network for the US agrees with the other networks over a wide range of scales. This is the first direct indication that multiscale mobility networks pos-sess universal features across national and cultural boundaries.
O ur findings are of funda-mental importance for un-derstanding a multitude of spatiotemporal phenom-
ena triggered by human traffic. We’re optimistic that, in the near future, re-searchers can satisfactorily offer plau-sible explanations of the properties and quantities we observed, such as the ex-ponents in Equations 2 and 7.
ACKNOWLEDGMENTS We thank Hank Eskin and wheresgeorge.com for providing the data on money circulation and Groundspeak.com for providing a data set on geocaching and trackable items. Dirk Brock-mann acknowledges support from the Volkswa-gen Foundation within the initiative “Complex Networks as a Phenomenon across Disciplines.” Fabian Theis acknowledges partial support by the Helmholtz Alliance on Systems Biology. Finally, we thank Dickie Petze and Wyatt Noyes for fruit-ful discussions.
REFERENCES 1. N.M. Ferguson et al., “Strategies for Miti-
gating an Influenza Pandemic,” Nature, vol. 442, July 2006, pp. 448–452.
2. N.M. Ferguson et al., “Strategies for Con-taining an Emerging Influenza Pandemic in Southeast Asia,” Nature, vol. 437, Sept. 2005, pp. 209–214.
3. V. Colizza et al., “Modeling the World-wide Spread of Pandemic Influenza: Baseline Case and Containment Interven-tions,” Plos Medicine, vol. 4, Jan. 2007, pp. 95–110.
4. S. Eubank et al., “Modelling Disease Outbreaks in Realistic Urban Social Net-works,” Nature, vol. 429, May 2004, pp. 180–184.
5. L. Hufnagel, D. Brockmann, and T. Geisel, “Forecast and Control of Epidem-ics in a Globalized World,” Proc. Nat’l Academy of Science, vol. 101, 19 Oct. 2004, pp. 15124–15129.
6. A. Barrat et al., “The Architecture of Complex Weighted Networks,” Proc. Nat’l Academy of Sciences, vol. 101, Mar. 2004, pp. 3747–3752.
7. A. Barrat, M. Barthelemy, and A. Vespig-nani, “The Effects of Spatial Constraints on the Evolution of Weighted Complex Networks,” J. Statistical Mechanics-The-ory and Experiment, May 2005.
8. R. Guimera et al., “The Worldwide Air Transportation Network: Anomalous Centrality, Community Structure, and Cities’ Global Roles,” Proc. Nat’l Acad-emy of Sciences, vol. 102, May 2005, pp. 7794–7799.
9. D. Brockmann, L. Hufnagel, and T. Geisel, “The Scaling Laws of Human Travel,” Nature, vol. 439, Jan. 2006, pp. 462–465.
10. C.W. Gardiner, Handbook of Stochastic Methods, Springer Verlag, 1985.
11. I.M. Sokolov, J. Klafter, and A. Blumen, “Fractional Kinetics,” Physics Today, vol. 55, Nov. 2002, pp. 48–54.
12. D.W. Sims et al., “Scaling Laws of Marine Predator Search Behaviour,” Nature, vol. 451, Feb. 2008, pp. 1098–1102.
13. G.M. Viswanathan et al., “Levy Flight Search Patterns of Wandering Alba-trosses,” Nature, vol. 381, 30 May 1996, pp. 413–415.
14. G.M. Viswanathan et al., “Optimizing the Success of Random Searches,” Nature, vol. 401, 28 Oct. 1999, pp. 911–914.
15. M.C. Gonzalez, C.A. Hidalgo, and A.L. Barabasi, “Understanding Individual Human Mobility Patterns,” Nature, vol. 453, 5 June 2008, pp. 779–782.
16. M.E.J. Newman, “The Structure and Function of Complex Networks,” SIAM Rev., vol. 45, June 2003, pp. 167–256.
17. L. Dall’Asta et al., “Vulnerability of Weighted Networks,” J. Statistical Mechanics-Theory and Experiment, Apr. 2006.
For more information on this or any other com-puting topic, please visit our Digital Library at www.computer.org/csdl.
the AUTHORSDirk Brockmann is an associate professor in the Department of Engineer-ing Sciences and Applied Mathematics, Northwestern University. His research focus is on fractional and anomalous diffusion, spatial dynamics of infectious diseases and human-mediated bioinvasion, geolinguistics, and transportation networks. Brockmann has a PhD from the University of Göttingen, Germany and studied physics at Duke as well as in Göttingen. He is a member of the American and German Physical Societies. Contact him at [email protected].
Fabian Theis is a principal researcher at the Institute of Bioinformatics and Systems Biology, Munich, where he leads a group on computational modeling of biological systems. His research interests include biostatistics, dynamical systems, systems biology, statistical signal processing, and blind source separation. Theis has a PhD in physics from the University of Regens-burg and a PhD in computer science from the University of Granada. He is a member of the TC on BSP of the IEEE CAS Society. Contact him at [email protected] or http://cmb.helmholtz-muenchen.de.
Authorized licensed use limited to: IEEE Xplore. Downloaded on October 20, 2008 at 16:53 from IEEE Xplore. Restrictions apply.