monetary statistics –july 6 1 0 2 - cnb statistics czech national bank 3 list of abbreviations and...
TRANSCRIPT
20
16MONETARY STATISTICS – JULY
MONETARY STATISTICS
Czech National Bank
2
CONTENT
Table 1: Key interest rates 4
Table 2: Financial market interest rates 4
Notes to tables 1-2 5
Monetary developments
Table 3: Key monetary indicators 6
Table 4: Monetary aggregates and counterparts 7
Table 5: Sector breakdown of components of M3 8
Table 6: Loans to private sector 9
Table 7: Contributions to annual growth of M3 10
Table 8: Contributions to annual growth of loans to private sector 11
Table 9a: Balance sheets of MFIs by reporting institutions (Assets) 12
Table 9b: Balance sheets of MFIs by reporting institutions (Liabilities) 13
Notes to tables 3-9 14
Monetary financial institutions interest rates
Table 10: MFI interest rates on new business 15
Table 11: MFI interest rates on outstanding amounts 16
Charts: MFI interest rates 17
Notes to tables 10-11 18
Investment funds except money market funds
Table 12: Aggregated balance sheet of investment funds 19
Financial corporations engaged in lending
(financial leasing, hire purchase and provision of personal or commercial finance, factoring and forfaiting)
Table 13: Quarterly aggregated balance sheet of FCLs 20
Table 14a: Summary of loans provided by FCLs to residents 21
Table 14b: Breakdown of loans provided to households 21
Notes to tables 12-14 22
Glossary 23
Technical notes 27
List of Annexes 29
Annex
Cost-of-borrowing Indicators
___________________________________________________________________________________________________1) The information in Tables 3-14 are based on monetary statistics of CNB harmonized with monetary statistics of European System of Central Banks. The data are not seasonally adjusted and the last period data are always preliminary.
2) All the data quoted in this Publication are included in the ARAD time series system:http://www.cnb.cz/cnb/STAT.ARADY_PKG.STROM_SESTAVY?p_strid=AAF&p_sestuid=&p_lang=EN(Time series database ARAD >> Money and financial statistics >> Monetary statistics >> Monetary Statistics Publication).
3) Source: CNB, unless otherwise stated

MONETARY STATISTICS
Czech National Bank
3
LIST OF ABBREVIATIONS AND CODES
Codes
CNB Czech National BankECB European Central BankESA European System of AccountsEurozone The European Union member states that have adopted the EURIF Investment funds excluding money market fundsMMF money market fundsLTIR yield of the 10-year bondM1, M2, M3 monetary aggregatesMFI monetary financial institutionsNFA net foreign assetsNISH non-profit institutions serving householdsNon–MFI all institutions excluding MFIsOFI other financial intermediariesFCL financial corporations engaged in lending
(financial leasing, hire purchase and provision of personal or commercial finance, factoring and forfaiting)
Institutional sectors and subsectors according to ESA2010S.11 non-financial corporationsS.121 central bankS.122 deposit-taking corporations, except the central bankS.123 money market fundsS.124 non-MMF investment fundsS.125 other financial intermediaries, except insurance corp. and pension fundsS.126 financial auxiliariesS.127 captive financial institutions and money lendersS.128 insurance corporationsS.129 pension fundsS.13 general governmentS.1311 central governmentS.14 householdsS.15 non-profit institutions serving households
MONETARY STATISTICS
Czech National Bank
4
TABLE 1 – KEY INTEREST RATES
CNB ECB
from 29 June 2012
onwards
from 1 October 2012
onwards
from 2 November 2012
onwards
from 16 March 2016
onwards
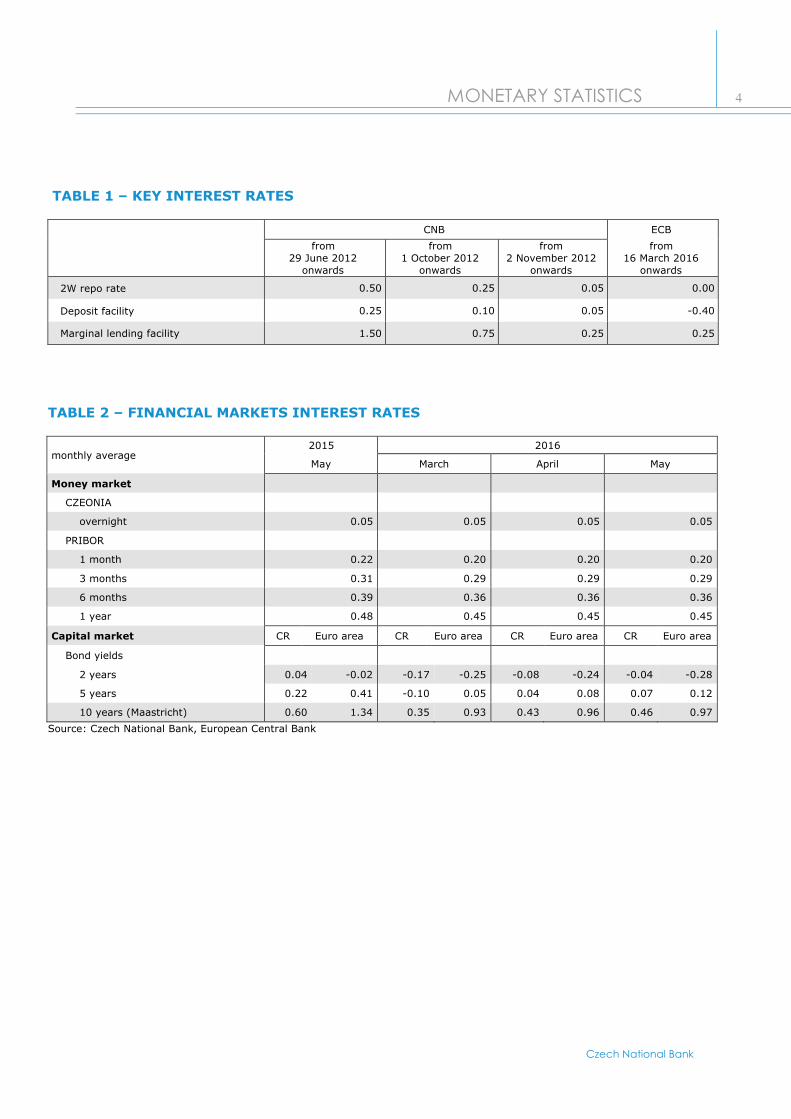
2W repo rate 0.50 0.25 0.05 0.00
Deposit facility 0.25 0.10 0.05 -0.40
Marginal lending facility 1.50 0.75 0.25 0.25
TABLE 2 – FINANCIAL MARKETS INTEREST RATES
monthly average2015 2016
May March April May
Money market
CZEONIA
overnight 0.05 0.05 0.05 0.05
PRIBOR
1 month 0.22 0.20 0.20 0.20
3 months 0.31 0.29 0.29 0.29
6 months 0.39 0.36 0.36 0.36
1 year 0.48 0.45 0.45 0.45
Capital market CR Euro area CR Euro area CR Euro area CR Euro area
Bond yields
2 years 0.04 -0.02 -0.17 -0.25 -0.08 -0.24 -0.04 -0.28
5 years 0.22 0.41 -0.10 0.05 0.04 0.08 0.07 0.12
10 years (Maastricht) 0.60 1.34 0.35 0.93 0.43 0.96 0.46 0.97
Source: Czech National Bank, European Central Bank

MONETARY STATISTICS
Czech National Bank
5
Financial markets interest rates in CR (%)
COMMENTARY ON KEY INTEREST RATES (TABLE 1) AND FINANCIAL MARKET INTEREST RATES (TABLE 2): MAY 2016
Key interest rates
The 2W repo rate of the Czech National Bank (CNB) has been flat at 0.05% since November 2012. The key interest rate of the European Central Bank (ECB) dropped to zero in March 2016. The ECB’s Lombard rate fell by 0.05 percentage point (to 0.25%) as of the same date as the ECB’s key rate. Thus, it is now the same as the CNB’s Lombard rate. The ECB’s discount rate decreased to a new historical low of -0.40% in March 2016, down by 0.10 percentage point from the level of -0.30% where it had stood since December 2015.
Financial market interest rates
As in April, interest rates on the Czech interbank deposit market were unchanged in May 2016. The 1M PRIBOR was unchanged from September 2015 at 0.20%. At 0.29%, the 3M PRIBOR was the same as in March. The 6M PRIBOR has been flat at 0.36% since February and the 1Y PRIBOR at 0.45% since January.
The capital market saw larger changes in interest rates than the money market. The yield on the 2Y Czech bond rose by 0.04 percentage point to -0.04%. The yield on the 5Y bond increased by 0.03 percentage point to 0.07%. The yield on the 10Y bond rose from 0.43% in April to 0.46% in May. The yield on the 2Y euro area bond decreased by 0.04 percentage point to -0.28%. By contrast, the yield on the 5Y euro area bond picked up by 0.04 percentage point. It stood at 0.12% in May. The yield on the 10Y bond increased by 0.01 percentage point to 0.97%. The largest differential between Czech and euro area bonds was recorded for the 10Y bond yields, which represent one of the five Maastricht criteria. This differential reached 0.51 percentage point.
0.00
1.00
2.00
3.00
4.00
5.00
6.00
7.00
8.00
2W repo rate 3M PRIBOR Bond yields 10 years

MONETARY STATISTICS
Czech National Bank
6
TABLE 3 – KEY MONETARY INDICATORS
CZK billions, unless otherwise indicated
2015 2016
May March April May
Stocks Flows4)
Annual growth rates (%)
Stocks Flows4)
Annual growth rates (%)
Stocks Flows4)
Annual growth rates (%)
Stocks Flows4)
Annual growth rates (%)
M1 2 899.3 47.8 11.5 3 169.2 23.8 12.6 3 202.1 33.1 12.8 3 261.1 57.8 12.9
M31) 3 401.0 22.2 6.3 3 655.7 18.9 9.9 3 686.5 31.1 9.5 3 718.9 31.1 9.7
Loans to private sector2) 2 320.6 18.7 6.0 2 483.7 39.9 9.3 2 498.6 15.8 9.3 2 519.4 21.7 9.4
Net foreign assets3) 1 401.7 -36.3 -3.8 1 647.7 -5.6 19.2 1 681.9 33.3 20.0 1 695.3 7.7 23.5
1) Monetary aggregates comprise monetary liabilities of MFIs vis-à-vis non-MFI Czech residents excluding central government. M1 is the sum of currency in circulation and overnight deposits; M2 is the sum of M1, deposits with an agreed maturity of up to two years and deposits redeemable at notice of up to three months; and M3 is the sum of M2, repurchase agreements, money market fund shares/units and debt securities up to two years.2) Including all resident sectors without general government (S.13) and MFIs sector (S.121, S.122 and S.123 according to ESA2010).3) Net foreign assets (NFA) represent balance of financial claims and liabilities of the MFI sector vis-à-vis nonresidents.4) Net value of flow data calculated by adjusting the difference between end-of-period levels for the effect of non-transactions-related factors.
Annual growth rates (%)
-15
-10
-5
0
5
10
15
20
25
30
M1 NFA M3 Loans to private sector
MONETARY STATISTICS
Czech National Bank
7
TABLE 4 – MONETARY AGGREGATES AND COUNTERPARTS
CZK billions, unless otherwise indicated
2015 2016
May March April May
StocksFlows
1)
Annual growth rates (%)
StocksFlows
1)
Annual growth rates (%)
StocksFlows
1)
Annual growth rates (%)
StocksFlows
1)
Annual growth rates (%)
COMPONENTS OF M3
(1)M3 (items 1.3. 1.6 and 1.11)
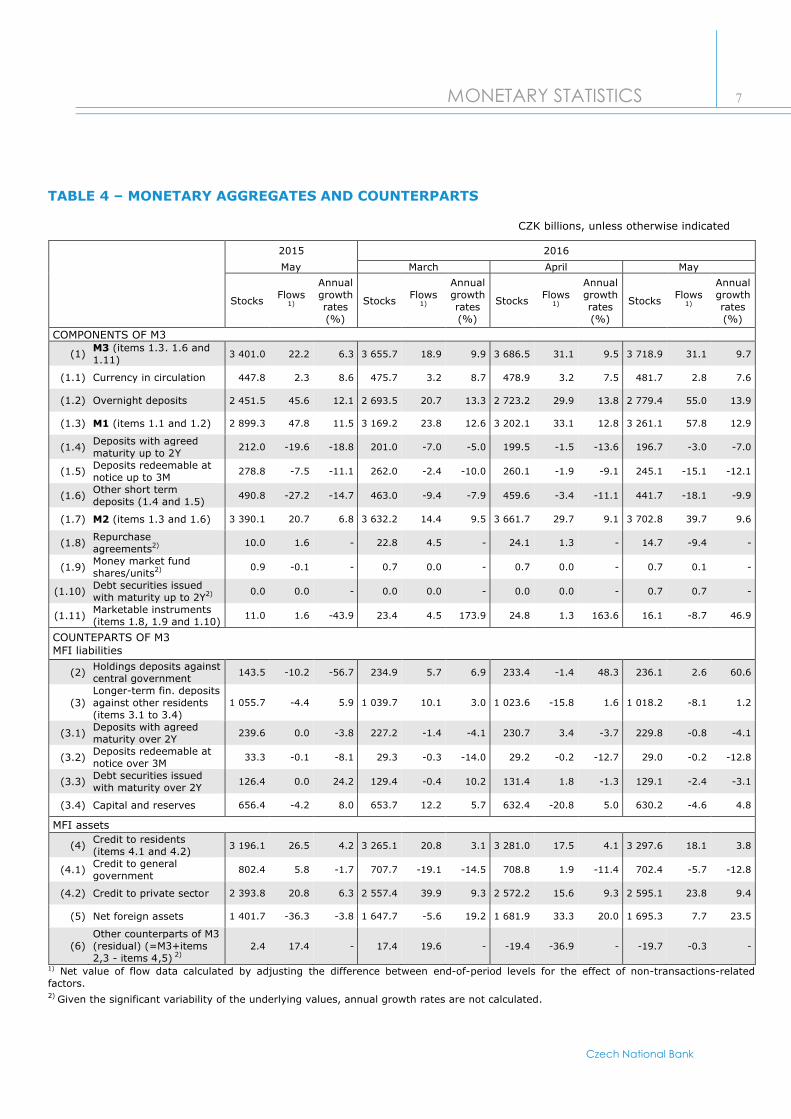
3 401.0 22.2 6.3 3 655.7 18.9 9.9 3 686.5 31.1 9.5 3 718.9 31.1 9.7
(1.1) Currency in circulation 447.8 2.3 8.6 475.7 3.2 8.7 478.9 3.2 7.5 481.7 2.8 7.6
(1.2) Overnight deposits 2 451.5 45.6 12.1 2 693.5 20.7 13.3 2 723.2 29.9 13.8 2 779.4 55.0 13.9
(1.3) M1 (items 1.1 and 1.2) 2 899.3 47.8 11.5 3 169.2 23.8 12.6 3 202.1 33.1 12.8 3 261.1 57.8 12.9
(1.4)Deposits with agreed maturity up to 2Y
212.0 -19.6 -18.8 201.0 -7.0 -5.0 199.5 -1.5 -13.6 196.7 -3.0 -7.0
(1.5)Deposits redeemable at notice up to 3M
278.8 -7.5 -11.1 262.0 -2.4 -10.0 260.1 -1.9 -9.1 245.1 -15.1 -12.1
(1.6)Other short term deposits (1.4 and 1.5)
490.8 -27.2 -14.7 463.0 -9.4 -7.9 459.6 -3.4 -11.1 441.7 -18.1 -9.9
(1.7) M2 (items 1.3 and 1.6) 3 390.1 20.7 6.8 3 632.2 14.4 9.5 3 661.7 29.7 9.1 3 702.8 39.7 9.6
(1.8)Repurchase agreements2) 10.0 1.6 - 22.8 4.5 - 24.1 1.3 - 14.7 -9.4 -
(1.9)Money market fund shares/units2) 0.9 -0.1 - 0.7 0.0 - 0.7 0.0 - 0.7 0.1 -
(1.10)Debt securities issued with maturity up to 2Y2) 0.0 0.0 - 0.0 0.0 - 0.0 0.0 - 0.7 0.7 -
(1.11)Marketable instruments (items 1.8, 1.9 and 1.10)
11.0 1.6 -43.9 23.4 4.5 173.9 24.8 1.3 163.6 16.1 -8.7 46.9
COUNTEPARTS OF M3MFI liabilities
(2)Holdings deposits against central government
143.5 -10.2 -56.7 234.9 5.7 6.9 233.4 -1.4 48.3 236.1 2.6 60.6
(3)Longer-term fin. deposits against other residents (items 3.1 to 3.4)
1 055.7 -4.4 5.9 1 039.7 10.1 3.0 1 023.6 -15.8 1.6 1 018.2 -8.1 1.2
(3.1)Deposits with agreed maturity over 2Y
239.6 0.0 -3.8 227.2 -1.4 -4.1 230.7 3.4 -3.7 229.8 -0.8 -4.1
(3.2)Deposits redeemable at notice over 3M
33.3 -0.1 -8.1 29.3 -0.3 -14.0 29.2 -0.2 -12.7 29.0 -0.2 -12.8
(3.3)Debt securities issued with maturity over 2Y
126.4 0.0 24.2 129.4 -0.4 10.2 131.4 1.8 -1.3 129.1 -2.4 -3.1
(3.4) Capital and reserves 656.4 -4.2 8.0 653.7 12.2 5.7 632.4 -20.8 5.0 630.2 -4.6 4.8
MFI assets
(4)Credit to residents (items 4.1 and 4.2)
3 196.1 26.5 4.2 3 265.1 20.8 3.1 3 281.0 17.5 4.1 3 297.6 18.1 3.8
(4.1)Credit to general government
802.4 5.8 -1.7 707.7 -19.1 -14.5 708.8 1.9 -11.4 702.4 -5.7 -12.8
(4.2) Credit to private sector 2 393.8 20.8 6.3 2 557.4 39.9 9.3 2 572.2 15.6 9.3 2 595.1 23.8 9.4
(5) Net foreign assets 1 401.7 -36.3 -3.8 1 647.7 -5.6 19.2 1 681.9 33.3 20.0 1 695.3 7.7 23.5
(6)Other counterparts of M3 (residual) (=M3+items 2,3 - items 4,5) 2)
2.4 17.4 - 17.4 19.6 - -19.4 -36.9 - -19.7 -0.3 -
1) Net value of flow data calculated by adjusting the difference between end-of-period levels for the effect of non-transactions-related factors.2) Given the significant variability of the underlying values, annual growth rates are not calculated.

MONETARY STATISTICS
Czech National Bank
8
TABLE 5 – SECTOR BREAKDOWN OF COMPONENTS OF M3
CZK billions
2015 2016
May March April May
Stocks Flows 1) Stocks Flows 1) Stocks Flows 1) Stocks Flows 1)
(1) Overnight deposits 2 451.5 45.6 2 693.5 20.7 2 723.2 29.9 2 779.4 55.0
(1.1) Other general government 165.3 10.8 189.8 12.8 184.9 -5.0 195.1 10.3
(1.2) Other financial intermediaries2) 54.2 1.9 71.6 8.7 77.3 5.7 80.9 3.5
(1.3)Insurance corporations and pension funds
18.5 -0.6 40.1 -1.7 36.6 -3.5 42.8 6.1
(1.4) Non-financial corporations 770.9 22.6 818.1 -8.0 821.2 3.3 846.1 24.2
(1.5) Households 3) 1 442.6 10.9 1 573.9 8.9 1 603.1 29.3 1 614.4 10.8
(2)M2 - M1 (other short- term deposits)
490.8 -27.2 463.0 -9.4 459.6 -3.4 441.7 -18.1
(2.1) Other general government 24.5 -0.8 33.9 1.7 32.8 -1.2 31.2 -1.6
(2.2) Other financial intermediaries 2) 38.1 0.9 36.9 1.0 37.0 0.1 31.1 -6.0
(2.3)Insurance corporations and pension funds
15.1 -5.4 15.8 -5.1 18.1 2.3 12.7 -5.4
(2.4) Non-financial corporations 82.0 -12.8 64.9 -3.4 63.8 -1.1 72.6 8.8
(2.5) Households 3) 331.1 -9.0 311.5 -3.7 308.0 -3.5 294.1 -14.0
(3)Repurchase agreements (a part of M3 - M2)
10.0 1.6 22.8 4.5 24.1 1.3 14.7 -9.4
1) Net value of flow data calculated by adjusting the difference between end-of-period levels for the effect of non-transactions-related factors.2) Including other financial intermediaries (without insurance corporations and pension funds) (S.124 and S.125 according to ESA2010), financial auxilliaries (S.126 according to ESA2010) and captive financial insitutions (S.127 according to ESA2010).3) Including households (S.14) and non-profit inctitutions serving households (S.15) according to ESA2010.
Overnight deposits and other short-term deposits (CZK billions) and their annual growth rates (%)
-20
-15
-10
-5
0
5
10
15
20
0
500
1 000
1 500
2 000
2 500
3 000
3 500
Other short-term depositsOvernight depositsAnnual growth rate of overnight deposits (right-hand scale)Annual growth rate of other short-term desposits (right-hand scale)

MONETARY STATISTICS
Czech National Bank
9
TABLE 6 – LOANS TO PRIVATE SECTOR
CZK billions
2015 2016
May March April May
Stocks Flows 1) Stocks Flows 1) Stocks Flows 1) Stocks Flows 1)
(1) Loans to non-financial corporations 914.1 11.7 974.4 29.7 979.2 5.2 978.9 0.2
(1.1) up to 1 year 271.0 3.3 251.1 11.0 252.8 1.9 252.0 -0.6
(1.2) over 1 year and up to 5 years 162.9 0.3 195.0 14.8 192.1 -2.8 185.4 -6.5
(1.3) over 5 years 480.2 8.1 528.3 4.0 534.3 6.1 541.5 7.3
(2) Loans to households2) 1 258.2 7.5 1 339.7 8.0 1 347.7 8.4 1 357.3 9.9
(2.1) Consumer credit 193.4 1.1 212.0 1.7 212.1 0.4 214.2 2.2
(2.2) Lending for house purchase 927.3 5.7 987.4 6.2 994.9 7.6 1 001.9 7.2
(2.3) Other lending 137.4 0.7 140.3 0.1 140.8 0.5 141.2 0.5
(3)Loans to other financial intermediaries3) 148.3 -0.5 168.7 2.1 169.4 0.8 181.0 11.6
(4)Loans to insurance corporations and pension funds
0.0 0.0 0.9 0.1 2.2 1.3 2.2 0.0
1) Net value of flow data calculated by adjusting the difference between end-of-period levels for the effect of non-transactions-related factors.2) Including households (S.14) and non-profit inctitutions serving households (S.15) according to ESA2010.3) Including other financial intermediaries (without insurance corporations and pension funds) (S.124 and S.125 according to ESA2010), financial auxilliaries (S.126 according to ESA2010) and captive financial insitutions (S.127 according to ESA2010).
Loans to private sector (CZK billions) and annual growth of loans to non-financial institutions and households (%)
-10
-5
0
5
10
15
0
500
1 000
1 500
2 000
2 500
3 000
Loans to insurance corporations and pension fundsLoans to other financial intermediariesLoans to householdsLoans to non-financial corporationsLoans to private sectorAnnual growth of loans to households (right-hand scale)Annual growth of loans to non-financial corporations (right-hand scale)
MONETARY STATISTICS
Czech National Bank
10
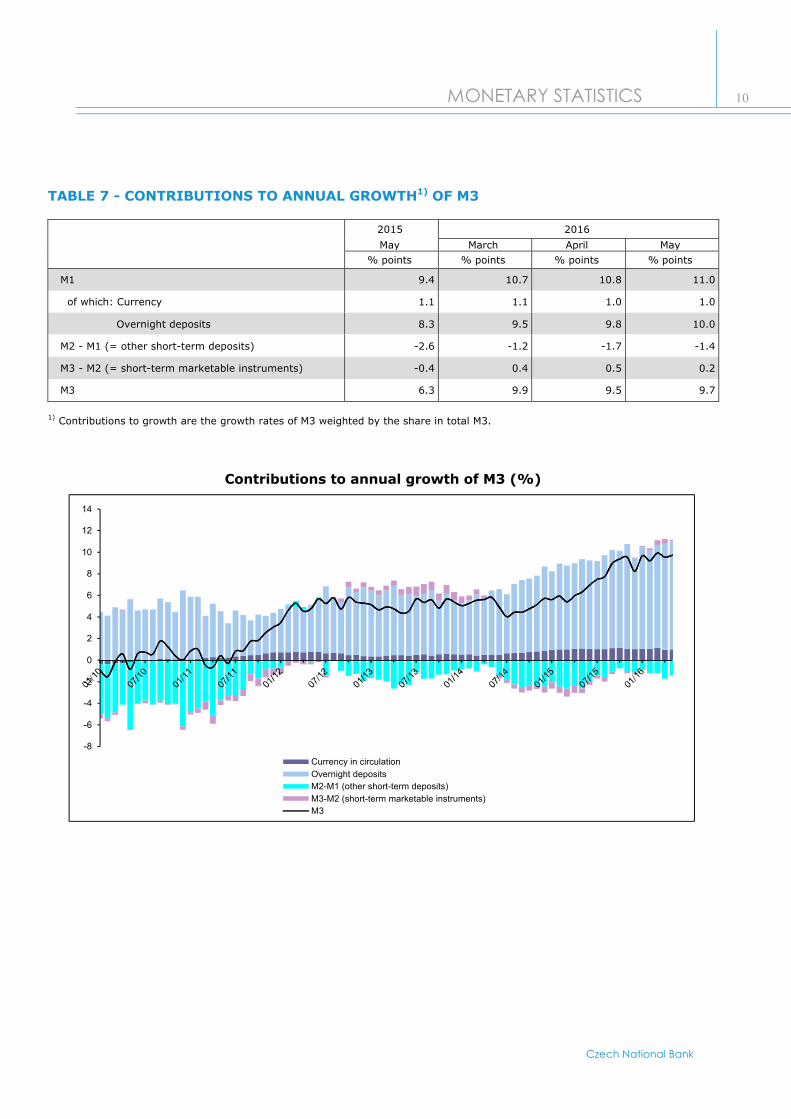
TABLE 7 - CONTRIBUTIONS TO ANNUAL GROWTH1) OF M3
2015 2016
May March April May
% points % points % points % points
M1 9.4 10.7 10.8 11.0
of which: Currency 1.1 1.1 1.0 1.0
Overnight deposits 8.3 9.5 9.8 10.0
M2 - M1 (= other short-term deposits) -2.6 -1.2 -1.7 -1.4
M3 - M2 (= short-term marketable instruments) -0.4 0.4 0.5 0.2
M3 6.3 9.9 9.5 9.7
1) Contributions to growth are the growth rates of M3 weighted by the share in total M3.
Contributions to annual growth of M3 (%)
-8
-6
-4
-2
0
2
4
6
8
10
12
14
Currency in circulation
Overnight deposits
M2-M1 (other short-term deposits)
M3-M2 (short-term marketable instruments)
M3

MONETARY STATISTICS
Czech National Bank
11
TABLE 8 - CONTRIBUTIONS TO ANNUAL GROWTH 1) OF LOANS TO PRIVATE SECTOR
2015 2016
May March April May
% points % points % points % points
Non-financial corporations 2.3 4.0 3.9 3.3
Households2) 2.9 3.9 4.1 4.1
Other financial intermediaries3) 0.8 1.3 1.3 1.8
Insurance corporations and pension funds 0.0 0.0 0.1 0.1
Loans to private sector4) 6.0 9.3 9.3 9.4
1) Contributions to growth are the growth rates of lending weighted by the share in total lending to private sector.2) Including households (S.14) and non-profit inctitutions serving households (S.15) according to ESA2010.3) Including other financial intermediaries (without insurance corporations and pension funds) (S.124 and S.125 according to ESA2010), financial auxilliaries (S.126 according to ESA2010) and captive financial insitutions (S.127 according to ESA2010).4) Including all sectors without general government (S.13) and MFIs sector (S.121, S.122 and S. 123) according to ESA2010.
Contributions to annual growth of loans to private sector (%)
-6
-4
-2
0
2
4
6
8
10
12
Non-financial corporationsHouseholdsOther financial intermediariesInsurance corporations and pension fundsLoans to private sector

MONETARY STATISTICS
Czech National Bank
12
TABLE 9a - BALANCE SHEETS OF MONETARY FINANCIAL INSTITUTIONS BY REPORTING INSTITUTIONS (ASSETS): MAY 2016
CZK billions
Monetary financial institutionsConsolidated balance
sheet of MFIsCNBOther monetary
financial institutions
(1) ASSETS TOTAL 1 844.3 6 054.0 6 207.1
(1.1) Loans to residents 2.5 3 880.9 2 572.1
MFI 0.0 1 311.3 -
General government 0.0 52.7 52.7
Other residents 2.5 2 516.9 2 519.4
(1.2)Holdings of securities other than shares issued by residents
0.0 973.8 668.2
MFI 0.0 305.7 -
General government 0.0 649.7 649.7
Other residents 0.0 18.4 18.4
(1.3) Money market fund shares/units 0.0 0.0 -
Holdings of shares/other equity issued by residents 0.0 96.9 57.3
MFI 0.0 39.7 -
Other residents 0.0 57.3 57.3
(1.5) External assets 1 829.6 737.9 2 567.5
(1.6) Fixed assets 10.8 123.0 133.8
(1.7) Remaining assets 1.3 241.4 208.3
Consolidated balance sheet of MFIs – assets
41%
12%
41%
6%
Loans to residents
Holdings of debt securitiesissued by residents
External assets
Remaining assets
MONETARY STATISTICS
Czech National Bank
13
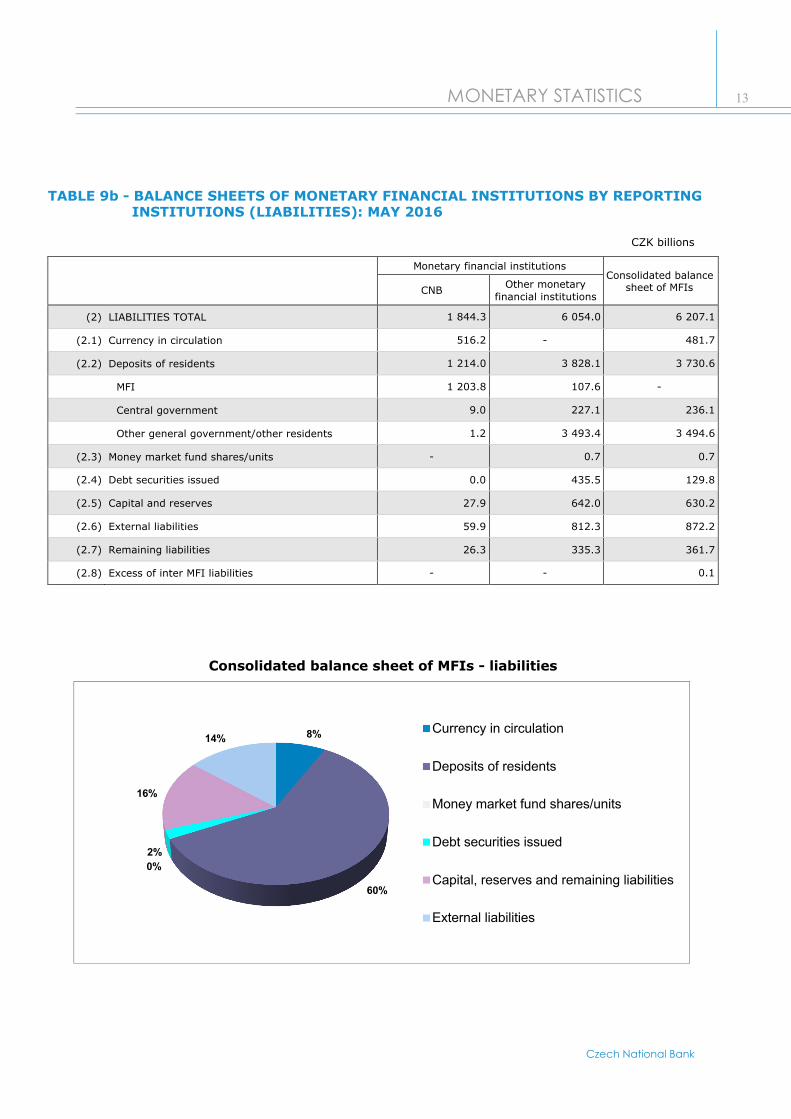
TABLE 9b - BALANCE SHEETS OF MONETARY FINANCIAL INSTITUTIONS BY REPORTING INSTITUTIONS (LIABILITIES): MAY 2016
CZK billions
Monetary financial institutionsConsolidated balance
sheet of MFIsCNBOther monetary
financial institutions
(2) LIABILITIES TOTAL 1 844.3 6 054.0 6 207.1
(2.1) Currency in circulation 516.2 - 481.7
(2.2) Deposits of residents 1 214.0 3 828.1 3 730.6
MFI 1 203.8 107.6 -
Central government 9.0 227.1 236.1
Other general government/other residents 1.2 3 493.4 3 494.6
(2.3) Money market fund shares/units - 0.7 0.7
(2.4) Debt securities issued 0.0 435.5 129.8
(2.5) Capital and reserves 27.9 642.0 630.2
(2.6) External liabilities 59.9 812.3 872.2
(2.7) Remaining liabilities 26.3 335.3 361.7
(2.8) Excess of inter MFI liabilities - - 0.1
Consolidated balance sheet of MFIs - liabilities
8%
60%
0%
2%
16%
14%Currency in circulation
Deposits of residents
Money market fund shares/units
Debt securities issued
Capital, reserves and remaining liabilities
External liabilities
MONETARY STATISTICS
Czech National Bank
14
COMMENTARY ON MONETARY DEVELOPMENTS STATISTICS1) (TABLES 3-9): MAY 2016
The evolution of the annual growth rate of M3 had been characterised by fluctuations around zero from the start of 2010 to the first half of 2011. It started to grow gradually in July 2011 and stood at around 5% from March 2012. The upward trend observed since April 2015 halted in December and the annual growth rate declined to 8.2% (from 9.6% in November 2015). It stood again above 9% in all months of 2016 (9.7% in May). As a result of financial transactions, M3 rose by CZK 31.1 billion month on month (and by CZK 330.9 billion year on year), reaching CZK 3,718.9 billion.
Main components of M3
The increase in the annual growth rate of M3 from 9.5% in April to 9.7% in May was due to a higher contribution of overnight deposits (up from 9.8 percentage points in April to 10.0 percentage points). The 0.2 percentage point increase in overnight deposits was affected by the contribution of M1, which rose from 10.8 percentage points in April to 11.0 percentage points in May. (Table 7)
The increase in the annual growth rate of overnight deposits from 13.8% in April to 13.9% in May was reflected in a rise in the annual growth rate of M1 to 12.9% (from 12.8% in April). Overnight deposits rose by CZK 55.0 billion month on month, due to financial transactions. Overnight deposits increased in alleconomic sectors. The largest increase was recorded for deposits of insurance corporations and pension funds (up by 16.7%, or CZK 6.1 billion). Deposits of other government also rise (up by 5.6%, or CZK 10.3 billion), as did deposits of other financial intermediaries (up by 4.6%, or CZK 3.5 billion), deposits of non-financial corporations (up by 3.0%, or CZK 24.2 billion) and deposits of households (up by 0.7%, or CZK 10.8 billion).Currency in circulation increased by 0.6% month on month, amounting to CZK 481.7 billion (CZK 478.9 billion in April).Other short-term deposits (excluding overnight deposits) fell by CZK 18.1 billion (or 3.9%) month on month, due to financial transactions. The annual rate of growth of these deposits rose to -9.9% (-11.1% in April). The annual rate of growth of deposits with agreed maturity of up to two years increased by 6.6 percentage points compared to the previous month, reaching -7.0 %. The annual rate of growth of deposits redeemable at notice of up to 3 months fell from -9.1% in April to -12.1% in May. Within other short-term deposits, the largest decline was recorded for deposits of insurance corporations and pension funds (down by 29.8%, or CZK 5.4 billion). Decreases were also recorded for deposits of other financial intermediaries (down by 16.2%, or CZK 6.0 billion), other government (down by 4.7%, or CZK 1.6 billion) and households (down by 4.5%, or CZK 14.0 billion). By contrast, deposits of non-financial corporations increased by 13.8%, or CZK 8.8 billion. Marketable instruments, which consist of repos, money market fund shares/units and debt securities with maturities of up to two years, decreased by 34.9% month on month due to financial transactions, to CZK 16.1 billion.
Main counterparts of M3
The annual rate of growth of loans to the private sector, which are the most important counterpart of M3, stood at 9.4% in May 2016. The annual growth rate of loans to non-financial corporations, a major component of this indicator, was stagnant in the second half of 2011. It recorded a decline in 2012 (from 7.1% in November 2011 to 1.1% in November 2012), was irregularly volatile from December 2012 and started to gradually increase in January 2015, to 11.8% in September 2015. Following a decline in 2015 Q4 (6.2% in December 2015), it stood at 8.5% in May 2016. The annual growth rate of loans to households is another major component; it showed a downward trend from January 2008 (34.2%) to February 2013 (4.0%). Later this growth rate fluctuated around 5%. An upward trend returned in January 2015, and the annual growth rate of loans to households reached 7.5% in May 2016.The annual growth rate of loans provided to general government and purchased securities was -12.8 % in May (-11.4% in April). The annual growth rate of net external assets rose to 23.5% at the end of May (from 20.0% in April). The annual rate of growth of longer-term financial liabilities fell from 1.6% in April to 1.2% in May. The annual growth rate of deposits of central government increased to 60.6% in May (from 48.3% in April).
1) All increases and decreases referred to in this commentary relate only to financial transactions adjusted for non transaction effects.

MONETARY STATISTICS
Czech National Bank
15
TABLE 10 - INTEREST RATES OF MONETARY FINANCIAL INSTITUTIONS - NEW BUSINESS1)
2015 2016
May March April May
Interest rate (%
p.a.)
Volume(CZK
billions)
Interest rate (%
p.a.)
Volume(CZK
billions)
Interest rate (%
p.a.)
Volume(CZK
billions)
Interest rate (%
p.a.)
Volume(CZK
billions)
(1) Deposits from households2)
(1.1) Overnight3) 0.27 1 376.6 0.19 1 502.2 0.18 1 529.2 0.16 1 539.6
of which: current accounts 0.13 823.1 0.09 930.3 0.08 952.5 0.08 944.8
(1.2) With agreed maturity 1.30 3.6 1.24 5.5 0.97 4.6 0.97 4.8
of which: Up to 2 years 1.16 3.0 1.19 4.6 0.91 3.3 0.92 4.2
(1.3) Redeemable at notice3), 4) 1.41 305.3 1.25 284.4 1.19 282.4 1.10 267.9
(1.3.1) Up to 3 months’ notice 1.53 272.5 1.37 255.4 1.31 253.6 1.21 239.3
(1.3.2) Over 3 months’ notice 0.40 32.8 0.21 29.0 0.19 28.8 0.19 28.6
(2) Deposits from non-financial corporat.
(2.1) Overnight3) 0.13 570.2 0.07 599.5 0.07 600.9 0.06 621.0
(2.2) With agreed maturity 0.19 10.4 0.18 12.4 0.45 8.6 0.05 16.8
of which: Up to 1 year 0.18 10.3 0.16 11.6 0.39 8.4 0.05 16.7
(3) Loans to households2)
(3.1) Consumer. house pur. and other loans 4.50 35.4 4.36 39.3 4.44 38.1 4.26 43.1
(3.1.1) Consumer credit 12.58 6.6 10.99 8.7 10.91 8.7 10.68 9.5
(3.1.2) Lending for house purchase 2.56 24.9 2.36 27.0 2.40 25.6 2.33 29.6
of which: Mortgage lending5) 2.30 18.3 2.14 21.8 2.15 19.9 2.10 23.1
Saving for building purposes 4.12 3.1 4.33 2.0 4.27 2.3 4.16 2.6
(3.1.3) Other lending 3.13 3.8 3.29 3.6 3.36 3.7 3.23 4.0
(3.2) Overdraft6) and revolving loans3) 13.92 22.1 13.99 23.2 13.81 22.4 13.83 23.0
(3.3) Credit cards3) 20.14 21.8 21.51 26.6 21.49 26.1 21.43 26.0
(4) Loans to non-financial corporations
(4.1) Total loans (all size categories) 1.96 44.6 2.05 45.6 2.10 36.2 1.98 35.8
(4.1.1) Up to CZK 7.5 million 3.41 3.3 3.35 2.8 3.31 3.2 3.25 3.4
of which: Up to 3 months rate fixation7) 3.13 2.0 3.17 1.6 3.14 1.9 3.02 2.0
(4.1.2) CZK 7.5-30 million 2.22 5.1 2.09 5.7 2.06 5.1 2.10 5.4
of which: Up to 3 months rate fixation7) 2.16 3.9 1.93 4.2 1.98 3.7 2.05 4.0
(4.1.3) Over to CZK 30 million 1.79 36.2 1.94 37.1 1.97 27.9 1.79 27.0
of which: Up to 3 months rate fixation7) 1.70 32.2 1.79 23.1 1.96 23.0 1.91 19.5
(4.2) Overdraft6), revolving and credit cards3) 2.38 228.6 2.32 213.3 2.31 215.0 2.28 212.9
(5) APRC8) on loans to households2) 4.95 31.5 4.76 35.7 4.80 34.3 4.61 39.1
(5.1) Consumer credit 13.51 6.6 11.58 8.7 11.46 8.7 11.22 9.5
(5.2) Lending for house purchase 2.66 24.9 2.57 27.0 2.54 25.6 2.48 29.61) The interest rates applied by MFIs to CZK-denominated deposits and loans vis-à-vis households and non-financial corporations
resident in the Czech Republic. New business refers to any new agreement between the customer and the MFI within given perio d.2) Including households (S.14) and non-profit institutions serving households (S.15) according to the classification ESA2010.3) For this instrument category the new business are equal to the outstanding amounts (end-of-period stocks).4) Households deposits redeemable at notice include similar deposits of non-financial corporations of which volumes are negligible
in this category.5) Since 2009, the amendment to Act No. 190/2004 Coll., on Bonds, as amended, has been fully applied, under which a mortgage loan
is a loan whose redemption, including appurtenances (i.e. interest etc.), is secured by lien (right of pledge) over real estate (property), including property under construction, where the claim arising from the loan does not exceed twice the pledge value of the mortgaged property (Article 28(3)).
6) Debit balances on current accounts. The total amount owed by the borrower is included, irrespective of whether is within or beyond any limit agreed beforehand.
7) The initial period of fixations is a predetermined period of time at the start of the contract during which the value of the interest rate cannot change. Period up to 3 months includes floating rates.
8) Annual percentage rate of charge (APRC) covers total costs of the credit to the client including charges etc.
MONETARY STATISTICS
Czech National Bank
16
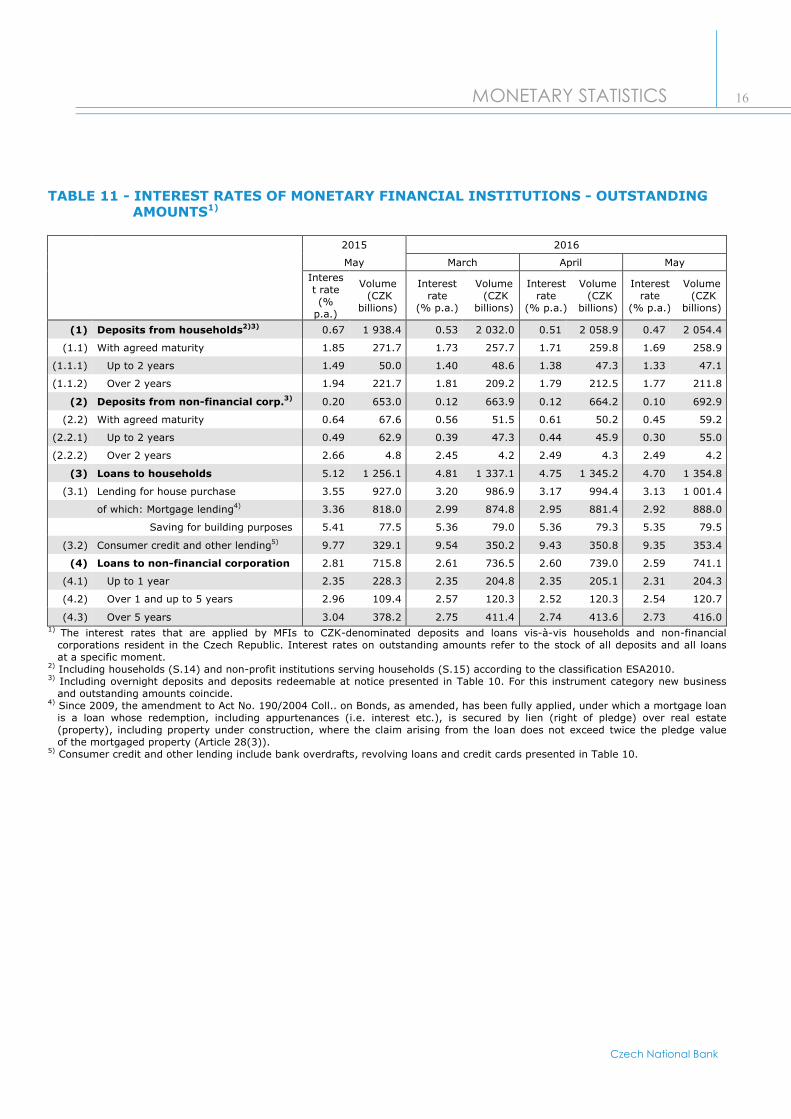
TABLE 11 - INTEREST RATES OF MONETARY FINANCIAL INSTITUTIONS - OUTSTANDING AMOUNTS1)
2015 2016
May March April May
Interest rate (%
p.a.)
Volume(CZK
billions)
Interest rate
(% p.a.)
Volume(CZK
billions)
Interest rate
(% p.a.)
Volume(CZK
billions)
Interest rate
(% p.a.)
Volume(CZK
billions)
(1) Deposits from households2)3) 0.67 1 938.4 0.53 2 032.0 0.51 2 058.9 0.47 2 054.4
(1.1) With agreed maturity 1.85 271.7 1.73 257.7 1.71 259.8 1.69 258.9
(1.1.1) Up to 2 years 1.49 50.0 1.40 48.6 1.38 47.3 1.33 47.1
(1.1.2) Over 2 years 1.94 221.7 1.81 209.2 1.79 212.5 1.77 211.8
(2) Deposits from non-financial corp.3) 0.20 653.0 0.12 663.9 0.12 664.2 0.10 692.9
(2.2) With agreed maturity 0.64 67.6 0.56 51.5 0.61 50.2 0.45 59.2
(2.2.1) Up to 2 years 0.49 62.9 0.39 47.3 0.44 45.9 0.30 55.0
(2.2.2) Over 2 years 2.66 4.8 2.45 4.2 2.49 4.3 2.49 4.2
(3) Loans to households 5.12 1 256.1 4.81 1 337.1 4.75 1 345.2 4.70 1 354.8
(3.1) Lending for house purchase 3.55 927.0 3.20 986.9 3.17 994.4 3.13 1 001.4
of which: Mortgage lending4) 3.36 818.0 2.99 874.8 2.95 881.4 2.92 888.0
Saving for building purposes 5.41 77.5 5.36 79.0 5.36 79.3 5.35 79.5
(3.2) Consumer credit and other lending5) 9.77 329.1 9.54 350.2 9.43 350.8 9.35 353.4
(4) Loans to non-financial corporation 2.81 715.8 2.61 736.5 2.60 739.0 2.59 741.1
(4.1) Up to 1 year 2.35 228.3 2.35 204.8 2.35 205.1 2.31 204.3
(4.2) Over 1 and up to 5 years 2.96 109.4 2.57 120.3 2.52 120.3 2.54 120.7
(4.3) Over 5 years 3.04 378.2 2.75 411.4 2.74 413.6 2.73 416.01) The interest rates that are applied by MFIs to CZK-denominated deposits and loans vis-à-vis households and non-financial
corporations resident in the Czech Republic. Interest rates on outstanding amounts refer to the stock of all deposits and all loans at a specific moment.
2) Including households (S.14) and non-profit institutions serving households (S.15) according to the classification ESA2010.3) Including overnight deposits and deposits redeemable at notice presented in Table 10. For this instrument category new business
and outstanding amounts coincide.4) Since 2009, the amendment to Act No. 190/2004 Coll.. on Bonds, as amended, has been fully applied, under which a mortgage loan
is a loan whose redemption, including appurtenances (i.e. interest etc.), is secured by lien (right of pledge) over real estate (property), including property under construction, where the claim arising from the loan does not exceed twice the pledge value of the mortgaged property (Article 28(3)).
5) Consumer credit and other lending include bank overdrafts, revolving loans and credit cards presented in Table 10.

MONETARY STATISTICS
Czech National Bank
17
INTEREST RATES OF MONETARY FINANCIAL INSTITUTIONS ON NEW BUSINESS
New business, deposits New business, loans
INTEREST RATES OF MONETARY FINANCIAL INSTITUTIONS ON OUTSTANDING AMOUNTS
Outstanding amounts, deposits Outstanding amounts, loans
0.0
0.5
1.0
1.5
2.0
2.5
Households - overnight
Households - deposits with agreed maturity
Non-financial corp. - overnight
Non-financial corp. - deposits with agreed maturity
Deposits redeemable at notice
0
2
4
6
8
10
12
14
16
Households - consumer credit
Households - lending for house purchase
Households - overdraft and revolving
Non-fin. corp. - loans over CZK 30 mil.
Non-financial corp. - overdraft, revolving and credit cards
0.0
0.5
1.0
1.5
2.0
2.5
Households with agreed maturity up to 2 years
Households with agreed maturity over to 2 years
Non-financial corp. with agreed maturity up to 2 years
2.0
4.0
6.0
8.0
10.0
12.0
Households - consumer credit Households - lend. for house pur.
Non-financial corp. up to 1 year Non-financial corp. - over 5 years
MONETARY STATISTICS
Czech National Bank
18
COMMENTARY ON MFI INTEREST RATES (TABLES 10 AND 11) – MAY 2016
Interest rates on new business
In May, interest rates on new deposits recorded the largest change for household deposits redeemable at notice. The interest rate on overnight deposits of households fell to an all-time low of 0.16%. The rate on current account deposits remained at the lowest level since the start of the measurement (0.08%). The rate on deposits with agreed maturity was unchanged from April at 0.97% and the rate on deposits redeemable at notice dropped to 1.10% (this rate is the only one to include, in addition to the household sector, also similar deposits of non-financial corporations, whose volumes are negligible in this category).
The interest rate on overnight deposits of non-financial corporations dropped to a record-low 0.06%. The rate on deposits with agreed maturity of up to one year (which as a rule account for 100% of all deposits with agreed maturity in this sector) saw a decrease of 0.34 percentage point to 0.05%.
Within interest rates on new loans to households, other loans recorded the biggest change in May. Interest rates on loans to non-financial corporations saw the largest change for loans of over CZK 30 million.The overall interest rate on consumer credit, loans for house purchase and other loans declined by 0.18 percentage point to 4.26%. Consumer credit was remunerated at 10.68%, down by 0.23 percentage point. This was the lowest level in the available time series. This indicator decreased by 1.90 percentage points year on year. The interest rate on loans for house purchase was down by 0.07 percentage point to 2.33%. The interest rate on other loans decreased to 3.23%. The interest rate on mortgage loans stood at 2.10% and the volume of these loans was CZK 23.1 billion. The figures on mortgage loans represent the record results for this type of loans.
The interest rate on new loans to non-financial corporations (excluding overdrafts, revolving loans and credit cards) decreased by 0.12 percentage point to 1.98%. The rate on loans of up to CZK 7.5 million dropped by 0.06 percentage point to 3.25%. Loans of over CZK 7.5 million and up to CZK 30 million were remunerated at 2.10%, i.e. 0.04 percentage point higher than in April. The interest rate on loans of over CZK 30 million declined by 0.18 percentage point, reaching 1.79%.
Interest rates on outstanding amounts
The average interest rates on outstanding amounts of deposits of households changed only slightly in May. Changes were more pronounced for non-financial corporations. Total deposits of households were remunerated at 0.47%. The interest rate on overnight deposits fell to 0.16%. The interest rate on deposits redeemable at notice dropped to 1.10% and the rate on deposits with agreed maturity declined to 1.69%.
Total deposits of non-financial corporations were remunerated at 0.10%, down by 0.02 percentage point from April. The rate on overnight deposits dropped to the lowest level in the available time series (0.06%). The interest rate on deposits with agreed maturity fell to 0.45%.
Interest rates on outstanding amounts of loans to households changed only slightly in May. The changes in interest rates on outstanding amounts of loans to non-financial corporations were also just a few basis points.The overall interest rate on loans to households fell by 0.05 percentage point to 4.70%. The interest rate on loans for house purchase declined to 3.13%. Consumer credit and other loans were remunerated at 9.35%, down by 0.08 percentage point from April.
The average interest rate on outstanding amounts of loans to non-financial corporations decreased to 2.59%. Following three months of stagnation, the rate on loans with maturity of up to one year decreased by 0.04 percentage point to 2.31%. By contrast, the rate on loans with maturity of over one year and up to five years was up by 0.02 percentage point to 2.54%. The interest rate on loans for house purchase with maturity of over five years declined for the fifteenth consecutive month, to an all-time low of 2.73%.

MONETARY STATISTICS
Czech National Bank
19
TABLE 12 – AGGREGATED BALANCE SHEET OF INVESTMENT FUNDS 1)
CZK billions
2015
April
2016
February March April
Out-standing amounts
Transa-ctions
Out-standing amounts
Transa-ctions
Out-standing amounts
Transa-ctions
Out-standing amounts
Transa-ctions
Total Assets 311.4 3.9 338.9 3.2 348.0 5.8 352.3 4.7
(1.1) Deposits 35.2 1.6 40.3 -0.5 41.0 0.7 41.8 0.8
(1.2) Securities other than shares 92.0 1.2 98.3 1.1 98.4 0.7 98.8 0.7
Residents 43.5 -0.2 46.9 -0.3 46.5 -0.1 46.5 0.3
Non-residents 48.4 1.3 51.4 1.4 51.9 0.8 52.3 0.4
(1.3) Shares and other equity 46.1 -0.2 54.3 1.1 56.6 0.6 57.3 0.6
Residents 11.7 -0.2 17.3 0.2 18.6 0.9 19.4 0.6
Non-residents 34.4 0.0 37.1 1.0 38.0 -0.3 38.0 0.0
(1.4) Investment fund shares (including MMFs)
62.2 2.3 69.0 1.6 73.1 2.8 75.7 2.1
Residents 10.3 0.2 13.8 0.4 14.1 0.1 14.1 0.0
Non-residents 51.9 2.1 55.2 1.1 59.0 2.7 61.6 2.1
(1.5) Other assets 76.0 -1.0 77.0 -0.1 78.8 1.0 78.7 0.5
Total Liabilities 311.4 3.9 338.9 3.2 348.0 5.8 352.3 4.7
(2.1) Loans accepted 13.6 0.0 12.6 -0.1 12.7 0.2 12.8 0.0
(2.2) Investment fund shares 281.3 5.0 307.0 3.3 312.9 2.3 316.2 3.6
(2.3) Other liabilities 16.5 -1.1 19.3 0.0 22.3 3.4 23.4 1.11) Investment Funds (IFs) represent Mutual and Investment Funds other than Money Market Funds which are residents in the Czech Republic.Funds of funds and funds of qualified investors are classified under the category of assets or funds in which they primarily invest.Data are published by the 15th calendar day of the second month following the reference period.
Balance sheet total – breakdown by asset items (CZK billions)
0
50
100
150
200
250
300
350
400
12-
08
3-0
9
6-0
9
9-0
9
12-
09
3-1
0
6-1
0
9-1
0
12-
10
3-1
1
6-1
1
9-1
1
12-
11
3-1
2
6-1
2
9-1
2
12-
12
3-1
3
6-1
3
9-1
3
12-
13
3-1
4
6-1
4
9-1
4
12-
14
3-1
5
6-1
5
9-1
5
12-
15
3-1
6
Deposits Securities other than shares IF shares/units (incl . MMFs)
Shares and other equity Other assets Total assts
MONETARY STATISTICS
Czech National Bank
20
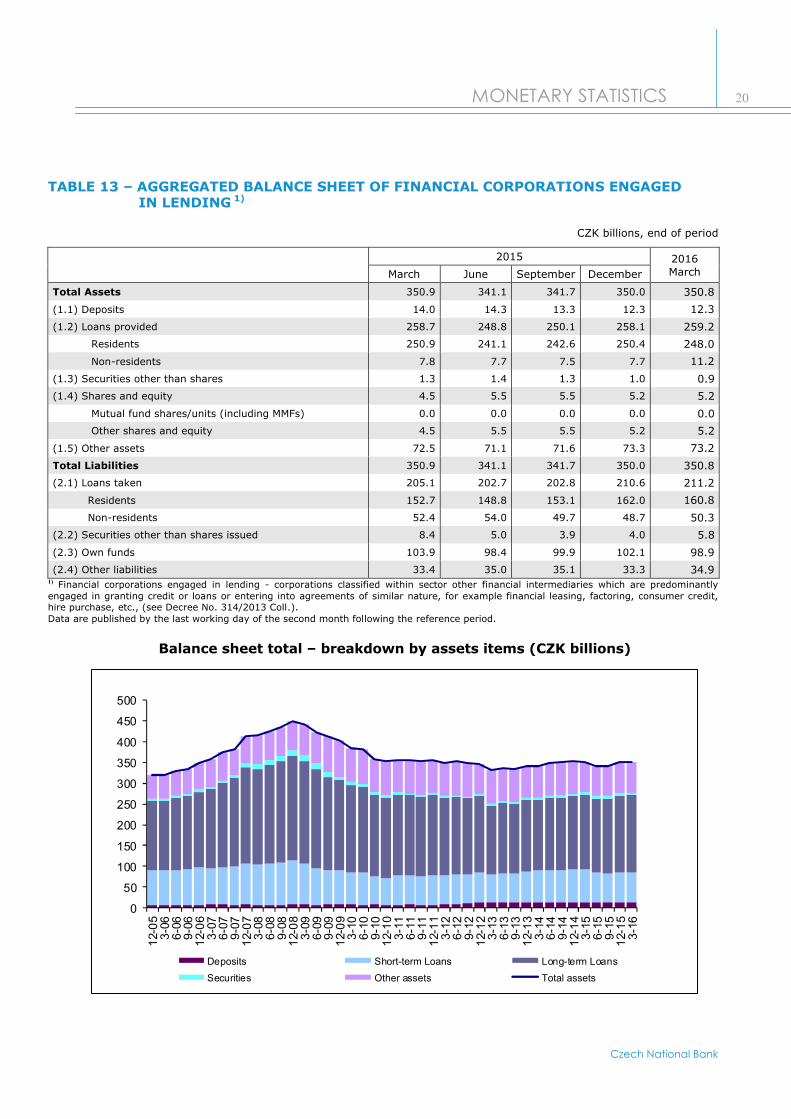
TABLE 13 – AGGREGATED BALANCE SHEET OF FINANCIAL CORPORATIONS ENGAGED IN LENDING 1)
CZK billions, end of period
2015 2016MarchMarch June September December
Total Assets 350.9 341.1 341.7 350.0 350.8
(1.1) Deposits 14.0 14.3 13.3 12.3 12.3
(1.2) Loans provided 258.7 248.8 250.1 258.1 259.2
Residents 250.9 241.1 242.6 250.4 248.0
Non-residents 7.8 7.7 7.5 7.7 11.2
(1.3) Securities other than shares 1.3 1.4 1.3 1.0 0.9
(1.4) Shares and equity 4.5 5.5 5.5 5.2 5.2
Mutual fund shares/units (including MMFs) 0.0 0.0 0.0 0.0 0.0
Other shares and equity 4.5 5.5 5.5 5.2 5.2
(1.5) Other assets 72.5 71.1 71.6 73.3 73.2
Total Liabilities 350.9 341.1 341.7 350.0 350.8
(2.1) Loans taken 205.1 202.7 202.8 210.6 211.2
Residents 152.7 148.8 153.1 162.0 160.8
Non-residents 52.4 54.0 49.7 48.7 50.3
(2.2) Securities other than shares issued 8.4 5.0 3.9 4.0 5.8
(2.3) Own funds 103.9 98.4 99.9 102.1 98.9
(2.4) Other liabilities 33.4 35.0 35.1 33.3 34.91) Financial corporations engaged in lending - corporations classified within sector other financial intermediaries which are predominantly engaged in granting credit or loans or entering into agreements of similar nature, for example financial leasing, factoring, consumer credit,hire purchase, etc., (see Decree No. 314/2013 Coll.).Data are published by the last working day of the second month following the reference period.
Balance sheet total – breakdown by assets items (CZK billions)
0
50
100
150
200
250
300
350
400
450
500
12-
05
3-0
66
-06
9-0
61
2-0
63
-07
6-0
79
-07
12-
07
3-0
86
-08
9-0
81
2-0
83
-09
6-0
99
-09
12-
09
3-1
06
-10
9-1
01
2-1
03
-11
6-1
19
-11
12-
11
3-1
26
-12
9-1
21
2-1
23
-13
6-1
39
-13
12-
13
3-1
46
-14
9-1
41
2-1
43
-15
6-1
59
-15
12-
15
3-1
6
Deposits Short-term Loans Long-term Loans
Securities Other assets Total assets
MONETARY STATISTICS
Czech National Bank
21
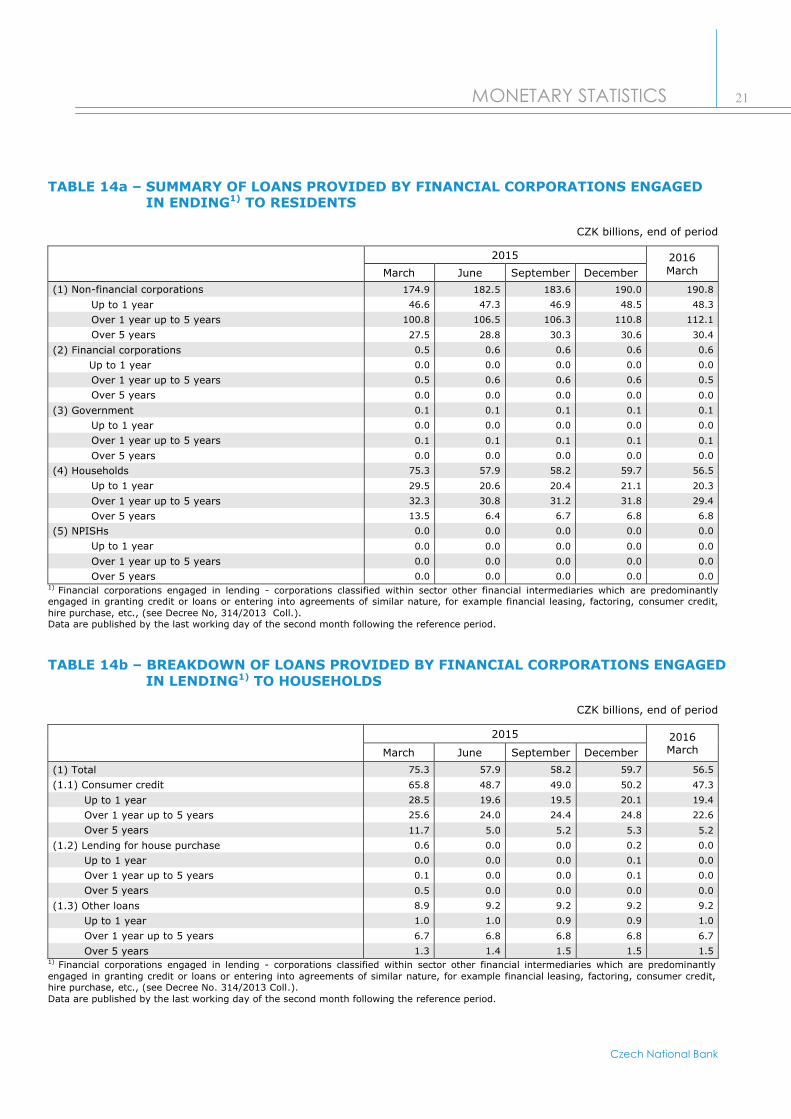
TABLE 14a – SUMMARY OF LOANS PROVIDED BY FINANCIAL CORPORATIONS ENGAGED IN ENDING1) TO RESIDENTS
CZK billions, end of period
2015 2016MarchMarch June September December
(1) Non-financial corporations 174.9 182.5 183.6 190.0 190.8
Up to 1 year 46.6 47.3 46.9 48.5 48.3
Over 1 year up to 5 years 100.8 106.5 106.3 110.8 112.1
Over 5 years 27.5 28.8 30.3 30.6 30.4
(2) Financial corporations 0.5 0.6 0.6 0.6 0.6
Up to 1 year 0.0 0.0 0.0 0.0 0.0
Over 1 year up to 5 years 0.5 0.6 0.6 0.6 0.5
Over 5 years 0.0 0.0 0.0 0.0 0.0
(3) Government 0.1 0.1 0.1 0.1 0.1
Up to 1 year 0.0 0.0 0.0 0.0 0.0
Over 1 year up to 5 years 0.1 0.1 0.1 0.1 0.1
Over 5 years 0.0 0.0 0.0 0.0 0.0
(4) Households 75.3 57.9 58.2 59.7 56.5
Up to 1 year 29.5 20.6 20.4 21.1 20.3
Over 1 year up to 5 years 32.3 30.8 31.2 31.8 29.4
Over 5 years 13.5 6.4 6.7 6.8 6.8
(5) NPISHs 0.0 0.0 0.0 0.0 0.0
Up to 1 year 0.0 0.0 0.0 0.0 0.0
Over 1 year up to 5 years 0.0 0.0 0.0 0.0 0.0
Over 5 years 0.0 0.0 0.0 0.0 0.01) Financial corporations engaged in lending - corporations classified within sector other financial intermediaries which are predominantly engaged in granting credit or loans or entering into agreements of similar nature, for example financial leasing, factoring, consumer credit,hire purchase, etc., (see Decree No, 314/2013 Coll.).Data are published by the last working day of the second month following the reference period.
TABLE 14b – BREAKDOWN OF LOANS PROVIDED BY FINANCIAL CORPORATIONS ENGAGEDIN LENDING1) TO HOUSEHOLDS
CZK billions, end of period
2015 2016MarchMarch June September December
(1) Total 75.3 57.9 58.2 59.7 56.5
(1.1) Consumer credit 65.8 48.7 49.0 50.2 47.3
Up to 1 year 28.5 19.6 19.5 20.1 19.4
Over 1 year up to 5 years 25.6 24.0 24.4 24.8 22.6
Over 5 years 11.7 5.0 5.2 5.3 5.2
(1.2) Lending for house purchase 0.6 0.0 0.0 0.2 0.0
Up to 1 year 0.0 0.0 0.0 0.1 0.0
Over 1 year up to 5 years 0.1 0.0 0.0 0.1 0.0
Over 5 years 0.5 0.0 0.0 0.0 0.0
(1.3) Other loans 8.9 9.2 9.2 9.2 9.2
Up to 1 year 1.0 1.0 0.9 0.9 1.0
Over 1 year up to 5 years 6.7 6.8 6.8 6.8 6.7
Over 5 years 1.3 1.4 1.5 1.5 1.51) Financial corporations engaged in lending - corporations classified within sector other financial intermediaries which are predominantly engaged in granting credit or loans or entering into agreements of similar nature, for example financial leasing, factoring, consumer credit,hire purchase, etc., (see Decree No. 314/2013 Coll.).Data are published by the last working day of the second month following the reference period.
MONETARY STATISTICS
Czech National Bank
22
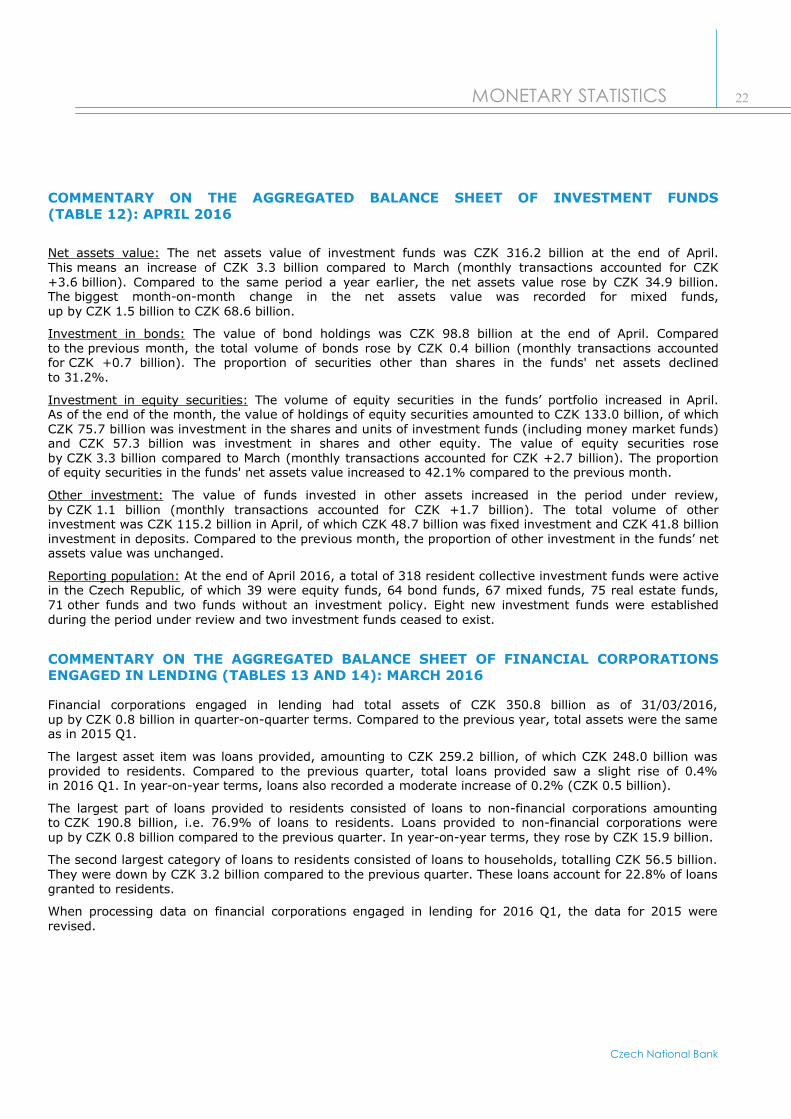
COMMENTARY ON THE AGGREGATED BALANCE SHEET OF INVESTMENT FUNDS (TABLE 12): APRIL 2016
Net assets value: The net assets value of investment funds was CZK 316.2 billion at the end of April. This means an increase of CZK 3.3 billion compared to March (monthly transactions accounted for CZK +3.6 billion). Compared to the same period a year earlier, the net assets value rose by CZK 34.9 billion. The biggest month-on-month change in the net assets value was recorded for mixed funds, up by CZK 1.5 billion to CZK 68.6 billion.
Investment in bonds: The value of bond holdings was CZK 98.8 billion at the end of April. Compared to the previous month, the total volume of bonds rose by CZK 0.4 billion (monthly transactions accounted for CZK +0.7 billion). The proportion of securities other than shares in the funds' net assets declined to 31.2%.
Investment in equity securities: The volume of equity securities in the funds’ portfolio increased in April. As of the end of the month, the value of holdings of equity securities amounted to CZK 133.0 billion, of which CZK 75.7 billion was investment in the shares and units of investment funds (including money market funds) and CZK 57.3 billion was investment in shares and other equity. The value of equity securities rose by CZK 3.3 billion compared to March (monthly transactions accounted for CZK +2.7 billion). The proportionof equity securities in the funds' net assets value increased to 42.1% compared to the previous month.
Other investment: The value of funds invested in other assets increased in the period under review, by CZK 1.1 billion (monthly transactions accounted for CZK +1.7 billion). The total volume of other investment was CZK 115.2 billion in April, of which CZK 48.7 billion was fixed investment and CZK 41.8 billion investment in deposits. Compared to the previous month, the proportion of other investment in the funds’ net assets value was unchanged.
Reporting population: At the end of April 2016, a total of 318 resident collective investment funds were active in the Czech Republic, of which 39 were equity funds, 64 bond funds, 67 mixed funds, 75 real estate funds, 71 other funds and two funds without an investment policy. Eight new investment funds were established during the period under review and two investment funds ceased to exist.
COMMENTARY ON THE AGGREGATED BALANCE SHEET OF FINANCIAL CORPORATIONS ENGAGED IN LENDING (TABLES 13 AND 14): MARCH 2016
Financial corporations engaged in lending had total assets of CZK 350.8 billion as of 31/03/2016, up by CZK 0.8 billion in quarter-on-quarter terms. Compared to the previous year, total assets were the same as in 2015 Q1.
The largest asset item was loans provided, amounting to CZK 259.2 billion, of which CZK 248.0 billion was provided to residents. Compared to the previous quarter, total loans provided saw a slight rise of 0.4% in 2016 Q1. In year-on-year terms, loans also recorded a moderate increase of 0.2% (CZK 0.5 billion).
The largest part of loans provided to residents consisted of loans to non-financial corporations amounting to CZK 190.8 billion, i.e. 76.9% of loans to residents. Loans provided to non-financial corporations were up by CZK 0.8 billion compared to the previous quarter. In year-on-year terms, they rose by CZK 15.9 billion.
The second largest category of loans to residents consisted of loans to households, totalling CZK 56.5 billion. They were down by CZK 3.2 billion compared to the previous quarter. These loans account for 22.8% of loans granted to residents.
When processing data on financial corporations engaged in lending for 2016 Q1, the data for 2015 were revised.
MONETARY STATISTICS
Czech National Bank
23
GLOSSARY
Harmonisation of statistics: the Treaty establishing the European Community tasked the European Central
Bank (ECB) with ensuring harmonised statistics according to Article 5 of the Statute of the European System
of Central Banks. The national central banks of EC Member States therefore collect statistical information
according to a uniform definition, from which the ECB then compiles aggregate data for euro area monetary
policy. Although Council Regulation No 2533/98, which specifies the requirements for statistical data
collection, only concerns euro area countries, the ECB also receives full data sets from the non-participating
countries (e.g. the Czech Republic) in order to monitor their economic and financial development.
Monetary statistics: financial macrostatistics of constituent sub-sectors of the sector S.12 based exclusively
on the “host country” principle. According to this principle, a resident reporting unit is an institution resident
in a given economic territory. The reporting population includes 1) institutions incorporated and located
in the territory, including subsidiaries of parent companies located outside that territory, and 2) branches
of institutions that have their head office outside that territory.
________________________________________________________________________________________
APRC: annual percentage rate of charge, i.e. the rate including interest expenses and all related costs
of the credit to the client (fees etc.).
Investment funds: for the purposes of monetary and banking statistics, investment funds comprise
investment funds other than money market funds which are resident in the Czech Republic. These are
undertakings the sole object of which is collective investment, i.e. pooling investor funds and investing them
under conditions stipulated in the Act on Management Companies and Investment Funds (No. 240/2013 Coll.).
Such undertakings may be constituted under the Act either as unit trust managed by an investment company
or as investment funds.
Consolidated balance sheet of the MFI sector: the basic statistical tool of monetary statistics. It is based
on the residency principle and is obtained by netting out inter-MFI positions on their aggregated balance
sheet.
Consumer credit: loans granted to households for personal use in the consumption of goods and services.
Contribution to annual growth rate: the growth rate of a selected component weighted by its share
in the total growth rate.
Deposits redeemable at notice: deposits that can be withdrawn by clients only after the expiry of a period
of notice agreed in advance, which starts at the moment of notification of the intention to withdraw
the deposit.
Deposits with agreed maturity: deposits than cannot be withdrawn by clients before a predefined maturity.
Financial corporations engaged in lending (FCLs):
Definition: FCLs mean corporations classified within sector S.125 other financial intermediaries which are
predominantly engaged in granting credit or loans or entering into agreements of similar nature, for example
financial leasing, faktoring, consumere credit, hire purchase, etc. (see Decree No. 314/2013 Coll.)
Type of services:
1.Financial leasing - It is financial service, when lessee acquires the right to use good in exchange for rental
payment over predetermined term. All risk and rewards of ownership are transferred from lessor to lessee.
After lapse of predetermined term ownership of good is transferred from lessor to lessee.

MONETARY STATISTICS
Czech National Bank
24
2. Factoring - It is financial service consisting in purchase of short-term receivables ( with maturity 30-90
days) before their maturity date. Receivables are transferred on factoring copany – factor- by supplier
of goods or services.
3. Other lending - This category encompass granting credit or loans or aggreements of similar nature different
from financial leasing and factoring. It deals especially with consumer credit, hire purchase, consumption
loans, etc.
Growth rate: the percentage change in the monitored variable over the reference period, calculated
from the volumes of monthly financial transactions and the outstanding amounts at the beginning of each
month.
Household sector: institutional units included in the sectors of households (S.14) and non-profit institutions
serving households (S.15) under ESA2010.
Housing loans: Loans granted to households for the purpose of purchasing/investing in housing, including
building and home improvements.
Interest rate fixation: a period of interest rate fixation, i.e. a period at the beginning of a contract
for which the agreed interest rate cannot be changed. Period up to 1 year includes floating rates.
MFI longer-term financial liabilities: comprise deposits with an agreed maturity of over two years,
deposits redeemable at a period of notice of over three months, debt securities issued with an original
maturity of more than two years and the capital and reserves of the Czech MFI sector.
Monetary aggregates: comprise the monetary liabilities of monetary financial institutions to non-MFI Czech
residents except central government. The narrow monetary aggregate M1 includes currency in circulation
(excluding cash at banks’ cash desks) and overnight deposits. The intermediate monetary aggregate M2
comprises M1, deposits redeemable at a period of notice of up to and including three months and deposits
with a maturity of up to and including two years. The broad monetary aggregate M3 comprises M2, money
market fund shares/units, debt securities with a maturity of up to two years and repurchase agreements.
Monetary financial institutions (MFIs): financial institutions forming the money-issuing sector.
Under Community law, these include the central bank, resident credit institutions, and all other resident
financial institutions whose business is to receive deposits and/or close substitutes for deposits from entities
other than MFIs and, for their own account (at least in economic terms), to grant credit and/or invest
in securities. In the Czech Republic, MFIs include the central bank, banks, money market funds and credit
unions.
Money-holding sector: all residents institutional units except central government (S.1311) and monetary
financial institutions (S.121, S.122 and S.123) under ESA2010.
Money-issuing sector: all institutional units included in the sectors of the central bank (S.121)
and other monetary financial institutions (S.122 and S.123) under ESA2010.
Money-neutral sector: an institutional sector comprising the central government sector (S.1311)
under ESA2010.
Money market funds: collective investment undertakings complying with all the following criteria shall be treated as MMFs, where they:
(a) pursue the investment objective of maintaining a fund’s principal and providing a return in line with the interest rates of money market instruments;
(b) invest in money market instruments which comply with the criteria for money market instruments set out in Directive 2009/65/EC of the European Parliament and of the Council of 13 July 2009on the coordination of laws, regulations and administrative provisions relating to undertakings for collective investment in transferable securities (UCITS) (*), or deposits with credit institutions or,
MONETARY STATISTICS
Czech National Bank
25
alternatively, ensure that the liquidity and valuation of the portfolio in which they invest is assessed on an equivalent basis;
(c) ensure that the money market instruments they invest in are of high quality, as determined by the management company. The quality of a money market instrument shall be considered, inter alia, on the basis of the following factors:
— the credit quality of the money market instrument,
— the nature of the asset class represented by the money market instrument,
— for structured financial instruments, the operational and counterparty risk inherent within the structured financial transaction,
— the liquidity profile;
(d) ensure that their portfolio has a weighted average maturity (WAM) of no more than 6 months and a weighted average life (WAL) of no more than 12 months, when
- ‘weighted average maturity’ (WAM) shall mean a measure of the average length of time to maturity of all of the underlying securities in the fund weighted to reflect the relative holdings in each instrument, assuming that the maturity of a floating rate instrument is the time remaining until the next interest rate reset to the money market rate, rather than the time remaining before the principal value of the security must be repaid. In practice, WAM is used to measure the sensitivity of a MMF to changing money market interest rates;
- ‘weighted average life’ (WAL) shall mean the weighted average of the remaining maturity of each security held in a fund, meaning the time until the principal is repaid in full, disregarding interest and not discounting. Contrary to the calculation of the WAM, the calculation of the WAL for floating rate securities and structured financial instruments does not permit the use of interest rate reset dates and instead only uses a security’s stated final maturity. WAL is used to measure the credit risk, as the longer the reimbursement of principal is postponed, the higher the credit risk. WAL is also used to limit the liquidity risk;
(e) provide daily net asset value (NAV) and a price calculation of their shares/units, and daily subscription and redemption of shares/units;
(f) limit investment in securities to those with a residual maturity until the legal redemption date of less than or equal to 2 years, provided that the time remaining until the next interest rate reset date is less than or equal to 397 days whereby floating rate securities should reset to a money market rate or index;
(g) limit investment in other collective investment undertakings to those complying with the definition of MMFs;
(h) do not take direct or indirect exposure to equity or commodities, including via derivatives and only use derivatives in line with the money market investment strategy of the fund. Derivatives which give exposure to foreign exchange may only be used for hedging purposes. Investment in non-base currency securities is allowed provided the currency exposure is fully hedged;
(i) have either a constant or fluctuating NAV
Net external assets: comprise external assets of Czech MFIs (such as monetary gold, non-koruna
banknotes, securities issued by non-residents and loans granted to non-residents) minus external liabilities
of the Czech MFI sector (such as non-residents’ holdings of deposits, repurchase agreements, money market
fund shares and units, and debt securities with a maturity of up to and including two years issued by MFIs
and held by non-residents).
Non-MFIs: all resident sectors excluding MFIs, i.e. general government (S.13), non-financial corporations
(S.11), financial institutions other than MFIs (S.124, S.125 , S.126, S.127, S.128, and S.129) and households
and non-profit institutions serving households (S.14 and S.15) under ESA2010.
MONETARY STATISTICS
Czech National Bank
26
Other financial intermediaries (OFIs): entities included in the sectors of other financial intermediaries
except insurance corporations and pension funds (S. 125), financial auxiliaries (S.126), captive financial
institutions and money lenders (S.127), insurance corporations (S.128), and pensions funds (S.129)
under ESA2010.
Private sector: a sector comprising all institutional sectors except general government (S.13) and monetary
financial institutions (S.121, S.122 and S.123) under ESA2010.
Rates on new business: interest rates agreed by the bank and the client for all agreements negotiated
during the reference period.
Rates on outstanding amounts: interest rates applied to end-of-period balances.
Reclassifications: comprise any changes in the MFI balance sheet resulting from changes in the reporting
population, corporate restructuring, reclassifications of assets and liabilities, and corrections of reported
errors.
Residents: all domestic and foreign legal entities and natural persons, including branches of foreign banks
and foreign owners of buildings and land, whose centre of economic interest is in the given territory. Foreign
legal entities and natural persons are considered residents after at least one year of economic activity
in the territory, with the exception of foreign bank branches and owners of buildings and land, who become
residents at the moment they perform a valid legal act (in the case of foreign owners of buildings and land,
this only applies in connection with transactions relating to the building or land in question).
Transaction (flow) data: values related to the whole period which are calculated as the difference
between the balances at the end of the current and the previous period adjusted for non-transaction effects,
i.e. effects connected with reclassifications, valuation changes and exchange rate variations over the period.
These factors result in breaks in time series, thereby affecting the comparability of end-of-period balances.
Transaction (flow) data only reflect those changes that arise from transactions, i.e. from accepting financial
assets or providing financial liabilities.
Unit trusts other than money market funds:
1. Equity funds – funds investing mainly in shares and other equity.
2. Bond funds – funds investing mainly in securities other than shares.
3. Mixed funds – funds investing in equity and debt securities without a clear preference for either approach.
4. Real estate funds – funds investing mainly in real estate.
5. Hedge funds – funds applying more or less unlimited investment strategies in order to achieve positive
absolute yields, whose managers are remunerated based on the fund’s performance in addition
to their salary.
6. Other funds – investment funds other than equity funds, bond funds, mixed funds, real estate funds
or hedge funds.
Funds of funds and funds of qualified investors are classified under the aforementioned categories according
to their investment strategies.
MONETARY STATISTICS
Czech National Bank
27
TECHNICAL NOTES
A. Calculation of growth rates
The growth rate for the reference period is calculated from the volumes of monthly financial transactions
and the outstanding amounts at the beginning of each month. Monthly transactions are calculated
from differences in outstanding amounts adjusted for reclassifications, other revaluations, exchange rate
variations and other changes which do not arise from transactions. This data thus reflects only those changes
that arise from accepting financial assets or providing financial liabilities. Reclassifications and other
non-transaction corrections are introduced into the transaction statistics to preserve the comparability
of the gradual monitoring results, thereby enabling calculation of the indices of expected outstanding balances
of the monitored variables and determination of their growth rates.
Method of calculation
1. The month-on-month percentage change Mta for month t is calculated as:
(a) 1001
t
MtM
t LF
a
2. The annual growth rate for month t, i.e. the change for the last 12 months ending with month t,
is calculated as the product of the twelve coefficients for each previous month. The calculation of the annual
growth rate from the month-on-month growth rates thus enables transaction changes and non-transaction
effects in the individual months to be taken into account.
(b) 1001111
0 1
i it
Mit
t LF
a ,
where
FtM - transactions in month t
FtM = (Lt - Lt-1) - Ct
M - EtM - Vt
M
and
Lt - outstanding amount at the end of month t
CtM - reclassifications in month t
EtM - exchange rate variations in month t
VtM - valuation changes in month t
Growth rates for other reference periods are derived from formula (b).

MONETARY STATISTICS
Czech National Bank
28
B. Calculation of the contribution to the annual growth rate of a monitored variable (e.g. M3)
If at(M3) represents the annual growth rate of M3 for the year ending with month t, and Ft-i (M1), Ft-i (M2-M1),
Ft-i (M3-M2) are the monthly transactions of the components M1, M2-M1 and M3-M2 in month t-i,
the contribution of M1 to the annual growth rate of M3, for example, is calculated as:
3
)23(121
)1(
11
0
11
0 Ma
MMFMMFMF
MF
t
iititit
iit

MONETARY STATISTICS
Czech National Bank
29
LIST OF ANNEXES
July 2016: Cost-of-borrowing Indicators

MONETARY STATISTICS
Czech National Bank
ANNEX
COST-OF-BORROWING INDICATORS
The Czech National Bank has been publishing fully harmonised MIR statistics in accordance with
Regulation ECB/2013/14 since January 2004. These statistics are used in the CNB's economic and
monetary analyses and are reported to the ECB on a monthly basis. Over time, it has been found that in
order to estimate the effectiveness of monetary policy pass-through across euro area and EU countries, it
is necessary to use an accurate and comparable measure of the borrowing costs for non-financial
corporations and households in those countries, in addition to the standard MIR indicators. For this
reason, the euro area countries started to publish cost-of-borrowing indicators (CBI) in 2013. The CBIs
were created to assess the effectiveness of monetary policy pass-through and economic forecasts and to
compare economic conditions across the euro area countries. The Czech Republic voluntarily signed up to
the publication of CBIs in June 2014.
The motive for implementing the CBIs was that aggregate indicators cannot be easily compiled for MIR
statistics in some cases due to inhomogeneity in the definitions of the underlying instruments. For
example, overdrafts1 are recorded in the monthly statistics on new loan contracts (“new business”), but
they have a higher periodicity and different characteristics. They cannot be left out if this segment is to be
fully covered. Because of the difference in definitions, however, interest rates could previously be
monitored only separately for individual instruments, not in aggregate form. The CBI calculation algorithm
eliminates this shortcoming for certain instruments.
Four basic categories of underlying instruments were used to calculate the CBIs: interest rates on loans
provided by banks to non-financial corporations and interest rates on loans provided by banks to
households for house purchase. The MIR source statistics were used in two ways to construct the CBIs.
Interest rates on long-term loans provided by banks to non-financial corporations and interest rates on
short-term and long-term loans provided by banks to households for house purchase were obtained
directly from the MIR statistics. In the case of interest rates on long-term loans provided by banks to non-
financial corporations, two additional calculations had to be performed to make this aggregate indicator
applicable. This involved accounting for the importance of overdrafts an important source of financing for
firms and computing an estimate of the share of long-term loans with original and residual maturity of
over one year and interest rate reset in the next twelve months, as these long-term loans are akin to
short-term loans.
There are eight indicators: four basic ones and four derived ones. The basic indicators provide an
assessment of the costs of borrowing broken down into short-term and long-term loans to households and
non-profit organisations serving household for house purchase and to non-financial corporations. These
four basic CBIs are used to compile the derived CBIs – short-term CBIs, long-term CBIs, CBIs for non-
financial corporations as a whole and CBIs for households and non-profit institutions serving households
as a whole. The CBIs cover CZK-denominated loans.
The CBIs are compiled on the basis of the existing MFI interest rate (MIR) and balance sheet statistics.
The CBIs for households and non-profit institutions serving households (HH) are calculated using loans
for house purchase (new business). Consumer credit and other loans are not included as their interest
rates are too volatile across countries and thus not relevant for macroeconomic projections.
1 Overdrafts are debit balances on current accounts, revolving loans and card credit.

MONETARY STATISTICS
Czech National Bank
1.5
2.0
2.5
3.0
3.5
4.0
4.5
CR - Total short-term cost of borrowing
FR - Total short-term cost of borrowing
CR - Total long-term cost of borrowing
FR - Total long-term cost of borrowing
OVERVIEW OF DERIVED COST-OF-BORROWING INDICATORS IN THE CZECH REPUBLIC AND FRANCE
2015 2016
April February March April
Rate (%) Rate (%) Rate (%) Rate (%)
CZ FR5) CZ FR CZ FR CZ FR
(1) Households – total1).2) 2.65 2.31 2.53 2.26 2.37 2.18 2.40 2.09
(2) Non-financial corporations – total 2.12 1.71 2.07 1.66 2.15 1.70 2.18 1.70
(3) Short-term cost of borrowing – total3) 2.11 1.56 2.03 1.49 2.12 1.56 2.16 1.56
(4) Long-term cost of borrowing – total4) 2.63 2.28 2.54 2.22 2.39 2.15 2.40 2.09
1) MFI interest rate statistics cover CZK-denominated loans only. The rates on outstanding amounts are the rates applied to end of period balances.2) Households comprise the household sector (S.14) and non-profit institutions serving households (S.15) under ESA2010.3) Short-term (ST) loans are loans with a floating rate or an initial rate fixation up to one year. 4) Long-term (LT) loans are loans with an initial rate fixation over one year.5) FR = France.
Cost-of-borrowing indicators of households Long-term and short-term
and non-financial corporations cost-of-borrowing indicators
1.5
2.0
2.5
3.0
3.5
4.0
4.5
CR - Households - total
FR - Households - total
CR - Non-financial corporations - total
FR - Non-financial corporations - total

MONETARY STATISTICS
Czech National Bank
Recent developments in derived cost-of-borrowing indicators in the Czech Republic
and France
All four cost-of-borrowing indicators (CBIs) were higher for Czech loans than for French loans in April 2016.
The French short-term CBI was the lowest. The month-on-month changes in all CBIs were less
than 0.1 percentage point. CBIs in the Czech Republic increased slightly, while CBIs in France were flat
or falling. The Czech and French CBIs for households mirror the evolution of the long-term borrowing costs
in these two countries.
Compared to March, the cost of borrowing of Czech households rose by 0.03 percentage point to 2.40%.
In year-on-year terms, it fell by 0.25 percentage point. In France, this CBIS was unchanged from March
at 2.09%. It also fell in year-on-year terms, by 0.22 percentage point. This CBI was 0.31 percentage point
higher in the Czech Republic than in France.
The borrowing costs of non-financial corporations in the Czech Republic saw a month-on-month increase
of 0.03 percentage point to 2.15%. The CBI for French non-financial corporations was 1.70%,
i.e. 0.48 percentage point lower than in the Czech Republic. This difference was the second largest among
the four Czech and French CBIs. Loans to non-financial corporations in France are thus less costly than
in the Czech Republic. The year-on-year change in this indicator was 0.06 percentage point in the Czech
Republic and -0.01 percentage point in France.
The total short-term cost of borrowing, which comprises both households and non-financial corporations,
picked up from 2.12% in March to 2.16% in April in the Czech Republic. In France, this indicator was 1.56%,
i.e. 0.60 percentage point lower, the largest differential among the four Czech and French CBIs.
In year-on-year terms, an increase on 0.05 percentage point was recorded in the Czech Republic,
while stagnation was recorded in France.
The long-term CBI rose in the Czech Republic but declined in France. The Czech CBI was
up by 0.01 percentage point to 2.40% and the French CBI fell by 0.06 percentage point to 2.09%.
The year-on-year decline in the Czech Republic was the second largest. In April, this CBI was 0.31 percentage
point lower in France than in the Czech Republic.