monetary policy for 2017/18 - central bank of nepalin_english... · monetary policy for 2017/18...
TRANSCRIPT

Monetary Policy for
2017/18
Nepal Rastra Bank Central Office
Baluwatar, Kathmandu
July 2017
Unofficial Translation

Monetary Policy for
2017/18
Delivered by Governor Dr. Chiranjibi Nepal
on 9 July 2017
Nepal Rastra Bank Central Office
Baluwatar, Kathmandu
www.nrb.org.np
ACRONYMS
BFIs = Banks and Financial Institutions
BOP = Balance of Payments
CCB = Counter cyclical Buffer
CCD = Credit-to-Capital and Deposit
CIB = Credit Information Bureau
CPI = Consumer Price Index
CRR = Cash Reserve Ratio
CSD = Central Securities Depository
FSDS = Financial Sector Development Strategy
GDP = Gross Domestic Product
GDS = Gross Domestic Savings
GoN = Government of Nepal
IMF = International Monetary Fund
IC = Indian Currency
IRC = Interest Rate Corridor
LMFF = Liquidity Monitoring and Forecasting Framework
LOLR = Lender of Last Resort
LTV = Loan-to-Value
M1 = Narrow Money Supply
M2 = Broad Money Supply
MFIs = Microfinance Institutions
NFRS = Nepal Financial Reporting Standard
NPL = Non Performing Loan
NRB = Nepal Rastra Bank
OMOs = Open Market Operations
OMTOC = Open Market Transaction Operation Committee
PCA = Prompt Corrective Action
PoS = Point of Sale
RTGS = Real Time Gross Settlement System
SLF = Standing Liquidity Facility
SLR = Statutory Liquidity Ratio
SME = Small and Medium Enterprises
USD = US Dollar
y-o-y = year on year

TABLE OF CONTENTS
Page Number
Background 1
Global Economic Outlook 1
Domestic Economic Situation 2
Review of Monetary and Financial Situation 3
Monetary Situation 3
Liquidity Management and Interest Rate 3
Implementation Status of the Financial Programs 4
Monetary Policy Framework for 2017/18 6
Monetary Policy Stance 6
Economic and Monetary Targets 7
Operating Targets and Instruments of Monetary Policy 7
Financial Sector Program for 2017/18 9
Financial Sector Reform 9
Macroprudential Regulation 9
Regulation and Supervision 11
Microfinance and Financial Customer Protection 13
Foreign Exchange Management 13
Appendix 1: Progress Matrix of Policy Targets Outlined in Monetary
Policy for 2016/17 15
Appendix 2: Progress Matrix of Policies and Programs Pertaining to
Financial Sector, Microfinance and Foreign Exchange
Outlined in Monetary Policy for 2016/17 18
Appendix 3: Projection of Monetary Survey 27
Statistical Tables 28

Monetary Policy for 2017/18
Background
1. Nepalese economy remained buoyant in 2016/17. Relatively higher economic growth,
contained inflation and a reasonable level of surplus in balance of payments have spurred a
new hope. Favorable weather, a pick up in tourists arrival and improvement in overall supply
situation steered the economy towards the positive direction.
2. The financial friction observed after the first quarter of 2016/17, mainly because of the
aggressive lending by banks and financial institutions (BFIs) to consumption and riskier
sectors, is in the process of amelioration. This is mainly attributed to various policy measures
taken by this Bank, including the moral suasion. In the aftermath of the financial friction,
there has been a positive change in the structure of deposits held by the BFIs along with the
improvement in deposit rates, which remained low over the years. These developments have
contributed to the rise in the gross domestic savings (GDS) to 10.3 percent in 2016/17
compared to 3.8 percent a year ago.
3. BFIs have contributed significantly in promoting financial access through the expansion of
their branch network. Likewise, resource mobilization and the growth in the number of
saving and credit cooperatives have contributed additionally to the financial expansion.
However, there is an increasing challenge to effectively regulate and supervise these
cooperatives and help maintain financial stability.
4. Stock market which was bullish in the previous year remained normal in 2016/17.
Macroprudential measures introduced by this Bank helped stabilize the stock market.
Macroprudential measures consist of the policies lowering the concentration risk of BFIs in
the stock market and real estate transactions, and encouraging credit disbursement to the
priority sector, among others.
5. The monetary policy for 2017/18 is formulated as per the mandate of the Nepal Rastra Bank
(NRB) Act 2002. This is the sixteenth in sequence since 2002/03. This policy takes a number
of evolving developments into account. These include the direction of the global economy,
recently held local level elections, annual budget of the Government of Nepal (GoN),
financial frictions observed in the banking sector, rising imports and latest developments in
employment destination countries of Nepali labor force.
6. The policy duly considers suggestions from various associations of BFIs, federations of
industries and commerce, intellectuals as well as from other stakeholders.
Global Economic Outlook
7. International Monetary Fund (IMF) projects the world economy to grow 3.5 percent in 2017
and 3.6 percent in 2018. Such growth was estimated 3.1 percent in 2016. Advanced
economies, which expanded by 1.7 percent in 2016, are projected to grow at a same rate of
2.0 percent in 2017 and 2018.
8. Improvement in the world economy is likely to have positive impact on the least developed
economies including Nepal. However, slow productivity growth and inward looking policies
in advanced economies could possibly have downside risks to emerging market and least
developed countries.

2 Nepal Rastra Bank
9. Indian economy is projected to expand by 7.2 percent in 2017 and 7.7 percent in 2018. Such
growth was 6.8 percent in 2016. Chinese economy, which grew 6.7 percent in 2016, is
projected to expand 6.6 percent in 2017 and 6.2 percent in 2018.
10. International Monetary Fund projects the consumer price inflation of advanced economies to
remain at 2.0 percent in 2017 and 1.9 percent in 2018. Such rate was 0.8 percent in 2016.
Expansion in aggregate demand is expected to have an inflationary pressure ahead. Likewise,
inflation in India is projected at 4.8 percent in 2017 and 5.1 percent in 2018. Such rate was
4.9 percent in 2016. Similarly, inflation in China is projected at 2.4 percent in 2017 and 2.3
percent in 2018; slightly on the higher side compared to that of 2.0 percent in 2016.
11. US Federal Reserve has been normalizing the unconventional monetary policy since
December 2015. The Federal Reserve had adopted such unconventional stance after the
global financial crisis of 2008.The Fed increased target range for Fed Fund rate by 0.25
percentage point to the band of 1.0 percent and 1.25 percent on 14 June 2017. However,
monetary stance is expected to remain expansionary in Eurozone and Japan.
12. The IMF's Global Financial Stability Report 2017 states the gradual improvement in the
financial stability. The Report credits such improvement to the expansion in economic
activities, and a rise in long-term interest rates, thereby increasing the earnings of banks and
insurance companies. Nevertheless, the IMF mentions a cautionary note on international
trade and capital flows resulting in from the recent political development around the world
along with an inclination towards protectionism.
Domestic Economic Situation
13. The real gross domestic product (GDP) at basic price is expected to grow at 6.9 percent in
2016/17. This is slightly above the target (6.5 percent) mainly because of the improvement in
agriculture, industry and service sector.
14. Agriculture sector witnessed a marked improvement due to favorable monsoon, smooth
supply of agricultural inputs and an expansion in forest related output. The non-agricultural
sector witnessed a higher growth on account of the improvement in power supply and
investment climate.
15. The share of consumption in the gross domestic product of Rs. 2599 billion for 2016/17 is
89.75 percent, while the share of savings is 10.25 percent. The ratio of gross national savings
to GDP is estimated at 43.78 percent. The national savings ratio is higher due to the
significant inflow of remittance. In the review period, the gross fixed capital formation to
GDP ratio is expected to increase to 33.8 percent and gross capital formation to GDP ratio is
expected to reach 42.51 percent.
16. The ratio of net exports to GDP is estimated to remain negative at 32.26 percent. Such ratio
remained negative at 29.89 percent in previous fiscal year. This implies an increased
contribution of domestic demand to the economic growth in 2016/17.
17. Consumer price inflation averaged 4.6 percent in the first eleven months of 2016/17. Such
inflation in 2015/16 was 9.9 percent. On y-o-y basis, the consumer inflation remained low at
2.8 percent in June 2017. Average annual inflation remained below the annual target of 7.5
percent for 2016/17 on account of the base price effect and improved supply situation.
18. GoN had announced a total budget of Rs. 1049 billion for 2016/17. Of this, the estimates for
capital spending and current spending were Rs. 312 billion and Rs. 617 billion respectively.
Capital spending stood at 38.7 percent and current spending at 69.8 percent of annual

Monetary Policy for 2017/18 3
estimates on cash basis as of June 2017. Revenue collection of the GoN stood at Rs. 544.76
billion, which is 96.3 percent of the annual target of Rs. 565.9 billion. The cash balance of
the Government was Rs. 239.3 billion on 30 June 2017. This resulted in from lower
government expenditure compared to resource mobilization.
19. Domestic debt mobilized by the government was Rs. 88.34 billion and the repayment was
Rs. 38.78 billion in 2016/17. Consequently, net domestic debt mobilization remained Rs.
49.56 billion. The outstanding net domestic debt of the government is expected to stand at
Rs. 283.72 billion by the end of 2016/17.
20. The overall BOP has recorded a surplus of Rs. 74.26 billion in the first eleven months of
2016/17 compared to a surplus of Rs. 171.15 billion in the corresponding period of the
previous year. BOP surplus remained low due to higher import growth and deceleration in
remittances.
21. Gross foreign exchange reserves increased by 3 percent to Rs. 1070.26 billion in mid-June
2017 from Rs. 1039.21 billion in mid-July 2016. On the basis of imports in the first eleven
months of 2016/17, the existing reserve is sufficient to cover the merchandise imports of 13.3
months and merchandise and services imports of 11.5 months. Monetary policy for 2016/17
had targeted the foreign exchange holdings equivalent to at least 8 months of imports of
merchandise and services.
22. Nepalese currency vis-à-vis the US dollar appreciated by 3.9 percent in mid-June 2017
compared to the level of mid-July 2016. It had depreciated by 5.5 percent in the
corresponding period of the previous year. The buying rate per US dollar stood at Rs. 102.77
in mid-June 2017 compared to Rs. 106.73 in mid-July 2016.
Review of monetary and financial situation
Monetary Situation
23. Monetary policy for 2016/17 projected the annual growth rate of broad money supply (M2)
at 17 percent. On y-o-y basis, M2 growth stood 16.8 percent in mid-June 2017.
24. Total domestic credit was projected to grow 25 percent in 2016/17. On y-o-y basis, the
growth of such credit stood at 20.9 percent in mid-June 2017. Domestic credit growth
remained below the target due to lower than expected capital spending by the government,
among others.
25. The growth of private sector credit in mid-June 2017 stood at 21.8 percent slightly higher
than the projected growth of 20 percent. Private sector credit increased as a result of the
expansion in economic activities, which had contracted in the aftermath of the disastrous
earthquake and obstructions in the Southern border last year. On y-o-y basis, the growth in
deposits at BFIs was 15.5 percent in mid-June 2017.
Liquidity Management and Interest Rate
26. The excess reserve of BFIs is taken as an operating target of monetary policy for the last few
years. Open market operations (OMOs), compulsory cash reserve ratio (CRR), bank rate and
deposit collection auction are the instruments used by this bank in conducting monetary
policy operations. Interest rate corridor has been in place since 2016/17.
27. NRB injected total liquidity of Rs. 546.29 billion from mid July 2016 to 6 July 2017. The
liquidity injection consists of various instruments of open market operation, standing
liquidity facility (SLF) and foreign exchange intervention.

4 Nepal Rastra Bank
28. Altogether Rs. 61 billion liquidity was injected through OMO during mid July 2016 to 6 July
2017. Out of the total injection, Rs 33.21 billion was through repo auction (REPO) and Rs.
27.79 billion through outright purchase auction. During this period, BFIs used standing
liquidity facility (SLF) of Rs. 62.39 billion.
29. The NRB injected net liquidity of Rs. 422.90 billion through the net purchase of USD 3.98
billion from commercial banks from mid-July 2016 to 6 July 2017. In 2015/16, Rs. 471.35
billion was injected though the net purchase of USD 4.45 billion.
30. Altogether Rs. 115.05 billion was mopped up through OMOs during mid-July 2016 to 6 July
2017. In 2015/16, Rs. 591.63 billion liquidity was absorbed using various instruments.
31. Indian Currency (IC) equivalent to Rs. 441.57 billion was purchased through the sale of USD
4.02 billion and Euro 120 million during mid-July 2016 to 6 July 2017. In 2015/16, Indian
Currency (IC) equivalent to Rs 385.46 billion was purchased through the sale of USD 3.40
billion and Euro 210 million.
32. Interbank transactions among commercial banks stood at Rs. 1053.94 billion and that of
other financial institutions (except among commercial banks) Rs. 379.16 billion during mid
July 2016 to 6 July 2017. Such transaction among commercial banks was Rs. 961.72 billion
and among others was Rs. 129.06 billion in 2015/16.
33. Short-term interest rates moved upward compared to those in 2015/16. The weighted average
interest rate of 91-day Treasury bill has increased to 1.03 percent in mid-June 2017 to that of
0.12 percent in mid-June 2016. Likewise, weighted average inter-bank rate among
commercial banks increased to 2.46 percent in mid-June 2017 compared to that of 0.36
percent in mid- June 2016.
34. Interest on lending and deposit has increased in 2016/17. This movement in interest rate is
expected to mobilize higher gross domestic savings and discourage credit disbursement to
riskier sectors. The weighted average interest rate on deposit of commercial banks marked
5.91 percent in mid-June 2017 from 3.09 percent a year ago. Similarly, the weighted average
bank lending rate climbed to 11.29 percent in mid-June 2017 from 8.98 percent a year ago.
35. Interest rate spread has come down despite the increase in weighted average deposit and
lending rates. The weighted average interest rate spread between bank lending and deposit
decreased to 5.4 percent in mid-June 2017 from 5.9 percent a year ago. The average base rate
of commercial banks has increased owing to an increase in deposit rates. The base rate
reached 9.4 percent in mid-June 2017 from 6.3 percent a year ago.
36. The deposit structure has changed resulting in from the increase in interest rate. Of the total
deposit at BFIs, the share of current, saving, and fixed deposits remained 7.9 percent, 35.8
percent and 43.4 percent respectively in mid-June 2017. Such share was 8.5 percent, 43.8
percent and 30.2 percent respectively a year ago.
Implementation Status of the Financial Programs
37. BFIs witnessed mismatch between deposit mobilization and credit disbursement in the
middle of 2016/17. Macroprudential measures were used to correct such anomaly. As a result
of which, financial sector remains stable.
38. Of the various Acts relating to BFIs, Nepal Rastra Bank Act, 2002 and Banking Offence and
Punishment Act, 2008 have been amended. A new Banks and Financial Institutions Act,
2017 has come into effect. This replaces the then Banks and Financial Institutions Act, 2006.
Additionally, Deposit and Credit Guarantee Fund Act, 2016 has been introduced and

Monetary Policy for 2017/18 5
Employees Provident Fund Act, 1962 has been amended. These legal reforms are expected to
facilitate the resolution of problem banks, improve financial sector governance, protect
financial resources and promote efficient utilization of such resources.
39. Private sector credit has expanded since the announcement of monetary policy and its
planned implementation. At first, monetary policy was announced publicly on 16 July 2002.
The ratio of outstanding loan to GDP was 29 percent in 2001/02. Such ratio reached 75.3
percent in 2015/16. Credit disbursement to agriculture, energy and tourism has also increased
significantly following the policy initiatives taken by this Bank in the last few years.
40. Commercial banks have lent 17.5 percent of their credit to agriculture, energy, tourism and
small and cottage industries as of mid-June 2017. Such ratio was 16.8 percent in mid-June
2016. It was mandatory for these banks to disburse 20 percent of their outstanding credit to
these sectors.
41. The "Manual for Interest Subsidy on Commercial Agriculture and Livestock to Youths,
2016" has come into effect after the approval by the Council of Ministers, GoN. This
replaces the prior Manual issued in 2014. As per the new Manual, the rate on interest subsidy
has been increased to 5 percent from 4 percent. Additionally, it has made a provision to
disburse loan up to Rs. 70 million to agriculture and livestock business. As of mid-April
2017, 5144 individuals have obtained such loan. The outstanding loan under this provision
stood Rs. 5.97 billion and interest subsidy provided was Rs. 177 million as of mid-April
2017.
42. A total refinance of Rs. 14.36 billion including general refinance of Rs. 13.53 billion and
export refinance of Rs. 828.60 million were provided as of mid- June 2017. Likewise, BFIs
have obtained housing refinance of Rs. 816.50 million at zero interest rate for earthquake
victims. Such loan is to be disbursed to earthquake victims at a maximum of 2 percent
interest rate. Altogether 382 victims are expected to benefit from this loan.
43. Commercial banks have disbursed 5.8 percent, development banks 6.8 percent and finance
companies 4.6 percent of their total loan to the deprived sector as of mid-April 2017. Overall,
BFIs have disbursed 5.9 percent of their outstanding loan to the deprived sector amounting to
Rs. 103.02 billion.
44. As of 4 July 2017, 155 banks and financial institutions have been involved in merger and
acquisition process after the initiation of merger and acquisition policy by this Bank. Of
these, license of 112 institutions has been repealed resulting in the formation of 43 BFIs.
45. The total number of BFIs stood at 153 as of 6 July 2017. This consists of 28 “A" class
commercial banks, 44 "B" class development banks, 30 "C" class finance companies and 51
"D" class microfinance institutions.
46. The total number of BFIs branches stood at 4,894 in mid-June 2017. These include 2,116
branches of commercial banks, 805 of development banks, 148 of finance companies and
1,825 of microfinance institutions. On an average, population served by per branch of BFIs is
5,809 in mid-June 2017. Such ratio per branch was 6,647 people a year ago.
47. The number of deposit accounts stands at 18.80 million and loan accounts 1.18 million in
mid-April 2017. Similarly, the number of ATM reaches 2,047, the number of mobile banking
users 2.43 million and internet banking users 735 thousand. Likewise, the number of debit
card stands at 5.18 million and credit card 64 thousand.
48. Rs. 381.91 billion total deposit at 115 BFIs has been guaranteed as of mid-June 2017. This
follows the provision of guaranteeing bank deposits up to Rs. two hundred thousand.

6 Nepal Rastra Bank
Similarly, a total credit of Rs. 6.13 billion has been guaranteed as of mid-June 2017. This
includes Rs. 5.55 billion under micro and deprived sector credit guarantee program and Rs.
580 million under small and medium business program.
49. A remarkable progress has been achieved on the resolution process of the problem BFIs. Of
the 16 problem banks and financial institutions, the resolution process of 7 institutions has
been completed. Two of these, General Finance Ltd and Arun Finance Ltd have come out of
the problem status and are operating normally. Of the remaining 9 problematic institutions,
process of ownership transfer of 6 institutions is underway and of another one is under such
consideration. However, the case relating to other two entities is under the jurisdiction of the
court.
50. There has been a marginal decline in the non-performing loan (NPL) of the BFIs. Such loan
came down to 1.7 percent in mid-April 2017 from 1.8 percent in mid-July 2016. Credit to
core capital cum deposit (CCD) ratio of commercial banks remained 70.96 percent in mid-
June 2017. This is after allowing BFIs to deduct up to 50 percent of productive sector loan
from CCD ratio computation. However, such ratio without such concession to the banks
stands 77.46 percent.
51. The paid up capital of BFIs has increased to Rs 209.80 billion in mid-June 2017 from Rs.
140.79 billion in mid-July 2015. In mid-July 2015, the paid-up capital requirement for the
BFIs was increased through the monetary policy statement. The BFIs have increased their
paid up capital through the issuance of bonus shares, right shares, further public offerings,
and through merger and acquisition.
Monetary Policy Framework for 2017/18
Monetary Policy Stance
52. The monetary policy stance for 2017/18 follows the domestic and global economic outlook,
14th Development Plan of the country, NRB's Strategic Plan, Financial Sector Development
Strategy, as well as the policies, programs and priorities set in the Budget of the GoN.
53. The policy stance is set to support the implementation of the programs and policies outlined
in the Budget of the GoN to achieve the targeted economic growth. Caution is taken to keep
monetary aggregates at desired level in order to rein in the inflationary pressure arising from
aggregate demand along with the expansion in economic activities.
54. The monetary policy stance duly considers possible adverse impact of widening trade deficit
and decelerating remittance growth on external sector stability.
55. The monetary policy aims to keep the interest rate at the desired level and contain intrest rate
volatility in order to promote financial stability and optimally allocate financail resources.
56. Increasing investment in priority sector has become critical in order to minimize wideing
trade deficit. In this context, monetary policy has given top priority to encourage banks and
financial institutions for funneling credit towards agriculture, energy, tourism, small and
medium scale enterprises as well as to other productive enterprises.
57. It is important to keep proper balance in mobilizing finanical resources for strengthening
financial sector and maintain its stability. In this regard, the monetary policy aims at
promoting the sectors contributing to sustainable development along with discouraging
speculative behavior in real estate and stock market.

Monetary Policy for 2017/18 7
58. Utmost priority is given to expand bank network in all local levels given the increasing need
for widening financial access in the context of state restructuring.
Economic and Monetary Targets
59. Price stability remains the primary objective of monetary policy. The policy aims to keep
consumer price inflation within 7.0 percent in 2017/18. For this, monetary management will
be directed towards averting inflationary pressure that arises from the aggregate demand.
60. The policy also aims to ensure external sector stability. For this, foreign exchange reserves
will be maintained to cover imports of goods and services at least for 8 months in 2017/18.
61. Liquidity management will be directed towards facilitating the targeted economic growth of
7.2 percent in 2017/18.
62. The existing currency peg as a nominal anchor of monetary policy will be continued. And the
focus of managing monetary and credit aggregates will be on defending the peg.
63. The bank has been projecting monetary aggregates on the basis of the nominal GDP.
Accordingly, the growth rate of M2 is targeted at 18 percent for 2017/18. This projection has
been made on the basis of the targeted economic growth, inflation and income elasticity of
money demand.
64. The ceiling on domestic credit growth is set at 27.8 percent for 2017/18. This aligns with the
budget of the GoN and considers the aggregate demand arising from the targeted economic
growth and inflation.
65. Private sector credit, a major component of domestic credit, is projected to grow by 20
percent in 2017/18.
Operating Target and Instrument of Monetary Policy
66. Operational targets and instruments of monetary policy are designed to facilitate attaining
economic and monetary goals, which follow the policy stance developed on the basis of the
internal as well as external macro-financial outlook.
67. The system of taking commercial bank, development bank and finance companies as
counter-parties as well as the reserve kept by these institutions in excess of the required
reserve in this bank as an operating target will be continued.
68. The interest rate corridor system (IRC), which has been in operation since 2016/17, is revised
in a timely manner.
69. The provision of taking standing liquidity facility (SLF) as an upper bound of IRC is
continued. The existing SLF rate of 7 percent has also been kept unchanged.
70. A provision of taking two weeks' repo rate as a policy rate has been kept unchanged.
However, such rate has been fixed at 5 percent.
71. A provision of taking two weeks' deposit collection rate as a lower bound of the corridor has
been kept unchanged. However, such deposit collection rate has been fixed at 3 percent. It is
expected that this revision in interest corridor arrangement will help in minimizing interest
rate volatility.
72. Absorption or injection of liquidity under interest rate corridor based on the liquidity
situation indicated by the liquidity monitoring and forecasting framework (LMFF) will be
continued. Further, liquidity management will also consider monetary policy objectives and
financial market situation.

8 Nepal Rastra Bank
73. Regular, fine tuning and structural open market operations will be conducted as per the
existing provision. Under this, liquidity will be managed by using instruments such as NRB
bond, 90 days deposit collection auction and collateral based outright purchase/sale,
repo/reverse repo.
74. Cash reserve ratio (CRR) is kept unchanged at 6 percent for commercial banks, 5 percent for
development banks and 4 percent for finance companies.
75. The two-week maintenance period for CRR and daily maintenance at least of 70 percent is
kept unchanged.
76. The bank rate, applied for the purpose of lender of last resort (LOLR) facility and discount of
securities, is kept unchanged at 7 percent.
77. The SLF period has been extended to 7 working days from the existing 5 days. Similarly, the
loan-to-value (LTV) ratio for this purpose has been fixed up to 90 percent. The exiting
provision of extending SLF at the bank rate is kept unchanged.
78. Statutory Liquidity Ratio (SLR) remains at 12 percent for commercial banks, 9 percent for
development banks, 8 percent for finance companies and 6 percent for the development
banks and finance companies which do not collect current and call deposits.
79. The interest rate of 4 percent on general refinance and 1 percent on special refinance is kept
unchanged. Under this facility, the BFIs are allowed to charge interest rate up to 9 percent for
general refinance and 4.5 percent for special refinance.
80. There has been continuity in the special refinance in order to promote exports and support
sick industries, cottage and small industries, foreign employment, Dalits, indigenous people,
women, differently abled individuals, disadvantaged and minority communities who run
small businesses. Likewise, a concessional refinance facility aimed at encouraging exports in
foreign currency is also kept unchanged at the existing rate of 0.25 percentage point added to
the LIBOR.
81. The provision of special refinance to BFIs at 1 percent interest aimed at encouraging
agriculture and small business based income generating activities in poverty stricken areas is
continued. These include Kalikot, Humla, Jumla and Mugu districts of Province 6 Bajura,
Bajhang, Darchula, Doti, Achham and Baitadi districts of Province 7 and the southern
bordering area of Parsa, Bara, Rauthat, Sarlahi, Mahotari, Dhanusha, Siraha and Saptari
districts of Province 2.
82. The NRB has been providing refinance facility using the existing fund of Rs. 10.84 billion. A
refinance fund of Rs. 20 billion will be established by including additional amount of Rs. 5
billion from Economic Rehabilitation Fund and the remaining amount from the profit of this
Bank in 2016/17. The increase in the fund amount will support extending concessional credit
to strategically important sectors including the hydropower.
83. Hydropower, agriculture, tourism, exports, small and cottage industries, pharmaceuticals,
cement and garment will be defined as priority sector.
84. Commercial banks are required to allocate minimum 25 percent of total credit to priority
sector, which include minimum of 10 percent to agriculture, 5 percent to hydropower, and 5
percent to tourism and remaining to other priority sectors. However, the existing provision
for development banks and finance companies to extend minimum 15 percent and 10 percent
of their total credit to the priority sector is kept unchanged.

Monetary Policy for 2017/18 9
85. The ratio of loan to be extended by the commercial banks, development banks and finance
companies to the deprived sector has been kept unchanged. Under this provision, commercial
banks are required to extend 5 percent, development banks 4.5 percent and finance
companies 4 percent to the deprived sector. However, the provision requiring commercial
banks to invest minimum 2 percent of the deprived sector credit directly has been made
optional.
86. A provision will be made to include the loan extended to purchase, own and operate
electronic rikshaw by 'A', 'B' and 'C' class institutions under the deprived sector loan
category. Currently, such loan to normal rikshaw pullers is counted as deprived sector
lending.
87. The provision to include project loan up to Rs. one million extended by the BFIs against the
collateral of commercial agriculture project under deprived sector lending has been
continued.
Financial Sector Program for 2016/17
Financial Sector Reform
88. The programs relating to this Bank in the "Financial Sector Development Strategy" approved
by the GoN on 6 January 2017 will be implemented gradually.
89. The establishment of Infrastructure Development Bank, as per the provision of Bank and
Financial Institutions Act, 2017, will be facilitated through necessary policy provisions such
as licensing, regulation and supervision.
90. The share investment of this Bank at various organized institutions will be gradually
divested.
91. Various offices of this Bank outside the Kathmandu Valley will be made responsible for
conducting central banking functions, unless other provisions are made, in the context of
implementing federalism. Central banking functions for state number 1 will be carried out by
Biratnagar Office, state number 2 by Janakpur and Birgunj Office considering the districts
under the existing provision, state number 3 by Central Office, state number 4 by Pokhara
Office, state number 5 by Siddharthanagar Office and Nepalgunj Office considering the
districts under the existing provision, state number 6 by Nepalgunj Office and state number 7
by Dhangadi Office.
92. This bank will manage the note chests in different parts of the country to ensure the smooth
supply of the Nepalese currency at various local levels.
Macroprudential Regulation
93. NRB has been implementing macro prudential measures in order to minimize the procyclical
behavior of BFIs and the risks in the economy that may arise from their inter-linkages.
94. There has been continuity in the provision that requires commercial banks to maintain
minimum common equity tier 1 capital ratio of 4.5 percent based on Basel III requirement.
95. The provision requiring banks to maintain capital conservation buffer equal to 2.5 percent of
total risk weighted assets has been kept unchanged.
96. There has been continuity in the provision requiring banks to maintain an additional counter
cyclical buffer (CCB) up to 2.5 percent of total risk weighted assets to minimize the adverse
impact of pro-cyclicality and fluctuations in macroeconomic variables on financial sector.
10 Nepal Rastra Bank
97. BASEL III will be implemented at national level development banks and national level
finance companies gradually.
98. The facility that allows the BFIs to deduct 50 percent of outstanding loan in specified sectors
while computing CCD ratio has been phased-out. The BFIs which exceed the regulatory
CCD ratio are required to maintain it by mid-October 2017.
99. The provision for commercial banks to maintain the leverage ratio of 4 percent on a quarterly
basis has been kept unchanged.
100. Prompt corrective action (PCA) will also be implemented for commercial banks on the basis
of the liquidity monitoring framework based on BASEL III.
101. Commercial banks will be required to bring down the ratio of institutional deposit to 45
percent of total deposit from the existing 50 percent by mid-July 2018. Likewise, the
borrowing limit of one-fourth of the banks and financial institutions' total deposit is kept
unchanged.
102. 25 percent sectoral credit limit, of the total outstanding loan, on real estate introduced to
minimize the credit risk remains unchanged.
103. The provision allowing the BFIs to extend loan including non-fund based facilities to a single
borrower, firm, company or group of related borrowers up to 25 percent of the core capital
has been kept unchanged.
104. The provision of single obligor limit of 30 percent of the core capital for extending loan to
the productive industries and the maximum credit limit up to 50 percent of core capital for
the construction projects relating to hydropower, electricity transmission lines and cable car
has been kept unchanged.
105. The existing provision of margin loan against the collateral of shares only up to 50 percent of
the average closing price for the last 180 days or the prevailing market value, whichever is
less has been kept unchanged.
106. The provision allowing BFIs to extend credit against the collateral of shares up to the amount
of core capital has been revised to 40 percent of core capital. In addition, a provision will be
made requiring the BFIs not to lend more than 10 percent of their core capital against the
share collateral of an individual listed company.
107. The provision restricting BFIs' promoters holding more than 1 percent shares to borrow, by
pledging more than 50 percent shares as collateral, remains unchanged.
108. The provision restricting BFIs to extend loan against the collateral of promoters' shares
remains unchanged. Currently, BFIs can lend against the collateral of promoters' shares only
up to 50 percent of the average closing price of ordinary shares for the last 180 days or the
prevailing market value of the promoters' shares, whichever is less.
109. The limit for personal home loans provided by BFIs has been increased to Rs. 15 million
from the existing Rs. 10 million.
110. The maximum LTV ratio for real estate loan is lowered to 40 percent from the existing 50
percent for the Kathmandu valley. Such ratio for other places has been kept unchanged at the
existing 50 percent. It is expected that this provision will promote decentralized development
in the process of implementing federalism.
111. The maximum LTV ratio for residential housing loan is lowered to 50 percent for the
Kathmandu valley and such ratio has been kept unchanged at 60 percent for other places.

Monetary Policy for 2017/18 11
112. The maximum LTV ratio for personal vehicle loan has been increased to 65 percent from the
existing level of 50 percent. Similarly, such ratio in case of electric vehicles has been
increased to 80 percent. The limit is not applicable for public vehicles with a minimum of 40
seats, vehicles used in construction, education and health services.
113. In order to reduce the risk of multiple banking, the limit for converting loans borrowed from
multiple banks to consortium financing has been kept unchanged at the existing level of Rs. 1
billion. However, the provision is not compulsory to the loan extended to microfinance
institutions.
114. Consortium financing will not be required if the BFIs lend to licensed institutions providing
hire purchase loans up to 50 percent of fixed assets such as vehicles and machinery by
insuring full value of such collateral.
Regulation and Supervision
115. BFIs, required to raise stipulated minimum paid up capital by mid-July 2017, have been
encouragingly working towards it. These institutions should meet the target for the minimum
paid up capital and clearly show it on the 'Notes to Account' by the time the external audit
report and financial statement of 2016/17 are made public as per the Banks and Financial
Institutions Act, 2016. In the case of noncompliance, several actions will be taken including
restricting the distribution of cash and bonus shares and branch expansion, limiting deposit
collection and credit disbursement, and enforcing merger.
116. A separate policy provision will be made regarding the increment of the minimum paid up
capital of the problematic banks and financial institutions, which have come into operation
after completing the resolution process.
117. Continuity is given to the provision of interest free loan of Rs. 10 million per branch for
certain period to „A', „B‟, and „C‟ class BFIs if they establish their branches outside the
headquarters of remote districts namely Bhojpur, Okhaldhunga, Manang, Rukum, Salyan,
Jumla, Mugu, Humla, Kalikot, Dolpa, Jajarkot, Bajhang, Bajura and Darchula.
118. An interest free loan of Rs. 4 million will be provided to „D‟ class financial institutions if
they establish branches, outside the headquarters of 22 districts namely Manang, Humla,
Dolpa, Kalikot, Mugu, Jajarkot, Bajhang, Bajura, Darchula, Okhaldhunga, Jumla, Achham,
Baitadi, Rukum, Salyan, Bhojpur, Mustang, Rolpa, Taplejung, Khotang, Rasuwa, and
Solukhumbu, where people have low access to microfinance services.
119. A provision will be made to provide an interest free one year loan of Rs. 10 million to BFIs,
which open branches in Village Councils deprived of banking service and open at least 2500
accounts of those Nepali citizens not having bank account. This will facilitate the GoN's
campaign of opening bank account of all citizens and provide social security allowance
through banks. This provision will terminate after 2017/18.
120. Banks will be directed to open branches in 744 local levels, which are designed on the basis
of the federal structure. Banks will be responsible to follow such directive and any defiance
will be penalized as per the provision in the Nepal Rastra Bank Act. However, interest free
loan of Rs. 10 million per branch for one year will be provided to those establishing branches
in designated local levels in order to facilitate government transactions.
12 Nepal Rastra Bank
121. Operating zone on the basis of paid-up capital for 'B' and 'C' class financial institutions will
be defined according to the federal set-up instead of the existing district-based categorization.
122. A directive on Environmental and Social Risk Management will be issued mentioning the
procedures, which BFIs need to follow for risk management.
123. A separate directive will be issued with respect to overdraft as well as demand and working
capital loan extended by the BFIs.
124. A mechanism to report financial soundness indicators will be developed. In addition, early
warning system will be improved for systemic risk analysis.
125. A new directive will be issued identifying necessary revisions in the existing NFRS
Migration Guidelines to implement Nepal Financial Reporting Standard (NFRS) in
commercial banks. NFRS will be implemented gradually in other BFIs too.
126. An arrangement whereby customers can deposit money to their designated bank account
through any BFIs will be made. This will facilitate the customer making banking service
simpler and easier and help in minimizing transaction cost and risk.
127. Development Banks fulfilling the standards set by this Bank will be allowed to issue
domestic letter of credit.
128. The existing provision to conduct any transaction above Rs. 3 million through bank cheque
in order to reduce the risk from cash transactions has been revised. Effective from 16 July
2017, transactions above Rs. 1 million and above should be carried out through account
payee cheques.
129. A provision will be made to report information of each lending to the Credit Information
Bureau instead of the existing provision of credit reporting only for the loan above Rs. 1
million. Further, a provision to share credit information below Rs. 1 million will be made
free of cost.
130. Credit Information Bylaws 2059 has the provision to share credit information to BFIs with or
without fee. Now onwards, individuals/debtors will also be entitled of such facility.
131. Actions will be taken against the BFIs, which do not report credit information regularly.
132. Payment and Settlement Act will be drafted to modernize the payment system of Nepal.
Similarly, Real Time Gross Settlement (RTGS) system will be established and National
Small Value Payment Strategy will be formulated.
133. The process to establish National Payment Switch/Gateway will be pushed forward and
transactions through the telecommunication will be included in such Switch/Gateway to
modernize the existing payment system of Nepal.
134. The use of Financial Technology (FinTech) will be encouraged to expand financial access
and make payment system safer and effective. Initiation will be taken to establish regulatory
technology (RegTech) mechanism for monitoring FinTech transactions.
135. The oversight of electronic payment transactions will be made effective in order to make
such transactions riskfree and improved.
136. An arrangement will be made to keep the interest rate spread at the level directed by the
Financial Sector Development Strategy through effective monitoring. This is particularly in

Monetary Policy for 2017/18 13
the context of stakeholders' concern that the spread between lending and deposit needs to be
lowered given the decline in intermediation costs owing to the financial modernization.
Microfinance and Financial Customer Protection
137. Microfinance institutions (MFIs) will be required to consolidate various funds created for the
protection of customers and utilize such funds only after developing a guideline.
138. Licensing new MFIs has been deferred. However, MFIs will be encouraged to expand their
branches in districts of mountain and hilly regions, with low financial access and
comparatively high poverty.
139. The guideline relating to the service fee for the protection of financial customer will be
revised.
140. An arrangement to provide banking service to the senior citizens, differently-abled people
and illiterate individuals through specified counters of BFIs will be made. In addition,
necessary arrangement will be made to provide ATM services friendly to differently-abled
individuals.
141. A provision will be made to designate at least the senior manager or higher level official at
the 'Information and Grievance Hearing Desk' of the BFIs. In addition, BFIs will be required
to publish the number of grievances handled and hearings in their annual reports, along with
submitting such information to this Bank.
142. BFIs will be required to fix the borrowing rate against the collateral of fixed deposit receipt
at the time of opening the fixed deposit account and will not be allowed to charge interest
more than the predetermined rate.
143. Guidelines will be formulated for the valuation, acceptance and auctioning of the borrower's
collateral, which banks usually ask for lending.
Foreign Exchange Management
144. The card transactions incurred in Nepal are settled in India in Indian currency. The existing
provision for payment and settlement of fee on such card transactions in Indian Currency has
increased the cost. To address this, foreign service providers will be required to settle
electronic card transactions in Nepal and pay only the net amount.
145. The licensed institutions working in the area of foreign exchange have been providing
exchange facility through convertible currency. However, it has become necessary to provide
exchange facility through other appropriate banking instruments given their increasing uses.
Thus, a provision will be made for the licensed institutions fulfilling certain criteria to
provide exchange facilities and receive payment of their services through Point of Sale (PoS).
146. A provision will be made for the licensed hotels to provide exchange facilities up to USD
300 per customer. The existing provision allows such hotels to provide exchange facilities
only while rendering their business services.
147. The existing limit of providing Indian Rupee in cash to the people going for tour in India has
been reduced from Indian Rupee one hundred thousand to Indian Rupee fifty thousand.
Above this limit, people are required to use exchange facility through cards or other banking
instruments. However, this limit is not applicable to those going for medical treatment.

14 Nepal Rastra Bank
148. The existing provision of providing foreign currency exchange only from licensed
institutions will be made effective through wider publicity. This it expected to control
informal foreign currency transactions.
149. An arrangement will be made to provide standing exchange facility for the remuneration
maximum of one year at once for the foreign citizens working in airlines companies of
Nepal. However, labor permit and valid contract agreement should be in place to get such
exchange facility.
150. The limit that Nepalese citizens, firms and institutions are allowed to borrow from their
relatives, other persons, non-resident Nepalese or institutions abroad in order to operate
business or expand business under the specified conditions by this Bank has been increased
to USD 500,000 from USD 200,000. Such limit for borrowing from India has been fixed at
Indian Rupee 50 million. However, pre-approval from this Bank is required for such
borrowings.
151. The existing provision for licensed banks to invest foreign currency holdings in foreign
banks for a maximum period of 2 years has been increased to a maximum period of 5 years
should they invest fully in liquid government securities.
152. Infrastructure development projects operating in Nepal will be allowed to go for short term
advances from abroad in order to meet their operating expenses.
153. The existing provision for repatriation of foreign investment earnings will be made simpler.
In this regard, the firm, company and institutions which distribute dividend up to Rs. one
hundred million per annum will get exchange facility directly through commercial banks
after submitting required documents.
154. An arrangement to provide exchange facility within 90 days on the basis of customs
documents for the immediate import of spare parts of airplanes, telecommunication, and
medical equipment up to USD 10,000 from authorized agents on credit will be made.
155. Necessary arrangement to channelize remittance inflow through banking system and
discourage Hundi transactions will be made. Actions will be taken against those involved in
Hundi as well as illegal transactions of foreign currency in co-ordination with law
implementing agencies.
156. Other existing provisions relating to the foreign exchange are kept unchanged.
Finally,
157. The financial friction witnessed during the time of mid-term review of monetary policy is
ameliorating. This monetary policy formulated in consonance with the GoN budget at a time
when there are rising hopes with respect to economic growth at home and abroad will be
instrumental in promoting macroeconomic stability and attaining the targeted growth.
158. NRB would like to thank all the concerned stakeholders including the GoN and its various
agencies, BFIs, professional associations of industrial and commercial sectors, donor
agencies, academicians and media for their cooperation in formulating this policy. The NRB
expects continued cooperation from all the stakeholders in implementing policy programs as
envisioned in this statement.

Monetary Policy for 2017/18 15
Appendix 1
Progress Matrix of Targets Outlined in Monetary Policy for 2016/17
S.
N.
Point
No. Objectives/Programs Implementation Status
1. 55 Containing annual average CPI inflation rate within 7.5 percent
as mentioned in the budget for 2016/17.
Average inflation rate stood at 4.6 percent during 11
months of 2016/17.
2. 56 Maintaining foreign exchange reserve sufficient to cover
imports of goods and services for at least 8 months.
The foreign exchange reserve stood at Rs. 1070.26 billion
in mid-June 2017. Based on the imports of the first 11
months of the current fiscal year, such reserve is sufficient
to cover prospective merchandise imports of 13.3 months
and merchandise and services imports of 11.5 months.
3. 57 Managing necessary liquidity to support the economic growth
of 6.5 percent as mentioned in the budget for 2016/17.
Liquidity has been managed as per need.
4. 59 The growth rate of broad money will be contained within 17
percent.
On y-o-y basis, broad money posted a growth of 16.8
percent in mid-June 2017.
5. 60 Growth target of the domestic credit has been set to 25 percent. On y-o-y basis, total domestic credit growth rate was 20.9
percent in mid-June 2017.
6. 61 Private sector credit will grow by 20 percent. On y-o-y basis, private sector credit growth rate stood
21.8 percent in mid-June 2017.
7. 64 Two-week repo rate pre-determined by market will be taken as
policy rate.
Manual for two-week repo and deposit collection has been
in implementation since 7 August, 2016. Two-week repo
auction rate stood within the range of 4.8753 percent and
3.7223 percent in the review period.
8. 64 Open Market Transactions Operations Committee (OMTOC)
will determine repo rate by adding 200 basis points to the
weighted average interbank rate, prevailing in the market prior
to two working days. At such a pre-determined rate, the offered
amount will be auctioned to the counterparties and if
necessary, auction allotment will be made on pro-rata basis.
As per the approved Manual, repo auction notice totaling
Rs. 38 billion issued on different periods. Only the bid
amounting Rs. 5.40 billion was received and it was
allocated accordingly.
16 Nepal Rastra Bank
S.
N.
Point
No. Objectives/Programs Implementation Status
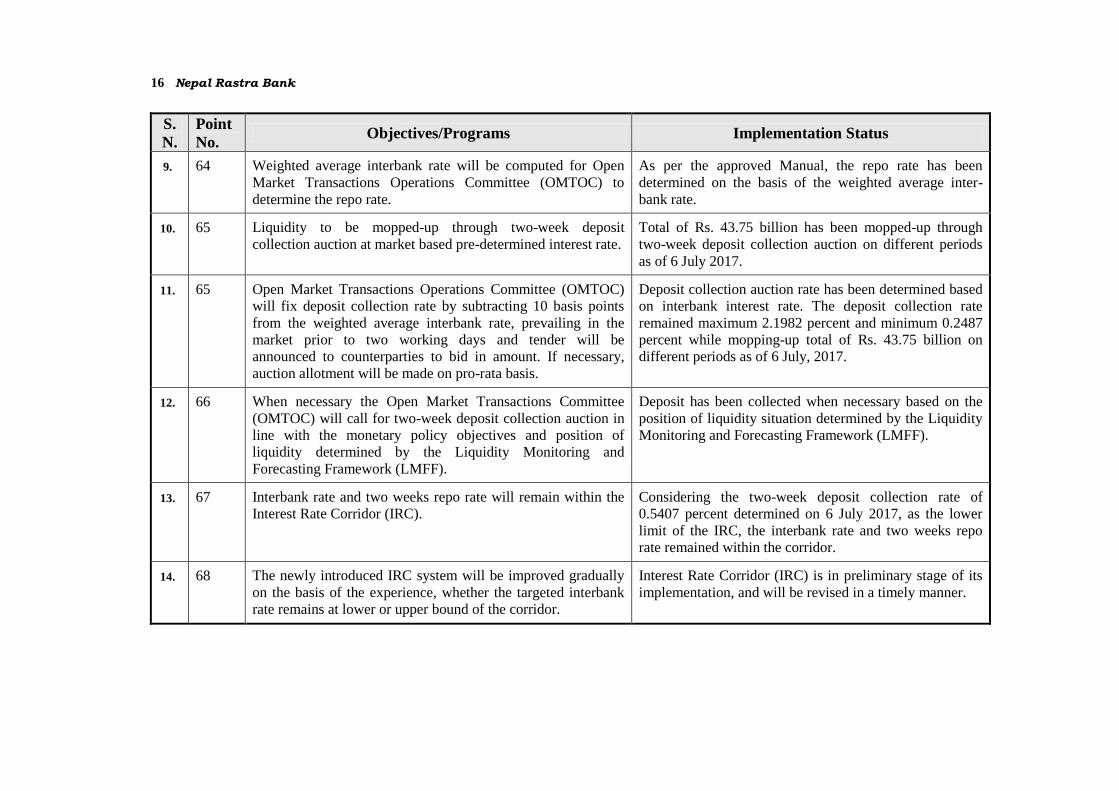
9. 64 Weighted average interbank rate will be computed for Open
Market Transactions Operations Committee (OMTOC) to
determine the repo rate.
As per the approved Manual, the repo rate has been
determined on the basis of the weighted average inter-
bank rate.
10. 65 Liquidity to be mopped-up through two-week deposit
collection auction at market based pre-determined interest rate.
Total of Rs. 43.75 billion has been mopped-up through
two-week deposit collection auction on different periods
as of 6 July 2017.
11. 65 Open Market Transactions Operations Committee (OMTOC)
will fix deposit collection rate by subtracting 10 basis points
from the weighted average interbank rate, prevailing in the
market prior to two working days and tender will be
announced to counterparties to bid in amount. If necessary,
auction allotment will be made on pro-rata basis.
Deposit collection auction rate has been determined based
on interbank interest rate. The deposit collection rate
remained maximum 2.1982 percent and minimum 0.2487
percent while mopping-up total of Rs. 43.75 billion on
different periods as of 6 July, 2017.
12. 66 When necessary the Open Market Transactions Committee
(OMTOC) will call for two-week deposit collection auction in
line with the monetary policy objectives and position of
liquidity determined by the Liquidity Monitoring and
Forecasting Framework (LMFF).
Deposit has been collected when necessary based on the
position of liquidity situation determined by the Liquidity
Monitoring and Forecasting Framework (LMFF).
13. 67 Interbank rate and two weeks repo rate will remain within the
Interest Rate Corridor (IRC).
Considering the two-week deposit collection rate of
0.5407 percent determined on 6 July 2017, as the lower
limit of the IRC, the interbank rate and two weeks repo
rate remained within the corridor.
14. 68 The newly introduced IRC system will be improved gradually
on the basis of the experience, whether the targeted interbank
rate remains at lower or upper bound of the corridor.
Interest Rate Corridor (IRC) is in preliminary stage of its
implementation, and will be revised in a timely manner.
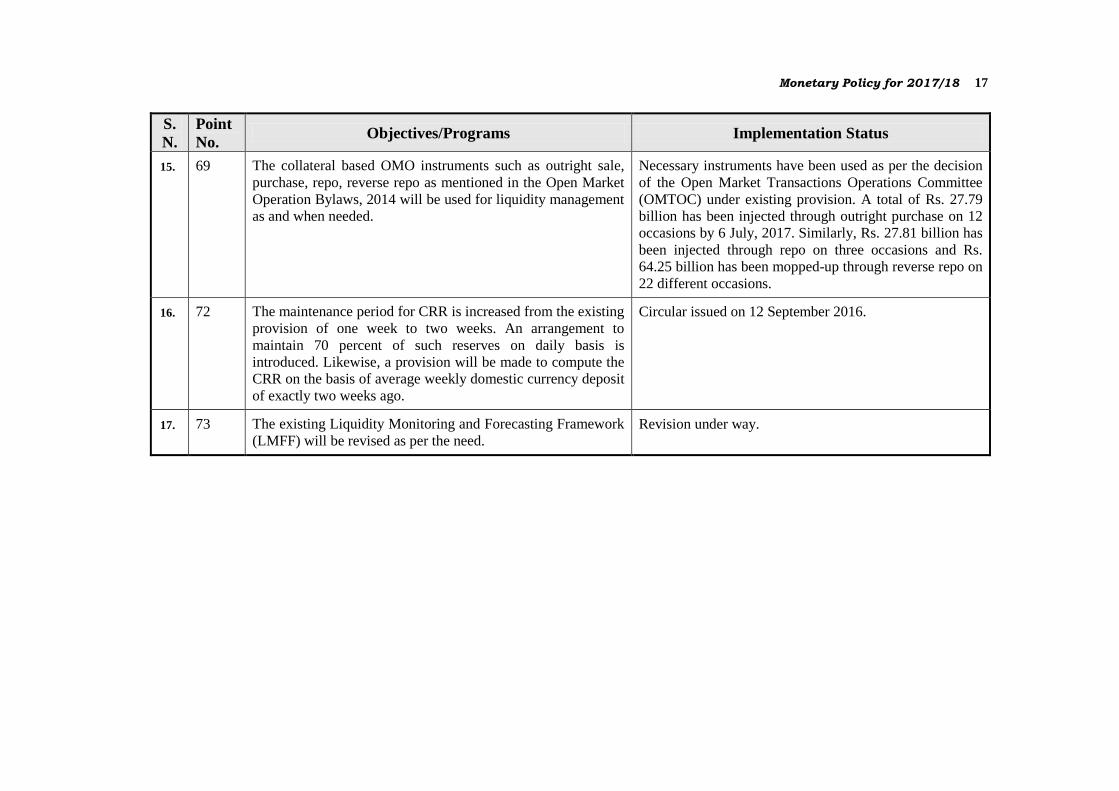
Monetary Policy for 2017/18 17
S.
N.
Point
No. Objectives/Programs Implementation Status
15. 69 The collateral based OMO instruments such as outright sale,
purchase, repo, reverse repo as mentioned in the Open Market
Operation Bylaws, 2014 will be used for liquidity management
as and when needed.
Necessary instruments have been used as per the decision
of the Open Market Transactions Operations Committee
(OMTOC) under existing provision. A total of Rs. 27.79
billion has been injected through outright purchase on 12
occasions by 6 July, 2017. Similarly, Rs. 27.81 billion has
been injected through repo on three occasions and Rs.
64.25 billion has been mopped-up through reverse repo on
22 different occasions.
16. 72 The maintenance period for CRR is increased from the existing
provision of one week to two weeks. An arrangement to
maintain 70 percent of such reserves on daily basis is
introduced. Likewise, a provision will be made to compute the
CRR on the basis of average weekly domestic currency deposit
of exactly two weeks ago.
Circular issued on 12 September 2016.
17. 73 The existing Liquidity Monitoring and Forecasting Framework
(LMFF) will be revised as per the need.
Revision under way.
18 Nepal Rastra Bank
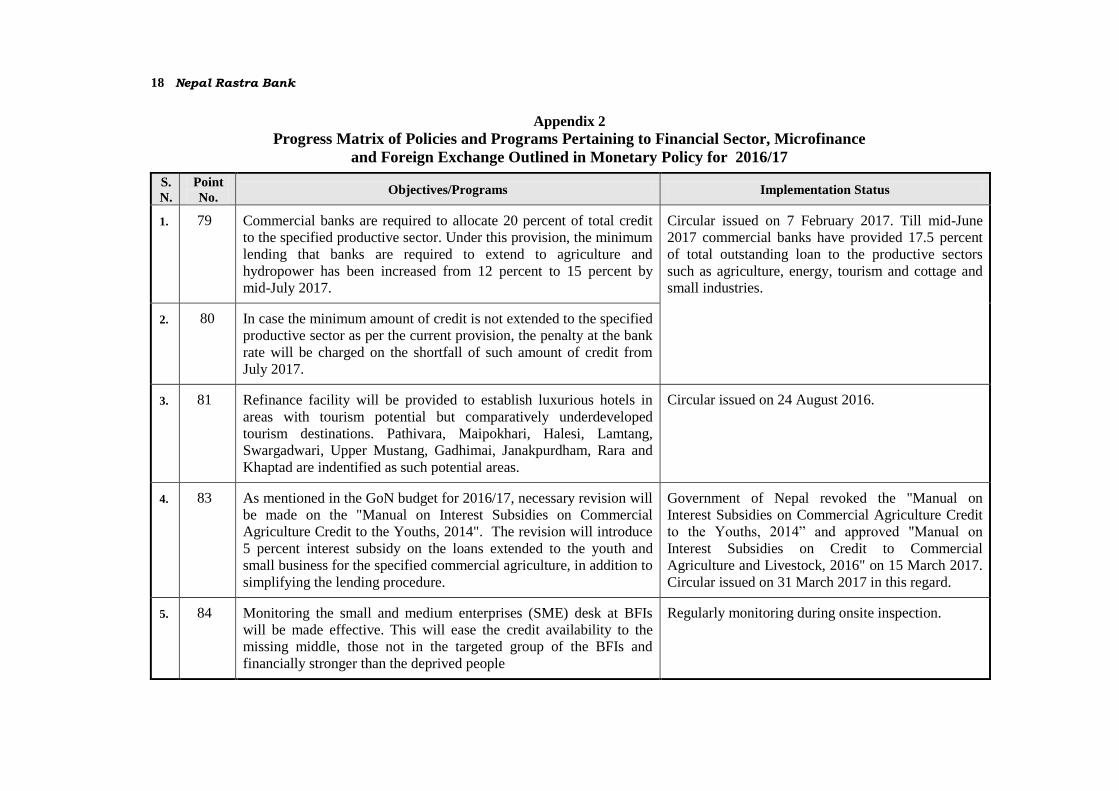
Appendix 2
Progress Matrix of Policies and Programs Pertaining to Financial Sector, Microfinance
and Foreign Exchange Outlined in Monetary Policy for 2016/17
S.
N.
Point
No. Objectives/Programs Implementation Status
1. 79 Commercial banks are required to allocate 20 percent of total credit
to the specified productive sector. Under this provision, the minimum
lending that banks are required to extend to agriculture and
hydropower has been increased from 12 percent to 15 percent by
mid-July 2017.
Circular issued on 7 February 2017. Till mid-June
2017 commercial banks have provided 17.5 percent
of total outstanding loan to the productive sectors
such as agriculture, energy, tourism and cottage and
small industries.
2. 80 In case the minimum amount of credit is not extended to the specified
productive sector as per the current provision, the penalty at the bank
rate will be charged on the shortfall of such amount of credit from
July 2017.
3. 81 Refinance facility will be provided to establish luxurious hotels in
areas with tourism potential but comparatively underdeveloped
tourism destinations. Pathivara, Maipokhari, Halesi, Lamtang,
Swargadwari, Upper Mustang, Gadhimai, Janakpurdham, Rara and
Khaptad are indentified as such potential areas.
Circular issued on 24 August 2016.
4. 83 As mentioned in the GoN budget for 2016/17, necessary revision will
be made on the "Manual on Interest Subsidies on Commercial
Agriculture Credit to the Youths, 2014". The revision will introduce
5 percent interest subsidy on the loans extended to the youth and
small business for the specified commercial agriculture, in addition to
simplifying the lending procedure.
Government of Nepal revoked the "Manual on
Interest Subsidies on Commercial Agriculture Credit
to the Youths, 2014” and approved "Manual on
Interest Subsidies on Credit to Commercial
Agriculture and Livestock, 2016" on 15 March 2017.
Circular issued on 31 March 2017 in this regard.
5. 84 Monitoring the small and medium enterprises (SME) desk at BFIs
will be made effective. This will ease the credit availability to the
missing middle, those not in the targeted group of the BFIs and
financially stronger than the deprived people
Regularly monitoring during onsite inspection.
Monetary Policy for 2017/18 19
S.
N.
Point
No. Objectives/Programs Implementation Status
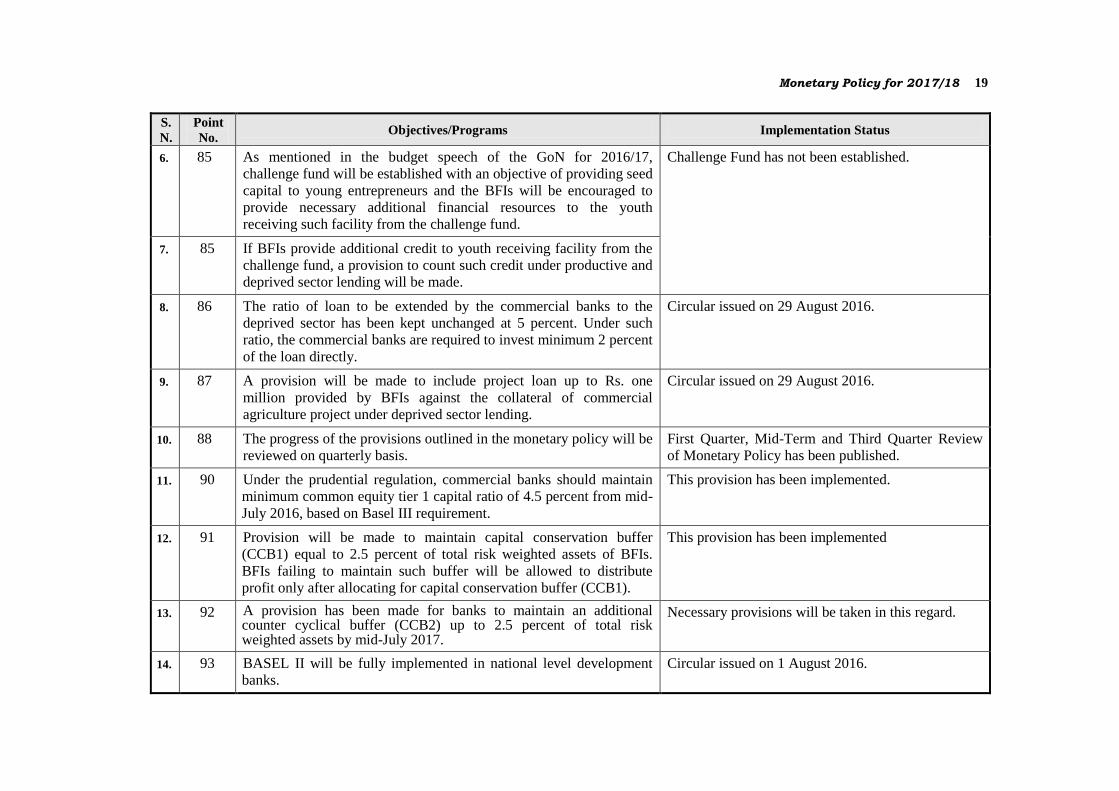
6. 85 As mentioned in the budget speech of the GoN for 2016/17,
challenge fund will be established with an objective of providing seed
capital to young entrepreneurs and the BFIs will be encouraged to
provide necessary additional financial resources to the youth
receiving such facility from the challenge fund.
Challenge Fund has not been established.
7. 85 If BFIs provide additional credit to youth receiving facility from the
challenge fund, a provision to count such credit under productive and
deprived sector lending will be made.
8. 86 The ratio of loan to be extended by the commercial banks to the
deprived sector has been kept unchanged at 5 percent. Under such
ratio, the commercial banks are required to invest minimum 2 percent
of the loan directly.
Circular issued on 29 August 2016.
9. 87 A provision will be made to include project loan up to Rs. one
million provided by BFIs against the collateral of commercial
agriculture project under deprived sector lending.
Circular issued on 29 August 2016.
10. 88 The progress of the provisions outlined in the monetary policy will be
reviewed on quarterly basis.
First Quarter, Mid-Term and Third Quarter Review
of Monetary Policy has been published.
11. 90 Under the prudential regulation, commercial banks should maintain
minimum common equity tier 1 capital ratio of 4.5 percent from mid-
July 2016, based on Basel III requirement.
This provision has been implemented.
12. 91 Provision will be made to maintain capital conservation buffer
(CCB1) equal to 2.5 percent of total risk weighted assets of BFIs.
BFIs failing to maintain such buffer will be allowed to distribute
profit only after allocating for capital conservation buffer (CCB1).
This provision has been implemented
13. 92 A provision has been made for banks to maintain an additional counter cyclical buffer (CCB2) up to 2.5 percent of total risk weighted assets by mid-July 2017.
Necessary provisions will be taken in this regard.
14. 93 BASEL II will be fully implemented in national level development
banks.
Circular issued on 1 August 2016.
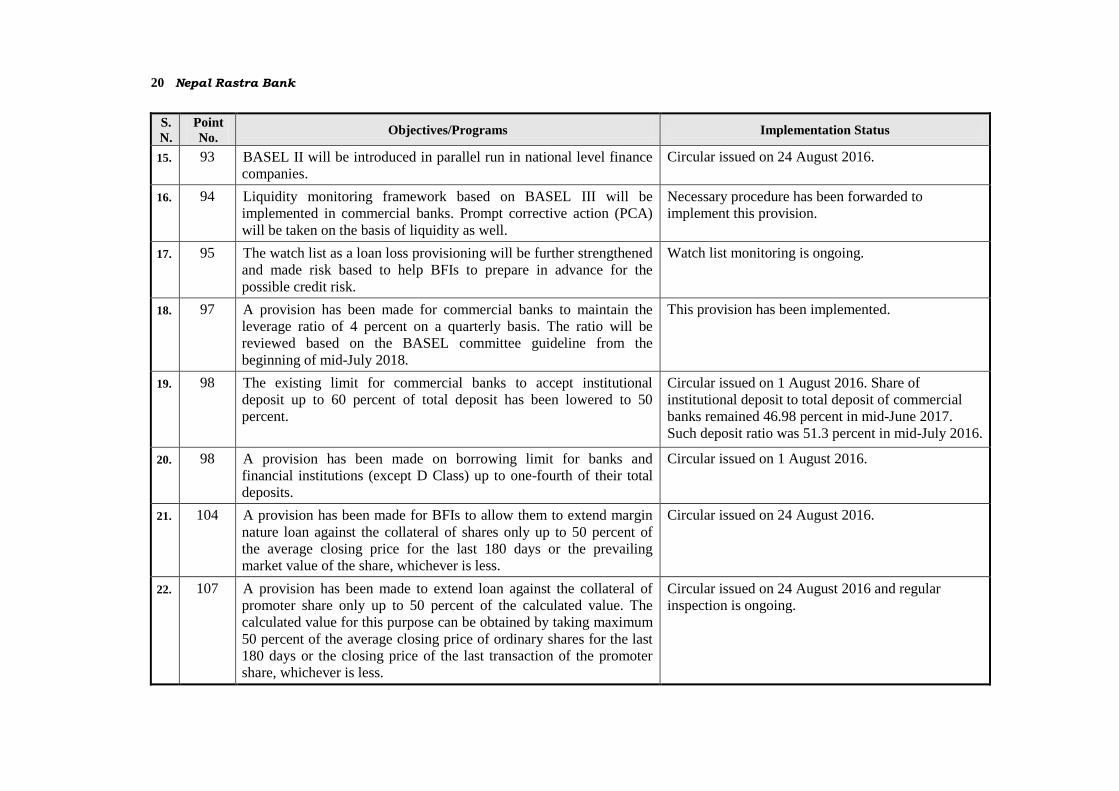
20 Nepal Rastra Bank
S.
N.
Point
No. Objectives/Programs Implementation Status
15. 93 BASEL II will be introduced in parallel run in national level finance
companies.
Circular issued on 24 August 2016.
16. 94 Liquidity monitoring framework based on BASEL III will be
implemented in commercial banks. Prompt corrective action (PCA)
will be taken on the basis of liquidity as well.
Necessary procedure has been forwarded to
implement this provision.
17. 95 The watch list as a loan loss provisioning will be further strengthened
and made risk based to help BFIs to prepare in advance for the
possible credit risk.
Watch list monitoring is ongoing.
18. 97 A provision has been made for commercial banks to maintain the
leverage ratio of 4 percent on a quarterly basis. The ratio will be
reviewed based on the BASEL committee guideline from the
beginning of mid-July 2018.
This provision has been implemented.
19. 98 The existing limit for commercial banks to accept institutional
deposit up to 60 percent of total deposit has been lowered to 50
percent.
Circular issued on 1 August 2016. Share of
institutional deposit to total deposit of commercial
banks remained 46.98 percent in mid-June 2017.
Such deposit ratio was 51.3 percent in mid-July 2016.
20. 98 A provision has been made on borrowing limit for banks and
financial institutions (except D Class) up to one-fourth of their total
deposits.
Circular issued on 1 August 2016.
21. 104 A provision has been made for BFIs to allow them to extend margin
nature loan against the collateral of shares only up to 50 percent of
the average closing price for the last 180 days or the prevailing
market value of the share, whichever is less.
Circular issued on 24 August 2016.
22. 107 A provision has been made to extend loan against the collateral of
promoter share only up to 50 percent of the calculated value. The
calculated value for this purpose can be obtained by taking maximum
50 percent of the average closing price of ordinary shares for the last
180 days or the closing price of the last transaction of the promoter
share, whichever is less.
Circular issued on 24 August 2016 and regular
inspection is ongoing.
Monetary Policy for 2017/18 21
S.
N.
Point
No. Objectives/Programs Implementation Status
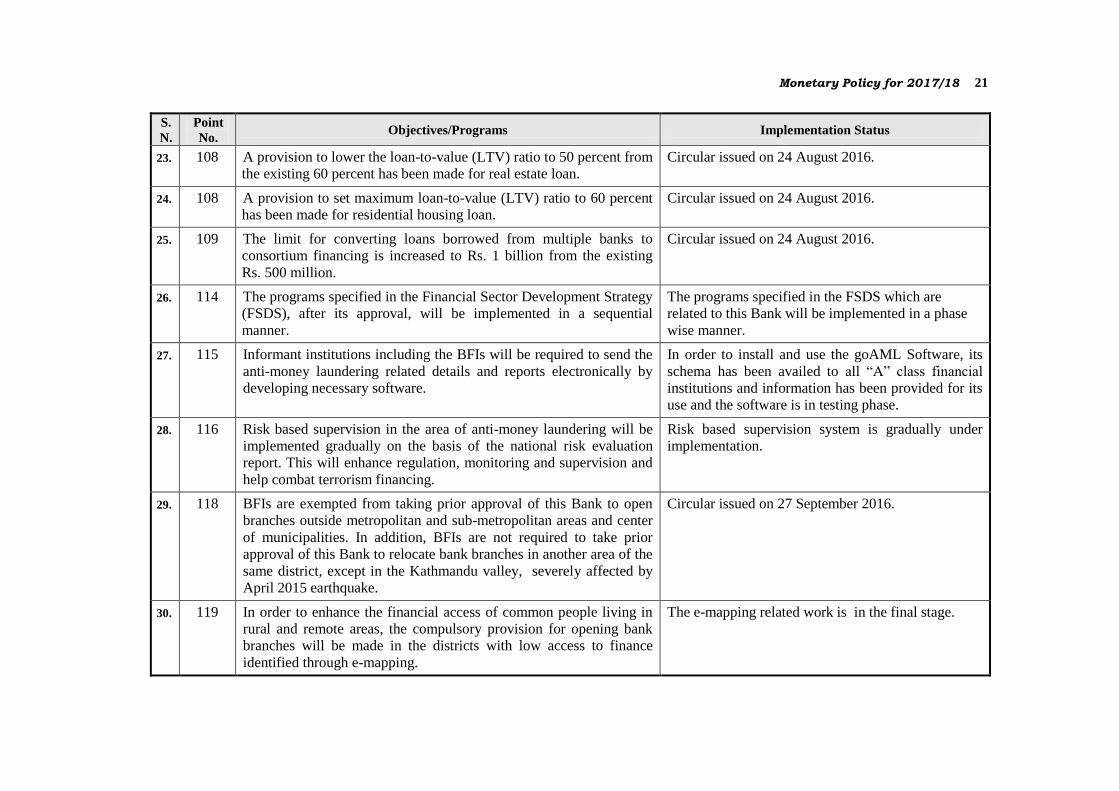
23. 108 A provision to lower the loan-to-value (LTV) ratio to 50 percent from
the existing 60 percent has been made for real estate loan.
Circular issued on 24 August 2016.
24. 108 A provision to set maximum loan-to-value (LTV) ratio to 60 percent
has been made for residential housing loan.
Circular issued on 24 August 2016.
25. 109 The limit for converting loans borrowed from multiple banks to
consortium financing is increased to Rs. 1 billion from the existing
Rs. 500 million.
Circular issued on 24 August 2016.
26. 114 The programs specified in the Financial Sector Development Strategy
(FSDS), after its approval, will be implemented in a sequential
manner.
The programs specified in the FSDS which are
related to this Bank will be implemented in a phase
wise manner.
27. 115 Informant institutions including the BFIs will be required to send the
anti-money laundering related details and reports electronically by
developing necessary software.
In order to install and use the goAML Software, its
schema has been availed to all “A” class financial
institutions and information has been provided for its
use and the software is in testing phase.
28. 116 Risk based supervision in the area of anti-money laundering will be
implemented gradually on the basis of the national risk evaluation
report. This will enhance regulation, monitoring and supervision and
help combat terrorism financing.
Risk based supervision system is gradually under
implementation.
29. 118 BFIs are exempted from taking prior approval of this Bank to open
branches outside metropolitan and sub-metropolitan areas and center
of municipalities. In addition, BFIs are not required to take prior
approval of this Bank to relocate bank branches in another area of the
same district, except in the Kathmandu valley, severely affected by
April 2015 earthquake.
Circular issued on 27 September 2016.
30. 119 In order to enhance the financial access of common people living in
rural and remote areas, the compulsory provision for opening bank
branches will be made in the districts with low access to finance
identified through e-mapping.
The e-mapping related work is in the final stage.

22 Nepal Rastra Bank
S.
N.
Point
No. Objectives/Programs Implementation Status
31. 120 Reestablishment of branches of banks displaced during conflict
period will be made more effective. In this process, private banks will
also be encouraged to open branches in such areas.
Circular issued on 29 August 2016. Out of 318
displaced branches, 157 branches of Nepal Bank
Limited, Rastriya Banijya Bank Limited and
Agricultural Development Bank Limited have been
reestablished by mid-April 2017.
32. 121 The establishment of infrastructure development bank jointly with the
participation of private sector will be initiated.
The policy will be formulated to establish
infrastructure development bank.
33. 122 In order to enhance the quality of corporate governance and risk
management in the entire banking system, "Directors Education
Program" will be conducted. This will increase awareness of directors
of BFIs by incorporating international best practices in transparency,
disclosure, conflict of interest and compliance, among others.
Circular issued on 10 January 2017.
34. 123 The guideline to implement the "Nepal Financial Reporting Standard
(NFRS)" has already been issued to commercial banks. As per the
guideline, the structure of financial statements to be prepared by
commercial banks has also been drafted. New guidelines will be
issued by identifying the areas for improvement in the process of
implementing the NFRS.
The process of implementing the NFRS is underway
along with the finalization of the Uniform Chart of
Accounts.
35. 123 An arrangement will be made to implement the NFRS in other banks
and financial institutions as well.
After implementing in commercial banks in the first
phase, it will be gradually implemented in other
BFIs.
36. 124 Necessary arrangements will be made to distribute social security
allowance through banks and implement the campaign for opening
bank account for all Nepali citizens.
In order to make necessary provisions, the Ministry
of Federal Affairs and Local Development,
Government of Nepal has initiated the coordination
process.
37. 125 In order to make BFIs more active in social responsibility, a
provision to allocate at least one percent of their profit will be made.
Likewise, BFIs will need to allocate at least three percent of total
staff spending on training and career development of their employees.
Circulars were issued on 10 January 2017 for
capacity building of human resources and on 23
February 2017 for corporate social responsibility.

Monetary Policy for 2017/18 23
S.
N.
Point
No. Objectives/Programs Implementation Status
38. 126 To reduce the risk arising from cash transaction, the limit above
which the transactions have to be done through cheque has been
reduced from existing Rs. 5 million to Rs. 3 million.
Circular issued on 24 August 2016 and continuous
monitoring being done.
39. 127 Necessary revision will be made on "Public Debt Guideline, 2003". The revision of guidelines is in final stage.
40. 127 New software will be introduced for the simplification in payment
system through dematerialization of government securities.
A task force has been formed in this regard and
preparation of Business Requirement is in final stage.
41. 128 In order to modernize and manage the existing payment system of
Nepal, the study will be conducted in cooperation with partner
institutions on the Real Time Gross Settlement System (RTGS),
Central Securities Depository (CSD) and National Payment
Switch/Gateway, among others.
After conducting study on RTGS, CSD and National
Payment Switch/Gateway, the report of the study on
RTGS has been completed. In addition, the report is
under the process of preparation for CSD, National
Payment Switch/ Gateway.
42. 129. In order to make the credit information system more effective and
manage multiple banking transactions at MFIs, an arrangement for
MFIs will be made to take the membership of the Credit Information
Bureau (CIB).
The microfinance institutions have been included in
Credit Information Bureau (CIB).
43. 130. An arrangement will be made for the MFIs to maintain maximum of
7 percent spread in excess to their cost of fund while charging interest
on loans.
Circular issued on January 10, 2017 and continuous
monitoring being done.
44. 131 Necessary policy provision will be made based on study regarding
federal structure and e-mapping. This will consider the factors such
as access to finance, up-gradation, merger/acquisition and operation
of MFIs. Until the formulation of such policy, a moratorium is
imposed on establishing and licensing MFIs.
Notice issued on September 27, 2016.
45. 131 The existing licensing policy for establishment of MFIs has been kept
unchanged for MFIs with head office and working area in ten
specified districts with low financial access namely Manang, Jumla,
Dolpa, Kalikot, Mugu, Jajarkot, Bajhang, Bajura and Darchula.
Notice issued on September 27, 2016.

24 Nepal Rastra Bank
S.
N.
Point
No. Objectives/Programs Implementation Status
46. 132 A provision has been made for the national level MFIs providing
wholesale lending to maintain minimum paid up capital of Rs. 600
million by mid-July 2018.
Circular issued on August 24, 2016. Total paid-up
capital of such institutions was Rs. 1.50 billion in
mid-June 2017.
47. 133 The micro credit limit has been revised as follows:
a. Increase in limit of micro credit to the deprived or low income
individuals against group guarantee for operating micro business
from Rs. 1 hundred thousand to Rs. 3 hundred thousand and such
limit is increased from Rs. 3 hundred thousand to Rs. 5 hundred
thousand for group members classified as good borrowers for the
last two years.
b. Increase in credit limit for Solar system and/or Biogas under
renewable energy technology from Rs. 60 thousands to Rs. 2
hundred thousand per family.
c. Increase in credit limit against collateral to deprived and low
income people for operating micro business from Rs. 3 hundred
thousand to Rs. 5 hundred thousand, and such limit increased
from Rs. 5 hundred thousand to Rs. 7 hundred thousand for group
members classified under good category for the last two years.
d. Increase in credit limit against acceptable collateral from Rs. 7
hundred thousand to Rs. 1 million for individuals, affiliated or
not in groups, in village development committees where BFIs are
not present.
e. Increase in credit limit from Rs. 60 thousand to Rs. 3 hundred
thousand for the deprived and low income people not associated
with any group.
Circular issued on August 24, 2016 and being
monitored accordingly.
48. 134 Separate policy provision will be made regarding the Prompt
Corrective Action (PCA) against MFIs not being able to maintain the
specified capital fund.
Bylaw on Prompt Corrective Action (PCA) has
already been put into action.

Monetary Policy for 2017/18 25
S.
N.
Point
No. Objectives/Programs Implementation Status
49. 135 Necessary measures to be undertaken to encourage the use of
financial services by common people, protect the right of customers
and enhance the financial inclusion after the approval of the national
financial literacy policy by the GoN.
Draft of the financial literacy policy has been
submitted to the Ministry of Finance, GoN.
50. 136 A policy to be formulated to encourage maximum portion of remittance inflows through banking system from countries such as South Korea, Israel, Australia, and among others.
A committee was formed by the Ministry of Finance. GoN in January, 2017 in order to make necessary policy provision for South Korea in the first phase.
51. 137 The existing limit of making payment on one occasion for imports from third countries (except India) through draft/TT to be increased from convertible currency amount equivalent to USD 40,000 to convertible currency amount equivalent to USD 50,000.
Circular issued on August 12, 2016.
52. 138 The existing limit to purchase software on one occasion through L/C from India and to be paid in convertible currency to be increased from USD 10,000 to USD 15,000.
Circular issued on August 7, 2016.
53. 139 A provision to be made to mandatorily update the recording of foreign direct investment at this bank.
The public notice with respect to the recording of foreign direct investment has been issued on April 13, 2017.
54. 140 An arrangement to be made for obtaining information from the licensed individuals/institutions electronically in order to facilitate those submitting transaction records to this bank.
The public notice was issued on 15 May 2017.
55. 141 A provision has to be made for institutions involving in remittance business to gradually maintain the following level of minimum paid up capital.
a. Rs. 250 million for companies issuing remittance card.
b. Rs. 100 million from existing level of Rs. 50 million for remittance firm, company or institution acting as a principal company.
c. Rs. 20 million from existing level of Rs. 10 million for remittance firm, company or institution acting as an agent of foreign principal company.
Circular issued on August 21, 2016.
26 Nepal Rastra Bank
S.
N.
Point
No. Objectives/Programs Implementation Status
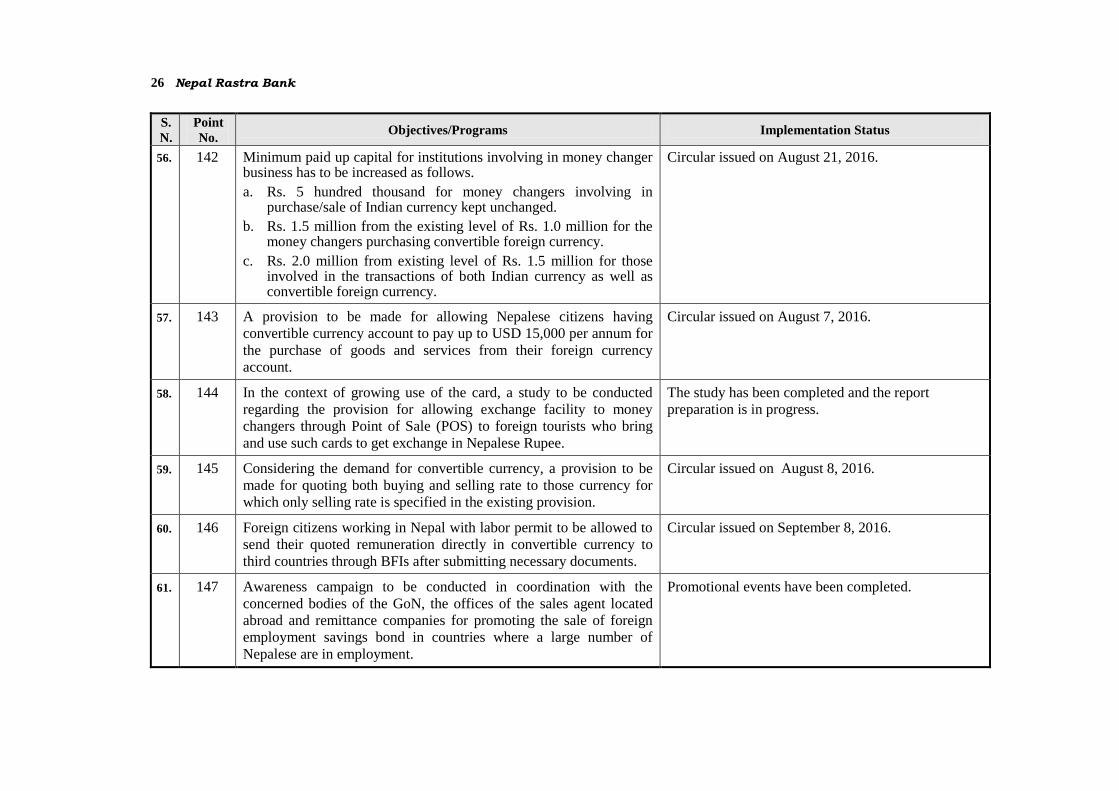
56. 142 Minimum paid up capital for institutions involving in money changer business has to be increased as follows.
a. Rs. 5 hundred thousand for money changers involving in purchase/sale of Indian currency kept unchanged.
b. Rs. 1.5 million from the existing level of Rs. 1.0 million for the money changers purchasing convertible foreign currency.
c. Rs. 2.0 million from existing level of Rs. 1.5 million for those involved in the transactions of both Indian currency as well as convertible foreign currency.
Circular issued on August 21, 2016.
57. 143 A provision to be made for allowing Nepalese citizens having
convertible currency account to pay up to USD 15,000 per annum for
the purchase of goods and services from their foreign currency
account.
Circular issued on August 7, 2016.
58. 144 In the context of growing use of the card, a study to be conducted
regarding the provision for allowing exchange facility to money
changers through Point of Sale (POS) to foreign tourists who bring
and use such cards to get exchange in Nepalese Rupee.
The study has been completed and the report
preparation is in progress.
59. 145 Considering the demand for convertible currency, a provision to be
made for quoting both buying and selling rate to those currency for
which only selling rate is specified in the existing provision.
Circular issued on August 8, 2016.
60. 146 Foreign citizens working in Nepal with labor permit to be allowed to
send their quoted remuneration directly in convertible currency to
third countries through BFIs after submitting necessary documents.
Circular issued on September 8, 2016.
61. 147 Awareness campaign to be conducted in coordination with the
concerned bodies of the GoN, the offices of the sales agent located
abroad and remittance companies for promoting the sale of foreign
employment savings bond in countries where a large number of
Nepalese are in employment.
Promotional events have been completed.
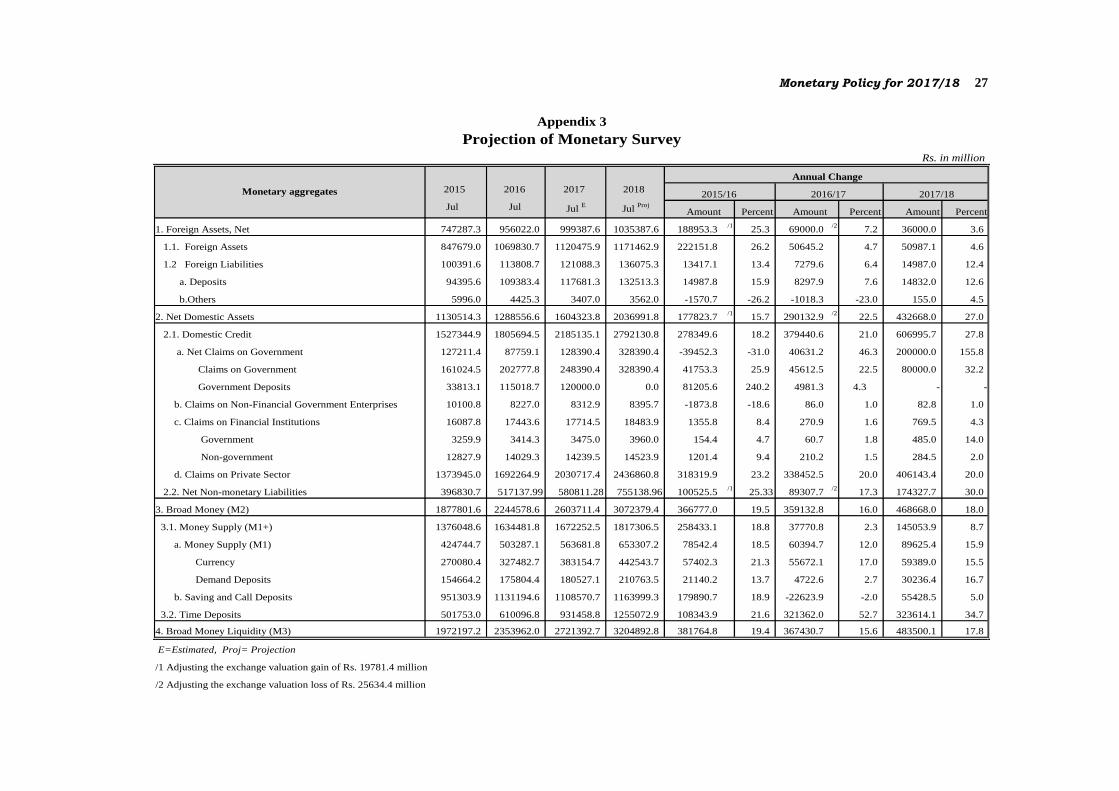
Monetary Policy for 2017/18 27
2015 2016 2017 2018
Jul Jul Jul E
Jul Proj
Amount Percent Amount Percent Amount Percent
1. Foreign Assets, Net 747287.3 956022.0 999387.6 1035387.6 188953.3/1
25.3 69000.0/2
7.2 36000.0 3.6
1.1. Foreign Assets 847679.0 1069830.7 1120475.9 1171462.9 222151.8 26.2 50645.2 4.7 50987.1 4.6
1.2 Foreign Liabilities 100391.6 113808.7 121088.3 136075.3 13417.1 13.4 7279.6 6.4 14987.0 12.4
a. Deposits 94395.6 109383.4 117681.3 132513.3 14987.8 15.9 8297.9 7.6 14832.0 12.6
b.Others 5996.0 4425.3 3407.0 3562.0 -1570.7 -26.2 -1018.3 -23.0 155.0 4.5
2. Net Domestic Assets 1130514.3 1288556.6 1604323.8 2036991.8 177823.7/1
15.7 290132.9/2
22.5 432668.0 27.0
2.1. Domestic Credit 1527344.9 1805694.5 2185135.1 2792130.8 278349.6 18.2 379440.6 21.0 606995.7 27.8
a. Net Claims on Government 127211.4 87759.1 128390.4 328390.4 -39452.3 -31.0 40631.2 46.3 200000.0 155.8
Claims on Government 161024.5 202777.8 248390.4 328390.4 41753.3 25.9 45612.5 22.5 80000.0 32.2
Government Deposits 33813.1 115018.7 120000.0 0.0 81205.6 240.2 4981.3 4.3 - -
b. Claims on Non-Financial Government Enterprises 10100.8 8227.0 8312.9 8395.7 -1873.8 -18.6 86.0 1.0 82.8 1.0
c. Claims on Financial Institutions 16087.8 17443.6 17714.5 18483.9 1355.8 8.4 270.9 1.6 769.5 4.3
Government 3259.9 3414.3 3475.0 3960.0 154.4 4.7 60.7 1.8 485.0 14.0
Non-government 12827.9 14029.3 14239.5 14523.9 1201.4 9.4 210.2 1.5 284.5 2.0
d. Claims on Private Sector 1373945.0 1692264.9 2030717.4 2436860.8 318319.9 23.2 338452.5 20.0 406143.4 20.0
2.2. Net Non-monetary Liabilities 396830.7 517137.99 580811.28 755138.96 100525.5/1
25.33 89307.7/2
17.3 174327.7 30.0
3. Broad Money (M2) 1877801.6 2244578.6 2603711.4 3072379.4 366777.0 19.5 359132.8 16.0 468668.0 18.0
3.1. Money Supply (M1+) 1376048.6 1634481.8 1672252.5 1817306.5 258433.1 18.8 37770.8 2.3 145053.9 8.7
a. Money Supply (M1) 424744.7 503287.1 563681.8 653307.2 78542.4 18.5 60394.7 12.0 89625.4 15.9
Currency 270080.4 327482.7 383154.7 442543.7 57402.3 21.3 55672.1 17.0 59389.0 15.5
Demand Deposits 154664.2 175804.4 180527.1 210763.5 21140.2 13.7 4722.6 2.7 30236.4 16.7
b. Saving and Call Deposits 951303.9 1131194.6 1108570.7 1163999.3 179890.7 18.9 -22623.9 -2.0 55428.5 5.0
3.2. Time Deposits 501753.0 610096.8 931458.8 1255072.9 108343.9 21.6 321362.0 52.7 323614.1 34.7
4. Broad Money Liquidity (M3) 1972197.2 2353962.0 2721392.7 3204892.8 381764.8 19.4 367430.7 15.6 483500.1 17.8
E=Estimated, Proj= Projection
/1 Adjusting the exchange valuation gain of Rs. 19781.4 million
/2 Adjusting the exchange valuation loss of Rs. 25634.4 million
Appendix 3
Projection of Monetary Survey
Rs. in million
Monetary aggregates
Annual Change
2015/16 2016/17 2017/18

28 Nepal Rastra Bank
Table 1 Gross Domestic Product (at 2000/01 Prices)
Table 2 Gross Domestic Product (at Current Prices)
Table 3 Gross National Disposable Income and Saving (at current Prices)
Table 4 National Consumer Price Index (2014/15=100)
Table 5 Monetary Survey
Table 6 Monetary Survey (YoY)
Table 7 Structure of Interest Rates
Table 8 Outright Sale and Purchase Auction
Table 9 Repo and Reverse Repo Auction
Table 10 Deposit Collection Auction (90 Days)
Table 11 Interest Rate Corridor
Table 12 Government Budgetary Operation
Table 13 Outstanding Domestic Debt of the GoN
Table 14 Net Domestic Borrowing of the GoN
Table 15 Direction of Foreign Trade
Table 16 Summary of BOP
Table 17 Gross Foreign Assets of the Banking Sector
Table 18 Purchase/Sale of Foreign Currency
List of Statistical Tables
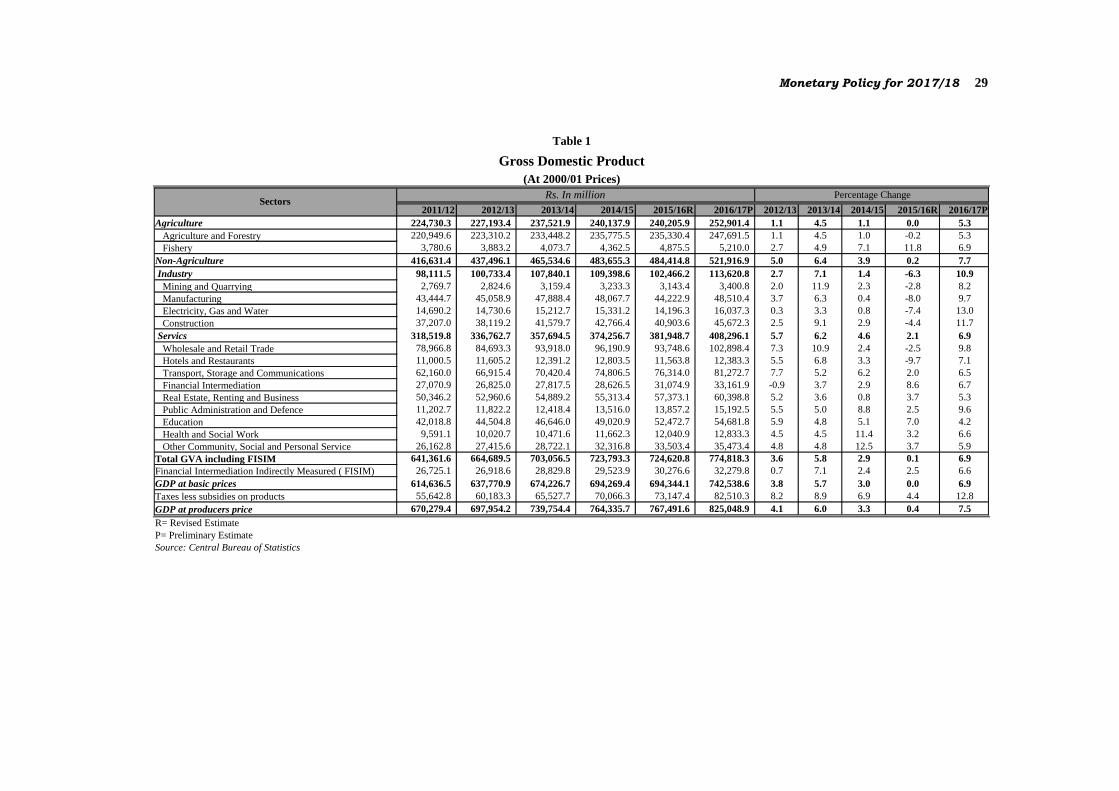
Monetary Policy for 2017/18 29
2011/12 2012/13 2013/14 2014/15 2015/16R 2016/17P 2012/13 2013/14 2014/15 2015/16R 2016/17P
Agriculture 224,730.3 227,193.4 237,521.9 240,137.9 240,205.9 252,901.4 1.1 4.5 1.1 0.0 5.3
Agriculture and Forestry 220,949.6 223,310.2 233,448.2 235,775.5 235,330.4 247,691.5 1.1 4.5 1.0 -0.2 5.3
Fishery 3,780.6 3,883.2 4,073.7 4,362.5 4,875.5 5,210.0 2.7 4.9 7.1 11.8 6.9
Non-Agriculture 416,631.4 437,496.1 465,534.6 483,655.3 484,414.8 521,916.9 5.0 6.4 3.9 0.2 7.7
Industry 98,111.5 100,733.4 107,840.1 109,398.6 102,466.2 113,620.8 2.7 7.1 1.4 -6.3 10.9
Mining and Quarrying 2,769.7 2,824.6 3,159.4 3,233.3 3,143.4 3,400.8 2.0 11.9 2.3 -2.8 8.2
Manufacturing 43,444.7 45,058.9 47,888.4 48,067.7 44,222.9 48,510.4 3.7 6.3 0.4 -8.0 9.7
Electricity, Gas and Water 14,690.2 14,730.6 15,212.7 15,331.2 14,196.3 16,037.3 0.3 3.3 0.8 -7.4 13.0
Construction 37,207.0 38,119.2 41,579.7 42,766.4 40,903.6 45,672.3 2.5 9.1 2.9 -4.4 11.7
Servics 318,519.8 336,762.7 357,694.5 374,256.7 381,948.7 408,296.1 5.7 6.2 4.6 2.1 6.9
Wholesale and Retail Trade 78,966.8 84,693.3 93,918.0 96,190.9 93,748.6 102,898.4 7.3 10.9 2.4 -2.5 9.8
Hotels and Restaurants 11,000.5 11,605.2 12,391.2 12,803.5 11,563.8 12,383.3 5.5 6.8 3.3 -9.7 7.1
Transport, Storage and Communications 62,160.0 66,915.4 70,420.4 74,806.5 76,314.0 81,272.7 7.7 5.2 6.2 2.0 6.5
Financial Intermediation 27,070.9 26,825.0 27,817.5 28,626.5 31,074.9 33,161.9 -0.9 3.7 2.9 8.6 6.7
Real Estate, Renting and Business 50,346.2 52,960.6 54,889.2 55,313.4 57,373.1 60,398.8 5.2 3.6 0.8 3.7 5.3
Public Administration and Defence 11,202.7 11,822.2 12,418.4 13,516.0 13,857.2 15,192.5 5.5 5.0 8.8 2.5 9.6
Education 42,018.8 44,504.8 46,646.0 49,020.9 52,472.7 54,681.8 5.9 4.8 5.1 7.0 4.2
Health and Social Work 9,591.1 10,020.7 10,471.6 11,662.3 12,040.9 12,833.3 4.5 4.5 11.4 3.2 6.6
Other Community, Social and Personal Service 26,162.8 27,415.6 28,722.1 32,316.8 33,503.4 35,473.4 4.8 4.8 12.5 3.7 5.9
Total GVA including FISIM 641,361.6 664,689.5 703,056.5 723,793.3 724,620.8 774,818.3 3.6 5.8 2.9 0.1 6.9
Financial Intermediation Indirectly Measured ( FISIM) 26,725.1 26,918.6 28,829.8 29,523.9 30,276.6 32,279.8 0.7 7.1 2.4 2.5 6.6
GDP at basic prices 614,636.5 637,770.9 674,226.7 694,269.4 694,344.1 742,538.6 3.8 5.7 3.0 0.0 6.9
Taxes less subsidies on products 55,642.8 60,183.3 65,527.7 70,066.3 73,147.4 82,510.3 8.2 8.9 6.9 4.4 12.8
GDP at producers price 670,279.4 697,954.2 739,754.4 764,335.7 767,491.6 825,048.9 4.1 6.0 3.3 0.4 7.5
R= Revised Estimate
P= Preliminary Estimate
Source: Central Bureau of Statistics
Table 1
Gross Domestic Product
(At 2000/01 Prices)
SectorsRs. In million Percentage Change

30 Nepal Rastra Bank
2011/12 2012/13 2013/14 2014/15 2015/16R 2016/17P 2012/13 2013/14 2014/15 2015/16R 2016/17P
Agriculture 506283.9 534514.8 594610.1 625900.7 655571.0 702757.0 5.6 11.2 5.3 4.7 7.2
Agriculture and Forestry 500464.9 527868.8 585951.1 616572.4 645083.5 691168.8 5.5 11.0 5.2 4.6 7.1
Fishery 5819.0 6646.0 8659.0 9328.3 10487.5 11588.2 14.2 30.3 7.7 12.4 10.5
Non-Agriculture 931190.0 1045911.5 1227562.7 1345804.9 1416345.6 1689864.5 12.3 17.4 9.6 5.2 19.3
Industry 215387.2 239922.2 271724.3 292195.2 293409.6 350325.3 11.4 13.3 7.5 0.4 19.4
Mining and Quarrying 8166.1 9568.8 11003.1 11874.9 12255.5 15030.8 17.2 15.0 7.9 3.2 22.6
Manufacturing 91163.7 100312.4 112995.4 118979.8 118615.1 135584.4 10.0 12.6 5.3 -0.3 14.3
Electricity, Gas and Water 17518.4 20553.5 21362.3 22051.4 21221.2 27867.9 17.3 3.9 3.2 -3.8 31.3
Construction 98539.0 109487.6 126363.5 139289.1 141317.8 171842.2 11.1 15.4 10.2 1.5 21.6
Servics 715802.8 805989.3 955838.3 1053609.7 1122935.9 1339539.2 12.6 18.6 10.2 6.6 19.3
Wholesale and Retail Trade 198164.1 229871.5 271573.4 289566.4 292204.4 323501.7 16.0 18.1 6.6 0.9 10.7
Hotels and Restaurants 25306.5 29886.3 35309.4 40479.4 41458.6 47389.6 18.1 18.1 14.6 2.4 14.3
Transport, Storage and Communications 122354.3 140735.4 155764.9 164976.1 167404.5 193973.9 15.0 10.7 5.9 1.5 15.9
Financial Intermediation 58528.7 62183.3 79362.7 91406.1 107758.4 129232.0 6.2 27.6 15.2 17.9 19.9
Real Estate, Renting and Business 123213.4 139157.2 152984.0 166946.9 191325.0 236986.4 12.9 9.9 9.1 14.6 23.9
Public Administration and Defence 30547.2 32236.4 44324.0 51421.5 52719.7 71795.9 5.5 37.5 16.0 2.5 36.2
Education 81796.6 91565.8 115253.5 129363.2 141612.8 173083.7 11.9 25.9 12.2 9.5 22.2
Health and Social Work 20430.7 22326.9 27725.2 32929.4 33707.6 41681.1 9.3 24.2 18.8 2.4 23.7
Other Community, Social and Personal Service 55461.3 58026.5 73541.3 86520.7 94744.8 121894.9 4.6 26.7 17.6 9.5 28.7
Total GVA including FISIM 1437473.9 1580426.3 1822172.8 1971705.6 2071916.6 2392621.5 9.9 15.3 8.2 5.1 15.5
Financial Intermediation Indirectly Measured ( FISIM) 49992.2 55204.9 63434.7 72616.4 84092.8 98632.8 10.4 14.9 14.5 15.8 17.3
GDP at basic prices 1387481.7 1525221.4 1758738.0 1899089.2 1987823.7 2293988.6 9.9 15.3 8.0 4.7 15.4
Taxes less subsidies on products 139861.9 169789.7 205801.5 231060.4 259602.8 305245.1 21.4 21.2 12.3 12.4 17.6
GDP at producers price 1527343.6 1695011.1 1964539.6 2130149.6 2247426.6 2599233.7 11.0 15.9 8.4 5.5 15.7
R= Revised Estimate
P= Preliminary Estimate
Source: Central Bureau of Statistics
Table 2
Gross Domestic Product
(At Current Prices)
SectorsRs. In million Percentage Change
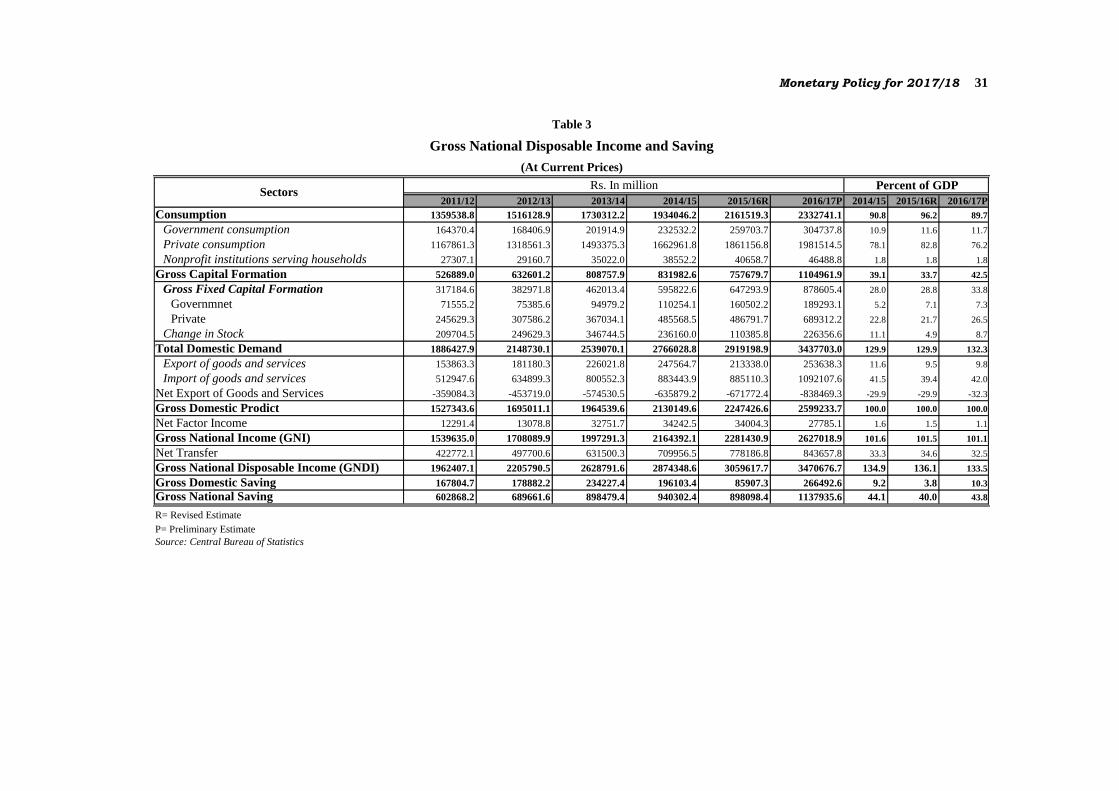
Monetary Policy for 2017/18 31
2011/12 2012/13 2013/14 2014/15 2015/16R 2016/17P 2014/15 2015/16R 2016/17P
Consumption 1359538.8 1516128.9 1730312.2 1934046.2 2161519.3 2332741.1 90.8 96.2 89.7
Government consumption 164370.4 168406.9 201914.9 232532.2 259703.7 304737.8 10.9 11.6 11.7
Private consumption 1167861.3 1318561.3 1493375.3 1662961.8 1861156.8 1981514.5 78.1 82.8 76.2
Nonprofit institutions serving households 27307.1 29160.7 35022.0 38552.2 40658.7 46488.8 1.8 1.8 1.8
Gross Capital Formation 526889.0 632601.2 808757.9 831982.6 757679.7 1104961.9 39.1 33.7 42.5
Gross Fixed Capital Formation 317184.6 382971.8 462013.4 595822.6 647293.9 878605.4 28.0 28.8 33.8
Governmnet 71555.2 75385.6 94979.2 110254.1 160502.2 189293.1 5.2 7.1 7.3
Private 245629.3 307586.2 367034.1 485568.5 486791.7 689312.2 22.8 21.7 26.5
Change in Stock 209704.5 249629.3 346744.5 236160.0 110385.8 226356.6 11.1 4.9 8.7
Total Domestic Demand 1886427.9 2148730.1 2539070.1 2766028.8 2919198.9 3437703.0 129.9 129.9 132.3
Export of goods and services 153863.3 181180.3 226021.8 247564.7 213338.0 253638.3 11.6 9.5 9.8
Import of goods and services 512947.6 634899.3 800552.3 883443.9 885110.3 1092107.6 41.5 39.4 42.0
Net Export of Goods and Services -359084.3 -453719.0 -574530.5 -635879.2 -671772.4 -838469.3 -29.9 -29.9 -32.3
Gross Domestic Prodict 1527343.6 1695011.1 1964539.6 2130149.6 2247426.6 2599233.7 100.0 100.0 100.0
Net Factor Income 12291.4 13078.8 32751.7 34242.5 34004.3 27785.1 1.6 1.5 1.1
Gross National Income (GNI) 1539635.0 1708089.9 1997291.3 2164392.1 2281430.9 2627018.9 101.6 101.5 101.1
Net Transfer 422772.1 497700.6 631500.3 709956.5 778186.8 843657.8 33.3 34.6 32.5
Gross National Disposable Income (GNDI) 1962407.1 2205790.5 2628791.6 2874348.6 3059617.7 3470676.7 134.9 136.1 133.5
Gross Domestic Saving 167804.7 178882.2 234227.4 196103.4 85907.3 266492.6 9.2 3.8 10.3
Gross National Saving 602868.2 689661.6 898479.4 940302.4 898098.4 1137935.6 44.1 40.0 43.8
R= Revised Estimate
P= Preliminary Estimate
Source: Central Bureau of Statistics
Table 3
Gross National Disposable Income and Saving
(At Current Prices)
SectorsRs. In million Percent of GDP
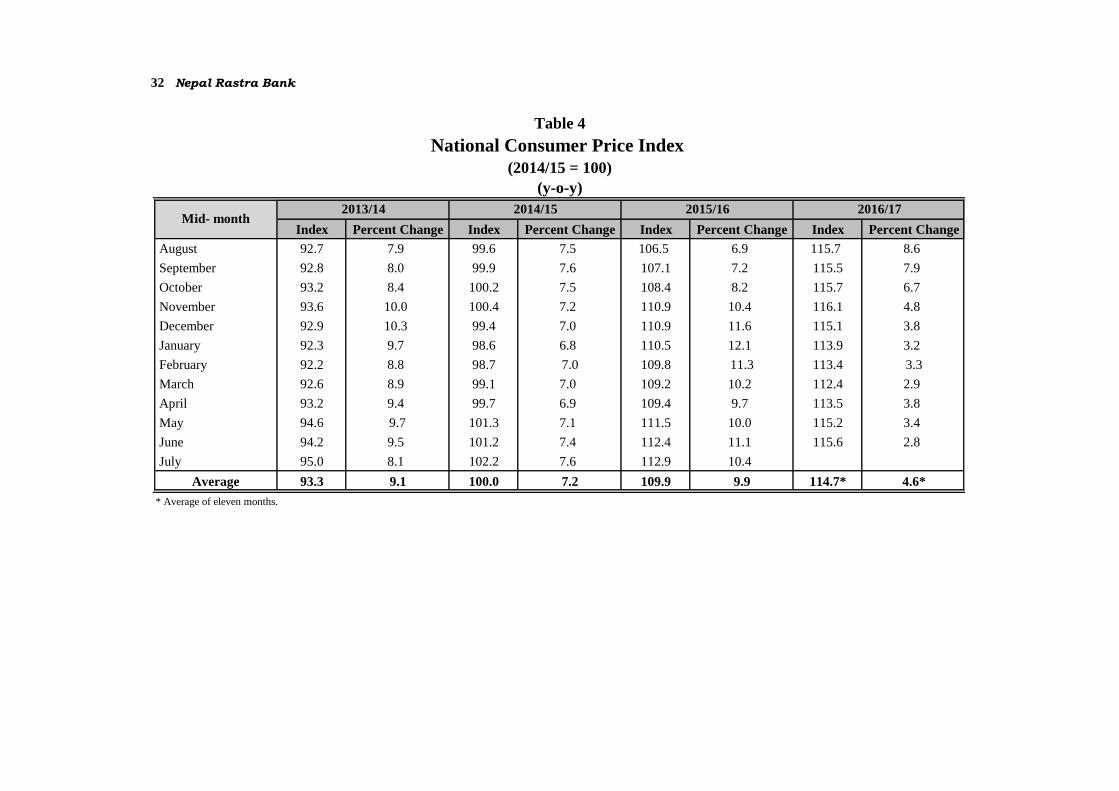
32 Nepal Rastra Bank
Index Percent Change Index Percent Change Index Percent Change Index Percent Change
August 92.7 7.9 99.6 7.5 106.5 6.9 115.7 8.6
September 92.8 8.0 99.9 7.6 107.1 7.2 115.5 7.9
October 93.2 8.4 100.2 7.5 108.4 8.2 115.7 6.7
November 93.6 10.0 100.4 7.2 110.9 10.4 116.1 4.8
December 92.9 10.3 99.4 7.0 110.9 11.6 115.1 3.8
January 92.3 9.7 98.6 6.8 110.5 12.1 113.9 3.2
February 92.2 8.8 98.7 7.0 109.8 11.3 113.4 3.3
March 92.6 8.9 99.1 7.0 109.2 10.2 112.4 2.9
April 93.2 9.4 99.7 6.9 109.4 9.7 113.5 3.8
May 94.6 9.7 101.3 7.1 111.5 10.0 115.2 3.4
June 94.2 9.5 101.2 7.4 112.4 11.1 115.6 2.8
July 95.0 8.1 102.2 7.6 112.9 10.4
Average 93.3 9.1 100.0 7.2 109.9 9.9 114.7* 4.6*
* Average of eleven months.
Table 4
National Consumer Price Index
(2014/15 = 100)
(y-o-y)
Mid- month2014/15 2015/16 2016/172013/14
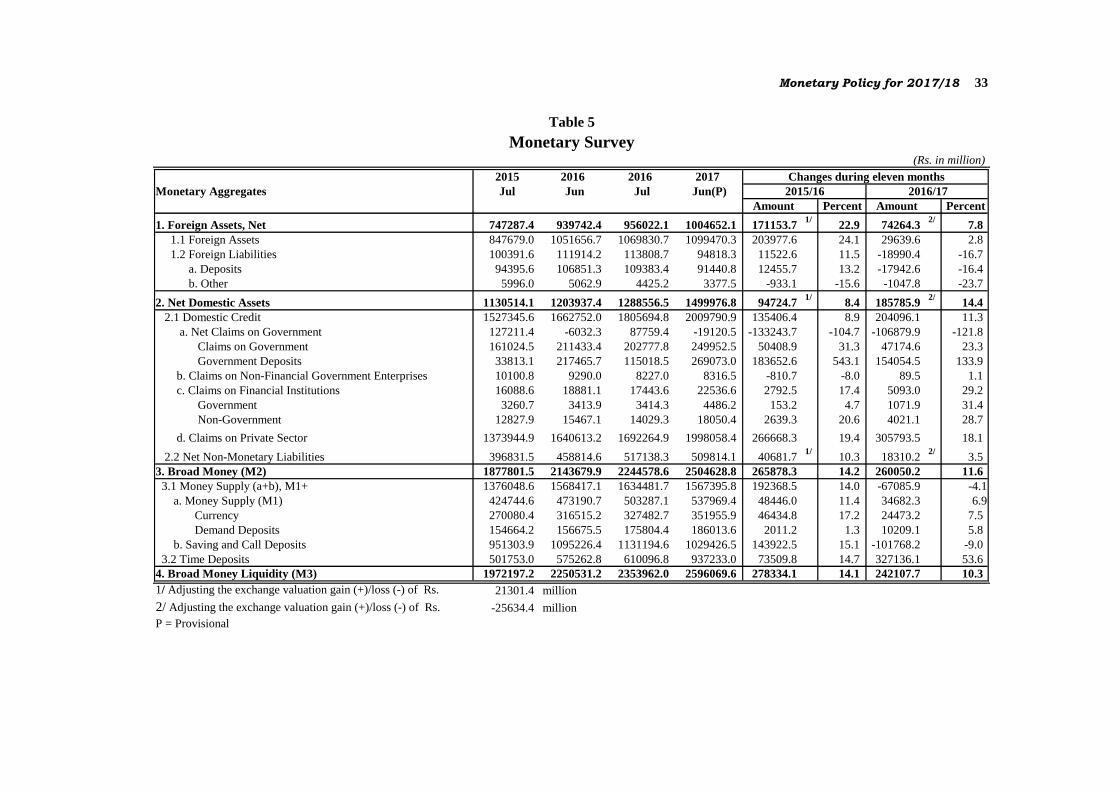
Monetary Policy for 2017/18 33
2015 2016 2016 2017
Monetary Aggregates Jul Jun Jul Jun(P)
Amount Percent Amount Percent
1. Foreign Assets, Net 747287.4 939742.4 956022.1 1004652.1 171153.71/
22.9 74264.32/
7.8
1.1 Foreign Assets 847679.0 1051656.7 1069830.7 1099470.3 203977.6 24.1 29639.6 2.8
1.2 Foreign Liabilities 100391.6 111914.2 113808.7 94818.3 11522.6 11.5 -18990.4 -16.7
a. Deposits 94395.6 106851.3 109383.4 91440.8 12455.7 13.2 -17942.6 -16.4
b. Other 5996.0 5062.9 4425.2 3377.5 -933.1 -15.6 -1047.8 -23.7
2. Net Domestic Assets 1130514.1 1203937.4 1288556.5 1499976.8 94724.71/
8.4 185785.92/
14.4
2.1 Domestic Credit 1527345.6 1662752.0 1805694.8 2009790.9 135406.4 8.9 204096.1 11.3
a. Net Claims on Government 127211.4 -6032.3 87759.4 -19120.5 -133243.7 -104.7 -106879.9 -121.8
Claims on Government 161024.5 211433.4 202777.8 249952.5 50408.9 31.3 47174.6 23.3
Government Deposits 33813.1 217465.7 115018.5 269073.0 183652.6 543.1 154054.5 133.9
b. Claims on Non-Financial Government Enterprises 10100.8 9290.0 8227.0 8316.5 -810.7 -8.0 89.5 1.1
c. Claims on Financial Institutions 16088.6 18881.1 17443.6 22536.6 2792.5 17.4 5093.0 29.2
Government 3260.7 3413.9 3414.3 4486.2 153.2 4.7 1071.9 31.4
Non-Government 12827.9 15467.1 14029.3 18050.4 2639.3 20.6 4021.1 28.7
d. Claims on Private Sector 1373944.9 1640613.2 1692264.9 1998058.4 266668.3 19.4 305793.5 18.1
2.2 Net Non-Monetary Liabilities 396831.5 458814.6 517138.3 509814.1 40681.71/
10.3 18310.22/
3.5
3. Broad Money (M2) 1877801.5 2143679.9 2244578.6 2504628.8 265878.3 14.2 260050.2 11.6
3.1 Money Supply (a+b), M1+ 1376048.6 1568417.1 1634481.7 1567395.8 192368.5 14.0 -67085.9 -4.1
a. Money Supply (M1) 424744.6 473190.7 503287.1 537969.4 48446.0 11.4 34682.3 6.9
Currency 270080.4 316515.2 327482.7 351955.9 46434.8 17.2 24473.2 7.5
Demand Deposits 154664.2 156675.5 175804.4 186013.6 2011.2 1.3 10209.1 5.8
b. Saving and Call Deposits 951303.9 1095226.4 1131194.6 1029426.5 143922.5 15.1 -101768.2 -9.0
3.2 Time Deposits 501753.0 575262.8 610096.8 937233.0 73509.8 14.7 327136.1 53.6
4. Broad Money Liquidity (M3) 1972197.2 2250531.2 2353962.0 2596069.6 278334.1 14.1 242107.7 10.3
1/ Adjusting the exchange valuation gain (+)/loss (-) of Rs. 21301.4 million
2/ Adjusting the exchange valuation gain (+)/loss (-) of Rs. -25634.4 million
P = Provisional
Table 5
Monetary Survey (Rs. in million)
Changes during eleven months
2015/16 2016/17

34 Nepal Rastra Bank
2015 2016 2017
Monetary aggregates Jun Jun Jun (P)
Amount Percent Amount Percent
1. Foreign Assets, Net 731506.2 939742.4 1004652.1 208236.2 28.5 64909.6 6.9
1.1 Foreign Assets 832768.3 1051656.7 1099470.3 218888.4 26.3 47813.7 4.5
1.2 Foreign Liabilities 101262.0 111914.2 94818.3 10652.2 10.5 -17095.9 -15.3
a. Deposits 94917.2 106851.3 91440.8 11934.2 12.6 -15410.5 -14.4
b. Other 6344.8 5062.9 3377.5 -1282.0 -20.2 -1685.4 -33.3
2. Net Domestic Assets 1070233.5 1203937.4 1499976.8 133704.0 12.5 296039.3 24.6
2.1 Domestic Credit 1453375.1 1662752.0 2009790.9 209376.9 14.4 347038.9 20.9
a. Net Claims on Government 65987.6 -6032.3 -19120.5 -72019.9 -109.1 -13088.3 217.0
Claims on Government 146872.4 211433.4 249952.5 64561.1 44.0 38519.0 18.2
Government Deposits 80884.8 217465.7 269073.0 136580.9 168.9 51607.3 23.7
b. Claims on Non-Financial Government Enterprises 9796.5 9290.0 8316.5 -506.5 -5.2 -973.6 -10.5
c. Claims on Financial Institutions 14351.6 18881.1 22536.6 4529.4 31.6 3655.5 19.4
Government 2668.4 3413.9 4486.2 745.5 27.9 1072.3 31.4
Non-Government 11683.3 15467.1 18050.4 3783.9 32.4 2583.2 16.7
d. Claims on Private Sector 1363239.3 1640613.2 1998058.4 277373.9 20.3 357445.2 21.8
2.2 Net Non-Monetary Liabilities 383141.6 458814.6 509814.1 75672.9 19.8 50999.6 11.1
3. Broad Money (M2) 1801739.7 2143679.9 2504628.8 341940.2 19.0 360948.9 16.8
3.1 Money Supply (a + b), M1+ 1309073.0 1568417.1 1567395.8 259344.0 19.8 -1021.2 -0.1
a. Money Supply (M1) 397168.7 473190.7 537969.4 76022.0 19.1 64778.7 13.7
Currency 260844.0 316515.2 351955.9 55671.1 21.3 35440.7 11.2
Demand Deposits 136324.6 156675.5 186013.6 20350.9 14.9 29338.1 18.7
b. Saving and Call Deposits 911904.4 1095226.4 1029426.5 183322.1 20.1 -65800.0 -6.0
3.2 Time Deposits 492666.7 575262.8 937233.0 82596.1 16.8 361970.1 62.9
4. Broad Money Liquidity (M3) 1896656.9 2250531.2 2596069.6 353874.3 18.7 345538.4 15.4
P = provisional
2015/16 2016/17
(Year on Year)
Table 6
Monetary Survey
(Rs. in million)
Changes

Monetary Policy for 2017/18 35
2015 2016 2016 2016 2017 2017 2017
Jul Jun Jul Oct Jan Apr Jun
A. Policy Rates
CRR
Commercial Banks 6.0 6.0 6.0 6.0 6.0 6.0 6.0
Development Banks 5.0 5.0 5.0 5.0 5.0 5.0 5.0
Finance Companies 4.0 4.0 4.0 4.0 4.0 4.0 4.0
Bank Rate 8.0 7.0 7.0 7.0 7.0 7.0 7.0
Refinance Rates Against Loans to:
Special Refinance 1.0 1.0 1.0 1.0 1.0 1.0 1.0
General Refinance 4.0 4.0 4.0 4.0 4.0 4.0 4.0
Export Credit in Foreign Currency LIBOR+0.25 LIBOR+0.25 LIBOR+0.25 LIBOR+0.25 LIBOR+0.25 LIBOR+0.25 LIBOR+0.25
Standing Liquidity Facility (SLF) Rate ^ 8.0 7.0 7.0 7.0 7.0 7.0 7.0
B. Government Securities
T-bills (28 days)* - - - - - - -
T-bills (91 days)* 0.1739 0.12 0.05 2.12 1.74 0.93 1.03
T-bills (182 days)* 0.5648 0.44 0.33 2.30 2.23 1.45 2.02
T-bills (364 days)* 0.7579 0.67 0.72 2.74 2.70 2.31 2.10
Development Bonds 2.65-9.5 2.65-9.0 2.65-9.0 2.65-9.0 2.65-9.0 2.65-9.0 2.65-9.0
National/Citizen SCs 6.0-10.0 6.0-10.0 6.0-10.0 6.0-10.0 6.0-10.0 6.0-10.0 6.0-10.0
C. Interbank Rate of Commercial Banks 1.01 0.36 0.69 3.27 2.71 0.75 2.46
D. Weighted Average Deposit Rate (Commercial Banks) 3.94 3.09 3.28 3.30 3.98 5.08 5.91
E. Weighted Average Lending Rate (Commercial Banks) 9.62 8.98 8.86 8.62 9.31 10.77 11.29
F. Base Rate (Commercial Banks) 7.88 6.27 6.54 6.43 7.10 8.60 9.40
^ The SLF rate is fixed as same as bank rate effective from August 16, 2012
* Weighted average interest rate.
Table 7
Structure of Interest Rate(Percent per annum)
Year
Mid-month
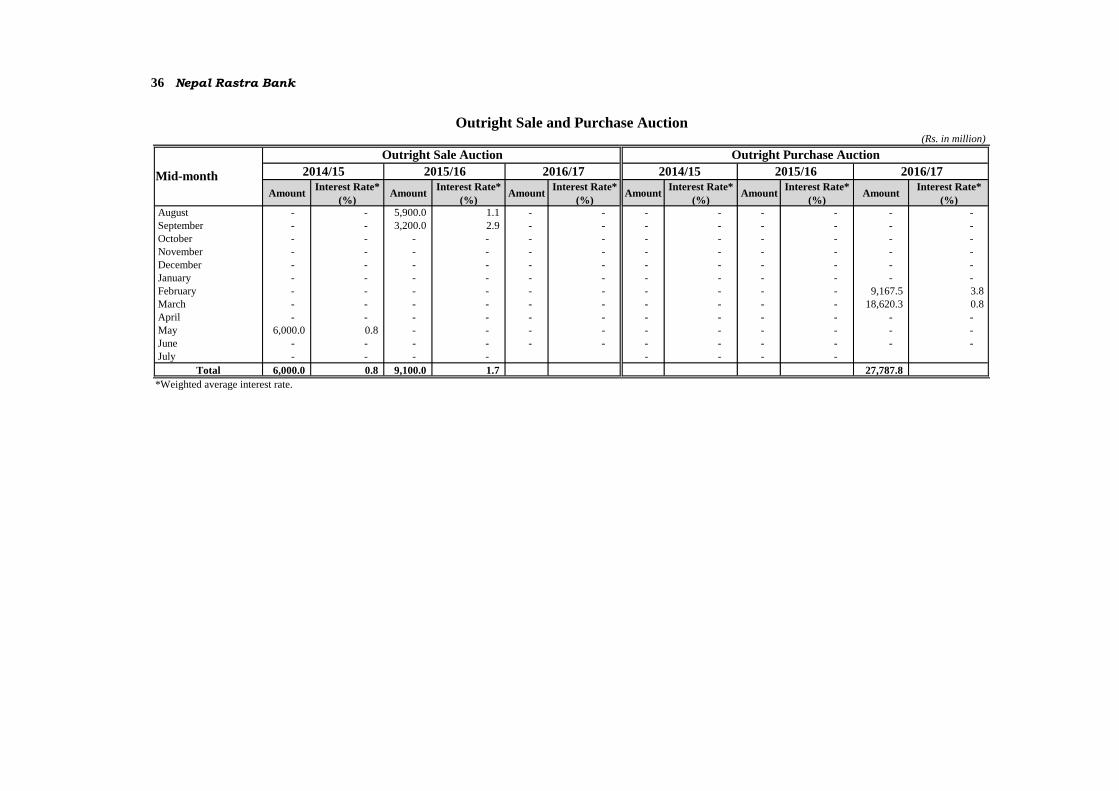
36 Nepal Rastra Bank
(Rs. in million)
AmountInterest Rate*
(%)Amount
Interest Rate*
(%)Amount
Interest Rate*
(%)Amount
Interest Rate*
(%)Amount
Interest Rate*
(%)Amount
Interest Rate*
(%)
August - - 5,900.0 1.1 - - - - - - - -
September - - 3,200.0 2.9 - - - - - - - -
October - - - - - - - - - - - -
November - - - - - - - - - - - -
December - - - - - - - - - - - -
January - - - - - - - - - - - -
February - - - - - - - - - - 9,167.5 3.8
March - - - - - - - - - - 18,620.3 0.8
April - - - - - - - - - - - -
May 6,000.0 0.8 - - - - - - - - - -
June - - - - - - - - - - - -
July - - - - - - - -
Total 6,000.0 0.8 9,100.0 1.7 27,787.8
*Weighted average interest rate.
2016/17
Outright Sale and Purchase Auction
Mid-month
Outright Sale Auction Outright Purchase Auction
2014/15 2015/16 2016/17 2014/15 2015/16

Monetary Policy for 2017/18 37
(Rs. in million)
AmountInterest Rate*
(%)Amount
Interest Rate*
(%)Amount
Interest Rate*
(%)Amount
Interest Rate*
(%)Amount
Interest Rate*
(%)Amount
Interest Rate*
(%)
August - - - - - - 99,500.0 0.00 13,000.0 0.72 27,450.0 0.43
September - - - - - - 68,500.0 0.05 8,300.0 1.30 26,100.0 2.49
October - - - - 10,000.0 3.06 19,000.0 0.11 35,000.0 0.22 5,200.0 2.45
November - - - - - - 11,000.0 0.03 20,000.0 0.21 2,000.0 2.41
December - - - - - - 22,500.0 0.05 9,000.0 0.13 2,000.0 2.21
January - - - - - - 40,000.0 0.01 12,050.0 0.04 1,500.0 1.27
February - - - - 17,810.0 5.68 9,750.0 0.17 40,000.0 0.11 - -
March - - - - - - 850.0 0.40 25,420.0 0.17 - -
April - - - - - - 2,700.0 0.04 2,270.0 1.08 - -
May - - - - - - 6,000.0 0.32 5,910.0 0.41 - -
June - - - - - - 11,000.0 0.26 40,000.0 0.07 - -
July - - - - 25,000.0 0.02 25,000.0 0.00
Total - - - - 27,810.0 315,800.0 0.05 235,950.0 0.21 64,250.0
*Weighted average interest rate.
2016/17
Table 9
Repo and Reverse Repo Auction
Mid-month
Repo Auction (7-Days) Reverse Repo Auction
2014/15 2015/16 2016/17 2014/15 2015/16

38 Nepal Rastra Bank
(Rs. in million)
Amount Interest Rate *
(%)Amount
Interest Rate *
(%)Amount
Interest Rate *
(%)
August - - 57,250.0 1.39 5,000.0 1.39
September 20,000.0 0.69 - - 50.0 2.60
October 20,000.0 0.67 - - - -
November - - 100,000.0 0.87 - -
December 15,000.0 0.21 26,150.0 1.08 - -
January 20,000.0 0.20 15,000.0 0.81 2,000.0 1.60
February 5,000.0 0.69 60,000.0 0.48 - -
March 5,000.0 0.86 39,100.0 0.39 - -
April 10,000.0 0.72 - - - -
May 10,000.0 0.79 - - - -
June - - - - - -
July 50,000.0 0.24 - -
Total 155,000.0 0.45 297,500.0 0.85 7,050.0
*Weighted average interest rate.
Table 10
Deposit Collection Auction (90 Days)
Mid-month
2014/15 2015/16 2016/17

Monetary Policy for 2017/18 39
(Rs. in million)
Amount Interest Rate * (%) Amount Interest Rate * (%)
August 16450.0 0.30 - -
September 10000.0 2.10 10.0 3.72
October - - - -
November - - - -
December - - - -
January 3350.0 0.89 5390.0 4.88
February - - - -
March - - - -
April - - - -
May - - - -
June - - - -
July** 13950.0 0.61
Total 43750.0 5400.0
*Weighted average interest rate.
** Upto Asar 22.
2016/17 2016/17
Table 11
Interest Rate Corridor
Month
Deposit Collection Acuction (14 Days) Repo Auction (14 Days)

40 Nepal Rastra Bank
2014/15 2015/16 2016/17P
July 03 July 01 June 30 2015/16 2016/17
Expenditure of Budget 418551.4 424648.8 629752.1 1.5 48.3
Recurrent 288370.4 302980.1 430702.9 5.1 42.2
a.Domestic Resources 268441.3 278651.8 396802.3 3.8 42.4
b.Foreign Loans 3059.5 7001.2 15765.3 128.8 125.2
c.Foreign Grants 16869.6 17327.1 18135.3 2.7 4.7
Capital 53230.4 64494.5 120815.8 21.2 87.3
a.Domestic Resources 44111.2 55134.2 96647.1 25.0 75.3
b.Foreign Loans 6313.0 5263.5 16268.9 -16.6 209.1
c.Foreign Grants 2806.2 4096.8 7899.8 46.0 92.8
Financial 76950.6 57174.2 78233.4 -25.7 36.8
a.Domestic Resources 72917.3 52878.7 76167.9 -27.5 44.0
b.Foreign Loans 3136.3 3969.5 1737.0 26.6 -56.2
c.Foreign Grants 897.0 326.0 328.5 -63.7 0.8
Total Expenditure 418551.4 424648.8 629752.1 1.5 48.3
Total Resources 421187.4 480064.4 624992.7 14.0 30.2
Revenue and Grants 394538.0 454247.6 558653.2 15.1 23.0
Revenue 363681.8 420874.4 544764.5 15.7 29.4
Foreign Grants 30856.2 33373.2 13888.7 8.2 -58.4
Non-Budgetary Receipts, net 9732.6 7871.6 17636.4 -19.1 124.1
Others 34.2 436.8 -994.4 1177.2 -327.7
V. A. T. Fund Account 1281.2 1703.0 1285.0 32.9 -24.5
Customs Fund Account 925.0 336.0 1510.7 63.7 349.6
Reconstruction Fund Account 0.0 0.0 18287.1 - -
Local Authorities' Accounts (LAA)# 14676.4 15469.4 28614.7 5.4 85.0
Deficits(-) Surplus(+) 2636.0 55415.6 -4759.4
Sources of Financing -2636.0 -55415.6 4759.4
Internal Loans -13980.9 -96204.1 -43752.2 588.1 -54.5
Domestic Borrowings 42339.4 87662.1 81337.7 107.0 -7.2
(i) Treasury Bills 10000.0 20500.0 33000.0 - -
(ii) Development Bonds 30000.0 62000.0 48000.0 - -
(iii) National Savings Certificates 0.0 0.0 0.0 - -
(iv) Citizen Saving Certificates 2339.4 5000.0 285.6 - -
(v) Foreign Employment Bond 0.0 162.1 52.1 - -
Overdrafts++ -56259.8 -183661.2 -124281.1 - -
Others@ -60.5 -205.0 -808.8 - -
Principal Refund and Share Divestment 6071.1 12757.3 1740.4 110.1 -86.4
Foreign Loans 5273.8 28031.2 46771.2 431.5 66.9
AmountPercent Change
Table 12
Government Budgetary Operation+( On Cash Basis)
(Rs. in million)
(Based on the data of the third week of Asar)
+ Based on data reported by 8 offices of NRB, 69 branches of Rastriya Banijya Bank Limited, 49 branches of Nepal Bank Limited, 22 branches of Agriculture
Development Bank, 9 branches of Everest Bank Limited, 4 branches of Global IME Bank Limited and 1 branch each from NMB Bank Limited, Bank of
Kathmandu Lumbini Limited and Century Commercial Bank conducting government transactions and release report from 79 DTCOs and payment centres.
# Change in outstanding amount disbursed to VDC/DDC remaining unspent.
++ Minus (-) indicates treasury surplus.
@ Interest from Government Treasury transactions and others.
P : Provisional.

Monetary Policy for 2017/18 41
2015 2016 2017
Mid-Jul Mid-Jul Mid-June(Jul 2016-
Jul 2015)
(Jun 2017-
Jul 2016)
1 Treasury Bills 119858.1 116059.1 124714.3 -3799.0 8655.2
a. Nepal Rastra Bank 17968.9 16099.9 47687.4 -1869.0 31587.5
b. Commercial Banks 100729.2 97899.5 76673.8 -2829.6 -21225.7
c. Development Banks 907.0 444.4 213.1 -462.6 -231.3
d. Finance Companies 253.1 111.5 140.0 -141.6 28.5
e. Others 0.0 1503.8 0.0 1503.8 -1503.8
2 Development Bond 57070.0 108900.1 143900.1 51830.1 35000.1
a. Nepal Rastra Bank 28.7 0.0 8942.0 -28.7 8942.0
b. Commercial Banks 35633.9 79063.5 103878.3 43429.6 24814.8
c. Development Banks 2180.9 5116.7 6186.7 2935.8 1070.0
d. Finance Companies 2793.9 3733.5 3878.0 939.7 144.5
e. Others 16432.7 20986.3 21015.1 4553.7 28.8
3 National Saving Bond 16586.5 906.5 906.5 -15680.0 0.0
a. Nepal Rastra Bank 21.4 1.3 167.8 -20.1 166.5
b. Commercial Banks 0.0 0.0 0.0 0.0 0.0
c. Development Banks 0.0 0.0 0.0 0.0 0.0
d. Finance Companies 0.0 0.0 0.0 0.0 0.0
e. Others 16565.1 905.2 738.7 -15659.9 -166.5
4 Citizen Saving Bond 3056.2 7806.2 7965.2 4750.0 159.0
a. Nepal Rastra Bank (Secondary Market) 507.6 307.6 2172.9 -200.0 1865.3
b. Commercial Banks 0.0 0.0 0.0 0.0 0.0
c. Development Banks 0.0 0.0 0.0 0.0 0.0
d. Finance Companies 0.0 0.0 0.0 0.0 0.0
e. Others 2548.6 7498.6 5792.3 4950.1 -1706.3
5 Foreign Employment Bond 215.0 486.2 538.3 271.2 52.1
a. Nepal Rastra Bank 0.02 0.01 12.50 0.0 12.5
b. Others 215.0 486.2 525.8 271.2 39.6
6 Total Domestic Debt 196785.8 234158.0 278024.4 37372.2 43866.4
a. Nepal Rastra Bank 18526.6 16408.8 58982.6 -2117.8 42573.8
b. Commercial Banks 136363.1 176963.0 180552.1 40600.0 3589.1
c. Development Banks 3087.8 5561.1 6399.8 2473.3 838.7
d. Finance Companies 3047.0 3845.0 4018.0 798.1 173.0
e. Others 35761.3 31380.1 28071.9 -4381.3 -3308.2
7 Balance at NRB (Overdraft (+)/Surplus(-) -33813.1 -115018.5 -269073.0 -81205.4 -154054.5
Table 13
Outstanding Domestic Debt of the GoN
(Rs. in million)
No. Name of Bonds/Ownership
Amount Change
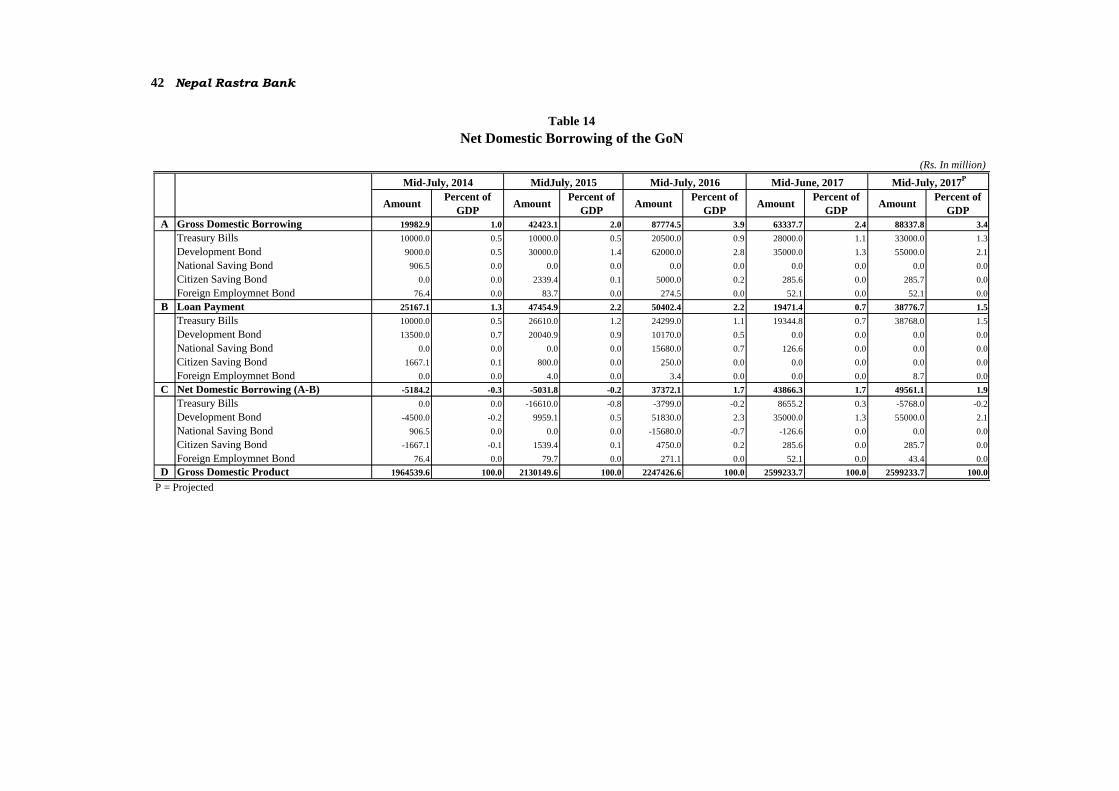
42 Nepal Rastra Bank
(Rs. In million)
AmountPercent of
GDPAmount
Percent of
GDPAmount
Percent of
GDPAmount
Percent of
GDPAmount
Percent of
GDP
A Gross Domestic Borrowing 19982.9 1.0 42423.1 2.0 87774.5 3.9 63337.7 2.4 88337.8 3.4
Treasury Bills 10000.0 0.5 10000.0 0.5 20500.0 0.9 28000.0 1.1 33000.0 1.3
Development Bond 9000.0 0.5 30000.0 1.4 62000.0 2.8 35000.0 1.3 55000.0 2.1
National Saving Bond 906.5 0.0 0.0 0.0 0.0 0.0 0.0 0.0 0.0 0.0
Citizen Saving Bond 0.0 0.0 2339.4 0.1 5000.0 0.2 285.6 0.0 285.7 0.0
Foreign Employmnet Bond 76.4 0.0 83.7 0.0 274.5 0.0 52.1 0.0 52.1 0.0
B Loan Payment 25167.1 1.3 47454.9 2.2 50402.4 2.2 19471.4 0.7 38776.7 1.5
Treasury Bills 10000.0 0.5 26610.0 1.2 24299.0 1.1 19344.8 0.7 38768.0 1.5
Development Bond 13500.0 0.7 20040.9 0.9 10170.0 0.5 0.0 0.0 0.0 0.0
National Saving Bond 0.0 0.0 0.0 0.0 15680.0 0.7 126.6 0.0 0.0 0.0
Citizen Saving Bond 1667.1 0.1 800.0 0.0 250.0 0.0 0.0 0.0 0.0 0.0
Foreign Employmnet Bond 0.0 0.0 4.0 0.0 3.4 0.0 0.0 0.0 8.7 0.0
C Net Domestic Borrowing (A-B) -5184.2 -0.3 -5031.8 -0.2 37372.1 1.7 43866.3 1.7 49561.1 1.9
Treasury Bills 0.0 0.0 -16610.0 -0.8 -3799.0 -0.2 8655.2 0.3 -5768.0 -0.2
Development Bond -4500.0 -0.2 9959.1 0.5 51830.0 2.3 35000.0 1.3 55000.0 2.1
National Saving Bond 906.5 0.0 0.0 0.0 -15680.0 -0.7 -126.6 0.0 0.0 0.0
Citizen Saving Bond -1667.1 -0.1 1539.4 0.1 4750.0 0.2 285.6 0.0 285.7 0.0
Foreign Employmnet Bond 76.4 0.0 79.7 0.0 271.1 0.0 52.1 0.0 43.4 0.0
D Gross Domestic Product 1964539.6 100.0 2130149.6 100.0 2247426.6 100.0 2599233.7 100.0 2599233.7 100.0
P = Projected
Table 14
Net Domestic Borrowing of the GoN
Mid-July, 2017P
Mid-July, 2014 MidJuly, 2015 Mid-July, 2016 Mid-June, 2017

Monetary Policy for 2017/18 43
(Rs. in million)
2014/15 2015/16R 2014/15 2015/16
R2016/17
P2015/16
R2016/17
P
TOTAL EXPORTS 85319.1 70117.1 77831.1 62154.9 68624.7 -20.1 10.4
To India 55864.6 39493.7 51108.0 34872.1 39044.5 -31.8 12.0
To China 2229.9 1681.5 2157.7 1501.6 1565.5 -30.4 4.3
To Other Countries 27224.6 28941.9 24565.4 25781.3 28014.8 4.9 8.7
TOTAL IMPORTS 774684.2 773599.1 690696.8 684753.1 896571.4 -0.9 30.9
From India 491655.9 477212.6 437728.6 420981.1 585020.5 -3.8 39.0
From China 100166.4 115694.3 92171.3 103645.7 113965.7 12.4 10.0
From Other Countries 182861.9 180692.2 160796.9 160126.4 197585.2 -0.4 23.4
TOTAL TRADE BALANCE -689365.1 -703482.0 -612865.7 -622598.2 -827946.6 1.6 33.0
With India -435791.3 -437718.9 -386620.6 -386109.0 -545976.0 -0.1 41.4
With China -97936.5 -114012.8 -90013.6 -102144.1 -112400.2 13.5 10.0
With Other Countries -155637.3 -151750.3 -136231.5 -134345.1 -169570.5 -1.4 26.2
TOTAL FOREIGN TRADE 860003.3 843716.3 768527.9 746908.1 965196.1 -2.8 29.2
With India 547520.5 516706.3 488836.6 455853.1 624065.0 -6.7 36.9
With China 102396.3 117375.8 94329.1 105147.3 115531.1 11.5 9.9
With Other Countries 210086.5 209634.1 185362.2 185907.6 225600.0 0.3 21.4
1. Ratio of export to import 11.0 9.1 11.3 9.1 7.7
India 11.4 8.3 11.7 8.3 6.7
China 2.2 1.5 2.3 1.4 1.4
Other Countries 14.9 16.0 15.3 16.1 14.2
2. Share in total export
India 65.5 56.3 65.7 56.1 56.9
China 2.6 2.4 2.8 2.4 2.3
Other Countries 31.9 41.3 31.6 41.5 40.8
3. Share in total import
India 63.5 61.7 63.4 61.5 65.3
China 12.9 15.0 13.3 15.1 12.7
Other Countries 23.6 23.4 23.3 23.4 22.0
4. Share in trade balance
India 63.2 62.2 63.1 62.0 65.9
China 14.2 16.2 14.7 16.4 13.6
Other Countries 22.6 21.6 22.2 21.6 20.5
5. Share in total trade
India 63.7 61.2 63.6 61.0 64.7
China 11.9 13.9 12.3 14.1 12.0
Other Countries 24.4 24.8 24.1 24.9 23.4
6. Share of export and import in total trade
Export 9.9 8.3 10.1 8.3 7.1
Import 90.1 91.7 89.9 91.7 92.9
* Based on customs data
P= Provisional
R= Revised
Table 15
Direction of Foreign Trade*
Annual Eleven Months Percent Change

44 Nepal Rastra Bank
Eleven Months Annual Eleven Months Annual Eleven Months 2015/16 2016/17 P
A. Current Account 95285.4 108319.8 130081.3 140418.5 -1722.3 36.5
Goods: Exports f.o.b. 89536.1 98276.3 66600.7 74866.1 77033.4 -25.6 15.7
Oil 0.0 0.0 0.0 0.0 0.0 - -
Other 89536.1 98276.3 66600.7 74866.1 77033.4 -25.6 15.7
Goods: Imports f.o.b. -678921.0 -761773.0 -670433.5 -756487.9 -886559.5 -1.3 32.2
Oil -101232.4 -112044.6 -58988.0 -68724.4 -112377.0 -41.7 90.5
Other -577688.6 -649728.4 -611445.5 -687763.5 -774182.5 5.8 26.6
Balance on Goods -589384.9 -663496.7 -603832.8 -681621.8 -809526.2 2.5 34.1
Services: Net 24317.4 27617.5 9454.9 9849.2 6008.3 -61.1 -36.5
Services: credit 134461.0 149288.4 125817.3 138472.4 146033.7 -6.4 16.1
Travel 50048.3 53428.6 38926.4 41765.3 55204.8 -22.2 41.8
Government n.i.e. 27947.7 32481.1 34310.4 38330.8 22818.5 22.8 -33.5
Other 56465.0 63378.7 52580.6 58376.3 68010.3 -6.9 29.3
Services: debit -110143.6 -121670.9 -116362.5 -128623.2 -140025.4 5.6 20.3
Transportation -40762.7 -43996.3 -39962.2 -44030.3 -41373.6 -2.0 3.5
Travel -48465.5 -53190.2 -50662.1 -56418.4 -72930.8 4.5 44.0
O/W Education -15681.8 -17065.4 -17642.1 -20139.1 -31197.6 12.5 76.8
Government services: debit -1949.5 -1974.8 -2069.3 -2100.3 -1074.1 6.1 -48.1
Other -18965.9 -22509.6 -23668.9 -26074.2 -24646.9 24.8 4.1
Balance on Goods and Services -565067.5 -635879.2 -594377.9 -671772.6 -803517.8 5.2 35.2
Income: Net 29021.3 34242.5 29159.9 34004.3 26156.9 0.5 -10.3
Income: credit 37075.5 42831.5 37306.0 43085.3 46496.9 0.6 24.6
Income: debit -8054.2 -8589.0 -8146.1 -9080.9 -20339.9 1.1 149.7
Balance on Goods, Services and Income -536046.2 -601636.7 -565218.0 -637768.3 -777360.9 5.4 37.5
Transfers: Net 631331.6 709956.5 695299.3 778186.8 775638.6 10.1 11.6
Current transfers: credit 633585.6 712522.2 698689.7 781989.6 779121.5 10.3 11.5
Grants 42165.3 52855.4 57811.2 70411.6 103387.6 37.1 78.8
Workers' remittances 551742.2 617278.8 598950.4 665064.3 633419.7 8.6 5.8
Pensions 39678.1 42388.0 41928.1 46513.6 42314.1 5.7 0.9
Other (Indian Excise Refund) 0.0 0.0 0.0 0.0 0.0 - -
Current transfers: debit -2254.0 -2565.7 -3390.5 -3802.8 -3482.8 50.4 2.7
B Capital Account (Capital Transfer) 11890.5 14811.4 12252.3 16987.3 12234.8 3.0 -0.1
Total, Groups A plus B 107175.9 123131.2 142333.6 157405.8 10512.5 32.8 -92.6
C Financial Account (Excluding Group E) 16194.8 18023.8 13297.7 29638.4 20593.5 -17.9 54.9
Direct investment in Nepal 3701.0 4382.6 4798.5 5920.9 12270.5 29.7 155.7
Portfolio Investment 0.0 0.0 0.0 0.0 0.0 - -
Other investment: assets -30997.6 -34584.5 -27611.0 -30936.3 -36982.5 -10.9 33.9
Trade credits -1932.9 -2234.3 -35.8 -338.9 -1458.9 -98.1 3971.6
Other -29064.7 -32350.2 -27575.2 -30597.4 -35523.6 -5.1 28.8
Other investment: liabilities 43491.4 48225.7 36110.3 54653.8 45305.5 -17.0 25.5
Trade credits 21815.8 22912.3 14180.4 16397.4 19844.8 -35.0 39.9
Loans 7766.8 12160.4 12994.1 27341.8 43198.2 67.3 232.4
General Government 7810.0 12222.5 11614.8 25978.9 31843.8 48.7 174.2
Drawings 24180.0 29264.3 27515.3 43774.0 47369.1 13.8 72.2
Repayments -16370.0 -17041.8 -15900.5 -17795.1 -15525.3 -2.9 -2.4
Other sectors -43.2 -62.1 1379.4 1362.9 11354.4 -3293.0 723.2
Currency and deposits 14915.8 14318.6 12450.2 14982.3 -17725.6 -16.5 -242.4
Nepal Rastra Bank 55.4 -20.2 -5.6 -5.6 217.0 -110.1 -3975.0
Deposit money banks 14860.4 14338.8 12455.8 14987.9 -17942.6 -16.2 -244.1
Other liabilities -1007.0 -1165.7 -3514.4 -4067.7 -11.9 249.0 -99.7
Total, Group A through C 123370.7 141155.0 155631.4 187044.3 31106.0 26.1 -80.0
D. Miscellaneous Items, Net 18748.5 18199.6 27972.6 16891.2 25432.7 49.2 -9.1
Total, Group A through D 142119.2 159354.6 183604.0 203935.5 56538.7 29.2 -69.2
E. Reserves and Related Items -142119.2 -159354.6 -183604.0 -203935.5 -56538.7 29.2 -69.2
Reserve assets -141115.2 -158192.0 -183603.9 -203935.5 -55421.3 30.1 -69.8
Nepal Rastra Bank -114934.8 -130353.0 -152331.2 -172887.0 -52698.3 32.5 -65.4
Deposit money banks -26180.4 -27839.0 -31272.8 -31048.5 -2722.9 19.5 -91.3
Use of Fund Credit and Loans -1004.0 -1162.6 0.0 0.0 -1117.4 - -
Changes in reserve net (- increase) -127203.4 -145036.0 -171153.8 -188953.2 -74264.3 34.6 -56.6
P= Povisional
Percentage Change
During Eleven months
Table 16
Summary of Balance of Payments(Rs. in million )
Particulars2014/15 2015/16 2016/17
P
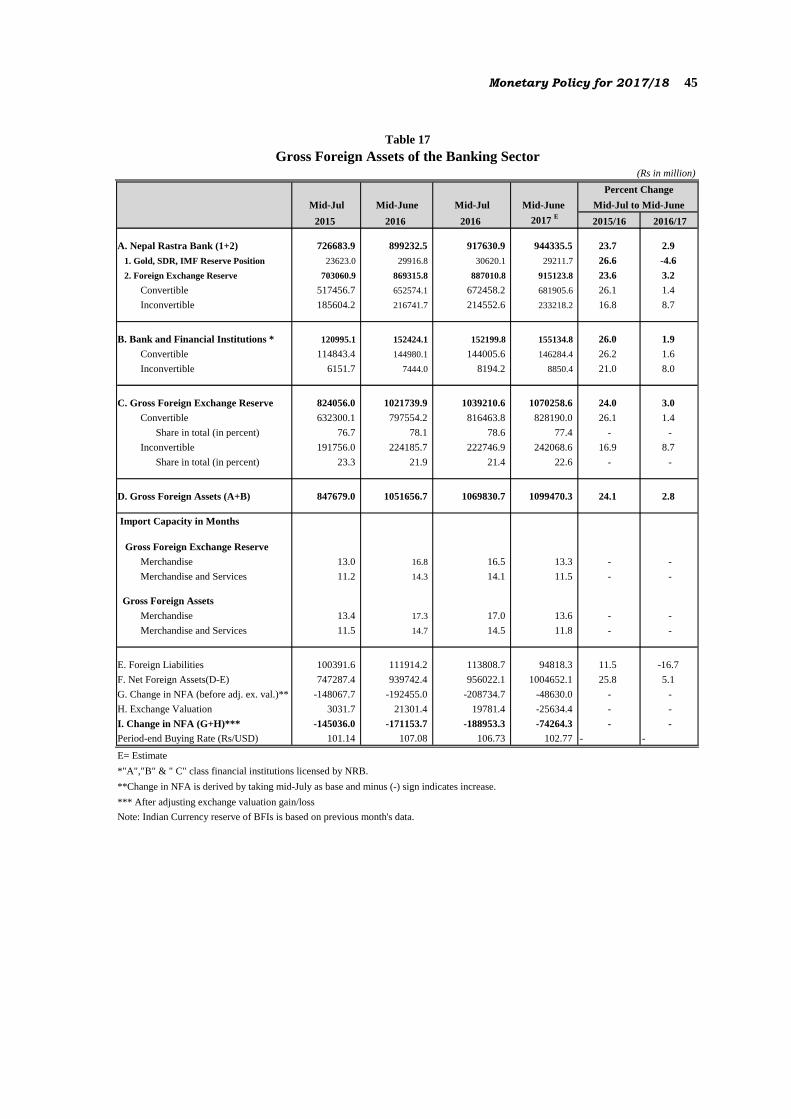
Monetary Policy for 2017/18 45
Percent Change
Mid-Jul Mid-June Mid-Jul Mid-June
2015 2016 2016 2017 E
2015/16 2016/17
A. Nepal Rastra Bank (1+2) 726683.9 899232.5 917630.9 944335.5 23.7 2.9
1. Gold, SDR, IMF Reserve Position 23623.0 29916.8 30620.1 29211.7 26.6 -4.6
2. Foreign Exchange Reserve 703060.9 869315.8 887010.8 915123.8 23.6 3.2
Convertible 517456.7 652574.1 672458.2 681905.6 26.1 1.4
Inconvertible 185604.2 216741.7 214552.6 233218.2 16.8 8.7
B. Bank and Financial Institutions * 120995.1 152424.1 152199.8 155134.8 26.0 1.9
Convertible 114843.4 144980.1 144005.6 146284.4 26.2 1.6
Inconvertible 6151.7 7444.0 8194.2 8850.4 21.0 8.0
C. Gross Foreign Exchange Reserve 824056.0 1021739.9 1039210.6 1070258.6 24.0 3.0
Convertible 632300.1 797554.2 816463.8 828190.0 26.1 1.4
Share in total (in percent) 76.7 78.1 78.6 77.4 - -
Inconvertible 191756.0 224185.7 222746.9 242068.6 16.9 8.7
Share in total (in percent) 23.3 21.9 21.4 22.6 - -
D. Gross Foreign Assets (A+B) 847679.0 1051656.7 1069830.7 1099470.3 24.1 2.8
Import Capacity in Months
Gross Foreign Exchange Reserve
Merchandise 13.0 16.8 16.5 13.3 - -
Merchandise and Services 11.2 14.3 14.1 11.5 - -
Gross Foreign Assets
Merchandise 13.4 17.3 17.0 13.6 - -
Merchandise and Services 11.5 14.7 14.5 11.8 - -
E. Foreign Liabilities 100391.6 111914.2 113808.7 94818.3 11.5 -16.7
F. Net Foreign Assets(D-E) 747287.4 939742.4 956022.1 1004652.1 25.8 5.1
G. Change in NFA (before adj. ex. val.)** -148067.7 -192455.0 -208734.7 -48630.0 - -
H. Exchange Valuation 3031.7 21301.4 19781.4 -25634.4 - -
I. Change in NFA (G+H)*** -145036.0 -171153.7 -188953.3 -74264.3 - -
Period-end Buying Rate (Rs/USD) 101.14 107.08 106.73 102.77 - -
E= Estimate
*"A","B" & " C" class financial institutions licensed by NRB.
**Change in NFA is derived by taking mid-July as base and minus (-) sign indicates increase.
*** After adjusting exchange valuation gain/loss
Note: Indian Currency reserve of BFIs is based on previous month's data.
Table 17
Gross Foreign Assets of the Banking Sector(Rs in million)
Mid-Jul to Mid-June

46 Nepal Rastra Bank
( Amount in million)
US$ Nrs. US$ Nrs. US$ Nrs. US$ Nrs. US$ Nrs. US$ Nrs. IC Purchase US$ Sale IC Purchase US$ Sale
August 332.5 34,039.0 - - 332.5 34,039.0 220.8 23,629.3 - - 220.8 23,629.3 20,502.5 320.0 17,437.0 260.0
September 376.9 39,886.6 - - 376.9 39,886.6 316.7 33,874.0 - - 316.7 33,874.0 14,577.7 220.0 25,398.7 380.0
October 416.5 43,534.9 - - 416.5 43,534.9 388.4 41,431.7 - - 388.4 41,431.7 3,920.4 60.0 17,327.6 260.0
November 350.5 36,816.6 - - 350.5 36,816.6 364.4 38,936.5 - - 364.4 38,936.5 10,495.0 160.0 26,715.9 400.0
December 399.8 42,556.2 - - 399.8 42,556.2 348.4 37,894.3 - - 348.4 37,894.3 19,977.3 300.0 17,714.0 260.0
January 349.9 37,301.5 - - 349.9 37,301.5 400.6 43,581.0 - - 400.6 43,581.0 18,644.7 280.0 28,516.7 420.0
February 318.0 34,486.9 - - 318.0 34,486.9 292.5 31,770.9 - - 292.5 31,770.9 24,380.4 380.0 25,765.9 380.0
March 346.3 37,711.9 - - 346.3 37,711.9 363.9 38,901.5 - - 363.9 38,901.5 17,732.1 260.0 24,082.5 360.0
April 406.6 43,327.5 - - 406.6 43,327.5 361.5 37,580.0 - - 361.5 37,580.0 33,357.2 500.0 32,585.2 500.0
May 416.6 42,584.4 - - 416.6 42,584.4 320.8 33,035.5 - - 320.8 33,035.5 21,290.1 320.0 10,315.2 160.0
June 295.3 31,654.4 - - 295.3 31,654.4 365.8 37,693.9 - - 365.8 37,693.9 21,470.6 320.0 21,895.6 340.0
July 440.4 47,450.2 - - 440.4 47,450.2 238.0* 24572.9* - - 238.0* 24572.9* 18,896.4 280.0 19370.0* 300.0*
Total 4,449.3 471,350.0 - - 4,449.3 471,350.0 3981.8* 422901.6* - - 3981.8* 422901.6* 225,244.3 3,400.0 267127.2* 4020.0*
*Upto Asar 22.
Table 18
Purchase/Sale of Foreign Currency
Mid-month
Purchase/Sale of Convertible Currency IC Purchase
2015/16 2016/172015/16 2016/17
Purchase Sale Net Purchase Sale Net