monetary policy and financial stability report · pdf filerameswurlall basant roi g.c.s.k. ......
TRANSCRIPT

BANK OF MAURITIUS
Address Sir William Newton Street Port Louis Mauritius
Website https://www.bom.mu ISSN 1694-2892
MONETARY POLICY AND FINANCIAL STABILITY REPORT
May 2016

MAY 2016
Monetary Policy and Financial Stability Report

This Report is available on the Bank of Mauritius’ website at https://www.bom.mu under the menu item Publications and Statistics. The Bank of Mauritius welcomes feedback from readers. Please forward comments and suggestions to [email protected].
Use of this Report or content thereof for educational and non-commercial purposes is permitted subject to acknowledgement. Monetary Policy and Financial Stability Report May 2016
© Bank of Mauritius 2016
ISSN 1694-2892

Foreword 1
1. Executive Summary 3
2. External Economic Developments 52.1 Growth 52.2 Inflation 62.3 Commodity Prices 62.4 Exchange Rate 72.5 Trade 72.6 Monetary Policy 72.7 Equity Markets 82.8 Financing Conditions 92.9 Banking Conditions 9
3. Domestic Economic Developments 113.1 GDP by Sector 113.2 GDP by Expenditure 113.3 Labour Market and Unit Labour Costs 123.4 Public Sector Debt 143.5 Monetary Aggregates 153.6 Credit Developments 193.7 Interest Rates 193.8 Excess Liquidity and Yield Curves 203.9 Exchange Rate Developments 213.10 Balance of Payments 23
4. Inflation: Developments and Outlook 254.1 Recent Trends 254.2 Import and Producer Price Indices 274.3 Inflation Projection and Output Gap - The Baseline Scenario 284.4 Inflation Projection 294.5 Real GDP Growth Projection 294.6 Balance of Risks 30
Table of Contents

Statement on Price Stability 32
5. Debt Indicators of Households and Corporates 335.1 Households 33
5.2 Corporates 34
6. Developments in the Financial Sector 396.1 Banking Sector 39
6.2 Non-Bank Deposit-Taking Sector 47
6.3 Insurance Sector 49
6.4 Pension Sector 50
7. Payment Systems Infrastructure 61
8. Risk Analysis of the Domestic Banking System 63
Box I: Domestic Systemically Important Banks (D-SIBs) 44
Box II: Exclusive Interview by the Governor 53
Box III: Double Tax Avoidance Agreement Between Mauritius and India 65
Statement on Financial Stability 67
List of Tables 69
List of Charts 70
Acronyms 72
Glossary 73
Table of Contents

1Monetary Policy and Financial Stability Report |
Foreword
I have the pleasure to present this first edition of the Monetary Policy and Financial Stability Report of the Bank of Mauritius.
This Report supersedes the former Inflation Report and Financial Stability Report. It will be published once a year in April. As required by section 33(2)(b) of the Bank of Mauritius Act 2004, the Bank of Mauritius has to publish twice a year a “Statement on Price Stability” and a “Statement on the Stability and Soundness of the Financial System”. From now onwards, these two statements will be published in April in the Monetary Policy and Financial Stability Report and in October in the Annual Report of the Bank of Mauritius.
The Bank of Mauritius is mandated to maintain price stability and promote orderly and balanced economic development as well as to ensure the stability and soundness of the financial system of Mauritius, as set out in sections 4(1) and 4(2)(b) of the Bank of Mauritius Act 2004. The formulation and determination of monetary policy is entrusted to the Monetary Policy Committee, as laid down under sections 54 and 55 of the Bank of Mauritius Act 2004.
With the aforementioned mandates in focus, the Bank of Mauritius continuously endeavours to achieve and maintain price stability. Financial stability occupies as important a place as price stability in the overall policy stance of the Bank of Mauritius. The regulatory regime for the banking system is aligned with international best practices. Further initiatives are under way to foster a sound and stable financial system, the more so that a resilient financial system supports sustained economic growth.
This Report presents an evaluation of monetary and financial stability, recent and expected inflation trends as well as inherent and potential risks to price and financial stability. It aims to enhance the public’s understanding of the policies applied to achieve the mandates of the Bank of Mauritius.
The analysis provides insights into the resilience of the domestic financial system and the financial market infrastructure to recent developments on the domestic and international fronts. Unless otherwise stated, this edition relies on information and financial data available up to the end of March 2016.
Rameswurlall Basant Roi G.C.S.K.Governor
30 May 2016


3Monetary Policy and Financial Stability Report |
Global growth turned out to be lower than expected in 2015 and still remains fragile. Despite the boost from lower oil and other commodity prices, the majority of advanced and emerging market economies posted uneven growth performance in 2015. The growth momentum has slowed in both US and UK, while economic activity remained moderate in the Eurozone and Japan. The rebalancing of economic activity in China and its potential risk of contagion as well as the expectation of a slowdown across BRICS countries would represent a major threat to global economic recovery. Amidst diverging monetary policy stances and increased volatility in major financial markets, risks to global growth remain tilted on the downside. In its April 2016 World Economic Outlook, the IMF revised global growth down to 3.1 per cent for 2015 and projected growth at 3.2 per cent in 2016.
Against a background of low inflationary pressures and lacklustre investment, the domestic economy recorded lower-than-expected growth in 2015. Statistics Mauritius has revised downward its estimate for real GDP growth at 3.1 per cent for 2015, which mainly reflected a deceleration in the manufacturing sector in addition to the enduring contraction of the construction sector. However, in line with the evolving structure of the economy over time, growth remained supported by the services sector. GDP growth is forecast at 3.9 per cent for 2016. Downside risks to the growth outlook are associated mainly with delays in implementing the announced public infrastructure projects and eliminating bottlenecks in lagging private sector projects as well as ongoing corporate deleveraging that may hinder private investment ventures.
Domestic inflation declined to low levels in 2015, reflecting low global inflation and subdued domestic demand conditions. Headline inflation eased to 0.9 per cent in March 2016, its lowest reading since June 1988. Year-on-year inflation indicated a contrasting path as a result of the gyrations in prices of vegetables and base effects, and even posted a negative figure of 0.5 per cent in February 2016. Based on the results of the Bank of Mauritius’ February 2016 Inflation Expectations Survey, the outlook for domestic inflation for the forthcoming different time horizons is assessed to remain skewed to the downside, indicating contained expectations. The exchange rate of the rupee broadly reflected the fundamentals of the economy. The external current account deficit is estimated at 4.7 per cent of GDP in 2015. The import cover currently sits at about 8.0 months of imports of goods and services.
The Bank’s monetary policy stance has remained accommodative in an environment characterised by subdued domestic real output growth and tame inflationary pressures. The economy has been operating below its potential, with growth prospects hindered by the presence of structural bottlenecks as well as diverging productivity and wage trends. Subdued domestic demand conditions have complemented falling global commodity prices and have underpinned low inflationary pressures in the domestic economy. In addition, inflation expectations appeared to be well contained. In view of these macroeconomic developments, the MPC kept the Key Repo Rate unchanged in February 2016, arguing that the monetary policy stance was broadly appropriate and that the cut in November 2015 which was effected to support domestic economic activity had yet to work through the economy.
Household indebtedness as a share of disposable income has hardly changed in 2015. Although the household debt-to-disposable income ratio has remained broadly unchanged, in part, due to the implementation of macroprudential policy measures, non-performing loans of households is continuously monitored.
Amid the ongoing restructuring and deleveraging process undertaken by several major corporates, the ratio of corporate indebtedness to GDP has dropped marginally during 2015. The leverage ratios in main economic sectors namely construction, tourism, and trade had, until very recently, been above 100 per cent but restructuring of the debt portfolios has provided relief on repayment schedules. Nonetheless, several major corporates remain tied to the domestic and international outlook which might directly affect their cash flows.
1. Executive Summary

4 | Bank of Mauritius
The banking sector remained profitable and the majority of banks maintained strong capital positions over the year ended December 2015. Growth in total banking assets mainly reflected further consolidation of the foreign assets portfolio held by both domestic-owned banks and subsidiaries of foreign-owned banks. Most banks maintained capital over and above the minimum statutory requirement of 10 per cent, with the overall capital adequacy ratio remaining at a comfortable level of 17.9 per cent as at end-December 2015. Common Equity Tier 1 capital ratio of banks stood at 15.5 per cent which underscores the strengthening of capital buffers in line with implementation of Basel III framework. The risk of loss from adverse movements in exchange rates was relatively low as banks’ individual balance sheets exhibit fairly low currency mismatches and net exposure to foreign exchange risk. Concurrently, the performance of non-bank deposit-taking institutions indicates that the sector remained sound during 2015, with growth in assets and strengthening of capital adequacy ratios.
The ratio of non-performing loans to total loans extended by banks maintained an uptrend in 2015. As at end-December 2015, the aggregate non-performing loan ratio stood at 7.9 per cent, which reflected a deterioration of asset quality mainly in credit extended outside Mauritius. Banks have thus been required to build adequate buffers against potential credit losses primarily by improving their coverage ratio of non-performing loans. The banking sector also remains exposed to credit concentration risk, including risk of failure of large borrowers and group of closely-related borrowers.
During 2015H2, the centralised payment systems operated by the Bank remained resilient and handled a large volume of transactions without failure. The Mauritius Automated Clearing and Settlement System and the Port Louis Automated Clearing House operated smoothly without any significant downtime, confirming their robust capacity to process high volumes of transactions based on Real Time Gross Settlement principles. In a bid to render the payment systems digital economy friendly, the Bank is proposing the setting-up of a National Payment Switch.
The financial system is assessed to be sound and stable. The banking sector remained resilient during 2015 despite negative spillover effects that have emanated from the collapse of a large financial conglomerate, the BAI group. As at end-December 2015, the sector was supported by strong capital positions, despite a weakening of some financial soundness indicators, including rising non-performing loans ratios. Indebtedness of households has remained broadly constant in 2015 in terms of ratio to disposable income. Similarly, corporate indebtedness remained range-bound as a ratio to GDP. Although the financial system is assessed to be sound and stable in the face of potential vulnerabilities emanating from concentration portfolios, asset exposures and developments in the global business sector, continued vigilance is being exercised by the Bank.
Following the signature of a protocol for amending the Double Tax Avoidance Agreement (DTAA) between India and Mauritius on 10 May 2016, the Governor of the Bank reviewed the situation with the Chief Executive Officers of systemically important banks and noted that the revision would have mitigated impact on the domestic banking industry in the foreseeable future. An assessment of the banking sector’s resilience to liquidity shocks arising from significant outflows of Global Business Companies’ (GBC) deposits in case of an unfavourable DTAA re-negotiation was carried out by the IMF/World Bank’s Financial Sector Assessment Programme in November 2015. The result revealed that the banking sector could withstand significant withdrawals.
Going forward, in a bid to increase the financial system’s resilience against potential shocks, the Bank has embarked on a number of key initiatives such as the setting-up of a Deposit Insurance Scheme to protect depositors and of an Asset Management Company to primarily address the adverse impact of non-performing loans on the stability of the financial system. In addition, discussions are under way by the Bank for the design of a formal framework for crisis management/resolution. The Bank is currently in the process of strengthening the regulatory framework through the review and rationalisation of Guidelines issued to take into account latest banking developments on the international front.
1. Executive Summary

5Monetary Policy and Financial Stability Report |
2.1 GrowthGlobal growth turned out to be lower than anticipated in 2015, and the growth momentum remains fragile. Major advanced and emerging market economies posted relatively weak and uneven growth despite lower oil and other commodity prices. Downside risks to the global outlook are mainly attributed to the threat of a protracted slowdown in emerging market economies, including rebalancing of economic activity in China, tighter financial conditions with rising market volatility, declining capital flows in emerging market economies, Britain’s potential exit from the European Union and geopolitical strife. In its April 2016 World Economic Outlook (WEO), the International Monetary Fund (IMF) revised global growth for 2016 down to 3.2 per cent.
Growth performance remains asymmetrical across the world, as major advanced and emerging market economies’ growth trajectories point to diverse trends. Advanced economies are expected to register a growth of 1.9 per cent in 2016, reflecting support from lower oil prices and accommodative monetary policies. US growth is forecast at 2.4 per cent in 2016, supported by strengthening balance sheets and improving housing and labour markets. The euro area is projected to expand by 1.5 per cent in 2016, helped by stronger private consumption due to lower oil prices and easy financial conditions that would outweigh the weakening net exports. In the UK, consumption would remain the main driver of growth as businesses show increased signs of risk aversion. Growth in the UK, which could soften due to uncertainties associated with the outcome of the referendum on exit from European Union in June 2016, is projected at 1.9 per cent for 2016. Economic growth in Japan is expected to remain flat at 0.5 per cent in 2016 as a stronger yen and lower demand from emerging markets are expected to restrain activity during 2016H1.
The widespread slowdown across BRICS countries, with the exception of India, is a major source of concern for the global economy due to its substantial risk of contagion. Emerging market and developing economies are projected to grow at 4.1 per cent in 2016, from 4.0 per cent in 2015, the lowest growth rate since the 2008 global financial crisis. The rebalancing of the Chinese economy, weakness in oil-exporting countries and strains in Brazil, Russia and South Africa are expected to weigh on growth prospects in 2016. The growth rate for China is forecast to slow down to 6.5 per cent in 2016, reflecting weaker investment growth as excess capacity continues to unwind, especially in real estate and manufacturing sectors. India is posited to grow at a robust pace of 7.5 per cent on the back of economic reforms. Brazil and Russia may not be able to come out of recession in 2016, while South Africa may record growth of only 0.6 per cent, weighed down by low commodity prices, increased policy uncertainty and tighter monetary and fiscal policies.
Global activity indicators confirmed the moderation of world growth in 2016Q1. The Global Composite PMI1 stood at 51.5 in March 2016, representing only a slight improvement on February’s 40-month low figure of 50.8 (Chart 2.1). Growth picked up in both manufacturing and services sectors in March, but the improvement was marginal compared to the previous month and highlighted sustained broad-based weakness on a sectoral basis. The PMI is broadly consistent with global GDP at market prices rising at an annual rate of just over 1.0 per cent in 2016Q1.
2. External Economic Developments
Global economic growth continues to remain fragile and uneven across countries. Inflation risks remain on the downside amid falling commodity prices. In the US, the Federal Reserve increased interest rates for the first time on 16 December 2015 but despite emerging sources of vulnerabilities, it remains on course for a potential rate hike this year. Concerns about the slowdown in China and its potential spillover to other emerging markets have resulted in heightened volatility and in massive sell-off in markets. Though markets have recovered, risks to growth remain tilted to the downside.
1 Markit.

6 | Bank of Mauritius
2.2 Inflation Global inflation would remain low in several parts of the world in 2016. In advanced economies, headline inflation, which currently hovers at an average of 0.5 per cent, is projected to remain below 2.0 per cent until 2017, reflecting tumbling prices of traded goods due to subdued global demand. In emerging market economies, inflation developments have been mixed and reflected the combined impact of lower oil prices and sharp currency depreciations.
2.3 Commodity PricesExcess supply as well as reduced demand from major emerging economies have driven down commodity prices. The FAO’s food price index fell consistently to its lowest point in January 2016 at 149.3, before rising marginally to 151.0 in March mainly due to an increase in sugar prices. The plunge in prices since the start of 2015 was driven by a decline in almost all commodity indices, including meat, dairy products, cereals and vegetable oils (Chart 2.2).
Oil prices continued to record downward pressure in 2015Q4 mainly due to abundant supply especially from OPEC countries and Russia, expectations of Iranian oil coming on the market after the lifting of sanctions against the country, and concerns about global demand (Chart 2.3). However, after bottoming out at an average of US$31.9 per barrel in January 2016, the price of ICE Brent picked up to US$39.8 per barrel in March amid tightening supply, proposed new producer talks on co-ordinated output cuts and US dollar weakness. While prices of oil futures point to a moderate increase in the near-term, uncertainty about expected oil price developments remains high. The US Energy Information Administration (EIA)2 forecasts Brent crude oil price to average US$35 per barrel and US$41 per barrel in 2016 and 2017, respectively.
The price of gold, on average, recovered from a low of US$1,050.8 an ounce in December 2015 to US$1,244.1 an ounce in March 2016. Gold prices has been boosted recently amid expectations that the US Fed would be more cautious on raising interest rates this year.
44 44
46 46
48 48
50 50
52 52
54 54
56 56
58 58
60 60
62 62
Index Index
US US Euro area Euro area UK UK India India China China Global Composite Global Composite
Jan-
13
Jan-
13
Mar
-13
Mar
-13
May
-13
May
-13
Jul-1
3 Ju
l-13
Sep-
13
Sep-
13
Nov
-13
Nov
-13
Jan-
14
Jan-
14
Mar
-14
Mar
-14
May
-14
May
-14
Jul-1
4 Ju
l-14
Sep-
14
Sep-
14
Nov
-14
Nov
-14
Jan-
15
Jan-
15
Mar
-15
Mar
-15
May
-15
May
-15
Jul-1
5 Ju
l-15
Sep-
15
Sep-
15
Nov
-15
Nov
-15
Jan-
16
Jan-
16
Mar
-16
Mar
-16
Purchasing Managers’ IndexChart2.1
Source: Thomson Reuters.
120 120
140 140
160 160
180 180
200 200
220 220
240 240
260 260
280 280
Jan-
13
Jan-
13
Mar
-13
Mar
-13
May
-13
May
-13
Jul-1
3 Ju
l-13
Sep-
13
Sep-
13
Nov
-13
Nov
-13
Jan-
14
Jan-
14
Mar
-14
Mar
-14
May
-14
May
-14
Jul-1
4 Ju
l-14
Sep-
14
Sep-
14
Nov
-14
Nov
-14
Jan-
15
Jan-
15
Mar
-15
Mar
-15
May
-15
May
-15
Jul-1
5 Ju
l-15
Sep-
15
Sep-
15
Nov
-15
Nov
-15
Jan-
16
Jan-
16
Mar
-16
Mar
-16
Food Price Index Food Price Index Meat Price Index Meat Price Index Dairy Price Index Dairy Price Index Cereals Price Index Cereals Price Index Oils Price Index Oils Price Index Sugar Price Index Sugar Price Index
Index (2002-04=100) Index (2002-04=100)
FAO Food Price IndicesChart2.2
Source: FAO.
20 20
30 30
40 40
50 50
60 60
70 70
80 80
90 90
100 100
110 110
120 120
Jan-
13
Jan-
13
Mar
-13
Mar
-13
May
-13
May
-13
Jul-1
3 Ju
l-13
Sep-
13
Sep-
13
Nov
-13
Nov
-13
Jan-
14
Jan-
14
Mar
-14
Mar
-14
May
-14
May
-14
Jul-1
4 Ju
l-14
Sep-
14
Sep-
14
Nov
-14
Nov
-14
Jan-
15
Jan-
15
Mar
-15
Mar
-15
May
-15
May
-15
Jul-1
5 Ju
l-15
Sep-
15
Sep-
15
Nov
-15
Nov
-15
Jan-
16
Jan-
16
Mar
-16
Mar
-16
US$ per barrel US$ per barrel
ICE Brent ICE Brent NYMEX WTI NYMEX WTI
Crude Oil PricesChart2.3
Source: Thomson Reuters.
2. External Economic Developments
2 US Energy Information Administration - Short-Term Energy and Summer Fuels Outlook Report, April 2016.

7Monetary Policy and Financial Stability Report |
2.4 Exchange RateCurrency markets remained under the grip of divergent monetary policy stances and risk aversion among the major central banks. The US dollar drew support from increasing expectations of the US first lift-off of interest rates and encouraging data releases. The greenback reached a high of 1.0595 against the euro on 3 December 2015 but subsequently lost ground on growing expectations that the US Fed would reconsider the timing of future interest rate hikes.
The euro initially depreciated against major currencies on the back of weak economic conditions and the implementation of ultra-loose monetary policy in the euro area. However, it recouped its losses as expectation of an increase in US interest rates in the first half of the year declined amid dimming growth prospects. The Pound sterling fell from a high of US$1.5427 in November 2015 to a low of US$1.3951 in March 2016, as the Bank of England (BoE) indicated that UK interest rates were likely to remain on hold at record lows for a longer period. Moreover, the possibility of UK exit from the European Union weighed on the Pound sterling (Chart 2.4).
2.5 TradeAfter losing momentum in 2015, world trade picked up somewhat in the first two months of 2016. Heightened volatility of trade - particularly for emerging market economies - showcased the real contagion effects of the Chinese stock market plunge. Nevertheless, the IMF forecast trade volumes to grow by 3.1 per cent in 2016, from an estimated growth of 2.8 per cent in 2015 (Chart 2.5).
2.6 Monetary Policy Global monetary policies witnessed diverging stances. The US Fed raised its federal funds rate for the first time in over nine years at its December 2015 meeting. Despite emerging sources of uncertainty in early 2016, it remains on course for a potential rate hike this year. The European Central Bank (ECB) and Bank of Japan (BoJ) adopted ultra-loose monetary policy to address real sector issues and fight deflationary spikes. With the deterioration of growth prospects at the start of 2016, the ECB adopted new policy measures that included
2. External Economic Developments
88 88
90 90
92 92
94 94
96 96
98 98
100 100
102 102
104 104
106 106
108 108
GBP GBP EUR EUR YEN YEN
Index (3 Jan 2013=100) Index (3 Jan 2013=100)
Jan-
13
Jan-
13
Mar
-13
Mar
-13
May
-13
May
-13
Jul-1
3 Ju
l-13
Sep-
13
Sep-
13
Nov
-13
Nov
-13
Jan-
14
Jan-
14
Mar
-14
Mar
-14
May
-14
May
-14
Jul-1
4 Ju
l-14
Sep-
14
Sep-
14
Nov
-14
Nov
-14
Jan-
15
Jan-
15
Mar
-15
Mar
-15
May
-15
May
-15
Jul-1
5 Ju
l-15
Sep-
15
Sep-
15
Nov
-15
Nov
-15
Jan-
16
Jan-
16
Mar
-16
Mar
-16
Evolution of Major Currenciesagainst the US Dollar
Chart2.4
World TradeWorld Trade
Trade Growth Chart2.5
-2
-1
0
1
2
3
4
5
6
Feb-
13
Apr-
13
Jun-
13
Aug-
13
Oct
-13
Dec
-13
Feb-
14
Apr-
14
Jun-
14
Aug-
14
Oct
-14
Dec
-14
Feb-
15
Apr-
15
Jun-
15
Aug-
15
Oct
-15
Dec
-15
Feb-
16
Per cent
World trade World imports World exports
ExportsExports
Trade Growth Chart2.5
-4
-2
0
2
4
6
8
10
12
Feb-
13
Apr-
13
Jun-
13
Aug-
13
Oct
-13
Dec
-13
Feb-
14
Apr-
14
Jun-
14
Aug-
14
Oct
-14
Dec
-14
Feb-
15
Apr-
15
Jun-
15
Aug-
15
Oct
-15
Dec
-15
Feb-
16
Per cent
World exports Advanced economies Emerging economies
Sources: Thomson Reuters and Netherlands Bureau of Economic Research.
Source: Thomson Reuters.

8 | Bank of Mauritius
cuts in interest rates and expansion of its asset-purchase programme to EUR80 billion starting April 2016. The main refinancing operations rate is currently at zero per cent while the interest rate on deposit facility is -0.4 per cent. The BoJ surprised markets by adopting negative interest rates in January 2016. In the UK, the BoE left its key policy rate unchanged at 0.5 per cent and also maintained its bond-buying programme at GBP375 billion.
Monetary policy in emerging market economies diverged on differing economic conditions. While India and China have cut interest rates to provide a fillip to growth amid a worsening economic outlook, Mexico and Chile increased interest rates to support their weakening domestic currencies and tame above target inflation. In South Africa, the deteriorating inflation outlook has resulted in several rate hikes in 2015 and early 2016. In the same vein, Brazil has maintained high interest rates after successive hikes in the first half of 2015 to fight inflation. Elsewhere, Russia, New Zealand and Indonesia have cut interest rates amid sagging growth and weak inflation.
2.7 Equity MarketsAt the start of 2016, stock markets experienced their worst sell-off since the 2008 global financial crisis against fragile global growth prospects. The first phase of the turbulence was centered on the economic slowdown in China and spill-overs to other emerging market economies. Trading in China was halted twice during the first week of 2016. Also, as concerns over the global growth outlook increased, commodity prices fell on the prospect of lower demand in addition to the supply glut, with energy stocks being the most affected. The MSCI World Index lost 7.3 per cent year-on-year in March 2016 and the MSCI Emerging Markets Index was down by 16.6 per cent (Chart 2.6).
Albeit some upticks in early February 2016, volatility indices were lower compared to their levels a year earlier. Volatility in emerging markets as well as in the US and euro area increased in early 2016 to levels last seen in August 2015 (Chart 2.7). It was only around mid-February 2016 that volatility indices started falling and by end-March 2016, they were nevertheless comparable to the December 2015 levels.
2. External Economic Developments
68 68
72 72
76 76
80 80
84 84
88 88
92 92
96 96
100 100
104 104
108 108
112 112
116 116
120 120
MSCI World MSCI World MSCI Emerging Markets MSCI Emerging Markets MSCI Frontier MSCI Frontier
Index (5 Jan 2015 = 100) Index (5 Jan 2015 = 100)
Jan-
15
Jan-
15
Feb-
15
Feb-
15
Mar
-15
Mar
-15
Apr-
15
Apr-
15
May
-15
May
-15
Jun-
15
Jun-
15
Jul-1
5 Ju
l-15
Aug-
15
Aug-
15
Sep-
15
Sep-
15
Oct
-15
Oct
-15
Nov
-15
Nov
-15
Dec
-15
Dec
-15
Jan-
16
Jan-
16
Feb-
16
Feb-
16
Mar
-16
Mar
-16
MSCI World, Emerging Marketsand Frontier Indices
Chart2.6
Source: Thomson Reuters.
Volatility IndicesChart2.7
10
15
20
25
30
35
40
45
50
55
60
Jan-
15
Feb-
15
Mar
-15
Apr-
15
May
-15
Jun-
15
Jul-1
5
Aug-
15
Sep-
15
Oct
-15
Nov
-15
Dec
-15
Jan-
16
Feb-
16
Mar
-16
Index
US Euro area Emerging markets
Source: Thomson Reuters.
ImportsImports
Trade Growth (cont’d)Chart2.5
-8
-6
-4
-2
0
2
4
6
8
10
12
Feb-
13
Apr-
13
Jun-
13
Aug-
13
Oct
-13
Dec
-13
Feb-
14
Apr-
14
Jun-
14
Aug-
14
Oct
-14
Dec
-14
Feb-
15
Apr-
15
Jun-
15
Aug-
15
Oct
-15
Dec
-15
Feb-
16
Per cent
World imports Advanced economies Emerging economies
Sources: Thomson Reuters and Netherlands Bureau of Economic Research.

9Monetary Policy and Financial Stability Report |
2.8 Financing ConditionsDuring most of 2015, financing conditions were benign but became less accommodative following adverse developments in early 2016. In the US, banks have tightened lending standards across a range of loan types amid rising corporate credit risks and deterioration in energy-related exposures. Banks in the euro area, however, maintained a net easing of credit conditions on loans to enterprises while in Japan, there was a lesser degree of easing in lending standards. In the UK, the BoE Credit Conditions Survey pointed to a loosening of credit conditions and a rise in unsecured lending provided by banks. The market turmoil at the beginning of the year nevertheless caused liquidity risk premia to rise amid increased uncertainty. Though markets have recovered as from mid-February 2016, disruptions to global capital markets may have pernicious feedback loops on financial conditions with potential repercussions on investment and growth.
Financial markets volatility emanating from emerging markets may affect financing conditions going forward. A further slowdown of the Chinese economy has the potential to affect financing conditions via the trade and confidence channels. Developments in the Asian powerhouse have dented investors’ confidence, and as a result, there is a rising risk of an abrupt reversal of global risk premia. Additional headwinds relate mainly to the re-intensification of sovereign stress in the euro area, the issue of Brexit, the rise in geopolitical tensions, an adverse global interest rate shock and increased global risk aversion. Monetary policy across the globe would continue to preserve price stability. However, possible country and institution-specific challenges would suggest a strong role for macroprudential policy in bolstering systemic resilience and curbing financial cycles in order to maintain the favourable financing conditions in both advanced and emerging market economies.
2.9 Banking ConditionsWhile facing challenges to adapt to the new regulatory and market environment, banks’ resilience to credit and liquidity shocks improved in advanced economies. With new
regulatory requirements, banks have increased the amount and quality of capital, held better liquidity positions and have reduced funding mismatches. However, these improvements are hampered by a number of challenges. Interest revenue earned by banks in the global environment has fallen significantly over the past years, and the downward trend in interest rates has accelerated in the wake of the unprecedented level of support extended by central banks for the real economy, mainly in terms of exceptionally accommodative monetary measures. In addition, negative interest rates in the euro area and Japan have added to downward pressure on banks’ profitability. Compression of interest rates would have a more significant bearing on banks that have less flexibility in their banking model.
Global initiatives such as implementation of the Basel III framework continue to reinforce the resilience of banks and banking regulatory environment. Gradual improvements are underway to strengthen capital buffers, leverage ratios and liquidity requirements, along with the legal framework for resolving non-performing loans. These measures are also expected to improve loss recognition by banks and foreclosure of collateral underlying impaired loan portfolios.
Several international banks continue to clean up their balance sheets which would remove constraints on the supply of new credit. It remains crucial that efforts deployed to resolve the stocks of non-performing loans do not impinge on the strengthening of capital standards aimed at minimising moral hazard. Alongside, country-specific measures are being taken to address structural systemic risks such as those originating from significant size, high concentration and interconnectedness in the banking sector. In this respect, buffers for systemically important institutions and the systemic risk buffers are being applied and adopted across several countries.
2. External Economic Developments


11Monetary Policy and Financial Stability Report |
3.1 GDP by SectorDomestic economic activity expanded at a slower-than-expected pace in 2015. In its March 2016 issue of national accounts, Statistics Mauritius revised further down its estimate of real GDP growth at 3.1 per cent for 2015 to reflect the weaker-than-expected performance of specific sectors like ‘Manufacturing’, ‘Construction’ and ‘Public administration’ during 2015Q4 (Table 3.1). In line with the evolving structure of the economy, growth continued to be supported by the services sector, notably, ‘Accommodation and food service activities’ (9.3 per cent), ‘Information and communication’ (6.9 per cent), ‘Professional, scientific and technical activities’ (5.6 per cent), and ‘Financial and insurance activities’ (5.2 per cent). The contribution of the ‘Accommodation and food service activities’ sector to growth doubled in 2015 in the wake of a more open air access policy and targeted promotion campaigns. Tourist arrivals for 2015 stood at 1,151,723 and tourism earnings are estimated at about Rs50.2 billion.
During 2015Q4, the domestic economy decelerated sharply to 2.6 per cent, its lowest growth since 2014Q2, primarily due to the sharp contraction in the manufacturing sector. ‘Manufacturing’ shrank by 2.6 per cent, its first contraction since 2014Q2, as the contraction in sugar, textile and other manufacturing more than offset the moderate growth of 3.3 per cent in food. Real output in the ‘Construction’ sector fell by 1.7 per cent – the lowest contraction rate in fourteen successive quarters. By contrast, growth was supported by buoyant activity in the services sector, especially in ‘Accommodation and food service activities’, which grew by 10.8 per cent in 2015Q4, while growth in ‘Financial and insurance
activities’, ‘Information and communication’ and ‘Professional, scientific and technical activities’ exceeded 5.5 per cent (Table 3.2).
3.2 GDP by ExpenditureHousehold consumption contributed positively to overall growth in 2015Q4, while net exports and investment spending remained a drag on economic activity. Household consumption expenditure growth was estimated at 2.9 per cent y-o-y in 2015Q4, lower compared to 3.2 per cent in 2015Q3 and unchanged from 2014Q4. Gross domestic fixed capital formation decreased by 13.8 per cent, mainly attributed to the 30.3 per cent contraction in ‘Machinery and equipment’. Concerning external demand, export growth contracted for the third consecutive quarter, driven by a significant decline in exports of goods. Imports declined by 0.7 per cent compared to the same period last year, reflecting a negative growth of 5.7 per cent in imports of services (Table 3.3).
On an annual basis, household consumption growth increased in 2015 while investment and exports remained lacklustre. Final consumption growth is estimated at 2.7 per cent for 2015, lower than the growth of 2.9 per cent in 2014. While household consumption growth picked up to 2.9 per cent, general government consumption grew by 1.3 per cent, down from 4.4 per cent in the previous year. By contrast, investment maintained its downward trend and is estimated to have contracted by 5.2 per cent in 2015, weighed down by a persistent decline in private sector investment amid the uncertain global economic environment and high corporate indebtedness. On the external front, exports of goods and services contracted by 0.5
3. Domestic Economic Developments
The domestic economy slowed further towards the end of 2015. The slower rate of growth was mainly due to a poor performance of the manufacturing sector. On the expenditure side, final consumption growth slowed in the last quarter of 2015 while investment activity declined further with a sharp contraction in private investment. Overall, growth for 2015 came in at a lower-than-expected rate of 3.1 per cent. The labour market remained characterised by higher unemployment among the youth and women and no major improvement is expected given moderate growth prospects and the prevailing skills mismatch. Recent monetary and credit developments show that money growth remained relatively strong while credit growth lost some momentum. The exchange rate of the rupee broadly reflected economic fundamentals as well as developments in major currency markets. The external current account deficit improved in 2015 mainly on account of a lower merchandise trade deficit, given lower global commodity prices.

12 | Bank of Mauritius
per cent in 2015, as against a strong growth of 10.8 per cent in 2014, while imports of goods and services grew by 6.0 per cent.
3.3 Labour Market and Unit Labour Costs
Structural unemployment remains prominent among the youth and women in the labour market. Unemployment among those aged below 30 years is more pronounced compared to those aged above 30 years (Chart 3.1).
Labour market statistics for 2015Q4 revealed the following characteristics: (i) 58 per cent of unemployed were women; (ii) 47 per cent were under the age of 25 years; (iii) 45 per cent did not have a School Certificate; and (iv) 31 per cent were looking for their first job. Effective job creation policies and skills development should take into consideration these characteristics.
Overall, the unemployment rate increased in 2015. The overall unemployment rate rose from 7.5 per cent in 2014Q4 to 7.9 per cent in 2015Q4. The seasonally-adjusted unemployment rate
3. Domestic Economic Developments
Table 3.1: Sectoral Real Growth Rates (per cent over previous year)
2013 20142015
Jun-2015 Issue
Sep-2015 Issue
Dec-2015 Issue
Mar-2016 Issue
Primary SectorAgriculture, forestry and fishing 0.4 3.9 3.6 2.7 -0.2 -1.0Mining and quarrying -4.6 -5.0 2.0 0.0 0.0 -1.6Secondary SectorManufacturing 4.4 2.2 1.9 1.9 1.5 0.2 - sugar -1.0 0.6 2.0 2.0 -7.6 -7.2 - food processing (excluding sugar) -0.3 2.6 3.0 3.4 3.6 3.9 - textile 2.6 1.0 1.0 0.5 -1.0 -2.9 - other manufacturing 12.7 3.0 1.3 1.6 1.8 -0.8
Electricity, gas, steam and air conditioning supply 4.4 4.0 4.2 3.9 3.9 3.9Water supply 2.5 3.0 3.0 3.0 3.0 3.0Construction -9.4 -8.5 1.4 -2.6 -4.3 -4.7Tertiary SectorWholesale and retail trade 3.1 3.2 3.0 3.0 3.0 3.1Transport and storage 2.0 2.5 3.0 3.0 3.0 3.0Accommodation and food service activities 2.5 4.1 5.4 6.5 8.6 9.3Information and communication 6.9 6.4 7.0 7.0 6.9 6.9Financial and insurance activities 5.4 5.4 5.3 5.2 5.2 5.2Real estate activities 2.9 2.7 2.2 2.2 2.2 2.2Professional, scientific and technical activities 7.2 5.9 6.0 6.0 5.5 5.6Administrative and support service activities 7.4 7.4 6.0 6.0 6.0 6.3Public administration and defence 2.2 5.8 4.3 3.5 2.3 1.4Education 2.7 2.9 2.9 3.4 3.7 3.0Human health and social work activities 6.4 6.4 5.1 4.5 4.5 4.0Arts, entertainment and recreation 8.2 6.7 5.0 4.9 4.7 5.0Other service activities 6.3 5.2 4.2 4.2 4.2 4.6GDP at basic prices 3.2 3.4 3.8 3.6 3.4 3.1Taxes on products (net of subsidies) 2.7 4.7 2.6 2.9 3.9 6.8GDP at market prices 3.2 3.6 3.6 3.5 3.4 3.5
Source: Statistics Mauritius.

13Monetary Policy and Financial Stability Report |
also mirrored this trend, rising from 8.3 per cent to 8.6 per cent over the same period. Statistics Mauritius estimated the unemployment rate for 2015 at 7.9 per cent, marginally up from 7.8 per cent in 2014. The overall participation rate rose to 61.0 per cent in 2015Q4 compared to 60.4 per cent a year earlier. Total employment of Mauritian nationals increased by 6,700 over the year to 2015Q4 (Chart 3.2).
Against the backdrop of moderate growth prospects and prevailing skills mismatch, the unemployment rate in the near term is not expected to improve materially from its current level. Active labour market policies such as the Youth Employment Programme, which provides valuable work experience to young unemployed, could be scaled up with the collaboration of the
private sector. Measures focusing on training and skills development should aim at improving long term labour market trends and re-allocate human resources to more productive uses.
Unit labour costs have generally trended upwards, attributed to wage increases outpacing productivity growth (Charts 3.3 and 3.4). The growth in unit labour cost declined sharply from 2.5 per cent in 2014 to 0.9 per cent in 2015, reflecting a deceleration in both compensation and labour productivity growth. Over the period 2005 through 2015, unit labour cost has increased, on average, by 3.8 per cent each year. The corresponding annual growth for labour productivity and average compensation stood at 2.7 per cent and 6.6 per cent, respectively.
Table 3.2: Sectoral Growth Rates (per cent, y-o-y)2013 2014 2015
Q1 Q2 Q3 Q4 Q1 Q2 Q3 Q4 Q1 Q2 Q3 Q4
Primary Sector Agriculture, forestry and fishing -4.6 -0.1 4.5 0.2 5.4 4.8 3.7 2.8 -8.0 0.2 1.7 -0.3Mining and quarrying -2.4 -6.6 -0.7 -8.0 -15.0 -4.8 -5.0 2.7 2.0 -0.1 -3.7 -3.1Secondary Sector Manufacturing 6.0 4.8 3.4 3.8 -2.5 3.4 2.7 3.7 2.3 1.1 1.5 -2.6Electricity, gas, steam and air conditioning supply 6.5 2.5 3.7 4.5 3.7 6.5 2.3 3.4 4.3 2.1 1.8 6.9Water supply 3.0 1.1 1.9 3.9 5.1 0.5 4.0 2.4 2.6 3.6 2.8 3.0Construction -2 -3.1 -11.3 -19.1 -5.9 -9.7 -9.3 -9.0 -8.0 -5.4 -3.7 -1.7Tertiary Sector Wholesale and retail trade 3.7 3.1 2.6 2.8 3.0 3.1 3.2 3.5 3.0 2.7 3.3 3.1Transportation and storage 2.8 -1.0 1.6 4.2 2.5 3.2 2.9 1.4 2.4 3.4 2.4 3.8Accommodation and food service activities 1.4 0.3 6.8 1.6 -1.2 8.8 5.1 5.2 9.8 4.8 10.7 10.8Information and communication 7.2 8.0 7.2 5.5 6.8 6.0 7.0 5.8 7.6 7.7 5.9 6.6Financial and insurance activities 5.1 5.3 5.7 5.2 6.1 5.7 4.8 5.4 4.6 5.0 5.5 5.7Real estate activities 2.9 3.0 2.9 2.8 2.6 2.9 2.9 2.8 2.3 2.3 2.2 2.2Professional, scientific and technical activities 7.4 7.2 7.2 6.9 5.8 6.0 6.0 5.9 5.4 5.6 5.7 5.7Administrative and support service activities 7.2 7.1 7.2 8.0 7.2 7.5 7.5 7.4 6.1 6.3 6.2 6.4Public administration and defence 1.2 1.8 2.5 3.1 2.8 6.8 6.5 6.8 1.3 3.0 2.0 -0.6Education 2.7 2.7 2.6 3.0 2.9 3.0 3.0 2.8 2.8 2.8 2.9 3.3Human health and social work activities 6.3 5.9 6.4 6.8 6.4 6.3 6.2 6.7 3.9 4.0 4.5 3.7Art, entertainment and recreation 8.0 8.1 8.1 8.4 6.9 6.8 6.8 6.7 4.9 4.7 4.9 5.3Other service activities 5.1 5.9 6.5 7.4 5.1 5.1 5.1 5.3 4.6 4.6 4.4 4.8GDP at basic prices 3.8 3.4 3.4 2.6 2.4 4.0 3.6 3.7 3.1 3.1 3.5 2.6Taxes on products (net of subsidies) -0.4 4.1 3 4.1 3.8 6.0 4.1 4.7 12.1 1.8 7.1 6.6GDP at market prices 3.2 3.5 3.3 3.8 2.6 4.3 3.7 3.9 4.2 2.8 3.9 3.2
Source: Statistics Mauritius.
3. Domestic Economic Developments

14 | Bank of Mauritius
Table 3.3: Domestic and External Demand (per cent, y-o-y)2013 2014 2015
Q1 Q2 Q3 Q4 Q1 Q2 Q3 Q4 Q1 Q2 Q3 Q4
I. Domestic Demand Final consumption 2.8 2.1 2.6 1.8 1.6 3.4 3.2 3.3 2.3 3.0 3.1 2.2 Households 2.7 2.6 3.0 2.1 1.6 2.9 3.1 2.9 2.5 2.9 3.2 2.9 General Government 2.9 -0.5 0.5 -0.1 1.5 6.3 3.6 6.0 1.0 3.8 2.7 -2.3Gross DomesticFixed Capital Formation -10.7 -4.3 -0.6 1.9 -3.3 -4.5 -11.4 -4.2 -1.5 -1.9 -2.6 -13.8 Building and construction work -4.1 -4.1 -11.4 -19.1 -5.1 -8.9 -8.4 -7.1 -7.2 -3.7 -3.1 -1.5 Machinery and equipment -21.6 -4.4 25.8 59.7 0.1 4.6 -16.5 0.3 10.1 1.4 -1.5 -30.3II. Net External DemandExports of goods and services -7.9 -11.2 -4.2 -0.2 0.0 17.1 20.2 7.0 14.3 -2.1 -5.7 -6.5 Exports (goods) 4.0 -0.5 5.9 8.9 2.5 18.5 19.2 7.8 17.9 0.8 -8.1 -13.6 Exports (services) -15.9 -19.6 -13.3 -7.5 -2.0 15.8 21.2 6.1 11.2 -5.0 -3.1 0.3Imports of goods and services -7.3 -9.4 6.4 8.9 1.5 9.2 8.9 14.3 13.7 9.1 5.3 -0.7 Imports (goods) -1.6 -3.1 10.8 12.6 -2.1 8.3 9.6 14.6 17.0 12.5 6.4 1.3 Imports (services) -18.2 -22.1 -2.7 0.8 9.8 11.4 7.3 13.6 6.8 1.0 2.6 -5.7III. GDP at market prices 3.2 3.5 3.3 3.8 2.6 4.3 3.7 3.9 4.2 2.8 3.9 3.2
Source: Statistics Mauritius.
As a result of the noticeable depreciation of the rupee in 2015, the unit labour cost, in US dollar terms, declined by 12.1 per cent, as against an increase of 2.9 per cent in the preceding year. In the short term, the depreciation of the rupee supports competitiveness of the country through a lower growth of unit labour cost, in US dollar terms. In the medium to long term, however, external competitiveness can only be sustained by continuous productivity gains and a prudent wage policy centred on the productivity of workers. Inordinate increases in wages could also pose upside risks to inflation, especially as the economy reverts to its potential growth.
3.4 Public Sector DebtPublic sector debt remained expansionary, thereby raising concerns over fiscal sustainability. Public sector debt increased by 9.5 per cent, from Rs238 billion as at end-December 2014 to Rs261 billion as at end-December 2015 and further to Rs267 billion as at end-March 2016 (Table 3.4). As a share of GDP, it rose from 61.6 per cent to 65.2 per cent between December 2014 and
March 2016. The discounted public sector debt3 as a ratio of GDP has also increased from 54.2 per cent as at end-December 2014 to 56.6 per cent as at end-December 2015. It thereafter edged up to 56.9 per cent as at end-March 2016. However, Government is committed to bring down statutory public sector debt to 50 per cent by 2017/18.
3. Domestic Economic Developments
0 0
4 4
8 8
12 12
16 16
20 20
24 24
28 28
32 32
2011 2011 2012 2012 2013 2013 2014 2014 2015 2015
16-24 yrs 16-24 yrs 25-29 yrs 25-29 yrs 30-39 yrs 30-39 yrs 40-49 yrs 40-49 yrs 50+ yrs 50+ yrs
Per cent Per cent
1 1 2 2 3 3 4 4 1 1 2 2 3 3 4 4 1 1 2 2 3 3 4 4 1 1 2 2 3 3 4 4 1 1 2 2 3 3 4 4
Unemployment by Age Group Chart3.1
Source: Statistics Mauritius.
3 Discounted public sector debt evaluates/adjusts total public sector debt for the fiscal risks associated with debt of parastatals and state-owned enterprises. Accordingly, this debt is discounted whenever the fiscal risk is small. For operational purposes of adherence to the provisions of the Public Debt Management Act 2008, it is the discounted public sector debt that is relevant.

15Monetary Policy and Financial Stability Report |
Domestic debt mainly contributed to the rise in public sector debt between end-December 2014 and end-March 2016. Domestic public sector debt rose by 14.5 per cent and the share of long term domestic obligations in domestic central government debt has increased by 1.8 percentage points to 56 per cent. External public sector debt rose by 5.6 per cent and represented 16.2 per cent of GDP as at end-March 2016, almost unchanged from end-December 20l4.
The currency composition of budgetary central government external debt remained fairly balanced, suggesting relatively low foreign exchange risk. At end-March 2016, the US dollar accounted for nearly 42.0 per cent of external debt, followed by the euro (33.0 per cent). With regard to the interest rate mix of public sector external debt, the share of variable interest rate declined from 63.5 per cent in December 2014 to 60.0 per cent in March 2016. The need for fiscal consolidation is underscored so as to bring debt to a sustainable level.
3.5 Monetary AggregatesBoth money growth and credit growth lost some momentum. Y-o-y growth in broad money liabilities (BML) declined to 7.7 per cent in March 2016, from 10.5 per cent in March 2015 (Chart 3.5). The components of BML contributed broadly to this deceleration (Table 3.5). The increase in BML does not point toward any risk to the inflation outlook given the subdued economic environment. The velocity of circulation of broad money remained stable at around 1.0 in March 2016.
The y-o-y growth rate in the net foreign assets (NFA) of depository corporations (DCs) contracted by 9.0 per cent in March 2016, from significant growth of 50.1 per cent in March 2015. The annual growth rate of NFA of other depository corporations (ODCs) declined by 16.4 per cent in March 2016, from substantial growth of 60.3 per cent a year ago, while the NFA of the Bank of Mauritius slowed markedly from 26.0 per cent to 13.2 per cent.
3. Domestic Economic Developments
Agriculture, forestry and fishing Agriculture, forestry and fishing
Manufacturing Manufacturing
Construction Construction
Wholesale and retail trade Wholesale and retail trade
Transportation and storage Transportation and storage
Accommodation and food service activities Accommodation and food service activities
Professional, scientific and technical activities Professional, scientific and technical activities
Information and communication Information and communication
Financial and insurance activities Financial and insurance activities
Real estate activities Real estate activities
Between 2014Q4 and 2015Q4 Between 2014Q4 and 2015Q4
Quarterly Change inEmployment (Mauritians)
Chart3.2
-2000 -1000 0 1000 2000 3000
Source: Statistics Mauritius.
85
90
95
100
105
110
115
120
125
130
135
2005 2006 2007 2008 2009 2010 2011 2012 2013 2014 2015
Index (2007 = 100)
Unit Labour Costsfor the Total Economy
Chart3.3
Source: Statistics Mauritius.
Productivity and Wage IndicesChart3.4
72
80
88
96
104
112
120
128
136
144
152
160
2005 2006 2007 2008 2009 2010 2011 2012 2013 2014 2015
Labour productivity Average compensation of employees
Index (2007 = 100)
Source: Statistics Mauritius.

16 | Bank of Mauritius
Domestic claims picked up in March 2016. The annual growth rate of domestic claims of DCs increased from a trough of 1.9 per cent in February 2016 to 6.1 per cent in March 2016, reflecting a rise in net claims on central government. Net claims on central government increased from Rs41.2 billion at end-March 2015 to Rs47.5 billion at end-March 2016, while claims on other sectors, which mainly include credit to private sector, increased by about 3.4 per cent, from Rs420.8 billion to Rs435.0 billion.
3. Domestic Economic Developments
Table 3.4: Public Sector DebtJun-14 Dec-14 Jun-15 Dec-15 Mar-16
Provisional(Rs million)
1. Short-term Domestic Obligations 1 22,984 26,750 25,916 26,845 32,6812. Medium-term Domestic Obligations 1 50,692 48,440 50,218 51,710 50,3103. Long-term Domestic Obligations 1 83,301 90,095 95,774 103,094 106,9004. Domestic Central Government Debt (1+2+3) 156,977 165,285 171,908 181,649 189,8915. External Government Debt 51,456 51,429 54,711 54,676 54,024
(13.6) (13.3) (13.9) (13.5) (13.2)
(a) Foreign Loans 46,539 46,773 49,920 49,727 49,074(b) Foreign Investment in Government Securities 392 207 16 131 131(c) IMF SDR Allocations 4,525 4,449 4,775 4,818 4,819
6. Extra Budgetary Unit Domestic Debt 24 24 24 24 247. Extra Budgetary Unit External Debt 149 137 136 126 1268. Local Government Domestic Debt 0 0 0 0 09. Public Enterprise Domestic Debt 9,437 9,864 12,507 11,532 10,73410. Public Enterprise External Debt 10,838 11,294 12,618 12,674 12,26111. Domestic Public Sector Debt 166,438 175,173 184,439 193,205 200,649
(44.1) (45.4) (46.7) (47.9) (49.0)
12. External Public Sector Debt 62,443 62,860 67,465 67,476 66,411(16.6) (16.3) (17.1) (16.7) (16.2)
13. Total Public Sector Debt (11+12) 228,881 238,033 251,904 260,681 267,060(60.7) (61.6) (63.8) (64.6) (65.2)
1 By original maturity.
Notes: (i) Short-term: Up to 12 months; Medium-term: Over 1 year but less than 5 years; Long-term: 5 years and above. (ii) Figures in brackets are percentages to GDP. (iii) Figures may not add up to totals due to rounding.
Source: Ministry of Finance and Economic Development.
Annual Growth Rates of BML and NMLChart3.5
0
2
4
6
8
10
12
14
16
18
2006 2007 2008 2009 2010 2011 2012 2013 2014 2015 Mar-16
Per cent
Broad Money Liabilities Narrow Money Liabilities

17Monetary Policy and Financial Stability Report |
3. Domestic Economic Developments
Table 3.5: Depository Corporations Survey, 2012-2016 1
2012 2013 2014
2015
Mar-16Mar Jun Sep Dec
(Rs million)
Net Foreign Assets 401,320.9 396,299.9 457,823.2 557,980.6 519,851.3 505,829.9 529,025.5 507,495.6 BoM (net) 91,559.8 103,497.9 122,735.5 139,062.5 138,628.5 144,450.6 151,519.5 157,406.7 ODCs (net) 309,761.1 292,802.0 335,087.7 418,918.1 381,222.8 361,379.3 377,506.1 350,088.9Domestic Claims 214,348.0 242,531.1 253,324.3 240,316.0 248,943.7 252,302.6 255,992.9 255,032.6 Net Claims on Central Government 26,748.3 34,759.0 44,771.5 41,183.3 46,467.8 43,682.0 41,980.5 47,471.8 Claims on Central Government 61,251.3 65,605.5 78,031.4 76,119.4 79,660.2 81,976.2 83,459.8 89,542.7 Liabilities to Central Government -34,503.0 -30,846.5 -33,259.9 -34,936.1 -33,192.4 -38,294.2 -41,479.3 -42,070.9 Claims on Other Sectors 364,273.6 413,415.5 402,034.6 420,833.5 414,496.8 426,617.6 434,672.1 435,001.3 of which loans to various sectors
of the economy 306,043.5 336,942.4 350,895.8 362,750.1 363,101.8 372,027.6 379,160.1 377,393.3
Other claims (net) -176,673.9 -205,643.5 -193,481.8 -221,700.8 -212,020.9 -217,997.0 -220,659.7 -227,440.4 o/w Shares and equity -134,541.2 -137,324.9 -164,291.8 -165,869.0 -166,822.2 -170,609.6 -149,815.0
Financial derivatives -33,923.0 -48,880.6 -30,159.0 -24,374.6 -26,988.6 -26,324.6 -27,691.0
Broad Money Liabilities 345,617.2 365,608.7 397,556.5 410,915.3 418,402.1 423,801.8 437,998.6 442,449.9 Currency Outside Depository
Corporations22,169.7 23,316.7 25,391.2 23,784.9 24,017.5 24,354.6 27,637.6 26,183.7
Transferable Deposits 74,630.8 80,391.4 92,719.2 100,592.6 102,270.0 104,979.3 107,987.4 110,751.6 Savings Deposits 123,940.2 137,028.6 151,721.3 157,723.5 162,367.6 163,856.7 171,829.5 177,427.0 Time Deposits 122,902.1 121,803.1 124,366.9 124,372.0 126,313.1 126,371.2 126,016.4 122,824.9 Securities other than Shares 1,974.3 3,069.0 3,358.0 4,442.3 3,433.9 4,240.1 4,527.8 5,262.6GBC Deposits 270,051.7 273,222.3 313,590.9 387,381.3 350,392.9 334,330.7 347,019.8 320,078.4
(Annual growth rate, per cent)
Net Foreign Assets 8.2 -1.3 15.5 50.1 36.0 14.8 15.6 -9.0 BoM (net) 14.3 13.0 18.6 26.0 15.9 19.6 23.5 13.2 ODCs (net) 6.6 -5.5 14.4 60.3 45.2 13.0 12.7 -16.4Domestic Claims 3.2 13.1 4.5 1.9 8.8 9.3 1.1 6.1 Net Claims on Central Government -11.4 29.9 28.8 14.9 34.7 28.1 -6.2 15.3 Claims on Central Government 1.3 7.1 18.9 10.9 7.1 6.8 7.0 17.6 Liabilities to Central Government 13.8 -10.6 7.8 6.6 -16.7 -10.2 24.7 20.4 Claims on Other Sectors 17.1 13.5 -2.8 4.4 5.7 9.3 8.1 3.4 of which Loans to various sectors
of the economy 12.4 10.1 4.1 7.7 7.3 9.1 8.1 4.0
Other claims (net) 32.3 16.4 -5.9 9.2 7.3 12.6 14.0 2.6Broad Money Liabilities 8.2 5.8 8.7 10.5 10.6 11.7 10.2 7.7GBC Deposits 4.3 1.2 14.8 64.4 50.6 14.5 10.7 -17.4Memo items:Nominal GDP (market prices) 343,835.0 366,228.0 386,627.0 406,636.0 406,636.0 406,636.0 406,636.0 431,823.0BML + GBC Deposits 615,668.9 638,831.0 711,147.5 798,296.6 768,795.0 758,132.5 785,018.4 762,528.3Velocity of Broad Money (BM) 1.03 1.03 1.03 1.05 1.03 1.00 0.97 1.02Velocity of BM plus GBC 0.58 0.58 0.57 0.60 0.57 0.54 0.53 0.56Velocity of Narrow Money Liabilities (NML) 4.95 4.89 4.96 5.14 5.00 4.82 4.71 4.89
Money multiplier 6.6 5.9 5.9 5.6 5.8 6.3 6.0 6.4
1 Data is up to March 2016 and includes the accounts of banks and non-bank deposit-taking institutions.

18 | Bank of Mauritius
3. Domestic Economic Developments
Table 3.6: Bank of Mauritius Balance Sheet, 2012-2016 1
2012 2013 2014
2015
Mar-16Mar Jun Sep Dec
(Rs million)
Net Foreign Assets 91,559.8 103,497.9 122,735.5 139,062.5 138,628.5 144,450.6 151,519.5 157,406.7Net Domestic Claims -32,414.4 -24,504.0 -31,099.7 -46,363.8 -40,279.1 -46,483.3 -48,724.2 -53,838.2 Claims on ODCs 1,804.6 2,715.7 2,467.9 2,443.2 2,027.6 1,307.1 1,056.7 1,011.9 Net Claims on Central Government 2 -9,721.1 -6,903.8 -16,238.5 -19,134.6 -15,869.1 -20,396.7 -21,718.4 -25,081.8 Claims on Other Sectors 184.5 172.7 152.2 127.2 3,704.0 3,675.2 3,668.5 3,623.0 Other items (net) -24,682.3 -20,488.5 -17,481.4 -29,799.5 -30,141.6 -31,069.0 -31,731.1 -33,391.4Monetary Base 52,622.9 62,350.0 67,933.6 73,577.8 71,594.1 66,947.3 73,569.0 69,446.0 Currency in circulation 26,961.3 30,127.7 32,530.9 28,235.8 28,401.2 28,816.4 33,337.4 30,743.3 Liabilities to ODCs 25,661.6 32,222.4 35,402.7 45,342.0 43,193.0 38,130.9 40,231.7 38,702.7BoM securities 6,522.5 16,644.0 23,702.2 19,120.9 26,755.2 31,020.0 29,226.2 34,122.5 Held by banks 3,916.3 10,796.4 17,219.3 11,724.0 18,914.7 21,819.0 19,286.0 23,507.9 Held by Social Security Funds 1,745.8 4,028.9 4,505.0 4,368.4 5,845.7 6,432.3 6,916.5 6,876.9 Other holders 860.3 1,818.7 1,977.8 3,028.5 1,994.8 2,768.7 3,023.8 3,737.6
(Contribution to monetary base growth, per cent)
Net Foreign Assets 23.7 22.7 30.9 46.0 30.6 37.2 42.4 24.9Net Domestic Assets/Claims -19.0 15.0 -10.6 -30.6 -10.2 -13.1 -25.9 -10.2Claims on ODCs 1.4 1.7 -0.4 -1.7 -0.6 -1.2 -2.1 -1.9Net Claims on Central Government -8.2 5.4 -15.0 -15.3 -2.3 0.1 -8.1 -8.1 Claims on Other Sectors 0.0 0.0 0.0 0.0 5.7 5.6 5.2 4.8 Other items (net) -12.2 8.0 4.8 -13.5 -13.0 -17.5 -21.0 -4.9Monetary Base 9.0 18.5 9.0 17.8 15.2 5.0 8.3 -5.6 Currency in circulation 5.2 6.0 3.9 2.3 3.3 3.5 1.2 3.4 Liabilities to ODCs 3.8 12.5 5.1 15.4 11.9 1.4 7.1 -9.0BoM securities 4.3 -19.2 -11.3 2.4 -5.1 -19.1 -8.1 -20.4 Held by banks 3.4 -13.1 -10.3 5.5 -2.8 -14.0 -3.0 -16.0 Held by Social Security Funds 0.7 -4.3 -0.8 -0.9 -2.2 -3.7 -3.5 -3.4 Other holders 0.2 -1.8 -0.3 -2.2 -0.1 -1.5 -1.5 -1.0
(Growth rate, per cent)
Net Foreign Assets 14.3 13.0 18.6 26.0 15.9 19.6 23.5 13.2 Net Domestic Assets/Claims 39.6 -24.4 26.9 70.3 18.7 21.8 56.7 16.1 Claims on ODCs 58.5 50.5 -9.1 -30.8 -16.0 -37.4 -57.2 -58.6 Net Claims on Central Government 68.9 -29.0 135.2 100.0 10.0 -0.4 33.7 31.1 Claims on Other Sectors -1.7 -6.4 -11.8 -17.9 2,220.9 2,627.8 2,310.0 2,749.3 Other items (net) 31.3 -17.0 -14.7 39.6 36.6 56.2 81.5 12.1Monetary Base 9.0 18.5 9.0 17.8 15.2 5.0 8.3 -5.6 Currency in circulation 10.2 11.7 8.0 5.5 7.8 8.5 2.5 8.9 Liabilities to ODCs 7.8 25.6 9.9 27.0 20.7 2.5 13.6 -14.6BoM securities -24.1 155.2 42.4 -7.3 13.6 64.9 23.3 78.5 Held by banks -29.3 175.7 59.5 -22.8 10.2 69.2 12.0 100.5 Held by Social Security Funds -16.2 130.8 11.8 14.3 30.3 56.8 53.5 57.4 Other holders -11.7 111.4 8.8 86.2 4.6 52.6 52.9 23.4Memo item:End-period exchange rate (Rs/US$) 30.5 30.1 31.7 36.4 35.2 35.5 35.9 35.4
1 Data is up to March 2016.2 Exclude BoM securities holdings by social security funds.

19Monetary Policy and Financial Stability Report |
Monetary base posted negative growth in March 2016. The monetary base contracted by 5.6 per cent y-o-y in March 2016, from robust growth of 17.8 per cent in March 2015. The annual growth of liabilities to ODCs, one of the major components of monetary base, fell in negative territory, recording a contraction rate of 14.3 per cent in March 2016, from significant growth of 26.5 per cent in March 2015. The broad money multiplier accelerated to 6.4 in March 2016, from 5.6 in March 2015 (Table 3.6).
3.6 Credit DevelopmentsThe y-o-y growth rate of bank credit to the private sector (excluding GBCs) more than halved in March 2016 compared to the previous month. Whilst the growth rate had declined to 1.6 per cent in April 2015, it accelerated to 5.5 per cent in August 2015 before slowing down to 2.1 per cent in March 2016 (Chart 3.6 and Table 3.7). The deceleration in growth of total credit to the private sector was driven by corporate credit which slowed from 4.6 per cent in February 2016 to 1.0 per cent in March 2016. The contribution of household credit growth to total credit growth remained fairly stable, in the range of 1.3-1.7 per cent. The decrease in total credit growth was mainly on account of the negative growth rates recorded in the construction, traders and financial services sectors in March 2016. Growth in consumer or personal credit still remained in negative territory.
3.7 Interest RatesBanks’ lending and deposit rates have been on a declining trend since March 2015. Lending rates applicable to key sectors in the economy - construction, traders and tourism - hovered in the range of 6.7 per cent to 8.3 per cent during the period under review (Chart 3.7). Lending rates on consumer credit have remained higher than those for productive purposes. All lending rates declined following the November 2015 cut in the Key Repo Rate (KRR) by 25 basis points. Weighted average rupee deposit rate, which stood at 3.2 per cent in March 2015, dropped to 2.6 per cent in March 2016, reflecting the reduction in the KRR in November 2015 (Chart 3.8).
3. Domestic Economic Developments
Y-o-y Growth in Bank Credit to Private Sector 1
Chart3.6
-6
-4
-2
0
2
4
6
8
10
12
14
16
18
Mar
-13
May
-13
Jul-1
3
Sep-
13
Nov
-13
Jan-
14
Mar
-14
May
-14
Jul-1
4
Sep-
14
Nov
-14
Jan-
15
Mar
-15
May
-15
Jul-1
5
Sep-
15
Nov
-15
Jan-
16
Mar
-16
Per cent
Bank credit to private sector Bank credit to corporates Bank credit to household
1 Excludes loans to GBC entities.
6.0 6.0
6.5 6.5
7.0 7.0
7.5 7.5
8.0 8.0
8.5 8.5
9.0 9.0
9.5 9.5
11.0 11.0
10.5 10.5
10.0 10.0
Per cent Per cent
Consumer Consumer Mortgage Mortgage Construction Construction TradersTraders TourismTourism
Weighted Average RupeeLending Rate by Sector
Chart3.7
Mar
-13
May
-13
Jul-1
3
Sep-
13
Nov
-13
Jan-
14
Mar
-14
May
-14
Jul-1
4
Sep-
14
Nov
-14
Jan-
15
Mar
-15
May
-15
Jul-1
5
Sep-
15
Nov
-15
Jan-
16
Mar
-16
Inflation and WeightedAverage Rupee Deposit Rate
Chart3.8
-1.0 -0.5 0.0 0.5 1.0 1.5 2.0 2.5 3.0 3.5 4.0 4.5 5.0 5.5 6.0
Mar
-13
May
-13
Jul-1
3
Sep-
13
Nov
-13
Jan-
14
Mar
-14
May
-14
Jul-1
4
Sep-
14
Nov
-14
Jan-
15
Mar
-15
May
-15
Jul-1
5
Sep-
15
Nov
-15
Jan-
16
Mar
-16
Per cent
Headline inflation Y-o-y inflation Weighted average rupee deposit rate

20 | Bank of Mauritius
3.8 Excess Liquidity and Yield CurvesExcess liquidity in the banking system receded significantly mainly on account of the Bank’s sterilisation policy. Open market operations conducted during 2015 led to a gradual decrease in the level of excess liquidity (Chart 3.9). As from January 2015, the Bank has been conducting sterilised intervention to absorb rupee injections into the system. Out of a total amount of Rs16.1 billion injected through foreign exchange intervention by the Bank over the period January to December 2015, a total amount of Rs7.3 billion was sterilised by way of rupee deposits placed by banks for a period of one year, at the rate prevailing on the last auction for Government of Mauritius Treasury Bills of the same maturity. The Bank
Table 3.7: Bank Credit to Private Sector, 2011-2016
2011 2012 2013 20142015 2016
Mar Jun Sep Dec Mar(Annual growth rates, per cent)
Total credit to private sector 8.3 12.8 5.9 1.3 2.6 2.7 5.2 4.2 2.1 Corporates 1 5.9 11.5 2.8 -0.7 1.4 1.7 5.2 3.9 1.0 Construction 11.5 32.1 10.9 3.4 6.7 5.9 7.0 4.0 -2.9 Tourism 6.6 4.1 8.8 -2.4 -3.5 -1.4 1.8 1.4 1.6 Traders 19.2 9.0 -7.6 9.0 8.4 -4.3 1.6 1.0 -0.6 Financial services 2.8 5.9 5.4 -7.0 -0.5 7.1 13.4 6.8 -5.6 Manufacturing 1.7 3.6 2.2 -2.2 11.6 10.2 10.2 12.0 3.5 Agriculture and Fishing 11.5 12.0 5.0 0.7 -8.7 -3.7 6.1 12.1 20.1 Other -10.8 23.3 -7.4 -6.7 -1.8 3.4 1.9 -4.5 -2.4 Households 16.4 16.6 15.0 6.2 5.8 5.1 5.2 5.0 4.6 Personal credit 7.6 14.1 21.3 2.1 -0.2 -2.4 -3.7 -2.1 -2.0 Mortgages 22.6 18.3 11.1 8.9 9.9 10.1 11.1 9.4 8.6
(Contribution to growth of total credit to private sector, per cent)Total credit to private sector 8.3 12.8 5.9 1.3 2.6 2.7 5.2 4.2 2.1 Corporates 1 4.5 8.6 2.1 -0.5 1.0 1.2 3.7 2.7 0.7 Construction 1.0 2.9 1.1 0.4 0.7 0.7 0.8 0.4 -0.3 Tourism 1.3 0.8 1.5 -0.4 -0.6 -0.3 0.3 0.2 0.3 Traders 2.2 1.1 -0.9 1.0 0.9 -0.5 0.2 0.1 -0.1 Financial services 0.3 0.6 0.5 -0.7 -0.1 0.6 1.1 0.6 -0.6 Manufacturing 0.1 0.3 0.2 -0.2 0.8 0.7 0.7 0.8 0.3 Agriculture and Fishing 0.8 0.9 0.4 0.0 -0.6 -0.3 0.4 0.8 1.3 Other -1.2 2.1 -0.7 -0.6 -0.1 0.3 0.1 -0.4 -0.2 Households 3.8 4.1 3.9 1.7 1.7 1.5 1.6 1.5 1.3 Personal credit 0.7 1.4 2.1 0.2 0.0 -0.3 -0.4 -0.2 -0.2 Mortgages 3.1 2.8 1.8 1.5 1.7 1.8 2.0 1.7 1.6
1 includes Public Corporations.
3. Domestic Economic Developments
2,000 2,000
4,000 4,000
6,000 6,000
8,000 8,000
10,000 10,000
12,000 12,000
14,000 14,000
16,000 16,000
18,000 18,000
20,000 20,000
Rs million Rs million
Jan-
14
Jan-
14
Feb-
14
Feb-
14
Mar
-14
Mar
-14
Apr-
14
Apr-
14
May
-14
May
-14
Jun-
14
Jun-
14
Jul-1
4 Ju
l-14
Aug-
14
Aug-
14
Sep-
14
Sep-
14
Oct
-14
Oct
-14
Nov
-14
Nov
-14
Dec
-14
Dec
-14
Jan-
15
Jan-
15
Feb-
15
Feb-
15
Mar
-15
Mar
-15
Apr-
15
Apr-
15
May
-15
May
-15
Jun-
15
Jun-
15
Jul-1
5 Ju
l-15
Aug-
15
Aug-
15
Sep-
15
Sep-
15
Oct
-15
Oct
-15
Nov
-15
Nov
-15
Dec
-15
Dec
-15
Jan-
16
Jan-
16
Feb-
16
Feb-
16
Mar
-16
Mar
-16
Banks’ Monthly Average Excess Reserves
Chart3.9

21Monetary Policy and Financial Stability Report |
also absorbed around Rs5.6 billion for liquidity management purposes through Government of Mauritius Treasury Bills auctions in addition to issuing Bank of Mauritius securities for a total nominal amount of Rs18.9 billion.
Excess liquidity in the banking system drove the yields on Government securities down. The weighted average yields on Treasury Bills for the three maturities (91-Day, 182-Day, and 364-Day) fell during the first five months of 2015, due to the prevailing excess liquidity in the banking system (Chart 3.10). As excess liquidity came down substantially, the weighted yields started to pick up, but thereafter subsided due to a net redemption of securities. Though the Bank has issued its own instruments and embarked on active liquidity management operations to mop up the excess liquidity, this measure was not sufficient to align the interbank rate with the KRR. The disconnect between the two rates impedes on the effectiveness of the transmission mechanism of monetary policy and on the financial system as a whole. In addition, liquidity and depth in the secondary debt market are still inadequate and are not conducive to effective open market operations. Developing a fully effective secondary market is crucial to ensure development of a yield curve which can serve as an important tool in the pricing of securities and risk.
3.9 Exchange Rate DevelopmentsMovements in the rupee exchange rate reflected developments in major currency markets as well as in domestic demand and supply conditions. In March 2016, the rupee appreciated by 4.5 per cent vis-à-vis the Pound sterling but depreciated by 1.1 per cent and 3.2 per cent against the US dollar and euro, respectively, compared to a year ago. In nominal effective terms, the rupee, as measured by the MERI1 - obtained through the currency distribution of trade - depreciated by 0.7 cent between March 2015 and March 2016. Between March 2015 and March 2016, the real effective exchange rate of the rupee, weighed by trading partner countries, appreciated by 2.6 per cent (Chart 3.11).
3. Domestic Economic Developments
0.5 0.5
1.0 1.0
1.5 1.5
2.0 2.0
2.5 2.5
3.0 3.0
3.5 3.5
4.0 4.0
4.5 4.5
Per cent Per cent
91-Day 91-Day 182-Day 182-Day 364-Day
Jan-
15
Jan-
15
Feb-
15
Feb-
15
Mar
-15
Mar
-15
Apr-
15
Apr-
15
May
-15
May
-15
Jun-
15
Jun-
15
Jul-1
5 Ju
l-15
Aug-
15
Aug-
15
Sep-
15
Sep-
15
Oct
-15
Oct
-15
Nov
-15
Nov
-15
Dec
-15
Dec
-15
Jan-
16
Jan-
16
Feb-
16
Feb-
16
Mar
-16
Mar
-16
Movement in Yields Chart3.10
AppreciationAppreciation
Nominal and Real EffectiveExchange Rate of the Rupee
Chart3.11
94
95
96
97
98
99
100
101
102
103
104
80
81
82
83
84
85
86
87
88
89
90
Mar
-13
May
-13
Jul-1
3
Sep-
13
Nov
-13
Jan-
14
Mar
-14
May
-14
Jul-1
4
Sep-
14
Nov
-14
Jan-
15
Mar
-15
May
-15
Jul-1
5
Sep-
15
Nov
-15
Jan-
16
Mar
-16
Real Nominal (RHS)
(Base year: 2005-06=100)
-15 -15 -14 -14 -13 -13 -12 -12 -11 -11 -10 -10 -9 -9 -8 -8 -7 -7 -6 -6 -5 -5 -4 -4 -3 -3 -2 -2
-26 -26 -22 -22 -18 -18 -14 -14 -10 -10 -6 -6 -2 -2 2 2 6 6
10 10 14 14 18 18 22 22 26 26
1 1 2 2 3 3 4 4 1 1 2 2 3 3 4 4 1 1 2 2 3 3 4 4 1 1 2 2 3 3 4 4 1 1 2 2 3 3 4 4
2011 2011 2012 2012 2013 2013 2014 2014 2015 2015
Merchandise Merchandise Services Services Current transfers Current transfers
Income Income Current account balance (RHS) Current account balance (RHS)
Rs billion Rs billion Rs billion Rs billion
Components ofthe Current Account
Chart3.12

22 | Bank of Mauritius
3. Domestic Economic Developments
Table 3.8: Balance of Payments, 2013-20162013 2014 1 2015 2 2016 3
(Rs million)Current account -23,124 -19,204 -18,867 -18,944Trade balance -69,625 -69,394 -64,630 -63,686Service balance 17,364 24,859 21,095 23,974Income balance 31,969 36,008 33,625 30,927 o/w GBC1 flows 27,891 37,436 33,501 30,478Current transfers -2,832 -10,677 -8,957 -10,158Capital and Financial account 16,091 26,218 13,225 18,944Capital account -123 -146 -136 -224Financial account 16,214 26,364 13,361 19,168Direct investment 36,949 621,412 579,276 598,572Portfolio investment -6,960 -362,568 -345,846 -371,644Other investment 2,805 -209,462 -200,108 -188,813 o/w Banks (net) 12,375 -42,348 -9,839 8,014Reserve assets -16,580 -23,019 -19,960 -18,947Errors and omissions, net 7,033 -7,014 5,643 0
(Per cent of GDP)Current account -6.3 -5.0 -4.7 -4.4Trade balance -19.0 -18.0 -16.0 -14.7Service balance 4.7 6.4 5.2 5.6Income balance 8.7 9.3 8.3 7.2 o/w GBC1 net inflows 7.6 9.7 8.3 7.1Current transfers -0.8 -2.8 -2.2 -2.4Capital and Financial account 4.4 6.8 3.3 4.4Capital account 0.0 0.0 0.0 -0.1Financial account 4.4 6.8 3.3 4.4FDI (net) 10.1 160.9 143.6 138.6Portfolio investment -1.9 -93.9 -85.7 -86.1Other investment 0.8 -54.2 -49.6 -43.7 o/w Banks (net) 3.4 -11.0 -2.4 1.9
Reserve assets -4.5 -6.0 -4.9 -4.4Errors and omissions net 1.9 -1.8 1.4 0.0Memo items:Nominal GDP (Rs million) 366,325 386,229 403,536 431,823Gross official international reserves (Rs million) 105,009 124,344 152,902 157,644 Import cover (in months, of Goods and Services) 5.6 6.2 7.7 8.0
1 Revised. 2 Partially revised estimates. 3 Forecast.

23Monetary Policy and Financial Stability Report |
3.10 Balance of PaymentsThe current account deficit improved due to a lower merchandise trade deficit resulting from lower global commodity prices. Preliminary estimates indicate a narrowing of the current account deficit from Rs19.2 billion in 2014 to Rs18.9 billion in 2015 (Table 3.8). As a percentage of GDP, the current account deficit fell from 5.0 per cent to 4.7 per cent. The decline in the deficit on the goods account, from Rs69.4 billion in 2014 to Rs64.6 billion in 2015, emanated from the larger nominal decline in the value of imports relative to exports. Imports declined by 2.3 per cent in 2015, essentially reflecting lower import value of ‘Mineral fuels, lubricants, and related products,’ due to the drop in oil prices. Exports fell by 0.7 per cent to Rs94.1 billion in 2015, driven by the decline of 41.2 per cent in ‘ship’s stores and bunkers’ that offset the pick-up of 15.9 per cent in re-exports and 2.1 per cent in domestic exports. The surplus on the services account narrowed to Rs21.1 billion in 2015, mirroring principally the higher payment for import of services which outpaced the rise in the receipt. The income account registered a lower surplus of Rs33.6 billion in 2015 while current transfers recorded a lower deficit of Rs9.0 billion (Chart 3.12).
The current account deficit was adequately financed by direct investment flows and the overall balance of payments posted a surplus. Direct investment posted net inflows of Rs579.3 billion in 2015, which were amply sufficient to offset the respective net outflows of Rs345.8 billion and Rs200.1 billion recorded on the portfolio and other investment accounts (Chart 3.13). The Bank maintained its sterilised intervention policy and built on foreign exchange reserves which, excluding valuation change, increased by Rs20.0 billion in 2015 compared to a surplus of Rs23.0 billion recorded in 2014.
The gross official international reserves of the country increased to a record high level in February 2016, thereby providing a comfortable buffer. Reserves reached nearly Rs158 billion at the end of February 2016 and
based on the value of imports of goods (f.o.b.) and non-factor services for the year 2015, the import cover stood at 8.0 months at the end of February 2016, up from 7.4 months at the end of September 2015 (Chart 3.14). The country has accumulated sufficient foreign reserves to deal with unanticipated external shocks. Risks to financial stability stemming from transactions with non-residents are currently deemed to be contained.
3. Domestic Economic Developments
Direct investment Direct investment Portfolio investment Portfolio investment Reserve assets (increase -) Reserve assets (increase -)
Other investment Other investment Current account balance (RHS) Current account balance (RHS)
-18 -18
-16 -16
-14 -14
-12 -12
-10 -10
-8 -8
-6 -6
-4 -4
-2 -2
0 0
2 2
-100 -100
-80 -80
-60 -60
-40 -40
-20 -20
0 0
20 20
40 40
60 60
80 80
100 100
1 1 2 2 3 3 4 4 1 1 2 2 3 3 4 4 1 1 2 2 3 3 4 4 1 1 2 2 3 3 4 4 1 1 2 2 3 3 4 4
2011 2011 2012 2012 2013 2013 2014 2014 2015 2015
Rs billion Rs billion Rs billion Rs billion
Financing ofthe Current Account
Chart3.13
4.0 4.0
4.5 4.5
5.0 5.0
5.5 5.5
6.0 6.0
6.5 6.5
7.0 7.0
7.5 7.5
8.0 8.0
8.5 8.5
0.0 0.0
0.5 0.5
1.0 1.0
1.5 1.5
2.0 2.0
2.5 2.5
3.0 3.0
3.5 3.5
4.0 4.0
4.5 4.5
1 1 2 2 3 3 4 4 1 1 2 2 3 3 4 4 1 1 2 2 3 3 4 4 1 1 2 2 3 3 4 4 1 1 2 2 3 3 4 4 1 1
2011 2011 2012 2012 2013 2013 2014 2014 2015 2015 2016 2016
USD billion
Gross official international reserves Gross official international reserves Import cover (RHS) Import cover (RHS)
Months
Gross Official InternationalReserves and Import Cover
Chart3.14


25Monetary Policy and Financial Stability Report |
4.1 Recent TrendsIn an environment of subdued global growth, benign global inflation, volatile international commodity prices and subdued domestic demand conditions, domestic inflation remained at moderate levels since 2015Q1. Headline inflation, as measured by the change in the average level of the Consumer Price Index (CPI) during a twelve-month period, eased from 2.4 per cent in March 2015 to 0.9 per cent in March 2016, its lowest value since June 1988. Y-o-y inflation was volatile and even posted a historically low value of -0.5 per cent in February 2016, attributed partly to downward base effect. Y-o-y inflation thereafter surged to 0.9 per cent in March 2016, reflecting the hike in the price of vegetables (Chart 4.1).
The softening pressures were quite broad-based in various inflation indicators. Based on the y-o-y methodology, goods inflation subsided from 3.0 per cent in March 2015 to 1.3 per cent in March 2016, reflecting amongst others, the volatility in the price of vegetables and the downward adjustment in the prices of petroleum products under the Petroleum Pricing Committee (PPC)4. Services inflation remained at moderate levels too - in line with subdued domestic demand conditions - declining from 0.7 per cent in March 2015 to 0.3 per cent in March 2016. CPIX_M, which excludes mortgage payments in inflation, mirrored more or less the path of y-o-y inflation. However, imported inflation firmed up to 1.5 per cent in March 2016, from -0.7 per cent in March 2015, reflecting market correction of the rupee exchange rate (Chart 4.2 and Table 4.1).
4. Inflation: Developments and Outlook
Inflation DynamicsChart4.1
-1
0
1
2
3
4
5
6
7
8
Mar
-10
Jun-
10
Sep-
10
Dec
-10
Mar
-11
Jun-
11
Sep-
11
Dec
-11
Mar
-12
Jun-
12
Sep-
12
Dec
-12
Mar
-13
Jun-
13
Sep-
13
Dec
-13
Mar
-14
Jun-
14
Sep-
14
Dec
-14
Mar
-15
Jun-
15
Sep-
15
Dec
-15
Mar
-16
Per cent
Headline inflation Y-o-y inflation
Trend (headline inflation) Trend (y-o-y inflation)
Sources: Statistics Mauritius and BoM staff calculations.
4 On 4 February 2016, retail prices of Mogas (motor gasoline) and Gas Oil (diesel) were adjusted down by 6.0 per cent and 9.9 per cent, respectively.
Domestic inflation was subdued amid benign global inflation and soft domestic demand. Headline inflation declined from 2.4 per cent in March 2015 to 0.9 per cent in March 2016, its lowest value since June 1988. Year-on-year inflation was rather volatile, even falling in negative territory, at -0.5 per cent in February 2016, attributed partly to downward base effect. It, however, rebounded to 0.9 per cent in March 2016, reflecting the increase in vegetable prices. Headline inflation is expected to increase to around 2.3 per cent in 2016, amid muted energy prices, subdued global food inflation and slack in the domestic economy. Growth is projected at 3.8 per cent for 2016 but is subject to downside risks stemming mainly from implementation delays for public infrastructure projects and bottlenecks in private sector projects as well as ongoing corporate deleveraging.
Goods and Services Inflation (y-o-y)Chart4.2
-2
-1
0
1
2
3
4
5
6
7
Mar
-13
May
-13
Jul-1
3
Sep-
13
Nov
-13
Jan-
14
Mar
-14
May
-14
Jul-1
4
Sep-
14
Nov
-14
Jan-
15
Mar
-15
May
-15
Jul-1
5
Sep-
15
Nov
-15
Jan-
16
Mar
-16
Per cent
CPIX_M Imported inflation Goods inflation Services inflation
Sources: Statistics Mauritius and BoM staff calculations.

26 | Bank of Mauritius
On a 12-month average basis, goods inflation eased from 2.5 per cent in March 2015 to 1.2 per cent in March 2016. In the same vein, services inflation fell from 2.0 per cent to 0.3 per cent. Both CPIX_M and imported inflation also witnessed a downward bias from March 2015 to March 2016 (Table 4.2).
Underlying inflation measures have lately pointed to some signs of price pressures, as evidenced by the evolution of the CORE2 measure of inflation. Y-o-y CORE2 inflation
firmed to 2.5 per cent in March 2016, from 1.6 per cent in March 2015. Y-o-y CORE1 inflation trailed CORE2 inflation on a similar pattern and stood at 0.6 per cent in March 2016, up from 0.3 per cent in March 2015. The higher CORE2 inflation rate compared to CORE1 inflation could possibly reflect some price rigidities (Chart 4.3). Based on the 12-month average methodology, the core measures broadly mirrored the path of headline inflation.
4. Inflation: Developments and Outlook
Table 4.2: Measures of Inflation (per cent, 12-month average)
Period Food price inflation CPIX_M* Imported
inflationGoods
inflationServices inflation CORE1 CORE2
Mar-15 3.8 2.5 1.7 2.5 2.0 1.7 2.6Apr-15 3.8 2.3 1.4 2.4 1.8 1.5 2.5May-15 3.6 2.0 1.1 2.2 1.6 1.3 2.3Jun-15 3.2 1.8 0.9 1.9 1.3 1.1 2.3Jul-15 2.9 1.6 0.8 1.7 1.1 0.9 2.1Aug-15 2.6 1.4 0.6 1.5 0.9 0.7 2.0Sep-15 2.6 1.3 0.5 1.4 0.7 0.6 1.9Oct-15 2.9 1.3 0.4 1.5 0.6 0.5 1.8Nov-15 3.1 1.3 0.3 1.6 0.4 0.4 1.7Dec-15 3.3 1.4 0.4 1.8 0.3 0.4 1.7Jan-16 2.8 1.4 0.6 1.7 0.4 0.6 2.0Feb-16 1.7 1.2 0.8 1.4 0.4 0.7 2.1Mar-16 1.2 1.1 1.0 1.2 0.3 0.7 2.1
*Refers to CPI excluding mortgage payments in inflation.Sources: Statistics Mauritius and BoM staff calculations.
Table 4.1: Measures of Inflation (per cent, y-o-y)
Period Food price inflation CPIX_M* Imported
inflationGoods
inflationServices inflation CORE1 CORE2
Mar-15 7.9 2.3 -0.7 3.0 0.7 0.3 1.6Apr-15 7.6 2.2 -0.3 3.1 0.2 0.3 1.6May-15 1.1 0.6 0.1 0.7 0.2 0.5 1.9Jun-15 -1.2 0.4 0.9 0.4 0.1 0.6 2.1Jul-15 0.4 0.7 1.0 0.9 -0.1 0.2 1.6Aug-15 2.1 1.2 1.1 1.5 0.3 0.4 1.7Sep-15 4.3 2.1 1.6 2.8 0.1 0.9 2.0Oct-15 3.3 1.7 0.6 2.0 0.6 0.7 1.8Nov-15 1.8 1.2 0.6 1.5 0.2 0.5 2.0Dec-15 1.7 1.5 1.3 1.8 0.2 1.1 2.3Jan-16 -3.3 0.6 1.6 -0.1 1.3 1.9 3.5Feb-16 -4.4 -0.3 1.6 -0.9 0.4 0.9 2.8Mar-16 1.5 1.2 1.5 1.3 0.3 0.6 2.5
* Refers to CPI excluding mortgage payments in inflation.Sources: Statistics Mauritius and BoM staff calculations.
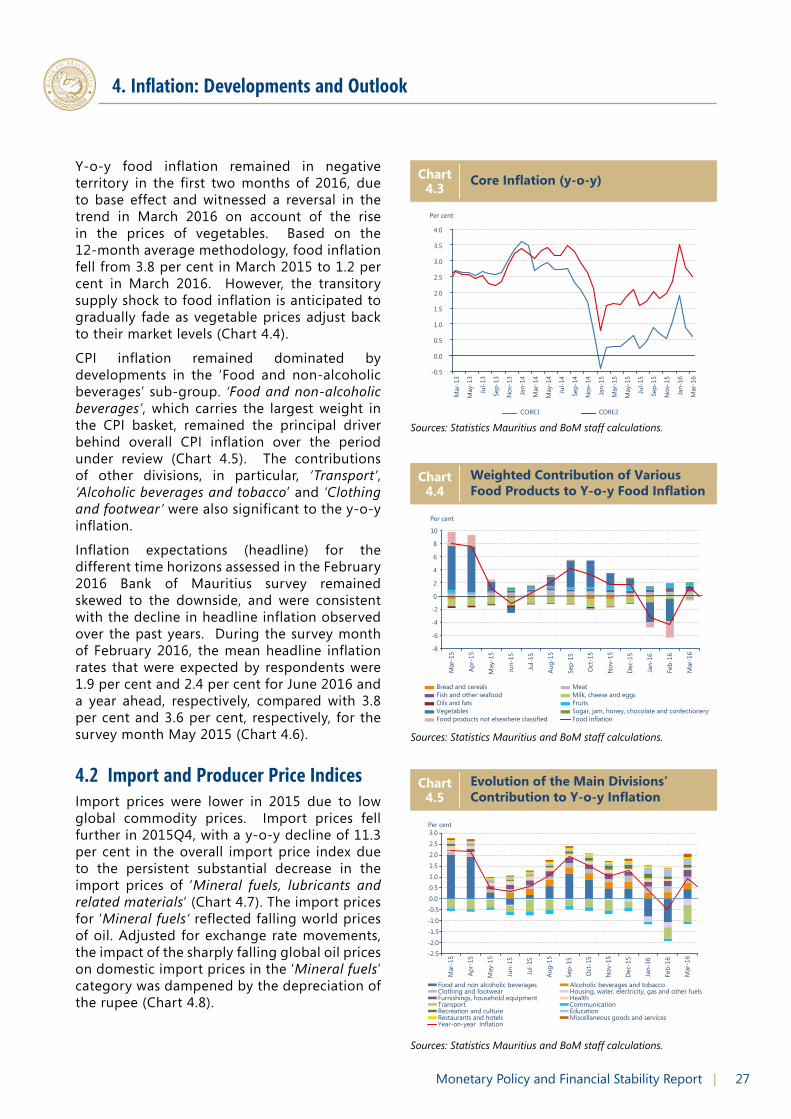
27Monetary Policy and Financial Stability Report |
Y-o-y food inflation remained in negative territory in the first two months of 2016, due to base effect and witnessed a reversal in the trend in March 2016 on account of the rise in the prices of vegetables. Based on the 12-month average methodology, food inflation fell from 3.8 per cent in March 2015 to 1.2 per cent in March 2016. However, the transitory supply shock to food inflation is anticipated to gradually fade as vegetable prices adjust back to their market levels (Chart 4.4).
CPI inflation remained dominated by developments in the ‘Food and non-alcoholic beverages’ sub-group. ‘Food and non-alcoholic beverages’, which carries the largest weight in the CPI basket, remained the principal driver behind overall CPI inflation over the period under review (Chart 4.5). The contributions of other divisions, in particular, ‘Transport’, ‘Alcoholic beverages and tobacco’ and ‘Clothing and footwear’ were also significant to the y-o-y inflation.
Inflation expectations (headline) for the different time horizons assessed in the February 2016 Bank of Mauritius survey remained skewed to the downside, and were consistent with the decline in headline inflation observed over the past years. During the survey month of February 2016, the mean headline inflation rates that were expected by respondents were 1.9 per cent and 2.4 per cent for June 2016 and a year ahead, respectively, compared with 3.8 per cent and 3.6 per cent, respectively, for the survey month May 2015 (Chart 4.6).
4.2 Import and Producer Price IndicesImport prices were lower in 2015 due to low global commodity prices. Import prices fell further in 2015Q4, with a y-o-y decline of 11.3 per cent in the overall import price index due to the persistent substantial decrease in the import prices of ‘Mineral fuels, lubricants and related materials’ (Chart 4.7). The import prices for ‘Mineral fuels’ reflected falling world prices of oil. Adjusted for exchange rate movements, the impact of the sharply falling global oil prices on domestic import prices in the ‘Mineral fuels’ category was dampened by the depreciation of the rupee (Chart 4.8).
4. Inflation: Developments and Outlook
Core Inflation (y-o-y)Chart4.3
-0.5
0.0
0.5
1.0
1.5
2.0
2.5
3.0
3.5
4.0
Mar
-13
May
-13
Jul-1
3
Sep-
13
Nov
-13
Jan-
14
Mar
-14
May
-14
Jul-1
4
Sep-
14
Nov
-14
Jan-
15
Mar
-15
May
-15
Jul-1
5
Sep-
15
Nov
-15
Jan-
16
Mar
-16
Per cent
CORE1 CORE2
Sources: Statistics Mauritius and BoM staff calculations.
Weighted Contribution of VariousFood Products to Y-o-y Food Inflation
Chart4.4
-8
-6
-4
-2
0
2
4
6
8
10
Mar
-15
Apr-
15
May
-15
Jun-
15
Jul-1
5
Aug-
15
Sep-
15
Oct
-15
Nov
-15
Dec
-15
Jan-
16
Feb-
16
Mar
-16
Per cent
Bread and cereals Meat Fish and other seafood Milk, cheese and eggs Oils and fats Fruits Vegetables Sugar, jam, honey, chocolate and confectionery Food products not elsewhere classified Food inflation
Sources: Statistics Mauritius and BoM staff calculations.
Evolution of the Main Divisions’Contribution to Y-o-y Inflation
Chart4.5
-2.5
-2.0
-1.5
-1.0
-0.5
0.0
0.5
1.0
1.5
2.0
2.5
3.0
Mar
-15
Apr-
15
May
-15
Jun-
15
Jul-1
5
Aug-
15
Sep-
15
Oct
-15
Nov
-15
Dec
-15
Jan-
16
Feb-
16
Mar
-16
Per cent
Food and non alcoholic beverages Alcoholic beverages and tobacco Clothing and footwear Housing, water, electricity, gas and other fuels Furnishings, household equipment Health Transport Communication Recreation and culture Education Restaurants and hotels Miscellaneous goods and services Year-on-year Inflation
Sources: Statistics Mauritius and BoM staff calculations.

28 | Bank of Mauritius
At producer price levels too, price pressures remained subdued during 2015. On a y-o-y basis, PPI-Agriculture (PPI-A) inflation, which has been in negative territory since July 2013, increased from -12.8 per cent in June 2015 to peak at 3.8 per cent in October 2015 but eventually subsided to 1.8 per cent in December 2015 amid a higher supply of crop products (Chart 4.9). Y-o-y PPI-Manufacturing (PPI-M) inflation rebounded from -0.7 per cent in December 2014 to 2.3 per cent in December 2015, led principally by prices of ‘Food products and beverages’ (Chart 4.10).
4.3 Inflation Projection and Output Gap - The Baseline Scenario
Global commodity prices are expected to remain subdued in 2016. The latest IMF projections indicate that oil prices are projected to remain close to their average 2015 levels. FAO’s food price index has been following a downward trend over the last few quarters, and compared to 2015 levels, the food price index is expected to fall in 2016 on account of a supply glut. The rupee exchange rate is assumed to remain contained around its current level.
The implementation of announced public and private sector infrastructure projects is expected to provide the required impulses in boosting domestic output in 2016 and going ahead. A more or less similar fiscal stance to 2015/16 is assumed for 2016/17. Following the price cut in petroleum products in February 2016, no further change in prices of administered products is assumed. However, with the gradual strengthening of US economic fundamentals and the US Fed’s signals of potential interest rate hikes in 2016, the US dollar is expected to strengthen against the rupee. The use of negative deposit interest rate policy by the ECB, despite its significant stimulus package, is a clear sign of massive effort being deployed to support growth in the euro area. Over the last few months, the euro vis-à-vis the rupee has been relatively stable and the same trend is projected in the near-term.
Staff’s growth and inflation near-term projections are generated using a Forecasting and Policy Analysis System (FPAS). The core of the FPAS is a quarterly projection model which is a forward-looking open economy calibrated
4. Inflation: Developments and Outlook
-50 -50
-40 -40
-30 -30
-20 -20
-10 -10
0 0
10 10
20 20
30 30
40 40
50 50
1 1 2 2 3 3 4 4 1 1 2 2 3 3 4 4
2014 2014 2015 2015
Food & live animals Food & live animals Beverages & tobacco Beverages & tobacco Crude materials, inedible, except fuels Crude materials, inedible, except fuels Mineral fuels, lubricants & related materials Mineral fuels, lubricants & related materials Animal & vegetable oils, fats & waxes Animal & vegetable oils, fats & waxes Chemical materials & related products Chemical materials & related products Manufactured goods classified chiefly by material Manufactured goods classified chiefly by material Machinery & transport equipment Machinery & transport equipment Miscellaneous manufactured articles Miscellaneous manufactured articles Overall Import Price Index (y-o-y) Overall Import Price Index (y-o-y)
Per cent Per cent
Contribution to Y-o-y Change in Import Prices
Chart4.7
35 35
45 45
55 55
65 65
75 75
85 85
95 95
105 105
115 115
35 35
45 45
55 55
65 65
75 75
85 85
95 95
105 105
115 115
1 1 2 2 3 3 4 4 1 1 2 2 3 3 4 4
2014 2014 2015 2015
Mineral fuels, lubricants and related materials Mineral fuels, lubricants and related materials MERI1 MERI1 Brent crude oil (RHS) Brent crude oil (RHS)
USD per barrel USD per barrel Index Index
Prices of Imported Mineral Fuels, BrentCrude Oil Prices and Adjusted MERI1
Chart4.8
Note: The adjusted MERI1 refers to MERI1 adjusted on its average index in 2013.
4.6 4.6 4.5 4.5
4.2 4.2
3.7 3.7 3.6 3.6
3.2 3.2 2.7 2.7
2.4 2.4
3.8 3.8
3.0 3.0
2.3 2.3
1.9 1.9
1.5 1.5
2.0 2.0
2.5 2.5
3.0 3.0
3.5 3.5
4.0 4.0
4.5 4.5
5.0 5.0
May
-14
May
-14
Aug-
14
Aug-
14
Nov
-14
Nov
-14
Feb-
15
Feb-
15
May
-15
May
-15
Aug-
15
Aug-
15
Nov
-15
Nov
-15
Feb-
16
Feb-
16
Per cent Per cent
Survey months Survey months
A year ahead A year ahead Jun-16 Jun-16
Inflation Expectations Chart4.6
Source: BoM staff calculations.

29Monetary Policy and Financial Stability Report |
general equilibrium gap model in the new Keynesian tradition. The model is reliant on certain key parameters and assumptions.
4.4 Inflation ProjectionThe current low inflation environment characterises tame global commodity prices as well as slackness in the domestic economy. Headline inflation is still forecast to remain at low levels in the short term, oscillating within tight ranges until the end of 2016 but would pick up moderately thereafter, conditional on both external and domestic development assumptions. Subdued inflationary pressures in the economy would also reflect base effects arising out of the previous cuts in energy prices as well as lower-than-expected outturns in the prices of vegetables. On the external front, global commodity prices have maintained their downtrend so far and have contributed to muted imported inflationary pressures. The combined impact of a depreciated rupee exchange rate and a relatively low imported inflation have had modest contribution on the pass-through to the domestic CPI. In the near-term, cost push pressures appear to be well contained due to muted external inflationary pressures, namely from global commodity prices, notwithstanding the wage award in the public sector and any potential spill-over effects for private sector employees.
Headline inflation is expected to firm up from its current level but would remain modest in 2016, barring exceptional shocks. Assuming that the various determinants of inflation move according to the set of assumptions, headline inflation is projected at around 2.3 per cent for 2016 (Chart 4.11).
4.5 Real GDP Growth Projection Growth performance for 2016 is forecast to be better compared to 2015. Bank staff forecast a real GDP growth of 3.8 per cent for 2016 conditional on some specific assumptions (Chart 4.12). The implementation of announced public infrastructure projects and the anticipated boost in private sector investment are projected to contribute to the pick-up in the domestic economy. Investment in major infrastructural projects such as the construction of smart cities, expansion of
4. Inflation: Developments and Outlook
-16 -16
-14 -14
-12 -12
-10 -10
-8 -8
-6 -6
-4 -4
-2 -2
0 0
2 2
4 4
6 6
8 8
Jan-
14
Jan-
14
Feb-
14
Feb-
14
Mar
-14
Mar
-14
Apr-
14
Apr-
14
May
-14
May
-14
Jun-
14
Jun-
14
Jul-1
4 Ju
l-14
Aug-
14
Aug-
14
Sep-
14
Sep-
14
Oct
-14
Oct
-14
Nov
-14
Nov
-14
Dec
-14
Dec
-14
Jan-
15
Jan-
15
Feb-
15
Feb-
15
Mar
-15
Mar
-15
Apr-
15
Apr-
15
May
-15
May
-15
Jun-
15
Jun-
15
Jul-1
5 Ju
l-15
Aug-
15
Aug-
15
Sep-
15
Sep-
15
Oct
-15
Oct
-15
Nov
-15
Nov
-15
Dec
-15
Dec
-15
Per cent Per cent
Sugarcane Sugarcane Other crops products Other crops products Animals and animal products Animals and animal products Overall index (y-o-y) Overall index (y-o-y)
Contribution of CommodityGroups to PPI-A
Chart4.9
-1.2 -1.2
-0.8 -0.8
-0.4 -0.4
0.0 0.0
0.4 0.4
0.8 0.8
1.2 1.2
1.6 1.6
2.0 2.0
2.4 2.4
Jan-
14
Jan-
14
Feb-
14
Feb-
14
Mar
-14
Mar
-14
Apr-
14
Apr-
14
May
-14
May
-14
Jun-
14
Jun-
14
Jul-1
4 Ju
l-14
Aug-
14
Aug-
14
Sep-
14
Sep-
14
Oct
-14
Oct
-14
Nov
-14
Nov
-14
Dec
-14
Dec
-14
Jan-
15
Jan-
15
Feb-
15
Feb-
15
Mar
-15
Mar
-15
Apr-
15
Apr-
15
May
-15
May
-15
Jun-
15
Jun-
15
Jul-1
5 Ju
l-15
Aug-
15
Aug-
15
Sep-
15
Sep-
15
Oct
-15
Oct
-15
Nov
-15
Nov
-15
Dec
-15
Dec
-15
Per cent Per cent
Food products and beverages Food products and beverages Chemicals and chemical products Chemicals and chemical products Other manufacturing Other manufacturing Overall index (y-o-y) Overall index (y-o-y)
Contribution of Main IndustryGroups to PPI-M
Chart4.10
1.0 1.0
1.5 1.5
2.0 2.0
2.5 2.5
3.0 3.0
3.5 3.5
4.0 4.0
4.5 4.5
5.0 5.0
5.5 5.5
6.0 6.0
1 1 2 2 3 3 4 4 1 1 2 2 3 3 4 4 1 1 2 2 3 3 4 4 1 1 2 2 3 3 4 4 1 1 2 2 3 3 4 4
2012 2012 2013 2013 2014 2014 2015 2015 2016 2016
Per cent Per cent
Headline InflationChart4.11

30 | Bank of Mauritius
the road network, and hotel construction would potentially have significant multiplier effects on economic activity and ought to give the necessary impetus to growth. Gross domestic fixed capital formation is forecast to grow in 2016 after four consecutive years of decline as a result of stronger support from investment.
Specific sectoral contributions to growth would enable the closing of the negative output gap. After several years of contraction, the construction sector is projected to rebound by 2.0 per cent, propelled by the implementation of major projects in the public and private sectors. The tourism sector is expected to benefit from the Air Corridor between Asia and Africa launched in March 2016 and which aims at enhancing air connectivity and access in the African region. Ongoing domestic efforts to diversify traditional export markets are expected to support external demand. Other positive factors that are expected to support real GDP growth over the projection period include an accommodative monetary policy stance and a supportive fiscal policy. Downside risks to the domestic growth outlook, nonetheless, would remain. Notable headwinds to real GDP growth would reflect delays in launching the announced public infrastructure projects and lagging private sector projects; longer-than-expected corporate deleveraging that may act as a hindrance to domestic private investment ventures; economic adjustments in emerging economies; and volatile US dollar movements.
4.6 Balance of RisksEvery forecast is subject to the occurrence of unanticipated events that may divert the forecast from the baseline scenario. The materialisation of the occurrences can result in a different inflation path. Risks to the baseline projections are weighted to the upside, to the downside, or are broadly balanced. The main events that could most likely divert the inflation rate from the baseline scenario include:
• Lower global growth. Uncertainty over a firm global growth outcome for 2016 clouds the macroeconomic projection, raising some concerns on the performance of the domestic economy. The IMF’s April 2016 WEO forecasts global growth at 3.2 per
cent for 2016. However, risks to the global growth outlook continue to be skewed to the downside and pertain to a broad and deeper slowdown in emerging market economies, the rebalancing of economic activity in China, lower commodity prices, and interest rate normalisation in the US. Should these risks materialise, global growth would be lower than projected and recovery to trend growth would take longer, thereby culminating into lower external impulse and a higher negative domestic output gap which would exert lower pressures on domestic price formation.
• Demand shock. A negative demand shock reflecting the delayed implementation of both public and private sector infrastructure projects would bring about a lower growth outcome and widen further the already negative output gap. In turn, this would lead
4. Inflation: Developments and Outlook
Weaker global growth Greater volatility in international
capital markets
Slowdown in domestic demand
Unforeseen cost push factors
Per cent
2016Q2 2016Q4
-0.2 -0.2
-0.1 -0.1
0.0 0.0
0.1 0.1
0.2 0.2
0.3 0.3
0.4 0.4
Balance of Risksto the Inflation Outlook
Chart4.13
2.8 2.8
2.9 2.9
3.0 3.0
3.1 3.1
3.2 3.2
3.3 3.3
3.4 3.4
3.5 3.5
3.6 3.6
3.7 3.7
3.8 3.8
3.9 3.9
4.0 4.0
1 2 3 4 1 2 3 4 1 2 3 4 1 2 3 4 1 2 3 4
2012 2013 2014 2015 2016
Per cent Per cent
Average Real GDP GrowthChart4.12

31Monetary Policy and Financial Stability Report |
to lower inflation over the forecast horizon. Although projects to the tune of billions of rupees have already been approved, the actual impact on growth would depend on the pace at which these projects are implemented. Persisting implementation issues suggest that the expansion in public investment may not be as high as expected. A longer-than-expected domestic recovery will most likely result in a more benign inflation outcome than under the baseline scenario.
• Domestic supply shock. Cost-push factors such as the 2016 PRB award for public sector employees and specific supply-side shocks, on account of climatic factors, could generate upward pressure on the prices of some goods and services. Increases in wages in excess of inflation indexation and productivity gains remain a major upside risk to the inflation outlook.
• Increased volatility and uncertainty in international financial markets. Increased volatility and uncertainty in international financial markets arising from expectations of normalisation of the US Fed’s policy rate could generate further downward pressure on the rupee that would affect inflation on the upside through the pass-through effect.
Staff assessment is that, for the year 2016, based on alternative projections, the balance of risks to the inflation outlook appears tilted marginally on the upside on account of unforeseen cost push factors. The probability that inflation will divert above the forecast in the baseline scenario is estimated to be higher than the probability that it will divert below this forecast. Chart 4.13 shows the impact of the individual risk factors on the inflation outcome for 2016, measured as the difference between the baseline scenario’s projected inflation rate and the inflation rate that would prevail under materialisation of the above-mentioned specific shocks, but adjusted for the probability of occurrence of these shocks. Each bar in the chart illustrates the magnitude and direction of the impact of these factors. The balance of risk is derived by taking the sum across the various effects, and shows the deviation of the inflation projection from the baseline scenario.
4. Inflation: Developments and Outlook

32 | Bank of Mauritius
4. Inflation: Developments and Outlook
Statement on Price StabilityThe Bank’s monetary policy stance has remained accommodative, reflecting subdued domestic real output growth and tame inflationary pressures.
The Bank’s Monetary Policy Committee (MPC) unanimously reduced the Key Repo Rate (KRR) by 25 basis points to 4.40 per cent at its November 2015 meeting to support domestic economic activity. At its February 2016 meeting, the MPC kept the KRR unchanged by majority vote, arguing that the monetary policy stance was broadly appropriate and that the reduction in the KRR effected last November had yet to work through the economy.
Over the 12-month period ended March 2016, inflation as well as various derived inflation indicators have dropped to low levels and remained range bound. Inflation fell to 0.8 per cent in March 2016, the lowest in over two decades. Year-on-year inflation dropped to a historically low of -0.5 per cent in February 2016 before increasing to 0.9 per cent in March 2016. Falling global commodity prices, weak global economic activity and subdued domestic demand conditions had been the broad factors underpinning low inflationary pressures in the domestic economy. In addition, inflation expectations appeared to be well contained.
The inflation outlook is relatively moderate and, in the absence of any major shock, inflation is expected to remain at relatively low levels. Based on a set of assumptions, inflation is projected at around 2 per cent for the year 2016.
The economy has been operating below its potential and is characterised by the presence of structural bottlenecks that have been a major drag on growth prospects. Domestic productivity levels and trends and wage developments in the economy are diverging and not supporting the growth agenda. Bank staff is projecting a real GDP growth rate of 3.8 per cent for 2016, on grounds of accelerated investments.
The Bank has taken several initiatives as from 2015 to address the disruptive effects that high excess liquidity has had on the efficacy of the monetary policy transmission mechanism. For quite some years, excess liquidity inhibited the influence of the KRR on market interest rates. As from early 2015, the Bank conducted more frequent monetary operations by issuing securities and by carrying out sterilised interventions in the domestic foreign exchange market to keep excess liquidity in check. Meanwhile, the Bank has been working on a new monetary policy framework with the aim of enhancing the transmission of monetary policy signals to the market and, ultimately, to the economy. The new monetary policy framework will be implemented in the near future.
The exchange rate channel has facilitated an enabling environment to support the export sector. The effects of loose monetary conditions and favourable exchange rate movements are yet to be fully felt on inflation as transmission channels are assessed to operate over a twelve to eighteen-month period.
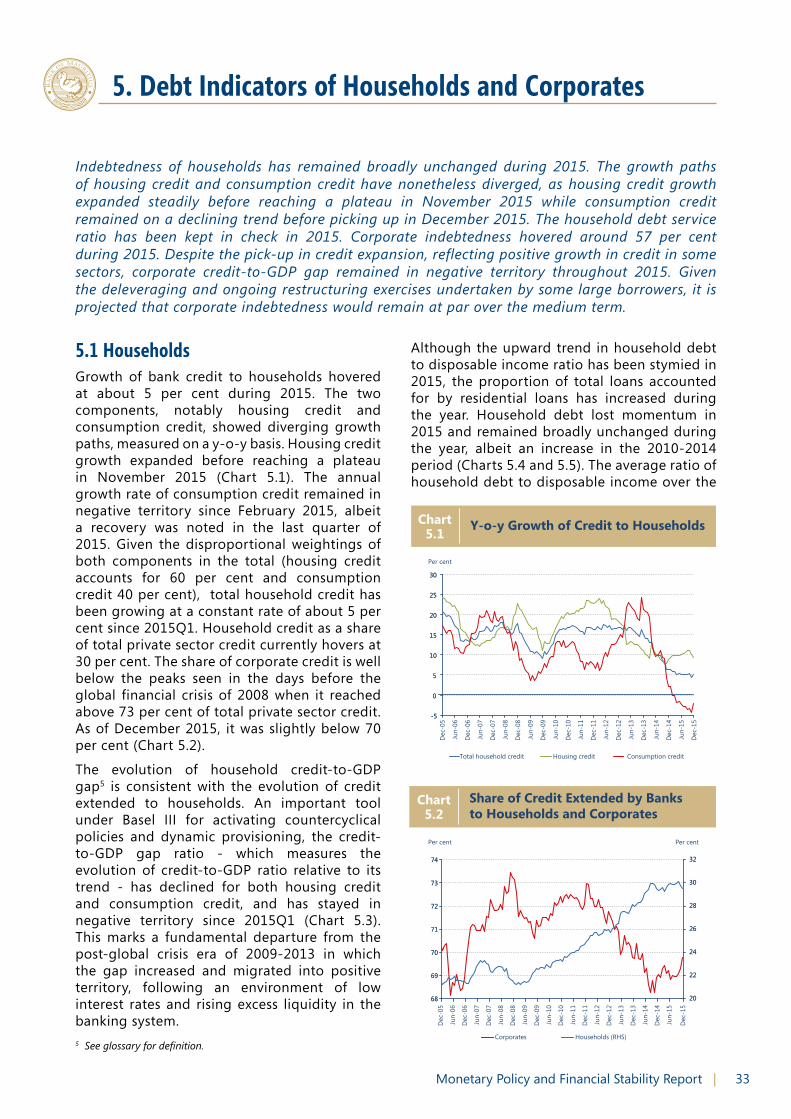
33Monetary Policy and Financial Stability Report |
Indebtedness of households has remained broadly unchanged during 2015. The growth paths of housing credit and consumption credit have nonetheless diverged, as housing credit growth expanded steadily before reaching a plateau in November 2015 while consumption credit remained on a declining trend before picking up in December 2015. The household debt service ratio has been kept in check in 2015. Corporate indebtedness hovered around 57 per cent during 2015. Despite the pick-up in credit expansion, reflecting positive growth in credit in some sectors, corporate credit-to-GDP gap remained in negative territory throughout 2015. Given the deleveraging and ongoing restructuring exercises undertaken by some large borrowers, it is projected that corporate indebtedness would remain at par over the medium term.
5. Debt Indicators of Households and Corporates
5.1 HouseholdsGrowth of bank credit to households hovered at about 5 per cent during 2015. The two components, notably housing credit and consumption credit, showed diverging growth paths, measured on a y-o-y basis. Housing credit growth expanded before reaching a plateau in November 2015 (Chart 5.1). The annual growth rate of consumption credit remained in negative territory since February 2015, albeit a recovery was noted in the last quarter of 2015. Given the disproportional weightings of both components in the total (housing credit accounts for 60 per cent and consumption credit 40 per cent), total household credit has been growing at a constant rate of about 5 per cent since 2015Q1. Household credit as a share of total private sector credit currently hovers at 30 per cent. The share of corporate credit is well below the peaks seen in the days before the global financial crisis of 2008 when it reached above 73 per cent of total private sector credit. As of December 2015, it was slightly below 70 per cent (Chart 5.2).
The evolution of household credit-to-GDP gap5 is consistent with the evolution of credit extended to households. An important tool under Basel III for activating countercyclical policies and dynamic provisioning, the credit-to-GDP gap ratio - which measures the evolution of credit-to-GDP ratio relative to its trend - has declined for both housing credit and consumption credit, and has stayed in negative territory since 2015Q1 (Chart 5.3). This marks a fundamental departure from the post-global crisis era of 2009-2013 in which the gap increased and migrated into positive territory, following an environment of low interest rates and rising excess liquidity in the banking system.
Although the upward trend in household debt to disposable income ratio has been stymied in 2015, the proportion of total loans accounted for by residential loans has increased during the year. Household debt lost momentum in 2015 and remained broadly unchanged during the year, albeit an increase in the 2010-2014 period (Charts 5.4 and 5.5). The average ratio of household debt to disposable income over the
-5 -5
0 0
5 5
10 10
15 15
20 20
25 25
30 30
Dec
-05
Jun-
06
Dec
-06
Jun-
07
Dec
-07
Jun-
08
Dec
-08
Jun-
09
Dec
-09
Jun-
10
Dec
-10
Jun-
11
Dec
-11
Jun-
12
Dec
-12
Jun-
13
Dec
-13
Jun-
14
Dec
-14
Jun-
15
Dec
-15
Total household credit Housing credit Consumption credit
Per cent
Y-o-y Growth of Credit to HouseholdsChart5.1
20 20
22 22
24 24
26 26
28 28
30 30
32 32
68 68
69 69
70 70
71 71
72 72
73 73
74 74
Corporates Households (RHS)
Per cent Per cent
Dec
-05
Jun-
06
Dec
-06
Jun-
07
Dec
-07
Jun-
08
Dec
-08
Jun-
09
Dec
-09
Jun-
10
Dec
-10
Jun-
11
Dec
-11
Jun-
12
Dec
-12
Jun-
13
Dec
-13
Jun-
14
Dec
-14
Jun-
15
Dec
-15
Share of Credit Extended by Banksto Households and Corporates
Chart5.2
5 See glossary for definition.

34 | Bank of Mauritius
last five years is approximately the same as in comparator countries like Namibia and South Africa (Chart 5.6). However, a word of caution in interpretation should be flagged here as international comparisons are not always straightforward as countries may have different systems for capturing funding information on household indebtedness. Residential real estate loans - a crucial component of household credit - have maintained their upward trajectory during the year. The ratio of residential real estate loans to total loans extended by both banks and non-bank deposit-taking institutions rose from 6.2 per cent as at end-December 2014 to 9.1 per cent as at end-December 2015. Possible explanations include: a lower interest rate environment coupled with tougher competition and campaigns accompanied by teaser rates during the first few years of the loans. Despite a breather in 2014 when a drop in the ratio of residential real estate loans to total loans was registered following the implementation of macroprudential limits, it would appear that demand conditions had strengthened in 2015.
The household debt service ratio has been kept in check in 2015 after having peaked in 2014. The debt service ratio - measured as debt service to disposable income - has remained broadly unchanged over the period under review, with a mild episodic drop noted during 2015Q1 and an uptick noted in 2015Q4. The debt service ratio hovered around 17 per cent in 2015Q4 - more or less unchanged from 2015Q1 (Chart 5.7). The proportion of disposable income that goes towards debt servicing is a crucial coverage metric assessing ability of borrowers to pay back their contractual loan commitments. This ratio has been generally significantly above the figures from selected comparator countries, with the exception of the year 2011 (Chart 5.8). This metric is extremely sensitive to growth trajectories and tax and allowance policies, given the relative stability of the numerator variable, barring financial restructurings.
5.2 CorporatesCorporate debt to GDP ratio increased in 2015. Corporate debt varied somewhat on account of the evolution of domestic corporate debt while corporate external debt has remained generally unchanged. Total corporate debt as
5. Debt Indicators of Households and Corporates
Alternative Estimates ofHousehold Indebtedness Ratio
Chart5.5
0
10
20
30
40
50
60
70
80
90
2 3 4 1 2 3 4 1 2 3 4 1 2 3 4 1 2 3 4 1 2 3 4 1 2 3 4
2009 2010 2011 2012 2013 2014 2015
Household credit from banks/disposable income Total household credit/disposable income
Per cent
-1.4 -1.4 -1.2 -1.2 -1.0 -1.0 -0.8 -0.8 -0.6 -0.6 -0.4 -0.4 -0.2 -0.2 0.0 0.0 0.2 0.2 0.4 0.4 0.6 0.6 0.8 0.8 1.0 1.0 1.2 1.2 1.4 1.4
2 3 4 1 2 3 4 1 2 3 4 1 2 3 4 1 2 3 4 1 2 3 4 1 2 3 4 1 2 3 4 1 2 3 4 1 2 3 4 1 2 3 4 1 2 3 4 1 2 3 4
2003 2004 2005 2006 2007 2008 2009 2010 2011 2012 2013 2014 2015
Households Housing Consumption
Per cent
Household Credit-to-GDP GapChart5.3
Household Debt to Disposable IncomeChart5.4
0
5
10
15
20
25
30
35
40
45
50
55
60
1 2 3 4 1 2 3 4 1 2 3 4 1 2 3 4 1 2 3 4 1 2 3 4
2010 2011 2012 2013 2014 2015
Consumption credit/disposable income Housing credit/disposable income
Household credit from banks/disposable income
Per cent
Note: Total household credit includes credit from banks, non-bank deposit-taking institutions and insurance companies.
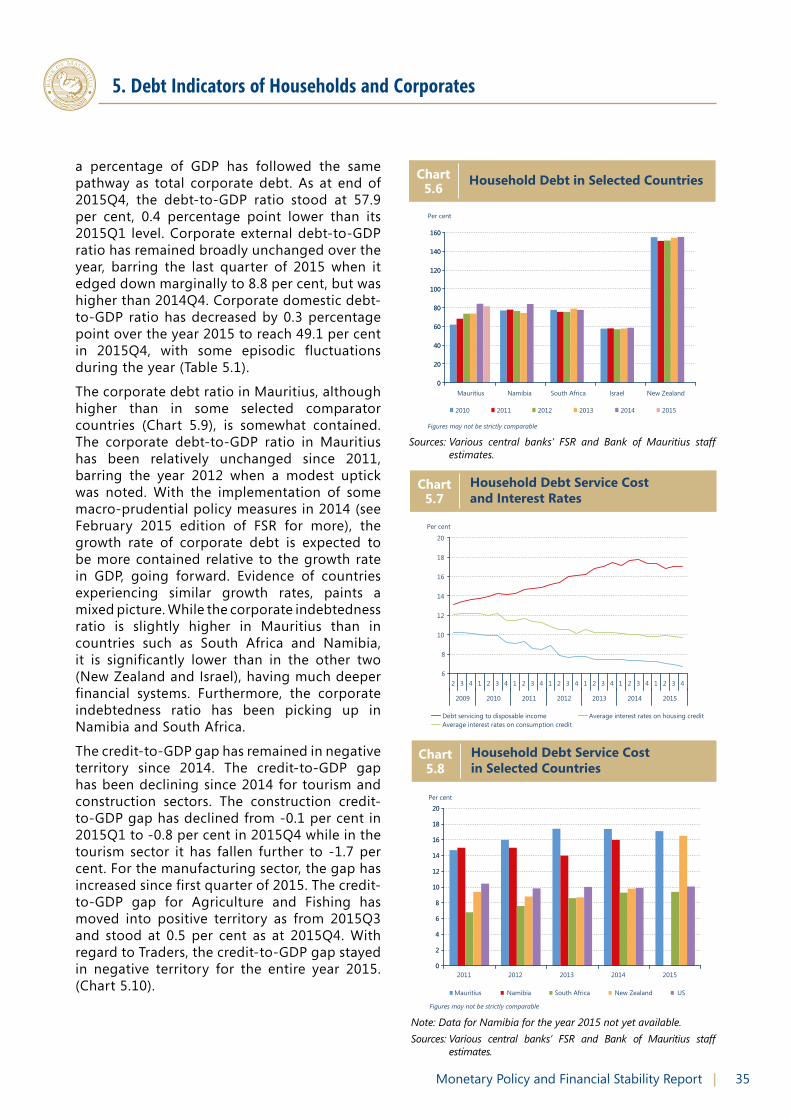
35Monetary Policy and Financial Stability Report |
a percentage of GDP has followed the same pathway as total corporate debt. As at end of 2015Q4, the debt-to-GDP ratio stood at 57.9 per cent, 0.4 percentage point lower than its 2015Q1 level. Corporate external debt-to-GDP ratio has remained broadly unchanged over the year, barring the last quarter of 2015 when it edged down marginally to 8.8 per cent, but was higher than 2014Q4. Corporate domestic debt-to-GDP ratio has decreased by 0.3 percentage point over the year 2015 to reach 49.1 per cent in 2015Q4, with some episodic fluctuations during the year (Table 5.1).
The corporate debt ratio in Mauritius, although higher than in some selected comparator countries (Chart 5.9), is somewhat contained. The corporate debt-to-GDP ratio in Mauritius has been relatively unchanged since 2011, barring the year 2012 when a modest uptick was noted. With the implementation of some macro-prudential policy measures in 2014 (see February 2015 edition of FSR for more), the growth rate of corporate debt is expected to be more contained relative to the growth rate in GDP, going forward. Evidence of countries experiencing similar growth rates, paints a mixed picture. While the corporate indebtedness ratio is slightly higher in Mauritius than in countries such as South Africa and Namibia, it is significantly lower than in the other two (New Zealand and Israel), having much deeper financial systems. Furthermore, the corporate indebtedness ratio has been picking up in Namibia and South Africa.
The credit-to-GDP gap has remained in negative territory since 2014. The credit-to-GDP gap has been declining since 2014 for tourism and construction sectors. The construction credit-to-GDP gap has declined from -0.1 per cent in 2015Q1 to -0.8 per cent in 2015Q4 while in the tourism sector it has fallen further to -1.7 per cent. For the manufacturing sector, the gap has increased since first quarter of 2015. The credit-to-GDP gap for Agriculture and Fishing has moved into positive territory as from 2015Q3 and stood at 0.5 per cent as at 2015Q4. With regard to Traders, the credit-to-GDP gap stayed in negative territory for the entire year 2015. (Chart 5.10).
5. Debt Indicators of Households and Corporates
0 0
20 20
40 40
60 60
80 80
100 100
120 120
140 140
160 160
Mauritius Namibia South Africa Israel New Zealand
2010 2011 2012 2013 2014 2015
Per cent
Household Debt in Selected CountriesChart5.6
Figures may not be strictly comparable
Household Debt Service Cost and Interest Rates
Chart5.7
6
8
10
12
14
16
18
20
2 3 4 1 2 3 4 1 2 3 4 1 2 3 4 1 2 3 4 1 2 3 4 1 2 3 4
2009 2010 2011 2012 2013 2014 2015
Debt servicing to disposable income Average interest rates on housing credit Average interest rates on consumption credit
Per cent
Sources: Various central banks’ FSR and Bank of Mauritius staff estimates.
0 0
2 2
4 4
6 6
8 8
10 10
12 12
14 14
16 16
18 18
20 20
2011 2012 2013 2014 2015
Mauritius Namibia South Africa New Zealand US
Per cent
Figures may not be strictly comparable
Household Debt Service Costin Selected Countries
Chart5.8
Note: Data for Namibia for the year 2015 not yet available.
Sources: Various central banks’ FSR and Bank of Mauritius staff estimates.

36 | Bank of Mauritius
The percentage of GDP accounted for by credit to corporates and households during 2015 was broadly in line with preceding years. Tourism and Housing continued to occupy the lion’s share of corporate and household credit, respectively. Notwithstanding positive annual growth figures, credit to manufacturing and to trade witnessed a mild decline as a share of GDP during 2015 due to de-leveraging following restructuring exercises in these sectors. In parallel, these sectors are extremely exposed to materialization of external risks, including a slowdown in the growth performance of the main trading partners of Mauritius (Table 5.2).
5. Debt Indicators of Households and Corporates
Table 5.1: Domestic and External Corporate Debt2014 2015
Q1 Q2 Q3 Q4 Q1 Q2 Q3 Q4*(Rs million)
Total Corporate Debt 187,640 204,863 208,477 222,910 228,227 225,122 228,980 235,397 Corporate External Debt 21,929 21,680 19,367 33,249 35,051 35,697 36,086 35,721 Short Term1 3,086 3,534 4,051 4,115 4,140 4,168 4,162 4,136 Long Term2 18,843 18,146 15,315 29,134 30,911 31,528 31,924 31,584 Corporate Domestic Debt 165,711 183,183 189,110 189,661 193,175 189,425 192,894 199,677
(Per cent of total corporate debt)
Total Corporate Debt 100 100 100 100 100 100 100 100 Corporate External Debt 11.7 10.6 9.3 14.9 15.4 15.9 15.8 15.2 Short Term1 1.6 1.7 1.9 1.8 1.8 1.9 1.8 1.8Long Term2 10.0 8.9 7.3 13.1 13.5 14.0 13.9 13.4Corporate Domestic Debt 88.3 89.4 90.7 85.1 84.6 84.1 84.2 84.8
(Per cent of GDP)
Total Corporate Debt 58.0 59.6 56.9 57.7 58.3 57.0 57.2 57.9Corporate External Debt 6.8 6.3 5.3 8.6 9.0 9.0 9.0 8.8Short Term1 1.0 1.0 1.1 1.1 1.1 1.1 1.0 1.0Long Term2 5.8 5.3 4.2 7.5 7.9 8.0 8.0 7.8Corporate Domestic Debt 51.3 53.3 51.6 49.1 49.4 47.9 48.2 49.1
* Provisional.1 Refers mainly to trade credit as recorded in Balance of Payments statistics.2 Excluding loans of Global Business Companies.Sources: Mauritius SDDS country page and Bank of Mauritius.
0
15
30
45
60
75
90
105
120
135
Mauritius South Africa Namibia New Zealand Israel
2011 2012 2013 2014 2015
Per cent of GDP
Corporate Debt to GDP Ratioin Selected Countries
Chart5.9
Figures may not be strictly comparable
Sources: Various central banks’ FSR and Bank of Mauritius staff estimates.

37Monetary Policy and Financial Stability Report |
5. Debt Indicators of Households and Corporates
-5.0 -5.0
-4.0 -4.0
-3.0 -3.0
-2.0 -2.0
-1.0 -1.0
0.0 0.0
1.0 1.0
2.0 2.0
3.0 3.0
4.0 4.0
5.0 5.0
1 1 2 2 3 3 4 4 1 1 2 2 3 3 4 4 1 1 2 2 3 3 4 4 1 1 2 2 3 3 4 4 1 1 2 2 3 3 4 4 1 1 2 2 3 3 4 4 1 1 2 2 3 3 4 4 1 1 2 2 3 3 4 4 1 1 2 2 3 3 4 4 1 1 2 2 3 3 4 4
2006 2006 2007 2007 2008 2008 2009 2009 2010 2010 2011 2011 2012 2012 2013 2013 2014 2014 2015 2015
Per cent Per cent TOTAL CORPORATE CREDITTOTAL CORPORATE CREDIT
-2.0 -2.0
-1.5 -1.5
-1.0 -1.0
-0.5 -0.5
0.0 0.0
0.5 0.5
1.0 1.0
1.5 1.5
2.0 2.0
1 2 3 4 1 2 3 4 1 2 3 4 1 2 3 4 1 2 3 4 1 2 3 4 1 2 3 4 1 2 3 4 1 2 3 4 1 2 3 4
2006 2007 2008 2009 2010 2011 2012 2013 2014 2015
Per cent Per cent CONSTRUCTIONCONSTRUCTION
-0.8 -0.8
-0.6 -0.6
-0.4 -0.4
-0.2 -0.2
0.0 0.0
0.2 0.2
0.4 0.4
0.6 0.6
0.8 0.8
1 1 2 2 3 3 4 4 1 1 2 2 3 3 4 4 1 1 2 2 3 3 4 4 1 1 2 2 3 3 4 4 1 1 2 2 3 3 4 4 1 1 2 2 3 3 4 4 1 1 2 2 3 3 4 4 1 1 2 2 3 3 4 4 1 1 2 2 3 3 4 4 1 1 2 2 3 3 4 4
2006 2007 2008 2009 2010 2011 2012 2013 2014 2015
Per cent Per cent
-2.5 -2.5
-2.0 -2.0
-1.5 -1.5
-1.0 -1.0
-0.5 -0.5
0.0 0.0
0.5 0.5
1.0 1.0
1.5 1.5
2.0 2.0
2.5 2.5
1 2 3 4 1 2 3 4 1 2 3 4 1 2 3 4 1 2 3 4 1 2 3 4 1 2 3 4 1 2 3 4 1 2 3 4 1 2 3 4
2006 2007 2008 2009 2010 2011 2012 2013 2014 2015
Per cent Per cent
-1.6 -1.6
-1.2 -1.2
-0.8 -0.8
-0.4 -0.4
0.0 0.0
0.4 0.4
0.8 0.8
1 1 2 2 3 3 4 4 1 1 2 2 3 3 4 4 1 1 2 2 3 3 4 4 1 1 2 2 3 3 4 4 1 1 2 2 3 3 4 4 1 1 2 2 3 3 4 4 1 1 2 2 3 3 4 4 1 1 2 2 3 3 4 4 1 1 2 2 3 3 4 4 1 1 2 2 3 3 4 4
2006 2007 2008 2009 2010 2011 2012 2013 2014 2015
Per cent Per cent
-1.5 -1.5
-1.0 -1.0
-0.5 -0.5
0.0 0.0
0.5 0.5
1.0 1.0
1.5 1.5
1 2 3 4 1 2 3 4 1 2 3 4 1 2 3 4 1 2 3 4 1 2 3 4 1 2 3 4 1 2 3 4 1 2 3 4 1 2 3 4
2006 2007 2008 2009 2010 2011 2012 2013 2014 2015
Per cent Per cent
MANUFACTURINGMANUFACTURING TOURISMTOURISM
AGRICULTURE AND FISHINGAGRICULTURE AND FISHING TRADERSTRADERS
Credit-to-GDP GapChart5.10

38 | Bank of Mauritius
5. Debt Indicators of Households and Corporates
Table 5.2. Distribution of Credit to the Private Sector2006-2012 2013 2014 2015Q1 2015Q2 2015Q3 2015Q4
Per cent of GDP
Total credit to private sector 66.6 74.0 71.0 71.1 71.1 69.7 71.0Corporates 47.9 51.6 49.0 49.4 49.2 48.0 49.1 Agriculture and fishing 4.5 5.2 4.9 4.6 4.9 4.6 4.9 Manufacturing 6.2 5.3 4.9 5.4 4.8 4.8 4.9 Tourism 11.4 13.3 12.3 11.9 12.8 12.4 12.3 Construction (ex housing) 5.4 8.1 7.9 8.0 8.1 7.8 7.9 Traders 8.6 7.9 8.1 7.9 8.3 8.0 8.1 Financial and business services 7.3 7.3 6.5 7.0 6.2 5.9 6.5Households 15.4 20.7 20.8 20.8 20.8 20.9 20.8 Housing 8.9 12.4 12.8 12.9 12.5 12.6 12.8 Consumption 6.5 8.3 8.0 7.8 8.3 8.3 8.0
(Average annual growth rates, per cent)
Total credit to private sector 12.1 5.9 1.3 2.6 2.7 5.2 4.2Corporates 12.5 3.2 0.3 2.3 2.0 5.5 5.3 Agriculture and fishing 12.7 5.0 0.7 -8.7 -3.7 6.1 12.1 Manufacturing 3.7 2.2 -2.2 11.6 10.2 10.2 12.0 Tourism 16.3 8.8 -2.4 -3.5 -1.4 1.8 1.4 Construction (ex housing) 27.7 10.9 3.4 6.7 2.6 7.0 4.0 Traders 9.4 -7.6 9.0 8.4 -4.3 1.6 1.0 Financial and business services 13.1 5.4 -7.0 -0.5 7.1 13.4 6.8Households 15.1 15.0 6.2 5.8 5.5 5.2 5.0 Housing 17.7 11.1 8.9 9.9 10.1 11.1 9.4 Consumption 11.8 21.3 2.1 -0.2 -2.4 -3.7 -2.1

39Monetary Policy and Financial Stability Report |
6.1 Banking Sector
OverviewThe total assets of the banking sector declined by 6.3 per cent at end-March 2016, compared to a growth of 21.8 per cent as at end-March 2015 (Table 6.1 and Chart 6.1). Domestic assets held by both domestic-owned and foreign-owned banks rose by 4.7 per cent, whilst foreign assets contracted by 13.9 per cent, with different asset growth trajectories for domestic and foreign banks. Foreign assets held by domestic banks increased by 18.3 per cent at end-March 2016, while those of subsidiaries and branches decreased by 20.6 per cent and 47.9 per cent, respectively. The upward trend in banks’ domestic assets is partly explained by the advances granted to the private sector and Global Business Companies as well as investments in liquid assets.
6. Developments in the Financial Sector
Table 6.1: Banks’ Assets, 2014-2016Growth rates of assets
(Per cent)Assets (contribution to asset growth)
(Per cent)
I. Foreign AssetsMar-14 Mar-15 Mar-16 Mar-14 Mar-15 Mar-16
Domestic banks 13.5 49.5 18.3 Domestic banks 1.2 4.6 2.1Subsidiary 0.2 34.5 -20.6 Subsidiary 0.1 14.2 -9.4Branch 24.7 -36.4 -47.9 Branch 0.8 -1.3 -0.9Total 3.7 32.3 -13.9 Total 2.0 17.5 -8.2
II. Domestic AssetsMar-14 Mar-15 Mar-16 Mar-14 Mar-15 Mar-16
Domestic banks 11.6 9.5 9.3 Domestic banks 3.6 3.1 2.7Subsidiary 0.9 10.4 -7.3 Subsidiary 0.1 1.1 -0.7Branch 1.2 5.3 -4.9 Branch 0.0 0.2 -0.1Total 8.4 9.4 4.7 Total 3.7 4.3 1.9
III. Total AssetsMar-14 Mar-15 Mar-16 Mar-14 Mar-15 Mar-16
Domestic banks 12.1 18.4 11.8 Domestic banks 4.8 7.7 4.8Subsidiary 0.3 29.8 -18.4 Subsidiary 0.2 15.3 -10.1Branch 13.0 -17.8 -23.4 Branch 0.8 -1.2 -1.0Total 5.8 21.8 -6.3 Total 5.8 21.8 -6.3
The financial sector comprises banks, non-bank deposit-taking institutions, cash dealers, insurance companies and pension funds. The macroeconomic importance of the banking system in the Mauritian economy – measured as banking assets as a share of GDP - cannot be underestimated. As at end of 2015, banking sector assets (excluding GBC deposits) represented around 293 per cent of GDP and accounted for around 80 per cent of total financial sector assets. Despite this size, interbank linkages are moderate and efforts towards the mitigation of systemic risks through the identification of system-wide vulnerabilities are well under way in the aftermath of the failure of the BAI group in 2015.
Banking Sector AssetsChart6.1
700
800
900
1,000
1,100
1,200
1,300
0
100
200
300
400
500
600
Mar 13 Mar 14 Mar 15 Mar 16
Rs billion Rs billion
Domestic-owned banks Subsidiaries of foreign-owned banks
Branches of foreign-owned banks Total banking sector (RHS)

40 | Bank of Mauritius
As at end-March 2016, the balance sheet of domestic-owned banks had registered a growth of 11.8 per cent whilst that of subsidiaries of foreign-owned banks contracted by 18.4 per cent, compared to growth of 18.4 per cent and 29.8 per cent as at end-March 2015. The balance sheet of branches of foreign-owned banks contracted by 23.4 per cent as at end-March 2016. The distribution of total bank assets accounted for by the various categories stood as follows: subsidiaries of foreign-owned banks (48.1 per cent), domestic-owned banks (47.5 per cent), and branches (4.4 per cent).
Banks’ claims on the private sector - comprising mainly households and corporates - registered a growth in 2015 compared to a contraction in 2014 (Table 6.2). Net foreign assets held mainly by subsidiaries of foreign-owned banks and by domestic-owned positions remained sizeable, while banks’ claims on the government and on the Central Bank have generally registered positive growth in recent years. Gross foreign asset positions averaged US$25 billion during 2010-2015, with a net value of about US$10 billion. The banks’ claims on the Central Bank which consist of cash reserve requirements and holdings of BoM securities rose by 27.9 per cent from end-December 2014 to reach Rs71.7 billion as at end-December 2015, indicating that the
banking system remained flushed with excess liquidity. Going forward, the Bank’s efforts to increasingly absorb excess liquidity through the issue of Government securities would help to improve the situation.
Market ConcentrationOver the five-year period ended December 2015, market concentration has been fairly stable in the domestic banking sector as the Herfindahl-Hirschman Index (HHI) for total assets and total deposits increased slightly from 1,047 and 1,168, respectively as at end-December 2011 to 1,112 and 1,184, respectively as at end-December 2015. Despite a slight increase in those indices, the magnitudes of these orders point towards a moderately concentrated market. Correspondingly, the share of total assets held by the four largest banks trended upward from 53.5 per cent to 55.2 per cent. Regarding the share of advances as at end-December 2015, the market share of the four banks in the upper quartile was 62.1 per cent of the loan portfolio, compared to 64.2 per cent recorded five years ago. In spite of new licensees entering the banking sector, the Lorenz Curve still indicates that inequality in the distribution of assets persists in the banking industry (Chart 6.2).
6. Developments in the Financial Sector
0
10
20
30
40
50
60
70
80
90
100
0 10 20 30 40 50 60 70 80 90 100
Cumulative percentage of total assets Dec-10 Dec-15
Cumulative percentage of total number of banks
Line of perfect e
quality
Distribution of Banks’ Assets and Advances Chart6.2
0
10
20
30
40
50
60
70
80
90
100
0 10 20 30 40 50 60 70 80 90 100 Cumulative percentage of advances
Dec-10 Dec-15
Cumulative percentage of total number of banks
Line of perfect e
quality

41Monetary Policy and Financial Stability Report |
6. Developments in the Financial Sector
Table 6.2: Other Depository Corporations Balance Sheet, 2012-2015
2012 2013 20142015
Mar Jun Sep Dec(Rs million)
Net Foreign Assets 309,761 292,802 335,088 418,918 381,223 361,379 377,506 Claims on Non-residents 802,936 772,471 782,494 898,882 789,126 771,743 777,975 Liabilities to Non-residents -493,175 -479,669 -447,407 -479,964 -407,903 -410,363 -400,469Claims on Central Bank (net) 32,315 47,005 56,013 62,560 70,325 69,865 71,667 o/w Reserve Deposits and Securities 25,340 32,105 35,352 47,797 48,707 44,720 47,601 o/w BoM Securities held by ODCs1 3,916 10,796 17,351 14,542 24,624 28,591 26,748Domestic Claims 250,348 273,493 292,486 289,659 290,971 299,546 304,856 Net Claims on Central Government 38,215 45,692 65,515 64,686 68,183 70,511 70,615 Claims on Other Sectors 364,089 413,243 401,882 420,706 410,793 422,942 431,004 Other items net -151,956 -185,441 -174,911 -195,733 -188,004 -193,908 -196,762Broad Money Liabilities 322,441 340,146 370,055 383,814 392,184 396,518 407,068 Transferable Deposits 74,619 80,380 92,691 100,564 102,248 104,951 107,961 Savings Deposits 123,940 137,029 151,721 157,724 162,368 163,857 171,829 Time Deposits 122,768 121,487 124,262 124,113 126,129 126,238 125,773 Securities other than Shares 1,114 1,250 1,380 1,414 1,439 1,471 1,504GBC Deposits 269,984 273,155 313,533 387,323 350,335 334,273 346,962
(Annual growth rates, per cent)
Net Foreign Assets 6.6 -5.5 14.4 60.3 45.2 13.0 12.7Claims on Central Bank (net) 0.3 45.5 19.2 21.1 27.8 32.8 27.9 o/w Reserve Deposits and Securities
7.1 26.7 10.1 35.2 37.0 20.8 34.6
o/w BoM Securities held by ODCs1 -29.3 175.7 60.7 -4.2 43.4 119.5 54.2Domestic Claims 6.9 9.2 6.9 7.0 7.9 8.9 4.2 Net Claims on Central Government 0.5 19.6 43.4 31.4 27.6 20.1 7.8 Claims on Other Sectors 17.1 13.5 -2.7 4.4 4.8 8.4 7.2 Other items net 32.4 22.0 -5.7 7.9 7.0 11.6 12.5Broad Money Liabilities 8.2 5.5 8.8 10.3 10.6 11.5 10.0 Transferable Deposits 7.5 7.7 15.3 24.6 20.3 25.3 16.5 Savings Deposits 8.5 10.6 10.7 10.0 11.8 11.1 13.3 Time Deposits 8.2 -1.0 2.3 1.3 2.5 2.5 1.2GBC Deposits 4.3 1.2 14.8 64.4 50.6 14.5 10.7
1 As reported in the BoM’s balance sheet.
Financial Soundness Indicators
Profitability
During the year ended December 2015, profitability of the banking sector has gradually declined, followed by decreases in the average return on assets (ROA) and return on equity (ROE) (Table 6.3, Chart 6.3 and Chart 6.4). In general, the decrease in net interest income coupled with an increase in the amount of write-offs of impaired investment and loans resulted in a decline in the
profitability posted by banks. This decline was most pronounced amongst domestic-owned banks with a decrease in ROA from 2.1 per cent to 1.4 per cent. During the period under review, banks’ average ROE followed a similar pattern to ROA, with a decrease across the banking sector. Among the three categories of banks, the average ROE of domestic-owned banks suffered the biggest decline from 21.2 per cent as at end-December 2014 to 14.4 per cent as at end-December 2015.

42 | Bank of Mauritius
Regulatory Capital
Overall, the capital adequacy ratio of the banking sector was at a comfortable level of 17.9 per cent as at 31 December 2015 against the regulatory requirement of 10.0 per cent. However, on a bank-wise basis, two banks were operating below the prescribed capital adequacy ratio of 10.0 per cent while another bank was not complying with the minimum capital requirement of Rs200 million. The Bank was vigilant in its monitoring in respect of these three banks. The capital base of the banking sector stood at Rs121.1 billion at the end of December 2015, with the ratio of Tier 1 capital to total risk-weighted assets standing at
16.4 per cent. From the ownership perspective, over the five years ending December 2015, branches of foreign-owned banks maintained the highest Common Equity Tier 1 capital ratio with an average of 24.0 per cent, followed by the subsidiaries of foreign banks with 17.3 per cent, while domestic-owned banks continued to post lower Common Equity Tier 1 capital ratio with an average of 12.1 per cent (Chart 6.5).
Around 36.8 per cent of banks’ assets were concentrated in the 100 per cent risk-weight bucket as at end-December 2015, down from 41.6 per cent as at end-December 2014 (Chart 6.6).
6. Developments in the Financial Sector
Table 6.3: Financial Stability Indicators1 of Other Depository Corporations (Banks and NBDTIs2)
Core Set of Financial Soundness Indicators Dec-14 Mar-15 Jun-15 Sep-15 Dec-15
Capital-basedRegulatory capital to risk-weighted assets 17.1% 17.7% 17.6% 18.2% 18.5%Regulatory Tier 1 capital to risk-weighted assets 15.1% 15.4% 15.2% 16.6% 16.7%Non-performing loans net of provisions to capital 16.4% 16.4% 17.8% 17.9% 17.9%Asset QualityNon-performing loans to total gross loans3 4.9% 5.1% 5.8% 7.0% 7.2%Sectoral distribution of loans to total loans3
Interbank loans 0.3% 0.4% 0.1% 0.0% 0.1%Other financial corporations 1.5% 1.5% 1.5% 1.4% 1.5%Non-financial corporations 33.6% 33.6% 34.8% 35.8% 36.8%Other domestic sectors 19.2% 18.6% 20.2% 20.5% 21.0%Non-residents 45.4% 45.9% 43.4% 42.2% 40.6%Earnings and ProfitabilityReturn on assets 1.4% 1.3% 1.1% 1.2% 1.2%Return on equity 15.2% 13.7% 11.4% 11.9% 12.1%Interest margin to gross income 49.0% 64.9% 62.0% 61.8% 68.5%Non-interest expenses to gross income 36.9% 43.6% 40.6% 39.5% 44.3%LiquidityLiquid assets to total assets 24.1% 26.0% 25.1% 24.3% 27.2%Liquid assets to short-term liabilities 30.2% 33.0% 31.7% 31.1% 34.5%Sensitivity to Market Risk Net open position in foreign exchange to capital 2.4% 2.7% 2.8% 2.6% 3.1%

43Monetary Policy and Financial Stability Report |
6. Developments in the Financial Sector
Table 6.3: Financial Stability Indicators1 of Other Depository Corporations (Banks and NBDTIs2) (cont’d)
Encouraged Set of Financial Soundness Indicators Dec-14 Mar-15 Jun-15 Sep-15 Dec-15Capital to assets 9.3% 9.2% 10.3% 10.4% 10.5%Value of large exposures to capital 201.9% 190.9% 209.6% 191.0% 182.8%Customer deposits to total (non-interbank) loans 133.2% 141.5% 142.3% 140.3% 146.8%Residential real estate loans to total loans3 6.2% 6.0% 8.7% 8.9% 9.1%Commercial real estate loans to total loans3 5.0% 4.9% 5.6% 6.0% 5.8%Trading income to total income 35.4% 13.1% 15.0% 17.7% 10.0%Personnel expenses to non-interest expenses 40.8% 47.6% 48.5% 48.8% 50.5%Macroeconomic Indicators Dec-14 Mar-15 Jun-15 Sep-15 Dec-15Headline inflation4 3.2% 2.4% 1.7% 1.2% 1.3%Year-on-year inflation4 0.2% 2.2% 0.4% 2.0% 1.3%Key Repo Rate (end of period) 4.7% 4.7% 4.7% 4.7% 4.4%Total public sector debt/GDP (end of period) 61.6% 63.1% 63.8% 64.3% 64.6%Total public sector external debt/GDP (end of period) 16.3% 17.6% 17.1% 16.8% 16.7%Import coverage of Gross International Reserves (months of goods and services) 6.2 7.1 7.1 7.4 7.7Deposits/Broad Money Liabilities5 92.8% 93.1% 93.4% 93.3% 92.7%Household debt/GDP (end of period)6 20.9% 20.8% 20.9% 20.9% 21.0%Corporate debt/GDP (end of period)6 49.1% 49.4% 48.0% 48.3% 49.5%
2014Q4 2015Q1 2015Q2 2015Q3 2015Q4Real GDP growth4 3.7% 3.1% 3.1% 3.5% 2.6%Unemployment rate 7.5% 8.7% 7.8% 7.4% 7.9%Current account deficit/GDP 3.1% 6.7% 5.3% 5.9% 2.0%
1 FSIs are calculated on a domestic consolidation basis using the Financial Soundness Indicators Compilation Guide of the International Monetary Fund. Figures may be slightly different from other parts of this Report.
2 NBDTIs refer to Non-Bank Deposit-Taking Institutions. 3 Total gross loans include commercial loans, installement loans, hire purchase credit, loans to finance trade credit and advances, finance leases
repurchase agreement not classified as a deposit, and overdrafts.4 Percentage change over corresponding period of previous year.5 Rupee and foreign currency deposits from domestic banks.6 Debt contracted with banks only. Note: Figures may not add up due to rounding.
Return on Assets of the Banking SectorChart6.3
0.0
0.5
1.0
1.5
2.0
2.5
3.0
3.5
Per cent
Dec-12 Dec-13 Dec-14 Dec-15
Subsidiaries offoreign-owned
banks
Subsidiaries offoreign-owned
banks
Branches offoreign-owned
banks
Branches offoreign-owned
banks
Total bankingSector
Total bankingSector
Domestic-ownedbanks
Domestic-ownedbanks
Subsidiaries offoreign-owned
banks
Subsidiaries offoreign-owned
banks
Branches offoreign-owned
banks
Branches offoreign-owned
banks
Total bankingSector
Total bankingSector
Per cent
Domestic-ownedbanks
Domestic-ownedbanks
Dec-12 Dec-12 Dec-13 Dec-13 Dec-14 Dec-14 Dec-15 Dec-15
Return on Equity of the Banking SectorChart6.4
0
5
10
15
20
25
30

44 | Bank of Mauritius
The Bank exercises enhanced vigilance with regards to Domestic-Systemically Important Banks (D-SIBs). The systemic importance of these banks is measured in terms of the impact that a bank’s failure could have on the domestic economy. In June 2014, the Bank issued the Guideline for Dealing with Domestic-Systemically Important Banks. Following an exercise carried out in December 2014 and December 2015, five banks were identified as D-SIBs (Box I).
As part of the implementation of macroprudential policy measures, the introduction of the ‘Loan-to-Value Ratio’ and ‘Debt-to-Income Ratio’ in January 2014 initially moderated the excessive expansion in credit facilities to the construction sector. As per a survey conducted by the Bank on credit facilities extended for the purpose of purchase and/or construction of residential property and commercial property in Mauritius during the period January to June 2014, most of the banks had reported to have tightened their lending standards. This was reflected in a contraction in residential real estate loans as from the third quarter of 2014. However, it was observed that the ratio of residential real estate loans to gross loans had picked up from 6.2 per cent as at end-December 2014 to 8.7 per cent as at end-December 2015. As at end-December
2015, residential real estate loans accounted for 9.1 per cent of gross loans, thereby exceeding the level prior to the introduction of the policy measures.
Asset Quality
The level of non-performing loans (NPL) or impaired credit in the banking sector continued its upward trend and amounted to approximately Rs42.6 billion as at 31 December 2015. While
6. Developments in the Financial Sector
Domestic-owned banks Domestic-owned banks Subsidiaries of foreign-owned banks Subsidiaries of foreign-owned banks Branches of foreign-owned banks Branches of foreign-owned banks Total banking sector (RHS) Total banking sector (RHS)
Tier 1 Capital Chart6.5
11.5
12.2
12.8
13.5
14.2
14.8
15.5
0
5
10
15
20
25
30
Dec-11 Dec-12 Dec-13 Dec-14 Dec-15
Per cent Per cent
Box I: Domestic-Systemically Important Banks (D-SIBs) In June 2014, the Bank issued the Guideline for Dealing with Domestic-Systemically Important Banks (D-SIBs) which sets out the methodology to be applied for assessing the systemic importance of banks and the ensuing capital surcharge to be maintained by them. A first assessment was carried out in 2014 and five banks were identified as D-SIBs, namely, The Mauritius Commercial Bank Ltd, SBM Bank (Mauritius) Ltd, Barclays Bank Mauritius Limited, The Hong Kong and Shanghai Banking Corporation Limited and AfrAsia Bank Ltd.
The assessment consisted of identifying those banks whose Segment A (domestic) assets represented at least 3.5 per cent of GDP at market prices. Once these banks were identified, their importance in terms of five key indicators, namely, size, exposure to large groups, interconnectedness, complexity and substitutability were computed on the basis of data provided.
The second exercise for the determination of domestic-systemically important banks was conducted on the basis of figures as at end-June 2015. The list of systemically important banks has remained unchanged.
These D-SIBs would be required to hold a capital surcharge ranging from 1.0 per cent to 2.5 per cent of their risk-weighted assets depending on their systemic importance. This capital surcharge is applicable over a four-year period, with effect from 1 January 2016. With these measures, the Bank aims at improving the resilience of these D-SIBs in the event of shocks.

45Monetary Policy and Financial Stability Report |
there has been an increase in the ratio of impaired credit to total credit facilities outstanding from 4.3 per cent as at end-December 2014 to 6.4 per cent as at end-December 2015, this deterioration in asset quality emanated mainly from credit extended outside Mauritius where the ratio of impaired credit to total credit extended outside Mauritius rose from 2.2 per cent to 5.0 per cent (Chart 6.7). The surge in impaired credit outside Mauritius was mainly driven by one bank predominantly engaged in foreign banking business and resulted from several facilities extended outside Mauritius in the ICT, construction and tourism sectors turning bad. The ratio of impaired credit to total credit extended in Mauritius rose from 6.8 per cent as at end-December 2014 to 7.9 per cent as at end-December 2015.
On the domestic and sectoral basis, NPL to gross loans in the traders sector increased from 5.9 per cent to 13.0 per cent between end-December 2014 and end-December 2015. As for the tourism sector, it showed some signs of improvement, with the ratio of NPL to gross loans falling from 7.2 per cent to 6.2 per cent while the construction sector continued to be under stress, with the ratio of NPL to gross loans increasing from 8.1 per cent to 8.9 per cent over the same period. Regarding the global business license holders sector, it was observed that NPL to gross loans went down from 7.9 per cent as at end-December 2014 to 3.6 per cent as at end-December 2015. The global business sector is viewed as a potential source of vulnerability to both the banking sector and the economy due to its inter-linkages with the banking sector. Efforts are under way by regulators to improve the collection of detailed data on the sector to have a better understanding of the inter-linkages of Global Business Companies with the domestic banking sector as well as the transformation taking place in relation to placements and/or loans raised by these entities and extended in other jurisdictions.
Cross-Border Exposures
Cross-border exposures went down from Rs344.2 billion as at end-December 2014 to Rs315.9 billion as at end-December 2015 or by 8.2 per cent. The cross-border exposures were mainly deployed towards Asia, Africa and Europe with respective shares of 61.2 per cent, 17.5 per cent and 12.0 per cent as at end-December 2015.
Exposures towards Asia registered a drop of 15.7 per cent over the above mentioned period.
Coverage Ratio
The ratio of specific provisions (made on facilities classified as impaired) to NPL, also known as the coverage ratio, improved from 37.3 per cent as at end-December 2014 to 48.7 per cent as at end-December 2015. This was principally caused by an increase in the level of specific provision from Rs2.2 billion to Rs10.2 billion for Segment B business, thereby translating in a better coverage ratio of 62.3 per cent as at end-December 2015 compared to 27.2 per cent as at end-December 2014. This indicates provisioning was being made for the NPL which nearly doubled from 31 March 2015 to 31 December 2015.
6. Developments in the Financial Sector
NPL as a percentage of domestic credit NPL as a percentage of domestic credit
NPL as a percentage of cross-border credit NPL as a percentage of cross-border credit
Total NPL as a percentage of total banking sector credit Total NPL as a percentage of total banking sector credit
Per cent
Non-Performing Loans of BanksChart6.7
0
1
2
3
4
5
6
7
8
Dec-14 Mar-15 Jun-15 Sep-15 Dec-15
Per cent of total assets Per cent of total assets
Chart6.6
0
5
10
15
20
25
30
35
40
45
0% 20% 35% 50% 75% 100% 125% 150% 250% 1250%
Dec-14 Mar-15 Jun-15 Sep-15 Dec-15
Risk Diversification Matrix of Banks

46 | Bank of Mauritius
The coverage ratio for loans extended in Mauritius increased in the second and third quarters of 2015 while a decline was observed in the last quarter of 2015. Overall, from end-March 2015 to end-December 2015, the coverage ratio increased from 38.8 per cent as reported in the last FSR to 40.3 per cent, indicating that the level of provisioning went up to cater for the increasing NPL (Chart 6.8).
Banks’ Foreign Exchange Open Positions
Since the publication of August 2015 FSR, the overall foreign exchange exposure of the banking sector was maintained below the limit of 15 per cent of Tier 1 capital and single currency exposure limit below 10 per cent of Tier 1 capital. As at end-December 2015, the consolidated overall foreign exchange exposure of banks averaged 3.4 per cent, down from 3.7 per cent as at end-March 2015 as reported in the August 2015 FSR. Given that balance sheets of individual banks, over the above mentioned period, have exhibited fairly low currency mismatches and net exposure to foreign exchange risk, the risk of loss from adverse movements in foreign exchange rates was assessed to be relatively benign.
Banks’ Liquidity Positions
By the end of December 2015, the ratio of liquid assets to total assets in the banking sector stood at 27.8 per cent, while the ratio of liquid assets to short-term liabilities was 35.5 per cent. The main components of liquid assets were balances with the Bank of Mauritius, holdings of Treasury Bills and Government securities and short-term placements with banks abroad (Chart 6.9).
Concentration of Credit
From December 2014 to December 2015, the level of concentration of banking credit portfolio remained high, with the ratio of
aggregate large exposures to total credit rising by 110 basis points to 32.8 per cent as at end-December 2015 (Table 6.5). Credit concentration, as measured by the ratio of large exposures to capital base, decreased from 218.5 per cent as at end-December 2014 to 198.6 per cent as at end-December 2015. On an overall basis, credit concentration ratio
6. Developments in the Financial Sector
Table 6.4: Credit Concentration Risk by Region2014 2015
Loans (Rs billion) Per cent to total cross-border loans Loans (Rs billion) Per cent to total
cross-border loans
Total 344.2 315.9Of which : Africa 52.4 15.2 55.2 17.5 Asia 229.5 66.7 193.4 61.2 Europe 29.6 8.6 37.8 12.0
Non-performing loans Coverage ratio (RHS)
Per cent Rs billion
Non-Performing Loans and Coverage Ratio
Chart6.8
38
40
42
44
46
48
50
0
5
10
15
20
25
30
Dec
-12
Mar
-13
Jun-
13
Sep-
13
Dec
-13
Mar
-14
Jun-
14
Sep-
14
Dec
-14
Mar
-15
Jun-
15
Sep-
15
Dec
-15
Per cent
Liquid assets to total assets Liquid assets to total assets Liquid assets to short-term liabilities Liquid assets to short-term liabilities
Liquidity Ratios of BanksChart6.9
10
15
20
25
30
35
40
Sep-
09
Dec
-09
Mar
-10
Jun-
10
Sep-
10
Dec
-10
Mar
-11
Jun-
11
Sep-
11
Dec
-11
Mar
-12
Jun-
12
Sep-
12
Dec
-12
Mar
-13
Jun-
13
Sep-
13
Dec
-13
Mar
-14
Jun-
14
Sep-
14
Dec
-14
Mar
-15
Jun-
15
Sep-
15
Dec
-15

47Monetary Policy and Financial Stability Report |
remained below the aggregate prudential limit of 600 per cent of the capital base of individual banks that is prescribed by the Bank.
Concurrently, the proportion of bank credit extended to the ten largest borrowers rose in absolute amount by around Rs8 billion to reach Rs89.1 billion as at end-December 2015, equivalent to around 73.6 per cent of banks’ capital base as at end-December 2015 (Table 6.6).
6.2 Non-Bank Deposit-Taking SectorNon-Bank Deposit-Taking Institutions’ (NBDTIs’) main activity relates to the mobilisation of deposits and the granting of leasing and loan facilities to individuals and corporates. There were eight NBDTIs in operation as at end-December 2015. The growth in business operations progressed smoothly over the year ended 31 December 2015 albeit at a slower pace than in the previous year. The ratio of total assets of NBDTIs to total banking assets reached 5.9 per cent as at 31 December 2015, from 5.7 per cent as at 31 December 2014.
Balance Sheet Structure The y-o-y growth in total assets of NBDTIs stood at 7.5 per cent as at end-December 2015 compared with the 12.1 per cent growth in the corresponding period of 2014 but was stronger than the growth of total assets of 3.4 per cent for the banking sector. Loan and leasing facilities followed the same pace of growth in assets compared with the previous corresponding period. As at 31 December 2015, around 73.2 per cent of total assets of NBDTIs consisted of loan and leasing facilities. On the liabilities side, total deposits amounted to 58.9 per cent of the total assets. A lower y-o-y growth in deposits of 6.3 per cent was recorded as at end-December 2015 compared with 9.3 per cent in the corresponding period in 2014 (Chart 6.10).
Liquidity With liquidity ratios above the statutory minimum of 10 per cent over the year ended 31 December 2015, NBDTIs remained relatively liquid. The liquid assets to total assets ratio moved marginally from 12.7 per cent as at
6. Developments in the Financial Sector
Table 6.5: Credit Concentration RiskPercentage of aggregate large
exposures to capital basePercentage of aggregate large
exposures to total credit facilities
Sep-14 210.1 31.0Dec-14 218.5 31.7Mar-15 205.6 31.5Jun-15 218.3 34.2Sep-15 207.4 32.6Dec-15 198.6 32.8
Table 6.6: Exposure of Banks to Ten Largest Borrowers Ten largest borrowers
(Rs million)Ten largest borrowers to total
large exposures (Per cent)Ten largest borrowers to total
capital base (Per cent)
Sep-14 82,615 35.4 74.3Dec-14 81,177 33.2 72.6Mar-15 83,977 32.8 67.4Jun-15 88,703 34.2 74.6Sep-15 87,049 35.2 73.0Dec-15 89,146 37.0 73.6

48 | Bank of Mauritius
31 December 2014 to 12.8 per cent as at 31 December 2015. The liquid assets to total deposits ratio tracked the same pace and improved to 21.7 per cent compared with a ratio of 21.4 per cent in the previous year (Chart 6.11).
Capital Adequacy The NBDTIs sector remained adequately capitalised, having reported an aggregate Capital Adequacy Ratio of 29.0 per cent as at end-December 2015 compared with 25.6 per cent a year ago, indicating that the capacity of NBDTIs to face shocks to their balance sheets has improved. Assets of NBDTIs remained concentrated in the 50 per cent and 100 per cent risk-weight buckets. Around 48.0 per cent and 22.6 per cent of total NBDTIs’ assets were classified in the 50 per cent and 100 per cent buckets, respectively, as at end-December 2015 (Chart 6.12).
Sectoral Credit and NPL An amount equivalent to 16.7 per cent of the total private sector credit extended by banks and non-bank financial intermediaries was granted by NBDTIs as at end-December 2015. Credit was mostly extended to the personal sector with a share of 64.5 per cent of total credit followed by the construction sector with a share of 13.8 per cent. The proportion of credit allocated to the traders and manufacturing sectors respectively represented 2.8 per cent and 2.7 per cent of total credit by NBDTIs while the share extended to the tourism sector accounted for 1.6 per cent. A 16.1 per cent growth in credit extended by NBDTIs was registered as at end-December 2015 compared with a 10.4 per cent growth for the corresponding period in 2014.
The ratio of NPL to total credit remained at 6.0 per cent as at 31 December 2015, unchanged from the corresponding period in 2014. Among the main sectors, the construction sector faced the highest NPL ratio which stood at 24.3 per cent as at end-December 2015. While credit extended was mostly concentrated to the personal sector, the NPL ratio at end-December 2015 stood at 2.0 per cent compared to 1.9 per cent as at end-December 2014 (Chart 6.13). The coverage ratio of NBDTIs dropped from 38.0 per cent to 36.7 per cent as at end-December 2015, indicating an increased vulnerability to their exposures.
6. Developments in the Financial Sector
Sep-
12
Sep-
12
Dec
-12
Dec
-12
Mar
-13
Mar
-13
Jun-
13
Jun-
13
Sep-
13
Sep-
13
Dec
-13
Dec
-13
Mar
-14
Mar
-14
Jun-
14
Jun-
14
Sep-
14
Sep-
14
Dec
-14
Dec
-14
Mar
-15
Mar
-15
Jun-
15
Jun-
15
Sep-
15
Sep-
15
Dec
-15
Dec
-15
0
4
8
12
16
20
Per cent
Total assets Total assets Total deposits Total deposits
Y-o-y Growth of Total Assetsand Deposits of NBDTIs
Chart6.10
Sep-
12
Sep-
12
Dec
-12
Dec
-12
Mar
-13
Mar
-13
Jun-
13
Jun-
13
Sep-
13
Sep-
13
Dec
-13
Dec
-13
Mar
-14
Mar
-14
Jun-
14
Jun-
14
Sep-
14
Sep-
14
Dec
-14
Dec
-14
Mar
-15
Mar
-15
Jun-
15
Jun-
15
Dec
-15
Dec
-15
Sep-
15
Sep-
15
Liquid assets/deposits Liquid assets/deposits Liquid assets/total assets (RHS) Liquid assets/total assets (RHS)
Per cent Per cent
Liquidity Indicators of NBDTIsChart6.11
11.0
11.6
12.1
12.7
13.3
13.9
14.4
15.0
17
18
19
20
21
22
23
24
Per cent of total assets
Risk DiversificationMatrix of NBDTIs
Chart6.12
0
10
20
30
40
50
60
0% 20% 35% 50% 75% 100%
Dec-14 Mar-15 Jun-15 Sep-15 Dec-15

49Monetary Policy and Financial Stability Report |
Release of nTan ReportFollowing the revocation of the banking licence of the Bramer Banking Corporation in April 2015, the Board of Directors of the Bank enlisted the services of nTan Corporate Advisory Pte Ltd of Singapore to examine the facts behind the complex financial transactions carried out by Bramer Banking Corporation Ltd (In Receivership), its related parties, affiliates, shareholders, directors, and its connection with other financial institutions. Following the release of the report in January 2016, the Governor gave a press interview on the nTan Report, which is reproduced in Box II.
6.3 Insurance Sector
Global Trends in Insurance IndustryThe global insurance industry continues to face numerous challenges. According to the International Association of Insurance Supervisors’ Global Insurance Market Report 2016, the global insurance industry was affected by global economic factors such as weak economic growth, low inflation rates, volatile financial markets and near-zero interest rates in 2015. Against this background, premium growth was robust recently; underwriting profitability in non-life insurance was stable, supported by benign claims trends that enabled insurers to release loss reserves. For life insurers, low premium growth and low interest rates in particular formed a challenging business environment. The entire insurance sector experienced declining investment yields. Moreover, regulatory and accounting changes continued to challenge insurance companies.
The reinsurance industry remains subject to challenging market conditions characterised by excess capital, moderate premium growth, low investment yields and a weak global economy. In the past, reinsurers have been resilient to adverse developments, as evidenced by their ability to withstand the impact of large catastrophes and economic events. Premium growth in reinsurance was modest in recent years. In 2015, global non-life reinsurance
premiums increased by 1 per cent y-o-y, compared to a decline of 1.9 per cent in 2014. Global life reinsurance premiums expanded by 1.6 per cent in 2015, up by 0.1 per cent over the preceding year.
Domestic Insurance Sector: OutlookThe assets of the insurance sector account for over 30 per cent of GDP and has linkages with the banking system. Total assets of the sector grew by 8.3 per cent in 2014 while gross premium grew by 12.5 per cent in the same year. The life insurance segment accounts for the lion’s share of the insurance sector. Both life and general insurance sectors experienced total assets increases and total premium increases in 2014. However, profitability of these two segments reflected diverging patterns, with life insurance experiencing profitability stresses while general insurance experienced improved profitability. Insurance companies invest the brunt of their funds in local assets and cash holdings and remain connected to banks through various contractual linkages, e.g., as at end-December 2014, local insurance companies held over Rs12 billion in cash and deposits at banks, invested nearly Rs6 billion in equity of local banks and had overdraft facilities of nearly Rs240 million.
6. Developments in the Financial Sector
Per cent
NPL as a Ratio of SectoralCredit in Key Sectors
Chart6.13
0
5
10
15
20
25
Personal Construction Traders Manufacturing Tourism
Dec-12 Dec-13 Dec-14 Dec-15

50 | Bank of Mauritius
Long-Term and General Insurers
As per the Insurance Act 2005, all long-term insurers are subject to a risk-based minimum capital or solvency margin. For the financial year ended 2014, the solvency positions of the seven long-term insurers and twelve general insurers are shown in Tables 6.7 and 6.8.
Surpluses are determined yearly by the insurer’s statutory Actuary. The valuation of liabilities and determination of surpluses are prescribed in the Insurance (Long-Term Solvency Business Solvency) Rules 2007. The surplus position for the financial year 2014 is shown in Table 6.9. Among the big companies, one insurer had a significantly high surplus due to historical accumulation.
An analysis of surplus with regard to only ‘investment returns’ and ‘interest rate’, of the seven life insurers is provided in Table 6.10.
Insurance (long-term insurance business) Solvency Rules require a margin of 10 per cent on the best estimate of ‘interest rate’. This is expected to release further surpluses down the years. Though the averages show negative emergence of surplus on the whole, the picture
is, however, less worrying when investigating on an insurer by insurer basis. Of the seven insurers, four reported positive surpluses while three reported negative surpluses. As for the big companies, holding 65 per cent of the market share, with the exception of one insurer which was recently put under administration, the rest showed positive emergence of surplus.
6.4 Pension SectorThe Private Pension Scheme Act 2012 (“PPSA”) came into force on 1 November 2012 and requires occupational pension schemes to submit actuarial valuation reports to the Financial Services Commission (FSC) on a triennial basis6. As at date, 10 occupational pension schemes had actuarial valuations performed after the coming into force of the PPSA. Data presented in Table
6. Developments in the Financial Sector
Table 6.8: Solvency Position of the Twelve General Insurers
Average Solvency Margin
(Per cent)Big Companies * 236Medium Companies ** 324Small Companies *** 263
Table 6.9: Surplus Position for the Financial Year 2014
Average Surplus(Rs million)
Big Companies * 1,478Medium Companies ** 204Small Companies *** 48
Table 6.10: Surplus Position with Regard to ‘Investment Returns’ and ‘Interest Rate’Investment
Returns(Rs million)
Change in Basis(economic)(Rs million)
Change in Provision (interest)
(Rs million)
Total(Rs million)
Big Companies * 192.3 (535.0) (342.7)Medium Companies ** (74.0) (26.0) (100.0)Small Companies *** 3.3 (13.0) 9.0 (0.7)
Table 6.7: Solvency Position of the Seven Long-term Insurers
Average Solvency Margin
(Per cent)
Big Companies * 295Medium Companies ** 122Small Companies *** 157
* Gross premium > Rs1 billion. ** Gross premium > Rs500 million, < Rs1 billion.*** Gross premium < Rs500 million.Source: Financial Services Commission.
6 Data pertaining to the pension funds refer to period ended December 2014 unless otherwise stated.

51Monetary Policy and Financial Stability Report |
6.10 was compiled from these 10 submitted actuarial valuation reports which represent a relatively small sample of the industry.
The funding ratio and surplus position for the financial years 2012-14 are shown in Tables 6.11 and 6.12.
Surplus/Deficit – Pension Funds (Occupational Pensions)
An analysis of surplus with regard to only ‘investment returns’ and ‘interest rate’ of the 10 pension funds showed that out of the sample of the 10 occupational pension schemes, most had a poor performance on investment assumptions (Table 6.13). However, it is also to be noted that most of the schemes experienced surpluses in terms of ‘contribution’ which brought the overall deficit down, while the interest rate was a major factor behind deficits.
Investment Funds and IntermediariesIn 2015, it was noted that the number of funds licensed increased by 11 per cent. As at 31 December 2015, the statistics were as follows:
• A comparative analysis of net asset value over the last three years indicates that there has been an increase in the net asset value of the funds (Tables 6.14 and 6.15). This confirms that Mauritius is being recognised as a jurisdiction of substance and quality for fund management.
• As at end-December 2015, the Stock Exchange of Mauritius reported that 24 funds holding Category 1 Global Business Licenses and 1 local fund were registered for technical listing, while two exchange-traded funds were in operation.
Regulatory InitiativesSeveral developments have taken place in the insurance sector since the publication of the August 2015 issue of the FSR, namely:
a) On 3 December 2015, the FSC issued Circular Letter CL031215 with respect to off-site supervision procedures to ensure a uniform approach and an efficient collaboration between the FSC and Management Companies/Registered Agents.
b) The Securities Rules 2007 were amended to exempt Exchange Traded Funds from publishing in at least one local newspaper, a quarterly report containing the information as required under the Rule.
6. Developments in the Financial Sector
Table 6.13: Surplus Position of Pension Funds with Regard to ‘Investment Returns’ and ‘Interest Rate’
Investment Returns
(Rs million)
Change in Basis
(economic) (Rs million)
Interest on Surplus/Deficit
(Rs million)Total
(Rs million)Average (29.2) (107.1) (99.0) (235.3)High 9.0 4.0 3.0Low (145.0) (425.0) (460.0)
Table 6.11: Funding Ratio for Financial Years 2012-2014
Average Funding Ratio
(Per cent)10 Occupational pension schemes 82High 156Low 45
Table 6.12: Surplus Position of Pension Funds for Financial Years 2012-2014
Average Surplus(Rs million)
10 Occupational pension schemes (286)High 16Low (1,416)
Source: Financial Services Commission.
Source: Financial Services Commission.
Source: Financial Services Commission.

52 | Bank of Mauritius
c) The Captive Insurance Act (“Act”) was passed by the National Assembly on 11 December 2015, and proclaimed on 29 January 2016. The objective of the Act is to establish a framework for the licensing, regulation and supervision of captive insurance business in Mauritius. At present, the Act only caters for pure captive insurance business, i.e. the business of undertaking liability restricted exclusively to the risks of the parent and affiliated corporations. Other types of captive insurance businesses continue to be regulated under the Insurance Act 2005. The FSC will soon start drafting the Rules to cover the licensing and supervision of Third Party Captives.
d) The FSC takes a risk-based approach to supervision by dedicating further attention to firms which represent significant risks to the market and economy. Further to its interventions, several firms have been removed from the official list.
The FSC is currently working on new supervisory tools, including solvency control levels, which are expected to be introduced soon. The final phase of the project, which includes the design and implementation of an insurance resolution scheme, is now under way. This component will focus on a “credible insurance resolution”, and will aim to ultimately deliver a framework for crisis preparedness and contingency planning for the FSC with respect to the insurance sector, and operating rules for the policyholder protection scheme.
6. Developments in the Financial Sector
Table 6.14: Number of Funds LicensedLicence 2015 2014 2013Fund*: 999 893 876Collective Investment Schemes (CIS) 526 498 494Closed-end Funds 473 395 382CIS Managers* 407 333 307Custodians: 18 19 17CIS 10 9 8Non-CIS 8 10 9CIS Administrators 5 4 4Distribution of Financial Products 17 17 16Asset Managers** 1 2 2
* Figures exclude all entities in the process of winding up and those removed from register.** Figures exclude global business companies.Source: Financial Services Commission.
Table 6.15: Net Asset Value
Licence 2014 USD
2013 USD
2012 USD
Collective Investment Schemes 38,246,409,632 34,143,749,319 35,879,935,904Closed-end Funds 29,650,530,029 31,412,633,491 22,458,304,314Total 67,896,939,661 65,556,382,810 58,338,240,210
Source: Financial Services Commission.

53Monetary Policy and Financial Stability Report |
Box II: Exclusive Interview by the GovernorThe Governor of the Bank of Mauritius, Mr Rameswurlall Basant Roi, GCSK, gave an exclusive interview to a local daily newspaper on 28 January 2016 on the nTan Report.
Governor, have you received the nTan Report?
We have received a version of the Report for release to the public. It’s being examined. The Report will be released by sundown tomorrow, barring unforeseen circumstances.
What’s your appreciation of the Report?
The Report is a skillfully woven documentation of an incredible number of findings that are appalling. It’s a riveting thriller of fraudulent practices within the defunct BAI Group. I read the Report in a kind of ascetic solitude. After having finished reading it, I felt like having sailed along streams of toxic wastes in a glass-bottomed boat. It’s ugly times ugly. And ugly got going for several years. The BAI Group had grown prematurely old, weary and exhausted under the staggering weight of its ever-growing liabilities. Like an old man anticipating death, the Group kept itself busy trying to stop the clock.
The dimming of the lights on the 21st century BAI Group made the picture clearer. The Report more than amply bears out manipulative twists, turns and round-tripping of funds funneled here and there, and cover-ups. It’s a perfect storm of bad news for many; there is an ominous cloud in the horizon for those who lost their bearings in the awful games played out for several years. One of Frederic Bastiat’s thoughts came to my mind: when plundering becomes the business of life for a group of men living in a society, they eventually create for themselves a legal system that authorizes it and a moral code that glorifies it. Even the Bank of Mauritius Act wasn’t spared. One of my predecessors, Goorparsad Bunwaree, would have said the talent for dishonesty “leaps out of the text and hits you in the eyes.” When you happen to discover a lingerie shop in a nunnery and blatant accounting hoaxes and auditing firms’ statements of opinion that would even embarrass Nigerian email scammers, wouldn’t you conclude that moral standards have collapsed? The indifference and obliviousness to the plight of others fleeced in the Ponzi finance game in the recent past seize you with a visceral force that is terribly upsetting; it freezes the soul. This is what I make out of the Report.
Let it be clearly stated that the nTan team of forensic accountants, lawyers and IT experts are, of course, not scriptwriters for science-fiction movies.
Why this emphasis on “21st century BAI Group”?
Because the business model of 20th century BAI Group evolved into a kind of business in the 21st century, the survival of which became totally dependent on systematic wrongdoings.
If you don’t mind, may I say that a handful of observers still believe that the BAI Group saga is staged for reasons other than regulatory. How do you react to it?
It’s a characteristically flawed belief; it reflects the powerlessness of reason over sentiment. Defunct BAI Group is reported to have been an employer of about 2,700 persons. No Government of this country, having employment creation high on its political agenda in such challenging times as we find ourselves today, would dare take the risk of treating the Chief Executive Officer (CEO) of such a Group as politically damaged goods. Make no mistake. A very high risk of a raging financial inferno was clear and present. The truly moral thing to do was to protect the innocent and the society as a whole by preventing a Greek tragedy.
6. Developments in the Financial Sector

54 | Bank of Mauritius
6. Developments in the Financial Sector
Powerlessness of the crowd, I mean the disenchanted crowd, to reason aright prevents it from displaying critical spirit, that is, from discerning truth from error or from forming a precise judgment on any matter. This is also the kind of a crowd that has a superstitious confidence in Ponzi finance schemes. When the planners and plotters of schemes and the winners from the schemes play into the belief that wealth is not something to work for, but something to scheme for, you better be watchful. The power of reason hits the rock. Don’t argue. You might lose your shirt in the bargain. Try not to lose your trousers, too.
In opposition to the handful of disenchanted observers who tend to be the most vocal, we also have a broad mass of silent observers at all levels of our society who think that the authorities took the right steps. Insiders at the defunct BAI Group and the external auditors were aware that the Group was already in the process of a fatal crash with disastrous consequences for the financial sector and the economy. The Group was like the rabbi who was falling from the topmost level of a multi-storey building. Half-way the rabbi said to himself: “So far, so good.”
Several months ago, you said “there was no silver bullet left” to save the Bramer Bank. You have the interim nTan Report now. Can you confirm to us that your decision to revoke the banking license of the bank was justified?
Forget the barstool gossips. It’s cut and dry. There was definitely no silver bullet left to save the Bramer Bank. Some of the regulatory considerations for the revocation of the banking license are best left unsaid. By definition, regulatory authorities speak very sparingly and very mindfully.
Nonetheless, let me give you the example of a specific situation and set a question mark thereafter. A regulatory authority requests a distressed bank – stuck with high levels of non-performing loans and acutely suffering from a fast deteriorating liquidity situation – to inject capital. The distressed bank has already borrowed money up to the neck from the central bank against an unconventional collateral. The distressed bank does not meet the deadline for the capital infusion. The distressed bank asks for massive bailout funds from the central bank against suspicious collaterals to be used for the capital infusion. But the central bank is, at around the same time, intimated by one of its peers that three persons, including a woman, associated with the sister companies of the distressed bank, are vainly seeking regulatory approval for parking US$200 million in a neighbouring country. Would you still believe that capital infusion will take place and wait for it in great expectation while the distressed bank is bleeding liquidity and is about to collapse? The past is past; there are things better left unsaid. Those who have pink elephants dancing around their heads need to stop having a jaundiced view of the demise of the Bramer Bank.
Like Caesar’s wife, regulators should be above all suspicion. Effective regulators are however disliked; they constantly have hostile forces working against them. It’s a phenomenon not confined to Mauritius only; it’s worldwide.
What made you decide for having a forensic report on the BAI Group?
I do not know of any credible regulatory authority in a jurisdiction that has not gone for a forensic investigation/examination in the wake of the collapse of a financial conglomerate that wiped out vast sums of people’s money. Technically, the BAI Group was clinically dead since a few years ago. The Group was sustained by aggressive campaigns for fund-raising that kept expanding its liabilities that, by any cannon of logic, couldn’t have been extinguished. A diagnosis of what went so terribly wrong by an independent team of world renowned

55Monetary Policy and Financial Stability Report |
6. Developments in the Financial Sector
forensic investigators, lawyers and IT specialists was felt imperatively needed, more so if it all happened under the watch of regulatory authorities. The systemic threats to our financial industry were more than disturbing. Professionals in the financial industry, politicians, the judiciary, regulatory authorities, university students, the victims who have been fleeced, the public at large, Moody’s, IMF, World Bank and regulatory authorities in the rest of the world must be made aware of how a financial conglomerate finally had recourse to Ponzi finance to ensure its own survival. All of us have lessons to learn from the Report.
But you hadn’t released the nTan Report on MCB/NPF scandal?
Yes, I hadn’t. And I don’t regret it. The decision not to release the Report is, however, like an unlocatable ache, a pain without a name that makes me edgy even after a dozen years.
The Report was overwhelmingly loaded with names of account holders and their bank balances. It could not be released by law. Anyone sincerely willing to have a copy of the Report way back in 2005 could have asked his representative(s) in the National Assembly to move for an amendment of the Banking Act. Nobody did ask. Just a simple exercise in the National Assembly and the Report could possibly have been out. Often, we uncritically enjoy the comfort of opinion of others and we avoid the discomfort of serious thinking.
In the MCB/NPF case, right from the outset the shareholders of the MCB had made up their mind to repay the missing amount to the NPF. Taxpayers did not have to bear the brunt of the missing amount. Nor the public was required to by any power of compulsion. By the way, Air Mauritius, a Government-owned enterprise, had incurred billions of rupees of losses related to hedging. It was revenue foregone by the Government. The STC [State Trading Corporation], too, incurred billions of rupees of losses related to hedging. Consumers of petroleum products and taxpayers footed the bill – happily. No investigation/examination was conducted. No Reports were produced and published. The laws of Mauritius did not come in the way. Why the fuss about the nTan Report on a private sector-owned enterprise like the MCB and no fuss at all on consumers and taxpayers funding losses due to hedging losses incurred by public sector bodies?
Don’t we have local firms instead of nTan to conduct the forensic examination?
No doubt, we do have some excellent accountants and excellent commercial lawyers. Individually, they are great. But they are employed in different organizations. I wonder if they would have teamed up along with local folks with IT forensic skills for a forensic examination without fear or favour to any party. I also gathered that local auditing firms, if at all they were entrusted with the assignment, would have had to seek external assistance. After all, many of the folks in our local firms, that are involved in the auditing of financial institutions in the country, would have had conflicts of interests. Besides, the team of experts should necessarily have a reputable track record in forensic accounting. nTan is neutral and has all the required qualities.
Everyone’s judgment is coloured by his worldview. The kind of investigations/examination nTan conducts require not only knowledge but wisdom, too. We can be knowledgeable about other people’s knowledge but we cannot be wise with other people’s wisdom. Wisdom is precious. You don’t get that in the Internet. You have to pay for it – with bitter experience. nTan has the track record. How independent a local team of investigators would have been is questionable.

56 | Bank of Mauritius
6. Developments in the Financial Sector
You have made references to Ponzi Finance. What is a Ponzi scheme?
In 1920, Charles Ponzi established the fraud of using one investor’s money to pay another while advertising that the payment was the result of a little-known investment idea. He kept on promising higher and higher rates of return to his victims. His liabilities kept on ballooning. And the balloon busted when Ponzi had promised a 50 per cent return in less than two months’ time. Bernie Madoff was a giant in his field. He out-Ponzied Charles Ponzi. Madoff’s firm used to advertise ethical standards. When he took people’s fortune to manage, he refused to tell them how he would invest and obtain high rates of return. Even when the markets were against him he was still making money, almost every month and every day. The victims were paid so much to look the other way. A pile of dung was burning for years. Madoff’s scheme blew up in the wake of the 2008 financial crisis.
The concept of Ponzi scheme has evolved over the years. There are different methods and structures used by swindlers. There is not one but a variety of Ponzi schemes. Like in the reptile family, one is an alligator. The other one is a crocodile or a fat lizard and so on. The essentials are the same. The dramatis personae in the game changes.
In any Ponzi scheme, the early birds get the money as promised and the late birds pay the money. In a very elementary Ponzi finance game, initially, the rates of return are above prevailing market rates. The early birds are paid out of funds provided by successive birds. Rumors of the winnings travel fast. It’s an infectious game. The number of participants in the scheme increases and the early birds keep getting back money at the promised rates of return. Over time, it gets tougher for the swindler to raise funds. The swindler progressively raises the rates of return. Persuasion, seduction and greed come into play. Increasingly, more birds join in. The swindler, finding himself lucky, discovers how much the birds and the rabbits are willing to bet on the rumours and how investors are willing to invest in fantasies. Often, even investors, otherwise very calculating, get seduced by the high rates of returns; they pop up like rabbits in the game. And the game goes on interestingly. More birds and more rabbits walk freely and happily into the slaughterhouse with bucketful of cash. In the fullness of time, the liabilities of the swindler outgrow his capacity to service them by far. The swindler eventually runs out of cash. The endgame is reached when repayments can no longer be effected. The house of cards collapses. Early birds and rabbits got the money; latest birds and rabbits paid the money. Ponzi debt units get destroyed. What started out with a bang ended with a whimper.
Anyone with a bent of mind for running a Ponzi scheme must be reminded of the greatest lessons in the world from a convicted felon, Bernie Madoff: “Be sure, your sin will find you out.” Even the best engineered schemes on the planet come undone at some point. No Ponzi scheme can continue forever. But if you are very bright, you can keep the game going for a long, long time. But it will certainly crash with tragic finality at some point in time.
The economist, Hyman Minsky, who achieved eminence during the 2008 financial crisis, had created his own categories of balance sheets, which reflected the degree of risk market participants (Super Cash Back Gold) assumed. The riskiest of these he categorized as “Ponzi finance.” Ponzi finance, in Minsky’s terminology, describes the condition of those who can neither repay the principal on their liabilities nor meet their interest payments from current cash flows. To survive they must refinance, either by selling assets or by raising more debt. For this to happen, asset prices must continue to rise. Fraudsters use accounting gimmicks to overvalue their assets to hide losses and contract more debt either to pocket the money or to meet repayment obligations. The bigger the losses, the more exaggerated are the overvaluation of assets.

57Monetary Policy and Financial Stability Report |
6. Developments in the Financial Sector
Did the BAI Group operate a Ponzi scheme?
Yes, the defunct BAI Group, short of cash, did eventually end up with a Ponzi scheme. An authoritative international financial institution and several other personalities share this view. The defunct Group had an arborescent structure – a complex cluster of many connected and intertwined companies. A look at the Group structure gives you the impression of a galaxy – a galaxy of loss-making planets with funds orbiting in and out conveniently without respecting regulatory rules. There was a regular haemorrhage of outflows that largely explained the losses made by the companies in the Group. Short of funds, the defunct Group came up with schemes to fund its loss-making companies. Occasionally, when fund-raising through the schemes toughened, the Group kept borrowing from the Bramer Bank, commercial banks, BoM etc. to meet its ever growing obligations. The larger the repayment of its obligations, the larger were the amounts of funds it raised by all means. Its ever-growing liabilities drove the Group to excessively overvalue the assets of the loss-making companies so as to balance their books. This process of overvaluation was repeated abusively over the years. It is wondered if the suppliers of funds to the Group were told about how their money was invested in ways that could bring them Madoff’s kinds of returns. The BAI Group should have had an annual consolidated balance sheet, but it didn’t have one. The BA Investment was listed on our Stock Exchange. Disclosure is a listing requirement. Why had the BAI asked for and obtained its de-listing in 2010? Read the nTan Report when it will be out.
There are thousands of people who have lost their money with the demise of the BAI Group. What would be, in your opinion, the solution to their plights?
I was in Lima, Peru, for the IMF/World Bank meetings in October 2015. I seized the opportunity to meet with the Governor of the central bank of Trinidad and Tobago and tried to get an idea of how the Government was handling a similar case over there. The suppliers of funds to the swindlers in Trinidad and Tobago were made to accept a substantial haircut. I am with the vast majority of the people in Mauritius who entertain the view that the suppliers of funds to the defunct BAI Group should accept a haircut.
People need to realize that in almost every act of our daily lives, whether in the sphere of politics or business, in our social conduct or even in our ethical thinking, we are dominated by a relatively small number of persons who understand the mental processes and social patterns of the masses. In the wake of the revocation of the banking license of the Bramer Bank, rumours about the defunct BAI Group salespersons purportedly practising skilled seduction and deception were rife. Some, if not all, of the suppliers of funds to the Group were driven solely by greed. True: they were seduced and are now hurt. True: they acted volitionally. The victims were all motivated to grow their money. They rang a bell; they cannot un-ring the bell.
In November 2015, you had quite some tirades against external auditors. They have not been spared in the nTan Report also. Is it so?
I understand it’s Gresham’s dynamic at work for several years. Bad ethics have driven good ethics out of the market in the business of auditing. The basic understanding that bad things are bad and good things are good is conspicuously absent in the auditing world. When it is affirmed that bad things are okay and good things are irrelevant, all hell breaks loose. Two auditing firms, KPMG and BDO, have been named. It’s even mentioned that if these two auditing firms had responsibly carried out their duties, investors and suppliers of funds might not have lost their money. Auditors have a fiduciary duty towards the investors.

58 | Bank of Mauritius
6. Developments in the Financial Sector
It appears that the BoM and the FSC have been criticized in the Report. How do you react to criticisms by the very consultant recruited by the Bank of Mauritius?
Does it not reflect nTan’s independence in the examination? If there have been regulatory failures, what must be truthfully said must be truthfully said. Should you have in mind to lead me to a destination of your choice with this question, you would be driving me to a point where every word uttered by me would displease those before me at the Bank of Mauritius. It’s like being exactly in the position after you have forgotten your wife’s birthday. I’m quite familiar with the famous one liner in journalism, “if it bleeds, it leads.”
I cannot say that the BoM has been faultless. With regard to the BoM, we need to differentiate between regulatory forbearance and regulatory failure due to incompetence. The November 2015 FSAP mission of the IMF/World Bank, nTan and I have read the working files and the recommendations of the staff of the Supervision Department on various issues having to do with the Bramer Bank. It was a revealing exercise. The staff recommendations on the regulatory stands of the BoM and the final decisions of the BoM do not necessarily match. There were voices of sanity within the Bank; they just did not prevail at the final decision-making level. A few officers took the risks of being ostracized into insignificance instead of “going along to get along” to have a wonderful and star-quality career. The BoM remains credible as a regulatory authority.
Did the Bramer Bank satisfy all the conditions for a banking license in 2008? What are the lessons learned in that case as opposed to the Delphis Bank, for instance?
One very important condition regarding shareholding was not satisfied. Defunct Delphis Bank, First City Bank, Union International Bank, Bramer Bank as well as SEAB (later acquired by Bramer Bank) and IOIB (later acquired by State Bank of India) had high risk of failures baked in the cake. Each of these banks had a single majority shareholder having a very strong domineering influence in the banks’ management. Once the shareholders of these banks were authorized to hold more than 10 per cent of the shares at the time of the issue of the licenses with a dilution clause, the Bank of Mauritius found itself trapped in a regulatory dilemma. In none of the above mentioned cases, the Bank of Mauritius was able, in subsequent years, to make the banks bend to the regulatory rule regarding the pattern of shareholdings. The pattern of shareholdings in the banks mentioned above has been the root cause of their failures. The philosophy underpinning the provision in our Banking Act that no single shareholder should have more than 10 per cent cannot be taken lightly.
Applicants for banking licenses requesting for majority shareholding are strong candidates for starring roles in zombie movies. No matter how many times the BoM kills them, they keep coming back to life to scare the regulatory authorities in Mauritius.
Statistically speaking, my second observation is that almost all the banks mentioned above have had some sort of a political clout unkind to regulatory discipline. The second lesson to draw is that politicians must not have a say on matters relating to the issue of licenses to financial institutions; they should trust the regulators and stay out of the regulatory perimeters. Regulators of financial systems are generally perceived to be cruel creatures. They are cruel only to be kind to the financial system. It’s not fun to be cruel.

59Monetary Policy and Financial Stability Report |
6. Developments in the Financial Sector
What do you now think of Mr Dawood Rawat as an entrepreneur?
I cannot claim to know Mr Dawood Rawat’s entrepreneurial talents. I have met with him on many occasions in my office. Like many of us, I only have the benefit of hearsays.
But I, rightly or wrongly, understand that Mr Rawat had started out daringly as a businessman. I cannot say if he has a highly polished Cartesian rationalism with an impeccable “geometrical” idea of reality as an entrepreneur. He ended with presiding over a Corporate Group whose modus operandi gave rise to suspicions in later years. The Group’s perception of direction did not agree with reality and ethics. The Group, suffocated with burdensome liabilities that, by any stretch of imagination, would not have been extinguished – teetered to the edge of collapse and busted in the end. The Group rolled on and on with the help of Ponzi finance.
I have a message for all the CEOs of financial institutions operating in the country; it’s a gem from Bernie Madoff, infamously known as the US$50 billion Ponzi schemer: “In today’s regulatory environment, it’s virtually impossible to violate rules… And this is something the public doesn’t really understand… It’s impossible for a violation to go undetected, certainly not for a considerable period of time.” Pottery barn rule : you break it, you own it.


61Monetary Policy and Financial Stability Report |
Availability of MACSSDuring 2015H2, MACSS operated smoothly without any significant downtime, confirming its robust capacity to process high volumes of transactions. MACSS settled 371,109 transactions for a total value of Rs1.1 trillion, representing an increase of 11.7 per cent in volume terms but recorded a decrease of 19.6 per cent in value terms compared to 2014H2 (Chart 7.1).
Bulk Clearing SystemThe Bulk Clearing System (BCS) is the clearing engine of the PLACH and used for payments which are carried out in bulk and settled on a net basis, four times per day on MACSS. It has the dual capacity to carry out cheque truncations as well as clearing and settling low value electronic payments presented in bulk.
Throughput on Bulk Clearing System
In 2015H2, 2,386,587 cheques were cleared compared to 2,479,569 in 2014H2, representing a fall of 3.7 per cent. The total value of cheques cleared in 2015H2 stood at Rs127.1 billion compared to Rs133.1 billion for the same period in 2014, representing a drop of 4.4 per cent (Chart 7.2).
Electronic Fund Transfers (EFTs), which comprise low value retail transactions such as salary payments that are sent to the Clearing House in bulk, have been an integral part of the cheque truncation system since 2011. The BCS cleared 1.7 million EFTs for a total value of Rs44.9 billion. The volume and value of instruments cleared
7. Payment Systems Infrastructure
Safe and efficient payment system infrastructures are essential to the effective functioning of the financial system. During 2015H2, the payment systems operated by the Bank remained robust and handled large volume transactions without failure even during peak periods. Given the rise in digital payment outlets, more and more electronic transactions are taking place in systems which are outside the Bank’s purview. As such, the Bank viewed that there was a need to bring all payment services within its regulatory and oversight scope to ensure effective risk management. A new legislation, the National Payment System Bill, is under preparation in this respect.
The centralised payment systems in Mauritius comprise two main payment system infrastructures; the Mauritius Automated Clearing and Settlement System (MACSS) and the Port Louis Automated Clearing Systems (PLACH). The MACSS is a large-value interbank payment system based on Real Time Gross Settlement (RTGS) principles. The PLACH is a clearing system whereby batched interbank retail payments are settled on a net basis on MACSS. The payment instructions for PLACH include cheques and Electronic Fund Transfers.
200
225
250
275
300
325
350
375
400
0
200
400
600
800
1,000
1,200
1,400
1,600
Jan-Jun Jan-Jun 2011 2011
Jul-Dec Jul-Dec 2011 2011
Jan-Jun Jan-Jun 2012 2012
Jul-Dec Jul-Dec 2012 2012
Jan-Jun Jan-Jun 2013 2013
Jul-Dec Jul-Dec 2013 2013
Jan-Jun Jan-Jun 2014 2014
Jul-Dec Jul-Dec 2014 2014
Jan-Jun Jan-Jun 2015 2015
Jul-Dec Jul-Dec 2015 2015
'000
Value Value Volume (RHS) Volume (RHS)
Rs billion
Transactions on MACSSChart7.1
Jan-Jun Jan-Jun 2011 2011
Jul-Dec Jul-Dec 2011 2011
Jan-Jun Jan-Jun 2012 2012
Jul-Dec Jul-Dec 2012 2012
Jan-Jun Jan-Jun 2013 2013
Jul-Dec Jul-Dec 2013 2013
Jan-Jun Jan-Jun 2014 2014
Jul-Dec Jul-Dec 2014 2014
Jan-Jun Jan-Jun 2015 2015
Jul-Dec Jul-Dec 2015 2015
Value Value Volume (RHS) Volume (RHS)
2.1
2.2
2.3
2.4
2.5
2.6
2.7
2.8
0
20
40
60
80
100
120
140
Million Rs billion
Cheques ClearedChart7.2

62 | Bank of Mauritius
during 2015H2 increased by 1.6 per cent and 3.2 per cent, respectively, compared with the same period of 2014, confirming an increasing use of this mode of payment (Chart 7.3).
The BCS has proved to be resilient enough to handle the large volume of cheques. A decrease in the volume and value of cheques cleared was noted, while the volume and value of EFTs cleared rose, thereby pointing to a shift from the use of cheques to electronic transactions. This may have a positive impact on the efficiency of the payment system, given the inherent risks associated with cheques (Chart 7.4).
MACSS and PLACH Business Continuity Procedures
In May 2015, the infrastructure supporting MACSS and PLACH was completely reviewed. These systems now operate on fully redundant machines with real time replication to the Bank’s Disaster Recovery (DR) site. As such, the improved design and operation of the systems provide for more availability and minimum disruptions. MACSS and PLACH are now fully operational from the DR Site and fallback tests are carried out on a quarterly basis.
On 10 September 2015, the Bank held a full day operations from its DR site with the objective of testing operational procedures as well as the system’s capability to switch to and run from another environment. The daily operations were successfully executed without encountering any major issues. The real time replication to the DR site contributed significantly to the stability of the payment systems as operations can be resumed from the Bank’s site or DR site in near real time, but more importantly, without any data loss.
7. Payment Systems Infrastructure
Jan-Jun Jan-Jun 2011 2011
Jul-Dec Jul-Dec 2011 2011
Jan-Jun Jan-Jun 2012 2012
Jul-Dec Jul-Dec 2012 2012
Jan-Jun Jan-Jun 2013 2013
Jul-Dec Jul-Dec 2013 2013
Jan-Jun Jan-Jun 2014 2014
Jul-Dec Jul-Dec 2014 2014
Jan-Jun Jan-Jun 2015 2015
Jul-Dec Jul-Dec 2015 2015
Value Value Volume (RHS) Volume (RHS)
Million Rs billion
0.8
0.9
1.0
1.1
1.2
1.3
1.4
1.5
1.6
1.7
1.8
0
5
10
15
20
25
30
35
40
45
50
Electronic Clearing TransactionsChart7.3
0.0
0.5
1.0
1.5
2.0
2.5
3.0
Jan-Jun 2011
Jan-Jun 2011
Jul-Dec 2011
Jul-Dec 2011
Jan-Jun 2012
Jan-Jun 2012
Jul-Dec 2012
Jul-Dec 2012
Jan-Jun 2013
Jan-Jun 2013
Jul-Dec 2013
Jul-Dec 2013
Jan-Jun 2014
Jan-Jun 2014
Jul-Dec 2014
Jul-Dec 2014
Jan-Jun 2015
Jan-Jun 2015
Jul-Dec 2015
Jul-Dec 2015
Million
Volume of cheques Volume of cheques Volume of EFTs Volume of EFTs
Volume of Cheques and EFTs on BCSChart7.4
Note: EFTs started as a service at the Clearing House on 6 September 2011.

63Monetary Policy and Financial Stability Report |
This section presents a summary assessment of the main risks to the domestic banking system. The heat-map below provides a synopsis of these risks and their likely evolution over the next six months.
8. Risk Analysis of the Domestic Banking System
Table 8.1: Risks to Financial Stability for the Upcoming Six MonthsRisk
ProbabilityChange
Probability*Global EconomyGlobal economic slowdown Down êOil price Up éFood prices Unchanged èVolatility (ViX) Up é
Domestic EconomyEconomic growth Up éInflation Up éTerms of trade Unchanged èDomestic savings Unchanged èInvestment/GDP Up éExchange rate Unchanged è
Household Debt RisksHousehold debt-to-disposable income Up éHousehold debt service-to-disposable income Up é
Corporate Debt RisksCorporate debt-to-GDP Unchanged èReturn on equity Up éLeverage Down ê
BankingLarge exposures Down êReturn on equity Up éAsset quality (domestic market) Up éCross-border exposures Unchanged è
Risk analysis keyHigh Medium Low
6 5 4 3 2 1
* Change between March 2016 and September 2016.
Source: Bank of Mauritius staff estimates.

64 | Bank of Mauritius
As a small open economy, Mauritius is subject to external developments, including the global economic slowdown, volatility in global trade and finance. The unexpected weakness in late 2015 has increased risks of a much weaker global growth going forward and this may act as a drag on growth domestically. The negative feedback loop on the fragile confidence may lead to declining flows to emerging markets and developing economies, including Mauritius.
On the domestic front, the economy is still operating with spare capacity while inflation remains subdued. With global commodity prices and oil prices hovering at low levels, domestic inflation is benign. The low inflationary environment has served as a fillip to private consumption. However, the ratio of investment to GDP is low and has, so far, constituted a major drag to growth prospects. While the Government has announced plans to embark on mega infrastructure projects and to fast-track investment through an improvement in the business climate, it is expected that materialisation of these new projects will support future growth prospects.
On the external front, economic uncertainties in Eurozone, if unaddressed, may also constitute an important risk to trade and tourism earnings which account for an important source of the country’s external financing.
Household indebtedness is comparable with selected comparator countries but must be monitored. Although selected macroprudential policy measures are already in place to prevent the build-up of excessive risks of systemic nature in the financial system, the household debt-to-disposable income ratio remains vulnerable to the unfolding of macroeconomic scenarios, including slowdown of economic growth as well as low interest rates which favour rapid credit accumulation. NPL from the household sector is being continuously monitored on a case-by-case basis.
The outlook regarding corporate indebtedness as a share of GDP is unchanged since the last assessment. While leverage ratios in sectors such as tourism, construction, real estate, and trade, have until very recently been above 100 per cent, several restructuring exercises, including
rescheduling of debt portfolios, have kept the lid on expansion of corporate indebtedness. The corporate sector is nonetheless still vulnerable to shocks - tied to the domestic and international growth outlook - directly affecting their cash flows. Without further deleveraging and restructuring exercises calling for injection of fresh equity, corporate sector risks may stymie growth of private investment.
Although the banking sector is healthy and well-capitalised, it remains exposed to a number of risks. Banks’ profitability has decreased over the year ended December 2015. Some portfolio reallocation between domestic and foreign assets has occurred as a result of the decrease in profitability. In January 2014, macroprudential policy measures including Loan-to-Value ratios and Debt-to-Income ratios, were implemented with a view to beefing up resilience of the banking sector against the build-up of risks following rapid expansion of credit to some selected sectors, and to address vulnerabilities that may result following materialisation of these risks. Going forward, the sector might face a number of challenges:
Asset Quality and Concentration Risks
The banking sector remains exposed to concentration risks, including risks of failure of large borrowers and of connectedness. With rising NPL levels, banks would face increasing pressure to deal with these urgently in an endeavour to maintain domestic and international confidence. The on-going monitoring of stressed assets would contribute toward reducing the risk that banks would need to increase provisioning so as not to constrain their capital and profitability.
GBC and Non-Resident Sector
The Mauritian banking system is dependent on deposits for funding purposes. Given the relatively high proportion of deposits - slightly above 40 per cent - accounted for by the GBC and non-resident sector, a sudden disruption to the sector could expose some banks to liquidity risks. This is especially so since these deposits have short maturity and are denominated in foreign currency.
8. Risk Analysis of Domestic Banking System

65Monetary Policy and Financial Stability Report |
Following the signature of a protocol for amending the Double Tax Avoidance Agreement (DTAA) between India and Mauritius on 10 May 2016, the Governor of the Bank reviewed the situation with the Chief Executive Officers of systemically important banks. The Bank issued a communique to reassure the financial community about the resilence of the domestic banking system (see Box III).
Although cross-border exposures have followed a downward trend between 2014 and 2015, banks in Mauritius still remain substantially exposed to heightened credit risks arising from
increased impairment in other jurisdictions such as Africa and India. The challenges facing some Sub-Saharan African countries (in the form of low commodity prices and falling revenues as well as dimmed growth outlook), for instance, could be a matter of concern for Mauritian banks which have legacy exposures and / or which are considering new lending opportunities in those jurisdictions. Banks in Mauritius should remain prudent in their cross-border lending and be proactive to ensure that their stressed assets are adequately provisioned in view of a less supportive external environment.
8. Risk Analysis of Domestic Banking System
Box III: Double Tax Avoidance Agreement Between Mauritius and India1. The Bank of Mauritius (Bank) has taken note of the signing of a Protocol for the amendment
of the Double Tax Avoidance Agreement (DTAA) between Mauritius and India on 10 May 2016.
2. Following concerns expressed in the media and in certain quarters regarding the likely impact of the revision of the DTAA between Mauritius and India, the Bank wishes to highlight some recent trends in the evolution of the robustness of the domestic banking system for the benefit of the public:
a. Since India decided in 2012 to implement the General Anti-Avoidance Rule (GAAR) provisions, domestic banks had started diversifying their deposit portfolios and reducing reliance on businesses with India.
b. The Bank has since been closely monitoring the initiatives taken by the banking industry to enhance its resilience to shocks stemming from external market environment, including from its exposure to India.
c. In 2015, the Bank, as the regulatory authority of deposit-taking institutions in Mauritius, reiterated the continuing need for banks to further diversify their asset portfolios with a view to mitigating excessive reliance on treaty-dependent advantages. Banks doing business with India-related Global Business Companies (GBCs) reinforced their initiatives regarding risk mitigation and market diversification.
d. The chief concern of the Bank is the potential impact on the liquidity position of international banks exposed to GBCs doing businesses with India. The public is informed that the Bank had, for years, set down prudential norms on liquidity risk that banks have been observing.
e. In line with the Guideline on Liquidity Risk Management, banks have to establish and implement prudent liquidity management policies. Banks are required to have adequate liquidity buffers, including readily accessible lines of credit, to meet unexpected liquidity-stressed situations. Most banks have committed lines of credit with foreign banks to meet any contingency arising out of liquidity-stressed situations.

66 | Bank of Mauritius
8. Risk Analysis of Domestic Banking System
Box III: Double Tax Avoidance Agreement Between Mauritius and India (cont’d) f. Importantly, the Bank requires banks to carry out regular stress testing on, inter alia,
liquidity and credit. Banks use various scenarios for the stress tests. Volatility of GBC deposits, including those stemming from the revision of the DTAA, is also factored in.
g. The banking industry in Mauritius is well capitalised with a capital adequacy ratio of 17.8 per cent in December 2015 against a minimum of 10 per cent. Banks dealing with the GBC sector also have comfortable capital buffers, standing at 18.3 per cent in December 2015. The strong capital base of international banks gives additional comfort regarding their capacity to withstand adverse shocks.
h. The Governor of the Bank met with the Chief Executive Officers (CEOs) of systemically important banks over the last two days to take stock of the situation following the signing of the Protocol. It is comforting to note that the systemically important banks, including the two largest domestic banks, do not have consequential India DTAA-related liquidity concerns. Nearly all of the 22 banks operating in our jurisdiction have drastically reduced their exposure to liquidity risks arising from India-DTAA related activities. The domestic foreign exchange market has remained flushed with foreign currencies.
i. The Governor’s meetings with the CEOs of banks bear out that a revision of the DTAA will have mitigated impact on our banking industry in the foreseeable future. However, in the years ahead, the mass of businesses generated in our jurisdiction could suffer should there be a failure to take imaginative actions to review, alter and innovate the business model that the sector has embraced for years.
j. The last Financial Sector Assessment Programme (FSAP) conducted by the IMF and the World Bank in November 2015 stress-tested the banking sector resilience to liquidity shocks arising from significant outflows of GBC deposits in case of an unfavourable DTAA re-negotiation. The result revealed that the banking sector can withstand significant withdrawals.

67Monetary Policy and Financial Stability Report |
8. Risk Analysis of Domestic Banking System
Statement on Financial StabilityThe domestic financial system in Mauritius remained resilient during 2015, notwithstanding negative spillovers that emanated from the collapse of a large financial conglomerate, the BAI group. Prompt intervention by the relevant authorities largely contributed to contain contagion effects and mitigate systemic risk, thereby boosting confidence of economic agents. Financial intermediaries continued to operate in a sound environment, and remained profitable despite the drag imposed by subdued domestic demand and output growth.
Against a backdrop of weak performances posted by several major advanced and emerging market economies during 2015, global output growth has remained subdued in spite of the boost provided by lower oil and other commodity prices. While the growth momentum has somewhat slowed in the US and UK, economic recovery in the Euro area and Japan maintained its sluggish pace. Concurrently, in the wake of a generalised slowdown and recurrent bouts of turbulence in financial markets, emerging market economies are undergoing significant macroeconomic adjustments that have generated significant uncertainty. The setback in growth and heightened uncertainty across different regions has led to a deterioration in the global financial stability outlook.
Domestic growth has remained moderate and Statistics Mauritius revised its estimate of real GDP growth at 3.1 per cent for 2015, down from previous forecasts of 3.4 per cent and 3.6 per cent made in December and September 2015, respectively. Headline inflation remained contained at low levels and dropped to 0.9 per cent in March 2016. Nonetheless, the trend decline in the ratio of investment to GDP continues to raise concern over its impact on the economy’s potential growth in the medium term, and taking into account the ongoing gloomy economic outlook of our main trading partners.
The banking sector remains supported by strong capital positions, despite a weakening of some financial soundness indicators. As at end-December 2015, the aggregate capital adequacy ratio was much above the regulatory requirement of 10 per cent at 17.9 per cent compared to 16.6 per cent as at end-March 2015, reflecting the consolidation of capital buffers that are being implemented in a phased manner and in conjunction with the implementation of Basel III framework. Nonetheless, the asset quality of banks worsened over the quarters in 2015, with the NPL ratio rising from 4.6 per cent as at end-March 2015 to 7.9 per cent as at end-December 2015, indicating impairment in both domestic credit and credit extended outside Mauritius. Overall, from end-March 2015 to end-December 2015, the coverage ratio increased from 38.8 per cent (as reported in the last FSR) to 40.3 per cent, indicating that the level of provisioning went up to cater for the increasing NPL. Although credit concentration indicators remain below prudential limits, the domestic credit portfolio of banks remains a potential source of credit concentration risk given the significant volume of large credit exposures extended to groups of closely-related customers.
Indebtedness of households has remained broadly constant in terms of ratio to disposable income. During 2015, the growth trajectory of housing and consumption credit has diverged, as housing credit growth expanded steadily before reaching a plateau in November 2015 while consumption credit remained on a declining trend before picking up in December 2015. Given the sensitivity of household indebtedness to unfolding macroeconomic events, continuous monitoring is exercised by the Bank.

68 | Bank of Mauritius
8. Risk Analysis of Domestic Banking System
Statement on Financial Stability (cont’d)Corporate indebtedness - measured as corporate debt-to-GDP ratio - remained rangebound and hovered around 57 per cent during 2015. Despite the pick-up in credit expansion, reflecting positive growth in credit in some sectors, corporate credit-to-GDP gap remained in negative territory throughout 2015, and given the deleveraging and ongoing restructuring exercises undertaken by some large borrowers, it is projected that corporate indebtedness would remain at par over the medium term. With the implementation of a set of macroprudential policy measures since 2014, the growth rate of corporate debt is expected to be more contained relative to the growth rate in GDP. Nonetheless, vigilance is required as banks’ exposures to corporates continue to remain at high levels and may have a systemic impact on financial stability.
The payment systems have operated efficiently during 2015H2 and generally, transactions have been settled without delay or loss. While keeping in view that a robust payment system is a critical requisite for promoting financial stability, the national payment system infrastructure is being overhauled with the upcoming project of the National Payment Switch, through which all payments made by electronic means will be routed for authorisation and settlement. Overall, the financial system is assessed to be sound and stable although key challenges relate to the consolidation of a supervisory framework for large conglomerates, as well as raising provisioning levels for impaired credit while remaining more vigilant to signs of vulnerabilities from both the household and corporate sectors.
Going forward, in a bid to increase the financial system’s resilience against potential shocks, the Bank has embarked on a number of key initiatives such as the setting-up of an explicit Deposit Insurance Scheme to protect depositors and of an Asset Management Company to primarily address the adverse impact of non-performing loans on the stability of the financial system. In addition, discussions are under way by the Bank for the design of a formal framework for crisis management/resolution. The Bank is currently in the process of strengthening the regulatory framework through the review and rationalisation of Guidelines issued to take into account latest banking developments on the international front.
69Monetary Policy and Financial Stability Report |
Table 3.1 Sectoral Real Growth Rates (per cent over previous year) 12Table 3.2 Sectoral Growth Rates (per cent, y-o-y) 13Table 3.3 Domestic and External Demand (per cent, y-o-y) 14Table 3.4 Public Sector Debt 16Table 3.5 Depository Corporations Survey, 2012-2016 17Table 3.6 Bank of Mauritius Balance Sheet, 2012-2016 18Table 3.7 Bank Credit to Private Sector, 2011-2016 20Table 3.8 Balance of Payments, 2013-2016 22Table 4.1 Measures of Inflation (per cent, y-o-y) 26Table 4.2 Measures of Inflation (per cent, 12-month average) 26Table 5.1 Domestic and External Corporate Debt 36Table 5.2 Distribution of Credit to the Private Sector 38Table 6.1 Banks’ Assets, 2014-2016 39Table 6.2 Other Depository Corporations Balance Sheet, 2012-2015 41Table 6.3 Financial Stability Indicators of Other Depository Corporations (Banks and NBDTIs) 42Table 6.4 Credit Concentration Risk by Region 46Table 6.5 Credit Concentration Risk 47Table 6.6 Exposure of Banks to Ten Largest Borrowers 47Table 6.7 Solvency Position of the Seven Long-term Insurers 50Table 6.8 Solvency Position of the Twelve General Insurers 50Table 6.9 Surplus Position for the Financial Year 2014 50Table 6.10 Surplus Position with Regard to ‘Investment Returns’ and ‘Interest Rate’ 50Table 6.11 Funding Ratio for Financial Years 2012-2014 51Table 6.12 Surplus Position of Pension Funds for Financial Years 2012-2014 51Table 6.13 Surplus Position of Pension Funds with Regard to ‘Investment Returns’ and
‘Interest Rate’51
Table 6.14 Number of Funds Licensed 52Table 6.15 Net Asset Value 52Table 8.1 Risks to Financial Stability for the Upcoming Six Months 63
List of Tables

70 | Bank of Mauritius
Chart 2.1 Purchasing Managers’ Index 6Chart 2.2 FAO Food Price Indices 6Chart 2.3 Crude Oil Prices 6Chart 2.4 Evolution of Major Currencies against the US Dollar 7Chart 2.5 Trade Growth 7Chart 2.6 MSCI World, Emerging Markets and Frontier Indices 8Chart 2.7 Volatility Indices 8Chart 3.1 Unemployment by Age Group 14Chart 3.2 Quarterly Change in Employment (Mauritians) 15Chart 3.3 Unit Labour Costs for the Total Economy 15Chart 3.4 Productivity and Wage Indices 15Chart 3.5 Annual Growth Rates of BML and NML 16Chart 3.6 Y-o-y Growth in Bank Credit to Private Sector 19Chart 3.7 Weighted Average Rupee Lending Rate by Sector 19Chart 3.8 Inflation and Weighted Average Rupee Deposit Rate 19Chart 3.9 Banks’ Monthly Average Excess Reserves 20Chart 3.10 Movement in Yields 21Chart 3.11 Nominal and Real Effective Exchange Rate of the Rupee 21Chart 3.12 Components of the Current Account 21Chart 3.13 Financing of the Current Account 23Chart 3.14 Gross Official International Reserves and Import Cover 23Chart 4.1 Inflation Dynamics 25Chart 4.2 Goods and Services Inflation (y-o-y) 25Chart 4.3 Core Inflation (y-o-y) 27Chart 4.4 Weighted Contribution of Various Food Products to Y-o-y Food Inflation 27Chart 4.5 Evolution of the Main Divisions’ Contribution to Y-o-y Inflation 27Chart 4.6 Inflation Expectations 28Chart 4.7 Contribution to Y-o-y Change in Import Prices 28Chart 4.8 Prices of Imported Mineral Fuels, Brent Crude Oil Prices and Adjusted MERI1 28Chart 4.9 Contribution of Commodity Groups to PPI-A 29Chart 4.10 Contribution of Main Industry Groups to PPI-M 29Chart 4.11 Headline Inflation 29Chart 4.12 Average Real GDP Growth 30Chart 4.13 Balance of Risks to the Inflation Outlook 30Chart 5.1 Y-o-y Growth of Credit to Households 33Chart 5.2 Share of Credit Extended by Banks to Households and Corporates 33Chart 5.3 Household Credit-to-GDP Gap 34Chart 5.4 Household Debt to Disposable Income 34Chart 5.5 Alternative Estimates of Household Indebtedness Ratio 34Chart 5.6 Household Debt in Selected Countries 35Chart 5.7 Household Debt Service Cost and Interest Rates 35Chart 5.8 Household Debt Service Cost in Selected Countries 35Chart 5.9 Corporate Debt to GDP Ratio in Selected Countries 36Chart 5.10 Credit-to-GDP Gap 37
List of Charts

71Monetary Policy and Financial Stability Report |
List of Charts
Chart 6.1 Banking Sector Assets 39Chart 6.2 Distribution of Banks’ Assets and Advances 40Chart 6.3 Return on Assets of the Banking Sector 43Chart 6.4 Return on Equity of the Banking Sector 43Chart 6.5 Tier 1 Capital 44Chart 6.6 Risk Diversification Matrix of Banks 45Chart 6.7 Non-Performing Loans of Banks 45Chart 6.8 Non-Performing Loans and Coverage Ratio 46Chart 6.9 Liquidity Ratios of Banks 46Chart 6.10 Y-o-y Growth of Total Assets and Deposits of NBDTIs 48Chart 6.11 Liquidity Indicators of NBDTIs 48Chart 6.12 Risk Diversification Matrix of NBDTIs 48Chart 6.13 NPL as a Ratio of Sectoral Credit in Key Sectors 49Chart 7.1 Transactions on MACSS 61Chart 7.2 Cheques Cleared 61Chart 7.3 Electronic Clearing Transactions 62Chart 7.4 Volume of Cheques and EFTs on BCS 62

72 | Bank of Mauritius
ATM Automated Teller Machine
BAI British American Insurance
BCS Bulk Clearing System
BML Broad Money Liabilities
BoE Bank of England
BoJ Bank of Japan
BRICS Brazil, Russia, India, China and South Africa
CEO Chief Executive Officer
CET1 Common Equity Tier 1
CPI Consumer Price Index
CRR Cash Reserve Ratio
DCs Depository Corporations
DR Disaster Recovery
DTAA Double Tax Avoidance Agreement
ECB European Central Bank
EFTs Electronic Fund Transfers
FAO Food and Agriculture Organisation
FDI Foreign Direct Investment
FPAS Forecasting and Policy Analysis System
FSAP Financial Sector Assessment Programme
FSC Financial Services Commission
FSR Financial Stability Report
GBC Global Business Companies
GDFCF Gross Domestic Fixed Capital Formation
GDP Gross Domestic Product
ICE Intercontinental Exchange
ICT Information and Communication Technology
IMF International Monetary Fund
IPI Import Price Index
HHI Herfindahl-Hirschman Index
KRR Key Repo Rate
MACSS Mauritius Automated Clearing and Settlement System
MDLS Mauritius Development Loan Stocks
MERI Mauritius Exchange Rate Index
MPC Monetary Policy Committee
Acronyms

73Monetary Policy and Financial Stability Report |
MSCI Morgan Stanley Capital International
NBDTIs Non-Bank Deposit-Taking Institutions
NFA Net Foreign Assets
NML Narrow Money Liabilities
NPL Non-Performing Loans
ODCs Other Depository Corporations
OPEC Organisation of the Petroleum Exporting Countries
PLACH Port Louis Automated Clearing House
PLR Prime Lending Rate
PMI Purchasing Managers’ Index
PPC Petroleum Pricing Committee
PPI-A Producer Price Index - Agriculture
PPI-M Producer Price Index - Manufacturing
PPSA Private Pension Scheme Act
ROA Return on Assets
ROE Return on Equity
RTGS Real Time Gross Settlement
SDDS Special Data Dissemination Standard
SDR Savings Deposit Rate
US FED US Federal Reserve Bank
WEO World Economic Outlook
Acronyms

74 | Bank of Mauritius
Basis point is a unit equal to one hundredth of a percentage point.
CORE1 inflation excludes food, beverages and tobacco and mortgage interest on housing loan from the CPI basket. Both headline and year-on-year CORE1 inflation measures are available.
CORE2 inflation excludes food, beverages and tobacco, mortgage interest, energy prices and administered prices from the CPI basket. Both headline and year-on-year CORE2 inflation measures are available.
Coverage ratio measures a bank’s ability to absorb losses from its non-performing loans.
Credit-to-GDP gap is the percentage deviation between the credit to GDP ratio and an estimate of its trend.
Cross-border exposures refer to exposures of banks outside Mauritius.
H1 refers to first semester.
H2 refers to second semester.
Headline inflation is measured by the change in the average Consumer Price Index (CPI) over a twelve-month period compared with the corresponding previous twelve-month period.
Key Repo Rate is the key policy rate used by the Bank of Mauritius to signal changes in its monetary policy stance.
Leverage ratio is used to calculate the financial leverage of a company to get an idea of the company’s methods of financing or to measure its ability to meet financial obligations. It is meant to evaluate the company’s debt levels.
MERI1 is the Mauritius Exchange Rate Index, a nominal effective exchange rate introduced in July 2008, based on the currency distribution of merchandise trade.
MERI2 is the Mauritius Exchange Rate Index, a nominal effective exchange rate introduced in July 2008, based on the currency distribution of merchandise trade and tourist earnings.
PMI refers to the Purchasing Managers’ Index of financial activity, reflecting purchasing managers’ acquisition of goods and services.
ROA is the annualised pre-tax return on assets and is measured by the ratio of pre-tax profit to average assets.
ROE is the annualised pre-tax return on equity and is measured by the ratio of pre-tax profit to average equity.
Seasonally-adjusted data are derived by removing the seasonal component of a time series in order to understand the underlying trends of the series.
SEM-10 is an index launched by the Stock Exchange of Mauritius on 02 October 2014. It is designed to meet international standards and provide a larger and more attractive investible benchmark for both domestic and foreign market participants and comprises the ten largest eligible shares of the Official Market, measured in terms of average market capitalisation, liquidity and investibility criteria.
Glossary

75Monetary Policy and Financial Stability Report |
SEMDEX is an index of prices of all listed shares on the Stock Exchange of Mauritius and each stock is weighted according to its share in the total market capitalisation.
The Herfindahl–Hirschman Index is a measure of the size of firms in relation to the industry and an indicator of the amount of competition among them. It is a commonly accepted measure of market concentration.
Tier 1 capital is a term used to qualify eligible capital of a bank and constitutes the component having the highest loss absorbing capacity.
Y-o-y change compares the value of a variable at one period in time compared with the same period the previous year.
Y-o-y inflation is measured by the change in the CPI for a given month compared with the corresponding month of the preceding year.
Glossary


BANK OF MAURITIUS
Address Sir William Newton Street Port Louis Mauritius
Website https://www.bom.mu ISSN 1694-2892
MONETARY POLICY AND FINANCIAL STABILITY REPORT
May 2016