monetary integration and real estate markets: an
TRANSCRIPT

Monetary integration and real estate markets: An investigation of the impact of the introduction of a single currency on real estate performance
Colin Lizieri, Patrick McAllister and Charles Ward
Department of Real Estate & Planning School of Business
The University of Reading Whiteknights, Reading, RG6 6AW
United Kingdom
[email protected] [email protected]
Abstract
This paper assesses the impact of the monetary integration on different types of stock returns in Europe. In order to isolate European factors, the impact of global equity integration and small cap factors are investigated. European countries are sub-divided according to the process of monetary convergence. Analysis shows that national equity indices are strongly influenced by global market movements, with a European stock factor providing additional explanatory power. The global and European factors explain small cap and real estate stocks much less well –suggesting an increased importance of ‘local’ drivers. For real estate, there are notable differences between core and non-core countries. Core European countries exhibit convergence – a convergence to a European rather than a global factor. The non-core countries do not seem to exhibit common trends or movements. For the non-core countries, monetary integration has been associated with increased dispersion of returns, lower correlation and lower explanatory power of a European factor. It is concluded that this may be explained by divergence in underlying macro-economic drivers between core and non-core countries in the post-Euro period.

2
Monetary integration and real estate markets: An investigation of the impact of the
introduction of a single currency on real estate performance
Colin Lizieri, Patrick McAllister & Charles Ward
1. Introduction
The introduction of a new currency for most European countries on 1 January 2002 was
the culmination of a far from smooth progression towards monetary integration over the
previous two decades. Following over a decade of pegging arrangements, a timetable for
the introduction of a single currency was introduced in 1991. The transition to EMU
(European Monetary Union) in the period 1992-1999 was to have variable implications
for the monetary and fiscal policies of aspirant members. This paper investigates the
effects of this change in monetary regime on the performance of European real estate
securities. This study builds on previous work by Lizieri et al. (2003) which examined
the changes in the behaviour of European common and real estate stocks in the period
1993-2001. The contribution of this paper is that it investigates the contribution of global
integration relative to European integration and takes into account the possibility that
segmentation in real estate securities may be due to the small capitalisation of many real
estate companies. Finally we also address the different a priori expectations for different
groups of economies.
The remainder of the paper is organized as follows. The next section examines existing
research on the effects of economic integration on capital market and real estate
performance. This includes a discussion of the variable timing of monetary integration for
different groups of European countries. This is followed by a discussion of the data,
methods and results of an empirical investigation of the effects of monetary integration
on patterns of performance of European publicly traded commercial real estate markets,
general equity markets and the small cap stock sector. The final section concludes and
identifies areas for further study.

3
2. Background
Studies of European equities, even those pre-dating the introduction of the single
currency, have found strong evidence integration of equity markets since the 1980s. Both
Freimann (1998) and Rouwenhorst (1999) found increases in average correlation between
national markets from approximately 0.2 in the 1980s to 0.6 in the 1990s. In more recent
research, Baele and Vennet (2001) found significantly positive contemporaneous
correlations between local excess returns and EU-15 returns ranging from 0.57 in
Belgium to 0.88 in the UK. Further, these increases between European markets were
significantly higher than changes in correlation between non-European markets. For the
major equity markets, there is evidence of reducing country effects relative to sector
effects. Since 1997, researchers have found that industry effects have overtaken country
effects (see Baca et al, 2000 and Cavaglia et al, 2000). However, recent research has
questioned the methodological basis of the country/industry research and the validity of
the empirical conclusions
Adjaouté and Danthine (2002) identify clear evidence of convergence up to 1992.
However, they find that the convergence of risk free rates in the late 1990s leaves no
trace on equity returns. They speculate that this is probably due to the fact that equity
premia are larger and more volatile than government bonds and that changes in equity
premia make it difficult to identify structural changes in the period following the
introduction of the Euro. Indeed, they report large increases in dispersion of returns in
2000-1 indicating that the post-Euro period has been very favourable for diversification
within the Euro area.
It should be noted that it does not follow that European real estate securities will display
similar patterns to general equities. Studies of integration of real estate securities have
found that they tend to display notably different behaviour than common stocks. A
number of stylized facts have emerged. Eichholtz (1996) found that the correlation
between national property markets were lower than for the other major asset classes.
Lizieri et al. (2003) also found that national real estate markets were much more

4
segmented than common stocks in that correlation were substantially lower and that
loadings on a common factor were less. Hamelink and Hoesli (2002), in a study of 21
countries, found similar behaviour in the correlation. There is also strong evidence to
suggest that real estate has become increasingly less strongly sensitive to common stocks.
Both Ling and Naranjo (2002) and Bond et al. (2002) report a falling beta for real estate
securities in the 1990s.
Focussing implicitly on global integration, there have been a number of recent studies
examining the relative contribution of systematic relative to country specific factors in
the explaining the behaviour of national real estate security markets and individual real
estate company returns. Ling and Naranjo (2002) used a simple two factor model to
measure the relative contribution of a world wide factor and country factors in company
real estate returns across a range of international markets. They found evidence of a
strong worldwide factor but that the country specific factor was significant in over 90%
of cases1. Interestingly, when they divided the data set into two sub-periods (1984-89 and
1990-99), they find only a slight increase in country real estate sensitivity to world
market movements. Bond et al. (2002) built on the work of Ling and Naranjo (2002) by
incorporating country value factors. In the period 1900-2001, in common with Ling and
Naranjo (2002), they found that the co-efficient of the global market factor was positive
and significantly different from zero (except for Germany). However, they also reported
that the portion of the variation in individual country excess returns explained by the
global market was low. It is interesting to note that they found that for France and
Netherlands, that the country specific factor was not significant. This is in contrast to all
the other European countries (except Germany) including Belgium, Italy, Spain, Sweden
and the UK. Looking at 21 countries in the period 1990-2002, Hamelink and Hoesli
(2002) calculated the “pure” effects of various factors on international real estate security
returns. The most relevant factors in this context were a common factor affecting all real
estate securities and a country of origin factor. When the common factor was extracted,
they unsurprisingly found that correlation were lower for pure country returns. However,
11 One recurring exception is Germany where we believe there may be data limitations due to the presence
and significance of open-ended funds.

5
an interesting finding in this context is that (for the 10 largest markets) average rolling
correlation coefficients were stable during the period 1990 2002. In the period mid-1996
to mid-1998 there was a notable drop in rolling average correlation. This probably
reflects the increase in currency volatility in the period 1992-1995.
Eichholtz et al. (1998) tested for the existence of “continental” factors in real estate
securities. They found evidence of a strong European effect with a significant continental
factor which appeared to increase in strength from the early 1990s with the completion of
the Single European Market and move toward Monetary Union. By contrast, they found
little evidence of a significant Asian continental factor. In private markets, confirming
earlier work by Case et al (1999), Goetzmann and Wachter (2000) used factor analysis on
property returns in a number of global cities and detected a “global” property factor
implying a source of common variation. However, they found that country effects
explained more of the variation in real estate returns than the global factor. In the real
estate sector, drawing upon the approach first employed by Heston and Rouwenhorst
(1994) and Beckers et al. (1996), Lee & D’Arcy (1998) examined sector, local and
national property market effects in Europe. They found that there were strong country
factors that dominated city and sector effects. Recent research by Grissom and Lizieri
(2003) applied a range of statistical tests to identify structural breaks in the performance
of real estate securities in the period 1989-2003. In the Eurozone, their findings are
consistent previous work on general equities. They report the major temporal
segmentation is observed between the periods 1989-92 and later periods. Whilst finding
evidence of increasing integration in the Eurozone relative to non-European markets and
non-Euro European markets, they also report that Germany, Ireland and Netherlands tend
to produce results contrary to an integration hypothesis.

6
3. Data and Research Methods
European real estate securities have characteristics that generate expectations about the
degree of integration relative to common stocks. A source of segmentation may be
relative differences in internationalisation. Lizieri et al. (2003) found that most European
real estate companies had mainly domestic portfolios. Excluding German open ended
funds, just over 10% of the European real estate companies were diversified across
countries whilst 80% had no non-domestic holdings. Since Dermeier and Solnik (2001)
found that the influence of international factors on returns was positively linked to level
of international business that the company performs, this home country bias might reduce
the significance of common factors. Also, the small size of many European real estate
companies may mean that they behave more like the ‘small cap’ sector. A lack of
integration may be due to the relatively small market capitalization of the sector rather
than any inherent ‘localness’ of real estate assets. Consequently we compare real estate
return behaviour with the ‘small cap’ sector as well as common stocks.
Whilst there are a number of clear consequences for European institutional investors of
the single currency relating in particular to reductions in the implications of currency
matching rules, the elimination of exchange rate uncertainty, cancellation of assets and
the convergence of risk free rates (and target rates of return). The implications of these
consequences are not necessarily uniform across countries in terms of timing and degree.
The degree of nominal convergence required to join the single currency varied between
countries. The relative significance of the ‘event’ of EMU for a national economy can be
related to the degree to which its performance varied from Core European yardsticks.
A number of countries had to significantly change their monetary and fiscal policy
‘behaviour’ in order to join the single currency whilst for others there were relatively
insignificant implications for macro-economic policy. In particular, a group of countries
around Germany,- Netherlands, Belgium, Austria, France and, to a lesser extent, Finland
had aligned themselves closely to German monetary and exchange rate policy in the
1980s and 1990s. Hereinafter, we call these the “Core” group of countries. A group of
‘southern’ economies (Spain, Italy, Portugal and Ireland), tended to have greater

7
volatility in macro-economic variables. It is in these four countries, the non-Core group,
that we should expect to see significant impacts of monetary integration. In contrast,
Sweden and the UK remained outside the single currency zone and were not part of the
monetary integration process. Denmark also remained outside the single currency zone
but has continued to ‘shadow’ Eurozone monetary policy.
Using short term interest rates as a portmanteau variable to capture variation in economic
variables such as inflation, exchange rate volatility and economic growth, Exhibits 1 & 2
illustrate both the major differences in the degree of nominal convergence prior to
January 1999 and in its timing. In essence, January 1999 was a ‘real’ monetary event for
the ‘southern’ economies whilst it had limited effects for the Core countries who had
converged in early 1996. Changes in short term real interest rates also suggest that EMU
had divergent effects on economic performance. The non-Core group received a
significant monetary stimulus due to substantial reductions in real interest rates relative to
other EMU members (Exhibit 3). However Exhibit 4 suggests that this monetary shift did
not produce significant differences in the relative GDP performance in the two periods.
We seek to examine indices of publicly-traded property companies in the Eurozone
countries to compare their performance to the ‘small cap’ and overall stock market
behaviour in those countries. Data are analysed for two different time periods. For the
Core group the effective date of monetary integration is assumed to be January 1996. For
the non-core group the effective date of monetary integration is taken as January 1999.
This causes a short sample problem. For Core countries reliable data are only available
for 36 months prior to convergence, for non-Core, we have 36 observations “after” the
event. There is a possibility that country-or sector specific shocks may, in the short term,
mask structural breaks. There are two further potential ‘masking’ issues that need to be
considered. First, the last six years have been associated with relatively geographically
synchronised bull and bear markets. Second, given that the series is in dollars, the Euro
currencies had been generally appreciating against the dollar in the period 1997-1999 and
then depreciating in the period 1999-20012.
2 Lizieri et al. (2003) note that the mean correlation between Eurozone countries exchange movements
against the dollar in the pre-1997 period was 0.90, so the actual impact may not be huge.

8
Exhibit 1: Variation in Treasury Bill Rates, Non-Core Countries
Exhibit 2: Variation in Treasury Bill Rates : Core Countries
Variations in T-bill rates
0.00
5.00
10.00
15.00
20.00
25.00
Jan-
93
Jul-9
3
Jan-
94
Jul-9
4
Jan-
95
Jul-9
5
Jan-
96
Jul-9
6
Jan-
97
Jul-9
7
Jan-
98
Jul-9
8
Jan-
99
Jul-9
9
Jan-
00
Jul-0
0
Jan-
01
Jul-0
1
Jan-
02
Year
Yiel
d
GermanyIrelandItalySpainPortugalGreece
Variations in T-bill rates
0.00
5.00
10.00
15.00
20.00
25.00Ja
n-93
Jul-9
3
Jan-
94
Jul-9
4
Jan-
95
Jul-9
5
Jan-
96
Jul-9
6
Jan-
97
Jul-9
7
Jan-
98
Jul-9
8
Jan-
99
Jul-9
9
Jan-
00
Jul-0
0
Jan-
01
Jul-0
1
Jan-
02
Year
Yiel
d
GermanyIrelandItalySpainPortugalGreece

9
Exhibit 3: Change in Short-Term Real Interest Rates
Exhibit 4: GDP Growth, 1995-1998 and 1999-2001
GDP growth 1995 1998 GDP growth 1999-2001 Rank Country Growth p.a. Rank Country Growth p.a.
1 Ireland 9.30 1 Ireland 9.43 2 Portugal 3.68 2 Spain 3.67 3 Netherlands 3.50 3 Finland 3.50 4 Spain 3.38 4 France 3.07 5 UK 2.98 5 Portugal 2.90 6 Denmark 2.70 6 Netherlands 2.77 7 EU 2.41 7 Belgium 2.67 8 Belgium 2.35 8 EU 2.55 9 Austria 2.18 9 UK 2.43 10 Italy 1.96 10 Austria 2.27 11 Finland 1.65 11 Denmark 2.10 12 France 1.65 12 Italy 2.08 13 Germany 1.48 13 Sweden 1.97 14 Sweden 1.25 14 Germany 1.80
Following a brief discussion of the descriptive statistics, our data analysis consists of
three approaches; standard deviation of returns, correlations between returns and a two
factor model. We begin by examining the correlation coefficients between the country
indices. Two analyses are performed. First, we examine the cross-sectional average
correlation between countries in the period the date of monetary integration.
Short term real interest ratesDifference in average annual percentage 1995-98 and 1999-2002
-4.5-4
-3.5-3
-2.5-2
-1.5-1
-0.50
Irelan
d
Portug
al
Italy
Spain
Finlan
d
Netherl
ands
France
Belgium
German
y
Austria
% d
iffer
ence

10
Given the discussion above, prior expectations are difficult to form. It is possible to
generate plausible cases for increased and decreased integration. We propose that
increased integration should be associated with the average correlation between European
countries will increasing in the post-convergence period and that cross-sectional standard
deviations will fall. In order to disentangle the separate effects of European monetary
integration from global financial integration, we also test for the relative importance of
global as against European integration factors using econometric methods. To obtain a
‘pure’ European factor, we first regress the European index returns on the global index
returns and save the residuals. For each of the three groups of equities, we estimate the
equation:
(Equation 1)
Where RE is the US dollar weighted excess return on a European index at time period t,
Rwt is the US dollar weighted excess turn on a global index at time period t, α is a
constant, βE is the return sensitivity of the European return to returns on the global index.
Rwt is the US dollar weighted excess turn on a global index at time period t, eit is the error
term.
The residuals from Equation 1 are retained as a proxy for a unique European equity factor
which is orthogonal to the global factor by construction. We then estimate the following
two factor equation:
Equation 2
For analysis, we have used monthly return data: using higher frequency data, while
increasing the number of observations, is likely to introduce excess noise into the
analysis. Since we examine the effect of monetary union, we cannot assume fully hedged
twtEEt eRR ++= βα
ittiEWtiWiit eRR µµµµββββββββαααα ++++++++++++====

11
indices without accounting for hedging costs, so we convert all series to provide US
dollar returns3. Thus, the analysis is conducted from the perspective of an investor whose
wealth portfolio is dollar denominated, and whose international investments are
unhedged. Although a standard approach in the international literature, this does presents
a number of problems, not least in that, as many series are now reported in Euros,
conversion requires the use of spliced currency series. This affects both the availability
and length of data series.
Aggregate and small cap stock equity market data for the individual countries were
obtained from DataStream. We use the MSCI global equity index as our equity market
series and a comparable Morgan Stanley series for small cap stocks. We examined other
global indices provided by DataStream and by Dow Jones: the results change little using
alternative indices.
Since there are known problems with the DataStream property market series, we
investigated the use of alternative sources. Two sources were available for property
company data: Global Property Research (GPR) and the European Public Real Estate
Association (EPRA), both of whom collect and analyse the stock market performance of
public listed real estate firms. For country indices and for the European index, we use
EPRA data. However, we have used the GPR global property index as our proxy for
world security indices. The span of the data runs from 1993 to 2001. In some cases,
notably for small cap stocks, there are insufficient firms to compute a reliable index for
the early months of the series.
3Further, the conversion to dollars raises the possibility that apparent increases in market integration result from the coordination of dollar-Euro movements by comparison to movements of the separate currencies. Cholley-Steeley and Steeley (op cit.) use dollar denominated returns but report that there was little difference in results when home-country denominated returns were used. Myer et al. (1997) argue that exchange-rate adjusted returns provide stronger evidence of structural change but found that in three or four cases there were no differences in Johansen test results for cointegration between nominal, real or exchange-rate adjusted series. Similarly, Eichholtz et al. (1998) report no difference between US dollar and local currency results in their investigation of continental factors in real estate returns.

12
4. Results
Descriptive statistics
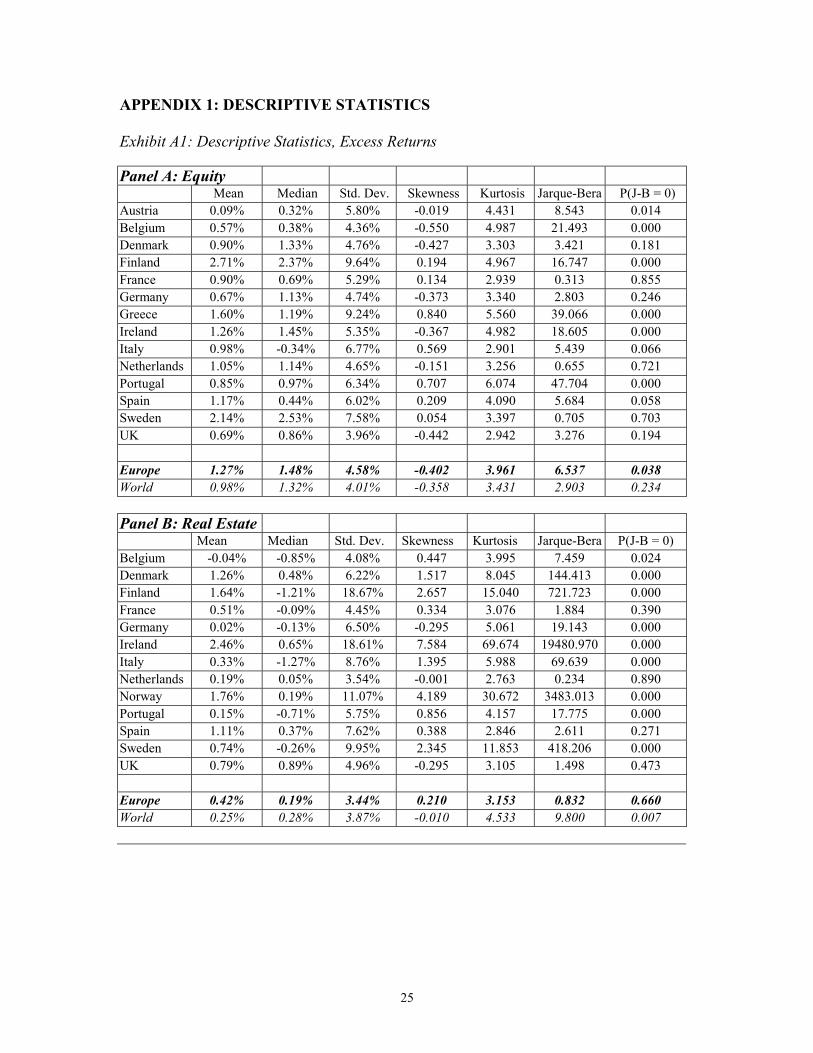
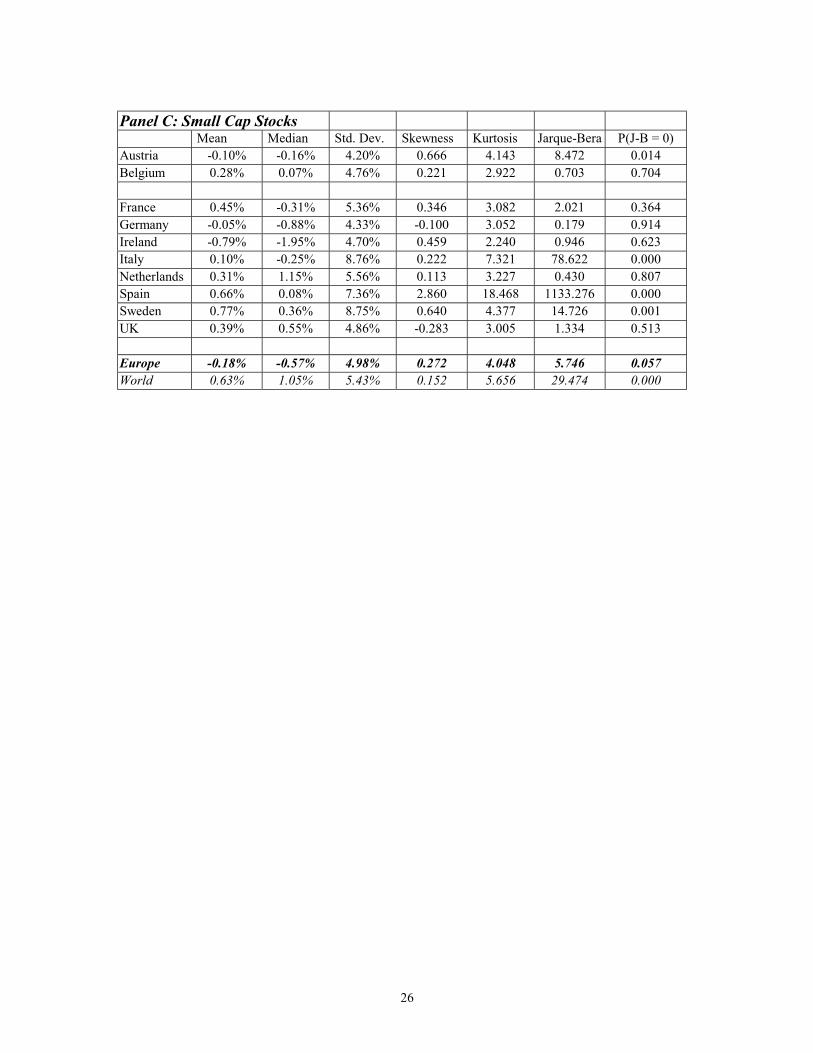
Basic descriptive statistics for the series are shown in Appendix Exhibit A1. Many series
fail conventional tests of normality, largely as a result of high kurtosis – fat tails being
characteristic of stock market series. This is particularly true of the real estate series,
where nine of 13 series have Jarque-Bera statistics significant at the 0.01 level. While this
does not affect the generality of the analysis conducted here, it needs to be borne in mind
in conducting any subsequent capital market pricing analysis or modelling work. In
addition, many of the real estate series show positive skewness. The overall equity series
typically have higher returns than the other two series (the unweighted annualised
average return for the equity series is 14.2% per annum compared to 10.6% for the real
estate series and 2.4% for small caps) without noticeably greater volatility. Generally, the
three sets of data conform to risk-return trade-off expectations. However, there is little
relationship in the ranking of countries by returns across the data sets. The mean returns
of small cap stocks have a –0.51 correlation with the mean returns of real estate stocks.
Exhibit 5 indicates the bull and bear market conditions in the 1997-2001 period. It is
noticeable that European real estate stocks in aggregate do not participate in the long bull
market growth phase (which is largely confined to technology and other growth stocks)
but trend upwards in the bear market phase. Exhibit 6 illustrates cross-section dispersion
using a twelve month trailing average of the cross-sectional standard deviation of returns
for equities, real estate shares and small cap stocks. Ignoring the data driven initial fall in
real estate variance (largely attributable to instability in Finland and the Scandinavian
markets), cross-sectional dispersion falls for real estate equities over time. More detailed
analysis suggests that the fall in real estate equity dispersion can be attributed largely to
the Core Euro countries. The cross-sectional standard deviations of the Non-Core
countries rise between 1997-1998 and then remain at a higher level than both those of
Core and Non-Euro countries. By contrast, equity dispersion trends upwards 1977-1999
then stabilises. Small cap stocks have a more uneven pattern. For non-real estate equities,
then, there is little evidence of a narrowing of absolute variation across countries.

13
Exhibit 5: Equity Indices, 1997-2001
Exhibit 6: Trailing 12 month average cross-sectional standard deviations
�������������������������������������������������������������������������������������������������������������������������������������������������������������������������������������������������������������
��������������������������������������������������������
��������������
����������������������
��������������������������������������������������������
����������������������
�����������������������������������������������������������������������������������������������������������������������������������������������������
��������������������������
������������������������������
0.00%
2.00%
4.00%
6.00%
8.00%
10.00%
12.00%
14.00%
16.00%
Dec-93
Jun-94
Dec-94
Jun-95
Dec-95
Jun-96
Dec-96
Jun-97
Dec-97
Jun-98
Dec-98
Jun-99
Dec-99
Jun-00
Dec-00
�����������������EquityReal EstateSmall Cap
�����������������������������������������������������������������������������������������������������������������������������������������������������������������������������������
�����������������������������������������������������������������������������������������������������������������������������������������������������������������������������������
�����������������������������������������������������������������������������������������������������������������������������������������������������������������������������������
�����������������������������������������������������������������������������������������������������������������������������������������������������������������������������������
�����������������������������������������������������������������������������������������������������������������������������������������������������������������������������������
�����������������������������������������������������������������������������������������������������������������������������������������������������������������������������������
�����������������������������������������������������������������������������������������������������������������������������������������������������������������������������������
��������������
��������������
������������
������������
���������������������
����������������
���������������������������
�����������������������������������
����������������
��������������
�����������������������������������������������������������
��������������
������������
����������������������������������
����������������
��������������
��������������
������������
������������������������������
����������������
����������������
��������������
���������������������
�����������������
������������������
������������������������
��������������
������������
������������
���������������������������
����������������������������������������
������
50.00
75.00
100.00
125.00
150.00
175.00
200.00
225.00
Jan-97
Apr-97
Jul-97
Oct-97
Jan-98
Apr-98
Jul-98
Oct-98
Jan-99
Apr-99
Jul-99
Oct-99
Jan-00
Apr-00
Jul-00
Oct-00
Jan-01
Apr-01
����������������World Equity Euro Equity Euro Real Estate
14
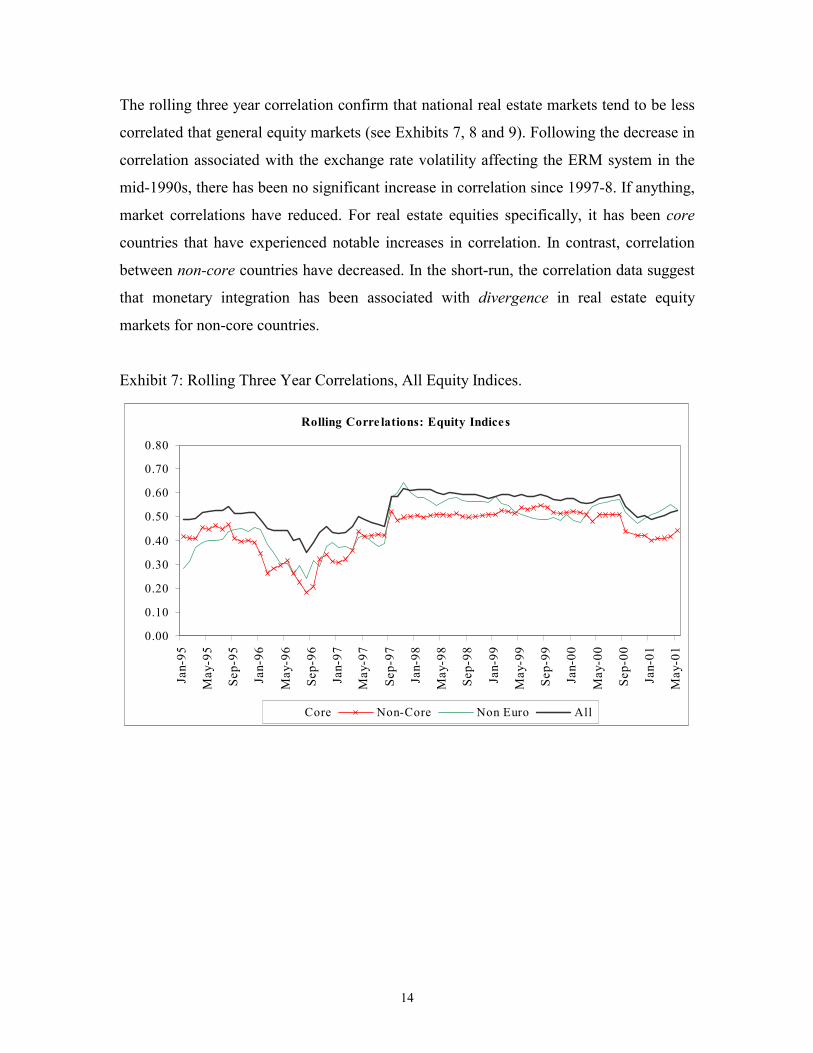
The rolling three year correlation confirm that national real estate markets tend to be less
correlated that general equity markets (see Exhibits 7, 8 and 9). Following the decrease in
correlation associated with the exchange rate volatility affecting the ERM system in the
mid-1990s, there has been no significant increase in correlation since 1997-8. If anything,
market correlations have reduced. For real estate equities specifically, it has been core
countries that have experienced notable increases in correlation. In contrast, correlation
between non-core countries have decreased. In the short-run, the correlation data suggest
that monetary integration has been associated with divergence in real estate equity
markets for non-core countries.
Exhibit 7: Rolling Three Year Correlations, All Equity Indices.
�������������������������������������������������������������������������������������������������������������������������������������������������������������������������������������������������������
��������������������������������������������������������������������������������������������������������������������������������������������������������������������������������������������������������������������������������������������������������������������������������������������������������������������������������������������������������������������������������������������������������������
������������������������������
��������������������������
������������
������������������������������������������������������������
����������������
������������������������
������������
�����������������������������
��������������
��������������������������
�����������������������
������������
����������������������
�����������������������������������������������������������������������������������������
������������������������
������������������������������
������������
������������������������������������������������������������������������������������������������������������
����������������������������������������
Rolling Corre lations: Equity Indices
0.00
0.10
0.20
0.30
0.40
0.50
0.60
0.70
0.80
Jan-
95
May
-95
Sep-
95
Jan-
96
May
-96
Sep-
96
Jan-
97
May
-97
Sep-
97
Jan-
98
May
-98
Sep-
98
Jan-
99
May
-99
Sep-
99
Jan-
00
May
-00
Sep-
00
Jan-
01
May
-01
���������������Core Non-Core Non Euro All

15
Exhibit 8: Rolling Three Year Correlations, Real Estate Indices.
Exhibit 9: Rolling Three Year Correlations, Small Cap Stocks
���������������������������������������������������������������������������������������������������������������������������������������������������������������������������������������
���������������������������������������������������������������������������������������������������������������������������������������������������������������������������������������
���������������������������������������������������������������������������������������������������������������������������������������������������������������������������������������
���������������������������������������������������������������������������������������������������������������������������������������������������������������������������������������
���������������������������������������������������������������������������������������������������������������������������������������������������������������������������������������
���������������������������������������������������������������������������������������������������������������������������������������������������������������������������������������
��������������������������������������������������������
�����������������������������������������
���������������������������
�������������������������
��������������
��������������������������������������������������������������
��������������
������������������������������������
������������������������������������������������������������������������������
��������������������
�����
����������������������
������������
�����������������������������������������������
����������������
�����������������
����������������
��������������
������������
������������
��������������������
-0.10
0.00
0.10
0.20
0.30
0.40
0.50
Dec-9
5
Apr-96
Aug-9
6
Dec-9
6
Apr-97
Aug-9
7
Dec-9
7
Apr-98
Aug-9
8
Dec-9
8
Apr-99
Aug-9
9
Dec-9
9
Apr-00
Aug-0
0
Dec-0
0
Apr-01
����������������� Core Non-Core Non-Euro All
��������������������������������������������������������������������������������������������������������������������������������������������������������������������������������������
��������������������������������������������������������������������������������������������������������������������������������������������������������������������������������������
��������������������������������������������������������������������������������������������������������������������������������������������������������������������������������������
��������������������������������������������������������������������������������������������������������������������������������������������������������������������������������������
��������������������������������������������������������������������������������������������������������������������������������������������������������������������������������������
��������������������������������������������������������������������������������������������������������������������������������������������������������������������������������������
��������������������������������������������������������������������������������������������������������������������������������������������������������������������������������������
��������������������������������������������������������������������������������������������������������������������������������������������������������������������������������������
�����������������������������������������������������������������������
�������������������������������
���������������������������������
�����������������������������������
��������������
�����������������������������������
��������������
������������
���������������������
�����������������������
������������
��������������������������������������������������������������������
��������������������������
�����������������������
��������������������
���������������������
������������
�����������������������������������������������������������
������������������������������������
0.00
0.10
0.20
0.30
0.40
0.50
0.60
0.70
0.80
Dec-9
5
Apr-96
Aug-9
6
Dec-9
6
Apr-97
Aug-9
7
Dec-9
7
Apr-98
Aug-9
8
Dec-9
8
Apr-99
Aug-9
9
Dec-9
9
Apr-00
Aug-0
0
Dec-0
0
Apr-01
���������������Core Non-Core Non-Euro All

16
Global or European integration?
Exhibit 10 shows output from the three first step regressions intended to generate the
orthogonal European factors. It is noticeable that the GPR world index explains a low
proportion of European property company performance relative to the explanation of
European stock variation provided by the global equity index. European small cap stocks,
like real estate stocks, are not strongly explained by the global index. We should note
that, while we have used the Morgan Stanley global small cap index to provide
consistency with overall equity indices, the Dow Jones world small cap index has a
higher correlation with the DataStream European index.
Exhibit 10: European Orthogonalization Regressions, Full Sample Period All Equities Small Cap Stocks Real Estate
Constant (t) 0.003 (1.25) -0.005 (-1.33) 0.003 (1.05)
Beta (t) 1.01 (19.04)*** 0.56 (7.65)*** 0.44 (5.70)***
Adjusted R2 0.78 0.37 0.37
S.E. Regression 0.02 0.04 0.02
F Statistic 362.60*** 58.44*** 58.67***
Durbin Watson 2.13 1.96 1.81
AIC -4.85 -3.55 -5.24
Notes: Regression of relevant European index on World index, White heteroscedasticity consistent standard errors. *** significant at 0.001 level

17
Exhibit A5 in the appendix shows summary results for the country equity indices over the
whole sample period. For all countries in the sample, the World index has significant
explanatory power at the 0.001 or 0.01 level. The average adjusted R2 for the single
factor model is 36%. Adding the European factor increases average R2 to 43%. Only for
Finland and Ireland is there no apparent European effect. There are no discernable
differences between the core and non-core groups of Eurozone countries. Of the three
countries outside the Eurozone, there are only weak European effects in Denmark and the
UK. However, Sweden shows the strongest European influence, with betas significant at
the 0.001 level and beyond and explanatory power increasing from 40% to 60%.
Exhibit A6 shows equivalent results for small cap stocks in Europe. The overall level of
explanation is far lower, for both single and two factor models, adjusted R2 averaging
19% and 29% respectively. Despite lower explanatory power, betas for the global index
are significantly different from zero for all countries except Belgium. Belgium, Ireland
and Sweden are not influenced by the European factor. Excluding those three countries,
average explanatory power increases from 18% to 32%.
Exhibit A7 summarises the real estate results for the whole period. As implied in prior
research, property indices appear to be more local/regional in nature. On average, only
7% of variation in country property company indices is explained by the GPR world real
estate index. This low explanatory power holds even where βiW is significantly different
from zero. Only for the UK and the Netherlands is the single factor model adjusted R2
above 20%4. Only Sweden and Italy appear not to be influenced by the European factor.
Moving from the single factor to the two factor model increases average explanatory
power to 23% (still below the small cap stock average R2). The UK’s R2 of 68% is
probably a compositional effect, with the UK property company sector making up a
significant share of the European composite index. The core group of Eurozone countries
appear to be more strongly influenced by the European factor than the later, non-core
group and the non-Euro group with the exception of the UK.
4 For much of the analysis period, Dutch property company investment strategy was more international than domestic in nature. However, the same could be argued regarding Swedish real estate investment.
18
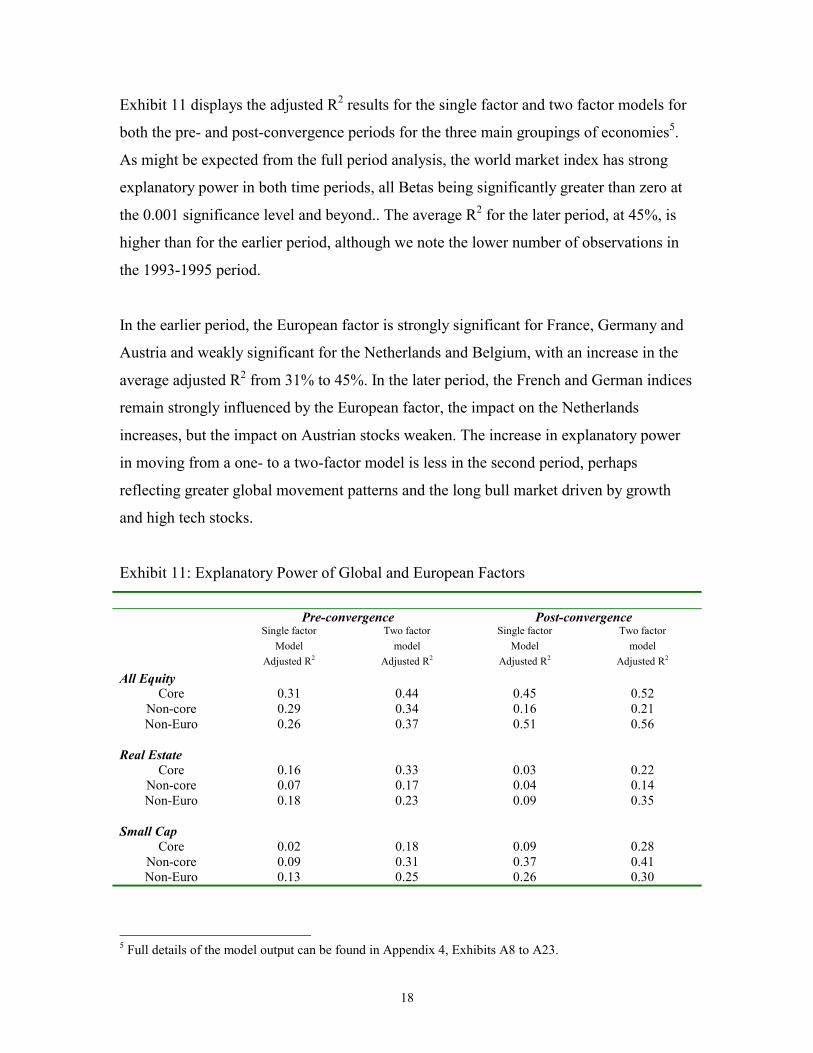
Exhibit 11 displays the adjusted R2 results for the single factor and two factor models for
both the pre- and post-convergence periods for the three main groupings of economies5.
As might be expected from the full period analysis, the world market index has strong
explanatory power in both time periods, all Betas being significantly greater than zero at
the 0.001 significance level and beyond.. The average R2 for the later period, at 45%, is
higher than for the earlier period, although we note the lower number of observations in
the 1993-1995 period.
In the earlier period, the European factor is strongly significant for France, Germany and
Austria and weakly significant for the Netherlands and Belgium, with an increase in the
average adjusted R2 from 31% to 45%. In the later period, the French and German indices
remain strongly influenced by the European factor, the impact on the Netherlands
increases, but the impact on Austrian stocks weaken. The increase in explanatory power
in moving from a one- to a two-factor model is less in the second period, perhaps
reflecting greater global movement patterns and the long bull market driven by growth
and high tech stocks.
Exhibit 11: Explanatory Power of Global and European Factors
Pre-convergence Post-convergence
Single factor Two factor Single factor Two factor
Model model Model model
Adjusted R2 Adjusted R2 Adjusted R2 Adjusted R2
All Equity Core 0.31 0.44 0.45 0.52
Non-core 0.29 0.34 0.16 0.21 Non-Euro 0.26 0.37 0.51 0.56
Real Estate
Core 0.16 0.33 0.03 0.22 Non-core 0.07 0.17 0.04 0.14 Non-Euro 0.18 0.23 0.09 0.35
Small Cap
Core 0.02 0.18 0.09 0.28 Non-core 0.09 0.31 0.37 0.41 Non-Euro 0.13 0.25 0.26 0.30
5 Full details of the model output can be found in Appendix 4, Exhibits A8 to A23.

19
For the non-core countries, there is a sample size issue as the period after the “Euro
shock” is comparatively short. In the earlier period, the national indices are strongly
influenced by the world index, but at best weakly influenced by the European factor. The
results for the later period show a fall in explanatory power in both the single and two-
factor models. The increase in average adjusted R2 is almost entirely attributable to the
association between Italian equities and the European factor. In the absence of any
evidence of an increase in correlation between the indices of the non-core group, it is
hard to see any evidence of equity market convergence. Indeed, whilst for all non-core
countries, the European factor is significant in the pre-convergence period, this is only he
case for Spain in the post-convergence period. There are insufficient data to attribute this
to adjustment effects associated with the Euro regime.
The analysis performed for the all equity indices was repeated for the real estate stocks.
As expected, variation in real estate stock indices is explained much less by movements
in the world index than was the case for all equities. The two factor model incorporating a
European factor consistently explains more of the variation than the single factor global
index model but, nonetheless, there remains considerable unexplained, possibly national,
variation. Most significantly, for those countries that adopted the Euro, the two-factor
model explains less of the variation in returns in the post convergence period.
For the core countries, in the pre-1996 period, only French returns are strongly associated
with movements in the world index and, in particular, in the European factor. After 1996,
the European factor becomes more important: betas are statistically significant for all five
countries. The world index becomes of less significance, only the beta of the Netherlands
being strongly different from zero. In the post-convergence period, the adjusted R2 for the
single factor models is 3%. This result provides confirmation for the trends observed in
the rolling correlations, above. By contrast, for the non-core countries, the explanatory
power of the European factor weakens after 1999 – with the one exception of Spain,
whose beta with the European factor is strongly significant. It is the non-EU countries
that show the strongest link to the European factor, particularly post 1996. As noted

20
above, the UK result needs to be treated with some caution given that UK property
companies made up a large proportion of the EPRA property index.
Caution is necessary in interpreting the small cap stock results given data problems and
unstable composition of the indices. For Core countries, in the pre-1996 period, the world
factor has little influence (with no country exhibiting a significant beta). The European
stock factor is significant for France, Germany and the Netherlands, but increases the
adjusted R2 from just 2% to 18%. After lock-in, the world index becomes more
significant, but still only explains 9% of variation. The European factor is significant for
all countries bar Belgium; its inclusion increases the adjusted R2 to 28%. This is largely
driven by the increase in explanatory power in the Netherlands (from 5% to 47%).
Data for non-Core countries is unstable: for much of the period figures are only available
for Spain and Italy. In the pre-convergence period, the European factor increases
explanatory power from 9% to 31%. In the post-convergence period, the global factor
becomes more important: the betas on the European factor are, in all cases, insignificantly
different from zero and adding in the European factor decreases the average R2 from 41%
to 37%. There is, thus, no evidence of a post-Euro convergence in small cap stocks for
the non-Core countries. Of the non-Euro countries, UK small cap stocks moved with both
World and European factors (inclusion of the European factor increasing explanation
from 26% to 47%. Swedish small cap stocks seem unaffected by either factor. Post-1997,
Swedish stocks are linked to world equities but not to the Euro factor, while UK stocks
are related to both. On average, adding in the Europe factor increases the adjusted R2
from 26% to 30%, all driven by behaviour of the UK index.

21
5. Summary and Conclusions
This paper assesses the impact of the monetary integration on different types of stock
returns in Europe. In particular, it investigates the extent to which input convergence (a
common currency and interest rate) has produced output convergence in equity returns.
There is no automatic presumption that nominal (input) convergence will be produce real
(output) convergence. Where economies within single currency areas are experiencing
contrasting economic performances, the inability to use the exchange rate, monetary
policy and, to a lesser extent, fiscal policy as adjustment mechanisms can serve to
intensify differences in the level of economic (and real estate) activity. In order to isolate
European factors, the impact of a global equity integration and small cap factors are
investigated. Further, the European countries are sub-divided according to the process of
monetary convergence.
One finding is that differences in real estate price movements cannot simply be attributed
to a small cap effect since there is negative correlation between the small cap sector and
the real estate sector. Nor do real estate and small cap have similar drivers. Analysis
over the whole period shows that national equity indices are strongly influenced by global
market movements, with a European stock factor providing additional explanatory power.
The single and two factor models explain small cap and real estate stocks much less well
– probably indicating the increased importance of ‘local’ drivers. The global factor is
more significant for small cap stocks than for real estate. Although a European property
factor strengthens the amount of variation in real estate stock prices explained, but there
remains considerable unexplained variation.
The data when broken down by time period present some relatively clear-cut results that
are difficult to explain. For the wider equity markets, there is some evidence of
convergence in overall equity returns – but this relates as much to global integration as to
European monetary integration. For real estate, there are notable differences between core
and non-core countries. It is clear that the core European countries do exhibit
convergence – a convergence to a European rather than a global factor. In marked

22
contrast, the non-core, southern countries that might have been anticipated as
experiencing the greatest impact from the macro-economic changes associated with the
Euro project do not seem to exhibit common trends or movements. For the non-core
countries, monetary integration has been associated with increased dispersion of returns,
lower correlation and lower explanatory power of a European factor. This may be
explained by divergence in underlying macro-economic drivers between core and non-
core countries in the post-Euro period. Variations in real interest rates, in particular, will
have divergent effects on real estate market drivers. Further it may simply be that it is too
soon for such trends to emerge as the adjustment processes take their effect.

23
Bibliography
Adjaouté, K. and Danthine, J-P, European Financial Integration and Equity Returns: A Theory-Based Assessment, Paper presented at Second ECB Central Banking Conference, October, 2002.
Baca, S. Garb, B. and Weiss, R., The Rise of Sector Effects in Major Equity Markets, Financial Analysts Journal, September-October, 2000, 34-40
Baele, L. and Vennet, R., European Stock Market Integration and EMU, Paper in progress, Department of Financial Economics, Ghent University, 2001
Beckers, S., Connor, G. and Curds, R. National versus Global Influences on Equity Returns Financial Analysts Journal 52:2, 31-39.
Bond, S. Karolyi, G. and Sanders, A., International Real Estate Returns: A Multifactor, Multicountry Approach, mimeo
Case, B. Goetzman, W. and Rouwenhorst K Global Real Estate Markets – Cycles and Fundamentals, mimeo, Yale School of Management, 1999.
Chelley-Steeley, P. and Steeley, J., Changes in the Comovement of European Equity Markets, Economic Inquiry, 1999, 37:3, 473-488.
Cavaglia, S. Brightman, C and Akev, C., The Increasing Importance of Industry Factors, Financial Analysts Journal, September-October, 2000, 41-53.
Eichholtz, P., Does International Diversification Work Better for Real Estate than for Stocks and Bonds Financial Analysts Journal Jan-Feb, 1996, 56-62.
Eichholtz, P., Huisman, R., Koedick, K. and Schuin, L., Continental Factors in International Real Estate Returns Real Estate Economics, 1998, 26(3) 493-509.
Freimann, E., European Integration and Country Allocation in Europe Financial Analysts Journal, September-October, 1998, 32-41
Goetzman, W. and Wachter, S., The Global Real Estate Crash: Evidence From An International Database in S. Brown and C. Liu (eds) A Global Perspective on Real Estate Cycles Dordrecht: Kluwer. 2000.
Grissom, T. and Lizieri, C. Exchange Rate Regime Impacts on Real Estate Securities Returns: The Euro Conversion, Grisham’s Law and the Law of One Price Paper delivered at ERES conference, June 2003.
Hamelink, F. and Hoesli, M What factors determine international real estate security returns, FAME Research Paper, No. 20, July 2002.
Heston, S. and Rouwenhorst, K. (1994) Does Industrial Structure Explain the Benefits of International Diversification? Journal of Financial Economics, 1994, 36, 5-25.
Lee, S. and D’Arcy, P.E., A Real Estate Portfolio Strategy for Europe Journal of Real Estate Portfolio Management, 1998, 4(2) 113-123.
Ling, D. and Naranjo, N. Commercial Real Estate Return Performance: A Cross-country Analysis, Journal of Real Estate Finance and Economics, 24, 119-142

24
Lizieri, C. McAllister, P. and Ward, C. Continental Shift: An analysis of convergence trends in European real estate. Journal of Real Estate Research, 2003, 25(1), 1-22.
Myer, F.C.N., Chauhry, M. and Webb, J., Stationarity and Co-Integration in Systems with Three National Real Estate Indices Journal of Real Estate Research, 1997, 13(3), 369-381.
Rouwenhorst, K., European Equity Markets and the EMU, Financial Analysts Journal, May/June, 1999, 57-64.
25
APPENDIX 1: DESCRIPTIVE STATISTICS Exhibit A1: Descriptive Statistics, Excess Returns Panel A: Equity Mean Median Std. Dev. Skewness Kurtosis Jarque-Bera P(J-B = 0) Austria 0.09% 0.32% 5.80% -0.019 4.431 8.543 0.014 Belgium 0.57% 0.38% 4.36% -0.550 4.987 21.493 0.000 Denmark 0.90% 1.33% 4.76% -0.427 3.303 3.421 0.181 Finland 2.71% 2.37% 9.64% 0.194 4.967 16.747 0.000 France 0.90% 0.69% 5.29% 0.134 2.939 0.313 0.855 Germany 0.67% 1.13% 4.74% -0.373 3.340 2.803 0.246 Greece 1.60% 1.19% 9.24% 0.840 5.560 39.066 0.000 Ireland 1.26% 1.45% 5.35% -0.367 4.982 18.605 0.000 Italy 0.98% -0.34% 6.77% 0.569 2.901 5.439 0.066 Netherlands 1.05% 1.14% 4.65% -0.151 3.256 0.655 0.721 Portugal 0.85% 0.97% 6.34% 0.707 6.074 47.704 0.000 Spain 1.17% 0.44% 6.02% 0.209 4.090 5.684 0.058 Sweden 2.14% 2.53% 7.58% 0.054 3.397 0.705 0.703 UK 0.69% 0.86% 3.96% -0.442 2.942 3.276 0.194 Europe 1.27% 1.48% 4.58% -0.402 3.961 6.537 0.038 World 0.98% 1.32% 4.01% -0.358 3.431 2.903 0.234
Panel B: Real Estate Mean Median Std. Dev. Skewness Kurtosis Jarque-Bera P(J-B = 0) Belgium -0.04% -0.85% 4.08% 0.447 3.995 7.459 0.024 Denmark 1.26% 0.48% 6.22% 1.517 8.045 144.413 0.000 Finland 1.64% -1.21% 18.67% 2.657 15.040 721.723 0.000 France 0.51% -0.09% 4.45% 0.334 3.076 1.884 0.390 Germany 0.02% -0.13% 6.50% -0.295 5.061 19.143 0.000 Ireland 2.46% 0.65% 18.61% 7.584 69.674 19480.970 0.000 Italy 0.33% -1.27% 8.76% 1.395 5.988 69.639 0.000 Netherlands 0.19% 0.05% 3.54% -0.001 2.763 0.234 0.890 Norway 1.76% 0.19% 11.07% 4.189 30.672 3483.013 0.000 Portugal 0.15% -0.71% 5.75% 0.856 4.157 17.775 0.000 Spain 1.11% 0.37% 7.62% 0.388 2.846 2.611 0.271 Sweden 0.74% -0.26% 9.95% 2.345 11.853 418.206 0.000 UK 0.79% 0.89% 4.96% -0.295 3.105 1.498 0.473 Europe 0.42% 0.19% 3.44% 0.210 3.153 0.832 0.660 World 0.25% 0.28% 3.87% -0.010 4.533 9.800 0.007
26
Panel C: Small Cap Stocks Mean Median Std. Dev. Skewness Kurtosis Jarque-Bera P(J-B = 0) Austria -0.10% -0.16% 4.20% 0.666 4.143 8.472 0.014 Belgium 0.28% 0.07% 4.76% 0.221 2.922 0.703 0.704 France 0.45% -0.31% 5.36% 0.346 3.082 2.021 0.364 Germany -0.05% -0.88% 4.33% -0.100 3.052 0.179 0.914 Ireland -0.79% -1.95% 4.70% 0.459 2.240 0.946 0.623 Italy 0.10% -0.25% 8.76% 0.222 7.321 78.622 0.000 Netherlands 0.31% 1.15% 5.56% 0.113 3.227 0.430 0.807 Spain 0.66% 0.08% 7.36% 2.860 18.468 1133.276 0.000 Sweden 0.77% 0.36% 8.75% 0.640 4.377 14.726 0.001 UK 0.39% 0.55% 4.86% -0.283 3.005 1.334 0.513 Europe -0.18% -0.57% 4.98% 0.272 4.048 5.746 0.057 World 0.63% 1.05% 5.43% 0.152 5.656 29.474 0.000

27
Appendix Two: Correlations Between Series Exhibit A2: Contemporaneous Correlation: World Indices
Equities Small Cap Real Estate Equities 1.00
Small Cap 0.61 1.00 Real Estate 0.61 0.43 1.00
Exhibit A3: Contemporaneous Correlation: European Indices
Equities Small Cap Real Estate Equities 1.00
Small Cap 0.68 1.00 Real Estate 0.41 0.33 1.00
Exhibit A4: Contemporaneous Correlation: European Unique Factors
Equities Small Cap Real Estate Equities 1.00
Small Cap 020 1.00 Real Estate 0.36 0.18 1.00

28
Appendix 3: Full Series Factor Models
Exhibit A5: Summary Results for All Equity Indices
One and Two Factor Models MSCI Monthly Data (US dollar returns)
February 1993-May 2001 Single factor Two factor Equities 1993-2001 model Model Country βiW βiE Adjusted R2 Adjusted R2 Austria 0.80 *** 0.80 *** 0.30 0.40 Belgium 0.56 *** 0.41 * 0.26 0.29 Denmark 0.67 *** 0.43 * 0.32 0.35 Finland 1.55 *** 0.42 0.41 0.41 France 0.92 *** 0.93 *** 0.49 0.63 Germany 0.83 *** 0.74 *** 0.49 0.60 Greece 0.65 ** 1.08 * 0.07 0.12 Ireland 0.71 *** -0.03 0.28 0.27 Italy 0.81 *** 1.11 *** 0.22 0.34 N'lands 0.86 *** 0.52 *** 0.54 0.60 Portugal 0.72 *** 1.11 *** 0.20 0.33 Spain 1.00 *** 0.54 * 0.44 0.47 Sweden 1.20 *** 1.47 *** 0.40 0.56 UK 0.75 *** 0.28 * 0.57 0.60 Average 0.36 0.43

29
Exhibit A6: Summary Results for Small Cap Stock Indices
Two Factor Model
MSCI Small Cap Monthly Data (US dollar returns) February 1993-May 2001
Single factor Two factor
Small cap model Model
Country βiW βiE Adjusted R2 Adjusted R2 Austria 0.29 *** 0.42 *** 0.18 0.33 Belgium 0.02 0.15 -0.01 -0.01 France 0.41 *** 0.58 *** 0.16 0.34 Germany 0.27 *** 0.42 *** 0.11 0.25 Ireland 0.38 *** -0.03 0.46 0.41 Italy 0.59 *** 0.86 *** 0.13 0.27 N'lands 0.54 *** 0.58 *** 0.26 0.42 Spain 0.55 *** 0.65 *** 0.16 0.27 Sweden 0.68 *** 0.33 0.17 0.18 UK 0.46 *** 0.47 *** 0.27 0.40 Average 0.19 0.29

30
Exhibit A7 Summary Results for Real Estate Equity Indices
One and Two Factor Model
EPRA Monthly Data (US dollar returns) February 1993-May 2001
Single factor Two factor Real estate equities
model model
Country βiW βiE Adjusted R2 Adjusted R2 Belgium 0.27 *** 0.65 *** 0.06 0.28 Denmark 0.35 * 0.52 * 0.04 0.13 Finland 1.01 * 1.90 ** 0.03 0.12 France 0.30 *** 1.00 *** 0.06 0.51 Germany 0.00 0.72 *** -0.01 0.09 Ireland 1.20 ** 2.03 *** 0.05 0.15 Italy 0.10 0.57 -0.01 0.02 N'lands 0.43 *** 0.46 *** 0.21 0.36 Portugal 0.12 0.61 ** 0.00 0.09 Spain 0.73 *** 0.96 *** 0.13 0.26 Sweden 0.74 ** 0.22 0.07 0.07 UK 0.63 *** 1.11 *** 0.23 0.68 Average 0.07 0.23

31
Appendix Four: Sub-Period Analyses, Factor Models
Exhibit A8: Core Countries, All Equities, pre-1996 Two Factor Model Core countries
MSCI Monthly Data (US dollar returns) February 1993-December 1995
Single factor Two factor
Equities Model model Country βiW βiE Adjusted R2 Adjusted R2
Austria 1.02 *** 1.22 ** 0.24 0.47 Belgium 0.73 *** 0.49 * 0.31 0.39 Finland 1.64 *** 0.07 0.38 0.36 France 0.93 *** 1.14 *** 0.25 0.47 Germany 0.71 *** 0.9 ** 0.18 0.39 N'lands 0.91 *** 0.46 * 0.48 0.53 Average 0.31 0.44
Exhibit A9: Core Countries, All Equities, post-1996
Two Factor Model – Core countries
MSCI Monthly Data (US dollar returns) January 1996-May 2001
Single factor Two factor
Equities Model model Country βiW βiE Adjusted R2 Adjusted R2
Austria 0.77 *** 0.63 * 0.32 0.48 Belgium 0.53 *** 0.39 0.24 0.26 Finland 1.52 *** 0.64 0.41 0.42 France 0.93 *** 0.82 *** 0.58 0.68 Germany 0.86 *** 0.67 *** 0.6 0.67 N'lands 0.84 *** 0.58 ** 0.56 0.61
Average 0.45 0.52

32
Exhibit A10: Non-Core Countries, All Equities, pre-1999 Two Factor Model – Non core countries MSCI Monthly Data (US dollar returns)
February 1993-Decmber 1998
Single factor Two factor Equities Model model Country βiW βiE Adjusted R2 Adjusted R2
Spain 1.09 *** 0.51 * 0.48 0.50 Greece 0.70 ** 1.06 * 0.10 0.16 Ireland 0.82 *** 0.01 0.35 0.34 Italy 0.83 ** 0.85 * 0.22 0.28 Portugal 0.88 ** 1.22 ** 0.30 0.44
Average 0.29 0.34
Exhibit A11: Non-Core Countries, All Equities, post-1999
Two Factor Model – Non core countries MSCI Monthly Data (US dollar returns)
January 1999-May 2001
Single factor Two factor Equities Model model Country βiW βiE Adjusted R2 Adjusted R2
Spain 0.79 *** 0.51 0.43 0.38 Greece 0.50 1.04 0.00 0.00 Ireland 0.43 -0.27 0.13 0.10 Italy 0.83 ** 1.72 ** 0.19 0.52 Portugal 0.32 0.62 0.01 0.04
Average 0.16 0.21

33
Exhibit A12: Non-Euro Countries, All Equities, pre-1996
Two Factor Model – Non € countries MSCI Monthly Data (US dollar returns)
February 1993-December 1995
Single factor Two factor
Equities Model Model Country βiW βiE Adjusted R2 Adjusted R2
Denmark 0.68 ** 0.20 0.19 0.17 Sweden 1.18 ** 1.91 *** 0.13 0.39 UK 0.94 *** 0.47 * 0.46 0.56
Average 0.26 0.37 The results for the sub-period 1993-1998 are not materially different.
Exhibit A13: Non-Euro Countries, All Equities, post-1996
OLS Estimation Two Factor Model – Non € countries
MSCI Monthly Data (US dollar returns) January 1996-May 2001
Single factor Two factor Equities Model Model Country βiW βiE Adjusted R2 Adjusted R2
Denmark 0.67 *** 0.56 * 0.36 0.40 Sweden 1.21 *** 1.24 *** 0.53 0.65 UK 0.71 *** 0.72 0.63 0.64
Average 0.51 0.56
The results for the sub-period 1999-2001 are not materially different.

34
Exhibit A14: Core Countries, Real Estate, pre-1996
Two Factor Model – Core countries EPRA Monthly Data (US dollar returns)
February 1993-December 1995
Single factor Two factor Real estate equities
Model Model
Country βiW βiE Adjusted R2 Adjusted R2
Belgium 0.26 0.48 * 0.16 0.27 Finland 1.88 3.22 0.11 0.18 France 0.36 ** 1.22 *** 0.24 0.66 Germany -0.03 0.48 -0.03 0.04 N'lands 0.37 ** 0.66 ** 0.30 0.52
Average 0.16 0.33
Exhibit A15: Core Countries, Real Estate, post-1996
Two Factor Model – Core countries EPRA Monthly Data (US dollar returns)
January 1996-December May 2001
Single factor Two factor Real estate equities
Model Model
Country βiW βiE Adjusted R2 Adjusted R2
Belgium 0.3 * 0.73 *** 0.02 0.28 Finland 0.17 1.05 * -0.02 0.06 France 0.22 * 0.88 *** 0.00 0.41 Germany 0.06 0.83 ** -0.02 0.09 N'lands 0.43 *** 0.39 ** 0.17 0.27
Average 0.03 0.22
35
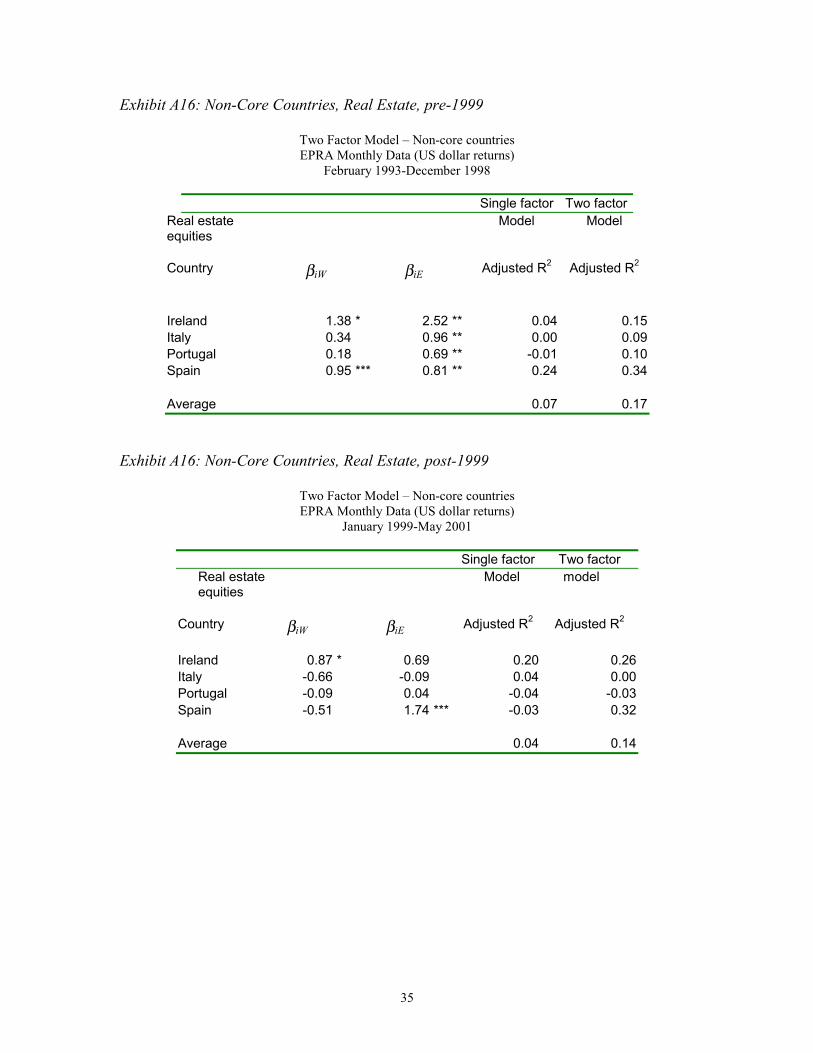
Exhibit A16: Non-Core Countries, Real Estate, pre-1999
Two Factor Model – Non-core countries EPRA Monthly Data (US dollar returns)
February 1993-December 1998
Single factor Two factor Real estate equities
Model Model
Country βiW βiE Adjusted R2 Adjusted R2
Ireland 1.38 * 2.52 ** 0.04 0.15 Italy 0.34 0.96 ** 0.00 0.09 Portugal 0.18 0.69 ** -0.01 0.10 Spain 0.95 *** 0.81 ** 0.24 0.34
Average 0.07 0.17
Exhibit A16: Non-Core Countries, Real Estate, post-1999
Two Factor Model – Non-core countries EPRA Monthly Data (US dollar returns)
January 1999-May 2001
Single factor Two factor Real estate equities
Model model
Country βiW βiE Adjusted R2 Adjusted R2
Ireland 0.87 * 0.69 0.20 0.26 Italy -0.66 -0.09 0.04 0.00 Portugal -0.09 0.04 -0.04 -0.03 Spain -0.51 1.74 *** -0.03 0.32
Average 0.04 0.14

36
Exhibit A17: Non-Euro Countries, Real Estate, pre-1996
Two Factor Model – Non-€ countries EPRA Monthly Data (US dollar returns)
February 1993-December 1995
Single factor Two factor Real estate equities
Model Model
Country βiW βiE Adjusted R2 Adjusted R2
Denmark 0.46 0.24 0.04 0.02 Sweden 1.31 -0.85 0.06 0.05 UK 0.71 *** 0.92 *** 0.44 0.63
Average 0.18 0.23
Exhibit A18: Non-Euro Countries, Real Estate, post-1996
Two Factor Model – Non-€ countries EPRA Monthly Data (US dollar returns)
January 1996-May 2001
Single factor Two factor Real estate equities Model model Country βiW βiE Adjusted R2 Adjusted R2
Denmark 0.34 * 0.6 ** 0.02 0.14 Sweden 0.54 *** 0.51 ** 0.12 0.21 UK 0.6 *** 1.17 *** 0.12 0.71
Average 0.09 0.35
The results for the sub-period 1999-2001 are not materially different.

37
Exhibit A19: Core Euro Countries, Small Cap Stocks, pre-1996
Two Factor Model – Core countries MSCI Small Cap Monthly Data (US dollar returns)
February 1993-December 1995
Single factor Two factor Small cap Model Model Country Βiw ΒiE Adjusted R2 Adjusted
R2
Belgium 0.26 0.1 -0.01 -0.06 France 0.37 0.67 ** 0.03 0.31 Germany 0.24 0.51 ** 0.01 0.21 N'lands 0.36 0.56 ** 0.06 0.24 Austria Insufficient data
Average 0.02 0.18
Exhibit A20: Core Euro Countries, Small Cap Stocks, post-1996
Two Factor Model – Core countries MSCI Small Cap Monthly Data (US dollar returns)
January 1996-May 2001
Single factor Two factor Small cap Model Model Country Βiw ΒiE Adjusted R2 Adjusted
R2
Belgium 0.00 0.16 -0.01 -0.02 France 0.41 ** 0.57 ** 0.2 0.35 Germany 0.28 ** 0.38 ** 0.04 0.25 N'lands 0.56 ** 0.58 ** 0.05 0.47 Austria 0.29 ** 0.43 ** 0.17 0.33
Average 0.09 0.28

38
Exhibit A21: Non-Core Euro Countries, Small Cap Stocks, pre-1999
Two Factor Model – Non-core countries MSCI Small Cap Monthly Data (US dollar returns)
February 1993-December 1998
Single factor Two factor Small cap Model Model
Country Βiw ΒiE Adjusted R2 Adjusted
R2
Spain 0.48 ** 0.52 ** 0.16 0.30 Italy 0.35 1.19 ** 0.02 0.32
Average 0.09 0.31
Exhibit A22: Non-Core Euro Countries, Small Cap Stocks, post-1999
Two Factor Model – Non-core countries MSCI Small Cap Monthly Data (US dollar returns)
January 1999-May 2001
Single factor Two factor Small cap Model model Country Βiw ΒiE Adjusted R2 Adjusted R2
Spain 0.63 * 0.9 0.18 0.23 Ireland 0.38 ** -0.04 0.46 0.41 Italy 0.86 ** 0.09 0.36 0.34
Average 0.41 0.37
Data for Ireland is February 2000-May 2001

39
Exhibit A23: Non-Euro Countries, Small Cap Stocks, pre-1997 OLS Estimation
Two Factor Model – Non-€ countries MSCI Small Cap Monthly Data (US dollar returns)
February 1993-December 1996
Single factor Two factor Small cap Model Model Country Βiw ΒiE Adjusted R2 Adjusted
R2
Sweden 0.4 0.51 -0.01 0.02 UK 0.72 ** 0.5 ** 0.26 0.47 Average 0.13 0.25
Exhibit A23: Non-Euro Countries, Small Cap Stocks, post-1997
Two Factor Model – Non-€ countries MSCI Small Cap Monthly Data (US dollar returns)
January 1997-May 2001
Single factor Two factor Small cap Model Model Country Βiw ΒiE Adjusted R2 Adjusted
R2
Sweden 0.71 ** 0.22 0.24 0.23 UK 0.44 ** 0.43 ** 0.28 0.37 Average 0.26 0.30
The results for the sub-period 1999-2001 are not materially different