monetary and fiscal developments - bnm
TRANSCRIPT

Monetary and Fiscal Developments2Monetary Developments
Monetary developments in 1998 were influencedby the policy measures implemented during theyear as well as developments in the domesticcorporate and banking sectors. Monetary growthslowed down significantly in 1998 in a period ofsevere economic contraction. Growth in moneysupply decelerated sharply as credit growth sloweddown rapidly in an environment of sluggisheconomic activity; weak business prospects; lowerprivate consumption; as well as more cautiouslending policies of banking institutions amidst risingnon-performing loans (NPLs). Against thisbackground, monetary policy evolved according tothe changing conditions during the course of theyear to address emerging risks and challenges,with the aim of maintaining overall macroeconomic
stability. In achieving this objective, Bank NegaraMalaysia (BNM) relied on a combination of interestrate, and prudential and structural measures. Whilein the early part of the year the focus of policywas on ensuring stability and efficiency of thefinancial markets which is an important preconditionto achieve the longer term policy objectives, thelatter part of the year was focused on supportingeconomic recovery.
The annual growth rates of broad monetaryaggregates - M2 and M3 - moderated significantlyduring the year, while narrow money or M1 declinedfor the first time in 1998. By end-1998, the annualgrowth of M2 and M3 decelerated to 1.5% and2.7% respectively (22.7% and 18.5% respectivelyat end-1997), while M1 contracted by 14.6% (+4.6%at end-1997). On the whole, the deceleration ofmonetary growth during the year had been moresevere than anticipated, with M2 and M3 expandingby only RM4.2 billion and RM10.6 billion respectively(+RM54 billion and RM61.1 billion respectively in1997), while M1 contracted by RM9.2 billion(+RM2.8 bil l ion in 1997). M3 had trendeddownwards since February and contracted duringthe months of April to July (–RM7 billion or–1.8%). However, since August money supply turnedaround to record a moderate expansion in responseto the easing of monetary policy as well as theimproved performance in the external sector. Incomparison, the rate of deceleration in the growthof M3 during the previous recession experienced inthe mid-1980s was more gradual. During that period,the annual growth of M3 slowed down from apeak of 16.3% at end-March 1985, to 8.8% atend-1986 and further to a trough of 3.9% at end-January 1988. The more rapid slowdown in M3during the current economic downturn reflectedmainly the larger GDP contraction as well asstructural changes in the economy in which a moredeveloped equity market exerted a relatively moresignificant negative wealth effect on the economy.
Reflecting the contraction in economic activity,the demand for transaction balances (currencyholdings and demand deposits of the private sector)
Graph 2.1Money Supply
1994 1995 1996 1997 1998-10
-5
0
5
10
15
20
25
30
-10
-5
0
5
10
15
20
25
30
-25
-20
-15
-10
-5
0
5
10
15
20
25
-25
-20
-15
-10
-5
0
5
10
15
20
25
M1
M3
M2
Annual growth
Jan July Dec July Dec1997 1998
Contribution to M3 growth% contribution
%
Private sector credit Net externalassets
M3 growth
%
M3 growth (%)

declined by RM8.9 billion in 1998. Demand depositsrecorded a substantial decline of RM5.7 billion whilecurrency in circulation contracted by RM3.2 billion.Except for January, June, September, Novemberand December, the demand for transaction balancesdisplayed a declining trend during the year. Thegenerally weak business activity and poor businesssentiments resulted in lower holdings of demanddeposits by the corporate sector (–RM4.8 billion).Meanwhile, lower private sector consumptionreduced households’ requirements to hold morecurrency in their daily transactions, leading to adecline in the currency in circulation. In addition,the decline also reflected the return of currency tothe banking sector following the announcement ofthe demonetisation exercise of the RM500 andRM1,000 denominations. It was announced on 12September 1998 that the RM500 and RM1,000notes will cease to be legal tender, effective 1 July1999. In response to the announcement, aboutRM3.9 billion worth of RM500 and RM1,000 noteswere returned to BNM between September andDecember 1998. The bulk of these currency noteswas placed mostly in the form of deposits withbanking institutions.
Broad quasi-money (private sector holdings offixed and savings deposits, negotiable instrumentsof deposit (NIDs) and repurchase agreements(repos) with the banking system (excluding interbanktransactions), expanded moderately by RM19.6 billionor 6% in 1998, compared with RM58.7 billion or21.8% in 1997. The sharp deceleration in thegrowth of broad quasi-money reflected mainly lowerincome with the contraction in GDP. Depositplacement by individuals in savings andfixed deposits expanded by RM17.7 billion,compared with the increase of RM22.8 billion in1997. For the corporate sector, a combination ofweak business activities as well as relatively higherlending rates, particularly in the first half-yearadversely affected their liquidity and cash flowposition. As a result, total deposits placement bybusiness enterprises in interest-bearing instrumentswith banking institutions declined, with a netwithdrawal in fixed deposits (–RM4.9 billion) andNIDs (–RM425 million).
In terms of instruments, the moderate expansionin the broad quasi-money reflected the increase infixed deposits (RM14.9 billion); foreign currencydeposits (RM1.4 billion); savings deposits (RM1.3billion); repos (RM1.1 billion) and NIDs (RM974million). The large differential between savings and
fixed deposits interest rates, in particular during thefirst half of the year, led to the increase in fixeddeposits during the year. It also reflected the shiftin preference among institutional and retail investorsof the Kuala Lumpur Stock Exchange (KLSE) toless risky portfolios following the sluggish stockmarket performance.
In terms of determinants, the main impetus tothe expansion in money supply emanated fromexternal operations. Reflecting the surplus in thecurrent account of the balance of payments ofRM36.1 billion, as well as the impact from theintroduction of selective exchange control measuresin September, net external assets of BNM and thebanking system expanded by RM51.2 billion. Duringthe year, external reserves of BNM increased byRM40.3 billion, a turnaround from the decline ofRM10.9 billion in 1997. However, it should be notedthat effective 15 September 1998, following thefixing of the exchange rate of the ringgit againstthe United States dollar at US$1=RM3.80, all foreigncurrency assets and liabilities of BNM have beenrevalued into ringgit at rates of exchange prevailingon the reporting date. Hence, part of the increasein the external assets during the year reflected theexchange revaluation gains. This, however, had aneutral impact on money supply since therevaluation gains were offset by increases in theitem "other influences", which also recorded adecline of RM32.4 billion during the year. In additionto the significant accumulation of reserves by BNM,the higher net external assets position was alsodue to the marked decline in the external liabilitiesof the banking system. In 1998, net externalliabilities of the banking system declined byRM10.9 billion. This was largely attributed to therepayment of foreign loans by the bankinginstitutions. Following the improved liquidity situation,especially in the second half of 1998, local bankinginstitutions did not roll over the bulk of theirmaturing loans from abroad. The domestic bankinginstitutions also reduced a large portion of theirforeign interbank borrowings, especially those withshorter-term maturity.
Claims on the private sector, which had beenthe main expansionary factor in previous years,exerted a marginal impact on monetary growth in1998, contributing about 1.1% to M3 growthcompared with 27.3% in 1997. During the year,claims on the private sector expanded by onlyRM4.2 billion or 0.9%, compared with the significantexpansion of RM90.4 billion or 25.3% in the

previous year. The expansion in credit was duewholly to the higher holdings of private debtsecurities by the banking institutions of RM14.1billion, partly reflecting subscriptions to Danamodaland Danaharta bonds. In the last quarter of 1998,Danamodal Nasional Berhad (Danamodal) issuedzero-coupon bonds with a face value of RM11billion, while Pengurusan Danaharta Nasional Berhad(Danaharta) issued two series of zero-coupon bondswith a total face value of RM2.6 billion in exchangefor the banking institutions’ NPLs. In contrast, loansand advances extended by the banking institutions(as defined under M3 determinants) declined byRM9.9 billion or 2.4%, compared with a substantialexpansion of RM82.1 billion or 25.3% in 1997.
Total loans of the banking system (comprisingcommercial banks, finance companies and merchantbanks) declined by RM7.6 billion or 1.8% in 1998.However, if the NPLs that were purchased byDanaharta during the year were included, total loansin 1998 would have increased by RM5.5 billion or1.3%. By institutions, commercial banks continuedto record a moderate increase in loans (+3.3%).Loans extended by finance companies and merchantbanks, however, declined by 15% and 3.7%respectively. The ongoing merger exercise amongthe finance companies had affected their loangrowth. The poor performance of the affectedfinance companies also contributed to the declinein loans extended to the private sector. On thewhole, the decline in loans extended by the bankingsystem in 1998 was attributed to both demand andsupply factors. On the demand side, the relativelyhigher interest rates, particularly during the first half-year, as well as the contraction in economic activity
were the main reasons that led to the lowerdemand for loans by the private sector. The declinein loans also reflected the higher repayments inresponse to higher interest rates in the first half-year and the postponement of expansion plans asthe crisis became more severe. Furthermore, asinventory levels increased and capacity utilisationwas lower, the demand for loans for newinvestments fell, leading to a decline in the overallfinancing needs of the economy. On the supplyside, the decline in the extension of loans by thebanking institutions was attributed to the tightliquidity conditions in early 1998 and more cautiouslending policies by banking institutions. With theactual NPL ratio on a net basis increasing from4.1% of total loans as at end-1997 to 9% of totalloans as at the end of 1998, and the ensuingerosion of capital, banking institutions became morecautious in their lending activities during the yearas they adjusted to strengthen their balance sheet.
Total loans extended by the banking system weregenerally on a declining trend during the periodFebruary to September before reverting to an increasein October and November. Sales of gross NPLs toDanaharta amounting to RM13 billion in December,caused total loans to decline during the month. Forthe year as a whole, the decline in total loans wasdue to lower lending for consumption credit, purchaseof securities, purchase of transport vehicles andcommunity, social and personal services andmanufacturing sectors, which more than offset thehigher loans to the broad property; transport, storageand communication; electricity, gas and water; andfinance, insurance and business services sectors.The bulk of the loans continued to be channelledto the broad property sector (+RM6.2 billion or 4.4%).By the end of 1998, total credit extended to thebroad property sector represented 35.3% of totalloans (33.2% in 1997). Nevertheless, the higherexposure to the broad property sector did not reflectnew risks, as the increases in loans were mainlyfor the purchase of residential property (RM5.5 billion).Given the slowdown in the implementation of existinginfrastructure and non-residential projects as well asthe deferment of selected new projects, loans extendedto the construction sector and for the purchase ofnon-residential property increased by only RM582million and RM1.5 billion respectively. At the sametime, loans for transport, storage and communication,as well as for finance, insurance and businessservices sectors continued to receive adequatefinancing with increases of RM1.9 billion or 14.9%and RM907 million or 2.5% respectively.Meanwhile, in line with the lower economic activity
0
5
10
15
20
25
30
35
40
0
5
10
15
20
25
30
35
40
Graph 2.2Banking System: Direction of Lending
% of total loans
Manufacturing Wholesale,retail,
restaurants& hotels
Purchase ofsecurities
Finance,insurance &
businessservices
15.0 15.3
8.3 8.5
33.235.3
8.6 9.0
13.711.9
1997
1998
Broadproperty
9.27.8
Consumption credit
% of total loans

and contraction in disposable income, loans extendedfor consumption credit, including for purchase ofpassenger cars, recorded a net repayment of RM8.4billion. Consequently, the share of outstanding loansdeclined to 11.9% at end-1998. Similarly, loans forthe purchase of securities declined by RM6.5 billionor 16.7%. Loans to the manufacturing sector recordeda decline of RM110 million or 0.2%, reflecting lowermanufacturing activities as well as large loanrepayments. Meanwhile, loan approvals improvedsubstantially in the second half of 1998 (RM38.2billion compared with RM24 billion in the first half-year). For the year as a whole, the bulk of theapprovals were for the manufacturing sector, thepurchase of residential properties and the finance,insurance and business services sector. A total ofRM10.5 billion of new loans had been approved forthe manufacturing sector, which accounted for 16.9%of total loans approved. Loans approved for thepurchase of residential property and the finance,insurance and business sector amounted to RM9.3billion and RM8.1 billion respectively, accounting
for 14.9% and 13.1% of total new approvals duringthe year.
In response to the slowdown in loans, severalmeasures were implemented to promote creditexpansion and to avoid a credit crunch in order toensure that the banking sector is better able tosupport economic recovery. With the improvementin the medium-term inflation prospects, interest rateswere lowered in stages during the second half ofthe year. Consequently, the average BLR ofcommercial banks declined steadily from a peak of12.27% at end-June to 8.04% at end-1998. Inaddition, with effect from 14 September 1998, allbanking institutions were also required to reducethe maximum margin over the quoted BLR from 4percentage points previously, to 2.5 percentagepoints. These measures effectively reduced theborrowing cost to the borrowers and eased theburden in servicing interest payments. To ensurethat there were sufficient funds to finance the
Table 2.1Banking System: Loans by Sector
As at end Change Share of total
1997 1998 1998 1998
RM million %
Agriculture, hunting, forestry and fishing 7,637.8 7,717.8 80.0 1.9Mining and quarrying 1,348.5 1,673.6 325.1 0.4Manufacturing 63,310.4 63,200.4 –110.0 15.3Electricity, gas and water 4,461.1 5,879.2 1,418.1 1.4Wholesale, retail, restaurants and hotels 34,940.7 35,111.4 170.7 8.5
Wholesale trade 19,926.8 18,725.0 –1,201.8 4.5Retail trade 10,531.4 10,240.0 –291.4 2.5Restaurants and hotels 4,482.5 6,146.4 1,663.9 1.5
Broad property sector 139,922.4 146,148.4 6,226.0 35.3Construction 42,615.9 43,198.4 582.5 10.4Purchase of residential property 50,843.9 56,386.7 5,542.8 13.6Purchase of non-residential property 28,440.2 29,967.0 1,526.8 7.2Real estate 18,022.4 16,596.3 –1,426.1 4.0
Transport, storage and communication 13,040.6 14,983.1 1,942.5 3.6Finance, insurance and business services 36,209.4 37,116.8 907.4 9.0
Financial services 26,617.3 28,375.0 1,757.7 6.9Insurance 131.6 249.0 117.4 0.1Business services 9,460.5 8,492.8 –967.7 2.1
Consumption credit 57,836.0 49,418.5 –8,417.5 11.9Personal uses 14,924.8 13,446.9 –1,477.9 3.3Credit cards 4,586.4 4,313.0 –273.4 1.0Purchase of consumer durables 1,717.0 826.9 –890.1 0.2Purchase of passenger cars 36,607.8 30,831.7 –5,776.1 7.5
Purchase of securities 38,951.2 32,460.0 –6,491.2 7.9Purchase of transport vehicles 5,687.3 4,504.8 –1,182.5 1.1Community, social and personal services 6,872.0 6,671.4 –200.6 1.6Others 10,985.1 8,752.8 –2,232.3 2.1
Total loans 421,202.5 413,638.2 –7,564.3 100.0
Adjusted total loans 421,202.5 426,677.3 5,474.8(Including NPLs sold to Danaharta)

economic recovery process, banking institutions withthe capacity to lend were encouraged to expandtheir loan base and achieve a minimum loangrowth of 8%. In addition, the SRR and liquidityratios were also reduced to improve theliquidity conditions.
These measures have produced encouragingresults. Even though the actual loans disbursed inthe second half-year remained slow, the amount ofloans approved by the banking system increasedsubstantially in the latter half of 1998. Otherinitiatives that had been taken to improve thefinancial intermediation process and expand creditincluded the establishment of Danaharta to purchaseNPLs from the banking institutions so that bankinginstitutions can focus more on their core activity ofproviding credit. Similarly, Danamodal was set upto recapitalise the banking system. Thisrecapitalisation process by Danamodal was alsoaccompanied by a restructuring of the bankinginstitutions. A Corporate Debt RestructuringCommittee had also been established to assistborrowers and creditors to discuss solutions for debtrestructuring.
During the year, the expansionary impact fromthe external operations and claims on the privatesector were partially offset by the contractionaryinfluences of other determinants. Net lending to the
Government contracted by RM12.3 billion primarilydue to the higher accumulation of deposits duringthe year. By end-year, total Government depositsplaced with BNM and the banking institutionsamounted to RM46.2 billion, an increase of RM17.5billion from the previous year. The large increasein deposits was mainly attributed to the proceedsfrom domestic borrowing as well as disbursementof external loans, particularly during the last quarterof the year to finance the fiscal stimulus programme.As such, the accumulation of Government depositsduring the period was expected to be temporaryand would eventually be drawn down in stages tofinance the Government’s expenditure. In additionto Government operations, net other influences alsoexerted a contractionary impact on money supply.During the year, net other influences contracted byRM32.4 billion reflecting the exchange revaluationgains on external reserves holdings of BNM, thehigher provisions for bad and doubtful debts aswell as the capital injection by Danamodal toselective banking institutions.
In 1998, the movement of interest rates wasprimarily influenced by the level of liquidity, whichwas in turn affected by financial marketexpectations, as well as the shift in the monetarypolicy stance. On the whole, interest ratesdevelopments can be divided into three periods.Prior to February 1998, interest rates were on anupward trend. Between February and July 1998,interest rates were stable, while thereafter, interestrates were on a downward trend.
In the first two months of the year, interestrates continued its upward trend as a policy ofmonetary restraint was adopted since September1997 to contain inflationary pressures arising fromthe ringgit depreciation as well as to discouragecapital outflows. The 3-month interbank rate, whichis BNM’s policy rate, had been raised in severalsteps from 7.55% in mid-September 1997 to 8.7%at end-1997. It was raised twice again in January1998 to 10% and again in February to 11%.Reflecting the tight liquidity situation and the unevendistribution of liquidity among banking institutionsduring this period, the average 1-month interbankrate rose above the average 3-month rate fromOctober 1997 onwards, while the 1-week andovernight rates began to follow suit since December1997. As a result, the term structure of interestrates was inverted during this period. The highshorter-term interest rates reflected the tight liquidityconditions faced especially by smaller financial
Table 2.2Changes to BNM Intervention Rate & SRR Ratio
Intervention SRRRate Ratio
End-97 8.70 13.5
Jan-Feb Tightening 9 Jan 9.0020 Jan 10.00
6 Feb 11.00
Mid-Feb 16 Feb 10-Jul
1 Jul 8
3 Aug 10.5010 Aug 10.0027 Aug 9.50
1 Sep 63 Sep 8.00
16 Sep 4
5 Oct 7.50
9 Nov 7.00
Liquidity Date1998
EasingAug-Dec
Stable

institutions. Furthermore, with increased uncertaintiesin the financial market, there was a flight to qualityof retail deposits placed with these smallerinstitutions towards the end of 1997 and in early1998. During this period, these institutions facedconsiderable difficulties in obtaining interbank fundsdue to selective lending practices by the largerinstitutions. The consequent aggressive bidding bythe smaller institutions at the short end of themoney market led to sharply higher short-end rates,with the 1-week rate peaking at 15.04% in January1998 (see Graph 2.3: Interbank Rates). Theresulting inverted term structure of interest rates,therefore, reflected the exceptionally tight liquiditysituation of a few institutions rather than that ofthe banking system as a whole. The higher costof funds incurred by these institutions led to arapid increase in lending rates for loans priced ona cost plus basis.
Faced with this scenario, BNM injected liquiditythrough direct lending to banking institutions. Torationalise the term structure of interest rates aswell as to improve liquidity flows in the system,BNM raised the intervention rate to 11% on 6February as well as reduced the SRR from 13.5%to 10% on 16 February 1998. Consequently, theterm structure of interest rates flattened from itsinverted position. The purpose of the SRR reductionwas not to add further liquidity but to improve thedistribution of liquidity that had already been injectedinto the banking system as well as to reduce thecost of funds for banking institutions given thatbanks do not earn interest on SRR. The SRR wasagain lowered without causing a net injection on 1July. This time around, the main objective was toreduce the cost of funds to banking institutions so
as to enable them to lower the lending rates totheir customers. On both occasions of the SRRreduction, the liquidity for the system as a wholewas unchanged, resulting in the 3-month interbankrates remaining firm at around 11%.
In the subsequent months, the ringgit ratesbecame more stable following the monetarymeasures undertaken between February and July1998. There were also emerging signs thatinflationary pressures had moderated. Thesedevelopments enabled BNM to ease monetary policyto complement fiscal policy to revive the economy.In August, the 3-month intervention rate wasadjusted downwards in three steps to 9.50%. SinceSeptember when selective exchange controls wereintroduced, further monetary easing was pursued.The intervention rate was reduced to 7% over threesuccessive reductions, while the SRR was reducedin two steps to 4%. Consequently, the interbankrates fell below the BNM intervention rates as a
2
4
6
8
10
12
14
16
18
20
2
4
6
8
10
12
14
16
18
20
% per annum % per annum
Graph 2.3Interbank Rates
3-Mth Intervention 3-Mth 1-Mth 1-Wk O/nite
Period 1Liquidity
Tightening
Period 2LiquidityStable
Period 3LiquidityEasing
Jan Apr Jul Oct97 97 97 97
Jan Apr Jul Oct98 98 98 98
2
4
6
8
10
12
14
16
18
20
2
4
6
8
10
12
14
16
18
20
Dec Feb Apr Jun Aug Oct Dec96 97 97 97 97 97 97
Feb Apr Jun Aug Oct Dec98 98 98 98 98 98
Period 3LiquidityEasing
Feb Apr Jun Aug Oct Dec98 98 98 98 98 98
Graph 2.4Interest Rates of Financial Institutions
Commercial Banks (average rates at end-month)
Average lending rate Base lending rate (BLR)Fixed deposit 1-month Fixed deposit 3-monthFixed deposit 12-month Savings deposit
2
4
6
8
10
12
14
16
18
20
2
4
6
8
10
12
14
16
18
20
Dec Feb Apr Jun Aug Oct Dec96 97 97 97 97 97 97
Period 2LiquidityStable
Period 3LiquidityEasing
Average lending rate Base lending rate (BLR)Fixed deposit 1-month Fixed deposit 3-monthFixed deposit 12-month Savings deposit
Finance Companies (average rates at end-month)
% per annum
% per annum
% per annum
% per annum
Period 1Liquidity
Tightening
Period 1Liquidity
Tightening
Period 2LiquidityStable

result of the significant increase in liquidity in anenvironment of continued weak loan growth.
Reflecting the movements in the interbank moneymarket rates, interest rates of financial institutionsalso increased up to June and subsequentlyadjusted downwards (see Table 2.3: Interest Ratesof Financial Institutions). As these rates tend to lagbehind interbank rates, the rates peaked in June.In the case of fixed deposit rates, the financecompanies’ fixed deposit (FD) rates adjusted morerapidly in response to the increases in interbankrates, whereas commercial banks’ rates had alonger lagged response. As a result, the averagespread offered by finance companies overcommercial banks’ FD rates increased from 0.2%before the crisis in June 1997 to as high as 1.5%in January 1998, before declining to 0.6% by end-1998. The greater responsiveness of financecompanies’ FD rates reflected the more aggressivecompetition for funds following their tighter liquiditysituation compared with commercial banks.Meanwhile, savings deposit rates for both typesof institutions were more stable, moving within anarrower range of only 0.6–0.8% during the year(the corresponding range for FD rates was 4.4–4.5%). A similar trend was also evident for thebase lending rates (BLRs), which was linked tothe 3-month interbank rate under the BLRframework. These BLRs are also linked to the SRRand as such, the reductions of the SRR inFebruary, July and twice in September allcontributed to a decline in the BLR. With thereduction in both the 3-month interbank rate andthe SRR, the BLR for commercial banks adjusteddownwards by 4.23 percentage points from a peakof 12.27% at end-June to 8.04% by mid-November.It remained unchanged thereafter until the end ofthe year.
Meanwhile, the interest margins or interestspreads of financial institutions also narrowed during
1998. The smaller margin was due to the fasterreduction in the average lending rate (ALR)compared with the average cost of funds (ACFs)during the year. The spread, however, widenedtowards mid-year in the case of commercial banksbut narrowed in the case of finance companies,before reversing trends in each case towards year-end. This asymmetry reflected the differentrelationships of these institutions’ ALR and ACF tochanges in liquidity and the general level of interestrates (see Table 2.4). Essentially, despite the sharpincrease in the BLRs of finance companies at end-1997 and early 1998, their ALRs were relativelystable. The bulk of finance companies’ loans wasin the form of fixed rate hire purchase loans ratherthan BLR-plus loans. As a result of the relativestability or “stickiness” of the ALR of the financecompanies, the rates were lower than their BLRsfor the 10 months between November 1997 andAugust 1998. In contrast, the ALR of commercialbanks moved in tandem with their BLR. On theother hand, the ACFs of finance companies weremore sensitive to changes in liquidity and interestrates and had, therefore, increased significantlywhen there was a flight to quality in late 1997 andearly 1998. Meanwhile, the ACFs of commercialbanks increased more marginally. As a result ofthe stickiness of the ALR and the greaterresponsiveness of cost of funds to monetarydevelopments, the margins of finance companieswere squeezed in times of rising interest rates,while in contrast, the margins of commercial banksincreased during periods of tight liquidity.
Interest rate differentials with other countriesalso changed significantly during the year. The realinterest rates (nominal interest rates adjusted forinflation) in Malaysia have moderated and are nowlower than the real interest rates in the UnitedStates and Singapore. The trend reflects the moresignificant decline in Malaysia’s nominal rates andthe relatively higher Consumer Price Index vis-a-vis
Table 2.3Interest Rates of Financial Institutions
3-Month FD 9.06 10.19 5.83Savings Deposit 4.23 4.51 3.87Base Lending Rate 10.33 12.27 8.04
3-Month FD 10.32 10.97 6.43Savings Deposit 5.49 5.56 5.01Base Lending Rate 12.22 14.70 9.50
CommercialBanks
End-97 End-98June 98
FinanceCompanies
Table 2.4Interest Margins of Financial Institutions
Avg. Lending Rate (ALR)11.51 13.51 9.72Less Avg. Cost of
Funds (ACF) 7.62 8.60 6.17Interest Margin 3.89 4.91 3.55
Avg. Lending Rate (ALR)12.16 13.35 11.76Less Avg. Cost of
Funds (ACF) 8.47 11.67 7.68Interest Margin 3.69 1.68 4.08
CommercialBanks
End-97 End-98June 98
FinanceCompanies

Monetary Measures in 1998
Adjustment and Stabilisation Measures(January - July 1998)
Monetary measures implemented in the firstseven months were aimed at enhancing theefficiency of the money market to allow interestrates to reflect underlying liquidity conditions.The measures were also aimed at reinforcingthe fundamental thrust of policy to achieve theobjectives of monetary and financial stability whilesupporting economic recovery. The measureswere as follows:
● On 26 January, banking institutions wereallowed to continue to provide bridging financeto housing developers to start new projectsfor residential properties costing RM150,000and below as long as the project wasdeemed viable.
● On 6 February, Bank Negara Malaysia (BNM)announced the streamlining of the interestrate structure to better reflect liquidityconditions in the market. Arising fromdevelopments in late 1997 and early 1998,the term structure of the interbank and lendingrates was not reflective of the prevailingmarket conditions. The shorter-endinterbank rates mainly reflected theexceptionally tight liquidity situation of a smallnumber of banking institutions. Followinguncertainties during the period, there was atendency for lending rates to be based onthese short-term rates on a cost-plus basis.To improve the flow of liquidity in the system,and to streamline the term structure of interestrates that would better reflect the liquidity inthe financial system, the 3-month BNMintervention rate was adjusted upwards to 11%from 10%.
● With effect from 16 February, the statutoryreserve requirement (SRR) for allcommercial banks, finance companies andmerchant banks was reduced from 13.5% to10% of their eligible liabilities. This was aimedat enhancing the efficiency of theintermediation process rather than to provide
additional liquidity to the system. BNMfurther reduced the SRR to 8% on1 July so as to reduce the cost of fundsto the banking institutions and improvethe liquidity distribution among thebanking institutions.
● Effective 1 May, the band for thepermissible daily variation in the averagebalance that is required to meet theSRR was widened to ±2% of theprescribed SRR rate from the previous bandof ±0.5%. The widening of the SRR bandwould accord banking institutionsgreater flexibility in managing their dailyliquidity operations.
Economic Recovery Plan (fromAugust 1998)
Beginning early August, monetary measuresreflected easing of monetary policy to supporteconomic recovery. The measures were alsoaimed at strengthening the financial system.These measures were as follows:
● In early August, with the improvement in themedium-term inflation prospects, BNMreduced its 3-month intervention rate inthree steps from 11% to 10.5% on 3 August,to 10% on 10 August and further to 9.5%on 27 August. Following the introduction ofthe new exchange control measures, the 3-month intervention rate was further reducedto 8% on 3 September, to 7.5% on 5October and to 7% on 9 November.
● On 1 September , the Governmentintroduced selective exchange controls toinsulate the Malaysian economy from theprospects of further deterioration in theworld economic and financial environmentand to regain monetary independence.On 2 September, BNM announced thatthe exchange rate for the ringgit wasfixed at RM3.80 against the UnitedStates dollar.

● Meanwhile, to ease liquidity in the bankingsystem and make available more loanablefunds to borrowers at a lower rate, theSRR was reduced from 8% to 6% on1 September and further to 4% on16 September.
● As of 3 September, commercial banks wereno longer required to maintain vostrobalances of foreign banking institutionswith BNM.
● The base lending rate (BLR) framework wasrevised on 1 September to ensure a morerapid transmission of changes in monetarypolicy on interest rate levels into the BLR ofbanking institutions. The calculation of theBLR is now based on the BNM 3-monthintervention rate instead of the KLIBOR. Inaddition, to ensure that borrowers benefit fromthe higher level of operational efficiency withinthe banking industry, the flat administrativemargin of 2.5 percentage points was reducedby 25 basis points to 2.25 percentage points.The maximum margin over the quoted BLRwas also reduced from 4 percentage pointsto 2.5 percentage points.
● To ensure that there was sufficient fundsto finance the economic recoveryprocess, banking institutions with the capacityto lend were encouraged to achieve aminimum annual loan growth of 8%.
● In an effort to assist the construction sectorthat had been severely affected by theeconomic crisis, some relaxation to theearlier ceilings on the broad propertysector were implemented on 7 September.Lending for the construction or purchase ofresidential properties costing up to RM250,000were exempted from the 20% limit onlending to the broad property sector. Inaddition, effective 5 October, the 60%maximum margin of financing was abolishedfor the purchase of non-owner occupiedresidential properties costing RM150,000 andabove; the purchase of shophouses costingRM300,000 and above which are not for theconduct of own business; and the purchaseof land lots.
● The ceiling on loans for the purchaseof shares and unit trust funds was also
raised from 15% to 20% of totaloutstanding loans for commercial banks andfinance companies on 23 September. Thelimit for merchant banks remained at 30%.The increase in the limit was aimed atpromoting long-term investments in thestock market.
● The margin of financing for all passengercars was raised from 70% to 85% on23 April and the restriction on themaximum repayment period was removed on28 July. The margin of financing of 85%was abolished on 21 November, and bankswere free to determine the percentage offinancing based on their credit assessment ofthe borrower.
● Effective 5 December, BNM reduced themaximum lending rate under the Fund forSmall and Medium Industries and theSpecial Scheme for Low and Medium CostHouses from 10% per annum to 8.5% perannum and the funding rate from 8% perannum to 6% per annum.
● Effective 20 November, the minimummonthly repayment on credit cards wasreduced from 15% to 5% of theoutstanding credit card balances in order toease the cash flow burden of creditcard holders. To ensure that the chargesimposed on the credit card holders werereasonable, banking institutions thatissue credit cards were required from30 December to impose a maximum financecharge of not more than 1.5% per monthor 18% per annum and that the late paymentcharges should not be more than 1% of theamount in default. However, bankinginstitutions were allowed to charge a minimumpenalty of RM5.
● In view of the need to clear thecurrent backlog of properties, effective5 January 1999, banks were not allowed tofinance the development of new residentialproperties and shophouses where theindividual unit costs more than RM250,000each. In addition, banking institutionswere not allowed to provide financingto develop hotels, resorts, office buildings,golf courses, clubs and shoppingcomplexes.

the United States and Singapore. The low realrates in the region of 1% at end-1998 waspreviously experienced in 1994 in Malaysia, duringthe period of massive capital inflows, and in 1988,during the recovery years after the recession ofthe mid-1980s.
Monetary Policy in 1998
As the Asian financial crisis became more severein 1998, the formulation of monetary policy wasgoverned by the need to address the increasingvolatility in the financial markets, the irrational marketbehavior, the deterioration in the financial position ofthe banking and corporate sectors, the existence ofimbalances in the economy and the contraction ineconomic activities. In this context, monetary policywas pursued as part of a comprehensive set ofpolicies to maintain macroeconomic and financialstability with the ultimate objective of stabilising andreviving the economy. While price stability remainedthe primary objective of monetary policy, it wasnecessary that monetary policy was also implemented
to create a conducive environment to achievesustainable long-term growth. Given the severeadverse effects of too tight a monetary policy onthe economies of countries in the region, Malaysiaadopted a different approach. It was recognisedthat high interest rates would not stabilise theexchange rate due to the strong external factors. Itwas more important to ensure that monetary policywould promote domestic macroeconomic stability andconfidence and contain the severity of externaldevelopments on economic growth.
-8
-6
-4
-2
0
2
4
6
8
10
-40
-30
-20
-10
0
10
20
30
40
50
M1, M3 (%) GDP, Inflation (%)
Graph 2.6
Money supply, GDP & inflation
M1
M3
GDP
Inflation
1992 1993 1994 1995 1996 1997 19980
1
2
3
4
5
6Interest rate differential (%) Exchange rate
Interest rate differentials & exchange rate (end-period)
Malaysia-Singapore
Malaysia-US
RM/US$
2.4
2.6
2.8
3.0
3.2
3.4
3.6
3.8
4.0
1992 1993 1994 1995 1996 1997 1998-1
0
1
2
3
4
5
6
7
8
9
10
11
% per annum Annual growth (%)
Interest rates & loan growth (end-period)
BLR of commercial banks
3-month interbank
Banking system loans
-5
0
5
10
15
20
25
30
35
40
45
50
55
0
1
2
3
4
5
6
7
0
1
2
3
4
5
6
7
0
1
2
3
4
5
6
7
0
1
2
3
4
5
6
7
Real rates in Malaysia Real rates in the United States
Graph 2.5Real Interest Rate Differentials
Dec-97 Feb-98 Apr-98 Jun-98 Aug-98 Oct-98 Dec-98
Dec-97 Feb-98 Apr-98 Jun-98 Aug-98 Oct-98 Dec-98
differentials (-ve)
-2.57
-1.64
-2.03+0.61 +1.69
+0.85
+1.220.00
-1.70
-2.31
differentials (-ve)
5.80
6.60
5.47
5.00
3.90
3.903.46 3.47
1.76
1.16
5.80
5.19
6.60
4.91
5.47
4.62
6.64
5.00
3.90
5.93
4.33
1.76
3.13
1.16
3.95 4.04 4.093.78
-1.97
Real rates in Malaysia Real rates in Singapore
Malaysia versus United States
Malaysia versus Singapore
+1.85 +2.56 +1.38
% per annum % per annum
% per annum % per annum

In a rapidly changing environment and a globalenvironment of uncertainty, monetary managementneeds to be appropriately sequenced. The timingof policy is important. While several issues mayneed to be addressed, it is important to prioritisethese policy responses to minimise disruptions inthe system. Monetary policy, therefore, evolved atdifferent stages of the economic crisis to adapt tochanging domestic and external developments aswell as to address new risks and challenges.Nevertheless, throughout the crisis period, thefundamental objective of policy remained unchanged.
At the start of the year, the tight monetary policythat was pursued before the onset of the crisisaimed to address the rising inflationary pressuresassociated with the depreciation of the ringgit andthe consequent outflow of short-term funds. Towardsmid-1998, it was evident that inflationary pressureswere contained and the external balance turnedaround from a deficit to a surplus position. However,this contributed to reinforce the effects of aworsening external environment on domestic activity.Consequently, in response to early indicators of aweaker-than-expected growth and lower inflation inJuly, monetary policy was eased in early August.The policy aimed to complement the fiscal stimulusto create an environment in which the prospectsfor economic recovery would be enhanced. It wasalso recognised that growth could only recover andbe sustained in an environment of stability andinvestor confidence. Given the build-up in risks thatemerged in the regional and global financial marketsduring August-September, Malaysia acted decisivelyto stabilise the economy. On 1 September, selectiveexchange control measures were introduced andthe ringgit was fixed against the United States dollaron the following day. This, together with an easingof monetary policy and an expansionary fiscal policy,had a positive effect on the economy. Keymacroeconomic indicators as well as financialaggregates at the end of 1998 and in early 1999suggested that the economy is emerging from thecountry’s worst economic turbulence.
An integral part of financial policy has been thepromotion of a sound financial system that is ableto carry out its intermediation function efficiently.As Malaysia had entered the crisis with a relativelystrong and well-regulated financial sector, thepayments system and loan intermediation processremained relatively intact. However, the behaviourof markets caused distortions. Throughout the crisisperiod, Bank Negara Malaysia (BNM) had focused
on improving the intermediation process andensuring that sufficient funds were available atreasonable cost for productive activities. Thisbecame critical when credit growth slowed downfaster than envisaged in the Credit Plan for 1998.During this period, the prolonged contraction ledto a deterioration in the asset quality of thebanking system. Besides taking pre-emptive stepsto address the latter concern, a comprehensive four-pronged strategy was also initiated to strengthenthe banking system.
Against this backdrop, monetary policy in 1998can be classified into three phases, namely theadjustment phase from the outbreak of the crisisto early 1998; followed by the stabilisation phaseup to the period in July; and subsequently, therecovery phase.
The start of 1998 witnessed a sharp increase inthe volatility in both the foreign exchange and stockmarkets. Inflation also began to edge upwards asthe effects of the depreciation filtered through tothe real economy. During this period, the ringgitdepreciated further following the depreciation of theKorean won in December 1997 and the nearcollapse of the Indonesian rupiah in early 1998.Meanwhile, loans which had still been expandingrapidly up to the end of 1997 began to experiencea significant slowdown. The outflow of foreign short-term funds during this period contributed to aprogressive tightening of liquidity in the bankingsystem. Inefficiencies in the intermediation processalso emerged as the sharper depreciation of theringgit raised concerns on the banking system,particularly on the smaller institutions. This led toa shift of deposits from the smaller to the largerbanking institutions. During this period, a smallnumber of banking institutions faced significantliquidity problems due to the flight to quality ofdeposits. The competition for funds by theseinstitutions contributed to the sharp increases inmoney market interest rates which resulted in higherinterest rates for the industry as a whole. In suchan environment, monetary policy focused onaddressing this distortion. The most importantobjective of policy during this period was to improveliquidity distribution and remove distortions in theintermediation process, thereby enabling the bankinginstitutions to reduce their lending rates.
To address these problems, BNM lowered thestatutory reserve requirement (SRR) from 13.5% to

10% on 16 February, followed by another reductionto 8% on 1 July. Prior to this, BNM had placedRM34 billion in the banking system to provideliquidity to the system. The funds released by thereduction in the SRR was therefore offset by thenon-rollover of funds previously lent by BNM tofinancial institutions. The purpose of the SRRreduction was aimed at improving the distributionof liquidity that had already been injected into thebanking system and to reduce the cost of fundsfor the banking institutions given that banks earnedzero interest on the SRR. As a result of thesemeasures, the money market rates declined, leadingto a corresponding reduction in the lending rates,which fell from 21.5% in early February to 16.3%at the end of February.
During this period, there was little leeway toreduce the money market intervention rate. In theinitial stages of the crisis in July 1997, interestrates were spiked up briefly for about a week.Interest rates were subsequently reduced to thepre-crisis level from mid-August until September1997. As the crisis became more prolonged, it wasviewed that higher interest rates would have anadverse effect on the real sector, but by itselfwould not contribute to restore stability in the foreignexchange markets (see article on Monetary Policyin 1997 in the 1997 BNM Annual Report). However,when the Indonesian rupiah experienced a nearcollapse in January 1998, the ringgit depreciated toits weakest level to touch US$1=RM4.88 on 7January. Under these conditions, concerns over thepotential outflows of funds and rising inflationarypressures prompted increases in interest rates.Interest rates were then allowed to edge up to11% to ensure that depositors continued to receivepositive real rates of interest. This move containedfurther capital outflows and ringgit rates stabilisedin the region of US$1=RM3.84–3.98 in the firstand second quarters of 1998. Although interest rateswere raised to the level of 11%, it was to asignificantly lesser extent than that recommendedby the International Monetary Fund (IMF) andexpected by the market. The Bank’s view was thatsuch high interest rates would dampen economicactivity and cause strains on the banking system,resulting in further pressure on the ringgit, therebymaking economic recovery more difficult to achieve.
The Bank also undertook a number of otherinitiatives to ensure the efficient management ofliquidity and increase the efficiency of loanintermediation. Procedures were introduced on 30
April to make money market operations moretransparent and to promote efficient liquiditymanagement. Under the new procedures, BNMundertook to provide daily forecasts of the cashflows of the financial system, as well as informationon the major factors that were expected to influenceliquidity, including details of BNM’s money marketactivities. With effect from 1 May 1998, the bandfor the daily variation in the average balancerequired to meet the SRR was widened from ±0.5%to ±2%. In addition, a new framework for liquiditymanagement was introduced to enable bankinginstitutions to manage their liquidity positions withgreater flexibility without compromising prudentialstandards. The new framework was set on a six-month trial run starting July 1998. On 3 September1998, the liquid asset requirement of the commercialbanks was reduced from 17% to 15% of totaleligible liabilities. The Bank also undertook measuresto increase the efficiency of monetary policy. Thebase lending rate (BLR) framework was revamped.Under the previous BLR computation based on the3-month average weighted interbank rate of thepreceding month, the retail interest rates respondedto changes in monetary policy with a lag of severalweeks. To rectify this, with effect from 1 September1998, the calculation of the BLR was based onBNM’s 3-month intervention rate rather than theKLIBOR. The banking institutions were required toadjust their BLRs within a week of a change inBNM’s intervention rate, leading to a more rapidtransmission of changes in monetary policy. Theadministrative margin included in the BLR was alsoreduced from 2.50% to 2.25%. These measuresresulted in a downward adjustment in lending ratesand contributed to increases in the efficiency ofthe banking institutions given that they providedthe banking institutions with greater flexibility in themanagement of existing liquidity. The measuresalso resulted in a lower cost of funds. At the endof July, the BLR had declined to 12.07% from12.27% at end-June 1998.
Apart from efforts to lower the cost offunds to banks, the Government also recognisedthe adverse implications high interest rates wouldhave on small businesses. A number of funds wereestablished and existing funds expanded so thatbanking institutions could provide credit to prioritysectors at reasonable lending rates. These fundsincluded the Fund for Food (RM1 billion); PettyTraders and Hawkers Fund (RM500 million);Fund for Small and Medium Industries (RM1.5billion); Export Credit Refinancing Facility (RM3billion); Special Scheme for Low and Medium Cost

Houses (RM2 billion); Suppliers, Buyers andOverseas Investment Credit (RM1 billion); NewEntrepreneurs Fund (RM1.25 bill ion) andRehabilitation Fund for Small and Medium Industries(RM750 million).
The worsening of the regional crisis followingthe IMF intervention in Korea and Indonesia tookthe region into a phase of severe economiccontraction with its consequent effect on the financialsector. Lower aggregate demand in the regionamidst the exchange rate instability and uncertaintyand the negative wealth effect from declining assetmarkets contributed to the contraction in domesticactivity. By July 1998, it was evident that theeconomy had undergone a sharper correction thanearlier anticipated. Indications were that the economywould contract for the second consecutive quarter,indicating that the country was technically in aneconomic recession. The annual loan growth haddecelerated sharply from 26.5% at the end of 1997to 8.9% at the end of July 1998. Similarly, thegrowth rate of the broad monetary aggregate (M3)had also decelerated from 18.5% to 5.9% over thesame period. Other macroeconomic indicatorsshowed that there was a sharp contraction in carsales and collections of sales tax, indicating a sharpslowing down of economic activity. To revive theeconomy, an adjustment in macroeconomic policieswas necessary.
The deceleration in the inflation rate and anabsence of demand pressures enabled BNM toundertake an easing of monetary policy beginningin early August to complement fiscal policy tocontain the contraction and promote recovery ofthe economy. The 3-month intervention rate of BNMwas reduced in three successive steps, from 11%to 9.5% during the month of August. A cautiousand gradual easing of monetary policy wasnecessary given the threat of volatility in the foreignexchange markets and the risk of capital outflows.Of special concern was the high rates being offeredto attract ringgit funds in Singapore and the build-up of offshore ringgit balances to fund speculativeactivity on the ringgit. During this period, externalrisks in the regional and global markets had alsoworsened since end-August. The crisis had spreadto Russia and Latin America. In this environment,BNM introduced selective exchange controls on1 September, while the exchange rate was fixed atRM3.80 to the United States dollar on 2 September.The new measures were aimed at ensuring thatMalaysia could gain greater independence in the
conduct of domestic monetary policy as well asinsulate the economy from the potential risks andvulnerabilities of external developments in theinternational financial markets. Other considerationsincluded preserving the gains that had been madeto stabilise the domestic economy; ensuring stabilityin prices and the ringgit exchange rate; as well aspromoting a stable environment for restoring investorand consumer confidence to revive the economy.Hence, the exchange control regulations werecarefully designed to contain speculation on theringgit and minimise the impact of short-termcapital flows on the domestic economy. Theseregulations did not affect trade and investment ineconomic activity. Full convertibility remained forcurrent account transactions.
The new measures provided the Bank with theability to further ease monetary policy to supportthe domestic economic recovery process given theabsence of inflationary pressures. Following theintroduction of the exchange control measures andthe fixed exchange rate, additional monetarymeasures were introduced to improve the liquidityflows in the banking system to generate lendingactivities, as well as to ensure that viablebusinesses continued to receive financing at lowercost. Consequently, the SRR was reduced to 6%on 1 September, and then again to 4% on 16September. Similarly, the 3-month intervention ratewas reduced from 9.5% to 8% on 3 September,to 7.5% on 5 October, and to 7% on 9 November.As a result of the easing of monetary policy, theaverage BLR of the commercial banks and financecompanies declined further from 11.70% and 14.17%respectively in August 1998, to 8.04% and 9.50%by November.
The period of stability that followed was fullyutilised to expedite reform of the financial sectorthrough the institutional framework that was alreadyestablished. Targets set for Danamodal NasionalBerhad (Danamodal) and Pengurusan DanahartaNasional Berhad (Danaharta) were brought forward.As at 15 March 1999, Danaharta, the assetmanagement company, has acquired and ismanaging gross non-performing loans (NPLs) fromthe banking system amounting to RM15.1 billion.Danamodal, the special purpose vehicle torecapitalise the banking system, injected RM6.15billion in capital into 10 banking institutions andadditional injections are in the pipeline. TheCorporate Debt Restructuring Committee (CDRC)has received 48 applications involving debt totalling

RM22.7 billion. In the case of the small andmedium industries (SMIs), a rehabilitation fund wasalso set up in 1998, with an initial allocation ofRM750 million to provide financial assistance toSMIs which are viable but have temporary cashflow problems and NPLs. Amongst others, bankinginstitutions can utilise 30% of the total loansapproved under this Fund to replace and restructureproblem loans.
Throughout the crisis period, the Bank recognisedthe importance of ensuring the efficient functioningof the intermediation role of the banking institutions.However, given the protracted financial crisis andrising NPLs, the banking institutions placed greateremphasis on balance sheet considerations. Withrising NPLs and the erosion of capital, bankinginstitutions had become excessively cautious in theirlending decisions. A sharp slowdown in creditensued. A credit crunch, if allowed to develop,would deepen the economic recession, thuscompounding the financial difficulties of soundcompanies and subsequently affecting the health ofthe financial system. Hence, additional measureswere undertaken to encourage banking institutionsto continue to lend for productive purposes. Witheffect from 9 September 1998, banking institutionswith capacity were encouraged to achieve aminimum annual loan growth of 8% for 1998. Themotivation for the 8% credit floor was to free thebanking institutions from the self-imposed creditfreeze. The introduction of the credit growth target,however, did not sacrifice prudential consideration.Banking institutions were required to continueexercising financial discipline in providing creditand making their decisions withoutcompromising prudential standards to ensure thatthe balance sheets of the banking institutions donot deteriorate further. Nevertheless, bankinginstitutions should not unnecessarily complicate thecredit process, making it difficult for borrowers toobtain credit.
Other measures adopted to revive economicactivities of identified sectors included therelaxation of the earlier ceilings on the broadproperty sector and the share markets. Earlier rulesrestricting consumption credit imposed during theperiod of high credit growth were also relaxed.
On the whole, although there has been atendency to generalise the problems confronting theEast Asian region, there are important differences
in these economies that require alternative policyapproaches in dealing with the crisis. It is importantto recognise that there is no standard prescription.The approach adopted in Malaysia has differed fromthat of its neighbours in response to differencesthat exist in its financial and macroeconomicenvironment. Malaysia went into the crisis from aposition of favourable economic and financialfundamentals of a high savings rate, fullemployment, low external debt, a strong fiscalposition, and a strong and well-capitalised bankingsystem. These favourable initial conditions gaveMalaysia greater flexibility in its policy responseto the crisis and enabled the country to formulatea series of pre-emptive monetary and financialpolicy initiatives.
Fiscal Operations and Policy
The 1998 Budget was formulated in October 1997when Malaysia was in the initial phase of theregional crisis and was still experiencing robustgrowth. Fiscal policy during this period focused onstrengthening macroeconomic stability and restoringinvestor confidence. The policy aimed to addressthe key areas of vulnerabilities, including containinginflationary pressures arising from the ringgitdepreciation and addressing the current accountdeficit in the balance of payments. The fiscal policystance was therefore one of prudence and restraint.In line with these objectives, the Governmentbudgeted for a fiscal surplus of 2.7% of GNP inthe 1998 Budget. This was effected through restrainton consumption spending, the rightsizing of thepublic sector and the privatisation of Governmentactivities. Less critical projects were also deferredto narrow the resource gap. The Government,however, continued to provide essential expenditureto address supply constraints, raise productivity andenhance potential output. Priority was also accordedto poverty eradication programmes and upgradingthe quality of life.
In the wake of continued regional instability andits adverse impact on Federal revenue, theGovernment announced in December 1997, furtherfiscal austerity measures involving a reduction of10% across the board and 8% on a selective basis,of both operating and development expenditureallocations in the 1998 Budget. The cutback, washowever, implemented without affecting essentialpublic services, poverty eradication programmes andkey infrastructure development. As the crisis becamemore prolonged, this tight fiscal policy became

unsustainable. On 24 March 1998, the Governmentreversed the earlier policy and reduced the targetedbudget surplus to 0.5% of GNP as the contractionin the economy became evident in the first quarter.An additional expenditure of RM1 billion was alsoprovided for socio-economic projects to protect themore vulnerable segments of society.
The adjustment measures taken in terms ofrestrained fiscal and monetary policies in the earlypart of the crisis contributed towards improving thecurrent account of the balance of payments andcontaining price pressures. However, the publicsector expenditure cutbacks aggravated the declinein investor and consumer demand, causing a severedeflationary impact on the domestic economy. Giventhe change in economic conditions, the Governmentadopted counter-cyclical measures to revitalise thedomestic economy. The policy change aimed tominimise the severity of the economic downturn. InJuly 1998, the Government announced a fiscalstimulus package involving an additional allocationof RM7 billion for implementing projects with stronglinkages within the domestic economy; minimumleakage in terms of imports; short gestation period;and expenditures to meet socio-economic objectives.In this regard, the projects that were given priorityincluded those related to housing, education, health,and rural and infrastructure development. In addition,an Infrastructure Development Fund, with an initialallocation of RM5 billion was established to assistthe financing of infrastructure projects and largepublic facilities so that their implementation couldproceed. The projects identified included the mass-transit transportation system, ports, highways, watersupply and waste disposal as well as sewerageprojects. The Government also established orexpanded special funds to ensure continued accessto credit at reasonable costs for priority sectors.With the change in the fiscal policy stance, thefiscal account was estimated to have recorded adeficit of 3.7% of GNP in 1998.
After five years of fiscal surpluses, the 1999Budget, announced in October 1998, maintained afiscal deficit of 3.7% of GNP for 1998 and targetedfor an increase to 6.1% of GNP for 1999. Theexpansionary fiscal policy was designed to supporteconomic activities to promote economic recovery,to strengthen the nation’s resil ience andcompetitiveness, to restructure the financial sectorand to ensure social well-being. Although the thrustof budgetary operations was expansionary, fiscalprudence and discipline was being maintained to
contain the fiscal deficit at a manageable level soas not to jeopardise long-term growth. Theseobjectives are being achieved through budgetarycontrol on non-essential and non-productivespending, whilst according priority to infrastructureand socio-economic projects that could generateeconomic activities, promote efficiency, improvecompetitiveness and long-term productivity, but whichare low in import content. Emphasis was also beingplaced on an adequate programme to protect thelower income group and the poor from the adverseeffects of the crisis. Hence, a large share of the1999 Budget allocation was for public utilities,education and skills training and health and medicalservices. Emphasis was also being placed onagriculture and rural development and specialassistance schemes to assist the low-income group,petty traders and small businesses.
Given the prospect of weak revenue performancein 1999, the comprehensive plan to revitalise andrestructure the economy was carefully framed toensure that sufficient resources are available andthat the private sector would not be crowded out.The total financing requirement has been initiallyestimated at RM62 billion for 1998-99, to financethe recovery package including the fiscal deficit,restructuring of banking institutions and developmentof infrastructure. In view of the smaller overall fiscaldeficit of RM5 billion for 1998 (–RM9.6 billionestimated in the 1999 Budget), the total financingrequirement is now estimated to be lower at RM58billion for 1998-99. The financing requirement wouldbe raised from non-inflationary domestic sourcesand, to a lesser extent, from selective externalfinancing. In 1998, funding was largely met fromdomestic sources. For 1999, the bulk of the financingwould continue to be met from domestic sources.Besides new funds from the provident, pension andinsurance funds, there is sufficient liquidity in thebanking system. Additional liquidity would begenerated from the large current account surplusin the balance of payments recorded in 1998 andestimated for 1999. In order to avoid crowding outthe funding for the private sector, approximatelyone-third of the funding requirements would be metfrom external sources. The latter would comprisemainly loans from bilateral and multilateral sources.The Government would continue to ensure prudencein its recourse to external borrowing so as tomaintain the external debt at a manageable leveland to ensure favourable international credit ratings.The Government would continue to maintain a policyof containing the overall debt service ratio of thenation at a low level.

Throughout the crisis period, the Government haspersevered with its programme to reform andsimplify the tax system, provide a conduciveenvironment for investment, and enhancecompetitiveness and productivity. Tax measures thatwere implemented in 1998 and announced in the1999 Budget included the two percentage pointreduction in both the corporate and petroleumincome tax rates to 28% and 38% respectively,aimed at reducing the cost of doing business andproviding tax incentives to boost exports. Wide-ranging tax incentives and exemptions were alsointroduced to expedite the shift to higher value-added and technology-intensive industries, especiallyfor exports. These included tax exemption on theincrease in the export value. There was also areview of the reinvestment allowance to encourageindustries to move up the industrial ladder and anextension of research and development incentivesto accelerate the development of indigenoustechnology capability. In addition, incentives werealso introduced to promote the services sector toaddress the persistent services deficit in the balanceof payments. Comprehensive measures wereintroduced to strengthen the banking system andimprove transparency, while ensuring stability in thefinancial markets to facilitate trade and commerce.The measures included the introduction of severalprudential measures; the change in the tax treatmenton actuarial surplus; tax exemption (50%) forinterest-in-suspense; as well as the exemption ofstamp duty and real property gains tax on mergersof financial institutions. Meanwhile, the 1999 Budgetalso announced several changes in the taxadministration system to enhance its efficiency andresponsiveness in the collection of income tax. Mostimportant was the change in the tax assessment,which would now be based on income received inthe current year instead of the previous year basis,with effect from year 2000.
Consolidated Public Sector
The financial position of the consolidated publicsector weakened in 1998 largely attributable to thedeterioration in the revenue performance of theFederal Government and the increase inexpenditure, particularly by the non-financial publicenterprises (NFPEs). The consolidated public sectoraccount recorded an overall deficit compared withsignificant surpluses in 1996 and 1997. This largelyreflected the significant deterioration in the overallfinancial performance of the NFPEs as well as thegeneral government, in particular the FederalGovernment. In aggregate, the overall account of
the consolidated public sector recorded a deficit ofRM4.7 billion or 1.8% of GNP compared with alarge surplus of RM17.3 billion or 6.6% of GNP in1997. This is the first deficit recorded since 1993.The increase in development expenditure of thegeneral government was mainly to finance thestimulus package as well as for providing facilitiesand social amenities to the poor. The bulk of theexpenditure was mainly for education, health,housing, rural development and infrastructure.
The general government, comprising the FederalGovernment, 13 state governments, statutory bodiesand local governments continued to record a currentaccount surplus, albeit a much lower surplus ofRM19.5 billion or 7.4% of GNP (11.4% of GNP in1997). The lower surplus was mainly attributableto the decline in aggregate revenue collection(–12.4%), as operating expenditure remained virtuallyunchanged. Increased outlays were recorded mainlyfor debt servicing, the expansion of severaleducation funds and Fund for Food, as well asreactivating the Sinking Fund. However, theseoutlays were offset by the decline inother expenditures.
As in previous years, the surplus was mainlygenerated by the Federal Government and the state
Table 2.5Consolidated Public Sector Finance
1997 1998p 1999r
RM million
General government 1
Revenue 81,528 71,392 64,581Operating expenditure 51,884 51,896 54,852
Current surplus of general government 29,644 19,496 9,729
Current surplus of NFPEs 2 27,680 23,046 23,971
Public sector current surplus 57,324 42,542 33,700(% of GNP) 22.0 16.2 12.5
Net development expenditure 39,992 47,219 48,559General government 18,651 21,442 23,768NFPEs 2 21,341 25,777 24,791
Overall balance 17,332 –4,677 –14,859(% of GNP) 6.6 –1.8 –5.5
1Comprises Federal Government, state governments, statutory authoritiesand local governments.
2Refers to 28 NFPEs in 1997 and 1998 respectively.
p Preliminaryr Revised
Source: Ministry of Finance, state governments and non-financial publicenterprises

governments, while statutory bodies remained indeficit due to their narrow revenue base. Severalmajor public enterprises also experienced lessfavourable performances due mainly to higher costof operations and debt servicing arising from ringgitdepreciation during the year. As a result, theoperating surplus of the NFPEs was also reducedto RM23 billion or 8.8% of GNP (10.6% of GNPin 1997). Consequently, the consolidated publicsector current account recorded a reduced surplusof RM42.5 billion or 16.2% of GNP in 1998 (22%of GNP in 1997).
The public sector development expenditureincreased by 18.1% to RM47.2 billion in 1998(29.8% in 1997) due to the substantial increase incapital spending by the NFPEs (20.8%; 37.6% in1997), while the development outlays of the generalgovernment moderated to 15% (21.9% in 1997).Increases in development expenditure were recordedby several major NFPEs, including the PetroliamNasional Berhad (PETRONAS) and MalaysianInternational Shipping Corporation Berhad (MISC),mainly on project expansion and modernisationprogramme. A sizeable proportion of the capitalspending was also for the acquisition of companiesrelated to their core business, including investmentoverseas. However, due to the adverse economicdevelopments, several other NFPEs consolidatedtheir positions and deferred or scaled downdevelopment projects during the year.
Federal Government Finance
The financial position of the Federal Governmentwas less favourable in 1998 in the face of asubstantial decline in revenue as well as theimplementation of the fiscal stimulus package sinceJuly. The overall fiscal position reverted to a deficitof RM5 billion or –1.9% of GNP from a surplusof RM6.6 billion or 2.5% of GNP in 1997. This isthe first overall deficit since 1992. The currentaccount continued to remain in surplus, albeitsmaller, at RM12.1 billion or 4.6% of GNP (RM21billion or 8.1% of GNP in 1997).
In 1998, Federal revenue fell by 13.7% toRM56.7 billion or 21.6% of GNP, reflecting thecontraction in economic activity and weak domesticdemand. This decline also reflected the reductionin tax rates as well as several tax concessionsprovided in the 1998 Budget to promote productivity-driven growth and reduce the cost of doing
business. Revenue foregone from lower taxes wasestimated at about RM1.3 bill ion in 1998.Meanwhile, the marked decline in petroleum pricescoupled with the reduction in the rate of petroleumincome tax and export duty also affected receiptsfrom petroleum income tax, exports, imports andexcise duties which together with PETRONASdividends accounted for about one-fifth of totalrevenue (–5.1% to RM11.8 billion). In aggregate,revenue decline was recorded across the broadcategories of direct taxes (–RM417 million), indirecttaxes (–RM7.9 billion) and non-tax revenue andreceipts (–RM735 million).
For the first time since 1988, tax revenue fellby 15.5% to account for a lower share of 80% ofthe total Federal revenue. As a result, the ratio oftax receipts to GNP declined to 17.3% (20.5% in1997). Revenue from indirect taxes declinedsignificantly (–33.9%), thereby reducing its share to
Table 2.6Federal Government Finance
1997 1998p 1999r
RM million
Revenue 65,736 56,710 50,332Operating expenditure 44,665 44,584 47,220
Current surplus 21,071 12,126 3,112(% of GNP) 8.1 4.6 1.2
Development expenditure 14,445 17,128 19,202Gross development
expenditure 15,750 18,103 20,202Less Loan recoveries 1,305 975 1,000
Overall balance 6,626 –5,002 –16,090(% of GNP) 2.5 –1.9 –6.0
Sources of financing 1
Net domestic borrowing –2,048 11,040 –Gross borrowing 3,000 17,990 –Less Repayment 5,048 6,950 –
Net foreign borrowing –1,681 1,819 –Gross borrowing 462 4,001 –Less Repayment 2,143 2,182 –
Special receipts 91 1 –
Realisable assets 2 andadjustments –2,988 –7,858 –
Total –6,626 5,002 –
1Data for 1999 are not given.
2Includes changes in Government's Trust Fund balances. An increase in theaccumulated realisable assets is indicated by a minus (–) sign.
p Preliminaryr Revised
Source: Ministry of Finance

27% of total revenue. Reflecting the contraction indomestic demand and lower petroleum prices,almost all major categories of indirect taxes recordeddouble-digit declines. Receipts from import andexcise duties registered sizeable declines of 40.7%and 40.8% respectively. Lower collection of theseduties were apparent across the whole spectrum ofgoods, in particular, duties on motor vehicles andspare parts; petrol and petroleum products; electricalappliances and machinery. The poor performanceof import duties also reflected the sharp decelerationin import growth. The lower private sector spendingaffected sales tax collections (–37.7%), with lowerreceipts in all sub-sectors, especially transportequipment (including passenger, commercial and bus
vehicles). Meanwhile, the decline in the collectionof service tax was marginal (–1.9%) as wideningthe scope of the service tax in the 1998 Budgetto include services provided by employmentagencies, limousine and management services had,to some extent, offset the lower collection particularlyfrom professional services. The reduction in theexport duty on petroleum from 20% to 10% aswell as the lower crude oil prices also contributedto the lower collection from export duties. However,the decline was moderated somewhat by higherexport volume of crude petroleum.
Revenue from direct taxes recorded a lowerdecline (–1.4%) than receipts from indirect taxesand, hence increased its share of total revenue(53%; 46% in 1997). This was largely becauseincome tax collections were mainly based on theprevious year’s earnings which were still experiencingstrong growth in the first-half of 1997. Nevertheless,the rescheduling of some tax payments due tocorporate cashflow problems as well as the provisionof several tax concessions and incentives in the1998 Budget to enhance productivity and boostexports had moderated income tax collections. Thesefiscal measures included the two percentage pointreduction in corporate and petroleum income tax,and tax incentives to boost exports, promoteresearch and development, human resourcedevelopment and tax rebate for the purchase ofpersonal computers. On the whole, the higherreceipts from personal (+7.3%), petroleum (+4.8%)and corporate (+3.6%) income taxes were morethan offset by lower revenue collection from stampduties (–56.2%) and real property gains tax (–24.3%).The decline in these two taxes reflected lower pricesand volume of transactions in both the stock andproperty markets.
The sustained high level of income tax collectionduring the year was partly due to the increasednumber of taxpayers (+151,930 in 1998). It alsoreflected to some extent the success of the InlandRevenue Board (IRB) in widening the tax baseand its concerted efforts to strengthen the efficiencyof the tax collection machinery, improve complianceand ensure enforcement. Further measures wereintroduced in the 1999 Budget to increase theefficiency and responsiveness in the collection ofincome tax and to ensure that the cashflow of theGovernment reflects the current performance. Thisincluded the change in the tax assessmentbased on income received in the current yearinstead of the previous year basis, beginning from
-6-4-202468
101214
-6-4-202468101214
Net foreign borrowing
0
10
20
30
40
50
60
70
0
10
20
30
40
50
60
70
RM billion
Graph 2.7Federal Government Finance
1992 1993 1994 1995 1996 1997 1998
Development expenditure
Current revenue
Operating expenditure
-2-10123456789
10
-2-1012345678910
RM billion
Net domestic borrowing
1992 1993 1994 1995 1996 1997 1998
1992 1993 1994 1995 1996 1997 1998
Market loansGovernment securities Investment issues
-5
-4
-3
-2
-1
0
1
2
-5
-4
-3
-2
-1
0
1
2
Market loans
Other loans
1992 1993 1994 1995 1996 1997 1998
Total net borrowing
Overall deficit/surplus
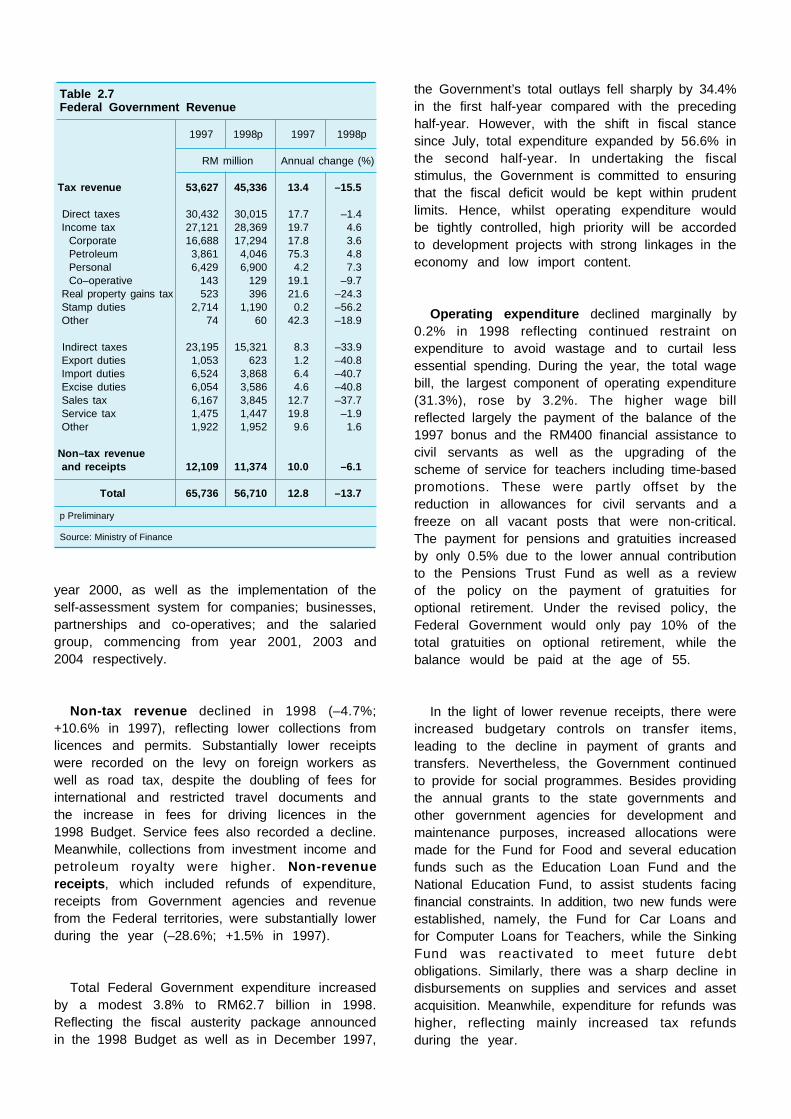
year 2000, as well as the implementation of theself-assessment system for companies; businesses,partnerships and co-operatives; and the salariedgroup, commencing from year 2001, 2003 and2004 respectively.
Non-tax revenue declined in 1998 (–4.7%;+10.6% in 1997), reflecting lower collections fromlicences and permits. Substantially lower receiptswere recorded on the levy on foreign workers aswell as road tax, despite the doubling of fees forinternational and restricted travel documents andthe increase in fees for driving licences in the1998 Budget. Service fees also recorded a decline.Meanwhile, collections from investment income andpetroleum royalty were higher. Non-revenuereceipts, which included refunds of expenditure,receipts from Government agencies and revenuefrom the Federal territories, were substantially lowerduring the year (–28.6%; +1.5% in 1997).
Total Federal Government expenditure increasedby a modest 3.8% to RM62.7 billion in 1998.Reflecting the fiscal austerity package announcedin the 1998 Budget as well as in December 1997,
the Government’s total outlays fell sharply by 34.4%in the first half-year compared with the precedinghalf-year. However, with the shift in fiscal stancesince July, total expenditure expanded by 56.6% inthe second half-year. In undertaking the fiscalstimulus, the Government is committed to ensuringthat the fiscal deficit would be kept within prudentlimits. Hence, whilst operating expenditure wouldbe tightly controlled, high priority will be accordedto development projects with strong linkages in theeconomy and low import content.
Operating expenditure declined marginally by0.2% in 1998 reflecting continued restraint onexpenditure to avoid wastage and to curtail lessessential spending. During the year, the total wagebill, the largest component of operating expenditure(31.3%), rose by 3.2%. The higher wage billreflected largely the payment of the balance of the1997 bonus and the RM400 financial assistance tocivil servants as well as the upgrading of thescheme of service for teachers including time-basedpromotions. These were partly offset by thereduction in allowances for civil servants and afreeze on all vacant posts that were non-critical.The payment for pensions and gratuities increasedby only 0.5% due to the lower annual contributionto the Pensions Trust Fund as well as a reviewof the policy on the payment of gratuities foroptional retirement. Under the revised policy, theFederal Government would only pay 10% of thetotal gratuities on optional retirement, while thebalance would be paid at the age of 55.
In the light of lower revenue receipts, there wereincreased budgetary controls on transfer items,leading to the decline in payment of grants andtransfers. Nevertheless, the Government continuedto provide for social programmes. Besides providingthe annual grants to the state governments andother government agencies for development andmaintenance purposes, increased allocations weremade for the Fund for Food and several educationfunds such as the Education Loan Fund and theNational Education Fund, to assist students facingfinancial constraints. In addition, two new funds wereestablished, namely, the Fund for Car Loans andfor Computer Loans for Teachers, while the SinkingFund was reactivated to meet future debtobligations. Similarly, there was a sharp decline indisbursements on supplies and services and assetacquisition. Meanwhile, expenditure for refunds washigher, reflecting mainly increased tax refundsduring the year.
Table 2.7Federal Government Revenue
1997 1998p 1997 1998p
RM million Annual change (%)
Tax revenue 53,627 45,336 13.4 –15.5
Direct taxes 30,432 30,015 17.7 –1.4Income tax 27,121 28,369 19.7 4.6
Corporate 16,688 17,294 17.8 3.6Petroleum 3,861 4,046 75.3 4.8Personal 6,429 6,900 4.2 7.3Co–operative 143 129 19.1 –9.7
Real property gains tax 523 396 21.6 –24.3Stamp duties 2,714 1,190 0.2 –56.2Other 74 60 42.3 –18.9
Indirect taxes 23,195 15,321 8.3 –33.9Export duties 1,053 623 1.2 –40.8Import duties 6,524 3,868 6.4 –40.7Excise duties 6,054 3,586 4.6 –40.8Sales tax 6,167 3,845 12.7 –37.7Service tax 1,475 1,447 19.8 –1.9Other 1,922 1,952 9.6 1.6
Non–tax revenueand receipts 12,109 11,374 10.0 –6.1
Total 65,736 56,710 12.8 –13.7
p Preliminary
Source: Ministry of Finance

In 1998, debt servicing, which is the secondlargest component in the operating expenditure(15.5%) rose by 7.8%. The higher outlay reflectedthe increased external indebtedness arising fromthe depreciation of the ringgit, the charges incurredin raising new loans as well as the higher domesticinterest rate during the first half-year.
Gross development expenditure rose by 14.9%to RM18.1 billion in 1998. The higher expenditurewas mainly attributable to the implementation ofthe RM7 billion fiscal stimulus package to revitalisethe economy as well as the provision of severalassistance schemes totaling RM1 billion to mitigatethe adverse impact of the economic adjustmentson the lower-income group and the vulnerablesegments of society. The bulk of the expenditurewas channelled to projects with strong domesticeconomic linkages and low import content. Theseincluded agriculture and rural development,infrastructure, housing, health and education projects.
In terms of sectoral distribution, economic servicesabsorbed a larger share or 51% of total expenditure.In particular, disbursements on the trade andindustry sub-sector were significantly higher. A largepart of the increased expenditure was disbursed toCyberview Sendirian Berhad (RM654 million),Pengurusan Danaharta Nasional Berhad (RM500million), Export-Import Bank of Malaysia (RM100million) and the Multimedia Development Corporation(RM90 million). In addition, part of the allocationwas for infrastructure facilities for new and
specialised industrial estates as well as for strategicinvestments including information technology. Prioritywas also given to the development of the smalland medium-scale enterprises, industrial researchand development, and the promotion of tourism. Incontrast, disbursements on the transport sub-sectorwere substantially lower in 1998 reflecting largelythe ongoing privatisation programme as well as thedeferment or scaling down of selective projects thatwere less critical. The bulk of the expenditure wasfor the construction and improvement of Federalroads (including highways) and the development andexpansion of rail, port and airport projects in tandemwith the Government’s efforts to provide for anintegrated transportation network. This was mainlyto strengthen and increase the capacity to facilitatethe flow of goods and passenger traffic to supportthe industrialisation process. The Government alsointensified its efforts during the year to meet thesocio-economic objectives of the nation. Expenditureon agriculture and rural development (including landdevelopment) remained high, while investment toimprove rural roads, water supply and electrificationprogrammes was increased.
Development expenditure on the social servicessector was also higher, accounting for a largershare of 32% of total development expenditure.Investment in education and training increasedduring the year, with priority placed on humanresource development, especially to develop skilledmanpower to support the productivity-driven growth.The expenditure was mainly for the upgrading ofeducation facilities, the construction of primary andsecondary schools, polytechnics, vocational andtechnical schools as well as the development ofuniversities, including the construction of theUniversiti Malaysia Sabah and the Universiti IslamAntarabangsa. Outlays on health and family planningwere also higher to enhance the quality of healthservices. The bulk of the expenditure was for theconstruction and upgrading of hospitals as well asthe provision of health facilities. Similarly, the higherexpenditure on housing was largely on low-costpublic housing projects and housing programmesfor the armed forces, customs officers, policepersonnel and teachers in rural areas, as well asestablishing a housing fund for the hardcore poor.Meanwhile, outlays on social and communityservices included a further contribution to theCommonwealth Games 1998, as well as theestablishment of the Amanah Ikhtiar Malaysia andthe micro-credit programme to assist the hardcorepoor, hawkers, petty traders and small enterprises.Expenditure for general administration was higher,
Table 2.8Federal Government Operating Expenditureby Object
1997 1998p 1997 1998p
RM million % share
Emolument 1 13,195 13,984 29.5 31.3Supplies and services 6,363 5,212 14.2 11.7Asset acquisition 905 434 2.0 1.0Public debt charges 6,426 6,928 14.4 15.5Pensions and gratuities 3,638 3,658 8.2 8.2Other grants and transfers 2 12,101 11,972 27.1 26.9Other expenditure 2,037 2,396 4.6 5.4
Total 44,665 44,5843 100.0 100.0
1 Excludes statutory bodies.2 Includes grants and transfers to state governments as well as public
agencies and enterprises.3 Excludes principal loan repayment of RM2.1 billion.p Preliminary
Source: Ministry of Finance

largely for the construction and development of thenew administrative centre and the implementationof the electronic Government to enhance efficiencyin the provision of services. In contrast, outlays ondefence and internal security were lower.
With an expansionary fiscal policy stance in July1998, the Government reviewed and expanded itsplanned borrowing for the year. Increased borrowingemanated mainly from domestic sources and, to alesser extent, from external sources in 1998, tofinance the fiscal deficit. As a result, total netborrowing (RM12.8 bil l ion) of the FederalGovernment increased for the first time, followingsix consecutive years of net repayment of loans.The increased borrowings, particularly from domesticsources, coupled with a marginal net exchangerevaluation loss arising from the weakening of theringgit against the Japanese yen had led to adeterioration in the total debt position of the FederalGovernment. The total debt outstanding increasedby 14.7% to RM103.1 billion at the end of 1998(end-1997: +0.3% to RM89.9 billion). As a percentof GNP, it increased from 34% to 39% at the endof 1998. Nevertheless, this ratio is still significantlylower, compared with 111% in 1986.
During the year, net domestic borrowingamounted to RM11 billion, in contrast to a net
repayment of domestic loans of RM2 billion in 1997.This domestic borrowing was mainly from non-inflationary domestic sources to fund its developmentexpenditure. Gross funds raised through MalaysianGovernment Securities (MGS) amounted to RM15billion, exceeding the previous high of RM8.6 billionraised in 1987. Part of the new issue was for therefinancing of MGS and Government InvestmentIssues (GII) which matured in 1998, amounting toRM7 billion. In December 1998, the Governmentsigned a syndicated loan agreement with 12 locally-incorporated foreign banks in Malaysia for a foreigncurrency loan amounting to US$1.35 billion(equivalent to RM5.1 billion), comprising largelyloans denominated in the United States dollar. Theloan was drawn down in three tranches, namely inDecember 1998 (first tranche of US$800 million)and January 1999 (second and third tranchestotalling US$550 million). The loan with a maturityperiod of five years has an interest rate spread of2.9% over the 6-month USD LIBOR. Meanwhile,there was no net new funds raised through the GIIor Treasury bills (TB), while the Treasury HousingLoans Fund recorded a small net borrowing duringthe year. Consequently, the total domestic debt ofthe Federal Government increased by 14.6% toRM88.2 billion at the end of 1998 to account for86% of the total outstanding debt.
In 1998, the Government floated six issues ofMGS worth RM15 billion, mainly through privateplacements and by way of open tender throughthe principal dealers. The new issues were for a
Table 2.9Federal Government Development Expenditure bySector
1997 1998p 1997 1998p
RM million % share
Defence and security 2,314 1,379 14.7 7.6
Economic services 7,501 9,231 47.6 51.0Agriculture and rural development 1,105 960 7.0 5.3Trade and industry 1,285 3,227 8.2 17.8Transport 3,578 3,051 22.7 16.9Public utilities 1,496 1,968 9.5 10.9Other 37 25 0.2 0.1
Social services 4,919 5,795 31.2 32.0Education 2,521 2,915 16.0 16.1Health 449 716 2.8 4.0Housing 735 1,041 4.7 5.7Other 1,214 1,123 7.7 6.2
General administration 1,016 1,698 6.5 9.4
Total 15,750 18,103 100.0 100.0
p Preliminary
Source: Ministry of Finance
Table 2.10Public Debt of Federal Government
Annual change At end1998p
1997 1998p
Nominal value in RM million
Domestic debt –2,243 11,229 88,197
Treasury bills – – 4,320Investment issues –1,400 –750 2,000Government securities –648 8,750 75,012Treasury Housing Loans Fund –195 189 3,825Market loans – 3,040 3,040
External debt 2,480 1,973 14,924Market loans 1,312 1,221 7,693Project loans 1,168 752 7,231
Total 237 13,202 103,121
p Preliminary
Source: Ministry of Finance

wide range of maturities of 3, 5, 7, 10, 15 and 20years to provide a benchmark yield curve to supportthe development of the bond market. Longer-datedMGS were mainly offered to institutional investorssuch as the social security institutions. Afteradjusting for loan redemptions, total MGSoutstanding increased by 13.2% to RM75 billion atthe end of 1998 and accounted for 85% of thetotal domestic debt outstanding. In terms of theownership structure of MGS holders, the significanceof the social security and insurance institutionsincreased, resulting in a slightly higher share of70% of the total outstanding MGS. The EmployeesProvident Fund (EPF) remained the single largestinstitutional investor in 1998, raising its holdings to61% of the total MGS, through investment in newissues of MGS as well as absorption of the divestedamounts of the Social Security Organisation(SOCSO). The share of MGS held by bankinginstitutions also increased (21%) reflecting the shiftto holdings of low-risk financial instruments. Theremaining MGS (9%) were held by the publicenterprises, the non-bank financial institutions andforeign investors.
The balance of the domestic debt was in theform of TB (5%), the Treasury Housing Loans Fund(4%), the domestic syndicated loan (4%) and GII
(2%). The banking institutions, which remained themajor investors of TB, continued to hold 85% ofthe total TB outstanding for liquidity purposes. Interms of the profile of holders of GII, the bankinginstitutions increased its holdings to account for alarger share of 45% of total GII outstanding. Allbanking institutions, in particular commercial banksincluding Bank Islam, increased their holdings ofGII reflecting the growing Islamic banking businessesas well as attractive returns. Meanwhile, the shareof BNM was reduced further to 47%, reflecting thenet redemption of loans during the year. The mainlenders to the Treasury Housing Loans Fund wereCagamas Berhad, the EPF, the National SavingsBank and the commercial banks.
The Government also relied, albeit to a lesserextent, on external borrowing largely from bilateraland multilateral sources, to fund its increasedfinancing needs. Consequently, for the first timesince 1991, net external borrowing of the FederalGovernment recorded a net inflow of RM1.8 billionin 1998. Gross external borrowing amounted to RM4billion, reflecting largely the raising of two loansduring the year. In June 1998, Malaysia signed anagreement with the World Bank (US$300 million orRM1.2 billion) under a multilateral arrangement tofinance projects to revive the economy as well asto mitigate the adverse effects of the economicadjustment on the more vulnerable segments ofsociety. In December, Malaysia signed the ¥74billion (RM2.4 billion) five-year term loan agreement/Euroyen bond with Sumitomo Bank Ltd./NomuraSecurities Co. Ltd.. The structured financing wasthrough a combination of a term loan and Euroyenbond issue guaranteed by the Ministry ofInternational Trade and Industry, Japan. Meanwhile,the large scheduled repayments of external loans(RM2.2 billion) in 1998 reflected largely the maturityof a Samurai bond of ¥30 billion (RM882 million)and a 100 million Swiss franc bond (RM274 million).Consequently, the external debt of the FederalGovernment rose by 15.2% to RM14.9 billion atthe end of 1998.
State Governments
Preliminary estimates indicated a smaller currentaccount surplus of RM4.3 billion in the consolidatedfinancial position of the 13 state governments in1998. The substantial decline in revenue collectionwas partially offset by a moderate contraction inbudgetary operations. In tandem with the policy offiscal prudence, all states achieved surpluses in
Table 2.11Holdings of Federal Government Domestic Debt
1997 1998p 1997 1998p
Nominal value in % shareRM million
Treasury bills 4,320 4,320 100.0 100.0Insurance companies 304 183 7.0 4.2Banking sector 3,959 3,678 91.7 85.1Other 57 459 1.3 10.7
Government InvestmentIssues 2,750 2,000 100.0 100.0Insurance companies 119 131 4.3 6.5Banking sector 2,610 1,848 94.9 92.4of which:
Bank Negara Malaysia 1,588 940 57.7 47.0Commercial banks 930 757 33.8 37.9
Other 21 21 0.8 1.1
Malaysian GovernmentSecurities 66,262 75,012 100.0 100.0Social security and
insurance institutions 45,329 52,851 68.4 70.4of which:
Employees Provident Fund 38,068 45,662 57.5 60.9Insurance companies 5,256 5,307 7.9 7.1
Banking sector 12,805 15,419 19.3 20.6Other 8,128 6,742 12.3 9.0
p Preliminary

their current accounts. However, with most statesrecording deficits in their overall balance, theconsolidated position reverted to a small deficit ofRM169 million. This is the first deficit recordedafter five consecutive years of surpluses. As FederalGovernment loans were more than sufficient tofinance the overall deficit, there was a build-up ofRM856 million in the accumulated financial assetsof the state governments.
The contraction in economic activity anddepressed prices of selected commodities affectedthe revenue of the state governments which fellsharply by 15.5% to RM8.4 billion in 1998. Thedecline in revenue was experienced by most stategovernments. Receipts from state sources declined,while contributions from Federal grants and transfersincreased. The lower revenue collections from statesources was attributable mainly to lower receipts ofboth tax and non-tax revenue. The decline inrevenue from direct taxes reflected lower receiptsfrom forest taxes due to the sharp reduction inboth saw log production and prices, following lowerdemand from both domestic and external markets.Nevertheless, it remained as the largest singlesource of state revenue, although its share fell to16%. Similarly, the decline in indirect taxes wasdue to lower collection from export duties on timber,and import and excise duties on petroleum products.Non-tax revenue also declined, largely due to lowerreceipts from most major components, particularlyfrom commercial undertakings and investmentincome. The larger receipts from Federal sourceswere channelled to assist the states in providinginfrastructure and other essential amenities toimprove the quality of life and to support theincreasing urbanisation in the states.
The total expenditure of the state governmentsas a group declined by 6.2% attributable largely tothe lower operating expenditure. In light of the lowerrevenue receipts, there was tighter control on non-essential expenditures and transfer payments.Hence, the operating expenditure of the stategovernments fell by 12.5% to RM4.1 billion(–6% in 1997). However, expenditure onemoluments was higher due mainly to the partpayment of the 1997 bonus in 1998 as well asthe financial assistance of RM400 each to civilservants. Similarly, gross development expenditurewas marginally lower by 1.4% to RM4.9 billionas the state governments consolidated theirposition in l ine with reduced resources.Nevertheless, eight states provided for an increase
in their capital expenditure. The bulk of theexpenditure was channelled to the economicsector, particularly for infrastructure (roads,bridges and public amenities), industrial andcommercial investments and agriculture and ruraldevelopment. The balance was expended on socialprogrammes, including housing and social andcommunity programmes. After taking into account asmaller loan recovery of RM437 million, netdevelopment expenditure rose marginally by 0.6%to RM4.5 billion.
Non-Financial Public Enterprises
Preliminary estimates of the consolidated positionof the 28 non-financial public enterprises (NFPEs)indicated that the overall financial position of theNFPEs as a group reverted to a deficit of RM1.5billion or 0.6% of GNP in 1998 after recording alarge surplus of RM6.7 billion or 2.6% of GNP in1997. The poorer outturn was attributed to thestrong increase in operating expenditure, includingdebt servicing arising from the weak ringgit andhigher capital spending, amidst more moderaterevenue growth. The strong increase in capitalexpenditure reflected mainly large investments by
Table 2.12Consolidated State Government Finance
1997 1998p 1999Budget
RM million
Revenue 9,968 8,421 7,725State sources 8,389 6,668 6,273Federal grants and transfers 1,579 1,753 1,452
Expenditure 4,715 4,123 4,665
Current surplus 5,253 4,298 3,060
Development expenditure 4,442 4,467 3,267
Gross development expenditure 4,975 4,904 3,716Less Loan recoveries 533 437 449
Overall balance 811 –169 –207
Sources of financing
Federal loans 816 1,025 666Realisable assets 1 –1,627 –856 –459
Total –811 169 207
1 An increase in the accumulated realisable assets is indicated by a minus(-) sign.
p Preliminary
Source: State governments

several major enterprises including PETRONAS andMISC, mainly in new projects, capacity expansionand modernisation programmes, as well asacquisition of companies related to their corebusinesses, and overseas investment. Nevertheless,given the economic uncertainties, several otherNFPEs either scaled down or deferred projects inthe pipeline.
The consolidated revenue of the NFPEscontinued to expand, albeit at a slower pace of11.8% to reach RM78.4 billion (1997: 21.3%). Whilethe revenue collection was adversely affected bythe contraction of economic activity and poorpetroleum prices, it benefited from the sharply highercrude palm oil prices and gains from overseasoperations in ringgit terms, as well as higher returnsfrom investments, especially overseas ventures.Meanwhile, operating expenditure rose sharply by28.8% to RM54.1 billion (1997: 13.5%). Higherspending reflected the increased cost of operationsand supplies, including higher import costs due tothe weak ringgit. Debt servicing was alsosubstantially higher, following higher domesticinterest rates, especially in the first half-year.External debt servicing also increased due to aweaker ringgit.
The operating surplus of the NFPEs as a groupwas maintained at a high level of RM24.3 billionor 9.3% of GNP (10.7% of GNP in 1997). Thelarge operating surplus was contributed mainly bythe larger NFPEs, notably PETRONAS, TelekomMalaysia Berhad (Telekom) and Tenaga NasionalBerhad (TNB). A small number of enterprisesexperienced further losses in 1998.
During the year, the capital expenditure of theNFPEs registered a strong growth of 20.8% toRM25.8 billion. Several major public enterprisescontinued to undertake capital investment, mainlyon infrastructure and utility projects (transport,telecommunications and energy), as well asinvestment in the oil and gas and manufacturingsectors. The increase in expenditure also reflectedthe investment diversification of some NFPEsthrough the acquisition of companies related to theircore businesses, including overseas ventures. Inparticular, higher capital spending was incurred byPETRONAS and MISC. However, several otherNFPEs consolidated their position and deferred orscaled down development projects in line withavailable resources.
During the year, PETRONAS continued to investin both upstream and downstream activities,including the construction of two new gas processingplants (GPP 5 and 6) and the central utility facilityprojects in Kertih and Gebeng. Other projectsundertaken by the company included thedevelopment of several petrochemical projects jointlywith multinational companies and the constructionof the University Technology PETRONAS and theKuantan-Kertih Railway project. PETRONAS alsocontinued to expand its overseas investment duringthe year. This included the acquisition of a SouthAfrican oil company, namely Engen Limited.Meanwhile, the capital investment of TNB wasmainly for capacity expansion as well as to expandand upgrade the transmission and distributionnetworks to meet the increasing demand forelectricity by the commercial and industrial sectorsas well as residential consumers. Major projectsunderway included the construction of Phase I ofthe 500kw transmission network, Phase III of thePort Klang Sultan Salahuddin Abdul Aziz PowerStation and the rehabilitation and conversion ofpower plants including the Melaka, Port Dickson,Prai and Pasir Gudang plants. TNB was alsoinvolved in the development of the electrificationinfrastructure for the XVI Commonwealth Games,1998, and the development of a world-classelectricity infrastructure for Putrajaya and Cyberjaya.Other projects included the construction of PhaseII of the Tenaga Nasional University Complex. TNBalso continued to invest in power projects abroadincluding in Pakistan and India. Similarly, Telekomcontinued with its expansion and modernisationprogramme to provide the nation with asophisticated telecommunication infrastructure. Alarge portion of the expenditure was expended ondeveloping a range of services and products for
Table 2.13Consolidated NFPEs Finance1
1996 1997 1998p
RM million
Revenue 57,794 70,086 78,378Expenditure 37,032 42,033 54,129
Current surplus 20,762 28,053 24,249(% of GNP) 8.7 10.7 9.3
Development expenditure 15,512 21,341 25,777
Overall balance 5,250 6,712 –1,528(% of GNP) 2.2 2.6 –0.6
1Refers to 28 NFPEs in 1996, 1997 and 1998.
p Preliminary
Source: Ministry of Finance and non-financial public enterprises

the Corporate Information Superhighway (COINS),which would be an integral part of the MultimediaSuper Corridor (MSC), and the National InformationInfrastructure (NII). Telekom continued to diversifyits investments overseas, including projects in SouthAfrica, Malawi and the Republic of Guinea. In linewith the policy to encourage the transportation ofgoods by Malaysian carriers, MISC continued itslong-term fleet expansion programme to enhanceits capacity to handle the growing volume ofinternational trade. The construction of the newKuala Lumpur International Airport was completedduring the year. Meanwhile, further workwas undertaken by Keretapi Tanah MelayuBerhad to modernise and enhance the quality andefficiency of rail services as an alternative commutertransport system.
With these large capital expenditures, theconsolidated overall account of the NFPEs as agroup reverted to a deficit of RM1.5 billion or 0.6%of GNP (+2.6% of GNP in 1997). This is the firstdeficit following three consecutive years of sizeablesurpluses. The capital outlays were mainly financedby internally generated funds and increaseddomestic borrowing. Recourse to external borrowingwas constrained by the ringgit depreciation. Hence,there was only a marginal increase in theoutstanding external debt of the public enterprisesto RM53.2 billion (representing 41% of the nation’s
external debt). The increase reflected a small netinflow of RM361 million as well as an exchangerevaluation loss as a result of the appreciation ofthe Japanese yen against the ringgit. The externaldebt level of the NFPEs remained manageable asthe capital investments currently being undertakenby the public enterprises were expected to generateadditional revenue to service the debt, besidesstrengthening the NFPEs’ financial performance.Nevertheless, in view of the large financing needsof the nation to revitalise the economy, investmentactivities and borrowings of the NFPEs need to beclosely monitored.
Following the regional crisis, the privatisationpolicy was implemented on a more selectivebasis. New privatised projects were assessedmore critically in terms of their macroeconomicimpact, especially on the balance of payments,strong economic linkages and domestic multipliereffects. During the year, seven projectswere privatised comprising three existingprojects and four new projects, mainly involvinginfrastructure and construction. The projects includedseveral highways such as the Ipoh-LumutHighway and the East-coast Highway, and theconstruction of the hostel for Universiti PutraMalaysia. Meanwhile, several approved privatisedprojects, which were viewed to be less strategic,were deferred.