moment–curvature measurement in thin sheet—part i: equipment
TRANSCRIPT

International Journal of Mechanical Sciences 41 (1999) 249—260
Moment—curvature measurement in thin sheet—part I:equipment
J.L. Duncan, S.-C. Ding, W.-L. JiangDepartment of Mechanical Engineering, The University of Auckland, Private Bag 92019, Auckland 1, New Zealand
Received 29 October 1996; and in revised form 26 January 1998
Abstract
The measurement of the moment—curvature characteristic for thin sheet metal in the elastic—plastic rangeprovides important information which is not readily obtained from the tensile test. Steel sheet which isroll-formed to products such as roofing typically contains a residual stress distribution and is subject tostrain ageing; these conditions can be identified from bend tests. The accurate determination of themoment—curvature diagram is not easy as the limiting elastic curvature is large and the magnitude of themoment is small.
Part I of this paper describes equipment and data processing which have been developed for this purposeand in Part II, results obtained in sheet which has been progressively aged and stress-relieved are presented.( 1998 Elsevier Science Ltd. All rights reserved.
Keywords: sheet bending; bending moment—curvature diagram; ageing; residual stress
Notation
P force measured by load cells, l, a, e
1, e
2dimensions of the rig
b half-length of the testpieceR
0bend radius of the testpiece when t"a
01/R
elimiting elastic curvature
E Young’s modulust sheet thicknessH horizontal force at the center of testpieceM(M
A, M
C) moment acting on the testpiece (edge and center)
Q1, Q
2horizontal components of the force acting at B and D
h, h#dh vertical distance of resultant force from the center and the edge of the testpiecer coefficient of correlation of the bend curvek bending stiffness, flexural rigidity (EI)
0020-7403/99/$ — see front matter ( 1998 Elsevier Science Ltd. All rights reserved.PII: S 0 0 2 0 - 7 4 0 3 ( 9 8 ) 0 0 0 3 1 - 9

* displacement of the crossheada0
initial angle of the clampp:"
yield stress in bendingt bend angleb1, b
2inclined angle of links
u inclined angle of clampg correction factor
1. Introduction
A bending test rig has been built which permits the accurate measurement of moment resistancein a thin strip of sheet metal in the elastic—plastic region. The objective is to submit the strip asnearly as possible to a pure moment at the onset of plastic deformation in the outer fibres of thestrip. Associated with the equipment is a data-processing system to determine the limit of linearelastic bending.
The equipment described is a development of earlier devices [1—3] used in the study of ageingand bending instability in steel sheet. The problem of uniformity of moment along the strip hasbeen considered in these devices and also in equipment used by others for bending bars and tubes[4—7]; while this problem is not eliminated in the present device, it is shown how it is minimized ina selected curvature range.
2. Description of the equipment
The method of bending the testpiece is evident from Fig. 1. The apparatus is placed in a testingmachine having accurate measurement of the crosshead displacement. A load cell giving accuratemeasurement in the range of 0—200 N connects the top cross-member of the apparatus to themachine crosshead. The equipment has four long aluminium links with precision ball bearingsfixed in the yokes at each end of the links. The testpiece (1) is held in the clamps (2) these clamps arebolted to the holder (3) in such a way that the angular relation between (2) and (3) can be adjustedin discrete increments of 10°. In this way, the curvature of the bend specimen when the linkagereaches the pure moment condition of Fig. 1 can be set before the test so that the limit of elasticbending occurs approximately at the configuration shown in Fig. 1.
After pre-setting the clamps (2), the test is started with the clamps horizontal. The testpiece isplaced loosely in the clamps and the load cell set to zero. This ensures that the testpiece weight doesnot influence the moment measurement. The clamps are tightened, making sure that the span of thetestpiece between the clamps is set to a length that will make the vertical links parallel when theconfiguration in Fig. 1 is reached.
During the test, the load and crosshead displacement are recorded digitally. A typical load—displacement diagram is shown in Fig. 2. Because of the changing geometry of the apparatus,the relations between load and moment and between displacement and curvature are non-linear;the load—displacement curve in the elastic range is consequently non-linear. To determinethe elastic limit in bending, the moment—curvature diagram must be computed as describedbelow.
250 J.L. Duncan et al. / International Journal of Mechanical Sciences 41 (1999) 249—260

Fig. 1. The bend test device.
3. Initial set-up
The geometry of the rig in the pure moment configuration is shown schematically in Fig. 3. It isdesired to find the initial angular set-up, a
0, between the clamps and their holder as described
above. Also the span of the testpiece, 2AC, must be calculated so that the links of length, l, areparallel and the link of length, a, is horizontal when the radius of curvature, R
0, is approximately
equal to the limiting elastic curvature, i.e.
R0+R
%"
Et2p
:"
(1)
J.L. Duncan et al. / International Journal of Mechanical Sciences 41 (1999) 249—260 251

Fig. 2. Typical load—displacement diagram in the bending test.
Fig. 3. Geometry of the bend rig in the pure moment condition.
This requires some prior knowledge of the approximate value of p:"
. From the given geometry,
R0"
s#(a/2)!e1sin a
0!e
2cos a
0sin a
0
(2)
252 J.L. Duncan et al. / International Journal of Mechanical Sciences 41 (1999) 249—260

Fig. 4. Geometry of bend rig in a general configuration.
and the initial span of the testpiece, 2b, is given by
b"R0a0. (3)
In this configuration, the moment applied to the testpiece is,
M"12Pa. (4)
This is constant along the strip and the axial force is zero.It is necessary to determine the moment and curvature relations in some general configuration
for the given initial settings, a0, and span, 2b.
Figure 4 shows the arrangement at some point in bending a specimen of initial half-length, b; thestrip has been bent to a radius of curvature R, which is assumed to be uniform, and subtendsa semi-angle, t, the bend angle.
The free body diagram is shown in Fig. 4(a). By symmetry, the force at C must be horizontal,hence the vertical components of force at B and D are equal and of magnitude P/2, where P is theload measured by the load cell. The horizontal equilibrium gives,
H"Q1#Q
2"
P2
Mtanb1#tan b
2N. (5)
J.L. Duncan et al. / International Journal of Mechanical Sciences 41 (1999) 249—260 253

Fig. 5. Geometry of the specimen, AC, and holder.
In Fig. 4(b), the free body diagram for the link ¹1¹
2, clamp and testpiece is drawn. The lines of
action of the forces in the long links intersect at some point G and the result of these forces is thehorizontal force, H. The moment on the testpiece at C is in equilibrium with the couple arising fromthe two horizontal forces, hence
MC"hH. (6)
In this configuration, the moment along the testpiece is not constant and as shown in Fig. 4(c), themoment at the end A of the span is
MA"(h#dh)H. (7)
In the design of the equipment it is desired to have h as large as possible and it should be pointedout that the intersection, G, can be above or below the specimen. If it is below, the force, H, iscompressive and the greater moment will be at the centre of the strip.
4. Geometric relations
We note from Fig. 3 that the ends B and D of the long links are a distance, s, and (s#a) awayfrom the centerline. As shown in Fig. 5, the other ends, ¹
1and ¹
2will move horizontally so that
the links become inclined by angles b1
and b2. The geometry at the start (a), when the links are
parallel (b) and in a general configuration (c) are shown in Fig. 5. The inclination of the arm ¹1¹
2in Fig. 5(c) is
u"t!a0, (8)
where t is the bend or curvature semi-angle subtended by the testpiece.Noting that the arm of length e
1is attached to the mid-point of ¹
1¹
2we have, from Fig. 5(c),
that the offset of the top link is
l sinb1"R sint#e
2cost#e
1sint!
a2
cosu!s (9)
254 J.L. Duncan et al. / International Journal of Mechanical Sciences 41 (1999) 249—260

Table 1The main dimensions of bend rig
Symbol Dimension (mm) Symbol l Dimension (mm) Initial angle (°)
2s 145 l 415 10a 60 e
137.5 a
020
2s#2a 265 e2
70 30
Fig. 6. Variation of bend angle, t, with displacement, *, for a0"30°.
and for the lower link,
l sinb2"R sint#e
2cost#e
1sint!
a2
cosu#(s#a). (10)
From these relations, the angles b1
and b2
can be found in terms of t, noting that because the arclength of the testpiece is constant that,
R"
bt
. (11)
From Figs 3 and 5(a), it may be seen that the vertical distance between the points B and D isinitially,
g0"l (cosb
1#cosb
2)0!a sin a
0(12)
when t"0. For a displacement of the crosshead of *, the vertical distance between B andD changes by
*"l (cosb1#cosb
2)!a sinu!g
0, (13)
where u is given by Eqn (8).The dimensions of the present equipment are given in Table 1 and for the initial setting of
a0"30°, the variation of the bend angle t with crosshead displacement, *, is shown in Fig. 6.A very similar relation is found for a
0"10 and 20°.
J.L. Duncan et al. / International Journal of Mechanical Sciences 41 (1999) 249—260 255

5. Determination of moment
In the free body diagram in Fig. 4(b), the moment arm, h, needs to be determined. In the triangleG¹
1¹
2,
asin(b
1#b
2)"
¹2G
sin ((n/2)#u!b1). (14)
Hence,
h"¹2G cosb
2!
a2
sin u#e1cost! e
2sin t!R (1!cost). (15)
Combining Eqns (5) and (6), we obtain
M#"h
P2
(tanb1#tanb
2). (16)
It is convenient to express the moment in terms of a correction factor, g, defined by the relation
M#"a
P2
(1#g). (17)
This factor g can be evaluated from Eqns (16) and (17) in terms of the geometry of the apparatusand is shown as a percentage for three settings of the fixture corresponding to a
0"10, 20 and 30°,
respectively, in Fig. 7. In a similar fashion, the ratio of horizontal force H to vertical force P can bedetermined as a function of bend angle, t, and H/P is shown as a percentage in Fig. 8.
Based on Eqn (7),
MA"(h# dh)H"M
C#dh )H"M
C#dM
A.
dMA
is the difference of the moment at point A compared with that at point C; the change of thisdifference with the increase of bend angle t is shown in Fig. 9.
Equation (11) gives the curvature, 1/R"t/b, which has a linear relation with bend angle, t. Themoment can be calculated from the measured load P using Eqn (17). The moment curvature
Fig. 7. Variation of the correction factor g, with bend angle t.
256 J.L. Duncan et al. / International Journal of Mechanical Sciences 41 (1999) 249—260

Fig. 8. Variation of the ratio of horizontal force to vertical load, H/P, with bend angle t.
Fig. 9. The difference between the edge and center moment.
diagram for the test in Fig. 2 is shown in Fig. 10(a) and alongside it, Fig. 10(b) the uncorrecteddiagram assuming g" 0. The difference between these two diagrams appears small, however, thecurvature of the uncorrected diagram, (b), in the elastic region is not negligible and the limitingelastic moment can only be determined from the corrected curve. The method of determining thepoint of the departure from linearity is described below.
6. Determination of yielding
We investigate two methods to determine the point on the moment—curvature characteristic atwhich the curve departs from linearity. The problem is similar to determining an elastic limit ora proof stress in the tensile test.
In the first method, the characteristic is fitted by the relation
M"M0#k (1/R), (18)
where M0
is the initial offset which may arise if the testpiece exerts some small moment when it isclamped; k is the bending stiffness or flexural rigidity,
k"EI"Ewt312
. (19)
J.L. Duncan et al. / International Journal of Mechanical Sciences 41 (1999) 249—260 257

Fig. 10. The moment, curvature diagrams from (a) corrected and (b) uncorrected data.
Fig. 11. The coefficient of correlation, r, of a typical test.
A least-squares regression is used to obtain a correlation coefficient, r. This is done on a point bypoint basis and if r'r
.!9, r
.!9is refreshed and then a new data point selected. The variation of
r with curvature for a typical test is shown in Fig. 11. The process is continued until r( r.!9
asindicated in the process diagram (Fig. 12); at this point, the characteristic is deemed to becomenon-linear and the limiting elastic moment is determined. The regression calculation is continueduntil r falls to a given value, r
#; this is done to ensure that r
.!9is a global maximum and not a local
maximum caused by small signal fluctuations.In the second method, a linear relation is fitted between selected points on the elastic portion of
the moment, curvature characteristic. From Eqn (1) using estimated values of yield strength andmodulus, the limiting elastic curvature, 1/R
%, can be calculated. Arbitrary offsets of 1 and 2% of the
limiting elastic curvature have been taken to obtain a ‘‘proof’’ value of the moment as shown inFig. 13.
These two methods give different results for the bending yield stress. If the limiting elasticmoment determined by either of these methods is denoted by M
e, the yield stress in bending is
determined as
p:""
6M%
wt2. (20)
258 J.L. Duncan et al. / International Journal of Mechanical Sciences 41 (1999) 249—260
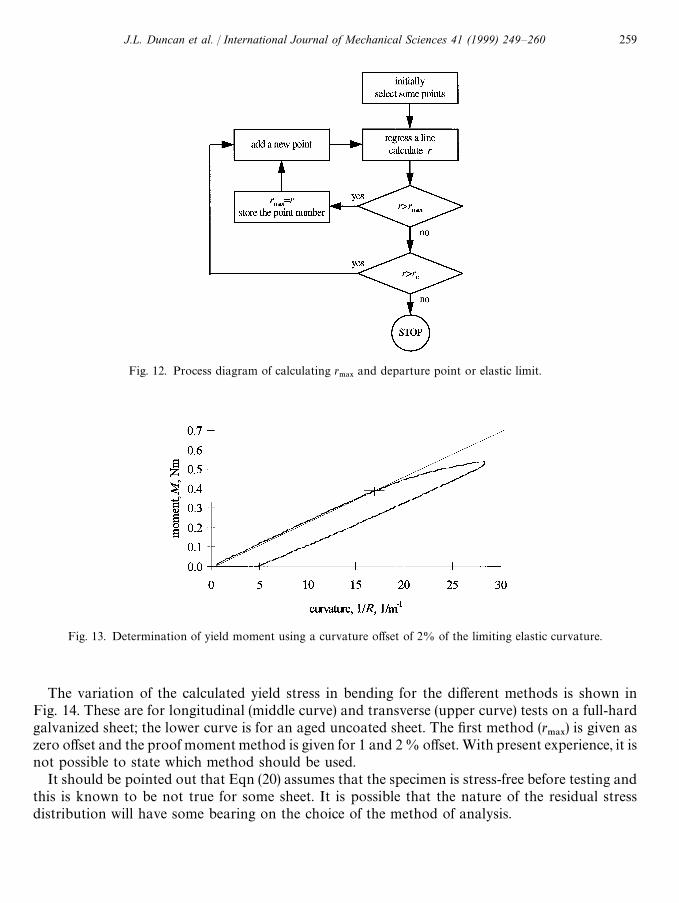
Fig. 12. Process diagram of calculating r.!9
and departure point or elastic limit.
Fig. 13. Determination of yield moment using a curvature offset of 2% of the limiting elastic curvature.
The variation of the calculated yield stress in bending for the different methods is shown inFig. 14. These are for longitudinal (middle curve) and transverse (upper curve) tests on a full-hardgalvanized sheet; the lower curve is for an aged uncoated sheet. The first method (r
.!9) is given as
zero offset and the proof moment method is given for 1 and 2% offset. With present experience, it isnot possible to state which method should be used.
It should be pointed out that Eqn (20) assumes that the specimen is stress-free before testing andthis is known to be not true for some sheet. It is possible that the nature of the residual stressdistribution will have some bearing on the choice of the method of analysis.
J.L. Duncan et al. / International Journal of Mechanical Sciences 41 (1999) 249—260 259

Fig. 14. Variation of calculated yield stress in bending with different amounts of offset.
7. Conclusions
The bend test device has been developed and tested for thin, hard sheet. It is shown how the testrig can be pre-set to approximate pure moment conditions at the onset of elastic—plastic bending.
Correction factors have been determined enabling an accurate moment curvature diagram to becomputed. Two methods are presented for analysing this curve to determine the limit of elasticbehaviour and hence calculate a yield stress in bending.
The equipment can be used in a universal testing machine having high-quality load and cross-head displacement measurement. Digital processing of test data is described.
Acknowledgements
The authors thank BHP Research, Australia, for their support of this work and J. T. Boyd, R. W.Halliwell and B. N. Fullerton for their assistance with the equipment. They also thank Dr. S. M.Panton for his advice with this manuscript.
References
[1] Sue-Chu M. Instability in bending, M. Eng. thesis, McMaster University, 1980.[2] Soldaat RJ. Bending and denting performance of strain aged sheet steel, M. Eng. thesis, McMaster University, 1985.[3] Gordon G. Ageing effects in bending of steel sheets, Ph. D. thesis, Auckland University, 1990.[4] Cimpoeru SJ, Murray NW. The large-deflection pure bending properties of a square thin-walled tube. International
Journal of Mechanical Sciences 1993;35(3/4):247—256.[5] Kyriakides S, Ju GT. Bifurcation and localization instabilities in cylindrical shells under bending—I, Experiments.
International Journal of Solids Structures 1992;29(9):1117—1142.[6] Kyriakides S, Corona E. Letters to the Editor. International Journal of Mechanical Sciences 1996;38(3):351.[7] Murray NW, Cimpoeru SJ. Authors’ reply. International Journal of Mechanical Sciences 1996;38(3):352—353.
260 J.L. Duncan et al. / International Journal of Mechanical Sciences 41 (1999) 249—260