molecular thermodynamics for chemical process …
TRANSCRIPT

MOLECULAR THERMODYNAMICS FOR CHEMICAL PROCESS DESIGN
J. M. PRA US NITZ University of California Berkeley, California 94720
T HE IMPORTANCE OF thermodynamics in chemical engineering is so well established
that today every undergraduate curriculum in chemical engineering includes at least one course in thermodynamics. Along with a few other subjects (e.g., transport phenomena, chemical kinetics, etc.), thermodynamics is recognized as one of the scientific cornerstones of chemical engineering science and practice.
Thermodynamics is a large subject with many possible applications; this article considers only that aspect of thermodynamics which is particularly important in chemical process design, viz., calculation of the equilibrium properties of fluid
Since the Scatchard-Hildebrand equation is not highly accurate, the design engineer faces the embarrassing problem of not knowing if the benzene comes out overhead or in the bottoms.
mixtures, especially as required in phase-separation operations. Design of most chemical processes requires at least some phase-equilibrium calculations since such processes, . with rare exceptions, include separation steps effected by diffusional operations such as distillation, extraction, etc.
While the technical importance of thermodynamics is recognized by all chemical engineers, and while its intellectual eminence is duly recognized by chemical engineering professors, its practice by industrial design engineers, unfortunately, is often limited. This limitation is certai1ily not caused by any lack of books or articles since our library shelves groan with
60
publications on thermodynamics. Nor is this limitation caused by any lack of respect for or recognition of thermodynamics by practicing chemical engineers. Unfortunately, however, many practicing engineers feel a deep frustration when they try to use thermodynamics for practical purposes. The books are full of equations and more equations and still more equations, and while many data are reported in the literature, in a typical practical situation, they rarely pertain to the particular mixture of interest and even then only rarely to the particular desired conditions of temperature, pressure and composition. Therefore, many experienced chemical engineers are disillusioned by thermodynamics; they regard thermodynamics the way a movie buff looks at the latest x-rated movie: it promises so much more than it delivers.
Practical use of thermodynamics for phase equilibrium calculations is restrained by lack of appropriate data and by limited availability of methods for estimating needed mixture properties from a minimum of experimental information. Since the number of binary mixtures in current chemical technology is already extremely large, and since the possible number of multicomponent mixtures is larger than the United States national budget expressed in pennies, we may safely conclude that it is not possible that we shall ever have enough experimental data to satisfy all our needs. On the other hand, it is also unlikely that within the normal life span of even our youngest colleagues we shall be able to calculate thermodynamic properties of multicomponent liquid mixtures from a fundamental theory, that is, by solving the Schrodinger equation. Clearly, therefore, it is necessary that we interpolate and extrapolate limited experimental data to estimate the information needed for designing a particular process or a particular processing unit. To perform such interpolations and extrapolations, we require models and, to assure that these models
CHEMICAL ENGINEERING EDUCATION

provide reliable answers, it is essential that they be based as much as possible on our growing knowledge of molecular behavior which, in turn, is expressed in macroscopic terms through statistical mechanics. When classical and statistical thermodynamics are combined with molecular physics, physical chemistry, limited experimental data and an efficient computer program, we obtain applied molecular thermodynamics. The purpose of this engineering tool is to provide the chemical engineer with the techniques that he needs to give him the equilibrium information required for process design.
To illustrate how molecular thermodynamics can help to solve engineering problems, four examples are briefly described in the following paragraphs. Each example refers to a real industrial situation.
RECOVERY OF BENZENE FROM A DILUTE SOLUTION OF SATURATED HYDROCARBONS
JN A REFINERY, a stream containing primari-ly C6 saturated hydrocarbons also contains ben
zene in low concentration. This stream is blended with others for making gasoline but, considering the rising price of benzene, it appears to be economical to remove the benzene by distillation prior to blending. The obvious question facing the design engineer is: What is the volatility of benzene (B) at high dilution relative to hexane (H)? To obtain a reasonable first estimate we can calculate the activity coefficient of benzene using the Scatchard-Hildebrand equation as outlined in Figure 1. * When we do so, we find that
'''All symbols are defined at the end of the article.
B = Benzene H = Hexane pS = Vapor Pressure Y = Activity Coeff icient
"EXTENDED" SCATCHARD- HILDEBRAND THEORY
CO VB [ 2 ] I n y B = RT (89- 8H) + 2 JI 888H
( b.Evap)l/2
8 = Solubil it y Pa rameter = -v-
[
1/2
(b.Evap) _ (b.Evap) (b.Evap)] -- - -- -- ( 1- J)
V BH V B V H
In or ig ina l (s imple) theory JI = 0
FIGURE 1. Relative Volatility of Benzene in Dilute Solution with Saturated Hexanes.
SPRING 1976
20
10
I 03 JI O t---=--+--------,f-----+---"'-
• • 0 .2 0.4 0.6 0.8
-1 0 •• • -20 • • • • • -30 •
No. of CH3 Groups
No. of C Atoms
in Sat urated Hydrocarbon
FIGURE 2. Correlation of Binary Parameter l with Methyl and Methylene Structure of Saturated Hydrocarbon.
00 a.n / H is uncomfortably close to unity. Since the Scatchard-Hildebrand equation is not highly accurate, the design engineer faces the embarrassing problem of not knowing if the benzene comes out overhead or in the bottoms.
The key simplification in the Scatchard-Hildebrand equation is the geometric-mean assumption which relates the cohesive energy density
(
6 Evn11 ) to those of the pure components. This V BH
assumption can be relaxed by introducing the binary constant l. Fortunately, experimental data for aromatic-saturated hydrocarbon systems are plentiful and therefore it was possible to establish a reasonable correlation for the binary parameter l as shown in Figure 2 taken from Funk [l]. The deviation from the geometric mean is related to the extent of branching of the saturated hydrocarbon ; the branching parameter, shown on the abscissa, varies from zero ( cyclohexane) to 0.8 (neopentane). Since the relative volatility depends not only on the solubility parameters, but also on l, to make rational design calculations, the design engineer must have some information on the extent of isomerization (branching) of the saturated-paraffin stream. With this information, parameter l can be estimated. Using Figure 2, it was possible to design the column with confidence and its performance corresponded fully to design specifications.
MODIFICATION IN THE AMMONIA-SYNTHESIS PROCESS
T HE CONVENTIONAL HABER process for synthesizing ammonia from nitrogen and hy
drogen must include a purge stream to remove unwanted methane and argon, as indicated in the top part of Figure 3. Small quantities of these inert materials unfortunately enter the reactor
61

Conventional
N2,H2
(Ar,CH4)
Modified
N2, H2 (Ar,CH4)
NH3
Recycle
Reactor
~250 atm
Reactor
Recycle ~250 aim
Absorber (~90°C)
Cooler
Purge
N2,H2, Ar, CH4
NH3
FIGURE 3. Modification of Ammonia Process: Reduc-tion of Purge-Gas Losses.
and unless they are removed, they eventually accumulate to an intolerable level, making the process inoperable. The purge stream, while small, discards appreciable quantities of nitrogen and hydrogen and, what is economically most unattractive, it wastes the work of compression that has been expended to bring the thrown-away reactants to the high pressure at which the reactor must operate.
To minimize purge-stream losses, a modification of the ammonia process was suggested by Professor Scott Lynn [2], as shown in the lower part of Figure 3. In this modification the purge stream, at high pressure, is contacted with product liquid ammonia in an absorber, operating near 90°C. The absorber removes most of the unwanted argon and methane and allows most of the wanted nitrogen and hydrogen to be recycled to the reactor with essentially no work of compression. The effluent liquid ammonia, rich with argon and methane (and containing also some nitrogen and hydrogen), is then cooled and flashed. The advantage of this procedure is that the energy and material (H2 , N2 ) loss in the purge stream is minimized. (It may also be possible to recover the argon with subsequent processing, but this is a secondary refinement.)
The disadvantage lies in the capital investment needed to construct the high-pressure absorber. To investigate the economics of this process modification, it was necessary to estimate phase equilibria in the five-component system NH3-H2-N 2-Ar-CH1 at high pressure. An experimental study would require much time and expense and the usual thermodynamic methods
62
found in textbooks are of little use here because in this mixture we have one subcritical component and four supercritical components. To make reasonable estimates, Alesandrini [3] used some molecular-thermodynamic tools summarized in Figure 4. For the liquid phase he used a model of the van Laar type, suggested earlier by Chueh [4] and for the vapor phase, a modified Redlich-Kwong (RK) equation of state. This modified RK equation, in turn, was made possible by an earlier study of O'Connell [5] which had investigated the polar and nonpolar interactions of ammonia molecules. Since the pressure is high, the effect of pressure on the liquid phase (Poynting effect) had to be taken into account and this, in turn, was made possible by a correlation of liquid partial molar volumes published in 1965 by Lyckman and Eckert [6]. The large advantage of Alesandrini's thermodynamic method is that only pure-component and binary data are required to predict the five-component phase equilibria by solving the equations shown in Figure 5. A computer program, containing an efficient iteration scheme, was used to calculate the equilibria using the thermodynamic tools briefly mentioned above coupled with experimental Henry's constants for each of the four gases in liquid ammonia; fortunately these were available in the literature.
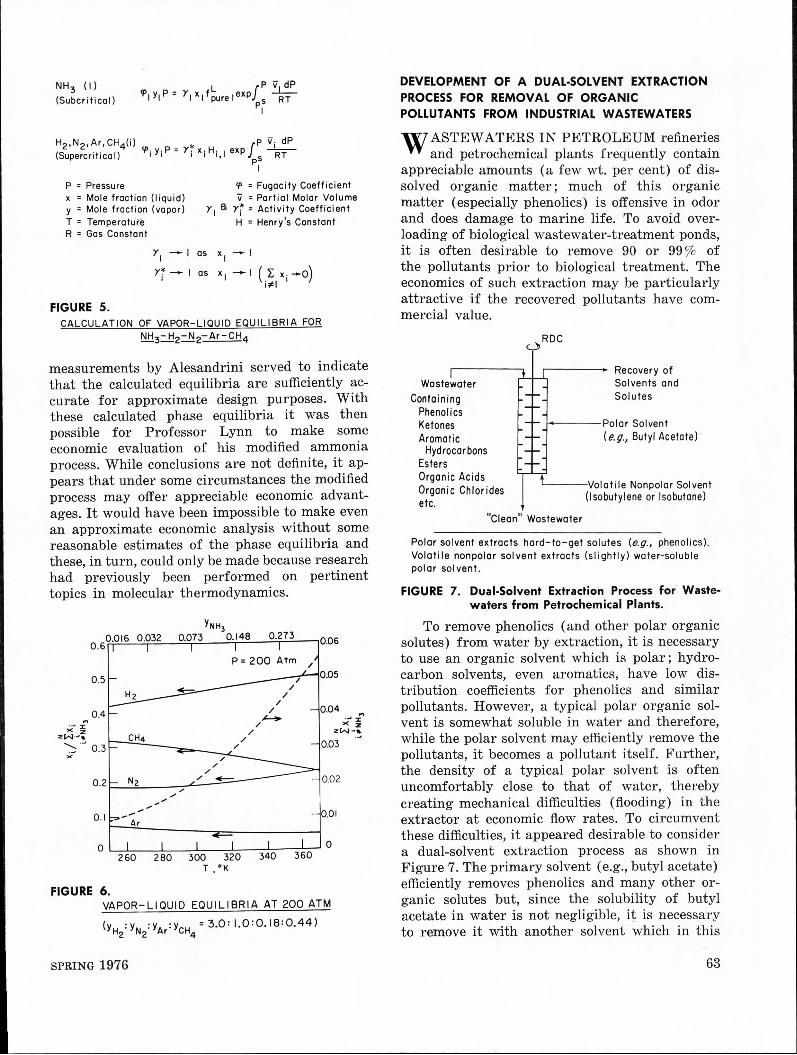
Some typical results from Alesandrini's calculation are shown in Figure 6. The gas composition (NH 3-free basis) is shown at the top and, in this example, the pressure is constant at 200 atm. The right ordinate shows the overall solubility and the left ordinate shows the individual solubilities, both as a function of temperature. The mole fraction of ammonia in the gas phase is also shown. A few well-selected experimental
Fugacity Coefficient 'P
Modified Redlich-Kwong equation of state. Modification based on analysis of potential energy function for ammonia (O'Connell).
Partial Molar Volume v Correlation based on cohesive energy density
concept (Lyckman and Eckert)
Activity Coefficients Y1 and Yi
Modified Van Loar Model (Chueh)
Henry's Constant H
Reduction of binary NH3-solute data
FIGURE 4. Calculation of Thermodynamic Properties Needed for Solution of Phase-Equilibrium Equations.
CHEMICAL ENGINEERING EDUCATION
NH3 (I)
(Subcritical)
P = Pressure x = Male fraction (liquid) y = Male fraction (vapor) T = Temperature R = Gas Constant
'P = Fugacity Coefficient v = Partial Molar Volume
Y1 a Yj = Activity Coefficient H = Henry's Constant
Y1 -1 as
Yj- I as ( r x.-o) i~I I
FIGURE 5. CALCULATION OF VAPOR-LIQUID EQUILIBRIA FOR
NH3-Hz-Nz-Ar-CH4
measurements by Alesandrini served to indicate that the calculated equilibria are sufficiently accurate for approximate design purposes. With these calculated phase equilibria it was then possible for Professor Lynn to make some economic evaluation of his modified ammonia process. While conclusions are not definite, it appears that under some circumstances the modified process may offer appreciable economic advantages. It would have been impossible to make even an approximate economic analysis without some reasonable estimates of the phase equilibria and these, in turn, could only be made because research had previously been performed on pertinent topics in molecular thermodynamics.
.,, ·- :c >< z
zW--'11,
0 .6
0 .5
0-4
YNH3 0.016 0.032 0.073 0.148 0.273
P= 200 Atm ,,
/ /
/
,, / ~
,, /
/
,·-·- 0 .3 /
>< / /
/
0.2l:::.......'.N~2 ___ ...L-,,._+-=c..--.,. ..,.
0.1 _.,,,,,.--,,,,.-
Ar
0.06
0.04 .., .J :c
>< z zt,,,.J --11,
0.03
0.02
0.01
0 L_.L-_--1.... _ __. __ -L---'-----::-=-::-' 0 260 280 300 320 340 360
T , °K
FIGURE 6. VAPOR-LIQUID EQUILIBRIA AT 200 ATM
(yH2: YN2: YAr: YcH4 = 3.0: I.0:0.18: 0.44)
SPRING 1976
DEVELOPMENT OF A DUAL-SOLVENT EXTRACTION PROCESS FOR REMOVAL OF ORGANIC POLLUTANTS FROM INDUSTRIAL WASTEWATERS
WAS TEW ATERS IN PETROLEUM refineries and petrochemical plants frequently contain
appreciable amounts (a few wt. per cent) of dissolved organic matter; much of this organic matter ( especially phenolics) is offensive in odor and does damage to marine life. To avoid overloading of biological wastewater-treatment ponds, it is often desirable to remove 90 or 99 % of the pollutants prior to biological treatment. The economics of such extraction may be particularly attractive if the recovered pollutants have commercial value.
Wastewater
Containing Phenolics Ke tones Aromatic
Hydrocarbons Esters Organic Acids Organic Chlorides etc.
~----. Recovery of Solvents and Solutes
----Polar Solvent ( e.q., Butyl Acetate) ·
~--Volat i le Nonpolar Solvent (lsobutylene or lsobutane)
"Clean" Wastewater
Polar solvent extracts hard-to-get solutes (e.q., phenolics). Volat i le nonpolar solvent extracts (slightly) water-soluble polar sol vent.
FIGURE 7. Dual-Solvent Extraction Process for Wastewaters from Petrochemical Plants.
To remove phenolics (and other polar organic solutes) from water by extraction, it is necessary to use an organic solvent which is polar; hydrocarbon solvents, even aromatics, have low distribution coefficients for phenolics and similar pollutants. However, a typical polar organic solvent is somewhat soluble in water and therefore, while the polar solvent may efficiently remove the pollutants, it becomes a pollutant itself. Further, the density of a typical polar solvent is often uncomfortably close to that of water, thereby creating mechanical difficulties (flooding) in the extractor at economic flow rates. To circumvent these difficulties, it appeared desirable to consider a dual-solvent extraction process as shown in Figure 7. The primary solvent (e.g., butyl acetate) efficiently removes phenolics and many other organic solutes but, since the solubility of butyl acetate in water is not negligible, it is necessary to remove it with another solvent which in this
63

case is isobutane or isobutylene. A rotating disc column (RDC) is useful for this process. Wastewater enters at the top and the C., hydrocarbon enters at the bottom of the column. Near the middle of the column, butyl acetate is introduced. Since the density of C4 is much lower than that of butyl acetate, the density of the organic phase is always well below that of water, allowing relatively large flow rates without flooding. The highly favorable distribution coefficients for the pollutants, distributing themselves between water and the mixed organic phase, permit operation at low solvent-to-water flow ratios. The high volatility of c. is also beneficial in subsequent processing steps to recover the solvents. The RDC operates at slightly elevated pressures, in the region 40-50 psia.
To design this extraction process and to evaluate its economic potential, it was necessary to obtain distribution-coefficient data. For a nonvolatile solvent like butyl acetate such data are obtained easily. But for volatile solvents, distribution data must be obtained under pressure and the necessary experimental work is much more difficult. Nevertheless, an apparatus and procedure for obtaining such data was developed by K. W. Won, as described elsewhere [7]. To minimize the experimental effort, it was desirable to obtain only a few representative experimental results and then to generalize ( correlate) these with the help of molecular thermodynamics.
A simple technique for achieving at least partial correlation is outlined in Figure 8. The distribution coefficient K consists of two parts : first, the difference in work that must be done to create a hole in the solvent and to collapse a hole in the water as the solvent moves from one phase to the other and second, the difference in attractive energy experienced by the solute as it exchanges its aqueous environment to a hydro-
q = Size parameter for solute
kq=k'q -k"q
k'q = Work needed to moke "hole" for solute in water
k"q = Work needed to make "hole" for solute in solvent
~U=U'-U"
U' = Attractive energy for solute in woter
U" = Attractive energy for solute . in solvent
FIGURE 8. Distribution Coefficient K is Correlated by Perturbed-Hard-Sphere Theory of Solutions.
64
1000.-----~-..---~--
Ill -C (I)
·;:; i
Cl) 0 u
100
C 10 0
• lsobutylene x lsobutane
] f ·;:: -Ill c
20 25 30 v*0.7
35 40
FIGURE 9. Distribution Coefficients K at 25 °C for Acetates. Units of V* are cm3 /mol. (K = moles acetate per kilogram of hydrocarbon/moles acetate per kilogram of water).
carbon environment. The derivation of the equa~ion shown in Figure 8 is given elsewhere [7] ; it 1s based on a very simple theory of dilute solutions, which, in similar forms, has often been used in the physico-chemical literature, especially for pharmaceutical applications. For our purposes here, we only want to show how such a simple theory can be used to obtain straight-line correlations for different solute families as shown in Figures 9 and 10 where size parameter q has been replaced by (V*) 0 · 7 • The solute-size parameter V* is obtained from fundamental purecomponent thermodynamic data. The exponent 0.7 was chosen because it is not clear whether the work to create a hole is proportional to the size V* or to the surface area which, at least for spheres, is given by (V*) 2/3. Empirically it was found that 0.7 gives the best straight-line correlation for the solutes considered in this particular extraction process. Figures 8, 9 and 10 illustrate that simple molecular ideas can reduce experimental effort by providing a reasonable basis for interpolation and extrapolation of limited experimental data.
Bench-scale pilot plant studies by Earhart [8] have shown that the extraction process outlined in Figure 7 has considerable potential for economic wastewater treatment.
CHEMICAL ENGINEERING EDUCATION
OPTIMIZATION OF THE SEPARATION STEP PRIOR TO RECYCLE OF ETHYLENE IN THE HIGHPRESSURE PROCESS FOR POLYETHYLENE
JN 1974, ANNUAL production of polyethylene was slightly in excess of four million tons.
Much of this polyethylene is made by the high pressure process, shown schematically in Figure 11. Per pass, the conversion of ethylene to polymer is in the region 10-30 % and it is therefore necessary, at the reactor outlet, to separate unreacted ethylene from the product stream, prior to recompression and recycle. Separation is easily achieved by decompression since the solubility of ethylene is strongly pressure-dependent. The lower the pressure in the separator, the better the separation. But the lower the pressure
"' ... C QI
·;:; ~ -QI 0 u -0
C .!:! "S .a ·;: .. "' Q
• lsobutylene 100 x lsobutane
10
1.0
ti -'ii -
N
' C
l ,:
0. I L-..L....--L-'--..L.......LL-J.J.........J
20 25 30 35 v,..O. 7
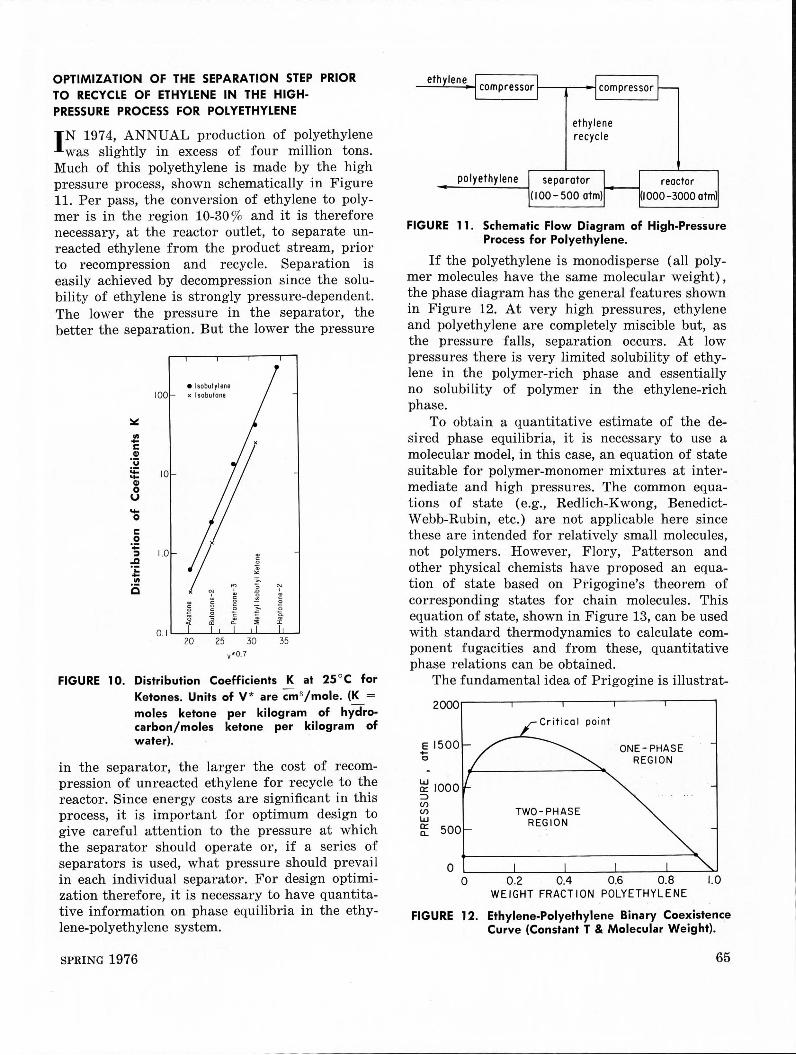
FIGURE 10. Distribution Coefficients K at 25 °C for Ketones. Units of V* are cm3 /mole. (K = moles ketone per kilogram of hydrocarbon/moles ketone per kilogram of water).
in the separator, the larger the cost of recompression of unreacted ethylene for recycle to the reactor. Since energy costs are significant in this process, it is important for optimum design to give careful attention to the pressure at which the separator should operate or, if a series of separators is used, what pressure should prevail in each individual separator. For design optimization therefore, it is necessary to have quantitative information on phase equilibria in the ethylene-polyethylene system.
SPRING 1976
ethylene compressor 1--~-- compressor
ethylene recycle
polyethylene separator reactor (I000-3000 atm) (100-500 atm)
FIGURE 11. Schematic Flow Diagram of High-Pressure Process for Polyethylene.
If the polyethylene is monodisperse (all polymer molecules have the same molecular weight), the phase diagram has the general f ea tu res shown in Figure 12. At very high pressures, ethylene and polyethylene are completely miscible but, as the pressure falls, separation occurs. At low pressures there is very limited solubility of ethylene in the polymer-rich phase and essentially no solubility of polymer in the ethylene-rich phase.
To obtain a quantitative estimate of the desired phase equilibria, it is necessary to use a molecular model, in this case, an equation of state suitable for polymer-monomer mixtures at intermediate and high pressures. The common equations of state (e.g., Redlich-Kwong, BenedictWebb-Rubin, etc.) are not applicable here since these are intended for relatively small molecules, not polymers. However, Flory, Patterson and other physical chemists have proposed an equation of state based on Prigogine's theorem of corresponding states for chain molecules. This equation of state, shown in Figure 13, can be used with standard thermodynamics to calculate component fugacities and from these, quantitative phase relations can be obtained.
The fundamental idea of Prigogine is illustrat-
2000
E 1500 +-0
~ IOOO => (f) (f)
w ~ 500
0
Critical point
TWO-PHASE REGION
ONE- PHASE REGION
0 0-2 0.4 0.6 0.8 1.0 WEIGHT FRACTION POLYETHYLENE
FIGURE 12. Ethylene-Polyethylene Binary Coexistence Curve (Constant T & Molecular Weight).
65

v = _y_ v*
~ p p = -p* T = T
T*
v* = Hard-core (van der Waals) volume per segment p"' = S")/2v"'2
T"' = S")/2ckv* k = Boltzmann's Constant
s = Nt1mber of external surface sites per segment
")IV = Potential energy per surface-site contact
3c = Number of external degrees of freedom (translation, large-scale rotations and vibrations)
Parameters v*, P*, and T* obtained from PVT data
FIGURE 13. Equation of State for Polyethylene, Ethy-lene, and Their Mixtures at High Pressures.
ed in Figure 14. In the upper part we show a container of volume V containing Nr monomer molecules at temperature T. In the lower part we show a container of the same volume V at the same temperature T, containing N polymer molecules where each polymer molecule consists of r units (or segments); the total number of segments, then, is Nr. In both containers, therefore, the density is the same, viz. Nr/V. But clearly there is a difference between the two situations. The difference is that in the upper diagram the total number of external degrees of freedom is 3Nr (each molecule has 3 translational degrees of freedom) while in the lower diagram, due to chemical bonding of the segments, the total number of external degrees of freedom is smaller. How much smaller? There are 3N translational degrees of freedom but there are also many degrees of freedom due to rotation and vibration of the segments. Some of these are external (i.e., they are affected by the presence or absence of neighboring molecules) while others are internal (i.e., they are independent of density). The total
. . . . ..... . ........ · .. . . . . . . . . . . . . ..... (Nr) SPHERICAL MOLECULES
AT T AND V
N CHAIN MOLECULES WITH r SEGMENTS EACH
(Nr SEGMENTS) AT T AND V
No. OF EXTERNAL (DENSITY-DEPENDENT) DEGREES
OF FREEDOM
3 Nr (ALL TRANSLATION)
3Nr(f) = 3Nc
ONLY 3 N TRANSLATION
0<-%-<1
IF ALL SEGMENTS WERE INDEPENDENT, t- WOULD
EQUAL UNITY
FIGURE 14. Corresponding States for Chain Molecules.
'66
number of external degrees of freedom in the lower diagram is equal to 3Nr (c / r) and Prigogine's theorem of corresponding states assumes that all of these can be treated as if they were equivalent translational degrees of freedom. The parameter c/ r lies between zero and unity. If the polymer molecule is stiff (uncooked spaghetti), c/ r < < 1 because in a stiff molecule rotations and vibrations are severely limited. On the other hand, if the polymer molecule is highly flexible (cooked spaghetti) c/ r may be in the region 0.5-0.8; only in the limit, when all segments can act independently (all segment-segment bonds are broken) does c/ r attain a value of unity.
The equation of state shown in Figure 13 contains three molecular reducing parameters, here called v*, T* and P* ; the first of these reflects the hard-core size of the molecules ( or segments) and the other two, in combination, reflect the characteristic segment-segment potential energy and the "flexibility" parameter c. Numerical
This article considers only that aspect of thermodynamics which is
particularly important in chemical process design, viz., calculation of the
equilibrium properties of fluid mixtures, especially as required in phase
separation operations.
values of these parameters can be obtained from fitting the equation of state to experimental volumetric (PVT) data which are available for polyethylene and for dense ethylene. The equation of state can be applied to mixtures using reasonable mixing rules.
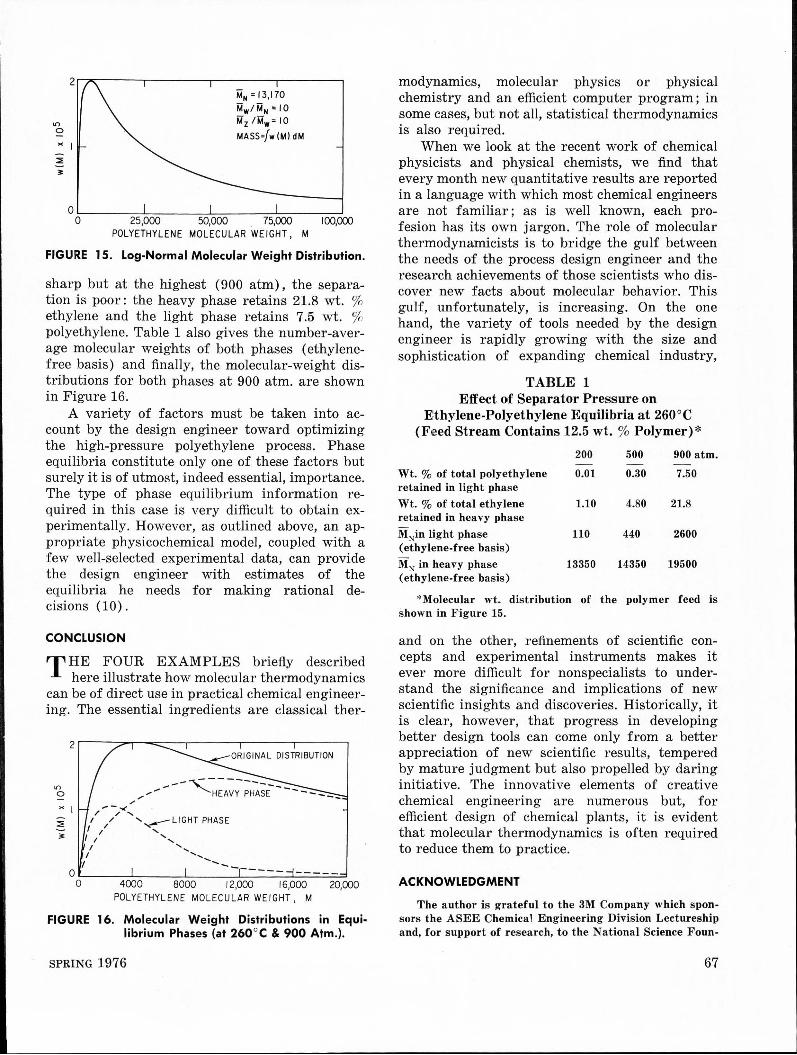
In a real industrial situation, the polymer in the product stream is not monodisperse, but polydisperse and, therefore, the mixture is not a binary but a multi-component mixture. A realistic distribution of molecular weights of polyethylene is shown in Figure 15 ; this particular distribution is a log-normal distribution whose number-average molecular weight is given by MN and whose first and second moments are those indicated.
Using the equation of state based on Prigogine's theorem, the molecular-weight distribution shown, and a suitable computer program, it is possible to calculate phase equilibria in the separator [9]. Some results are shown in Table 1 ; these were calculated at 260°C for an entering stream containing 12.5 wt % polymer. At the lowest pressure (200 atm) , the separation is
CHEMICAL ENGINEERING EDUCATION
"' 0
" I ::. 3'
MN= 13,170
Mw/MN=IO i.12 /Mw=IO
MASS=/w (Ml dM
0 .__------'-----"---------'--------' 0 25,000 50,000 75,000 100,000
POLYETHYLENE MOLECULAR WEIGHT, M
FIGURE 15. Log-Normal Molecular Weight Distribution.
sharp but at the highest (900 atm), the separation is poor: the heavy phase retains 21.8 wt. % ethylene and the light phase retains 7.5 wt. % polyethylene. Table 1 also gives the number-average molecular weights of both phases (ethylenefree basis) and finally, the molecular-weight distributions for both phases at 900 atm. are shown in Figure 16.
A variety of factors must be taken into account by the design engineer toward optimizing the high-pressure polyethylene process. Phase equilibria constitute only one of these factors but surely it is of utmost, indeed essential, importance. The type of phase equilibrium information required in this case is very difficult to obtain experimentally. However, as outlined above, an appropriate physicochemical model, coupled with a few well-selected experimental data, can provide the design engineer with estimates of the equilibria he needs for making rational decisions (10).
CONCLUSION
THE FOUR EXAMPLES briefly described here illustrate how molecular thermodynamics
can be of direct use in practical chemical engineering. The essential ingredients are classical ther-
"' 0
" I
4000 8000 12,000 16,000 20,000 POLYETHYLENE MOLECULAR WEIGHT, M
FIGURE 16. Molecular Weight Distributions in Equilibrium Phases (at 260°C & 900 Atm.).
SPRING 1976
modynamics, molecular physics or physical chemistry and an efficient computer program; in some cases, but not all, statistical thermodynamics is also required.
When we look at the recent work of chemical physicists and physical chemists, we find that every month new quantitative results are reported in a language with which most chemical engineers are not familiar ; as is well known, each prof esion has its own jargon. The role of molecular thermodynamicists is to bridge the gulf between the needs of the process design engineer and the research achievements of those scientists who discover new facts about molecular behavior. This gulf, unfortunately, is increasing. On the one hand, the variety of tools needed by the design engineer is rapidly growing with the size and sophistication of expanding chemical industry,
TABLE 1 Effect of Separator Pressure· on
Ethylene-Polyethylene Equilibria at 260°C (Feed Stream Contains 12.5 wt. % Polymer)*
200 500 900 atm.
Wt.% of total polyethylene 0.01 0.30 7.50 retained in light phase
Wt. % of total ethylene 1.10 4.80 21.8 retained in heavy phase
MNin light phase 110 440 2600 (ethylene-free basis)
MN in heavy phase 13350 14350 19500 (ethylene-free basis)
*Molecular wt. distribution of the polymer feed is shown in Figure 15.
and on the other, refinements of scientific concepts and experimental instruments makes it ever more difficult for nonspecialists to understand the significance and implications of new scientific insights and discoveries. Historically, it is clear, however, that progress in developing better design tools can come only from a better appreciation of new scientific results, tempered by mature judgment but also propelled by daring initiative. The innovative elements of creative chemical engineering are numerous but, for efficient design of chemical plants, it is evident that molecular thermodynamics is often required to reduce them to practice.
ACKNOWLEDGMENT
The author is grateful to the 3M Company which sponsors the ASEE Chemica \ Engineering Division Lectureship and, for support of research, to the National Science Foun-
67

dation, the Environmental Protection Agency, the Donors of the Petroleum Research Fund administered by the American Chemical Society, Union Carbide Corporation and Gulf Oil Chemicals Company. O
NOTATION
3c = total number of external degrees of freedom per molecule
6 E vap = energy of isothermal vaporization from the saturated liquid to the ideal gas
f = fugacity H = Henry's constant for a gaseous solute in liquid
k k K
MN N Nr p p s P *
q R T T *
u
V
V
v V V* w(M)
v* X
y
ammonia = a proportionality constant (Figure 8) = Boltzmann's constant ( Figure 13) = distribution coefficient for a solute between water
and an organic liquid phase = a binary parameter characterizing deviation from
the geometric-mean assumption = number-average molecular weight = number of polymer molecules = number of polymer segments (or monomers) = total pressure = saturation (vapor) pressure = a characteristic molecular parameter having units
of pressure = a molecular size parameter = gas constant = absolute temperature = a characteristic molecular parameter having units
of temperature = attractive energy of one mole of solute molecules
at very high dilution in a liquid solvent = liquid molar volume (Figure 1) = volume per segment (Figure 13) = partial molar liquid volume = total volume (Figure 13) = characteristic (hard-core) volume, per mole = frequency of molecular weight M in molecular-
weight distribution = characteristic (hard-core ) volume per segment = liquid-phase mole fraction = vapor-phase mole fraction = relative volatility of benzene infinitely dilute in
hexane = solubility parameter = vapor-phase fugacity coefficient = activity coefficient (normalized such that y 1 • 1
asx 1 • 1) = activity coefficient (normalized such that -y1 * • 1
as x 1 • 0)
LITERATURE CITED
1. Funk, E. W. and J. M. Prausnitz, Ind. Eng. Chem. 62 8 (1970).
2. Lynn, S., C. G. Alesandrini and A. D. Sherman, IEC Proc. Des. & Devel.12 217 (1973).
3. Alesandr ini, C. G., S. Lynn and J. M. Prausnitz, IEC Proc. Des. & Devel.11 253 (1972).
4. Chueh, P. L . and J. M. Prausnitz, Ind. Eng. Chem. 60 34 (1968).
68
5. Lee, C. S., J. P. O'Connell, C. D. Myrat and J. M. Prausnitz, Can. J. Chem. 48 2993 ( 1970).
6. Lyckman, E. W., C. A. E ckert and J. M. Prausnitz, Chem. Eng. Sci. 20 685 (1965) .
7. Won, K. W. and J . M. Prausnitz, AIChE Journal 20 1187 (1974).
8. King, C. ,J ., J. P. Earhart, K. W. Won and J. M. Prausnitz, "Extra::tion of Chemical Pollutants from Industrial Wastewaters with Volatile Solvents", report submitted to the Environmental Protection Agency, Ada, Oklahoma (1975).
9. Bonner, D. C., D. P. Maloney and J. M. Prausnitz, IEC Proc. Des. & Devel. 13 91 (1974). Erratum 13 198 (1974).
10. Maloney, D. P . and J . M. Prausnitz, IEC P roc. Des. & Devel. J.5 216 (1976) and AIChE Journal 22 74 (1976) .
[ti N §I books received 7 The History of Qucintum Theory, Friedrich
Hand, translated by Gordon Reece. Published by Barnes and Noble, New York, 260 pages. This book provides a survey of the history of quantum theory for students and those who may not have much knowledge of quantum theory.
Elementary General Thermodynamics, M. V. Sussman. Published by Addison-Wesley Publishing Co., Reading, MA, 444 pages. This book presents a broad introduction to thermodynamic thought and methodology, and applications to many branches of engineering and science.
Process Engineering with Economic Objectiiie, G. L. Wells. Published by Halsted Press, div. of John Wiley & Sons, New York, 168 pages. This guide to process engineering with economic objective serves as an introduction and to integrate the fuller instruction available from specialist texts.
Professional Obsolescence, edited by S. S. Dubin. Published by Lexington Books, div. of D. C. Heath & Co., Lexington, MA, 121 pages. This book is a record of a symposium on combatting professional obsolescence held at Churchill College, Cambridge (1970) under auspices of the Scientific Affairs Office of NATO.
Physical Properties of Inorganic CompoundsSI Units, A. L. Horvath. Published by Crane, Russak & Co., New York, 466 pages. In this book the essential physical properties of thirty one elements, and compounds which are needed by design engineers are presented in graphical and tabular form.
Statistics for Technology, Christopher Chatfield. 1975 reprint of Halsted Press, div. of John Continued on page 75.
CHEMICAL ENGINEERING EDUCATION