molecular design of effective and versatile adsorbents for ... · final report 3. dates covered...
TRANSCRIPT

FINAL REPORT
Molecular Design of Effective and Versatile Adsorbents for Ex Situ Treatment of AFFF-Impacted Groundwater
ER 181417
April 5, 2019
Prepared by:
Carla Ng, Manoochehr Khazaee University of Pittsburgh
Jennifer Field, Emerson Christie Oregon State University
Mandy Michalsen U.S. Army Engineer Research Development Center

REPORT DOCUMENTATION PAGE Form Approved OMB No. 0704-0188
Public reporting burden for this collection of information is estimated to average 1 hour per response, including the time for reviewing instructions, searching existing data sources, gathering and maintaining the data needed, and completing and reviewing this collection of information. Send comments regarding this burden estimate or any other aspect of this collection of information, including suggestions for reducing this burden to Department of Defense, Washington Headquarters Services, Directorate for Information Operations and Reports (0704-0188), 1215 Jefferson Davis Highway, Suite 1204, Arlington, VA 22202-4302. Respondents should be aware that notwithstanding any other provision of law, no person shall be subject to any penalty for failing to comply with a collection of information if it does not display a currently valid OMB control number. PLEASE DO NOT RETURN YOUR FORM TO THE ABOVE ADDRESS. 1. REPORT DATE (DD-MM-YYYY)30-04-2019
2. REPORT TYPEFinal Report
3. DATES COVERED (From - To)Jan. 2018 -- May 2019
4. TITLE AND SUBTITLEMolecular Design of Effective and Versatile Adsorbents for Ex Situ Treatment of AFFF-Impacted Groundwater
5a. CONTRACT NUMBER
5b. GRANT NUMBER
5c. PROGRAM ELEMENT NUMBER
6. AUTHOR(S)Michalsen, M.; Field, J. A.; Christie, E.; Khazaee, M.; Ng, C.
5d. PROJECT NUMBER ER-181417 5e. TASK NUMBER
5f. WORK UNIT NUMBER
7. PERFORMING ORGANIZATION NAME(S) AND ADDRESS(ES)U.S. Army Engineer Research Development
8. PERFORMING ORGANIZATION REPORTNUMBER
3909 Halls Ferry Road Vicksburg, MS 39180
9. SPONSORING / MONITORING AGENCY NAME(S) ANDADDRESS(ES)
10. SPONSOR/MONITOR’S ACRONYM(S)
Strategic Environmental Research and Develo SERDP4800 Mark Center Drive, Suite 16F16Alexandria, VA 22350-3605 11. SPONSOR/MONITOR’S REPORT
NUMBER(S)
12. DISTRIBUTION / AVAILABILITY STATEMENTApproved for public release; distribution is unlimited.
13. SUPPLEMENTARY NOTES
14. ABSTRACTResults of this limited-scope project confirmed the potential of protein-based sorbents for per- and polyfluorinated alkyl substances (PFAS) remediation by identifying, through a complementary model-experiment approach, proteins that associate strongly with both long- and short-chain PFAS. Of particular benefit is the ability we identified to tune an adsorbent, by incorporating multiple protein-based moieties and/or by use of strategic changes in feed composition (ionic strength, pH), to address a wide variety of PFAS structures. The combination of molecular modeling and batch testing used here thus forms the basis of a robust and powerful design framework for developing protein-based sorbents for PFAS water treatment.
15. SUBJECT TERMSBioinspired sorbents, filter media, PFAS water treatment
16. SECURITY CLASSIFICATION OF:Unclassified Unlimited
17. LIMITATIONOF ABSTRACT
18. NUMBEROF PAGES
19a. NAME OF RESPONSIBLE PERSONMandy Michalsen
a. REPORT b. ABSTRACT c. THIS PAGE UU 31 19b. TELEPHONE NUMBER (include area code) 206-764-3324 Standard Form 298 (Rev. 8-98)
Prescribed by ANSI Std. Z39.18
ER18-1417

ii
TABLE OF CONTENTS
1.0 INTRODUCTION ......................................................................................................................... 1 1.1 OBJECTIVE .................................................................................................................... 1 1.2 BACKGROUND ............................................................................................................. 1
2.0 MATERIALS AND METHODS .................................................................................................. 3 2.1 CANDIDATE PROTEINS INDENTIFICATION AND SCREENING ......................... 3 2.2 MODELING PFAS-PROTEIN INTERACTIONS .......................................................... 3 2.3 SORPTION BATCH TESTING ...................................................................................... 4 2.4 ANALYTICAL METHODS ............................................................................................ 6 2.5 DATA ANALYSIS .......................................................................................................... 7
3.0 RESULTS AND DISCUSSION .................................................................................................... 9 3.1 PROTEIN SELECTION BY MOLECULAR DYNAMICS MODELING ..................... 9 3.2 SORPTION BATCH TESTING RESULTS .................................................................. 11 3.3 COMPARISON OF SORPTION PERFORMANCE .................................................... 19
4.0 CONCLUSIONS AND IMPLICATIONS FOR FUTURE RESEARCH ............................... 20 5.0 LITERATURE CITED ............................................................................................................... 21 6.0 SERDP FINAL LIMITED SCOPE REPORT ADDENDUM ................................................ 25
LIST OF TABLES
TABLE 1. SUMMARY OF 3-DIMENSIONAL STRUCTURE INFORMATION FOR SELECTED PROTEINS ........ 3 TABLE 2. THE PREDICTED BINDING AFFINITIES FOR DIFFERENT PROTEIN-LIGAND COMPLEXES) ...... 10 TABLE 3. MATRIX OF SELECTED PROTEIN-PFAS COMBINATIONS FOR BATCH ANALYSIS................ 11 TABLE 4. KD VALUES FOR ALL ANALYTES AND THEIR CORRESPONDING PROTEIN.. ......................... 12
LIST OF FIGURES
FIGURE 1. THE SCHEMATIC OF EQUILIBRIUM DIALYSIS EXPERIMENT ................................................. 5 FIGURE 2. DECISION TREE FOR INCLUSION OF IN-VIAL CONCENTRATIONS FOR THE REGRESSION ...... 7 FIGURE 3. DISTRIBUTION OF KD VALUES DIFFERENT FABP-PFAS COMPLEXES. ............................... 9 FIGURE 4. DISTRIBUTION OF KD VALUES FOR DIFFERENT PPAR-PFAS COMPLEXES. ...................... 10 FIGURE 5. BINDING CURVES FOR L-FABP. ....................................................................................... 13 FIGURE 6. BINDING CURVES FOR I-FABP ......................................................................................... 14 FIGURE 7. BINDING CURVES FOR PPAR-Α.. ...................................................................................... 14 FIGURE 8. BINDING CURVES FOR PPAR-Δ. ........................................................................................ 15 FIGURE 9. BINDING CURVES FOR PPAR-𝛾𝛾. ........................................................................................ 15 FIGURE 10. BINDING CURVE FOR PFOS AND LFABP, VARIED GEOCHEMISTRY. ............................. 16 FIGURE 11. BINDING CURVE FOR PFBS AND LFABP, VARIED GEOCHEMISTRY. ............................. 17 FIGURE 12. BINDING OF PFHXS TO LFABP AND PFNA TO I-FABP AT PH 4.6. ............................... 17 FIGURE 13. BINDING CURVES FOR PFOA WITH LFABP, VARIED TEMPERATURE. ............................ 18 FIGURE A1: AFFF-CONTAMINATED GROUNDWATER SAMPLE RESULTSERROR! BOOKMARK NOT DEFINED.

iii
LIST OF ACRONYMS 3D 3-dimentional AFFF Aqueous film-forming foam ΔG° Free energy of binding FA1 – FA7 Fatty acid binding site 1 through 7 (on serum albumin) GAC Granular activated carbon GPU Graphics processing unit H-FABP Heart fatty acid binding protein HSA Human serum albumin I-FABP Intestinal fatty acid binding protein ISCO In-situ chemical oxidation KA Equilibrium association constant KD Equilibrium dissociation constant LC-MS/MS Liquid chromatography tandem mass spectrometry L-FABP Liver fatty acid binding protein MD Molecular dynamics NAPL Non-aqueous-phase liquid OSU Oregon State University PDB Protein data bank PFAAs Perfluorinated alkyl acids PFAS Per- and polyfluorinated alkyl substances PFBA Perfluorobutanoic acid PFBS Perfluorobutane sulfonic acid PFHxA Perfluorohexanoic acid PFHxS Perfluorohexane sulfonic acid PFOA Perfluorooctanoic acid PFOS Perfluorooctane sulfonic acid PPAR Peroxisome proliferator-activated receptors TCE Trichloroethylene UP University of Pittsburgh

iv
ACKNOWLEDGEMENTS This report represents the results and conclusions from a collaborative effort between scientists and
engineers at U.S. Army Engineer Research Development Center, Oregon State University and University of Pittsburgh. This laboratory phase of the demonstration project was funded by the Strategic Environmental Research and Development Program (SERDP), with the goal of exploiting known per- and polyfluorinated alkyl substances (PFAS) interactions with proteins to develop novel bio-inspired sorbents for PFAS water treatment. The project team wishes to thank Dr. Andrea Leeson and the support staff from the SERDP program office for their help and guidance throughout this limited-scope project.

v
ABSTRACT
Objectives: Per- and polyfluorinated alkyl substances (PFAS) are a diverse group of chemicals that have been used as components of aqueous film-forming foam (AFFF) for decades. Early formulations used perfluorooctane sulfonate (PFOS) in large proportion. Unfortunately, long-chain PFAS like PFOS have since been found to be bioaccumulative and toxic, prompting voluntary phase-outs, a establishment of drinking water guidelines by the US EPA and many states, and the need to remediate contaminated water for the protection of environmental and human health. Areas where AFFF were routinely deployed during firefighting exercises, including DoD sites, have accumulated a variety of PFAS in their groundwater, and are now in need of cost effective and efficient remediation solutions. Many PFAS eventually degrade to form perfluorinated alkyl acids, which are extremely persistent and have varying levels of water solubility. Because of this, ex situ treatment technologies may be most suitable. However, currently available technologies such as adsorption with activated carbon cannot effectively treat both short- and long-chain PFAS. The objective of this limited-scope project was to exploit the propensity of PFAS to bind with proteins, and using a combination of molecular modeling and batch testing, verify whether PFAS-protein interactions could be tuned to efficiently adsorb a variety of PFAS, opening a pathway to development of bio-based PFAS sorbents for treatment of AFFF-contaminated water.
Technical Approach: First, candidate protein sorbents were identified from existing literature based on interactions with PFAS and with analogous ligands such as fatty acids and acidic drugs. Protein-specific binding affinities for a set of 8 selected perfluorinated alkyl acids— PFOS, PFNA, PFOA PFHxS, PFHxA, PFHpA, PFBS, and PFBA—were predicted using a multi-step molecular modeling framework. Finally, the most promising proteins—liver and intestinal fatty acid binding proteins, L-FABP and I-FABP, and the peroxisome-proliferator-activated receptors, PPAR-α, -𝛾𝛾, and -δ—were experimentally evaluated for PFAS adsorption through a series of batch tests at the bench scale to determine the equilibrium dissociation constant, KD, and the equilibrium binding capcity, qmax. EqD experiments were performed under ideal matrix conditions with single PFAS-protein pairs, under varied pH, ionic strength and temperature conditions, as well under “realistic” conditions using AFFF-contaminated groundwater and single proteins.
Results: The binding of PFAS to different proteins was found to be variable, and both chain length and condition-specific, suggesting the ability to tune PFAS removal by the use of different proteins alone or in combination. Interestingly, the nuclear receptor PPAR-δ was found to bind strongly with both PFBA and PFHxS, while PPAR-α bound strongly to PFHxA (as well as the long-chain PFNA). This is the first report to show such a strong association of biomolecules with short-chain PFAS, raising both prospects for treatability and potential concern about toxic effects. Moreover, the binding capacities we calculated from protein-PFAS data for some short-chain PFAS were substantially higher than with either granular or particulate activated carbon, illustrating the potential of our approach for targeting difficult to treat PFAS. We found that low pH appeared to enhance sorption, leading to strong binding between L-FABP and both PFBS and PFOS, as well as for I-FABP and PFNA, while high pH prevented protein-PFAS binding. Testing at low ionic strength (closer to groundwater conditions) showed enhanced binding for PFOS and PFBS. We tested whether temperature could be used to release PFAS from binding and thus as a regeneration mechanism, but found under the condition tested (heating to 50°C) the binding capacity of L-FABP could not be recovered. However, based on our other testing conditions and other’s published work, we believe that ionic strength, pH and lower-temperature heating may be useful mechanisms to control binding and act as a regeneration mechanism.
Benefits: Results of this limited-scope project confirmed the potential of protein-based sorbents for PFAS remediation by identifying, through a complementary model-experiment approach, proteins that associate strongly with both long- and short-chain PFAS. Of particular benefit is the ability we identified to tune an adsorbent, by incorporating multiple protein-based moieties and/or by use of strategic changes in feed composition (ionic strength, pH), to address a wide variety of PFAS structures. The combination of molecular modeling and batch testing used here thus forms the basis of a robust and powerful design framework for remediation technology.

1
1.0 INTRODUCTION
1.1 OBJECTIVE
Per- and polyfluorinated alkyl substances (PFAS) are widely used in a variety of industrial and consumer applications due to their superior surfactant properties and high stability. These properties make them ideal stain and water repellents, processing fluids, and firefighting agents [1]. Unfortunately, it is now recognized that these same properties make some PFAS, and in particular the long-chain perfluorinated alkyl acids (PFAAs), persistent, bioaccumulative, and toxic environmental contaminants [2]. One of the most surprising properties of long-chain PFAS is their high bioaccumulation potential, which appears to be driven in large part by their strong binding to proteins such as serum albumin and liver fatty acid binding protein[3-5]. The overall goal of this project was to evaluate whether and how the protein-binding propensity of PFAS might be exploited to design versatile adsorbents effective for a wide variety of AFFF-associated groundwater contaminants, thus leading to development of bio-based PFAS sorbents for treatment of AFFF-contaminated water.
1.2 BACKGROUND
The adoption and wide use of Aqueous Film-Forming Foams (AFFF) at military sites and airports as effective firefighting foams against hydrocarbon-fueled fires has resulted in persistent and widespread groundwater contamination[6-8]. AFFF is a complex mixture containing a high percentage (g/L) of PFAS[9, 10] including perfluorooctane sulfonate (PFOS) and to a lesser extent, perfluorooctanoic acid (PFOA)[9], long-chain perfluoroalkyl acids (PFAAs) that have been identified as persistent, bioaccumulative and toxic, and are thus being phased out. Other polyfluorinated constituents in AFFF can degrade to form PFOS, PFOA and shorter-chain perfluorinated carboxylic and sulfonic acids[7, 11]. Because these perfluorinated acids are essentially perfectly persistent—there is no known natural route of abiotic or biotic mineralization—contaminated sites will require treatment in order to meet federal and state guidelines for water quality. In cases where impacted sites can affect drinking water [11], limits can be strict [12, 13], challenging the ability of currently available technologies.
Previous SERDP-funded research into in situ treatment technologies has confirmed that perfluorinated
acids are highly resistant to degradation [7, 14]. Oxidation of AFFF components, which may occur for example during in situ chemical oxidation (ISCO) of co-contaminants such as chlorinated solvents, leads to formation of PFAAs from precursor compounds and may result in increased mobilization of contamination, as the precursors can be more tightly sorbed to solids than the acids[6, 15]. Removal by adsorption, on the other hand, can be effective, particularly for long-chain PFAS [16-18]. Thus, ex situ removal of PFAS from AFFF-impacted groundwater using “pump and treat” technologies may represent both a more cost effective and safer route to site remediation. Granular activated carbon (GAC) is a particularly attractive option for ex situ treatment. It effectively removes PFOA and PFOS using relatively low-cost material [19] and can be regenerated. Although regeneration can be an energy- and thus cost-intensive process, it also provides a means to completely mineralize PFAS through thermal decomposition [16, 17] and thus is both a removal and destruction technology. Another major limitation of GAC is that adsorption efficiency drops precipitously for short-chain PFAS. Other removal approaches (e.g. membrane-based approaches) generate a waste stream that then requires further treatment or storage. Thus alternative, more cost-effective and sustainable treatment media is desired.
This limited-scope project exploited one of the features that makes PFAS environmentally
problematic—their ability to bind to proteins—to design more effective and versatile adsorbents that can be used as a polishing step as part of a GAC-based treatment train. Long-chain PFAAs are highly bioaccumulative and in organisms are found in highest concentrations in the blood plasma and liver [20-22]. Within these biological compartments, they are highly bound to proteins, as evidenced by both
2
biological samples and targeted in vitro studies [4, 5, 23-27]. This high bioaccumulation potential, which has implications for organ-specific toxicity, has prompted a search for replacement chemicals with reduced protein affinity. Strong PFAS interactions with biological macromolecules were used in this project to guide testing of bio-based PFAS adsorbents, specifically targeting those AFFF-associated contaminants that are poorly treated using traditional approaches.
Our central hypothesis was that by incorporating bio-inspired molecular interactions into the design of
adsorbents, key limitations of traditional materials like GAC, such as lack of capacity to bind short-chain PFAS, may be overcome. Three technical objectives were identified to test this hypothesis: (1) identify candidate proteins based on reported interactions with PFAS and/or fatty acids; (2) use molecular modeling to simulate protein – PFAS interactions and rank identified proteins by their interaction strength with a suite of AFFF-associated PFAS; and (3) batch test the most promising PFAS – protein pairs to evaluate their effectiveness as models for ex situ adsorbents, taking into account the presence of common co-contaminants present in an actual AFFF-contaminated groundwater sample.

3
2.0 MATERIALS AND METHODS
2.1 CANDIDATE PROTEINS INDENTIFICATION AND SCREENING
Proteins and Ligands. We initially selected a suite of proteins for model-based screening based on their known interactions with lipids and/or fatty acids, due to the similarity between PFAS and these endogenous ligands. This included the mammalian proteins we eventually retained for batch testing (further discussed below), as well as several non-mammalian proteins such as plant lipid binding protein and microbial fatty acid biding proteins. The binding affinity between all proteins and our suite of PFAS was then estimated using the molecular dynamics (MD) workflow developed by Cheng & Ng [28]. This method is briefly described below with details provided for the final candidate proteins.
The 3-dimensional (3D) crystal structure for each protein was obtained from the Protein Data Bank
(PDB, http://www.rcsb.org): for L-FABP (PDB code: 3STM [29]), I-FABP (PDB code: 3AKM [30]), PPAR-α (PDB code: 4CI4 [31]), PPAR-𝛾𝛾 (PDB code: 3U9Q [32]), and PPAR-δ (PDB code: 3TKM [33]). The detailed information on those structures is listed in Table 1. These 3D structures were selected because of their high resolution and the completeness of key residues that could be important to the protein binding sites. For the 9 PFAS ligands, 3D structures were either extracted from PDB (if available) or constructed from scratch using the Avogadro molecular editor [34], as described in our previous work [28].
Table 1. Summary of 3-dimensional structure information for selected proteins Protein PDB Code Resolution Chain Length Known Ligands L-FABP 3STM 2.22 Å 132 palmitic acid I-FABP 3AKM 1.9 Å 131 11-(Dansylamino)undecanoic acid PPAR-α 4CI4 2.3 Å 274 propanoic acid PPAR-𝛾𝛾 3U9Q 1.5 Å 269 decanoic acid PPAR-δ 3TKM 1.95 Å 275 GW0742
2.2 MODELING PFAS-PROTEIN INTERACTIONS
Molecular Dynamics Workflow. We previously developed the MD workflow that takes 3D structures of proteins and ligands as inputs, and outputs the estimated protein binding affinities (quantified by the free energy of binding) for those ligands. Briefly, the workflow consists of three major steps: molecular docking, MD simulation, and molecular mechanics combined with Poisson-Boltzmann surface area (MM-PBSA) energy calculation [28]. First, Autodock Vina [35] was employed to predict initial structures of bound complexes from the 3D structures of PFASs and proteins. The docking experiments generated the binding modes and free energies for each PFAS-protein complex. The 3 binding modes with lowest energies were then selected as initial structures for MD simulations. Next, the MD simulations for those complex structures were performed with the Amber 14 suite [36]. The whole complex system was explicitly solvated in a cubic box of TIP3P water molecules (Transferable Intermolecular Potential 3 Point or TIP3P), and Na+ or Cl- counterions were added to neutralize the system as in our previous study [28]. To mimic the actual experimental conditions, the simulation system included the following procedures:
• The solvent molecules were subjected to 3500 cycles of energy minimization; • The system was heated with constant volume for 20 ps from 0 K to 300 K; • The density of the system was adjusted to 1 g/cm3 at constant pressure (1 bar) for 100 ps; • The system was equilibrated with constant pressure (1 bar) and temperature (300 K) for 2 ns; and

4
• The system was run with constant pressure (1 bar) and temperature (300 K) for 24 ns (production phase).
Finally, the MM-PBSA method [37] was used to calculate ΔGbind as follows:
𝛥𝛥𝛥𝛥𝑏𝑏𝑏𝑏𝑏𝑏𝑏𝑏 = 𝛥𝛥𝐶𝐶𝐶𝐶𝐶𝐶𝐶𝐶𝐶𝐶𝐶𝐶𝐶𝐶 − 𝛥𝛥𝑃𝑃𝑃𝑃𝐶𝐶𝑃𝑃𝐶𝐶𝑏𝑏𝑏𝑏 − 𝛥𝛥𝑃𝑃𝑃𝑃𝑃𝑃𝑃𝑃
where GComplex, GProtein, and GPFAS are the free energies of complex, proteins, and PFAS ligands, respectively. The free energy (G) of each state was estimated from the following sum:
𝛥𝛥 = < 𝐸𝐸𝑏𝑏𝐶𝐶𝑏𝑏𝑏𝑏 + 𝐸𝐸𝐶𝐶𝐶𝐶 + 𝐸𝐸𝑣𝑣𝑏𝑏𝑣𝑣 + 𝛥𝛥𝐶𝐶𝐶𝐶𝐶𝐶𝑝𝑝𝑃𝑃 + 𝛥𝛥𝑏𝑏𝐶𝐶𝑏𝑏𝐶𝐶 − 𝑇𝑇𝑇𝑇 >
where the brackets indicate an average over MD trajectories. Inside the brackets, the first three terms are molecular mechanical energy terms for bonding, electrostatic and van der Waals (vdw) interactions, respectively. Gpolar and Gnonp are the polar solvation free energy and the nonpolar contribution, respectively. The last term is the absolute temperature (T) multiplied by the entropy (S). All those energy terms were calculated based on the trajectories using the MMPBSA.py program in Amber 14. The calculated ΔGbind values were translated into equilibrium dissociation constants (KD, with units of μM) using the following equation [38, 39]:
ΔGbind = RTlnKDC0
where R is the gas constant (1.987 cal K-1 mol-1), T is temperature (which is assumed to be 300 K), and C0
is the standard state concentration (1 M). All simulations were carried out by the GPU accelerated pmemd module on an AMBER GPU Certified MD workstation (Exxact Corporation, CA). The trajectories generated from the production phase (which contains coordinates and velocity information of the molecular system) were used to estimate the free energy of binding (ΔGbind) for each PFAS-protein pair.
2.3 SORPTION BATCH TESTING
Sorption Batch Testing Materials. Linear PFOS, PFBS, PFHxS, PFOA, PFBA, PFNA, PFHxA, and PFHpA (all > 98%) were purchased from Wellington Laboratories (Guelph, Ontario, Canada). L-FABP, I-FABP, PPAR-𝛾𝛾, PPAR-δ, and PPAR-α proteins were obtained from Novus Biologicals (Littleton, CO, USA). Slide-A-Lyzer mini dialysis devices (10K MWCO, 0.1 mL) were purchased from Thermo Scientific. Solvents and other reagents were of analytical grade. All buffers were prepared from 10X phosphate buffered saline (PBS) stock from GIBCO Invitrogen (Grand Island, USA).
Single PFAS-Protein Pairs, Standard Conditions. PFAS-protein binding affinities were evaluated by
the equilibrium dialysis (EqD) method, and the impact of pH, ionic strength (IS), and temperature on these affinities were further investigated for a subset of PFAS-protein pairs. EqD experiments were prepared over a range of ligand:protein mole ratios (0.05, 0.1, 0.5, 1, and 5). For all PFAS, 10 µM stock solutions were prepared by dissolving each chemical in 1X PBS buffer (pH 7.4). Stock solutions of different proteins were prepared fresh daily in PBS. A concentration of 1 μM for L-FABP, I-FABP, and PPAR-𝛾𝛾 and a concentration of 0.48 μM for PPAR-δ and PPAR-α were used in these experiments. Specific PFAS and protein concentrations were selected to achieve a 1:1 PFAS:protein molar ratio at the midpoint of the range of selected PFAS concentrations. Protein concentrations in prepared solutions were verified using Qubit Protein assay kit (Thermo Fisher, Waltham, MA, USA).

5
EqD experiments performed under standard conditions (room temperature, 1X PBS buffer, neutral pH) were performed by first adding 1.2 mL of 1X PBS buffer (pH:7.4) spiked with PFAS to a 1.5 ml tube (Figure 1). Then, a slide-a-lyzer mini dialysis cup was inserted into the tube. PFAS could pass freely through the semi-permeable membrane of the dialysis cup, which was impermeable to the proteins used (MW range 15.1 – 54.1 kDa). A known volume of proteins (between 20 to 50 μL) was added to the cup to reach a 1 μM concentration for LFABP, IFABP, and PPAR-𝛾𝛾, and 0.48 μM for PPAR-δ and PPAR-α (due to the larger size of these proteins). Finally, the total volume of the cup was brought to 100 μL by adding the buffer spiked with PFAS (Figure 1). Blanks were prepared using a protein solution with no PFAS. Furthermore, non-binding controls (containing PFAS but no protein) were prepared with the buffer spiked with different concentrations of PFAS. Finally, samples were placed on a rocker (Open-Air Rocker, Fisher Scientific, Waltham, MA, USA) for 36 hours to reach equilibrium. EqD tests were performed in duplicate.
Figure 1. The schematic of equilibrium dialysis experiment
Single PFAS-Protein Pairs, Varied Geochemistry. To evaluate the impact of pH on protein binding,
1X PBS buffer solutions at low and high pH values (4.6 and 10.4, respectively) were prepared to compare with results under standard conditions (pH=7.4). Concentrated solutions of hydrochloric acid or sodium hydroxide were used to adjust pH and monitored using a pH meter. In a separate set of EqD experiments, the IS was varied from <1 μM (using deionized water) to 650.8 mM (using 4X PBS buffer[40]), and to compare with the IS of the standard experiment, 162.7 mM (the 1X PBS buffer).
Single Protein, AFFF-Contaminated Groundwater. To assess protein and PFAS binding affinities in
a complex matrix, AFFF-contaminated groundwater was diluted into 1X PBS buffer solutions at molar ratios similar to those described above. The AFFF-contaminated groundwater was previously characterized for PFAS constituents in the Field lab, and the highest concentration constituent, PFOA, was used as the basis for molar dilutions. Experiments were performed as described in the EqD “standard conditions” section using proteins L-FABP and PPAR-α and using AFFF-contaminated groundwater instead of single PFAS solution prepared in buffer.
Protein Sorbent Regeneration. In order to determine the impact of temperature on PFAS-protein
binding, three separate EqD experiments were conducted. The first, “standard conditions” experiments were prepared as previously described without heat treatment (hereafter referred to as T1). In the second, L-FABP was pre-treated by heat before before use in the EqD experiment. The protein was placed in a water bath (IsoTemp 210 Water Bath, Fisher Scientific, USA) and the temperature was raised to 50 °C (in increments of 2 °C per min), and maintained for 10 min at 50 °C. Proteins were cooled to room temperature prior to use in the EqD heat treated experiments. In the last treatment, samples were dialyzed as for the standard experiment, and after equilibration dialysis tubes were placed into the water bath and heat treated to 50°C as described above. In this way we evaluated whether previously heat-treated proteins could effectively bind PFAS (2nd treatment, T2) and whether heat treatment could be used to release bound proteins (3rd treatment, T3).

6
2.4 ANALYTICAL METHODS
Material Extractions. Dialysis filters and vials were extracted according to Robel et. al. unpublished. Briefly, items were cut into 4.0 ± 0.5 cm2 pieces with methanol rinsed scissors and massed to ensure a representative sample. Materials were extracted by submerging with 3.3 mL of heated methanol (60−65°C), shaking on a wrist-action shaker for 10 minutes, centrifuging at 2808 g for 10 minutes, then collecting the supernatant was in a secondary centrifuge tube. This process was repeated two additional times with each round’s supernatant collected in the same secondary tube, yielding a theoretical 9.9 mL of extract. Extracts were brought to a final volume of 10 mL with additional methanol. In order to assess sorption to the dialysis filters and vials, a spike and recovery experiment was performed. Filters and vials were equilibrated on a shaker for 24 hours with 1.5 mL of 500 ng/L of native PFAS analytes in water. The spiked water was removed and extracted utilizing the micro liquid-liquid extraction technique described by Backe et. al. [9].
Sample Preparation. Material extracts were prepared for analysis as follows: 1) 60 μL aliquots of
extract were placed in 1.5 mL HDPE autosampler vials, 2) each vial was spiked with 0.72 ng of all isotopically labeled standards, 3) vials were diluted with methanol to a final volume of 1.2 mL. Analysis by LC-MS/MS. All dialysate samples were prepared via direct injection or dilution into solvents compatible with the mechanism of their corresponding chromatography method (described below), methanol for ion exchange and water for ionic strength. Dilutions for each sample were established using the dilution equation ([C]1 x V1= [C]2 x V2) based upon the known theoretical maximum concentration of the sample, which would be the concentration spiked into the dialysate prior to exposure to protein, the known final volume, and the known desired final theoretical concentration. For all samples, dilutions resulted in final theoretical concentrations that ranged between 100 –2,000 ng/L. All samples were spiked with isotopically labeled internal standard for quantification.
LC MS/MS. For samples that are known to be of high concentration for a small number of PFAS
analytes, a rapid large-volume injection LC MS/MS method is recommended to minimize sample preparation and analysis time. Two methods are described herein that utilize different retention mechanisms, the first is ion exchange and the second is ionic strength. Ion exchange was the shorter of the two methods (6 minutes per sample), which utilized methanol as the sample solvent, and was used prior to the discovery that PFBS and PFBA results for low concentrations (<500 ng/L) were inconclusive due to the 1X PBS matrix. Upon the discovering the issue with PFBS and PFBA samples, a new method utilizing ionic strength was developed to eliminate the competitive binding between the 1X PBS matrix and PFBS and PFBA. The ionic strength method (10 minutes per sample) permitted quantification of all the target analytes.
For ion exchange: a modified Agilent 1100 series HPLC (Santa Clara, CA) was used for large volume
(900 μL) injection of samples. In order to remove instrumental contamination of PFAS (e.g. internal component sources of PFAS) a 4.6 x 12.5mm x 5μm Zorbax Strong Anion Exchange (SAX) guard column was used between the LC pump and autosampler. Two 4.6 × 12.5 mm × 1.8 μm Zorbax zirconium diol guard columns were used in series with a Zorbax Eclipse XDB C18 4.6 × 12.5 mm × 5 μm to retain and focus analytes upon elution. Mobile phases were 3% HPLC grade methanol in HPLC grade water (A) and 10mM ammonium acetate in HPLC grade methanol (B). Analytes were loaded onto and eluted off guard columns by pumping mobile phase A at 1 mL/min for 1.2 minutes, switching to mobile phase B at 1 mL/min for 1.8 minutes, and reverting to A for 3.0 minutes; yielding a total six-minute run time per sample.
For ionic strength: the same modified HPLC described above was used, however, instrumental
contamination was removed via a C18 delay column (4.6x 50mm x 5μm Zorbax Eclipse) instead of the SAX guard column. A C18 analytical column (Eclipse 4.6x 100mm x 3.5μm) was used for the retention of analytes. Mobile phases were 20mM ammonium acetate in HPLC grade water (A) and 10mM ammonium acetate in HPLC grade methanol (B). Analytes were loaded onto and eluted off the analytical column by

7
pumping mobile phase A at 0.5 mL/min for 3.5 minutes, switching to mobile phase B at 1 mL/min for 1.5 minutes, and reverting back to A at 1.0 mL/min for 4.5minutes and 0.5 mL/min for the remaining 0.5 minutes; yielding a total ten minute run time per sample.
Identification and quantification of analytes have been previously described in Allred et. al.[41]. As
separation among analytes was limited due to time compression the analyte list was restricted to ensure adequate points per peak (<10 analytes). Each analytical sequence consisted of solvent and, when necessary, extraction process blanks that were spiked with 0.72 ng of isotopically labeled standards; all blanks gave responses that fell below the limit of quantification. The analytical sequence consisted of a minimum 5-point calibration curve over the range of 20 -10,000 ng/L for all analytes. Accuracy was determined from the analysis of a second source of standards and ranged from 70–130%. Whole method precision, as indicated by relative standard deviation, was calculated from four replicate samples and ranged from 4-18%. The limit of detection (LOD, 15 – 30 ng/L) was calculated by normalized-weighted regression (1/X), from which the limit of quantification (LOQ, 50 –100 ng/L) was calculated as 3.3 x the LOD [9].
2.5 DATA ANALYSIS
Chromatographic peaks were integrated with software (MassLynx 4.1) to provide PFAS concentrations in ng/L for all analytes of interest in all samples. These concentrations were then back-calculated to their original, in-vial concentrations based on the dilution factor determined during sample preparation utilizing the dilution equation. Binding coefficients were calculated from the difference in total PFAS (non-binding control or theoretical values) and in-vial concentrations on a molar ratio basis between the PFAS and protein. As some in-vial concentrations resulted in an erroneous negative binding coefficient when subtracted from the experimental spike, a decision tree was created to determine if a theoretical value should be substituted or if the value should be excluded, Figure 2.
Figure 2. Decision tree for inclusion of in-vial concentrations for the regression analysis. In the event that a negative binding coefficient value was determined, the value was recalculated using the theoretical concentration Data for all EqD experiments were analyzed by nonlinear regression using GraphPad Prism V8.0
(GraphPad software, San Diego, CA, USA) to develop plots and determine binding coefficient KD values. Single-site binding was assumed for all proteins.Combined percent uncertainty binding coefficients were calculated by combining replicate percent uncertainty and analysis relative standard deviation (RSD) as follows: 1) standard deviation of the replicate samples was calculated; 2) standard deviation was converted to a percent uncertainty by dividing the standard deviation by the mean of the replicates; 3) percent uncertainty and RSD were raised to the second power and then summed; 4) the square root of the sum of the squared uncertainties was taken resulting in the combined percent uncertainty for a given PFAS-protein binding coefficient (KD).

8
The mass of PFAS bound to each protein sorbent (q) was calculated using the equation below:
𝑞𝑞 =𝑉𝑉(𝐶𝐶𝑏𝑏 − 𝐶𝐶𝐶𝐶)
𝑀𝑀𝐶𝐶𝑃𝑃
where V represents the total sample volume; Ci and Ce represent the initial and final equilibrium unbound concentration of PFAS in the sample, respectively; and Mpr represents the mass of protein in the sample. The sorption capacity of each protein (qmax) was computed for each protein using EqD batch test data and the following equation:
𝑞𝑞 = 𝑞𝑞𝐶𝐶𝑝𝑝𝐶𝐶𝐶𝐶𝐶𝐶
𝐾𝐾𝐷𝐷 + 𝐶𝐶𝐶𝐶
where q represents the mass of PFAS bound to each protein sorbent; KD represents the binding coefficient specific to each PFAS-protein pair; and Ce represents the final equilibrium unbound concentration of PFAS in the sample associated with a particular batch test. The qmax value takes into account not only the (molar) capacity and affinity but also the molecular weight of the different proteins.

9
3.0 RESULTS AND DISCUSSION
3.1 PROTEIN SELECTION BY MOLECULAR DYNAMICS MODELING
We used our molecular dynamics approach to predict binding affinities as equilibrium dissociation constants (KD values) for a suite of perfluorinated carboxylates and sulfonates. In Figure 3, we show the results for the proteins that displayed strong binding for at least one PFAS, indicating it could be a suitable candidate for batch testing. In each panel, the PFAS indicated in red showed substantially stronger binding than other carboxylates or sulfonates. Based on these results, we developed a matrix of protein-PFAS combinations to be further investigated using EqD batch tests, which included one PFAS with predicted strong binding as well as one with a different chain length (i.e., a long-chain PFAS if the predicted binder was short-chain and vice versa) to serve as a comparison.
Figure 3. Distribution of KD values (geometric mean ±1 standard error) for different FABP-PFAS complexes. For L-FABP, predicted binding affinities were generally consistent with observations by other authors
(e.g. Zhang et al. [27]) except for PFHxA, which appeared to be an outlier among the carboxylates. For the sulfonates, PFOS showed the strongest binding by far (Figure 3, top). We thus selected PFHxA and PFOS for batch testing with L-FABP, and also included PFOA and PFHxS to compare the effect of head groups, as well as PFBS due to reasonably strong predicted binding (compared to the carboxylates). For I-FABP, binding was strongest for PFHpA and PFNA among the carboxylates and for PFHxS for the sulfonates (Figure 3, bottom). Given the relatively lower binding of PFHxS, we retained both PFHpA and PFNA for testing.
For the three PPARs modeled, interesting results were found for α and δ with short-chain PFAS. PPAR-
α (Figure 4, top) was predicted to bind most strongly with PFBA and PFBS (though with high variability among tested binding poses for the latter), while PPAR-δ (Figure 4, bottom) was predicted to bind strongly with PFPA and PFBS. In order to focus on those PFAS more likely to be in groundwater and to compare long- and short-chain performance, we focused our batch tests on PFBA, PFHxA, PFHpA and PFNA for PPAR-α and on PFBA, PFBS, PFHxS and PFOS for PPAR-δ. For PPAR-𝛾𝛾 (Figure 4, middle), interaction with PFOA has been noted in the literature. Our model results indicated strongest interactions of PPAR-𝛾𝛾

10
with PFOS and PFNA; we chose to investigate the effect of head group by including PFOS and PFOA in batch testing.
Figure 4. Distribution of KD values (geometric mean ±1 standard error) for different PPAR-PFAS complexes. Numeric values of KD predicted by molecular dynamics are compiled in Table 2 for ease of comparison
with results of EqD batch tests that follow. It is worth noting that MD is suitable for predicting relative binding [28] (that is, order of affinity for different PFAS) but not expected to provide reliable absolute values. Thus, we can estimate which among a range of PFAS will have the highest affinity for a protein.
Table 2. The geometric mean of the predicted binding affinities for different protein-ligand complexes (all values have units of μM ± standard error)
LigandPFBA 1.9E+01 ± 1.8E+00 2.5E+02 ± 6.3E+00 1.1E-01 ± 1.7E+01 9.5E+01 ± 5.4E+00 6.3E+02 ± 2.9E+01PFPA 2.5E+04 ± 1.5E+01 8.0E-01 ± 2.1E+01 6.8E+04 ± 5.2E+01 2.9E+01 ± 1.4E+01 8.9E-01 ± 2.2E+01
PFHxA 3.3E-06 ± 6.0E+00 1.6E-01 ± 3.7E+01 2.6E+06 ± 6.3E+00 7.4E+02 ± 8.5E+00 4.4E+02 ± 3.0E+01PFHpA 1.9E+02 ± 5.3E+00 1.5E-02 ± 1.1E+01 3.2E+04 ± 1.1E+01 1.6E+02 ± 3.4E+01 4.8E+05 ± 2.7E+00PFOA 1.5E+00 ± 3.0E+00 3.8E+00 ± 1.8E+01 2.9E+05 ± 5.3E+00 1.6E+01 ± 8.0E+01 2.5E+01 ± 2.1E+02PFNA 3.9E-04 ± 1.8E+01 2.9E-02 ± 2.4E+01 3.6E+03 ± 3.0E+00 1.4E-01 ± 5.6E+00 6.2E+05 ± 2.5E+00PFBS 1.8E+00 ± 2.3E+01 2.5E+02 ± 2.3E+00 2.0E+00 ± 1.9E+02 1.8E+03 ± 7.3E+00 2.2E-03 ± 7.1E+00PFHxS 1.7E-02 ± 4.6E+00 2.6E+02 ± 1.1E+01 1.2E+03 ± 1.8E+00 7.3E+01 ± 8.9E+00 5.5E+00 ± 3.2E+01PFOS 6.4E-05 ± 6.4E+00 2.2E+03 ± 6.5E+00 1.7E+01 ± 8.2E+00 2.5E-05 ± 4.3E+00 1.4E+04 ± 2.3E+00
PPAR-γ PPAR-δLFABP IFABP PPAR-α

11
Based on model results and consideration of relevant conditions and PFAS comparisons (chain length, head group) we developed a final matrix of PFAS-protein combinations for batch testing (Table 3).
Table 3. Matrix of Selected Protein-PFAS combinations for batch analysis. PFAS L-FABP I-FABP PPAR-α PPAR-δ PPAR-𝛾𝛾 PFBA X X
PFHxA X X PFHpA X X PFOA X X PFNA X X PFBS X X
PFHxS X X PFOS X X X
3.2 SORPTION BATCH TESTING RESULTS
QA - Material blanks. Material extraction analyses found no detectable concentrations of PFAS within the dialysis cups or the dialysis tubes. Additionally, spiked water and equilibration experiments (24 hour shake test) resulted in the recovery of PFAS analytes within the water, which indicated there was no level of considerable sorption of PFAS onto the dialysis cups or tubes. All other materials used in the processes have previously been verified to be clean of PFAS.
KD Results. Results of EqD batch experiments are summarized in Table 4 for the protein-PFAS
combinations tested. All selected pairs were tested under “standard conditions” (pH= 7.4 and ionic strength=163 mM, the latter of which is set by the concentration and composition of the PBS buffer used for protein experiments). We also tested PFBS and PFOS as model long- and short-chain PFAS for different pH and ionic strength conditions and included PFNA in the low pH test to gauge differences in the behavior of different ionic head groups. Finally, we selected PFOA for testing temperature as a means to release PFAS and regenerate the protein.

12
Table 4. KD values for all analytes and their corresponding protein. “ND” indicates no binding was detected. All values have units of μM ± SE.
Single PFAS-Protein Pairs, Standard Conditions. In the figures that follow, we show the detailed
results of the EqD experiments in terms of the non-linear fits to the binding data that are used to generate KD values. Note that all figure titles adhere to the following naming conventions.
• NE – Indicates an experiment with pH = 7.4 and ionic strength = 162.7 mM • LpH – Indicates an experiment with a pH = 4.6 • HpH – Indicates an experiment with a pH = 10.4 • HIS – Indicates an experiment with ionic strength = 650.8 mM • LIS – Indicates an experiment with ionic strength < 1 μM • T – Indicates an experiment where temperature was varied
pH=7.4, IS=163mM pH=4.6 pH=10.4 < 1 μM 651 mM T1 T2 T3PFOS 0.180 ± 0.032 0.014 ± 0.005 ND 0.200 ± 0.035 0.003 ± 0.015 -- -- --PFBS ND 0.057 ± 0.002 ND 0.055 ± 0.004 0.46 ± 0.52 -- -- --PFOA 0.099 ± 0.095 -- -- -- -- 0.018 ± 0.052 ND NDPFHxS 1.70 ± 0.031 ND -- -- -- -- -- --PFHxA ND -- -- -- -- -- -- --PFNA ND 0.014 ± 0.008 --PFHpA ND -- --PFOA 0.057 ± 0.027PFOS 8.5 ± 0.46PFOS 0.690 ± 0.330PFHxS 0.035 ± 0.002PFBS NDPFBA 0.044 ± 0.013PFNA 0.083 ± 0.028PFHxA 0.098 ± 0.070PFBA NDPFHpA ND
"--" not tested
L-FABP
I-FABP
PPAR-𝛾𝛾
PPAR-δ
PPAR-α
Protein PFASStandard Conditions Varied pH Varied Ionic Strength Temperature Treatment

13
Liver fatty acid binding protein (L-FABP). EqD-determined binding coefficients for L-FABP and PFOA (KD = 0.099 +- 0.095 μM), PFOS (KD = 2.099 +- 0.351 μM), PFHxS (KD = 1.695 +- 0.031 μM), and PFBS (KD = ND) were similar to previously published values of 3.1-52.6 μM, 18.5 μM, 85.7 μM, and 1034 μM, respectively [27]. No binding was observed for PFHxA, also in agreement with previously published results [27]. Model-predicted KD values for PFOS, PFHxS, PFBS, and PFHxA were lower than experimentally derived KD values; in contrast, the model-predicted KD value for PFOA was higher than the experimentally-derived KD value (Figure 5).
Figure 5. Binding curves for L-FABP.

14
I-FABP. Previously reported experimental data for PFAS binding to I-FABP does not exist (Figure 6).
In this case, experimental results did not agree with MD results, as the model indicated PFNA and PFHpA to have strong binding to I-FABP and our EqD results showed no binding.
Figure 6. Binding curves for I-FABP
PPAR–α. Previously reported experimental data for PFAS binding to PPAR-α are sparse. Ishibashi et.
al. [42] found that PFNA and PFHxA bound to PPAR-α while PFBA did not, with PFNA showing stronger binding that PFHxA, which agrees with our results. Our results showed stronger binding for PFNA and PFHxA than the model had predicted and no binding for PFBA, whereas the model predicted the strongest binding for PFBA among the PFAS tested (Figure 7).
Figure 7. Binding curves for PPAR-α. The negative result for PFHpA indicates no KD could be ascertained from these data. PFHpA may have been lost from the system due to non-specific interactions that were not due to the protein or there was a problem with the analysis of PFAS in the dialysate.

15
PPAR–δ. Binding to PFOS, PFHxS, and PFBA was stronger than the model had predicted (Figure 8). However, the model also predicted PFBS would bind strongly, which was not observed in the experimental results.
Figure 8. Binding curves for PPAR-δ.
PPAR– 𝛾𝛾. Determination of a relatively low KD value for PFOA (indicating strong binding, Figure 9)
agrees with previous experimental evidence that PFOA is a PPAR-𝛾𝛾 activator [43]. Thus it can be expected that PPAR-𝛾𝛾 would serve as an effective sorbent for long-chain perfluorinated carboxylic acids.
Figure 9. Binding curves for PPAR-𝛾𝛾.
16
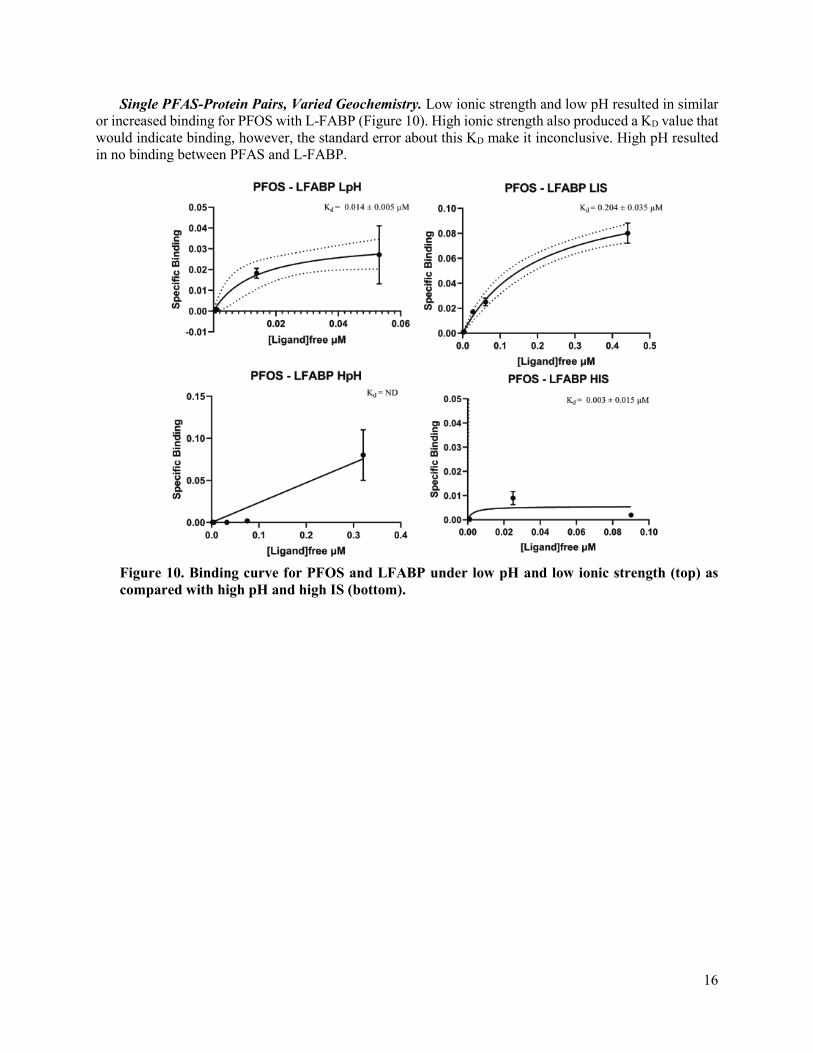
Single PFAS-Protein Pairs, Varied Geochemistry. Low ionic strength and low pH resulted in similar or increased binding for PFOS with L-FABP (Figure 10). High ionic strength also produced a KD value that would indicate binding, however, the standard error about this KD make it inconclusive. High pH resulted in no binding between PFAS and L-FABP.
Figure 10. Binding curve for PFOS and LFABP under low pH and low ionic strength (top) as compared with high pH and high IS (bottom).

17
A similar phenomenon was observed for PFBS and L-FABP in that low pH led to strong binding whereas high pH conditions showed no binding (Figure 11). The results for low and high ionic strength were both inconclusive.
Figure 11. Binding curve for PFBS and LFABP under low pH and low ionic strength (top) as compared with high pH and high IS (bottom). In contrast with PFBS and PFOS, PFHxS showed no binding to L-FABP at low pH despite some
binding under normal conditions. Surprisingly, I-FABP, which had not bound with any PFAS under the normal experimental conditions, showed enhanced binding to PFNA under low pH (Figure 12).
Figure 12. Binding of PFHxS to LFABP and PFNA to I-FABP at pH 4.6. Single Protein, AFFF-Contaminated Groundwater. Preliminary results for AFFF contaminated
groundwater with I-FABP and PPAR-α were determined using the 10-minute ionic strength method to screen for any obvious sorption and reduce PBS impacts on concentrations of PFBS and PFBA. However,

18
matrix effects resulted in partial analysis failure and therefore these data were inconclusive. Remaining samples are being reanalyzed using the previously published method by Backe et. al. [9] and these results will be included as a report amendment before the final project brief on May 3, 2019.
Protein Sorbent Regeneration. Temperature treatment at 50°C was not suitable to regenerate protein
for further use as a sorbent. While applying heat to equilibrated PFAS-protein complexes (T3) did appear to release the bound protein (Figure 13), it was not possible to use previously heat treated protein for subsequent PFAS binding (T2). Moreover, the results of our positive control (T1) were, for this set of experiments, equivocal. From this we conclude that further assessment of regenerative properties should focus on lower temperature heating, ionic strength and pH adjustment.
Figure 13. Binding curves for PFOA with LFABP under different temperature treatment conditions.

19
3.3 COMPARISON OF SORPTION PERFORMANCE
Based on the equilibrium binding data, we calculated maximum sorption capacities (qmax) for the PFAS-protein pairs with discernible KD values. We then compared these values with literature values for standard sorbents: granular activated carbon (GAC), particulate activated carbon (PAC), and anion exchange (Figure 14). This comparison highlights that several of our proteins are as or more effective for sorption of several PFAS than established methods. Of particular interest are our results for shorter-chain PFAS—the proteins tested here perform better than published methods for PFHxS, PFHxA and PFBS.
Figure 14. Maximum sorption capacity, qmax, calculated for PFAS-protein pairs in this study compared with literature values for granular activated carbon (GAC), particulate activated carbon (PAC), and anion exchange[19, 44-47]. Those PFAS-protein pairs that exceeded performance of published methods are highlighted in red.

20
4.0 CONCLUSIONS AND IMPLICATIONS FOR FUTURE RESEARCH
Results show some of the tested proteins hold promise for PFAS sorption, particularly under specific conditions (e.g. low pH, high ionic strength) that could boost selectivity for short-chain PFAS. The identification of strong binding of PPAR-δ for both PFBA and PFHxS, and of PPAR-α with PFHxA warrant further investigation in order to confirm their strong interactions, both to pursue promising avenues for bio-inspired treatment of short-chain PFAS and to ascertain whether these interactions have toxicological relevance. Protein production cost on the order of $40/kg could be possible [48], which although ~2x more expensive than GAC, could reduce the cost of sorptive media for high capacity protein-PFAS pairs. For example, increased sorption capacity of PPAR-γ compared to GAC for PFOS (Figure 14) could translate to a ~ 25% reduction in sorption media cost per mass of PFOS removed.
As this was a proof-of-concept limited-scope project it is important that a follow-on effort focus on the
practicalities of the use of proteins as an environmental treatment technology. We have identified three critical areas that require further investigation: (1) the production of proteins at scale and associated costs; (2) the capacity, kinetic performance, and optimization of protein sorbents under treatment conditions; (3) the durability and regenerability of protein sorbents. With these next steps in mind, we have outlined what a follow-on effort to refine our initial findings would entail.
YEAR 1 T1.1: Production of larger quantities best-performing protein candidates. Starting from best-perfoming
proteins from this limited-scope project, evaluate different production systems (e.g. E. coli, yeast) with consultation from appropriate biotechnology partners. Intrexon (www.dna.com) is one potential partner, who provided a letter of support for this project an has expressed enthusiastic interest in collaborating during a full SERDP project.
T1.2: Protein column testing. Focus on determining kinetics, sorption capacity, and breakthrough times under more realistic (but still bench-scale) conditions.
T1.3: Expansion of protein sorbent suite. In parallel with kinetic testing, expand candidate protein pool through additional molecular modeling and equilibrium dialysis batch tests, ending the first year with a comprehensive protein candidate suite and with robust set of performance parameters for the protein(s) to be featured in final products.
YEAR 2 T2.1: Production of expanded set of proteins with best chosen expression system.Based on results from
tasks 1.1 and 1.3, produce additional proteins for assessment. T2.2: Test potential to express only the ligand-binding domain. One strategy to increase the efficiency
of this protein binding approach would be to target production of only the relevant binding site (ligand-binding domains are already commercially produced for some of these proteins, e.g. PPAR-alpha, PPAR delta), thus reducing the mass or protein required to achieve the same PFAS removal. This would allow us to simplify production, tune efficiency, and reduce costs.
T2.3: Column testing for expanded suite of proteins. Here we would focus on establishing kinetic parameters and establish breakthrough curves for the expanded set of protein sorbents and the full set of PFAS.
T2.4: Degradation and shelf stability testing. While the application of appropriate controls during drying and freezing can allow lyophilized proteins to retain their activity [49], there are structure-specific considerations that warrant testing of specific proteins chosen for use as sorbents, particularly if their structures have been modified from the endogenous state.
YEAR 3 Finish up testing under various conditions, consider factors important for potential field testing and
pilot-scale production with industrial partners.

21
5.0 LITERATURE CITED
1. Buck, R.C., et al., Perfluoroalkyl and Polyfluoroalkyl Substances in the Environment: Terminology, Classification, and Origins. Integr Env. Assess Manage, 2011. 7: p. 513-541.
2. Butenhoff, J.L. and J.V. Rodricks, Human Health Risk Assessment of Perfluoroalkyl Acids, in Toxicological Effects of Perfluoroalkyl and Polyfluoroalkyl Substances, J.C. DeWitt, Editor. 2015. p. 363-418.
3. Ng, C.A. and K. Hungerbuhler, Bioconcentration of Perfluorinated Alkyl Acids: How Important Is Specific Binding? Environmental Science & Technology, 2013. 47(13): p. 7214-7223.
4. Luebker, D.J., et al., Interactions of flurochemicals with rat liver fatty acid-binding protein. Toxicology, 2002. 176(3): p. 175-185.
5. Bischel, H.N., et al., Strong associations of short-chain perfluoroalkyl acids with serum albumin and investigation of binding mechanisms. Environmental Toxicology and Chemistry, 2011. 30(11): p. 2423-2430.
6. Guelfo, J.L. and C.P. Higgins, Subsurface Transport Potential of Perfluoroalkyl Acids at Aqueous Film-Forming Foam (AFFF)-Impacted Sites. Environmental Science & Technology, 2013. 47(9): p. 4164-4171.
7. Houtz, E.F., et al., Persistence of Perfluoroalkyl Acid Precursors in AFFF-Impacted Groundwater and Soil. Environmental Science & Technology, 2013. 47(15): p. 8187-8195.
8. Karrman, A., et al., Environmental levels and distribution of structural isomers of perfluoroalkyl acids after aqueous fire-fighting foam (AFFF) contamination. Environmental Chemistry, 2011. 8(4): p. 372-380.
9. Backe, W.J., T.C. Day, and J.A. Field, Zwitterionic, Cationic, and Anionic Fluorinated Chemicals in Aqueous Film Forming Foam Formulations and Groundwater from US Military Bases by Nonaqueous Large-Volume Injection HPLC-MS/MS. Environmental Science & Technology, 2013. 47(10): p. 5226-5234.
10. Place, B.J. and J.A. Field, Identification of Novel Fluorochemicals in Aqueous Film-Forming Foams Used by the US Military (vol 46, pg 7120, 2012). Environmental Science & Technology, 2012. 46(19): p. 10859-10859.
11. Houtz, E.F., et al., Poly- and perfluoroalkyl substances in wastewater: Significance of unknown precursors, manufacturing shifts, and likely AFFF impacts. Water Research, 2016. 95: p. 142-149.
12. NJDEP-Division of Water Supply & Geoscience, http://www.nj.gov/dep/watersupply/dwc_quality_pfoa.html (accessed Nov 23, 2016).
13. USEPA, Health Effects Support Document for Perfluorooctanoic Acid (PFOA); 822-R-16–003; United States Environmental Protection Agency (US EPA): Office of Water, 2016. 2016.
14. Merino, N., et al., Degradation and Removal Methods for Perfluoroalkyl and Polyfluoroalkyl Substances in Water. Environmental Engineering Science, 2016. 33(9): p. 615-649.
15. McKenzie, E.R., et al., The influence of a non-aqueous phase liquid (NAPL) and chemical oxidant application on perfluoroalkyl acid (PFAA) fate and transport. Water Research, 2016. 92: p. 199-207.
16. Watanabe, N., et al., Thermal Mineralization Behavior of PFOA, PFHxA, and PFOS during Reactivation of Granular Activated Carbon (GAC) in Nitrogen Atmosphere. Environ. Sci. Pollut. Res., 2015: p. 1-6.

22
17. Du, Z.W., et al., Efficient adsorption of PFOS and F53B from chrome plating wastewater and their subsequent degradation in the regeneration process. Chemical Engineering Journal, 2016. 290: p. 405-413.
18. Zaggia, A., et al., Use of strong anion exchange resins for the removal of perfluoroalkylated substances from contaminated drinking water in batch and continuous pilot plants. Water Research, 2016. 91: p. 137-146.
19. Yao, Y., et al., Comparative study on adsorption of perfluorooctane sulfonate (PFOS) and perfluorooctanoate (PFOA) by different adsorbents in water. Water Science and Technology, 2014. 70(12): p. 1983-1991.
20. Ng, C.A. and K. Hungerbuhler, Bioaccumulation of Perfluorinated Alkyl Acids: Observations and Models. Environmental Science & Technology, 2014. 48(9): p. 4637-4648.
21. Conder, J.M., et al., Are PFCAs bioaccumulative? A critical review and comparison with regulatory lipophilic compounds. Environmental Science & Technology, 2008. 42(4): p. 995-1003.
22. Houde, M., et al., Monitoring of Perfluorinated Compounds in Aquatic Biota: An Updated Review PFCs in Aquatic Biota. Environmental Science & Technology, 2011. 45(19): p. 7962-7973.
23. Han, X., et al., Binding of perfluorooctanoic acid to rat and human plasma proteins. Chemical Research in Toxicology, 2003. 16(6): p. 775-781.
24. Karrman, A., et al., Identification and pattern of perfluorooctane sulfonate (PFOS) isomers in human serum and plasma. Environment International, 2007. 33(6): p. 782-788.
25. Bischel, H.N., L.A. MacManus-Spencer, and R.G. Luthy, Noncovalent Interactions of Long-Chain Perfluoroalkyl Acids with Serum Albumin. Environmental Science & Technology, 2010. 44(13): p. 5263-5269.
26. D'Eon, J.C., et al., Determining the molecular interactions of perfluorinated carboxylic acids with human sera and isolated human serium albumin using nuclear magnetic resonance spectroscopy. Environmental Toxicology and Chemistry, 2010. 29(8): p. 1678-1688.
27. Zhang, L.Y., X.M. Ren, and L.H. Guo, Structure-Based Investigation on the Interaction of Perfluorinated Compounds with Human Liver Fatty Acid Binding Protein. Environmental Science & Technology, 2013. 47(19): p. 11293-11301.
28. Cheng, W.X. and C.A. Ng, Predicting Relative Protein Affinity of Novel Per- and Polyfluoroalkyl Substances (PFASs) by An Efficient Molecular Dynamics Approach. Environmental Science & Technology, 2018. 52(14): p. 7972-7980.
29. Sharma, A. and A. Sharma, Fatty Acid Induced Remodeling within the Human Liver Fatty Acid-binding Protein. Journal of Biological Chemistry, 2011. 286(36): p. 31924-31928.
30. Laguerre, A., et al., Preparation, crystallization and preliminary X-ray diffraction analysis of two intestinal fatty-acid binding proteins in the presence of 11-(dansylamino)undecanoic acid. Acta Crystallographica Section F-Structural Biology Communications, 2011. 67: p. 291-295.
31. dos Santos, J.C., et al., Different binding and recognition modes of GL479, a dual agonist of Peroxisome Proliferator-Activated Receptor alpha/gamma. Journal of Structural Biology, 2015. 191(3): p. 332-340.
32. Malapaka, R.R.V., et al., Identification and Mechanism of 10-Carbon Fatty Acid as Modulating Ligand of Peroxisome Proliferator-activated Receptors. Journal of Biological Chemistry, 2012. 287(1): p. 183-195.

23
33. Batista, F.A.H., et al., Structural Insights into Human Peroxisome Proliferator Activated Receptor Delta (PPAR-Delta) Selective Ligand Binding. Plos One, 2012. 7(5).
34. Hanwell, M.D., et al., Avogadro: an advanced semantic chemical editor, visualization, and analysis platform. Journal of Cheminformatics, 2012. 4.
35. Trott, O. and A.J. Olson, Software News and Update AutoDock Vina: Improving the Speed and Accuracy of Docking with a New Scoring Function, Efficient Optimization, and Multithreading. Journal of Computational Chemistry, 2010. 31(2): p. 455-461.
36. Case, D.A., et al., The Amber biomolecular simulation programs. Journal of Computational Chemistry, 2005. 26(16): p. 1668-1688.
37. Miller, B.R., et al., MMPBSA.py: An Efficient Program for End-State Free Energy Calculations. Journal of Chemical Theory and Computation, 2012. 8(9): p. 3314-3321.
38. Caldwell, G.W. and Z.Y. Yan, Isothermal Titration Calorimetry Characterization of Drug-Binding Energetics to Blood Proteins., in Optimization in Drug Discovery: in Vitro Methods, Z. Yan and G.W. Caldwell, Editors. 2004, Humana Press, Inc: Totowa, NJ. p. 123–149.
39. Kastritis, P.L. and A. Bonvin, On the binding affinity of macromolecular interactions: daring to ask why proteins interact. Journal of the Royal Society Interface, 2013. 10(79).
40. Lloret, N., et al., Effects of buffer composition and dilution on nanowire field-effect biosensors. Nanotechnology, 2013. 24(3).
41. Allred, B.M., et al., Physical and Biological Release of Poly- and Perfluoroalkyl Substances (PFASs) from Municipal Solid Waste in Anaerobic Model Landfill Reactors. Environmental Science & Technology, 2015. 49(13): p. 7648-7656.
42. Ishibashi, H., et al., In Vitro and In Silico Evaluations of Binding Affinities of Perfluoroalkyl Substances to Baikal Seal and Human Peroxisome Proliferator-Activated Receptor alpha. Environmental Science & Technology, 2019. 53(4): p. 2181-2188.
43. Buhrke, T., et al., Perfluorooctanoic acid (PFOA) affects distinct molecular signalling pathways in human primary hepatocytes. Toxicology, 2015. 333: p. 53-62.
44. Hansen, M.C., et al., Sorption of perfluorinated compounds from contaminated water to activated carbon. Journal of Soils and Sediments, 2010. 10(2): p. 179-185.
45. Du, Z.W., et al., Selective and Fast Adsorption of Perfluorooctanesulfonate from Wastewater by Magnetic Fluorinated Vermiculite. Environmental Science & Technology, 2017. 51(14): p. 8027-8035.
46. Li, J., et al., Removal of perfluorooctanoic acid from water with economical mesoporous melamine-formaldehyde resin microsphere. Chemical Engineering Journal, 2017. 320: p. 501-509.
47. Zhao, D.M., et al., Sorption of Perfluorochemicals to Granular Activated Carbon in the Presence of Ultrasound. Journal of Physical Chemistry A, 2011. 115(11): p. 2250-2257.
48. Ferreira, R.D., A.R. Azzoni, and S. Freitas, Techno-economic analysis of the industrial production of a low-cost enzyme using E. coli: the case of recombinant beta-glucosidase. Biotechnology for Biofuels, 2018. 11.
49. Roy, I. and M.N. Gupta, Freeze-drying of proteins: some emerging concerns. Biotechnology and Applied Biochemistry, 2004. 39: p. 165-177.

24
FINAL REPORT ADDENDUM
APRIL 30, 2019

25
6.0 SERDP FINAL LIMITED SCOPE REPORT ADDENDUM
This section concerns the results of equilibrium dialysis experiments performed using actual AFFF-
contaminated groundwater. The groundwater in question was provided by the Field laboratory. Based on expected concentrations of various PFAS in this groundwater, we selected dilutions for dialysis that would cover the range of PFOA concentrations and tested against binding with L-FABP. We found that the KD calculated from this real-world contaminated sample was in the same range as when the dialysis was performed on a pure PFOA standard (0.066 ± 0.11 μM versus 0.099 ± 0.095 μM). Moreover, qmax values for the two were essentially the same (Figure A1).
Figure A1: Equilibrium dissociation constant and qmax for PFOA present in AFFF-contaminated groundwater sample.
The similarity in the results for PFOA using pure standard to those using AFFF-contaminated
groundwater is a promising indication that competition from other constituents in the groundwater, both PFAS and non-PFAS, do not substantially affect the tested protein’s capacity for PFOA removal.
A particular challenge of working with AFFF samples is the wide range of concentrations for different
PFAS present in the sample. In this case, our dilutions allowed us to capture full datasets for PFOA (as intended) and PFHxA. For PFHxA, no binding to LFABP was found when using the pure standard and this was confirmed in this groundwater test as well. PFOS was present at much higher concentration in this sample, and thus our dilutions were beyond the instrument calibration curve, thus preventing quantification of a KD or qmax for PFOS. Other PFAS, such as the short-chain PFBA and PFBS, were present at much lower concentrations and were therefore below the instrument LOQ in our dilutions. Based on the promising result for PFOA, we plan to follow up this initial set of experiments with a wider range of dilutions to capture the behavior of more of the PFAS present in this and other contaminated groundwater samples.