molecular characterization of global maize breeding ... yanli_tag_2009.pdf · molecular...
TRANSCRIPT

ORIGINAL PAPER
Molecular characterization of global maize breeding germplasmbased on genome-wide single nucleotide polymorphisms
Yanli Lu • Jianbing Yan • Claudia T. Guimaraes • Suketoshi Taba • Zhuanfang Hao • Shibin Gao •
Shaojiang Chen • Jiansheng Li • Shihuang Zhang • Bindiganavile S. Vivek • Cosmos Magorokosho •
Stephen Mugo • Dan Makumbi • Sidney N. Parentoni • Trushar Shah • Tingzhao Rong •
Jonathan H. Crouch • Yunbi Xu
Received: 6 August 2009 / Accepted: 11 September 2009 / Published online: 11 October 2009
� Springer-Verlag 2009
Abstract Characterization of genetic diversity is of great
value to assist breeders in parental line selection and
breeding system design. We screened 770 maize inbred
lines with 1,034 single nucleotide polymorphism (SNP)
markers and identified 449 high-quality markers with no
germplasm-specific biasing effects. Pairwise comparisons
across three distinct sets of germplasm, CIMMYT (394),
China (282), and Brazil (94), showed that the elite lines
from these diverse breeding pools have been developed
with only limited utilization of genetic diversity existing
in the center of origin. Temperate and tropical/subtropical
germplasm clearly clustered into two separate groups.
The temperate germplasm could be further divided into six
groups consistent with known heterotic patterns. The
greatest genetic divergence was observed between tem-
perate and tropical/subtropical lines, followed by the
divergence between yellow and white kernel lines, whereas
the least divergence was observed between dent and flint
lines. Long-term selection for hybrid performance has
contributed to significant allele differentiation between
heterotic groups at 20% of the SNP loci. There appeared to
be substantial levels of genetic variation between different
breeding pools as revealed by missing and unique alleles.
Two SNPs developed from the same candidate gene were
associated with the divergence between two opposite
Chinese heterotic groups. Associated allele frequency
change at two SNPs and their allele missing in Brazilian
germplasm indicated a linkage disequilibrium block of
142 kb. These results confirm the power of SNP markers
Communicated by T. Luebberstedt.
Electronic supplementary material The online version of thisarticle (doi:10.1007/s00122-009-1162-7) contains supplementarymaterial, which is available to authorized users.
Y. Lu � J. Yan � S. Taba � Z. Hao � T. Shah �J. H. Crouch � Y. Xu (&)
International Maize and Wheat Improvement Center
(CIMMYT), Km 45, Carretera, Mexico-Veracruz,
El Batan, Texcoco, Mexico
e-mail: [email protected]
Y. Lu � S. Gao � T. Rong
Maize Research Institute,
Sichuan Agricultural University,
Ya’an, Sichuan 625014, China
C. T. Guimaraes � S. N. Parentoni
Embrapa Maize and Sorghum,
CP 151, Sete Lagoas, MG 35701-970, Brazil
Z. Hao � S. Zhang
Institute of Crop Science, Chinese Academy of Agricultural
Sciences, National Key Facilities for Crop Genetic Resources
and Improvement, 100081 Beijing, China
S. Chen � J. Li
National Maize Improvement Center of China,
China Agricultural University, 100094 Beijing, China
B. S. Vivek � C. Magorokosho
CIMMYT, 12.5 Km peg Mazowe Road,
P.O. Box MP163, Mount Pleasant, Harare, Zimbabwe
S. Mugo � D. Makumbi
CIMMYT, PO Box 1041, Village Market,
00621 Nairobi, Kenya
123
Theor Appl Genet (2009) 120:93–115
DOI 10.1007/s00122-009-1162-7
for diversity analysis and provide a feasible approach to
unique allele discovery and use in maize breeding
programs.
Introduction
Maize (Zea mays L.) is one of the most important food
crops globally and a model system for the study of
genetics, evolution, and domestication. Detailed knowl-
edge of the relationship between maize breeding lines is
important not only for parental selection but also for
genetic analysis and breeding system design. Diversity
analysis of germplasm collections can be carried out using
data at morphological, geographical, molecular (DNA,
sequence, gene) and functional levels (Buckler et al. 2006).
This type of analysis has five important outputs for crop
genetics researchers and breeders (Xu 2003; Xu et al.
2003): differentiating cultivars and classifying inbred lines
into heterotic groups; identifying gaps and redundancy in
germplasm collections; monitoring genetic shifts that occur
during germplasm conservation, regeneration, domestica-
tion, and breeding; identifying novel and superior alleles
for improvement of agronomic traits; and constructing a
representative subset or core collection. With the large-
scale availability of gene-based single nucleotide poly-
morphism (SNP) makers in maize, allele mining, and
diversity analysis based on functional sequence variation
are now highly feasible and powerful approaches.
Maize is a widely grown C4 crop with a high rate of
photosynthetic activity leading to high grain and biomass
yield potential. It is predominantly a cross-pollinating
species, a feature that has contributed to its broad mor-
phological variability and geographical adaptability. Agro-
geographically, maize is classified into three types, tem-
perate, tropical, and subtropical. Maize germplasm can also
be classified based on endosperm and kernel constitution
(waxy, sweet, and pop corn), kernel color and texture
(flint, dent, floury), environment in which it is grown,
maturity class, and use. The economically most important
types of maize are grown for feed, food, fodder, and fuel.
In the tropics, grain is still primarily grown for human
consumption.
A collection of maize germplasm, which is to be used as
a source of genetic diversity, must be well characterized
with well-defined distinct groups for efficient management
and effective exploitation in breeding programs. Crosses
between genetically divergent lines generally produce
better-performed hybrids than crosses between closely
related parents (Tracy and Chandler 2006). Genetic
diversity analysis of maize germplasm can be used to
classify accessions into heterotic groups, so that maize
lines within each group have a high level of genetic
similarity and a high level of dissimilarity compared to
other groups. Commercial maize hybrids are typically
created from crosses between inbred lines from opposite
and complementary heterotic groups in order to maximize
hybrid performance. The International Maize and Wheat
Improvement Center (CIMMYT) has generated tropical
maize germplasm of dent and flint types with distinct sets
of genes. Dent and flint core accessions have been tenta-
tively named as heterotic groups A and B, respectively.
New accessions are testcrossed with inbred testers selec-
ted from A and B groups to determine their specific het-
erotic patterns. The hybrid maize breeding program at the
Brazilian Agricultural Research Corporation (Embrapa),
Brazil was established in the late 1970s using kernel type
as a major criterion for classifying lines into distinct
heterotic groups. Thus, flint and dent inbreds have been
managed as two separate heterotic groups. Twenty-eight
open pollinated varieties (OPVs), representing part of the
tropical maize diversity used in Brazil, have been sepa-
rated into dent and flint types after being classified into
four heterotic groups based on yield-specific combining
ability (Parentoni et al. 2001). In temperate germplasm,
such as the Chinese maize lines tested in this study, het-
erotic groups have been established over a long period and
proven useful in hybrid breeding. Chinese maize lines are
generally classified into four to six major heterotic groups
according to the pedigree information and combining
ability. Using 111 SSR markers, 84 parental lines of 71
hybrids widely grown across the China Corn Belt were
classified into 5 major heterotic groups: Lancaster, Reid,
Sipingtou (SPT), Zi330, and Tem-tropic I (Teng et al.
2004). Recently, while analyzing 187 commonly used
Chinese maize inbred lines, six subgroups were identified,
BSSS (Iowa Stiff Stalk Synthetic population), PA (group
A germplasm derived from modern US hybrids), PB
(group B germplasm derived from modern US hybrids),
Lancaster (Lancaster Surecrop), LRC (derivatives from
Lvda red coda Chinese landrace), and SPT (derivatives
from Tangshan Sipingtou Chinese landrace) (Xie et al.
2008). However, another recent analysis resulted in their
288 inbred lines being subdivided into four subgroups
according to major empirical germplasm origin in China;
i.e., Lancaster, Reid, SPT (Sipingtou) and P (introduced
from Pioneer hybrids), which assigned LRC to SPT group
and combined BSSS and PA into Reid group (Wang et al.
2008). Thus, the creation of heterotic groups in some
types of germplasm is still somewhat subjective and
individual breeding programs need to select the approach,
which best serves their respective breeding strategy and
goals.
Information from testcrosses, pedigrees, and morpho-
logical traits of inbred lines from within a breeding pro-
gram is all useful for defining heterotic groups. However,
94 Theor Appl Genet (2009) 120:93–115
123

heterotic relationships of germplasm from maize breeding
programs across the world cannot be easily classified due
to its diverse origins (different breeding practices and
breeding goals), and incomplete or insufficient pedigree
information (as many breeding programs prefer to keep
such information confidential). Thus, in such cases,
molecular marker analyses provide an important alternative
approach for estimating genetic relationships. Restriction
fragment length polymorphism (RFLP) and simple
sequence repeat (SSR) or microsatellite markers have been
used to examine genetic diversity in maize landraces,
modern OPVs, and inbred lines adapted to nontemperate
growing areas to find unique sources of allelic diversity
(Warburton et al. 2008), characterize the genetic structure
and diversity of 260 important tropical and temperate
maize inbred lines using SSR markers (Liu et al. 2003),
construct ‘‘phylogenetic’’ trees and define potential heter-
otic groups within medium to late maturing Iranian maize
inbred lines (Choukan et al. 2006) and within Chinese
germplasm (Teng et al. 2004; Wang et al. 2008; Xie et al.
2008), assign tropical Asian maize inbred lines to potential
heterotic groups (Yuan et al. 2001), classify 116 European
and North American maize inbreds into the dent and flint
groups (Smith et al. 1997), and cluster temperate, tropical,
and subtropical lines into major breeding groups (Liu et al.
2003). Furthermore, these molecular markers have been
extensively used for analysis of genotypic frequencies for
identification of deviations at individual loci (Reif et al.
2004) and for characterization of molecular variation
within or between populations (Dubreuil and Charcosset
1998; Warburton et al. 2002, 2008; Reif et al. 2004, 2006;
Vigouroux et al. 2008) and for analysis of correlation
between genetic distance and hybrid performance, and
specific combining ability (Melchinger 1999; Betran et al.
2003).
Several studies have demonstrated a decline in genetic
diversity across the elite temperate maize breeding pool
over the past century (Duvick et al. 2004). However, this
can be easily reversed by use of landraces and wild-related
species that contain untapped sources of biotic and abiotic
stress resistance that should provide useful new alleles for
future maize improvement (Hoisington et al. 1999). After
analyzing more than 100 maize inbred lines and teosinte
accessions with 462 SSRs, Vigouroux et al. (2005) con-
cluded that many alleles in the progenitor species of maize
(teosinte) are not present in modern maize. Moreover, a
significant difference in the overall level of genetic varia-
tion in the maize cultivars of industrialized countries as
compared to landraces and wild relatives has been found.
However, genetic diversity of germplasm developed in
developing country breeding programs from both temper-
ate and tropical areas has not been well studied, particu-
larly regarding characterization of alleles and their
frequencies among germplasm collections including elite
lines from different parts of the world.
A very large number of SNP markers are now available
in maize, many of which have been developed from the
DNA sequence of known genes. For this reason, SNP
markers are now the assay of choice for a variety of tasks in
maize improvement including genetic diversity analysis,
linkage map construction, marker–trait association or
quantitative trait locus (QTL) mapping, and marker-assis-
ted selection (MAS). SNPs have two major advantages
over other molecular markers: they are the most abundant
form of genetic variation within genomes (Zhu et al. 2003),
and a wide array of technologies have now been developed
for high throughput genotyping (Fan et al. 2006). In
addition, SNP markers can be used for revealing genetic
diversity at the sequence level within functionally relevant
genes. Characterization of alleles and their frequencies at
SNP loci provide an opportunity for discovery of functional
diversity, particularly when candidate gene-based markers
are used.
There are two SNP genotyping platforms that are of
particular importance for maize breeders: the GoldenGate
assay for medium-density genotyping that contains 96–
1,536 SNPs per array, and the Infinium assay for high-
density genotyping that contains up to 500 K SNPs per
array (Fan et al. 2006; http://www.illumina.com). A cus-
tom oligo pool assay (OPA) containing 1,536 SNPs has
been developed for the GoldenGate assay. This OPA has
already been used to genotype the nested association
mapping (NAM) population consisting of 5,000 RILs
derived from 25 families, and 1,106 of these SNPs were
successfully mapped to an integrated linkage map (http://
www.panzea.org). More recently, a refined OPA has been
developed using these 1,106 mapped SNPs plus 430 new
SNPs selected from the Panzea database to replace those
SNPs from the original OPA that could not be mapped or
did not provide good quality data (Yan et al. 2009). A third
OPA has been developed through a collaboration between
CIMMYT and Molecular and Functional Diversity Team
of the USA-NSF Maize Genome Project, which contains
SNP markers developed from candidate genes associated
with mechanisms and pathways known to influence
drought tolerance.
In maize, the frequency of SNPs and distribution of
DNA polymorphisms were examined at 18 maize genes in
36 maize inbreds (Ching et al. 2002). It was found that the
frequency of nucleotide changes was high, on average one
polymorphism per 31 bp in noncoding regions and one
polymorphism per 124 bp in coding regions. By comparing
SNP diversity between maize and teosinte in 774 genes
(Wright et al. 2005), it was concluded that maize acces-
sions had a far lower genetic diversity consistent with
products of artificial selection and crop improvement. In
Theor Appl Genet (2009) 120:93–115 95
123

linkage mapping, 133 SNPs were mapped onto the inter-
mated B73 9 Mo17 high-resolution mapping population
(Vroh et al. 2006). Based on an empirical comparison of
SSRs and SNPs in assessment of maize diversity and
relatedness (Hamblin et al. 2007), it was found that SSRs
performed better at clustering germplasm into populations
than did a set of 847 SNPs or 554 SNP haplotypes, and
SSRs provided more resolution in measuring genetic dis-
tance based on allele-sharing. It was suggested that large
numbers of SNP would be required to replace highly
polymorphic SSRs in studies of diversity and relatedness.
In this study, 770 maize inbred lines representing both
temperate and tropical/subtropical maize germplasm were
obtained from breeding programs in Brazil and China, as
well as CIMMYT breeding programs in Mexico, Zimba-
bwe and Kenya, and genotyped using a 1,536-SNP chip.
The main objectives of this research were to screen core
sets of SNP markers showing a high level of polymorphism
and providing high-quality data for large-scale character-
ization of maize breeding lines, to analyze the genetic
diversity presented in a broad and diverse set of maize
inbred lines to determine the level of genetic diversity that
has been tapped by modern plant breeding, to explore the
genetic distinction between germplasm from breeding
programs in diverse global locations as revealed by allelic
frequency differences, and to investigate the relationships
between these germplasm subsets and its association with
pedigrees and breeding history.
Materials and methods
Plant materials
A total of 770 maize inbred lines representing temperate,
tropical, and subtropical maize germplasm from breeding
programs and germplasm collections in diverse global
locations were chosen for characterization. Lines were
chosen due to their biotic stress resistance or abiotic stress
tolerance including 394 lines from CIMMYT maize
breeding programs in Mexico, Zimbabwe, and Kenya, 282
lines from China Agricultural University, Sichuan Agri-
cultural University and the Chinese Academy of Agricul-
tural Sciences, and 94 from Embrapa, Brazil (Table 1). All
the CIMMYT maize lines tested were tropical/subtropical
types, the majority of which (309) were white kernel types,
and many were developed from the same populations. In
contrast, the majority of Chinese maize lines tested was
temperate types with just 14 tropical lines that were derived
directly and solely from tropical germplasm. The Chinese
germplasm tested also included parental genotypes of
widely grown commercial hybrids, as well as 34 high oil
content line selections from populations developed by
Song and Chen (2004) at China Agricultural University, 28
Chinese landraces, and four high pro-vitamin A lines. All
the Brazilian lines tested were yellow kernel types, com-
prising 89 tropical types, 4 subtropical types, and 1 tem-
perate haploid inducer line (W23). The names of all tested
lines together with kernel color and texture characters,
environment adaptation, and heterotic group assignment
(where available) are listed in Table S1 and summarized in
Table 1. For data analysis, the 770 lines used in this study
were arranged in contrasting groups as follows: temperate
lines (269) versus tropical/subtropical lines (501), yellow
(377) versus white kernel (341) (Subset 1 in Table S1), and
dent (172) versus flint texture (255) (Subset 2 in Table S1).
For the convenience of description, however, we call all
tropical and subtropical maize collectively as tropical/
subtropical throughout the rest of this paper as in many
cases they cannot be well distinguished.
SNP genotyping
All maize lines tested in this study, except those from
Embrapa and China Agricultural University, were planted
during the 2007 wet season at CIMMYT’s Maize Experi-
mental Station in Tlaltizapan (State of Morelos, Mexico).
After removal of off-types and mixtures, leaf samples were
harvested from 15 plants from each line and bulked for
DNA extraction. For all the samples, DNA extraction was
Table 1 Summary information of phenotypic characterization and environment adaptation of 770 maize inbred lines
No. Adaptation Color Texture
TR TE Y W R Unknown D SD SF F Unknown
CIMMYT 394 394 0 44 309 0 41 47 81 100 115 51
China 282 14 268 239 32 1 10 87 51 17 97 30
Brazil 94 93 1 94 0 0 0 38 2 1 43 10
Total 770 501 269 377 341 0 51 172 134 118 255 91
TR Tropical/subtropical germplasm, TE temperate germplasm, Y yellow kernel color, W white kernel color, R red kernel color, D dent kernel
texture, SD semi-dent kernel texture, SF semi-flint kernel texture, F flint kernel texture
96 Theor Appl Genet (2009) 120:93–115
123

based on a CTAB procedure (CIMMYT Applied Molecular
Genetics Laboratory 2003).
Designability rank score was given to each SNP by
Illumina, with the score ranging from 0 to 1.0, where a
rank score of\0.4 has a low success rate, 0.4 to\0.6 has a
moderate success rate, and[0.6 has a high success rate for
the conversion of a SNP into a successful GoldenGate
assay. A total of 384 SNPs with a designability rank score
of 0.4 or higher were selected to be included in the OPA,
except when multiple SNPs were located on the same
STS, in which case only the SNPs with the highest de-
signability rank score was selected (the others were not
used).
The OPA for SNP genotyping used in this study was
developed under the framework of the Molecular and
Functional Diversity Team of the USA-NSF Maize Genome
Project (Yan et al. 2009). A total of 1,106 SNP markers
developed previously by the project have been integrated
into an existing linkage map (http://www.panzea.org). In
this study, these 1,106 mapped-SNPs were combined with a
further 430 SNPs selected from the panzea database to
develop a new OPA chip containing 1,536 SNPs on the
basis of having a designability score higher than 0.60, which
was given to each SNP by Illumina with the score ranging
from 0 to 1.0. A score of[0.6 has a high success rate for the
conversion of a SNP into a successful GoldenGate assay.
The original sequences used to develop these SNP markers
were used for a BlastN (Altschul et al. 1990) search against
the B73 genome sequence (reported at http://www.
maizesequence.org, December 2008) enabling in silico
map positions to be generated for 1,326 of the SNP markers.
The number of SNP markers per chromosome ranged from
81 (chromosome 10) to 231 (chromosome 1) with just 20
SNP markers remaining unmapped (see http://www.panzea.org
for details).
SNP genotyping was carried out using an Illumina
BeadStation 500 G (Illumina, Inc., San Diego, CA, USA)
at the Cornell University Life Sciences Core Laboratories
Center and the protocols described by Fan et al. (2006). A
total of 5 lL of 50 ng/lL genomic DNA was used to make
single-use DNA as required by the genotyping system
which was arranged in Sentrix Array Matrices (SAMs)
each with 96 samples comprising one negative control
(water) sample and one repeatability control (duplicate)
sample in addition to 94 genotype samples. The Golden-
Gate assay using a SNP chip containing the 1,536 markers
described above was then hybridized to the SAMs for
genotype analysis of the 770 maize lines. Allele calling for
each locus was carried out using Illumina BeadStudio
genotyping software with a no-call threshold of 0.25, which
is the lower bound for a reliable genotype call. Data not
automatically dealt with by the software were manually
scored.
Data analysis
The polymorphism information content (PIC) value,
described by Botstein et al. (1980), was used to refer to the
relative value of each marker with respect to the amount of
polymorphism exhibited. PIC value was estimated by
PICi ¼ 1�Xn
j¼1
P2ij �
Xn�1
j¼1
Xn
k¼jþ1
2P2ijP
2ik
where Pij and Pik are the frequencies of the jth and kth
alleles for marker i, respectively, and the summation
extends over n alleles. Heterozygosity and gene diversity
were calculated to quantify the genetic variation in the
maize lines sampled. The heterozygosity value reflects the
proportion of heterozygous loci detected in a single maize
line while the gene diversity is defined as the probability
that two alleles randomly chosen from the test sample are
different. The common biased estimator of the gene
diversity for marker i can be obtained using the above
equation by dropping the last item.
Allele frequency was calculated for each locus across
each of the three geographically distinct sets of maize
germplasm within each of the defined subsets: tropical/
subtropical versus temperate, white versus yellow kernel,
and dent versus flint texture. Statistical significance of
differences in allele frequency was based on the P value
from Fisher’s exact test (Fisher 1922). The genetic distance
between genotypes was computed using the Rogers (1972)
genetic distances (RD) and cluster analysis was then
carried out using the neighbor-joining tree (NJ) method
(Saitou and Nei 1987). Groups and subgroups were iden-
tified from the resultant phylogenetic tree. All of the above
calculations were performed with PowerMarker software
(Liu and Muse 2005).
The population structure of the 770 genotypes was
investigated using the STRUCTURE software (Pritchard
et al. 2000). The dataset was tested for a number of sub-
populations ranging from k = 1–12. Three runs for each
k value were performed using the admixture model and
correlated allele frequencies (Falush et al. 2003). The burn-
in length and iterations were all set to 500,000. In the
model-based method, membership coefficients (Q values)
for each inbred line were estimated to have its member-
ships in multiple subgroups. Inbred lines with membership
probabilities C0.60 were assigned to the corresponding
subgroup and lines with membership probabilities \0.60
were assigned to a mixed subgroup. In addition, principal
component analysis (PCA) was conducted using TASSEL
2.1 software (Yu et al. 2006; Bradbury et al. 2007) to
visualize the genetic relationships between the maize lines
tested and to compare different subsets of germplasm
with contrasting origins, kernel colors, kernel textures, and
Theor Appl Genet (2009) 120:93–115 97
123

environmental adaptation. SNP markers showing signifi-
cant different segregation patterns in different subsets of
germplasm and between different established heterotic
groups were identified. Shared allele frequency (the pro-
portion of the loci with identical alleles between two inbred
lines), was calculated in order to carry out pairwise com-
parisons of maize lines that were known to be closely
related to each other based on pedigree information.
Allele frequencies within different subsets of germplasm
and within groups identified by STRUCTURE, PCA and
clustering analyses were used to identify SNP markers
detecting unique, missing, and under-representative alleles
solely in specific subsets of germplasm. SNP markers
detecting significantly different allelic frequencies can be
used to distinguish closely related inbred lines and heter-
otic groups. Unique alleles are defined as those that can be
only found in one germplasm subset but not in the others.
Missing alleles are defined as those completely lacking in a
specific subset of germplasm while existing in all others at
a regular frequency. Under-representative alleles are
defined as those with very low frequencies in one collec-
tion (with only one or two lines containing the allele) but
existing normally in others.
Results
Characterization of SNP and germplasm diversity
All SNP data (770 lines by 1,536 SNPs) were scored using
Illumina BeadStudio genotyping software. An unambigu-
ous output from this software is shown in Fig. S1 where
there are three clearly separated clusters representing AA,
BB, and AB genotypes. The designability score ranged
from 0.1 to 1.0 with the majority (62%) of SNP markers
with designability scores of more than 0.6. This very high
level of designability score may be due to all the tested
material being inbred lines. SNPs with designability scores
lower than 0.3 are considered of poor quality so that they
cannot be called correctly by automatic scoring or manu-
ally re-clustering. In addition, SNP markers that were
monomorphic or had missing data points more than 20% in
the diversity panel of inbred lines were removed from
further analyses. As a result, a total of 1,034 SNPs (67%)
were called successfully with high quality. Base changes
involved A/C (181), A/G (661), A/T (73), and C/G (119),
and A/G transition accounted for 63.9% of the informative
SNPs. A list of these informative SNP loci including
chromosome, base change, minor allele frequency (MAF),
heterozygosity, gene diversity, and PIC is provided in
Table S2. Of the 1,034 markers, only 8.8% (91/1,034)
showed MAF less than 0.05. Approximately 54.3% (561/
1,034) of SNPs had an MAF more than 0.2, which were
selected as markers with normal allele frequencies. In
addition, 193 (18.7%) showed almost equal allele fre-
quencies (with MAF close to 0.5) for two alternative alleles
(Fig. 1).
In the 770 inbred lines, 2,068 alleles were detected at
the 1,034 marker loci, each with two alleles as expected.
The average PIC was 0.259, ranging from 0.003 to 0.375
(Table S2) with a peak distribution between 0.350 and
0.375 (Fig. 1). Estimated gene diversity varied from
0.003 to 0.500 with an average of 0.321. On average, the
inbred lines exhibited heterozygosity at 4.3% of the
genetic loci.
Further data analyses have been taken to test if the levels
of genetic diversity identified among different germplasm
collections matter with the SNP chip that was developed
for maximizing the genetic polymorphism between the
temperate parent B73 and other parents in the panel for
development of the NAM population. Three subsets of
SNPs were selected from the chip for genetic diversity
analysis. The first subset was selected for high quality with
449 SNPs selected based on three factors: high design-
ability scores ([0.6), normal MAF ([0.2), and high PIC
values ([0.25) (Table S2, Subset A). Two subsets (Table
S2, Subset A and B) were obtained by excluding the
markers with allele frequency difference between temper-
ate and tropical/subtropical germplasm larger than 10 and
5%, respectively. In addition, to understand the influence of
possible biased sampling method in collecting germplasm
on genetic diversity, a subset of the Chinese (mainly
temperate) germplasm collection was formed by excluding
28 landraces and 34 high-oil lines that might have made an
additional contribution to the genetic diversity in elite
Chinese maize germplasm. All these subsets selected for
SNPs and germplasm were compared with the entire
counterparts for PIC and gene diversity (Table 2).
Fig. 1 Frequency distribution
of minor allele and polymorphic
information content (PIC)
among 770 maize inbred lines
based on 1,034 single nucleotide
polymorphisms (SNPs)
98 Theor Appl Genet (2009) 120:93–115
123

Using all 1,034 informative SNPs and 770 inbred lines,
Chinese germplasm were found to show the highest aver-
age PIC value and gene diversity, followed by CIMMYT
germplasm, whereas the Brazilian germplasm showed the
lowest (Table 2). Analyses with the three subsets of SNP
markers provide consistent results that the differences in
detected genetic diversity between germplasm collections
were significantly reduced and as a result, the estimates for
PIC and gene diversity from Chinese germplasm are only
slightly higher than others. On the other hand, using 449
high-quality markers significantly increased the estimates
of PIC and gene diversity for all germplasm collections,
which are about 30% higher than those obtained from other
marker subsets. Excluding landraces and high-oil inbreds
from Chinese germplasm slightly decreased the estimates
for PIC and gene diversity, but did not change the order of
genetic diversity in different germplasm collections, indi-
cating that the Chinese germplam collection did not contain
highly diverse landraces or populations that should have
significantly contributed to the level of genetic diversity
detected in this study. In all cases, the Brazilian maize lines
tested in this study appear to have relatively narrow genetic
base as revealed by their estimates for both PIC and gene
diversity, which probably is related to the small number of
inbreds sampled that do not represent the whole inbred line
collection from Embrapa, but were mainly selected for
biotic and abiotic stresses. As the 449 high-quality markers
provided the highest estimates for PIC and gene diversity
and also the results comparative to those obtained from
other selected marker subsets, these markers should be
recommended for future use or optimization of SNP chips
by combining with high-quality markers identified from
other chips.
Population structure
An admixture model-based clustering method in the
STRUCTURE was implemented to infer population
structure for all 770 tested lines and it was run for the
number of fixed subgroups k from 1 to 12. The results
indicate that the model overestimated the number of
groups, and thus no suitable k could be chosen from the Ln
probability and used directly for group determination.
However, when k = 2, there was a big increase in the
probability compared to k = 1 so that two major groups
can be claimed (Fig. 2). When the results were compared
with the known pedigrees of the inbred lines for each run of
different ks, the model-based groups were largely consis-
tent with known pedigrees when k = 8, so that the 770
tested lines can be mainly divided into eight groups
(Fig. 2). Five of these groups (Group 1, 2, 3, 5, and 6)
include all Chinese maize inbred lines and correspond to
the five major germplasm origins in China, i.e., PA, BSSS,
PB, Lancaster and SPT. The other three groups (4, 7, and 8)
including maize lines predominantly from CIMMYT and
Brazil majorly representing tropical/subtropical germ-
plasm, which are named as Tropics 1, 2, and 3, respectively
(Fig. 2).
Group 1 belongs to BSSS heterotic group, consisting of
19 Chinese inbred lines that have B73 in their pedigrees.
Group 2, Lancaster, comprised 30 high-oil inbred lines, 52
Chinese normal inbred lines and 1 CIMMYT inbred line.
The majority of these Chinese normal inbred lines are
closely related to Mo17 and Zi300 pedigrees. Group 3,
SPT, included 34 Chinese inbred lines, which were mainly
derived from Chinese local germplasm such as Huangzao
4. Group 5, PB or Tem-tropic I, comprised 34 Chinese
inbred lines, most of which were related to US hybrid
P78599. Group 6 was PA heterotic group including 38
Chinese inbred lines derived from Ye478 and Shen5003.
Group 4 (named Tropics 1) contained 26 large grain borer
Table 2 PIC and gene diversity as revealed by selected subsets of
SNP markers and a subset of Chinese (temperate) maize germplasm
collection, compare to their entire counterparts
MAF Gene
diversity
Heterozygosity PIC
1,034 markers
Brazil 0.201 0.274 0.059 0.222
China-Entire set 0.257 0.343 0.038 0.274
China-Subset 0.256 0.340 0.037 0.272
CIMMYT 0.212 0.289 0.044 0.234
449 high-quality markers
Brazil 0.316 0.406 0.081 0.319
China-Entire set 0.350 0.435 0.041 0.338
China-Subset 0.343 0.429 0.040 0.334
CIMMYT 0.330 0.420 0.057 0.328
499 markers
Brazil 0.183 0.252 0.058 0.204
China-Entire set 0.203 0.283 0.033 0.231
China-Subset 0.202 0.281 0.032 0.229
CIMMYT 0.194 0.270 0.043 0.220
279 markers
Brazil 0.169 0.234 0.054 0.190
China-Entire set 0.188 0.261 0.032 0.214
China-Subset 0.187 0.258 0.030 0.211
CIMMYT 0.184 0.256 0.041 0.209
The 499 and 279 markers were selected from the 1,034 SNPs by
excluding markers that showed allelic frequency difference between
temperate and tropical/subtropical germplasm collections larger than
10 and 5%, respectively. The China-Subset is a subset of Chinese
maize inbred lines with landraces and high-oil inbred lines excluded.
The number of maize inbred lines included in each germplasm col-
lection: Brazil (94), China-Entire set (282), China-Subset (220), and
CIMMYT (394)
MAF Minor allele frequency
Theor Appl Genet (2009) 120:93–115 99
123

(LGB) resistant inbred lines bred by CIMMYT, Kenya.
Group 7, also called as Tropics 2, consisted of 21 tropical
inbred lines bred by CIMMYT, Zimbabwe. Group 8, Tropics
3, was the largest group, including 434 inbred lines, of which
330 were collected from CIMMYT, 92 from Brazil, and 12
from China. Out of the 12 Chinese inbred lines, four were
derived from CIMMYT germplasm, such as S37 and
SW1611, which are related to Suwan2 pedigree, and four
other lines adapted to tropical environment. In addition to the
inbred lines that were clearly assigned with probability
[0.60 to a single group (population), 81 inbred lines (10.5%
of the total) could not be clearly assigned to any of these
groups. These lines, which is called mixture group, include
63 from China, 16 from CIMMYT and two from Brazil. Most
of them are either derived from crosses between tropical and
temperate germplasm or derived from landraces. Out of two
lines from Brazilian collection, the w23 was derived from a
public temperate haploid inducer line W23 (Wisconsin 23)
and LPF9-01-2-1-1-1 is a subtropical line and adapted to the
south of Brazil. Inbred lines with proportional memberships
in the model-based groups are provided in Table S3.
Clustering analysis
In order to gain further insight into the genetic diversity
among different groups of the global maize collection, a
neighbor-joining tree based on Roger’s genetic distance
was constructed. The 770 tested lines were grouped into
two major groups (Fig. S2 for details; Fig. 3 for the
framework), which is consistent with structure analysis at
k = 2. In one major group, 270 Chinese lines, representing
temperate germplasm, were grouped along with 15 CI-
MMYT and 3 Brazilian lines. Four of the CIMMYT lines
in the group have some lines from old gene pools such as
EV7992, G16, and G27 in their pedigrees. One Brazilian
line, additional to the two lines to the mixture group, was
adapted to the subtropical region. The 270 Chinese lines in
this major group can be subdivided to five heterotic groups
such as Lancaster, SPT, PA, PB, and BSSS, which was
consistent with the result of structure analysis, plus an
additional group, called LRC, which included inbred lines
with Dan340 and Zi330 in their pedigrees and were
assigned to Lancaster group by structure analysis. The
clustering result is consistent with heterotic groups estab-
lished based on the pedigree information and combining
ability. Some inbred lines that were assigned to the mixed
group by structure analysis were also allotted to one of
these six groups (Fig. 3). The second major group, which
represents tropical/subtropical germplasm, comprised 482
inbred lines largely from CIMMYT and Brazil, and 7 of the
12 from China in this group with tropical backgrounds.
Unlike the first major group, these 482 lines cannot be
further distinguished well into subgroups that can be
explained based on their environmental adaptation, kernel
Fig. 2 Population structure in the 770 maize lines shown as
membership coefficients (Q values). Each horizontal bar represents
one maize line, which is partitioned into up to k colored segments.
Color codes are as follows: BSSS, red; Lancaster, green; SPT, blue;
Tropic 1, yellow; PB, purple red; PA, light blue; Tropic 2, orange;
Tropic 3, brown
100 Theor Appl Genet (2009) 120:93–115
123

Fig. 3 Neighbor-joining (NJ) tree for the 770 maize inbred lines
based on Roger’s genetic distance. A full NJ tree, sectional tree
representing Chinese germplasm, Brazilian germplasm, and PA and
PB heterotic group are shown from left to right. A version of this tree
with the names of the individual inbred lines can be found in Fig. S2
Theor Appl Genet (2009) 120:93–115 101
123

color, kernel texture, or heterotic response. However, out
of the 89 Brazilian yellow tropical inbred lines, 55 were
grouped separately from other tropical materials, and could
be clustered into four groups well assigned based on ped-
igree, kernel type and yield combining ability (Fig. 3).
Additionally, the lines closely related in pedigree usually
did cluster together.
Principal component analysis
Principal component analysis results showed good agreement
with both structure and cluster analyses. PCA on the entire set
of 770 inbred lines (Fig. 4a) exhibited a clear separation of
temperate and tropical/subtropical germplasms. Temperate
maize lines from China dispersed on the plot, compared to the
tropical/subtropical lines from CIMMYT and Brazil that
clustered around the original point of the plot with roughly
equal contribution by the first two principal components.
However, PCA did not separate germplasm well by kernel
color or texture (data not shown). PCA graph on CIMMYT
inbred lines (Fig. 4b) indicated that the first PC well separated
these lines into two groups. Group 1 included 26 LGB
resistant inbred lines from Kenya, which was fully consistent
with the Group 4 identified in structure analysis. These lines
can be traced back to a few genebank accessions from Cuban
and Guadalupe races (Cuban flint and coastal tropical flint).
The other group contains the rest of inbred lines from
CIMMYT. Brazilian inbred lines also were well divided into
two groups by the first PC, where Group 1 was composed by
flint lines essentially derived from L3, and Group 2 was
mainly represented by dent lines derived from L228-3, two
important inbred lines for Embrapa’s breeding program
(Fig. 4c). Chinese inbred lines were differentiated into four
distinct groups (Fig. 4d), including the three groups (PA, PB
and BSSS) that were consistent with cluster and structure
analysis, plus the fourth one that mixes two groups, Lancaster
and SPT, which were distinguishable by structure and clus-
tering analyses.
Genetic distances and allele differentiation among
germplasm groups
Genetic distances
Based on the comprehensive population structure analyses
above, genetic distances were calculated among seven
groups (Table 3). Two of the groups represented CIMMYT
and Brazilian collections; the other five are Chinese groups
that were identified in structure analysis. The largest
genetic distance was observed between temperate and
tropical/subtropical lines (Chinese vs. CIMMYT/Brazilian
lines), and the smallest between CIMMYT and Brazil
groups, both of which belong to tropical/subtropical lines
and the latter are largely developed using the former
germplasm. Interestingly, a high level of differentiation
was observed among the Chinese groups.
Fig. 4 Principal component analysis for the entire set of maize lines (temperate and tropical/subtropical lines) (a), CIMMYT inbred lines (b),
Brazilian inbred lines (c), and Chinese inbred lines (d)
102 Theor Appl Genet (2009) 120:93–115
123

Allele frequencies
To reveal genetic difference among different sets of maize
germplasm, comparative analysis of allele frequencies was
performed for three pairwise comparisons: temperate versus
tropical/subtropical lines, yellow versus white kernel (Sub-
set 1 in Table S1), and dent versus flint texture (Subset 2 in
Table S1). Of the 1,034 SNPs, a significant difference in
allele frequency (P \ 0.01) was observed for 779 (75%)
SNPs in the temperate versus tropical/subtropical lines, 643
(62%) SNPs in yellow versus white kernel, and 352 (34%)
SNPs in dent versus flint texture. Figure 5a shows a distri-
bution of allele frequency difference observed in the three
pairwise comparisons, ranging from 2.5 to 60%. In temperate
versus tropical/subtropical comparison, 535 (51.7%) SNPs
fell into the class with allele frequency difference larger than
10% (P \ 0.01). The most remarkable difference was 60%
at SNP PZA00416.7 for allele C (30% for temperate vs. 90%
for tropical/subtropical lines), with 19 SNP markers with
allele frequency difference larger than 40%. In yellow versus
white kernel comparison, 369 (35.7%) SNPs had significant
difference ([10%), with the largest difference of 36% at
PHM1899.157 for allele G (35% for yellow vs. 71% for
white lines) and 10 SNPs with allele frequency difference
larger than 30%. In dent versus flint texture comparison, 223
(21.6%) SNPs belonged to the class with a difference larger
than 10%, with the largest difference of 23% at SNP
PZA01316.1 for allele A (60% for dent vs. 83% for flint
texture) and 14 SNPs with allele frequency difference larger
than 20%. These results indicate distinct genetic differences
among the three pairwise germplasm comparisons and the
strongest differentiation was observed between temperate
and tropical/subtropical lines, the second between yellow
and white kernel, and the least between dent and flint texture
(see Fig. 5b for X–Y plots for allele frequencies in the pair-
wise comparisons). For the SNPs with extremely different
allelic frequencies between two germplasm collections or
groups, one of their alleles must be less frequent in one
collection while highly frequent in the other.
In order to distinguish different germplasm collections, ten
SNP markers with most significant allelic difference were
selected from each of six pairwise germplasm comparisons.
Three of the pairwise comparisons are for germplasm from
different collections (Table 4). The largest average allelic
frequency difference for the top ten differences was between
China and Brazil (0.55), followed by China versus CIMMYT
(0.50). The smallest allelic frequency difference was between
CIMMYT and Brazil (0.44). The three other pairwise com-
parisons are for germplasm of different types (Table 5). As
expected from genetic diversity analysis, the largest allelic
frequency difference was between temperate versus tropical/
subtropical lines with an average of 0.51 for the top ten
differences, followed by white versus yellow kernels (0.33).
The smallest allelic frequency difference was between dent
and flint textures (0.21).
To understand whether SNP alleles have been differenti-
ated between contrasting heterotic groups as the result of
selection for hybrid performance, two distinct groups deter-
mined by structure and PCA analyses, PA, and Lancaster,
were taken as an example. These two groups, which are
consistent with their heterotic groups, had a large genetic
distance (0.2889, Table 3) and were well separated in PCA
analyses (Fig. 4d). By comparing allele frequencies between
these two groups and with the entire set of Chinese germ-
plasm, 202 (19.5%) SNP markers were found to show allele
frequency differences larger than 50%. Thirty-eight of these
SNP markers showed allele frequency differences larger than
70% (Table 6). These differences are even much larger than
those between temperate and tropical/subtropical lines where
the largest allele frequency difference detected was 60%. For
each of these SNP markers, one heterotic group had a much
higher allelic frequency while the other had a much lower
allelic frequency than the entire Chinese collection, suggest-
ing a significant allele differentiation between two opposite
heterotic groups. Change of allele frequencies in opposite
directions at so many loci between heterotic groups indicates
that long-term selection for hybrid performance may have
resulted in allele differentiation that relates to the improved
hybrid performance.
There are several pairwise markers that were tightly
linked and showed the same tendency in the change of
allele frequencies between the two heterotic groups. For
example, two markers on chromosome 3 (67 bp apart),
PHM3352.19 and PHM3352.21, where were developed
from a unigene named PCO123854 (Zea mays PCO123854
mRNA sequence), both showed high allele A frequencies
Table 3 Genetic distances
between different groupsGroup Brazil BSSS CIMMYT Lancaster PA PB SPT
Brazil 0 0.3426 0.0686 0.1583 0.2906 0.2189 0.2096
BSSS – 0 0.3494 0.2893 0.2968 0.3344 0.3358
CIMMYT – – 0 0.1403 0.2898 0.2178 0.2026
Lancaster – – – 0 0.2889 0.2266 0.2143
PA – – – – 0 0.2619 0.3017
PB – – – – – 0 0.2504
SPT – – – – – – 0
Theor Appl Genet (2009) 120:93–115 103
123

in PA group (0.82 and 0.79) but low frequencies in
Lancaster group (0.06 and 0.05). Two markers on chro-
mosome 4, PZA03254.1 and PZA03587.1, tightly linked
(142 kb apart), showed similar allele frequency differences
(0.75 and 0.76) between the two heterotic groups.
To compare pairwise lines that are close to each other in
pedigree, the top ten pairs of inbred lines, each clustered
closely in the dendrogram, were selected for further anal-
ysis. The share allele frequency (SAF), the proportion of
alleles shared by two compared lines across all genotyped
marker loci, were calculated (Table 7). For each compar-
ison, a higher degree of genetic similarity (SAF) indicates a
smaller genetic difference. SAFs of 80% or higher were
detected across all comparisons with an average of 87.6%.
The most similar pairwise maize lines, Chang7-2 versus
CN_BI_10_03 [(Chang7-2 3 Huangzao4) 3 Chang7-
2BC4F2-24-33 L 3 24-33], shared alleles at 98.5% of
marker loci. These two maize lines had close relatedness as
Chang7-2 was the recurrent parent for the backcrossed
introgression line, CN_BI_10_03.
Missing and unique alleles in different germplasm
collections
There is only one missing allele identified in tropical/sub-
tropical germplasm (allele A at PHM1960.37, chromosome
3) but highly frequent (16.4%) in the temperate germplasm.
The same allele was also missing in CIMMYT germplasm
while it was frequently present in Chinese germplasm. On
the contrary, no allele was missing in the Chinese collec-
tion but frequently existing in the CIMMYT or Brazilian
collection. Compared with CIMMYT germplasm, Brazilian
Fig. 5 Differentiation of allele frequencies between maize germ-
plasm. a Difference in allele frequency between maize germplasm
collections: temperate versus tropical/subtropical lines, white versus
yellow kernels, and dent versus flint textures. b X–Y plots for allele
frequencies in pairwise comparisons of germplasm
104 Theor Appl Genet (2009) 120:93–115
123
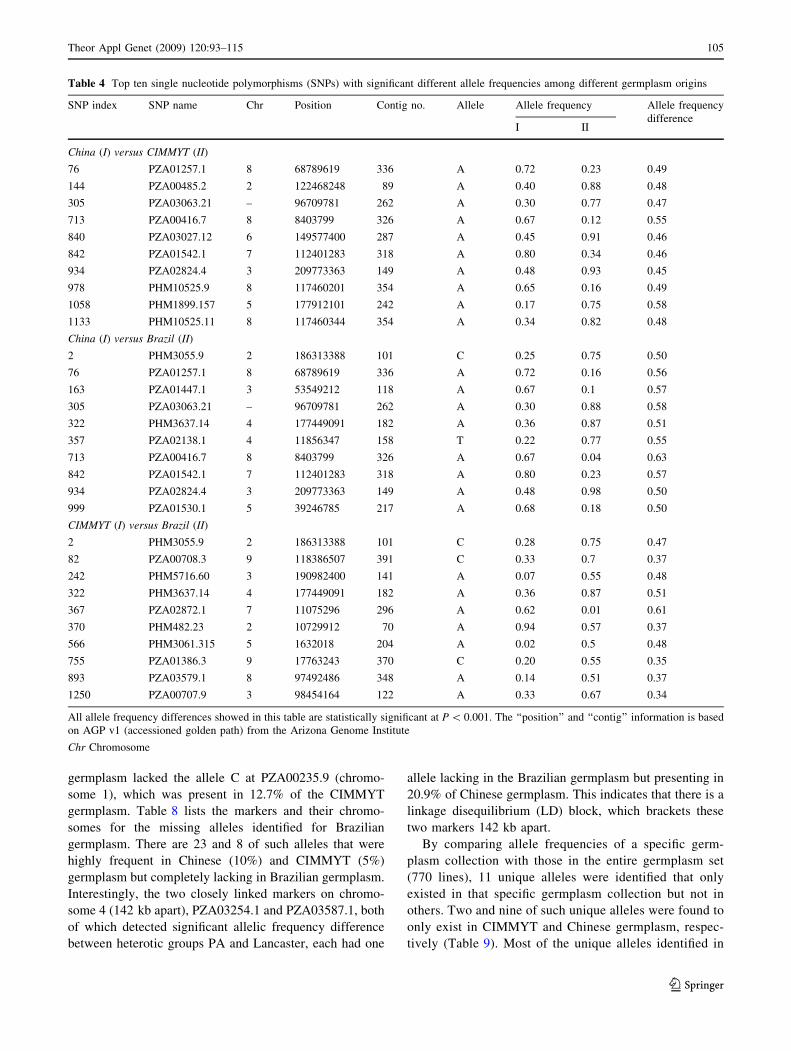
germplasm lacked the allele C at PZA00235.9 (chromo-
some 1), which was present in 12.7% of the CIMMYT
germplasm. Table 8 lists the markers and their chromo-
somes for the missing alleles identified for Brazilian
germplasm. There are 23 and 8 of such alleles that were
highly frequent in Chinese (10%) and CIMMYT (5%)
germplasm but completely lacking in Brazilian germplasm.
Interestingly, the two closely linked markers on chromo-
some 4 (142 kb apart), PZA03254.1 and PZA03587.1, both
of which detected significant allelic frequency difference
between heterotic groups PA and Lancaster, each had one
allele lacking in the Brazilian germplasm but presenting in
20.9% of Chinese germplasm. This indicates that there is a
linkage disequilibrium (LD) block, which brackets these
two markers 142 kb apart.
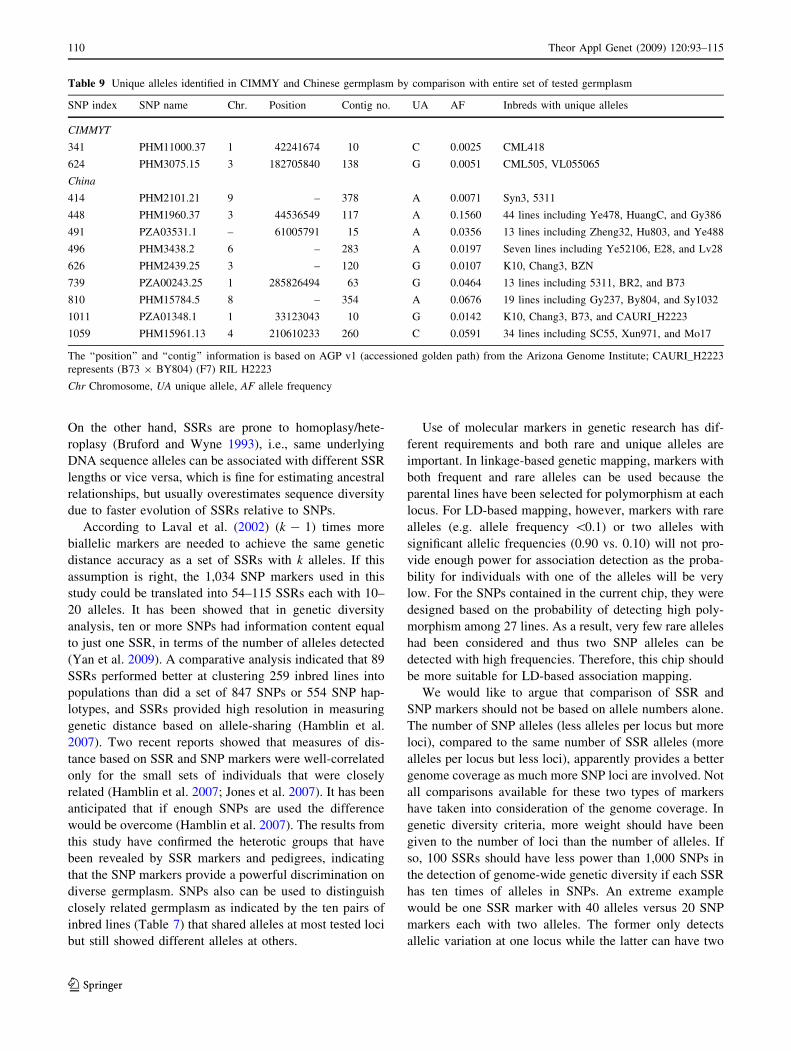
By comparing allele frequencies of a specific germ-
plasm collection with those in the entire germplasm set
(770 lines), 11 unique alleles were identified that only
existed in that specific germplasm collection but not in
others. Two and nine of such unique alleles were found to
only exist in CIMMYT and Chinese germplasm, respec-
tively (Table 9). Most of the unique alleles identified in
Table 4 Top ten single nucleotide polymorphisms (SNPs) with significant different allele frequencies among different germplasm origins
SNP index SNP name Chr Position Contig no. Allele Allele frequency Allele frequency
differenceI II
China (I) versus CIMMYT (II)
76 PZA01257.1 8 68789619 336 A 0.72 0.23 0.49
144 PZA00485.2 2 122468248 89 A 0.40 0.88 0.48
305 PZA03063.21 – 96709781 262 A 0.30 0.77 0.47
713 PZA00416.7 8 8403799 326 A 0.67 0.12 0.55
840 PZA03027.12 6 149577400 287 A 0.45 0.91 0.46
842 PZA01542.1 7 112401283 318 A 0.80 0.34 0.46
934 PZA02824.4 3 209773363 149 A 0.48 0.93 0.45
978 PHM10525.9 8 117460201 354 A 0.65 0.16 0.49
1058 PHM1899.157 5 177912101 242 A 0.17 0.75 0.58
1133 PHM10525.11 8 117460344 354 A 0.34 0.82 0.48
China (I) versus Brazil (II)
2 PHM3055.9 2 186313388 101 C 0.25 0.75 0.50
76 PZA01257.1 8 68789619 336 A 0.72 0.16 0.56
163 PZA01447.1 3 53549212 118 A 0.67 0.1 0.57
305 PZA03063.21 – 96709781 262 A 0.30 0.88 0.58
322 PHM3637.14 4 177449091 182 A 0.36 0.87 0.51
357 PZA02138.1 4 11856347 158 T 0.22 0.77 0.55
713 PZA00416.7 8 8403799 326 A 0.67 0.04 0.63
842 PZA01542.1 7 112401283 318 A 0.80 0.23 0.57
934 PZA02824.4 3 209773363 149 A 0.48 0.98 0.50
999 PZA01530.1 5 39246785 217 A 0.68 0.18 0.50
CIMMYT (I) versus Brazil (II)
2 PHM3055.9 2 186313388 101 C 0.28 0.75 0.47
82 PZA00708.3 9 118386507 391 C 0.33 0.7 0.37
242 PHM5716.60 3 190982400 141 A 0.07 0.55 0.48
322 PHM3637.14 4 177449091 182 A 0.36 0.87 0.51
367 PZA02872.1 7 11075296 296 A 0.62 0.01 0.61
370 PHM482.23 2 10729912 70 A 0.94 0.57 0.37
566 PHM3061.315 5 1632018 204 A 0.02 0.5 0.48
755 PZA01386.3 9 17763243 370 C 0.20 0.55 0.35
893 PZA03579.1 8 97492486 348 A 0.14 0.51 0.37
1250 PZA00707.9 3 98454164 122 A 0.33 0.67 0.34
All allele frequency differences showed in this table are statistically significant at P \ 0.001. The ‘‘position’’ and ‘‘contig’’ information is based
on AGP v1 (accessioned golden path) from the Arizona Genome Institute
Chr Chromosome
Theor Appl Genet (2009) 120:93–115 105
123

Chinese germplasm came from landraces, high-oil maize
lines, introduced maize lines including B73 and Mo17,
and parental lines for three recombinant inbred line (RIL)
populations. Thirteen landraces hosted five of the nine
unique alleles. B73 and its two RIL populations hosted
four alleles. Ye478 and its backcross introgression lines
hosted the unique allele A at PHM1960.37. The markers
that had significant allelic frequency difference among
germplasm collections and missing or unique alleles
identified above can be combined and used for charac-
terization of maize germplasm.
Discussion
Utilization of the random-gene SNP chip developed for
the nested association mapping
In the present study, we have shown that a 1,536-random
SNP GoldenGate assay can be used successfully for maize
genotyping. A total of 1,034 SNPs involving 4 base
changes were obtained with high polymorphism and
good quality as revealed by 770 diverse maize lines.
These markers were well distributed on the ten maize
Table 5 Top ten single nucleotide polymorphisms (SNPs) with significantly different allele frequencies among different germplasm collections:
temperate versus tropical/subtropical lines, white versus yellow kernels, and dent versus flint textures
SNP index SNP name Chr. Position Contig no. Allele Allele frequency Allele frequency
differenceI II
Tropical/subtropical (I) versus temperate (II)
76 PZA01257.1 8 68789619 336 G 0.77 0.27 0.50
144 PZA00485.2 2 122468248 89 A 0.88 0.38 0.50
305 PZA03063.21 – 96709781 262 A 0.79 0.28 0.51
713 PZA00416.7 8 8403799 326 A 0.90 0.30 0.60
840 PZA03027.12 6 149577400 287 A 0.90 0.43 0.47
842 PZA01542.1 7 112401283 318 G 0.68 0.18 0.50
934 PZA02824.4 3 209773363 149 A 0.93 0.46 0.47
978 PHM10525.9 8 117460201 354 C 0.82 0.34 0.48
1058 PHM1899.157 5 177912101 242 A 0.73 0.15 0.58
1133 PHM10525.11 8 117460344 354 A 0.79 0.33 0.46
White (I) versus yellow (II)
82 PZA00708.3 9 118386507 391 C 0.36 0.71 0.35
144 PZA00485.2 2 122468248 89 A 0.88 0.54 0.34
370 PHM482.23 2 10729912 70 A 0.96 0.64 0.32
713 PZA00416.7 8 8403799 326 A 0.15 0.45 0.30
755 PZA01386.3 9 17763243 370 C 0.18 0.51 0.33
840 PZA03027.12 6 149577400 287 A 0.91 0.58 0.33
978 PHM10525.9 8 117460201 354 A 0.18 0.52 0.34
1058 PHM1899.157 5 177912101 242 A 0.71 0.35 0.36
1131 PHM1911.173 9 – 391 A 0.19 0.49 0.30
1133 PHM10525.11 8 117460344 354 A 0.79 0.46 0.33
Dent (I) versus flint (II)
117 PZA03226.3 1 20089786 151 A 0.34 0.13 0.21
333 PZA01316.1 8 164369621 363 A 0.60 0.83 0.23
342 PZA00309.1 1 154683544 111 A 0.55 0.76 0.21
370 PHM482.23 2 10729912 70 A 0.62 0.84 0.22
533 PHM3312.23 8 163179300 366 A 0.23 0.45 0.22
825 PZA01468.1 6 161663856 287 A 0.48 0.27 0.21
827 PZA01477.3 4 170447971 182 A 0.60 0.39 0.21
1052 PZA00111.10 7 116158434 320 A 0.57 0.36 0.21
1140 PZB01899.1 9 98502979 376 A 0.51 0.31 0.20
1434 PHM3626.3 2 127453900 89 A 0.65 0.44 0.21
The ‘‘position’’ and ‘‘contig’’ information is based on AGP v1 (accessioned golden path) from the Arizona Genome Institute
Chr Chromosome
106 Theor Appl Genet (2009) 120:93–115
123

chromosomes, and average distance between two SNPs
reached a level of 1 cM in an integrated NAM map
(McMullen et al. 2009). These SNPs were originally
developed for detection of as much as possible the genetic
polymorphisms in 27 diverse inbred maize lines that
were used as parental genotypes to develop the NAM
population. The common parent, B73, is a temperate maize
inbred line while the 26 other parents were selected to
represent genetic diversity in both temperate and tropical/
subtropical maize germplasm (Yu et al. 2008). Markers
developed to be polymorphic in one set of germplasm are
likely to provide a biased estimate of diversity in another
Table 6 Allele frequencies in the PA and Lancaster group by comparison with the entire set of germplasm from China
SNP index SNP name Chr. Position Contig no. Allele Allele frequency Allele frequency
difference between
PA and LancasterPA China Lan
41 PHM5337.18 5 179310669 242 A 0.95 0.28 0.13 0.82
196 PZA00079.1 10 16951310 395 A 0.76 0.19 0.05 0.71
201 PZB00761.1 9 83959488 376 A 0.14 0.67 0.88 0.74
393 PZD00036.2 9 12264834 368 A 0.08 0.45 0.81 0.73
417 PZA03254.1 4 60073257 166 A 0.16 0.80 0.91 0.75
432 PHM2100.21 4 248719621 201 C 0.20 0.82 0.97 0.77
448 PHM1960.37 3 44536549 117 A 0.79 0.16 0.08 0.71
457 PHM3352.21 3 201420754 145 A 0.79 0.17 0.05 0.74
462 PZA00498.5 8 37058618 332 A 0.92 0.52 0.17 0.75
502 PHM3352.19 3 201420687 145 A 0.82 0.18 0.06 0.76
504 PHM3925.79 9 9374197 368 A 0.89 0.19 0.03 0.86
569 PZA00006.17 6 73591470 271 A 0.13 0.68 0.84 0.71
598 PHM1511.14 2 1845018 68 A 0.90 0.49 0.16 0.74
612 PHM3402.11 5 49984090 219 A 0.13 0.72 0.84 0.71
736 PZB01009.2 6 72952742 271 A 0.13 0.75 0.92 0.79
744 PZA01857.1 8 – 360 A 0.96 0.42 0.25 0.71
748 PZA01677.1 10 53695768 401 A 0.79 0.20 0.05 0.74
826 PHM3465.6 8 152388044 362 A 0.82 0.20 0.09 0.73
1027 PZA02111.1 9 101268673 387 A 0.83 0.30 0.08 0.75
1107 PZA02397.1 4 215586787 – C 0.09 0.73 0.96 0.87
1124 PZA02281.3 8 164193650 366 A 0.85 0.24 0.03 0.82
1125 PHM4353.31 7 35224569 300 A 0.05 0.48 0.76 0.71
1126 PZA02550.1 1 54135653 14 A 0.84 0.31 0.1 0.74
1168 PZB02122.1 3 138851210 128 A 0.14 0.71 0.89 0.75
1176 PZA00323.3 9 113713613 390 A 0.09 0.61 0.94 0.85
1222 PZA01819.1 9 89749789 384 A 0.90 0.31 0.16 0.74
1228 PZA00068.1 1 63972739 15 A 0.08 0.58 0.8 0.72
1262 PZA03587.1 4 60215739 166 A 0.84 0.21 0.08 0.76
1263 PZA00213.19 9 97742962 385 C 0.11 0.7 0.88 0.77
1348 PZA03659.1 2 168368135 95 A 0.87 0.32 0.16 0.71
1379 PZA01601.1 8 8759497 326 A 0.03 0.71 0.83 0.80
1396 PZA00225.8 9 76317829 380 A 0.07 0.59 0.82 0.75
1425 PZA02853.11 10 28852833 397 C 0.22 0.83 0.98 0.75
1451 PHM14046.9 8 161714993 364 C 0.21 0.75 0.92 0.71
1483 PZA00363.7 3 120532125 124 A 1.00 0.61 0.29 0.71
1505 PZA02012.7 2 218280369 108 A 0.82 0.20 0.02 0.80
1507 PZA00067.10 5 144565163 234 A 0.07 0.76 0.89 0.82
1508 PZA02141.1 6 157791306 289 A 0.93 0.30 0.10 0.83
The ‘‘position’’ and ‘‘contig’’ information is based on AGP v1 (accessioned golden path) from the Arizona Genome Institute
Chr Chromosome, Lan Lancaster
Theor Appl Genet (2009) 120:93–115 107
123

set of germplasm, which is called ‘ascertainment bias.’ The
number of SNP alleles unique to the ascertained groups
would be the indication of the degree of bias. Our results
indicate that the bias, if exists, could be tolerable, as unique
alleles could be identified from CIMMYT germplasm and
most unique alleles in Chinese germplasm were from
landraces, high-oil maize lines and introduced lines.
To test if the chip developed for the NAM population
has any preference in revealing genetic diversity, we
developed the subsets of SNPs after removal of those
showing high allelic frequency difference between tem-
perate and tropical/subtropical germplasm collections. The
level of genetic diversity in temperate germplasm has been
significantly reduced compared to only a small reduction
for tropical/subtropical germplasm, indicating that the
preference of this SNP chip to temperate germplasm can
be corrected to some extent by removing the prefer-
ence markers. With the possibility of bias, however, only
way to fully remove the bias is to use unbiased method-
ology, such as de novo sequencing of loci from all germ-
plasm groups.
Selection for better polymorphism between temperate
and temperate or tropical/subtropical germplasm provides
some advantages for this random gene-based chip in
genetics and breeding applications. Because of the prefer-
ence, this SNP chip should be more powerful for genetic
diversity analysis of temperate germplasm, and it will
distinguish temperate germplasm from each other better
than tropical/subtropical germplasm. Furthermore, the chip
can be used for, with limited or no negative influence at all
on, the rest of analyses that have been done in this study
including grouping via STRUCTURE, clustering, and PCA
analyses. For allelic frequency analyses, however, this chip
actually provides more opportunities of finding missing and
unique alleles from comparison of germplasm collections.
Information on the allelic frequencies of the SNP
markers contained in this SNP chip in a large number of
maize germplasm should help determining the usefulness
of this OPA for analysis of a broader range of maize
germplasm. The 770 inbred lines used in this study is the
largest set of inbred lines that have been tested so far to
cover diverse temperate and tropical/subtropical maize
germplasm including different kernel color and textures.
The results provide a robust test of the suitability of this
SNP chip for genetics and breeding applications. Based
on three criteria, designability scores above 0.6, MAF
exceeding 0.2, and PIC values larger than 0.25, 449 high-
quality SNP markers were selected (Table S2 Subset A).
This subset of markers has been proven the best in terms
of the estimation of PIC and gene diversity and the
detection of genetic diversity with least preference to
temperate germplasm, compared to other subsets selected
based on the allelic frequency differences alone. We
recommend this subset of SNPs for use in genetics and
breeding as well as for the development of new SNP
chips with optimized allele frequency and simplification
of the cumbersome manual scoring process by automated
scoring.
Table 7 Comparison of pairwise lines that are genetically close to each other
Pairwise inbreds Number of
SNPs that have
same alleles
Number
of SNPs
Share allele
frequency (%)
Relatedness
(pedigree and genetic
cause for close clustering)
CN_BI_10_03 versus Chang7-2 1,008 1,023 98.5 Chang7-2 was the recurrent parent of the
backcrossed introgression line, CN_BI_10_03
Zi330 versus Si446 937 1,010 92.8 Si446 derived from hybrid Qu43 9 Zi330
L1-2-3 versus L1-2-1 926 1,017 91.1 They were derived from the same synthetics and
selected under drought conditions
CML120 versus CML119 925 1,021 90.6 They were developed by selfing from the same
DeKalb commercial maize hybrid B807
CMT_L166 versus CMT_L154 834 973 85.7 They are sister lines sharing the source line for
LGB resistance as well as Kilima
CNRI3_2223 versus CNRI3_2106 875 1,029 85.0 Two sister lines developed from an identical
cross
Mo17 versus Ji842 840 1,006 83.5 Ji842 derived from hybrid Ji63 9 Mo17
VL058553 versus VL058454 856 1,027 83.3 They were selected from the same OPV NIP25
P1 versus CMTRI1_176 829 997 83.1 CMTRI1_176 developed from P1
Q1261 versus K12 835 1,016 82.2 Q1261 improved from K12
CN_BI_10_03: (Chang7-2 9 Huangzao4) 9 Chang7-2BC4F2-24-33 Lx24-33; CMT_L166: [CUBA/GUAD C1 F27-4-3-3-B-1-Bx(KILIMA
ST94A)-30/MSV-03-2-10-B-2-B–B]-342-1-B-2-B; CMT_L154: [CUBA/GUAD C1 F27-4-3-3-B-1-Bx(KILIMA ST94A)-30/MSV-03-2-10-B-
2-B–B]-160-1-B-6-B; CNRI3_2223: (B73 9 BY804) (F7) RIL H2223; CNRI3_2106: (B73 9 BY804) (F7) RIL H2106; CMTRI1_176:
(P1 9 P2) C5 RIL176
108 Theor Appl Genet (2009) 120:93–115
123

SNP versus SSR markers for genetic diversity
and genetic analyses
Single nucleotide polymorphism markers occur at much
higher density in the genome (Zhu et al. 2003). In maize,
there is a SNP every 60–104 bp (Ching et al. 2002; Tenaillon
et al. 2001). SNPs are amenable to high-throughput methods
such as genotyping arrays, and have lower genotyping error
rates (Fan et al. 2006; Gupta et al. 2008). On the other hand,
SNPs are distributed in the whole genome (either intergenic
or intragenic). Compared to SSR, SNP markers could be
more functional-related.
Simple sequence repeats being multi-allelic markers can
provide many times the numbers of alleles per locus
because of high mutational rate and a virtually unlimited
number of new alleles that can be created by the slippage
process. However, one important factor that has been
neglected is that it is very difficult to distinguish real SSR
alleles from those created by error scoring, artifact bands,
and false alleles because of the difficulty in comparing
cross-lab or experiment scores, which could have contrib-
uted greatly to the number of ‘alleles’ detected at a SSR
locus, particularly when the number of alleles is large and
the repeat length difference between two alleles is small.
Table 8 Markers with missing alleles identified in Brazilian collection compared with Chinese and CIMMYT germplasm collections
SNP index SNP name Chr. Position Contig no. Missing allele
in Brazil
Allele frequency
in counterpart
Brazil versus China
39 PZA03728.1 7 119508717 320 G 0.192
88 PZA02992.15 4 149588916 246 A 0.177
103 PZA00466.1 9 17495764 370 A 0.299
217 PZA03491.1 2 78899925 84 A 0.208
302 PHM4285.20 7 Unknown 299 C 0.124
306 PHM4604.18 9 114036547 390 A 0.228
337 PZA01144.1 6 140593030 285 G 0.247
383 PZA02044.1 1 280861208 63 G 0.208
417 PZA03254.1 4 60073257 166 G 0.209
448 PHM1960.37 3 44536549 117 A 0.156
631 PHM12633.15 1 101630891 27 C 0.207
684 PZA01028.2 7 146408615 325 G 0.209
748 PZA01677.1 10 53695768 401 A 0.199
864 PZA00255.14 5 169416706 238 G 0.309
903 PZA01135.1 1 80364339 20 G 0.314
972 PZA01736.1 6 110678883 281 A 0.187
1039 PZA02095.10 10 5118786 392 A 0.188
1040 PZA02426.1 5 191642344 247 A 0.152
1046 PHM14235.16 4 3489080 155 A 0.173
1100 PZA03465.1 1 87872265 23 C 0.233
1185 PZA00693.3 9 33802059 373 G 0.114
1234 PZA00382.17 6 111308412 281 G 0.139
1262 PZA03587.1 4 60215739 166 A 0.209
Brazil versus CIMMYT
39 PZA03728.1 7 119508717 246 G 0.080
383 PZA02044.1 1 280861208 285 G 0.056
392 PHM2501.24 3 113064730 370 G 0.074
561 PZA02471.5 2 214640786 299 A 0.064
684 PZA01028.2 7 146408615 84 G 0.065
864 PZA00255.14 5 169416706 390 G 0.063
878 PZA00235.9 1 282879776 320 C 0.127
1388 PZA01360.3 3 212481614 63 T 0.050
The ‘‘position’’ and ‘‘contig’’ information is based on AGP v1 (accessioned golden path) from the Arizona Genome Institute
Chr Chromosome
Theor Appl Genet (2009) 120:93–115 109
123
On the other hand, SSRs are prone to homoplasy/hete-
roplasy (Bruford and Wyne 1993), i.e., same underlying
DNA sequence alleles can be associated with different SSR
lengths or vice versa, which is fine for estimating ancestral
relationships, but usually overestimates sequence diversity
due to faster evolution of SSRs relative to SNPs.
According to Laval et al. (2002) (k - 1) times more
biallelic markers are needed to achieve the same genetic
distance accuracy as a set of SSRs with k alleles. If this
assumption is right, the 1,034 SNP markers used in this
study could be translated into 54–115 SSRs each with 10–
20 alleles. It has been showed that in genetic diversity
analysis, ten or more SNPs had information content equal
to just one SSR, in terms of the number of alleles detected
(Yan et al. 2009). A comparative analysis indicated that 89
SSRs performed better at clustering 259 inbred lines into
populations than did a set of 847 SNPs or 554 SNP hap-
lotypes, and SSRs provided high resolution in measuring
genetic distance based on allele-sharing (Hamblin et al.
2007). Two recent reports showed that measures of dis-
tance based on SSR and SNP markers were well-correlated
only for the small sets of individuals that were closely
related (Hamblin et al. 2007; Jones et al. 2007). It has been
anticipated that if enough SNPs are used the difference
would be overcome (Hamblin et al. 2007). The results from
this study have confirmed the heterotic groups that have
been revealed by SSR markers and pedigrees, indicating
that the SNP markers provide a powerful discrimination on
diverse germplasm. SNPs also can be used to distinguish
closely related germplasm as indicated by the ten pairs of
inbred lines (Table 7) that shared alleles at most tested loci
but still showed different alleles at others.
Use of molecular markers in genetic research has dif-
ferent requirements and both rare and unique alleles are
important. In linkage-based genetic mapping, markers with
both frequent and rare alleles can be used because the
parental lines have been selected for polymorphism at each
locus. For LD-based mapping, however, markers with rare
alleles (e.g. allele frequency \0.1) or two alleles with
significant allelic frequencies (0.90 vs. 0.10) will not pro-
vide enough power for association detection as the proba-
bility for individuals with one of the alleles will be very
low. For the SNPs contained in the current chip, they were
designed based on the probability of detecting high poly-
morphism among 27 lines. As a result, very few rare alleles
had been considered and thus two SNP alleles can be
detected with high frequencies. Therefore, this chip should
be more suitable for LD-based association mapping.
We would like to argue that comparison of SSR and
SNP markers should not be based on allele numbers alone.
The number of SNP alleles (less alleles per locus but more
loci), compared to the same number of SSR alleles (more
alleles per locus but less loci), apparently provides a better
genome coverage as much more SNP loci are involved. Not
all comparisons available for these two types of markers
have taken into consideration of the genome coverage. In
genetic diversity criteria, more weight should have been
given to the number of loci than the number of alleles. If
so, 100 SSRs should have less power than 1,000 SNPs in
the detection of genome-wide genetic diversity if each SSR
has ten times of alleles in SNPs. An extreme example
would be one SSR marker with 40 alleles versus 20 SNP
markers each with two alleles. The former only detects
allelic variation at one locus while the latter can have two
Table 9 Unique alleles identified in CIMMY and Chinese germplasm by comparison with entire set of tested germplasm
SNP index SNP name Chr. Position Contig no. UA AF Inbreds with unique alleles
CIMMYT
341 PHM11000.37 1 42241674 10 C 0.0025 CML418
624 PHM3075.15 3 182705840 138 G 0.0051 CML505, VL055065
China
414 PHM2101.21 9 – 378 A 0.0071 Syn3, 5311
448 PHM1960.37 3 44536549 117 A 0.1560 44 lines including Ye478, HuangC, and Gy386
491 PZA03531.1 – 61005791 15 A 0.0356 13 lines including Zheng32, Hu803, and Ye488
496 PHM3438.2 6 – 283 A 0.0197 Seven lines including Ye52106, E28, and Lv28
626 PHM2439.25 3 – 120 G 0.0107 K10, Chang3, BZN
739 PZA00243.25 1 285826494 63 G 0.0464 13 lines including 5311, BR2, and B73
810 PHM15784.5 8 – 354 A 0.0676 19 lines including Gy237, By804, and Sy1032
1011 PZA01348.1 1 33123043 10 G 0.0142 K10, Chang3, B73, and CAURI_H2223
1059 PHM15961.13 4 210610233 260 C 0.0591 34 lines including SC55, Xun971, and Mo17
The ‘‘position’’ and ‘‘contig’’ information is based on AGP v1 (accessioned golden path) from the Arizona Genome Institute; CAURI_H2223
represents (B73 9 BY804) (F7) RIL H2223
Chr Chromosome, UA unique allele, AF allele frequency
110 Theor Appl Genet (2009) 120:93–115
123

loci on each maize chromosome detecting 20 loci and their
interlocus variation. On the other hand, when more SNP
markers are used (than the number used in this study), the
reliability of SNP analysis would increase. For example,
Yu et al. (2009) revealed that kinship estimation was more
sensitive to the number of markers used than population
structure estimation in terms of model fitting. In our study,
1,034 informative SNP markers provide heterotic groups
completely consistent with those determined based on
pedigree and combining ability and the results from SSR-
based grouping, indicating the efficiency and power of SNP
markers in genetic diversity analysis.
Impacts of selection and breeding history on genetic
diversity and germplasm grouping
Genetic diversity in maize as in other crops has been
reduced during domestication (Doebley et al. 1984; Hilton
and Gaut 1998; Vigouroux et al. 2005). Maize contains
75% of the variation found in its progenitor (Z. mays ssp.
parviglumis) (Eyre-Walker et al. 1998). For SSR, maize
has 88% of the gene diversity and 76% of the number of
alleles found in teosinte (Vigouroux et al. 2005). A genetic
bottleneck during the domestication of maize as well as
ongoing selection by breeders is expected to result in
diversity reduction across the whole genome as well as
selected loci (Rafalski and Ananiev 2009). At the maize Y1
gene, selection for the yellow endosperm phenotype pre-
ferred in some markers resulted in [10-fold reduction of
diversity (Palaisa et al. 2003). The effect of this selective
sweep extends to several hundred kilobytes (Palaisa et al.
2004). Reduction of diversity and other effects indicative
of selection has also been observed in the starch pathway
(Whitt et al. 2002) and in the anthocyanin regulatory locus
c1 (Hanson et al. 1996). By survey of over 1,000 genes,
eight of them were identified showing evidence of selection
with strongly reduced diversity (Yamasaki et al. 2005).
However, a recent study showed that variation might not be
declining in global maize germplasm (Warburton et al.
2008). Globally, maize germplasm are being mixed up
more and as a result, population differentiation is declining
but overall diversity is being maintained because of the
mixing. With high throughput sequencing or chip technology,
scanning of all maize genes will allow identification of a more
complete set of genes under natural and artificial selection,
with which selective diversity enhancement by introgressions
from other germplasm collections, landraces or even teosinte,
would become possible.
Pedigree and molecular marker information showed that
changes in genetic diversity had occurred during each
decade for a set of maize hybrids that were widely grown in
the central US Corn Belt. For Pioneer brand hybrids widely
grown from 1930 to 1999 contributions from some
founders has risen, then fallen; some were low and disap-
peared, while others reappeared; and contributions from
others persisted at low levels (Smith et al. 2004). By the
1980s, contributions from 26% of both founders and
landraces had become extinct. When older (1930s
and 1940s) hybrids were compared with recent (1990s and
2000s) hybrids, SSR alleles showed large qualitative and
quantitative differences (Feng et al. 2006). For example,
23% of SSR alleles were found only in the older hybrids,
while 30% of SSR alleles were found only in the recent
hybrids. Duvick et al. (2004) showed that the allele num-
bers reached the highest during 1960s and has since
declined in recent era hybrids. On the other hand, efforts
directed at increasing heterotic yield have increased genetic
distance between two heterotic groups (Cooper et al. 2004;
Tracy and Chandler 2006). Allele frequencies at many loci
have changed in opposite directions in different heterotic
groups such as Stiff Stalk Synthetic (SSS) and Non-Stiff
Stalk (NSS). SSR data also supplied evidence that diver-
gent artificial selection on flowering time may have played
a role in generating population structure (Remington et al.
2001). Our results indicate that two major Chinese heter-
otic groups, PA and Lancaster, showed allele frequency
difference of over 70% at 38 SNP loci. This effect deepens
the non-random population structure of maize germplasm
collection (Rafalski and Ananiev 2009). In China, the Reid
germplasm were introduced from the US during 1950–
1970s and Lancaster germplasm, such as Mo17, were
introduced from the US in 1970s. Those US Corn Belt
germplasm have played an important role in Chinese
hybrid maize breeding with many inbred lines developed.
In addition, Pioneer hybrids were introduced into China in
the late 1980s, with a new group of inbreds bred that was
defined as ‘‘P’’ or Tem-tropic I. Introduction of these
germplasm and development of new lines from them have
significantly enhanced Chinese maize germplasm bases
and also increased the differentiation from opposite heter-
otic groups.
The majority of Brazilian tropical inbred lines tested in
this study were clustered into four heterotic groups,
including two dent and two flint lines, as predicted based
on yield combining ability (Parentoni et al. 2001). The
major flint group, which is coincident with the heterotic
group 4, comprises 18 lines, 17 of which are related to the
flint heterotic pattern and were derived from L3. The sec-
ond flint cluster, which is comparable to the Brazilian
heterotic group 2, includes eight flint lines, one dent line
and one line with unknown origin, most of which were
derived from Swan-1 germplasm. The third group was
represented by the dent heterotic group related to the L228-
3. For the 21 inbred lines in this group, only one was in
disagreement with its origin. This group was mainly
derived from Tuxpeno germplasm, which was described as
Theor Appl Genet (2009) 120:93–115 111
123

Brazilian heterotic group 1 (Parentoni et al. 2001). The
second dent cluster comprises seven dent lines and one line
with unknown origin from Brazil, one from CIMMYT and
two from China. The clustering improved the genetic
diversity resolution compared with PCA. However, the
heterotic group defined by PCA was the major source for
hybrid development from Embrapa.
Some CIMMYT lines developed recently can be
grouped into two major heterotic groups, A and B, by
breeders using well-known heterotic testers. However,
CIMMYT maize lines tested in this study could not be
divided into groups with significant genetic difference,
although 394 maize lines from CIMMYT global maize
breeding programs were tested. This confirms the previous
reports that no clear clustering or heterotic patterns could
be identified in either lowland tropical maize (Xia et al.
2004) or subtropical, tropical midaltitude and highland
maize populations (Xia et al. 2005). Other studies of
tropical maize, which were considered extremely diverse,
have found that SSR variation does not provide evidence of
population structure other than among individuals closely
related by pedigree (Warburton et al. 2002, 2005). It has
been suggested that relatedness among highly diverged
maize lines is difficult to measure accurately regardless of
the marker system (Hamblin et al. 2007). In this study,
however, most CIMMYT inbred lines tested are elite
germplasm and they are not so diverse compared to Chi-
nese temperate germplasm that has been clearly grouped
consistently with their heterotic patterns. Therefore, that
there was no evidence for distinct population structure
within CIMMYT inbred lines may not matter with the level
of genetic diversity but with breeding history. These may
be explained by the mixed origin of the populations used to
extract those lines and the breeding program that initially
emphasized developing germplasm with a wide genetic
base (for creation of OPVs) and only has begun to develop
heterotic groups since early 1990s. On the other hand, the
CIMMYT heterotic groups are not created the same way as
the temperate heterotic groups. Temperate lines are bred to
be heterotic among groups while CIMMYT lines are tested
after breeding and are usually assigned to a heterotic pat-
tern with specific other inbreds. CIMMYT inbred lines
have been developed frequently by incorporating genetic
diversity mainly existing in Latin American (Mexican,
Central American, and Caribbean, and southern cone
countries) and Asia, US and European germplasm as well.
Although CIMMYT maize lines cannot be grouped as
different heterotic groups, they can be used as one of the
parents to be crossed with other maize lines developed
outside CIMMYT to produce hybrids with good yield
potential. CIMMYT lines can be also used as a gene pool
for mixed novel and unique alleles. This has been sup-
ported by this study that the genetic distance between
CIMMYT lines and Chinese BSSS group examined was
the largest among all comparisons. However, in the long
run, CIMMYT breeding programs should pay more atten-
tion to heterotic pattern establishment so that high-perfor-
mance hybrids can be produced using two CIMMYT lines
as parents. For this purpose, a well-designed study should
be conducted for a systematic survey for heterotic patterns
and classify them based on both molecular markers and
their combining ability and pedigree. Differentiation
among CIMMYT maize lines should be increased so that
heterotic patterns can become distinct, as more effort in
breeding is put into selection for better hybrid performance.
This prediction has been supported by Pioneer’s long-term
selection for heterotic patterns in its breeding program
which resulted in significant increase of genetic diversity
between heterotic groups (Cooper et al. 2004).
SNP-marker assisted germplasm evaluation
As indicated by Mikel and Dudley (2006) and concurred by
Smith (2007) that regular assays of genetic diversity of
maize hybrids are necessary and that the diversity of maize
germplasm needs to be broadened, marker-assisted germ-
plasm evaluation will play an important role in worldwide
maize genetics studies and plant breeding. The required
resolution in germplasm evaluation depends on research
objectives. Genetic studies are more interesting in under-
standing of population structure, while breeding studies
have their focus on heterotic grouping. In genetic analysis,
the major objective of classification, for example, is to
precisely evaluate the genetic relationship among tested
individuals and then use this information in other genetic
analyses, and thus a refined or high-resolution classification
is required. In plant breeding, however, the major objective
is to evaluate combining ability and construct heterotic
groups and thus, only a rough-scale of classification is
required.
The relationship of genetic diversity with the location of
maize origin can be predicted but has not been fully proved
in this study as we found that Chinese temperate maize
germplasm have a (or even slight higher) level of genetic
diversity compared to the tropical/subtropical lines devel-
oped by CIMMYT, although CIMMYT maize breeding
programs have been based on the germplasm sources col-
lected from its host country, Mexico, which is the center of
origin for maize. This indicates that CIMMYT maize
breeding might have used only a part of genetic diversity
existing in Mexican maize germplasm while much of
genetic diversity hidden in Mexican landraces has not been
tapped into for breeding modern maize lines. This also
indicates that elite maize inbreds developed by using
genetic diversity available from the center of origin does
not necessarily have to be more diverse compared to those
112 Theor Appl Genet (2009) 120:93–115
123

developed by the breeding programs located in non-center
countries. In this study, the greatest extent of genetic
divergence was identified between temperate and tropical/
subtropical germplasm, compared to those between yellow
and white kernels and between dent and flint textures. Over
75% of the SNP markers showed significant allele fre-
quency difference between temperate and tropical/sub-
tropical germplasm, and eight and five alleles were found
to exclusively exist in temperate and tropical/subtropical
germplasm, respectively, if all rare alleles are considered.
This indicates that there is a great potential for breeding
programs with focus on one type of germplasm by utilizing
genetic variation in another.
Germplasm that host rare and unique alleles provide an
opportunity of using these alleles in genetics studies and
plant breeding. Search for such alleles have been reported
in other crops including rice (Xu et al. 2004). However, the
availability of similar information in maize is limited. In
this report, we identified many alleles that have signifi-
cantly different allelic frequencies among different maize
germplasm, and many alleles that are highly frequent in
one specific germplasm collection but are lacking or rare in
others. These alleles can be first used to distinguish dif-
ferent germplasm collections. Second, markers hosting
these alleles can be exploited for candidate gene discovery
and function characterization using the sequence informa-
tion and the associated phenotypic difference. Third,
germplasm containing these alleles can be used for plant
breeding if association between these alleles and pheno-
typic traits can be validated.
As SNPs can be developed from both intergenic and
intragenic, allele mining can be combined with functional
diversity analysis. Gene-based markers can be directly
associated with the genetic difference identified in segre-
gating populations or a panel of diverse lines used in LD-
based association mapping. We found that two SNPs
developed from the same candidate gene associated with
divergence of two opposite heterotic groups, PA and
Lancaster. Two other SNPs within a LD block of 142 kb
were found to be associated with allele frequency change
and allele missing in Brazilian germplasm. Methods to
ascertain allele function include marker-assisted back-
crossing, genetic transformation, transient expression
assays, and association analysis using an independent set of
germplasm from that used to identify the allele. As more
genetic variation is functionally validated, the next big step
in this area is the development of bioinformatics tools to
compare sequence variation with protein and functional
domain variation or with public databases including asso-
ciated phenotype data, in order to predict which sub-
selections of SNP haplotype variants have the maximum
likelihood of providing beneficial phenotypic variation in
the target trait (Xu et al. 2009). It is likely that SNPs in
promoter and non-coding regions will also be important for
predictive phenotype analysis. The same methodology used
in association mapping may also be used for allele mining
of the diverse core subsets of maize created from breeder’s
lines, genebank accessions, and wild relatives.
Acknowledgments We thank Drs. Marilyn Warburton and Rodomiro
Ortiz for their critical review and suggestions which much improved the
manuscript, Dr. Kevin Pixley for constructive discussion, and Eva Huerta
Miranda, Carlos Martinez Flores, Martha Hernandez Rodrıguez, Alberto
Vergara Alva, Maria Asuncion Moreno Ortega, and Jose Simon Pastrana
Marias for lab and field assistance. The maize breeding program team
from Embrapa (Drs. Paulo Evaristo O. Guimaraes, Cleso A.P. Pacheco,
and Lauro J.M. Guimaraes) provided breeding materials and related
information for the 94 Brazilian maize germplasm. This work at
CIMMYT is funded by the Rockefeller Foundation, Bill and Melinda
Gates Foundation, and European Community, and through other attrib-
uted or unrestricted funds provided by the members of the Consultative
Group on International Agricultural Research (CGIAR) and national
governments of USA, Japan, and UK. The Brazilian research was sup-
ported by Embrapa, FAPEMIG, The Generation Challenge Program and
The McKnight Foundation—CCRP. Yanli Lu was supported by China
Scholarship Council for her research at CIMMYT as a joint PhD student.
References
Altschul SF, Gish W, Miller W, Myers EW, Lipman DJ (1990) Basic
local alignment search tool. J Mol Biol 215:403–410
Betran FJ, Ribaut JM, Beck D, Gonzalez de Leon D (2003) Genetic
diversity, specific combining ability, and heterosis in tropical
maize under stress and nonstress environments. Crop Sci
43:797–806
Botstein DR, White RL, Skolnick M, Davis RW (1980) Construction
of a genetic linkage map in man using restriction fragment length
polymorphisms. Am J Hum Genet 32:314–331
Bradbury PJ, Zhang Z, Kroon DE, Casstevens TM, Ramdoss Y,
Buckler ES (2007) TASSEL: software for association mapping
of complex traits in diverse samples. Bioinformatics 23:2633–
2635
Bruford MW, Wyne RK (1993) Microsatellites and their application
to population genetic studies. Curr Opin Genet Dev 3:939–943
Buckler ES, Gaut BS, McMullen MD (2006) Molecular and
functional diversity of maize. Curr Opin Plant Biol 9:172–176
Ching A, Caldwell KS, Maurine Dolan JM, Smith OS, Tingey S,
Morgante M, Rafalski AJ (2002) SNP frequency, haplotype
structure and linkage disequilibrium in elite maize inbred lines.
BMC Genet 3:19
Choukan R, Hossainzadeh A, Ghannadha MR, Warburton ML, Talei
AR, Mohammadi SA (2006) Use of SSR data to determine
relationships and potential heterotic groupings within medium to
late maturing Iranian maize inbred lines. Field Crops Res
95:212–222
CIMMYT Applied Molecular Genetics Laboratory (2003) Laboratory
Protocols, 3rd edn. Mexico, D.F, pp 7–11
Cooper M, Smith OS, Graham G, Arthur L, Feng L, Podlich DW
(2004) Genomics, genetics, and plant breeding: a private sector
perspective. Crop Sci 44:1907–1913
Doebley JF, Goodman MM, Stuber CW (1984) Isoenzymatic
variation in Zea (Gramineae). Syst Bot 9:203–218
Dubreuil P, Charcosset A (1998) Genetic diversity within and among
populations: a comparison between isozyme and nuclear RFLP
loci. Theor Appl Genet 96:577–587
Theor Appl Genet (2009) 120:93–115 113
123
Duvick DN, Smith JSC, Cooper M (2004) Changes in performance,
parentage, and genetic diversity of successful corn hybrids,
1930–2000. In: Smith CW, Betran J, Runge ECA (eds) Corn:
origin, history, technology, and production. Wiley, New York,
pp 65–97
Eyre-Walker A, Gaut RL, Hilton H, Feldman DL, Gaut BS (1998)
Investigation of the bottleneck leading to the domestication of
maize. Proc Natl Acad Sci USA 95:4441–4446
Falush D, Stephens M, Pritchard JK (2003) Inference of population
structure using multilocus genotype data: linked loci and
correlated allele frequencies. Genetics 164:1567–1587
Fan JB, Gunderson KL, Bibikova M, Yeakley JM, Chen J, Wickham
Garcia E, Lebruska LL, Laurent M, Shen R, Barker D (2006)
Illumina universal bead arrays. Methods Enzymol 410:57–73
Feng L, Sebastian S, Smith S, Cooper M (2006) Temporal trends in
SSR allele frequencies associated with long-term selection for
yield of maize. Maydica 51:293–300
Fisher RA (1922) On the interpretation of v2 from contingency tables,
and the calculation of P. J R Stat Soc 85:87–94
Gupta PK, Rustgi S, Mir RR (2008) Array-based high-throughput
DNA markers for crop improvement. Heredity 101:5–18
Hamblin MT, Warburton ML, Buckler ES (2007) Empirical compar-
ison of simple sequence repeats and single nucleotide polymor-
phisms in assessment of maize diversity and relatedness. PLoS
ONE 12:e1367
Hanson MA, Gaut BS, Stec AO, Fuerstenberg SI, Goodman MM, Coe
EH, Doebley JF (1996) Evolution of anthoryanin biosynthesis in
maize kernels: the role of regulatory and enzymatic loci.
Genetics 143:1395–1407
Hilton H, Gaut BS (1998) Speciation and domestication in maize and
its wild relatives: evidence from the globulin-1 gene. Genetics
150:863–872
Hoisington D, Khairallah M, Reeves T, Ribaut JM, Skovmand B,
Taba S, Warburton M (1999) Plant genetic resources: what can
they contribute toward increased crop productivity? Proc Natl
Acad Sci USA 96:5937–5943
Jones ES, Sullivan H, Bhattramakki D, Smith JSC (2007) A
comparison of simple sequence repeat and single nucleotide
polymorphism marker technologies for genotypic analysis of
maize (Zea mays L.). Theor Appl Genet 115:361–371
Laval G, San Cristobal M, Chevalet C (2002) Measuring genetic
distances between breeds: use of some distances in various short
term evolution models. Genet Sel Evol 34:481–507
Liu K, Muse SV (2005) PowerMarker: an integrated analysis
environment for genetic marker analysis. Bioinformatics 21:
2128–2129
Liu K, Goodman M, Muse S, Smith JS, Buckler E, Doebley J (2003)
Genetic structure and diversity among maize inbred lines as
inferred from DNA microsatellites. Genetics 165:2117–2128
McMullen MM, Kresovich S, Villeda HS, Bradbury P, Li H, Sun Q,
Flint-Garcia S, Thornsberry J, Acharya C, Bottoms C, Brown P,
Browne C, Eller M, Guill K, Harjes C, Kroon D, Lepak N,
Mitchell SE, Peterson B, Pressoir G, Romero S, Rosas MO,
Salvo S, Yates H, Hanson M, Jones E, Smith S, Glaubitz JC,
Goodman M, Ware D, Holland JB, Buckler ES (2009) Genetic
properties of the maize nested association mapping population.
Science 325:737–740
Melchinger AE (1999) Genetic diversity and heterosis. Chapter 10.
In: Coors JG, Pandey S (eds) The genetics and exploitation of
heterosis in crops. CSSA, Madison
Mikel MA, Dudley JW (2006) Evolution of North American
dent corn from public to proprietary germplasm. Crop Sci
46:1193–1205
Palaisa K, Morgante M, Williams M, Rafalski A (2003) Contrasting
effects of selection on sequence diversity and linkage disequi-
librium at two phytoene synthase loci. Plant Cell 15:1795–1806
Palaisa K, Morgante M, Tingey S, Rafalski A (2004) Long-range
patterns of diversity and linkage disequilibrium surrounding the
maize Y1 gene are indicative of an asymmetric selective sweep.
Proc Natl Acad Sci USA 101:9885–9890
Parentoni SN, Magalhaes JV, Pacheco CAP, Santos MX, Abadie T,
Gama EEG, Guimaraes PEO, Meirelles WF, Lopes MA,
Vasconcelos MJV, Paiva E (2001) Heterotic groups based on
yield-specific combining ability data and phylogenetic relation-
ship determined by RAPD markers for 28 tropical maize open
pollinated varieties. Euphytica 121:197–208
Pritchard JK, Stephens M, Donnelly P (2000) Inference of population
structure using multilocus genotype data. Genetics 155:945–959
Rafalski A, Ananiev E (2009) Genetic diversity, linkage disequilib-
rium and association mapping. In: Bennetzen JL, Hake SC (eds)
Handbook of maize: genetics and genomics. Springer, New
York, pp 201–219
Reif JC, Xia XC, Melchinger AE, Warburton ML, Hoisington DA,
Beck D, Bohn M, Frisch M (2004) Genetic diversity determined
within and among CIMMYT maize populations of tropical,
subtropical, and temperate germplasm by SSR markers. Crop Sci
44:326–334
Reif JC, Warburton ML, Taba S, Hoisington D, Crossa J, Franco J,
Xia X, Muminovic J, Bohn M, Frisch M, Melchinger AE (2006)
Grouping of accessions of Mexican races of maize revisited with
SSR markers. Theor Appl Genet 113:177–185
Remington DL, Thornsberry JM, Matsuoka Y, Wilson LM, Whitt SR,
Doebley J, Kresovich S, Goodman MM, Buckler ES (2001)
Structure of linkage disequilibrium and phenotypic associations
in the maize genome. Proc Natl Acad Sci USA 98:11479–11484
Rogers JS (1972) Measures of genetic similarity and genetic distance.
In: Studies in genetics VII. University of Texas Publication
7213, Austin
Saitou N, Nei M (1987) The neighbor-joining method: a new
method for reconstructing phylogenetic trees. Mol Biol Evol4:406–425
Smith S (2007) Pedigree background changes in US hybrid maize
between 1980 and 2004. Crop Sci 47:1914–1926
Smith JSC, Chin ECL, Shu H, Smith OS, Wall SJ, Senior ML,
Mitchell SE, Kresovich S, Ziegle J (1997) An evaluation of the
utility of SSR loci as molecular markers in maize (Zea mays L.):
comparisons with data from RFLPs and pedigree. Theor Appl
Genet 95:163–173
Smith JSC, Duvick DJ, Smith OS, Cooper M, Feng L (2004) Changes
in pedigree backgrounds of Pioneer brand maize hybrids widely
grown from 1930 to 1999. Crop Sci 44:1935–1946
Song TM, Chen SJ (2004) Long term selection for oil concentration in
five maize populations. Maydica 49:9–14
Tenaillon MI, Sawkins MC, Long AD, Gaut RL, Doebley JF et al
(2001) Patterns of DNA sequence polymorphism along chromo-
some 1 of maize (Zea mays ssp. mays L.). Proc Natl Acad Sci
USA 98:9161–9166
Teng WT, Cao QS, Chen YH, Liu XH, Men SD, Jing XQ, Li JS
(2004) Analysis of maize heterotic groups and patterns during
past decade in China. Agric Sci Chin 3:481–489 (in Chinese)
Tracy WF, Chandler MA (2006) The historical and biological basis of
the concept of heterotic patterns in Corn Belt Dent maize. In:
Lamkey KR, Lee M (eds) Plant breeding: The Arnel R. Hallauer
international symposium. Blackwell, Ames, pp 219–233
Vigouroux Y, Mitchell S, Matsuoka Y, Hamblin M, Kresovich S,
Smith JSC, Jaqueth J, Smith OS, Doebley J (2005) An analysis
of genetic diversity across the maize genome using microsatel-
lites. Genetics 169:1617–1630
Vigouroux Y, Glaubitz JC, Matsuoka Y, Goodman MM, Sanchez G,
Doebley J (2008) Population structure and genetic diversity of
new world maize races assessed by DNA microsatellites. Am J
Bot 95:1240–1253
114 Theor Appl Genet (2009) 120:93–115
123

Vroh BI, McMullen MD, Sanchez-Villeda H, Schroeder S, Gardiner
J, Polacco M, Soderlund C, Wing R, Fang Z, Coe EH Jr (2006)
Single nucleotide polymorphisms and insertion–deletions for
genetic markers and anchoring the maize fingerprint contig
physical map. Crop Sci 46:12–21
Wang R, Yu Y, Zhao J, Shi Y, Song Y, Wang T, Li Y (2008)
Population structure and linkage disequilibrium of a mini core
set of maize inbred lines in China. Theor Appl Genet 117:1141–
1153
Warburton ML, Xia XC, Crossa J, Franco J, Melchinger AE, Frisch
M, Bohn M, Hoisington DA (2002) Genetic characterization of
CIMMYT maize inbred lines and open pollinated populations
using large scale fingerprinting methods. Crop Sci 42:1832–1840
Warburton ML, Ribaut JM, Franco J, Crossa J, Dubreuil P, Betran FJ
(2005) Genetic characterization of 218 elite CIMMYT inbred
maize lines using RFLP markers. Euphytica 142:97–106
Warburton ML, Reif JC, Frisch M, Bohn M, Bedoya C, Xia XC,
Crossa J, Franco J, Hoisington D, Pixley K, Taba S, Melchinger
AE (2008) Genetic diversity in CIMMYT nontemperate maize
germplasm: landraces, open pollinated varieties, and inbred
lines. Crop Sci 48:617–624
Whitt SR, Wilson LM, Tenaillon MI, Gaut BS, Buckler ES (2002)
Genetic diversity and selection in the maize starch pathway. Proc
Natl Acad Sci USA 99:12959–12962
Wright SI, Vroh BI, Schroeder SG, Yamasaki M, Doebley JF,
McMullen MD, Gaut BS (2005) The effects of artificial selection
on the maize genome. Science 308:1310–1314
Xia XC, Reif JC, Hoisington DA, Melchinger AE, Frisch M,
Warburton ML (2004) Genetic diversity among CIMMYT
maize inbred lines investigated with SSR markers: I. Lowland
tropical maize. Crop Sci 44:2230–2237
Xia XC, Reif JC, Melchinger AE, Frisch M, Hoisington DA, Beck D,
Pixley K, Warburton ML (2005) Genetic diversity among
CIMMYT maize inbred lines investigated with SSR markers:
II. Subtropical, tropical midaltitude, and highland maize inbred
lines and their relationships with elite US and European maize.
Crop Sci 45:2573–2582
Xie CX, Warburton M, Li MS, Li XH, Xiao MJ, Hao ZF, Zhao Q,
Zhang SH (2008) An analysis of population structure and linkage
disequilibrium using multilocus data in 187 maize inbred lines.
Mol Breed 21:407–418
Xu Y (2003) Developing marker-assisted selection strategies for
breeding hybrid rice. Plant Breed Rev 23:73–174
Xu Y, Ishii T, McCouch S (2003) Marker-assisted evaluation of
germplasm resources for plant breeding. In: Mew TW, Brar DS,
Peng S, Hardy B (eds) Rice science: innovations and impact for
livelihood. Proceedings of the 24th international rice research
conference, 16–19 September 2002, Beijing, China. International
Rice Research Institute, Chinese Academy of Engineering, and
Chinese Academy of Agricultural Sciences, Manila, Philippines,
pp 213–229
Xu Y, Beachell H, McCouch SR (2004) A marker-based approach to
broadening the genetic base of rice (Oryza sativa L.) in the US.
Crop Sci 44:1947–1959
Xu Y, Skinner DJ, Wu H, Palacios-Rojas N, Araus JL, Yan J, Gao S,
Warburton ML, Crouch JH (2009) Advances in maize genomics
and their value for enhancing genetic gains from breeding. Int J
Plant Genomics 2009:957602. doi:10.1155/2009/957602
Yamasaki M, Tenaillon MI, Vroh BI, Schroeder SG, Sanchez-Villeda
H, Doebley JF, Gaut BS, McMullen MD (2005) A large-scale
screen for artificial selection in maize identifies candidate
agronomic loci for domestication and crop improvement. Plant
Cell 17:2859–2872
Yan J, Yang X, Shah T, Sanchez-Villeda H, Li J, Warburton M, Zhou
Y, Crouch JH, Xu Y (2009) High-throughput SNP genotyping
with the GoldenGate assay in maize. Mol Breed (in press)
Yu J, Pressoir G, Briggs WH, Vroh Bi I, Yamasaki M, Doebley JF,
McMullen MD, Gaut BS, Nielsen DM, Holland JB, Kresovich S,
Buckler ES (2006) A unified mixed-model method for associ-
ation mapping that accounts for multiple levels of relatedness.
Nat Genet 38:203–208
Yu J, Holland JB, McMullen MD, Buckler ES (2008) Genetic design
and statistical power of nested association mapping in maize.
Genetics 178:539–551
Yu J, Zhang Z, Zhu C, Tabanao DA, Pressoir G, Tuinstra MR,
Kresovich S, Todhunter RJ, Buckler ES (2009) Simulation
appraisal of the adequacy of number of background markers for
relationship estimation in association mapping. Plant Genome
2:63–77
Yuan LX, Fu JH, Zhang SH, Liu XZ, Peng ZB, Li XH, Warburton M,
Khairallah M (2001) Heterotic grouping of maize inbred lines
using RFLP and SSR markers. Acta Agron Sin 27:149–156
Zhu YL, Song QJ, Hyten DL, Van Tassell CP, Matukumalli LK,
Grimm DR, Hyatt SM, Fickus EW, Young ND, Cregan PB
(2003) Single-nucleotide polymorphisms in soybean. Genetics
163:1123–1134
Theor Appl Genet (2009) 120:93–115 115
123