molecular basis of giant cells in tuberous sclerosis complex
TRANSCRIPT
clinical implications of basic research
T h e n e w e ngl a nd j o u r na l o f m e dic i n e
778
Dan L. Longo, M.D., Editor
The Clinical Implications of Basic Research series has focused on highlighting laboratory research that could lead to advances in clinical therapeutics. However, the path between the laboratory and the bedside runs both ways:
clinical observations often pose new questions for laboratory investigations that then lead back to the clinic. One of a series of occasional articles drawing attention to the bedside-to-bench f low of information is presented here,
under the Basic Implications of Clinical Observations rubric. We hope our readers will enjoy these stories of discovery, and we invite them to submit their own examples of clinical findings that have led to insights in basic science.
basic implications of clinical observations
n engl j med 371;8 nejm.org august 21, 2014
Molecular Basis of Giant Cells in Tuberous Sclerosis ComplexDavid J. Kwiatkowski, M.D., Ph.D., and Brendan D. Manning, Ph.D.
Focal cortical brain lesions (tubers), which were first recognized by Bourneville in 1879 during postmortem examination of a 15-year-old girl who died of epilepsy, were given the name tuber-ous sclerosis of the cerebral convolutions.1 Sub-sequent clinical studies defined tuberous sclero-sis complex (TSC) as an autosomal dominant hereditary disorder in which tumors develop in multiple organ systems. Pathological studies identified characteristic giant cells in cortical tubers and in brain tumors known as subepen-dymal giant-cell astrocytomas and other lesions that are frequently found in patients with TSC.
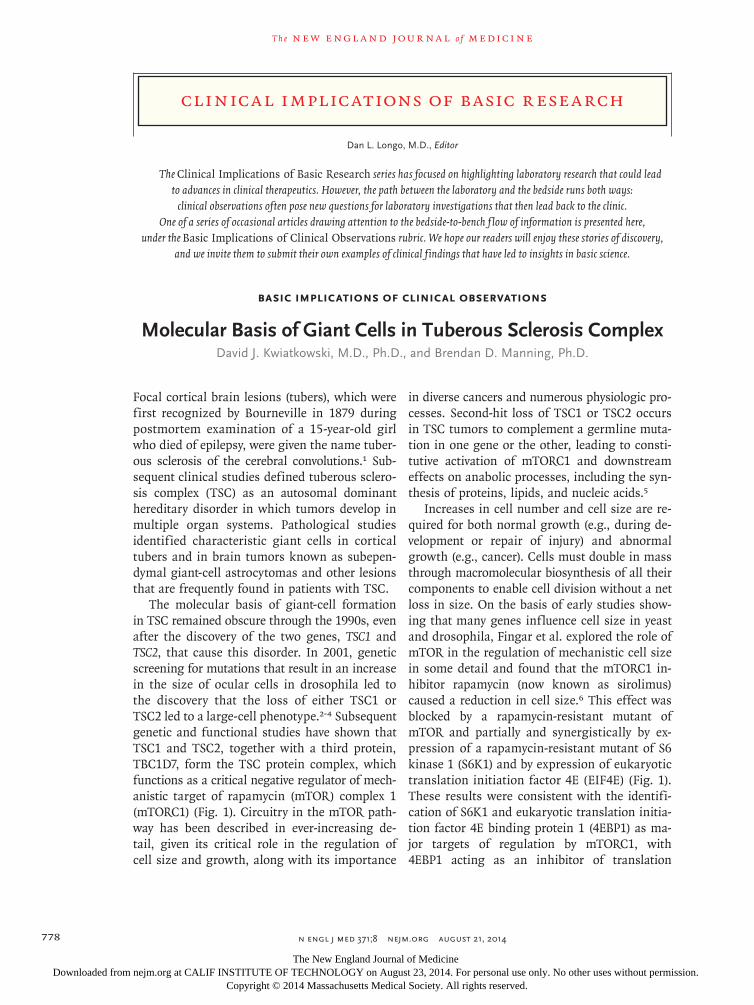
The molecular basis of giant-cell formation in TSC remained obscure through the 1990s, even after the discovery of the two genes, TSC1 and TSC2, that cause this disorder. In 2001, genetic screening for mutations that result in an increase in the size of ocular cells in drosophila led to the discovery that the loss of either TSC1 or TSC2 led to a large-cell phenotype.2-4 Subsequent genetic and functional studies have shown that TSC1 and TSC2, together with a third protein, TBC1D7, form the TSC protein complex, which functions as a critical negative regulator of mech-anistic target of rapamycin (mTOR) complex 1 (mTORC1) (Fig. 1). Circuitry in the mTOR path-way has been described in ever-increasing de-tail, given its critical role in the regulation of cell size and growth, along with its importance
in diverse cancers and numerous physiologic pro-cesses. Second-hit loss of TSC1 or TSC2 occurs in TSC tumors to complement a germline muta-tion in one gene or the other, leading to consti-tutive activation of mTORC1 and downstream effects on anabolic processes, including the syn-thesis of proteins, lipids, and nucleic acids.5
Increases in cell number and cell size are re-quired for both normal growth (e.g., during de-velopment or repair of injury) and abnormal growth (e.g., cancer). Cells must double in mass through macromolecular biosynthesis of all their components to enable cell division without a net loss in size. On the basis of early studies show-ing that many genes influence cell size in yeast and drosophila, Fingar et al. explored the role of mTOR in the regulation of mechanistic cell size in some detail and found that the mTORC1 in-hibitor rapamycin (now known as sirolimus) caused a reduction in cell size.6 This effect was blocked by a rapamycin-resistant mutant of mTOR and partially and synergistically by ex-pression of a rapamycin-resistant mutant of S6 kinase 1 (S6K1) and by expression of eukaryotic translation initiation factor 4E (EIF4E) (Fig. 1). These results were consistent with the identifi-cation of S6K1 and eukaryotic translation initia-tion factor 4E binding protein 1 (4EBP1) as ma-jor targets of regulation by mTORC1, with 4EBP1 acting as an inhibitor of translation
The New England Journal of Medicine Downloaded from nejm.org at CALIF INSTITUTE OF TECHNOLOGY on August 23, 2014. For personal use only. No other uses without permission.
Copyright © 2014 Massachusetts Medical Society. All rights reserved.

n engl j med 371;8 nejm.org august 21, 2014 779
Basic Implications of Clinical Observations
through binding to EIF4E, which together en-able an increase in cell size in preparation for cell division.
How does the activation of mTORC1 cause an increase in cellular mass? It does so through several mechanisms that control anabolic metab-olism,5 among which the best characterized is an increase in protein synthesis through the gen-eration of additional ribosomes and increased rates of messenger RNA translation (Fig. 1). The mTORC1 complex regulates the translation of a set of messenger RNAs that have 5′ terminal oligopyrimidine (5′-TOP) motifs through direct phosphorylation of the 4EBP proteins, which causes their release from EIF4E. These 5′-TOP messenger RNAs are enriched for those encoding ribosomal proteins and translation factors, there-by increasing ribosome biogenesis and protein synthesis. The activation of mTORC1 increases the translation of hypoxia-inducible factor 1α (HIF1A) to induce expression of glucose trans-porters and glycolytic enzymes to promote aero-bic glycolysis, which provides glycolytic inter-mediates for lipid, amino acid, and nucleotide synthesis.7 It also activates the sterol regulatory element-binding proteins (SREBP1 and SREBP2) to enhance expression of enzymes required for de novo biosynthesis of fatty acids and sterols. In addition, mTORC1 promotes the expression of genes in the pentose phosphate pathway to enhance NADPH production, which is needed for lipid biosynthesis. It also stimulates de novo pyrimidine biosynthesis through S6K1-mediated phosphorylation of the enzyme CAD (carbamoyl-phosphate synthetase 2, aspartate transcarba-moylase, dihydroorotase) to increase nucleo-tide pools for RNA and DNA synthesis.8,9 At the same time, mTORC1 strongly inhibits autophagy to preserve cellular organelles and macromole-cules by phosphorylation of the TFEB transcrip-tion factor10 and ULK1 (also known as ATG1), a protein kinase that regulates the initiation of autophagosome formation.11
Evidence of mTOR pathway activation has been seen in tuber giant cells and subependymal giant-cell astrocytomas.12,13 This understanding of the basic mechanism of giant-cell formation and tumor growth in TSC has led to the intro-duction of sirolimus and other mTOR inhibitors for treatment of various TSC manifestations.
TBC1D7
RHEB-GDPRHEB
TSC1
Pi
GTPGDP
TBC1D7TSC1
TSC2
+P+P
ERK
RSK
RHEB GTP
+P
AKT
AMPK
Hypoxia
Amino acids
GTPGDP
mTORC1
mTORmTORmLST8
RAPTOR
S6K1/2
Aerobicglycolysis
Lipidsynthesis
Nucleotidesynthesis
mRNAtranslation
G6PDPPP
Biosyntheticprecursors
SterolsFatty acids
RNADNA
Ribosome biogenesisProtein synthesis
NADPHribose
4EBP1
EIF4EEIF4BHIF1A SREBP1
Autophagy
S6CAD
ULK1 TFEB
Figure 1. TSC Protein Complex, mTOR Complex 1, and Downstream Effects.
The tuberous sclerosis complex (TSC) proteins, which include TSC1, TSC2, and TBC1D7, are negatively regulated by phosphorylation (+P) by AKT, ERK, and RSK, which are all core kinases that are activated during growth signal-ing. This complex is activated under hypoxia and on phosphorylation by AMPK in response to energy stress and functions as a GTPase-activating protein to negatively regulate RHEB, a Ras family member GTPase. RHEB-GTP acti-vates mechanistic target of rapamycin (mTOR) complex 1 (mTORC1), which is also regulated by intracellular amino acid levels and has multiple direct kinase targets and even more secondary targets of phosphorylation. In some cases, the mechanism of regulation is not completely understood (as indi-cated by a dashed line). In aggregate, these transcription factors, translation factors, and enzymes lead to biosynthesis of ribosomes and other compo-nents that are needed for efficient translation, including ATP and amino acids, as well as lipid precursors, NADPH, nucleotides, RNA, and DNA, to enable an increase in cell size and growth. Arrows indicate stimulatory events, which at times are mediated by phosphorylation; blocked lines indicate in-hibitory effects. Biallelic (complete) loss of TSC1 or TSC2 leads to the loss of negative regulatory effects of the TSC protein complex and constitutive activation of mTORC1. CAD denotes carbamoyl-phosphate synthetase 2, aspartate transcarbamoylase, dihydroorotase; EIF4E eukaryotic translation initiation factor 4E; 4EBP1 eukaryotic translation initiation factor 4E binding protein 1; G6PD glucose-6-phosphate dehydrogenase; HIF1A hypoxia-induc-ible factor 1α; PPP pentose phosphate pathway; SREBP1 sterol regulatory element-binding protein 1; and S6K1/2 ribosomal protein S6 kinase 1 and 2.
The New England Journal of Medicine Downloaded from nejm.org at CALIF INSTITUTE OF TECHNOLOGY on August 23, 2014. For personal use only. No other uses without permission.
Copyright © 2014 Massachusetts Medical Society. All rights reserved.

n engl j med 371;8 nejm.org august 21, 2014780
Basic Implications of Clinical Observations
Several TSC tumors or related diseases, including renal angiomyolipoma, lymphangioleiomyoma-tosis, and subependymal giant-cell astrocytoma, have been shown to be responsive to treatment with mTOR inhibitors (sirolimus and everolimus) in randomized trials.14-16 In addition, in some patients with cancers of the kidney and bladder with TSC1 mutations who do not have TSC, tu-mors have been responsive to mTORC1 inhibi-tion.17 Everolimus typically causes a median volumetric reduction in TSC tumors of about 50%14,15 and occasionally destroys tumors, which suggests that some responses can involve more than a reduction in cell size. Studies in mice have shown that cells lacking TSC have a major reduction in size in response to mTOR inhibitor therapy in vivo, a result that is probably caused by both a cessation of anabolic stimulation and the induction of autophagy. The majority of kid-ney angiomyolipomas regrow to a major extent when treatment is terminated,18 and subependy-mal giant-cell astrocytomas can also regrow when treatment is interrupted,19 indicating that continued treatment may be required to main-tain a response. Fortunately, the constellation of metabolic and anabolic effects of mTORC1 acti-vation that drive an increase in cell size provides abundant opportunity for additional therapeutic attack, which may enable effective long-term disease control or even elimination.5,20
The clinical description of TSC and the path-ological studies that identified giant cells in TSC lesions stimulated basic investigation into the regulation of cell size and growth. This research has led to the clinical advances now benefiting patients with TSC and others.
Disclosure forms provided by the authors are available with the full text of this article at NEJM.org.
From the Department of Medicine, Brigham and Women’s Hospital (D.J.K.), and the Department of Genetics and Complex Diseases, Harvard School of Public Health (B.D.M.) — both in Boston.
1. Bourneville D. Sclerose tubereuse des circonvolutions cere-brales: idiotie et epilepsie hemiplegique. Arch Neurol (Paris) 1880;1:81-91.2. Gao X, Pan D. TSC1 and TSC2 tumor suppressors antagonize insulin signaling in cell growth. Genes Dev 2001;15:1383-92.
3. Potter CJ, Huang H, Xu T. Drosophila Tsc1 functions with Tsc2 to antagonize insulin signaling in regulating cell growth, cell proliferation, and organ size. Cell 2001;105:357-68.4. Tapon N, Ito N, Dickson BJ, Treisman JE, Hariharan IK. The Drosophila tuberous sclerosis complex gene homologs restrict cell growth and cell proliferation. Cell 2001;105:345-55.5. Dibble CC, Manning BD. Signal integration by mTORC1 co-ordinates nutrient input with biosynthetic output. Nat Cell Biol 2013;15:555-64.6. Fingar DC, Salama S, Tsou C, Harlow E, Blenis J. Mamma-lian cell size is controlled by mTOR and its downstream targets S6K1 and 4EBP1/eIF4E. Genes Dev 2002;16:1472-87.7. Düvel K, Yecies JL, Menon S, et al. Activation of a metabolic gene regulatory network downstream of mTOR complex 1. Mol Cell 2010;39:171-83.8. Ben-Sahra I, Howell JJ, Asara JM, Manning BD. Stimulation of de novo pyrimidine synthesis by growth signaling through mTOR and S6K1. Science 2013;339:1323-8.9. Robitaille AM, Christen S, Shimobayashi M, et al. Quantita-tive phosphoproteomics reveal mTORC1 activates de novo pyrimi-dine synthesis. Science 2013;339:1320-3.10. Settembre C, Zoncu R, Medina DL, et al. A lysosome-to-nucleus signalling mechanism senses and regulates the lyso-some via mTOR and TFEB. EMBO J 2012;31:1095-108.11. Egan D, Kim J, Shaw RJ, Guan KL. The autophagy initiating kinase ULK1 is regulated via opposing phosphorylation by AMPK and mTOR. Autophagy 2011;7:643-4.12. Baybis M, Yu J, Lee A, et al. mTOR cascade activation distin-guishes tubers from focal cortical dysplasia. Ann Neurol 2004; 56:478-87.13. Chan JA, Zhang H, Roberts PS, et al. Pathogenesis of tuber-ous sclerosis subependymal giant cell astrocytomas: biallelic inactivation of TSC1 or TSC2 leads to mTOR activation. J Neuro-pathol Exp Neurol 2004;63:1236-42.14. Bissler JJ, Kingswood JC, Radzikowska E, et al. Everolimus for angiomyolipoma associated with tuberous sclerosis complex or sporadic lymphangioleiomyomatosis (EXIST-2): a multicentre, randomised, double-blind, placebo-controlled trial. Lancet 2013; 381:817-24.15. Franz DN, Belousova E, Sparagana S, et al. Efficacy and safety of everolimus for subependymal giant cell astrocytomas associated with tuberous sclerosis complex (EXIST-1): a multi-centre, randomised, placebo-controlled phase 3 trial. Lancet 2013; 381:125-32. [Erratum, Lancet 2013;381:116.]16. McCormack FX, Inoue Y, Moss J, et al. Efficacy and safety of sirolimus in lymphangioleiomyomatosis. N Engl J Med 2011;364: 1595-606.17. Iyer G, Hanrahan AJ, Milowsky MI, et al. Genome sequenc-ing identifies a basis for everolimus sensitivity. Science 2012; 338:221.18. Bissler JJ, McCormack FX, Young LR, et al. Sirolimus for angiomyolipoma in tuberous sclerosis complex or lymphangi-oleiomyomatosis. N Engl J Med 2008;358:140-51.19. Franz DN, Leonard J, Tudor C, et al. Rapamycin causes re-gression of astrocytomas in tuberous sclerosis complex. Ann Neurol 2006;59:490-8.20. Henske EP, McCormack FX. Lymphangioleiomyomatosis — a wolf in sheep’s clothing. J Clin Invest 2012;122:3807-16.
DOI: 10.1056/NEJMcibr1406613Copyright © 2014 Massachusetts Medical Society.
The New England Journal of Medicine Downloaded from nejm.org at CALIF INSTITUTE OF TECHNOLOGY on August 23, 2014. For personal use only. No other uses without permission.
Copyright © 2014 Massachusetts Medical Society. All rights reserved.