moisture profiles during intermittent soaking of an oblate spheroid
TRANSCRIPT
Journal of Food Engineering 125 (2014) 77–83
Contents lists available at ScienceDirect
Journal of Food Engineering
journal homepage: www.elsevier .com/ locate / j foodeng
Moisture profiles during intermittent soaking of an oblate spheroid
0260-8774/$ - see front matter � 2013 Elsevier Ltd. All rights reserved.http://dx.doi.org/10.1016/j.jfoodeng.2013.10.028
⇑ Tel.: +1 575 646 2565.E-mail address: [email protected]
Stuart H. Munson-McGee ⇑Food Science and Technology, New Mexico State University, Las Cruces, NM 88003, USA
a r t i c l e i n f o a b s t r a c t
Article history:Received 27 August 2013Received in revised form 15 October 2013Accepted 20 October 2013Available online 30 October 2013
Keywords:SorghumSteepingSoakingAbsorptionMoisture profileFickian diffusionOblate spheroidBiot modulusConvective mass transferMalting
Oblate spheroidal geometry and Fickian diffusion with constant diffusivity are used to model moistureabsorption in a sorghum kernel with an aspect ratio of 1.48 during intermittent soaking. During thesoaking phases the surface is assumed to be saturated while during the drain phases convective transportbetween the surroundings and the surface is assumed. An explicit finite difference scheme is used tosolve the dimensionless form of the diffusion equation. For a three-cycle scenario with a 30-min soak,2-h drain, 30-min soak, 5-h drain, and a 64-h soak, it is shown that the moisture distribution in the kernelis more uniform (as measured by the standard deviation of the moisture profile) than during a constantsoaking scenario regardless of the assumed values of the Biot modulus and the equilibrium surfacemoisture concentration during the drain phases.
� 2013 Elsevier Ltd. All rights reserved.
1. Introduction
Malt, hops, water, and yeast are the four principle ingredients inbeer, each adding unique contributions to the final beverage. Maltnot only provides the source of fermentable sugars but also pro-vides color, flavor, aroma, mouthfeel, and other properties to thefinished beer (see, for example, Bamforch, 2003; Lewis and Young,2002). In most beer sold in the western world, the malt is madefrom barley although other grains, including oats, wheat, rye, corn,and sorghum, are also used. Hops are added to beer to provideflavor and aroma and also were historically added because theirpreservative properties enhanced the shelf-life of the beer as well.Water is the primary ingredient in beer, typically 85–95% byweight, and the type and concentration of salts in the water signif-icantly affect the appropriate style of beer that should be brewedwith that water. Many historical brewing centers became famousbecause their local water chemistry serendipitously matched thatneeded for the style of beer they were brewing. Yeast, the fourthcomponent, is not only the biological organism that converts thefermentable sugars into alcohol and carbon dioxide but alsoproduces other by-products that can significantly affect the aromaand flavor of the beer.
Converting barley kernels into malt can described as a four-stepprocess: kernel preparation, steeping, germination, and kilning(Briggs, 1998). Kernel preparation includes not only removing allforeign debris but also a critical size sorting of the kernels. A typicalsort might categorize the kernels into small (2.2–2.5 mm), medium(2.5–2.8 mm), and large (above 2.8 mm) fractions with smallerkernels being rejected for malting (Briggs, 1998). This degree ofsorting is necessary to ensure that the kernel-to-kernel variationduring the subsequent steps in the process is as small as possible.
During the steeping phase, the sorted barley kernels areimmersed in water, some of which they absorb. At the end of thesteeping phase, the total amount of water absorbed is critical toa successful germination phase (Briggs, 1998). Typically, thedesired water content at the end of the steeping phase is 42–48%by weight, a significant increase over the initial moisture contentwhich is typically 12% or less (Briggs, 1998). Absorbing water intothe barley kernel begins the modification process where carbohy-drates in the endosperm are converted into fermentable sugars.The water provides one of the reactants and it also increases thediffusivity within the endosperm (Briggs, 1998). This is a criticalrole since the modification process requires that hormonesreleased from the embryo diffuse through the endosperm to thealeurone layer just beneath the husk. This then triggers the releaseof the enzymes that catalyze the reactions synthesizing thefermentable sugars.
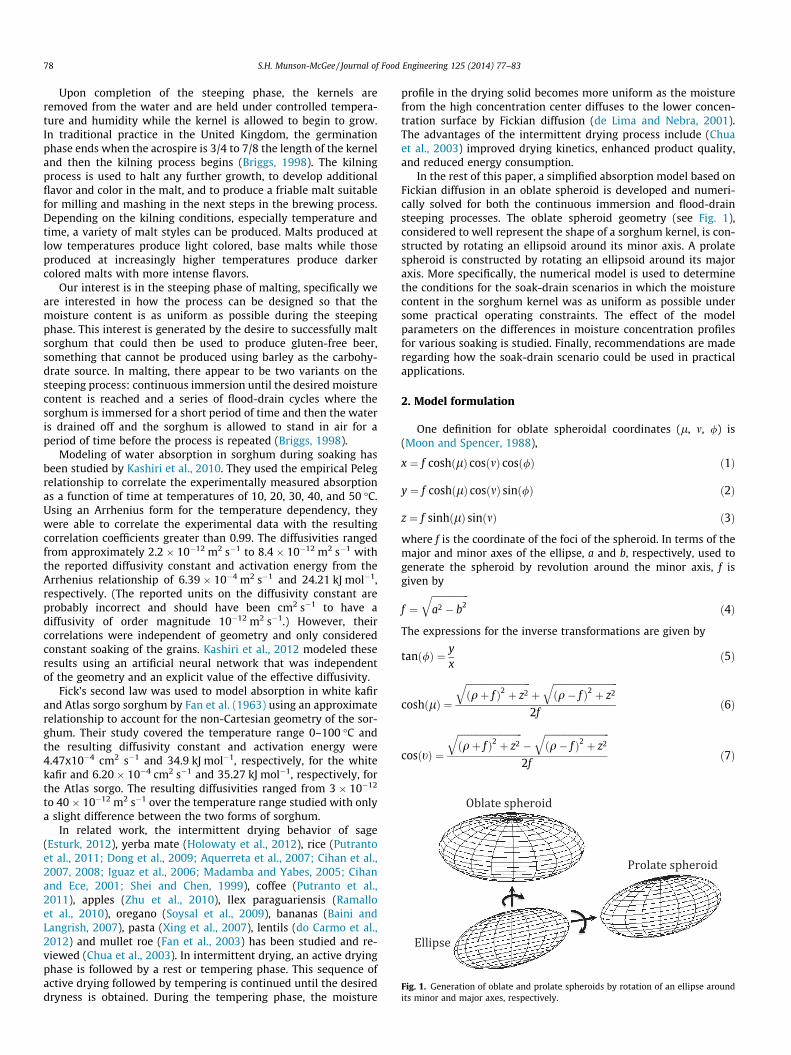
Fig. 1. Generation of oblate and prolate spheroids by rotation of an ellipse aroundits minor and major axes, respectively.
78 S.H. Munson-McGee / Journal of Food Engineering 125 (2014) 77–83
Upon completion of the steeping phase, the kernels areremoved from the water and are held under controlled tempera-ture and humidity while the kernel is allowed to begin to grow.In traditional practice in the United Kingdom, the germinationphase ends when the acrospire is 3/4 to 7/8 the length of the kerneland then the kilning process begins (Briggs, 1998). The kilningprocess is used to halt any further growth, to develop additionalflavor and color in the malt, and to produce a friable malt suitablefor milling and mashing in the next steps in the brewing process.Depending on the kilning conditions, especially temperature andtime, a variety of malt styles can be produced. Malts produced atlow temperatures produce light colored, base malts while thoseproduced at increasingly higher temperatures produce darkercolored malts with more intense flavors.
Our interest is in the steeping phase of malting, specifically weare interested in how the process can be designed so that themoisture content is as uniform as possible during the steepingphase. This interest is generated by the desire to successfully maltsorghum that could then be used to produce gluten-free beer,something that cannot be produced using barley as the carbohy-drate source. In malting, there appear to be two variants on thesteeping process: continuous immersion until the desired moisturecontent is reached and a series of flood-drain cycles where thesorghum is immersed for a short period of time and then the wateris drained off and the sorghum is allowed to stand in air for aperiod of time before the process is repeated (Briggs, 1998).
Modeling of water absorption in sorghum during soaking hasbeen studied by Kashiri et al., 2010. They used the empirical Pelegrelationship to correlate the experimentally measured absorptionas a function of time at temperatures of 10, 20, 30, 40, and 50 �C.Using an Arrhenius form for the temperature dependency, theywere able to correlate the experimental data with the resultingcorrelation coefficients greater than 0.99. The diffusivities rangedfrom approximately 2.2 � 10�12 m2 s�1 to 8.4 � 10�12 m2 s�1 withthe reported diffusivity constant and activation energy from theArrhenius relationship of 6.39 � 10�4 m2 s�1 and 24.21 kJ mol�1,respectively. (The reported units on the diffusivity constant areprobably incorrect and should have been cm2 s�1 to have adiffusivity of order magnitude 10�12 m2 s�1.) However, theircorrelations were independent of geometry and only consideredconstant soaking of the grains. Kashiri et al., 2012 modeled theseresults using an artificial neural network that was independentof the geometry and an explicit value of the effective diffusivity.
Fick’s second law was used to model absorption in white kafirand Atlas sorgo sorghum by Fan et al. (1963) using an approximaterelationship to account for the non-Cartesian geometry of the sor-ghum. Their study covered the temperature range 0–100 �C andthe resulting diffusivity constant and activation energy were4.47x10�4 cm2 s�1 and 34.9 kJ mol�1, respectively, for the whitekafir and 6.20 � 10�4 cm2 s�1 and 35.27 kJ mol�1, respectively, forthe Atlas sorgo. The resulting diffusivities ranged from 3 � 10�12
to 40 � 10�12 m2 s�1 over the temperature range studied with onlya slight difference between the two forms of sorghum.
In related work, the intermittent drying behavior of sage(Esturk, 2012), yerba mate (Holowaty et al., 2012), rice (Putrantoet al., 2011; Dong et al., 2009; Aquerreta et al., 2007; Cihan et al.,2007, 2008; Iguaz et al., 2006; Madamba and Yabes, 2005; Cihanand Ece, 2001; Shei and Chen, 1999), coffee (Putranto et al.,2011), apples (Zhu et al., 2010), Ilex paraguariensis (Ramalloet al., 2010), oregano (Soysal et al., 2009), bananas (Baini andLangrish, 2007), pasta (Xing et al., 2007), lentils (do Carmo et al.,2012) and mullet roe (Fan et al., 2003) has been studied and re-viewed (Chua et al., 2003). In intermittent drying, an active dryingphase is followed by a rest or tempering phase. This sequence ofactive drying followed by tempering is continued until the desireddryness is obtained. During the tempering phase, the moisture
profile in the drying solid becomes more uniform as the moisturefrom the high concentration center diffuses to the lower concen-tration surface by Fickian diffusion (de Lima and Nebra, 2001).The advantages of the intermittent drying process include (Chuaet al., 2003) improved drying kinetics, enhanced product quality,and reduced energy consumption.
In the rest of this paper, a simplified absorption model based onFickian diffusion in an oblate spheroid is developed and numeri-cally solved for both the continuous immersion and flood-drainsteeping processes. The oblate spheroid geometry (see Fig. 1),considered to well represent the shape of a sorghum kernel, is con-structed by rotating an ellipsoid around its minor axis. A prolatespheroid is constructed by rotating an ellipsoid around its majoraxis. More specifically, the numerical model is used to determinethe conditions for the soak-drain scenarios in which the moisturecontent in the sorghum kernel was as uniform as possible undersome practical operating constraints. The effect of the modelparameters on the differences in moisture concentration profilesfor various soaking is studied. Finally, recommendations are maderegarding how the soak-drain scenario could be used in practicalapplications.
2. Model formulation
One definition for oblate spheroidal coordinates (l, m, /) is(Moon and Spencer, 1988),
x ¼ f coshðlÞ cosðmÞ cosð/Þ ð1Þ
y ¼ f coshðlÞ cosðmÞ sinð/Þ ð2Þ
z ¼ f sinhðlÞ sinðmÞ ð3Þ
where f is the coordinate of the foci of the spheroid. In terms of themajor and minor axes of the ellipse, a and b, respectively, used togenerate the spheroid by revolution around the minor axis, f isgiven by
f ¼ffiffiffiffiffiffiffiffiffiffiffiffiffiffiffiffia2 � b2
qð4Þ
The expressions for the inverse transformations are given by
tanð/Þ ¼ yx
ð5Þ
coshðlÞ ¼
ffiffiffiffiffiffiffiffiffiffiffiffiffiffiffiffiffiffiffiffiffiffiffiffiffiffiffiffiðqþ f Þ2 þ z2
qþ
ffiffiffiffiffiffiffiffiffiffiffiffiffiffiffiffiffiffiffiffiffiffiffiffiffiffiffiffiðq� f Þ2 þ z2
q2f
ð6Þ
cosðtÞ ¼
ffiffiffiffiffiffiffiffiffiffiffiffiffiffiffiffiffiffiffiffiffiffiffiffiffiffiffiffiðqþ f Þ2 þ z2
q�
ffiffiffiffiffiffiffiffiffiffiffiffiffiffiffiffiffiffiffiffiffiffiffiffiffiffiffiffiðq� f Þ2 þ z2
q2f
ð7Þ
S.H. Munson-McGee / Journal of Food Engineering 125 (2014) 77–83 79
where the radius, q, is given by
q ¼ffiffiffiffiffiffiffiffiffiffiffiffiffiffiffix2 þ y2
pð8Þ
The starting point for our analysis is the Fickian diffusion equation(Crank, 1975)
@M@t¼ rDrM ð9Þ
where M is the moisture concentration (mol/m3); t is time (s); D isthe diffusivity (m2/s)
Assuming that all material properties (specifically the diffusiv-ity) and geometry are constant and focusing only on the (l, m)plane for / = 0, Eq. (9) becomes (Korn and Korn, 1968)
@M@t¼ Dr2M
¼ Df 2U
1coshðlÞ
@
@l coshðlÞ @M@l
� �þ 1
cosðtÞ@
@tcosðtÞ @M
@t
� �� �ð10Þ
where
U ¼ sinh2ðlÞ þ sin2ðtÞ ð11Þ
Recognizing that the oblate spheroidal coordinates are dimension-less by definition, the following dimensionless variables can be usedto convert Eq. (10) into dimensionless form
M� ¼ ðM �M0Þ=ðMe �M0Þ ð12Þ
t� ¼ Dt=f 2 ð13Þ
where Me is the equilibrium moisture content and M0 is the uniforminitial moisture content, giving
@M�
@t�¼ 1
U1
coshðlÞ@
@lcoshðlÞ @M�
@l
� �þ 1
cosðtÞ@
@tcosðtÞ @M�
@t
� �� �ð14Þ
The derivatives in Eq. (14) were expanded to facilitate writing theexplicit finite difference algorithm used to compute the numericalsolution resulting in
@M�
@t�¼ ð1
UÞ tanhðlÞ @M�
@lþ @
2M�
@l2
" #þ � tanðvÞ @M�
@tþ @
2M�
@t2
" #( )
ð15Þ
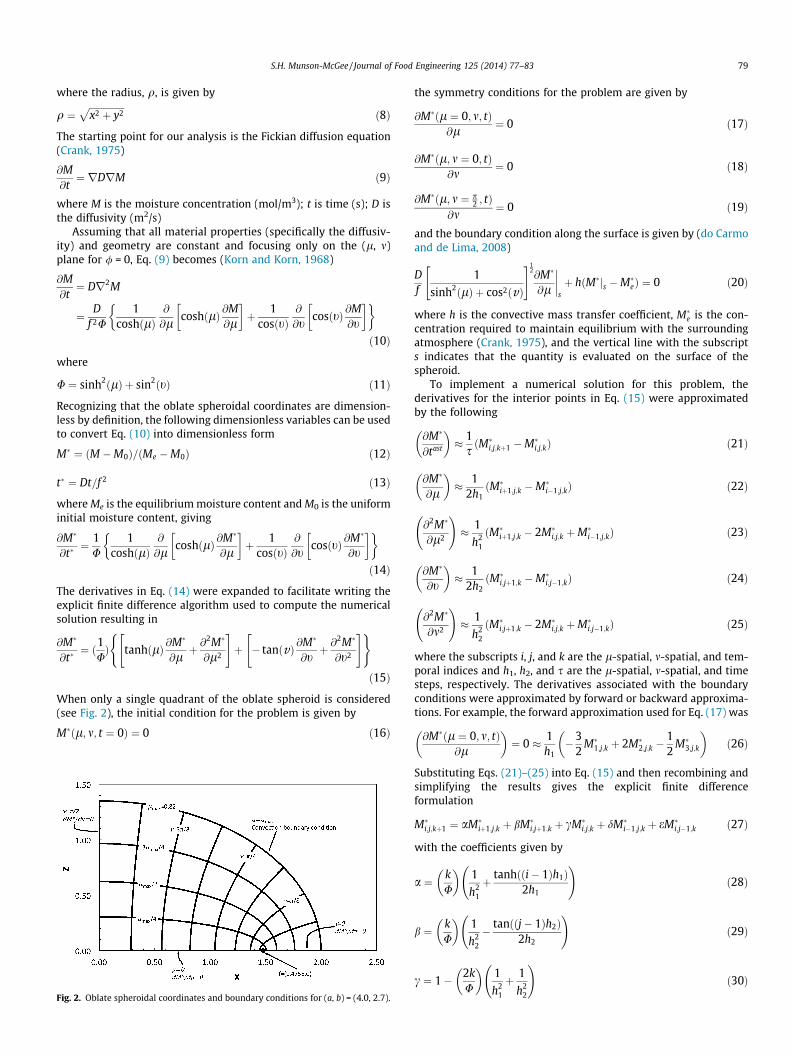
When only a single quadrant of the oblate spheroid is considered(see Fig. 2), the initial condition for the problem is given by
M�ðl; m; t ¼ 0Þ ¼ 0 ð16Þ
Fig. 2. Oblate spheroidal coordinates and boundary conditions for (a, b) = (4.0, 2.7).
the symmetry conditions for the problem are given by
@M�ðl ¼ 0; m; tÞ@l ¼ 0 ð17Þ
@M�ðl; m ¼ 0; tÞ@m
¼ 0 ð18Þ
@M�ðl; m ¼ p2 ; tÞ
@m¼ 0 ð19Þ
and the boundary condition along the surface is given by (do Carmoand de Lima, 2008)
Df
1
sinh2ðlÞ þ cos2ðvÞ
" #12@M�
@l
����s
þ hðM�js �M�eÞ ¼ 0 ð20Þ
where h is the convective mass transfer coefficient, M�e is the con-
centration required to maintain equilibrium with the surroundingatmosphere (Crank, 1975), and the vertical line with the subscripts indicates that the quantity is evaluated on the surface of thespheroid.
To implement a numerical solution for this problem, thederivatives for the interior points in Eq. (15) were approximatedby the following
@M�
@tast
� � 1
sðM�
i;j;kþ1 �M�i;j;kÞ ð21Þ
@M�
@l
� � 1
2h1ðM�
iþ1;j;k �M�i�1;j;kÞ ð22Þ
@2M�
@l2
!� 1
h21
ðM�iþ1;j;k � 2M�
i;j;k þM�i�1;j;kÞ ð23Þ
@M�
@t
� � 1
2h2ðM�
i;jþ1;k �M�i;j�1;kÞ ð24Þ
@2M�
@m2
!� 1
h22
ðM�i;jþ1;k � 2M�
i;j;k þM�i;j�1;kÞ ð25Þ
where the subscripts i, j, and k are the l-spatial, m-spatial, and tem-poral indices and h1, h2, and s are the l-spatial, m-spatial, and timesteps, respectively. The derivatives associated with the boundaryconditions were approximated by forward or backward approxima-tions. For example, the forward approximation used for Eq. (17) was
@M�ðl ¼ 0; m; tÞ@l
� ¼ 0 � 1
h1�3
2M�
1;j;k þ 2M�2;j;k �
12
M�3;j;k
� ð26Þ
Substituting Eqs. (21)–(25) into Eq. (15) and then recombining andsimplifying the results gives the explicit finite differenceformulation
M�i;j;kþ1 ¼ aM�
iþ1;j;k þ bM�i;jþ1;k þ cM�
i;j;k þ dM�i�1;j;k þ eM�
i;j�1;k ð27Þ
with the coefficients given by
a ¼ kU
� 1
h21
þ tanhðði� 1Þh1Þ2h1
!ð28Þ
b ¼ kU
� 1
h22
� tanððj� 1Þh2Þ2h2
!ð29Þ
c ¼ 1� 2kU
� 1
h21
þ 1
h22
!ð30Þ
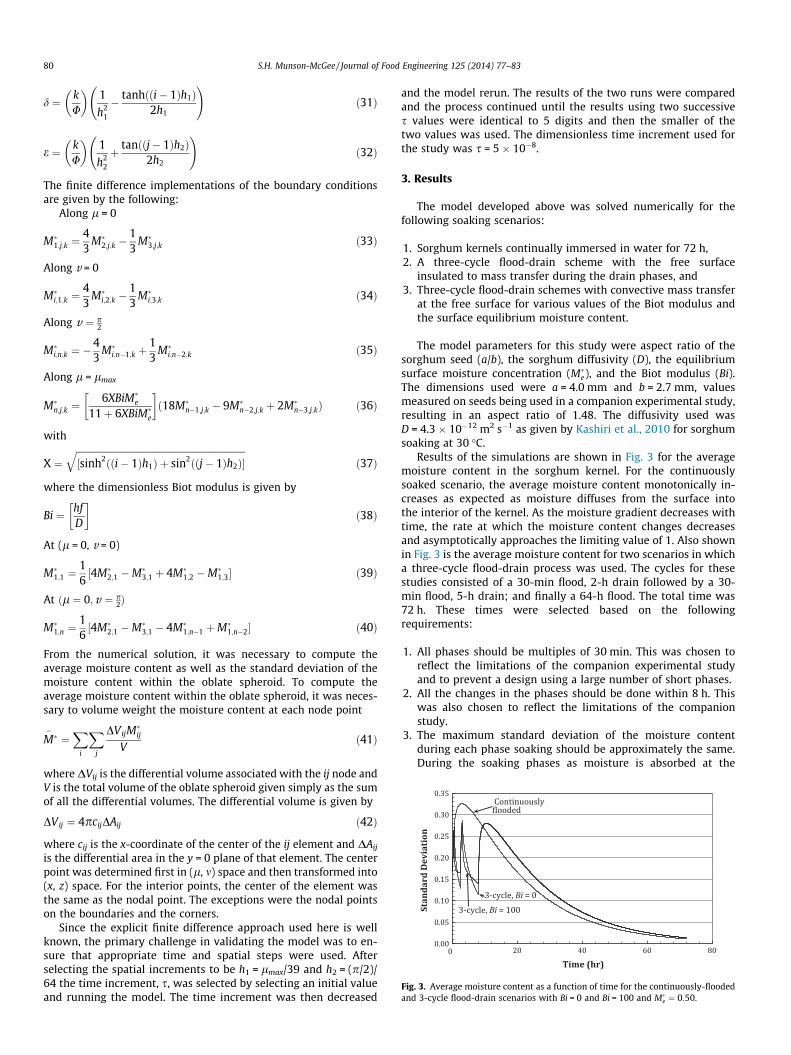
Fig. 3. Average moisture content as a function of time for the continuously-floodedand 3-cycle flood-drain scenarios with Bi = 0 and Bi = 100 and M�
e ¼ 0:50.
80 S.H. Munson-McGee / Journal of Food Engineering 125 (2014) 77–83
d ¼ kU
� 1
h21
� tanhðði� 1Þh1Þ2h1
!ð31Þ
e ¼ kU
� 1
h22
þ tanððj� 1Þh2Þ2h2
!ð32Þ
The finite difference implementations of the boundary conditionsare given by the following:
Along l = 0
M�1;j;k ¼
43
M�2;j;k �
13
M�3;j;k ð33Þ
Along v = 0
M�i;1;k ¼
43
M�i;2;k �
13
M�i;3;k ð34Þ
Along v ¼ p2
M�i;n;k ¼ �
43
M�i;n�1;k þ
13
M�i;n�2;k ð35Þ
Along l = lmax
M�n;j;k ¼
6XBiM�e
11þ 6XBiM�e
� �ð18M�
n�1;j;k � 9M�n�2;j;k þ 2M�
n�3;j;kÞ ð36Þ
with
X ¼ffiffiffiffiffiffiffiffiffiffiffiffiffiffiffiffiffiffiffiffiffiffiffiffiffiffiffiffiffiffiffiffiffiffiffiffiffiffiffiffiffiffiffiffiffiffiffiffiffiffiffiffiffiffiffiffiffiffiffiffiffiffiffiffiffiffiffiffiffiffiffiffiffi½sinh2ðði� 1Þh1Þ þ sin2ððj� 1Þh2Þ�
qð37Þ
where the dimensionless Biot modulus is given by
Bi ¼ hfD
� �ð38Þ
At (l = 0, v = 0)
M�1;1 ¼
16½4M�
2;1 �M�3;1 þ 4M�
1;2 �M�1;3� ð39Þ
At ðl ¼ 0;v ¼ p2Þ
M�1;n ¼
16½4M�
2;1 �M�3;1 � 4M�
1;n�1 þM�1;n�2� ð40Þ
From the numerical solution, it was necessary to compute theaverage moisture content as well as the standard deviation of themoisture content within the oblate spheroid. To compute theaverage moisture content within the oblate spheroid, it was neces-sary to volume weight the moisture content at each node point
M�� ¼
Xi
Xj
DVijM�ij
Vð41Þ
where DVij is the differential volume associated with the ij node andV is the total volume of the oblate spheroid given simply as the sumof all the differential volumes. The differential volume is given by
DVij ¼ 4pcijDAij ð42Þ
where cij is the x-coordinate of the center of the ij element and DAij
is the differential area in the y = 0 plane of that element. The centerpoint was determined first in (l, m) space and then transformed into(x, z) space. For the interior points, the center of the element wasthe same as the nodal point. The exceptions were the nodal pointson the boundaries and the corners.
Since the explicit finite difference approach used here is wellknown, the primary challenge in validating the model was to en-sure that appropriate time and spatial steps were used. Afterselecting the spatial increments to be h1 = lmax/39 and h2 = (p/2)/64 the time increment, s, was selected by selecting an initial valueand running the model. The time increment was then decreased
and the model rerun. The results of the two runs were comparedand the process continued until the results using two successives values were identical to 5 digits and then the smaller of thetwo values was used. The dimensionless time increment used forthe study was s = 5 � 10�8.
3. Results
The model developed above was solved numerically for thefollowing soaking scenarios:
1. Sorghum kernels continually immersed in water for 72 h,2. A three-cycle flood-drain scheme with the free surface
insulated to mass transfer during the drain phases, and3. Three-cycle flood-drain schemes with convective mass transfer
at the free surface for various values of the Biot modulus andthe surface equilibrium moisture content.
The model parameters for this study were aspect ratio of thesorghum seed (a/b), the sorghum diffusivity (D), the equilibriumsurface moisture concentration (M�
e), and the Biot modulus (Bi).The dimensions used were a = 4.0 mm and b = 2.7 mm, valuesmeasured on seeds being used in a companion experimental study,resulting in an aspect ratio of 1.48. The diffusivity used wasD = 4.3 � 10�12 m2 s�1 as given by Kashiri et al., 2010 for sorghumsoaking at 30 �C.
Results of the simulations are shown in Fig. 3 for the averagemoisture content in the sorghum kernel. For the continuouslysoaked scenario, the average moisture content monotonically in-creases as expected as moisture diffuses from the surface intothe interior of the kernel. As the moisture gradient decreases withtime, the rate at which the moisture content changes decreasesand asymptotically approaches the limiting value of 1. Also shownin Fig. 3 is the average moisture content for two scenarios in whicha three-cycle flood-drain process was used. The cycles for thesestudies consisted of a 30-min flood, 2-h drain followed by a 30-min flood, 5-h drain; and finally a 64-h flood. The total time was72 h. These times were selected based on the followingrequirements:
1. All phases should be multiples of 30 min. This was chosen toreflect the limitations of the companion experimental studyand to prevent a design using a large number of short phases.
2. All the changes in the phases should be done within 8 h. Thiswas also chosen to reflect the limitations of the companionstudy.
3. The maximum standard deviation of the moisture contentduring each phase soaking should be approximately the same.During the soaking phases as moisture is absorbed at the
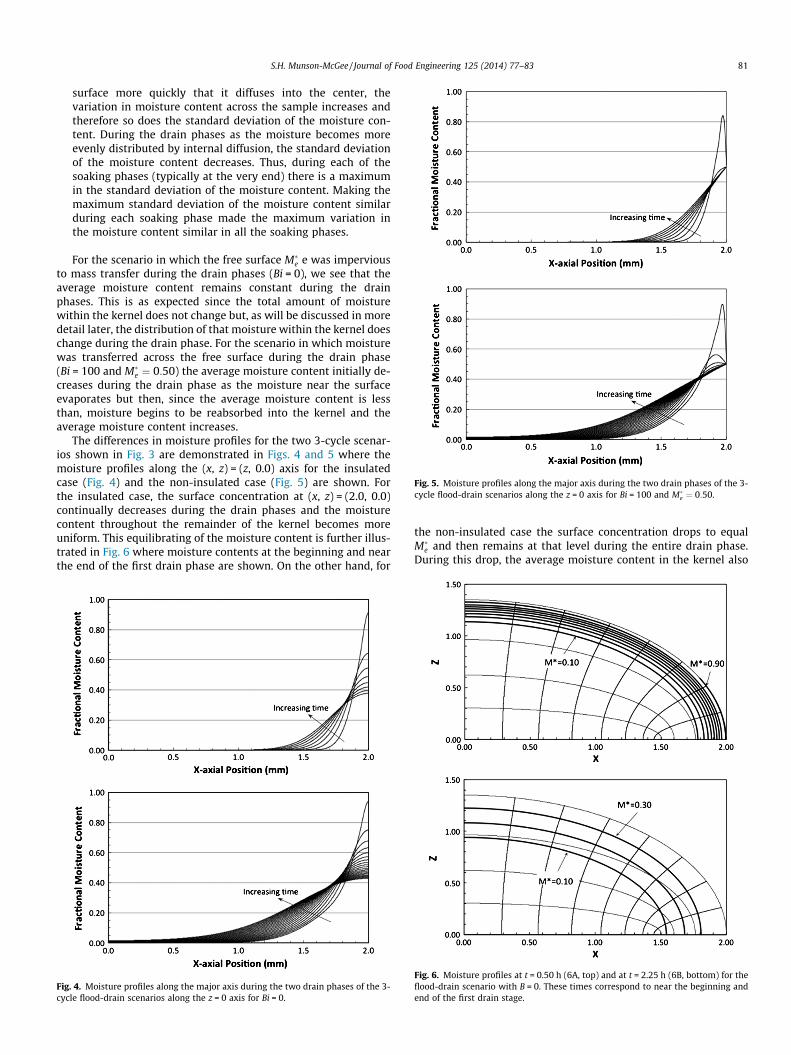
Fig. 5. Moisture profiles along the major axis during the two drain phases of the 3-cycle flood-drain scenarios along the z = 0 axis for Bi = 100 and M�
e ¼ 0:50.
S.H. Munson-McGee / Journal of Food Engineering 125 (2014) 77–83 81
surface more quickly that it diffuses into the center, thevariation in moisture content across the sample increases andtherefore so does the standard deviation of the moisture con-tent. During the drain phases as the moisture becomes moreevenly distributed by internal diffusion, the standard deviationof the moisture content decreases. Thus, during each of thesoaking phases (typically at the very end) there is a maximumin the standard deviation of the moisture content. Making themaximum standard deviation of the moisture content similarduring each soaking phase made the maximum variation inthe moisture content similar in all the soaking phases.
For the scenario in which the free surface M�e e was impervious
to mass transfer during the drain phases (Bi = 0), we see that theaverage moisture content remains constant during the drainphases. This is as expected since the total amount of moisturewithin the kernel does not change but, as will be discussed in moredetail later, the distribution of that moisture within the kernel doeschange during the drain phase. For the scenario in which moisturewas transferred across the free surface during the drain phase(Bi = 100 and M�
e ¼ 0:50) the average moisture content initially de-creases during the drain phase as the moisture near the surfaceevaporates but then, since the average moisture content is lessthan, moisture begins to be reabsorbed into the kernel and theaverage moisture content increases.
The differences in moisture profiles for the two 3-cycle scenar-ios shown in Fig. 3 are demonstrated in Figs. 4 and 5 where themoisture profiles along the (x, z) = (z, 0.0) axis for the insulatedcase (Fig. 4) and the non-insulated case (Fig. 5) are shown. Forthe insulated case, the surface concentration at (x, z) = (2.0, 0.0)continually decreases during the drain phases and the moisturecontent throughout the remainder of the kernel becomes moreuniform. This equilibrating of the moisture content is further illus-trated in Fig. 6 where moisture contents at the beginning and nearthe end of the first drain phase are shown. On the other hand, for
Fig. 4. Moisture profiles along the major axis during the two drain phases of the 3-cycle flood-drain scenarios along the z = 0 axis for Bi = 0.
the non-insulated case the surface concentration drops to equalM�
e and then remains at that level during the entire drain phase.During this drop, the average moisture content in the kernel also
Fig. 6. Moisture profiles at t = 0.50 h (6A, top) and at t = 2.25 h (6B, bottom) for theflood-drain scenario with B = 0. These times correspond to near the beginning andend of the first drain stage.
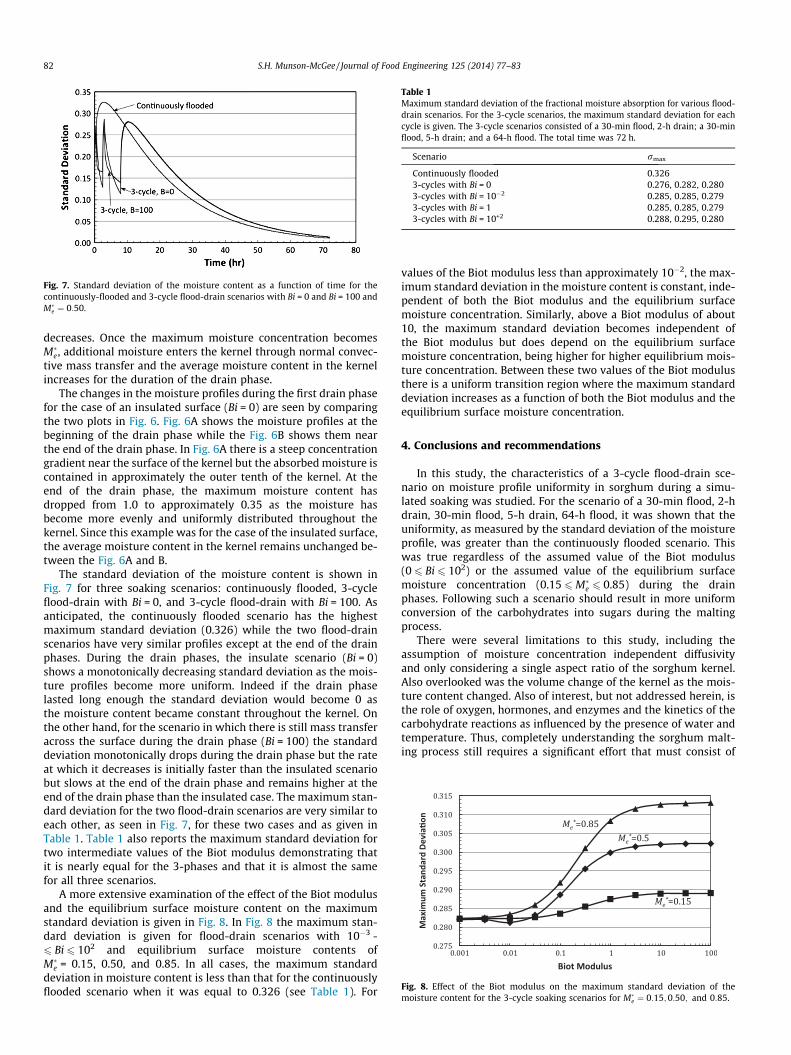
Fig. 7. Standard deviation of the moisture content as a function of time for thecontinuously-flooded and 3-cycle flood-drain scenarios with Bi = 0 and Bi = 100 andM�
e ¼ 0:50.
Table 1Maximum standard deviation of the fractional moisture absorption for various flood-drain scenarios. For the 3-cycle scenarios, the maximum standard deviation for eachcycle is given. The 3-cycle scenarios consisted of a 30-min flood, 2-h drain; a 30-minflood, 5-h drain; and a 64-h flood. The total time was 72 h.
Scenario rmax
Continuously flooded 0.3263-cycles with Bi = 0 0.276, 0.282, 0.2803-cycles with Bi = 10�2 0.285, 0.285, 0.2793-cycles with Bi = 1 0.285, 0.285, 0.2793-cycles with Bi = 10+2 0.288, 0.295, 0.280
Fig. 8. Effect of the Biot modulus on the maximum standard deviation of themoisture content for the 3-cycle soaking scenarios for M� ¼ 0:15;0:50; and 0:85.
82 S.H. Munson-McGee / Journal of Food Engineering 125 (2014) 77–83
decreases. Once the maximum moisture concentration becomesM�
e , additional moisture enters the kernel through normal convec-tive mass transfer and the average moisture content in the kernelincreases for the duration of the drain phase.
The changes in the moisture profiles during the first drain phasefor the case of an insulated surface (Bi = 0) are seen by comparingthe two plots in Fig. 6. Fig. 6A shows the moisture profiles at thebeginning of the drain phase while the Fig. 6B shows them nearthe end of the drain phase. In Fig. 6A there is a steep concentrationgradient near the surface of the kernel but the absorbed moisture iscontained in approximately the outer tenth of the kernel. At theend of the drain phase, the maximum moisture content hasdropped from 1.0 to approximately 0.35 as the moisture hasbecome more evenly and uniformly distributed throughout thekernel. Since this example was for the case of the insulated surface,the average moisture content in the kernel remains unchanged be-tween the Fig. 6A and B.
The standard deviation of the moisture content is shown inFig. 7 for three soaking scenarios: continuously flooded, 3-cycleflood-drain with Bi = 0, and 3-cycle flood-drain with Bi = 100. Asanticipated, the continuously flooded scenario has the highestmaximum standard deviation (0.326) while the two flood-drainscenarios have very similar profiles except at the end of the drainphases. During the drain phases, the insulate scenario (Bi = 0)shows a monotonically decreasing standard deviation as the mois-ture profiles become more uniform. Indeed if the drain phaselasted long enough the standard deviation would become 0 asthe moisture content became constant throughout the kernel. Onthe other hand, for the scenario in which there is still mass transferacross the surface during the drain phase (Bi = 100) the standarddeviation monotonically drops during the drain phase but the rateat which it decreases is initially faster than the insulated scenariobut slows at the end of the drain phase and remains higher at theend of the drain phase than the insulated case. The maximum stan-dard deviation for the two flood-drain scenarios are very similar toeach other, as seen in Fig. 7, for these two cases and as given inTable 1. Table 1 also reports the maximum standard deviation fortwo intermediate values of the Biot modulus demonstrating thatit is nearly equal for the 3-phases and that it is almost the samefor all three scenarios.
A more extensive examination of the effect of the Biot modulusand the equilibrium surface moisture content on the maximumstandard deviation is given in Fig. 8. In Fig. 8 the maximum stan-dard deviation is given for flood-drain scenarios with 10�3 -6 Bi 6 102 and equilibrium surface moisture contents ofM�
e = 0.15, 0.50, and 0.85. In all cases, the maximum standarddeviation in moisture content is less than that for the continuouslyflooded scenario when it was equal to 0.326 (see Table 1). For
values of the Biot modulus less than approximately 10�2, the max-imum standard deviation in the moisture content is constant, inde-pendent of both the Biot modulus and the equilibrium surfacemoisture concentration. Similarly, above a Biot modulus of about10, the maximum standard deviation becomes independent ofthe Biot modulus but does depend on the equilibrium surfacemoisture concentration, being higher for higher equilibrium mois-ture concentration. Between these two values of the Biot modulusthere is a uniform transition region where the maximum standarddeviation increases as a function of both the Biot modulus and theequilibrium surface moisture concentration.
4. Conclusions and recommendations
In this study, the characteristics of a 3-cycle flood-drain sce-nario on moisture profile uniformity in sorghum during a simu-lated soaking was studied. For the scenario of a 30-min flood, 2-hdrain, 30-min flood, 5-h drain, 64-h flood, it was shown that theuniformity, as measured by the standard deviation of the moistureprofile, was greater than the continuously flooded scenario. Thiswas true regardless of the assumed value of the Biot modulus(0 6 Bi 6 102) or the assumed value of the equilibrium surfacemoisture concentration (0.15 6M�
e 6 0.85) during the drainphases. Following such a scenario should result in more uniformconversion of the carbohydrates into sugars during the maltingprocess.
There were several limitations to this study, including theassumption of moisture concentration independent diffusivityand only considering a single aspect ratio of the sorghum kernel.Also overlooked was the volume change of the kernel as the mois-ture content changed. Also of interest, but not addressed herein, isthe role of oxygen, hormones, and enzymes and the kinetics of thecarbohydrate reactions as influenced by the presence of water andtemperature. Thus, completely understanding the sorghum malt-ing process still requires a significant effort that must consist of
e
S.H. Munson-McGee / Journal of Food Engineering 125 (2014) 77–83 83
both experimental and modeling efforts based on fundamentalchemical and physical principles.
References
Aquerreta, J., Iguaz, A., Arroqui, C., Virseda, P., 2007. Effect of high temperatureintermittent drying and tempering on rough rice quality. J. Food Eng. 80 (2),611–618.
Baini, R., Langrish, T.A.G., 2007. Choosing an appropriate drying model forintermittent and continuous drying of bananas. J. Food Eng. 79 (1), 330–343.
Bamforch, C., 2003. Beer, Tap into the art and science of brewing, 2nd edition.Oxford University Press, NY.
Briggs, D.E., 1998. Malts and Malting. Blackie Academic & Professional, New York.Chua, K.J., Mujumdar, A.S., Chou, S.K., 2003. Intermittent drying of bioproducts – an
overview. Bioresour. Technol. 90 (3), 285–295.Cihan, A., Ece, M.C., 2001. Liquid diffusion model for intermittent drying of rough
rice. J. Food Eng. 49 (4), 327.Cihan, A., Kahveci, K., Hacihafizoglu, O., 2007. Modelling of intermittent drying of
thin layer rough rice. J. Food Eng. 79 (1), 293–298.Cihan, A., Kahveci, K., Hacihafizoglu, O., de Lima, A.G.B., 2008. A diffusion based
model for intermittent drying of rough rice. Heat Mass Transf. 44 (8), 905–911.Crank, J., 1975. The Mathematics of Diffusion, 2nd edition. Oxford University Press,
New York.de Lima, A.G.B., Nebra, S.A., 2001. Theoretical study of intermittent drying
(tempering) in prolate spheroidal bodies. Drying Technol. 19 (8), 1569–1589.do Carmo, J.E.F., de Lima, A.G.B., 2008. Mass transfer inside oblate spheroidal solids:
modeling and simulation. Braz. J. Chem. Eng. 25 (1), 19–26.do Carmo, J.E.F., de Lima, A.G.B., Gilson, A., e Silva, C.J., 2012. Continuous and
Intermittent Drying (Tempering) of Oblate Spheroidal Bodies: Modeling andSimulation. Int J Food Eng 8(3) (Article Number: 20).
Dong, R.J., Lu, Z.H., Liu, Z.Q., Nishiyama, Y., Cao, W., 2009. Moisture distribution in arice kernel during tempering drying. J. Food Eng. 91 (1), 126–132.
Esturk, O., 2012. Intermittent and continuous microwave-convective air-dryingcharacteristics of sage (Salvia officinalis) leaves. Food Bioprocess Technol. 5 (5),1664–1673.
Fan, C.C., Liaw, S.P., Fu, W.R., Pan, B.S., 2003. Mathematical model for prediction ofintermittent drying and pressing process of mullet roe. J. Food Sci. 68 (3), 886–891.
Fan, L., Chu, P., Shellenberger, J.A., 1963. Diffusion of water in kernels of corn andsorghum. Cereal Chem. 40 (4), 303–313.
Holowaty, S.A., Ramallo, L.A., Schmalko, M.E., 2012. Intermittent drying simulationin a deep bed dryer of yerba mate. J. Food Eng. 111 (1), 110–114.
Iguaz, A., Rodriguez, M., Virseda, P., 2006. Influence of handling and processing ofrough rice on fissures and head rice yields. J. Food Eng. 77 (4), 803–809.
Kashiri, M., Kashaninejad, M., Aghajani, N., 2010. Modeling water absorption ofsorghum during soaking. Latin Am. Appl. Res. 40, 383–388.
Kashiri, M., Garmakhany, A.D., Dehghani, A.A., 2012. Modeling of sorghum soakingusing artificial neural networks (MLP). Qual. Assur. Safety Crops Foods 4 (4),179–184.
Korn, G.A., Korn, T.M., 1968. Mathematical Handbook for Scientists and Engineers.McGraw Hill Book Company, NY.
Lewis, M.J., Young, T.W., 2002. Brewing, 2nd edition. Kluwer Academic/PlenumPublishers, NY.
Madamba, P.S., Yabes, R.P., 2005. Determination of the optimum intermittentdrying conditions for rough rice (Oryza sativa, L.). LWT-Food Sci. Technol. 38 (2),157–165.
Moon, P., Spencer, D.E., 1988. Field Theory Handbook, 2nd edition. Springer-Verlag,New York.
Putranto, A., Chen, X.D., Xiao, Z.Y., Webley, P.A., 2011. Mathematical modeling ofintermittent and convective drying of rice and coffee using the reactionengineering approach (REA). J. Food Eng. 105 (4), 638–646.
Ramallo, L.A., Lovera, N.N., Schmalko, M.E., 2010. Effect of the application ofintermittent drying on Ilex paraguariensis quality and drying kinetics. J. FoodEng. 97 (2), 188–193.
Shei, H.J., Chen, Y.L., 1999. Thin-layer models for intermittent drying of rough rice.Cereal Chem. 76 (4), 577–581.
Soysal, Y., Arslan, M., Keskin, M., 2009. Intermittent microwave-convective airdrying of oregano. Food Sci. Technol. Int. 15 (4), 397–406.
Xing, H.J., Takhar, P.S., Helms, G., He, B., 2007. NMR imaging of continuous andintermittent drying of pasta. J. Food Eng. 78 (1), 61–68.
Zhu, Y., Pan, Z.L., McHugh, T.H., Barrett, D.M., 2010. Processing and qualitycharacteristics of apple slices processed under simultaneous infrared dry-blanching and dehydration with intermittent heating. J. Food Eng. 97 (1), 8–16.