mohair market value chain profile 2011-12 · a profile of the south african mohair market value...
TRANSCRIPT
1
A PROFILE OF THE SOUTH AFRICAN MOHAIR MARKET VALUE CHAIN
2011
Directorate Marketing Private Bag X 15
Arcadia 0007
Tel: 012 319 8455 Fax: 012 319 8131
E-mail: [email protected] www.daff.gov.za

2
Table of Contents
1. DESCRIPTION OF THE INDUSTRY. 3
2. PRODUCTION OF MOHAIR 5
3. MARKET STRUCTURE 6
3.1 Domestic market and prices 6
4. PRODUCTION AREAS OF MOHAIR IN SA (2010 PERIOD) 6
5. PRODUCTION AROUND THE WORLD 8
6. EXPORTS VOLUMES 9
7. SHARE ANALYSIS 24
8. IMPORTS VOLUMES 26
9. MOHAIR VALUE CHAIN 30
10. BARRIERS TO PARTICIPATION BY THE EMERGING SECTOR 31
11. BLACK ECONOMIC EMPOWERMENT INITIATIVES 31
12. MARKET ACCESS 33
12.1 Export tariffs for mohair 33
12.2 Import tariffs for mohair 34
13. MARKET INTELLIGENCE 35
13. ACKNOWLEDGEMENTS ERROR! BOOKMARK NOT DEFINED.

3
1. DESCRIPTION OF THE INDUSTRY.
South Africa is recognized as the most reliable source of mohair in the world because angora goats grow their fleeces all year-round which allows farmers to auction their produce two seasons a year - for summer and winter sales. South Africa currently produces 54% of total world’s mohair production. On average the annual average commercial production is about 4 million kg.
Angora goats are kept primarily for mohair production. Mohair is made of strong elastic fibres that form a fabric which is easily dyed, mainly used in the textile industry and is especially suitable for apparel, knitwear, curtaining, upholstery material, socks, shawls and accessories. November is a beautiful time of the year in the Karoo with many goats with kids and fleeces in full growth.
Angora goats were introduced in South Africa by Colonel John Henderson from Turkey with a consignment of twelve rams and one ewe in 1838. The rams were rendered infertile before leaving Turkey, but that happily the ewe was pregnant and gave birth to a healthy ram kid during the voyage. Although several further importations of Turkish stock were made up to 1896, the above-mentioned ewe and her kid formed the foundation of the Angora goat and mohair industry in South Africa.
Mohair growing has taken root and developed in this country. The flocks of these "smiling" goats have become a regular feature of the countryside, especially in the arid Karoo areas and south eastern Free State. The expertise of South African farmers had improved the breed and especially the quality of the hair, so that it now far surpasses the original, still to be found in regions that form modern Turkey (Momentos).
Today mohair is grown in several countries, mainly arid areas like The Western USA (Texas, Arizona and New Mexico), Lesotho and small quantities in Australia. Surprisingly some mohair is now grown in Great Britain and also New Zealand, although these latter tend to be enthusiasts, with over 60% of the world supply coming from South Africa (Momentos).

4
The contribution of the mohair industry to the gross value of agricultural production is summarized in Figure 1 below.
Figure 1: Gross value of Mohair Production
50 000
100 000
150 000
200 000
250 000
300 000
20
01
20
02
20
03
20
04
20
05
20
06
20
07
20
08
20
09
20
10
Period (Years)
Gro
ss V
alu
e (
'000 R
an
ds)
Source: Economic Analysis and Statistics, DAFF
Figure 1 confirms gross value of production of mohair in South Africa between 2001 and 2010 period. The figure further confirms that gross value of mohair production attained a peak in 2006 at a gross value of about R252 000 as against the lowest gross value of mohair production attained in 2003 at approximately R150 000. The figure also confirms that between 2007 and 2009 years, there was a decline in gross value of production of mohair due to the low levels of mohair production. The low levels of mohair production are also as a result of the fluctuations in mohair production during the same period under review.
In 2010 there was a 13.2% increase in gross value of mohair production in South Africa as compared to 2009 year.
5
2. PRODUCTION OF MOHAIR
Figure 2: Mohair production in South Africa
0
500
1 000
1 500
2 000
2 500
3 000
3 500
4 000
4 500
5 000
20
01
20
02
20
03
20
04
20
05
20
06
20
07
20
08
20
09
20
10
Period (Years)
Pro
du
cti
on
(to
ns)
Source: Economic Analysis & Statistics, DAFF
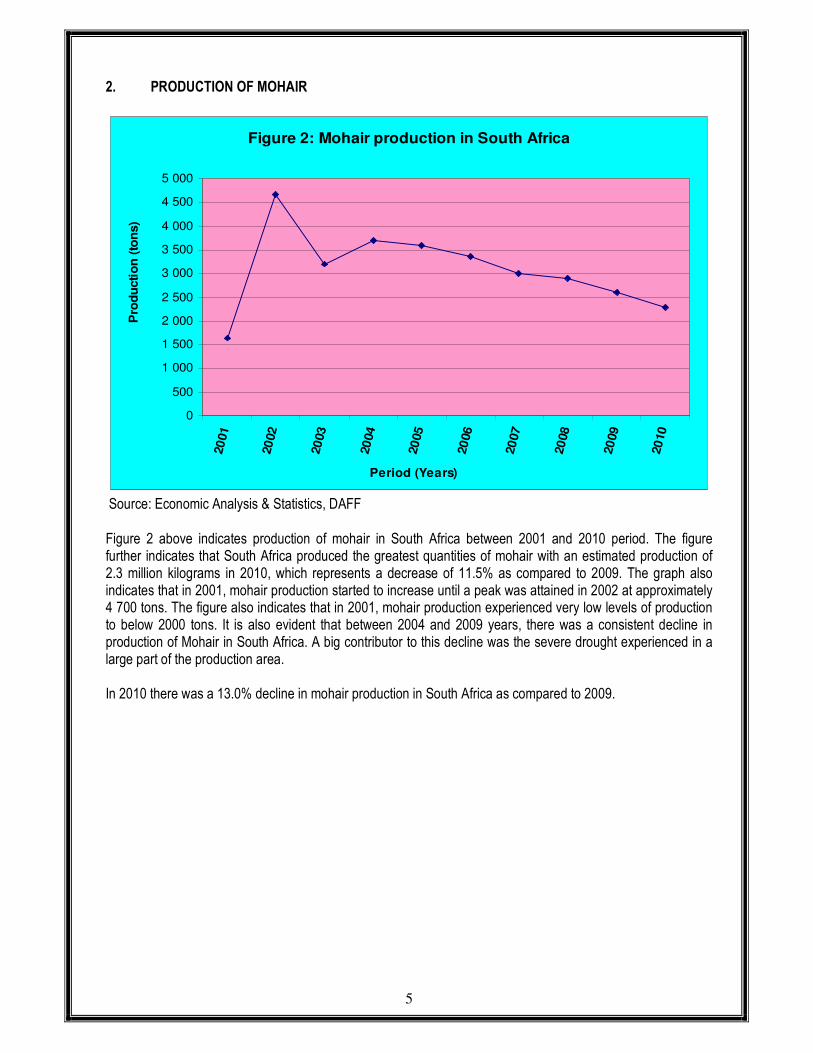
Figure 2 above indicates production of mohair in South Africa between 2001 and 2010 period. The figure further indicates that South Africa produced the greatest quantities of mohair with an estimated production of 2.3 million kilograms in 2010, which represents a decrease of 11.5% as compared to 2009. The graph also indicates that in 2001, mohair production started to increase until a peak was attained in 2002 at approximately 4 700 tons. The figure also indicates that in 2001, mohair production experienced very low levels of production to below 2000 tons. It is also evident that between 2004 and 2009 years, there was a consistent decline in production of Mohair in South Africa. A big contributor to this decline was the severe drought experienced in a large part of the production area. In 2010 there was a 13.0% decline in mohair production in South Africa as compared to 2009.

6
3. MARKET STRUCTURE
3.1 Domestic market and prices
Mohair is used to produce fabric and also for export. There are 6 main buyers of mohair in South Africa, 3 auction ports, 2 brokers and 26 manufacturers.
Mohair is a fashion fibre. Prices are determined by demand and supply at one of 3 auction ports.
Figure 3: Mohair Producer Prices
0.00
20.00
40.00
60.00
80.00
100.00
120.00
140.00
20
01
20
02
20
03
20
04
20
05
20
06
20
07
20
08
20
09
20
10
Period (Years)
Pri
ces (
Ran
ds/
Kg
)
Source: Economic Analysis & Statistics, DAFF
Figure 3 depicts prices of mohair in South Africa between 2001 and 2010 period. The graph further depicts that in 2001 mohair producer prices started to increase, and during the same period attained a peak at approximately R118.00 per kilogram. The graph further depicts between 2002 and 2004 years, mohair producer prices were very low between R40.00 and R60.00 rands per kilogram. The graph also depicts that between 2005 and 2007 years, prices of mohair consistently improved, and then a decline occurred in 2008. In 2010, a second peak in mohair producer prices was attained at approximately R97.00 per kilogram.
There was a 17.6% increase in mohair producer prices in South Africa during 2010 as compared to 2009.
4. PRODUCTION AREAS OF MOHAIR IN SA (2010 period)
The first importation of angora goats was destined for Caledon in the Western Cape but over the course of time they spread to the Eastern Cape where the climate and vegetation are more suitable for the rearing of angora goats and the production of high quality mohair. In due course, Jansenville and the surrounding districts became the hub of the mohair industry in South Africa and to this day the primary industry is centered on the small town of Jansenville. This is clearly illustrated by the fact that the offices of both the South African Mohair Growers' Association and the Angora Goat Stud Breeders' Society of South Africa are located in

7
Jansenville. The leading angora studs and the biggest concentration of stud breeders are found in the Jansenville district, while many of the leaders of the mohair industry hail from this area (Ikhwezi).
Figure 4: Top mohair production areas in South Africa - 2010
Willowmore
18%
Aberdeen
17%
Somerset-East
16%
Cradock
14%
Jansenville
13%
Port Elizabeth
8%
Graaf-Reinet
7%
Beaufort West
7%
Willowmore Aberdeen Somerset-East Cradock
Jansenville Port Elizabeth Graaf-Reinet Beaufort West
Source: Absa Agri-Business
Figure 4 illustrates that total production is approximately 35.9 thousand tons during the 2010 period. Figure 4 further illustrates the main mohair producing areas such as Willowmore accounting for 18%, Aberdeen accounting for 17%, Somerset East accounting for 16%, Cradock accounting for 14% and Jansenville accounting for 13%. The figure also illustrates that mohair is also produced in smaller volumes in areas such as Port Elizabeth, Beaufort West and Graaf-Reinet.
8
5. PRODUCTION AROUND THE WORLD
Figure 5: Major destinations of mohair from South Africa - 2010
United Kingdom
16%
Italy
38%
Taiwan
7%
India
2%
China
31%
Korea
2%
Japan
4%
Germany
0%
United Kingdom Italy Taiwan India China Korea Japan Germany
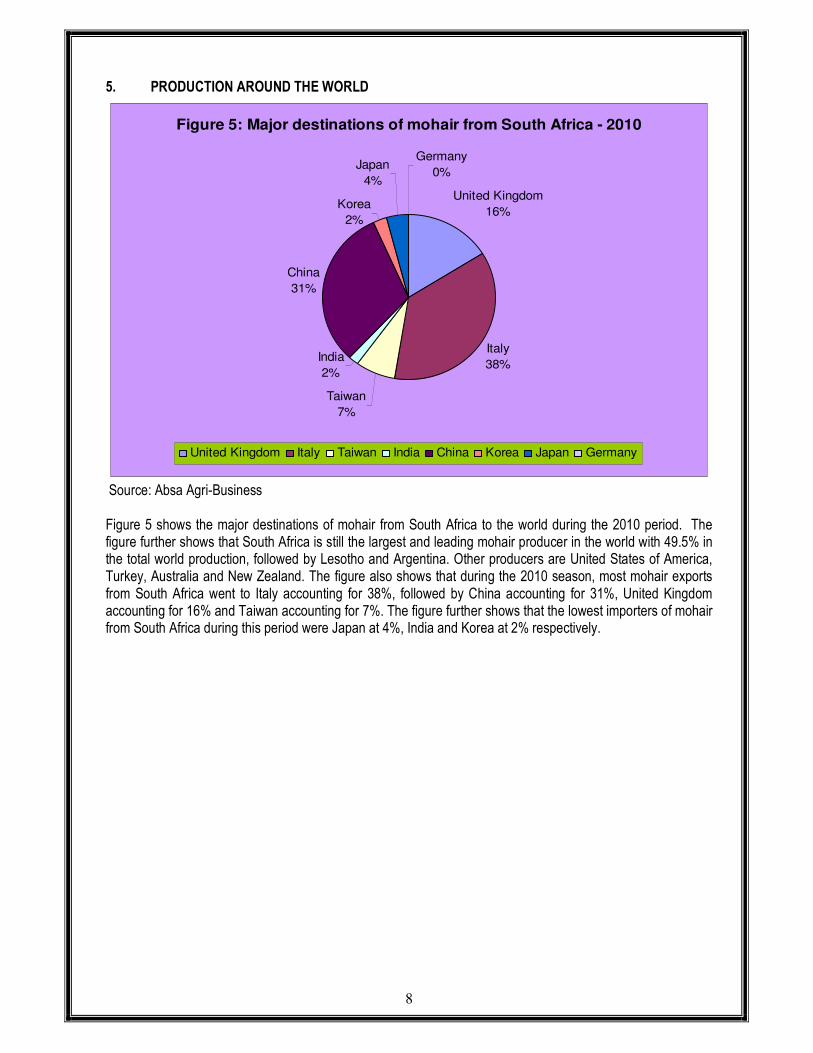
Source: Absa Agri-Business Figure 5 shows the major destinations of mohair from South Africa to the world during the 2010 period. The figure further shows that South Africa is still the largest and leading mohair producer in the world with 49.5% in the total world production, followed by Lesotho and Argentina. Other producers are United States of America, Turkey, Australia and New Zealand. The figure also shows that during the 2010 season, most mohair exports from South Africa went to Italy accounting for 38%, followed by China accounting for 31%, United Kingdom accounting for 16% and Taiwan accounting for 7%. The figure further shows that the lowest importers of mohair from South Africa during this period were Japan at 4%, India and Korea at 2% respectively.

9
6. EXPORTS VOLUMES
Figure 6: Exports volumes of Mohair to various regions
0
100
200
300
400
500
600
700
800
900
Period (Years)
Exp
ort
Qu
an
tity
(to
ns)
Africa 0 0 0 0 0 0.007 0 2.783 0
Americas 0 0 12.557 0 0 0 0.001 0 0.003
Asia 80.342 114.056 19.494 0.972 0.19 0.273 0 0 0
Europe 782.324 767.742 801.546 798.108 600.252 137.549 0 25.443 0
2002 2003 2004 2005 2006 2007 2008 2009 2010
Source: Quantec Figure 6 indicates exports volumes of mohair from South Africa to various regions of the world between 2002 and 2010 period. The graph further indicates that the major world market for mohair from South Africa was Europe, followed by very low export volumes to Asia during the period under scrutiny. The figure also indicates that exports volumes of mohair from South Africa to Europe started to increase in 2004 and during the same period attained a peak at an export quantity of about 801.55 tons. The graph also indicates that exports volumes of Mohair from South Africa to Asia attained a peak in 2003 at an export quantity of approximately 114.06 tons. There was a 100% decline in exports volumes of mohair from South Africa to Europe in 2010 as compared to 2009.

10
Figure 7: Exports volumes of Mohair to Africa
0
0.5
1
1.5
2
2.5
3
Period (Years)
Exp
ort
Qu
an
tity
(to
ns)
SADC 0 0 0 0 0 0.007 0 2.783 0
2002 2003 2004 2005 2006 2007 2008 2009 2010
Source: Quantec Figure 7 depicts volumes of mohair exports from South Africa to Africa between 2002 and 2010 period. The graph further depicts that during the period under review, the major export market for mohair from South Africa to Africa was the SADC region. The figure also depicts that exports of Mohair from South Africa to SADC started to increase in 2007 at 0.007 tons, and in 2009 a peak in exports of mohair from South Africa to SADC was attained at approximately 2.78 tons. The graph further depicts that between 2002 and 2006 years and again in 2008 and 2010 years, there were no exports of mohair from South Africa to SADC. In 2010 there was a 100% decline in exports volumes of mohair from South Africa to SADC as compared to 2009.

11
Figure 8: Exports volumes of Mohair to the SADC region
0
0.5
1
1.5
2
2.5
3
Period (Years)
Exp
ort
Qu
an
tity
(to
ns)
Mauritius 0 0 0 0 0 0.007 0 0 0
Zambia 0 0 0 0 0 0 0 2.783 0
2002 2003 2004 2005 2006 2007 2008 2009 2010
Source: Quantec Figure 8 indicates volumes of mohair exports from South Africa to the SADC region between 2002 and 2010 period. The graph further indicates that during the period under review, the major export market for mohair from South Africa to the SADC region was Zambia, followed by very intermittent exports to Mauritius. The figure also indicates that exports of mohair from South Africa to Zambia started to increase in 2009, and during the same period attained a peak at an export volume of approximately 2.78 tons. The graph further indicates that between 2002 and 2006 years, there were no exports of mohair to both Zambia and Mauritius. The figure also indicates that between 2008 and 2010 years, South Africa did not export mohair to both Zambia and Mauritius. In 2010, there was a 100% decline in exports volumes of mohair from South Africa to Zambia as compared to 2009.

12
Figure 9: Exports volumes of mohair to the Americas
0
2
4
6
8
10
12
14
Period (Years)
Exp
ort
Qu
an
tity
(to
ns)
NAFTA 0 0 12.557 0 0 0 0.001 0 0.003
2002 2003 2004 2005 2006 2007 2008 2009 2010
Source: Quantec Figure 9 illustrates exports volumes of mohair from South Africa to the Americas between 2002 and 2010 period. The graph further illustrates that during the period under review, the major export market for mohair from South Africa to Americas was NAFTA. The figure also illustrates that exports of mohair from South Africa to NAFTA started to increase in 2004, and during the same period attained a peak at an export volume of approximately 12.56 tons. The graph further illustrates that between 2002 and 2003 years and again between 2005 and 2007 years, there were no exports of mohair from South Africa to NAFTA. There was a 100% increase in exports volumes of mohair from South Africa to NAFTA in 2010 as compared to 2009.

13
Figure 10: Exports volumes of Mohair to NAFTA
0
2
4
6
8
10
12
14
Period (Years)
Exp
ort
Qu
an
tity
(to
ns)
Canada 0 0 12.557 0 0 0 0 0 0
United States 0 0 0 0 0 0 0.001 0 0.003
2002 2003 2004 2005 2006 2007 2008 2009 2010
Source: Quantec
Figure 10 shows exports volumes of mohair from South Africa to NAFTA between 2002 and 2010 period. The graph further shows that during the period under scrutiny, the major export market for mohair from South Africa to NAFTA was Canada, followed by very low export volumes of mohair to United States. The figure also shows that exports of mohair from South Africa to Canada started to increase in 2004, and during the same period attained a peak at an export volume of approximately 12 56 tons. The graph further shows that between 2002 and 2003 years and again between 2005 and 2010 years, there were no exports of mohair from South Africa to Canada. The graph also shows that between 2002 and 2007 years and again 2009, there were no exports of mohair from South Africa to United States. In 2010, there was a 100% decline in exports volumes of mohair from South Africa to Canada as compared to 2004.
14
Figure 11: Exports volumes of Mohair to Asia
0
20
40
60
80
100
120
Period (Years)
Exp
ort
Qu
an
tity
(to
ns)
Eastern Asia 31.765 103.018 0 0 0 0 0 0 0
South-central Asia 47.345 10.599 18.878 0 0 0 0 0 0
South-eastern Asia 1.232 0.439 0.616 0.972 0.19 0.273 0 0 0
2002 2003 2004 2005 2006 2007 2008 2009 2010
Source: Quantec
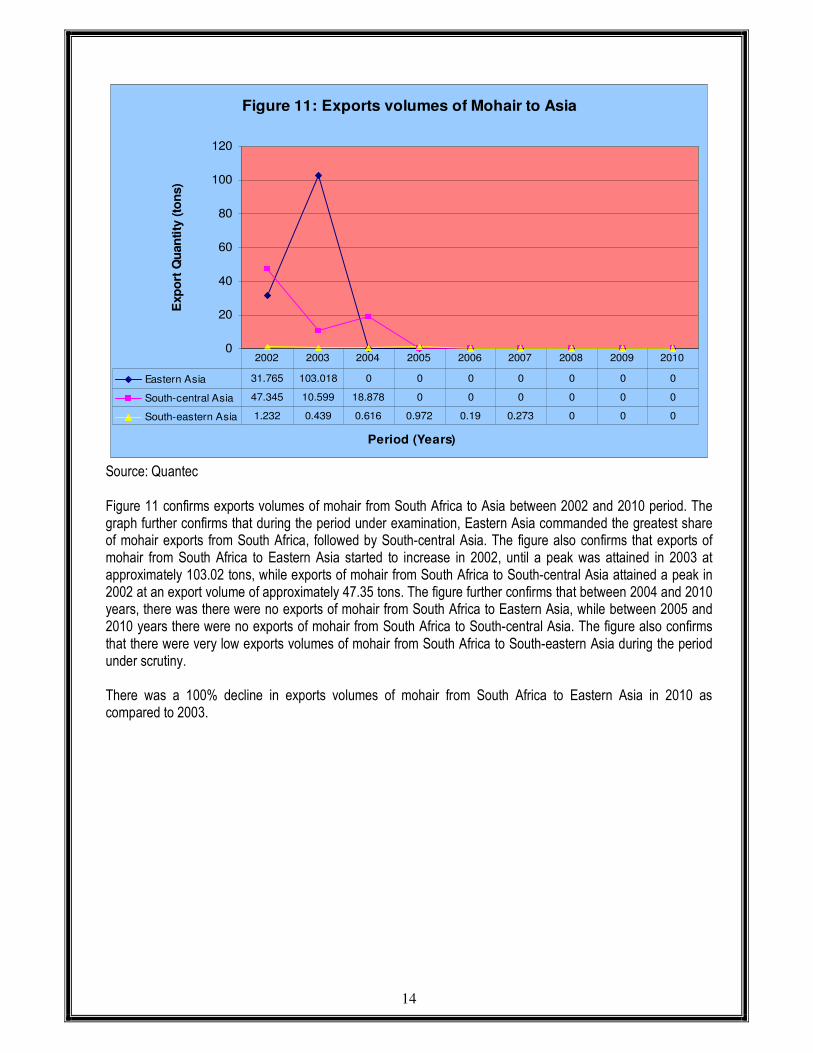
Figure 11 confirms exports volumes of mohair from South Africa to Asia between 2002 and 2010 period. The graph further confirms that during the period under examination, Eastern Asia commanded the greatest share of mohair exports from South Africa, followed by South-central Asia. The figure also confirms that exports of mohair from South Africa to Eastern Asia started to increase in 2002, until a peak was attained in 2003 at approximately 103.02 tons, while exports of mohair from South Africa to South-central Asia attained a peak in 2002 at an export volume of approximately 47.35 tons. The figure further confirms that between 2004 and 2010 years, there was there were no exports of mohair from South Africa to Eastern Asia, while between 2005 and 2010 years there were no exports of mohair from South Africa to South-central Asia. The figure also confirms that there were very low exports volumes of mohair from South Africa to South-eastern Asia during the period under scrutiny. There was a 100% decline in exports volumes of mohair from South Africa to Eastern Asia in 2010 as compared to 2003.

15
Figure 12: Exports volumes of Mohair to South-Central Asia
0
5
10
15
20
25
30
35
40
45
50
Period (Years)
Exp
ort
Qu
an
tity
(to
ns)
India 47.345 10.599 18.878 0 0 0 0 0 0
2002 2003 2004 2005 2006 2007 2008 2009 2010
Source: Quantec Figure 12 depicts exports volumes of mohair from South Africa to South-central Asia between 2002 and 2010 period. The graph further depicts that during the period under review, India commanded the greatest share of mohair exports from South Africa to South-central Asia. The figure also depicts that exports of mohair from South Africa to India started to increase in 2002 and during the same year attained a peak at approximately 47.35 tons. The graph also depicts that there was a dramatic decline in exports of mohair from South Africa to India in 2003. The figure further depicts that between 2005 and 2010 years, there were no exports of mohair from South Africa to India. In 2010, there was a 100% decline in exports volumes of mohair from South Africa to India as compared to 2004.
16
Figure 13: Exports volumes of Mohair to Eastern Asia
0
10
20
30
40
50
60
70
80
90
Period (Years)
Exp
ort
Qu
an
tity
(to
ns)
China 21.011 84.517 0 0 0 0 0 0 0
Japan 0 2.872 0 0 0 0 0 0 0
Taiwan Province of China 10.754 15.629 0 0 0 0 0 0 0
2002 2003 2004 2005 2006 2007 2008 2009 2010
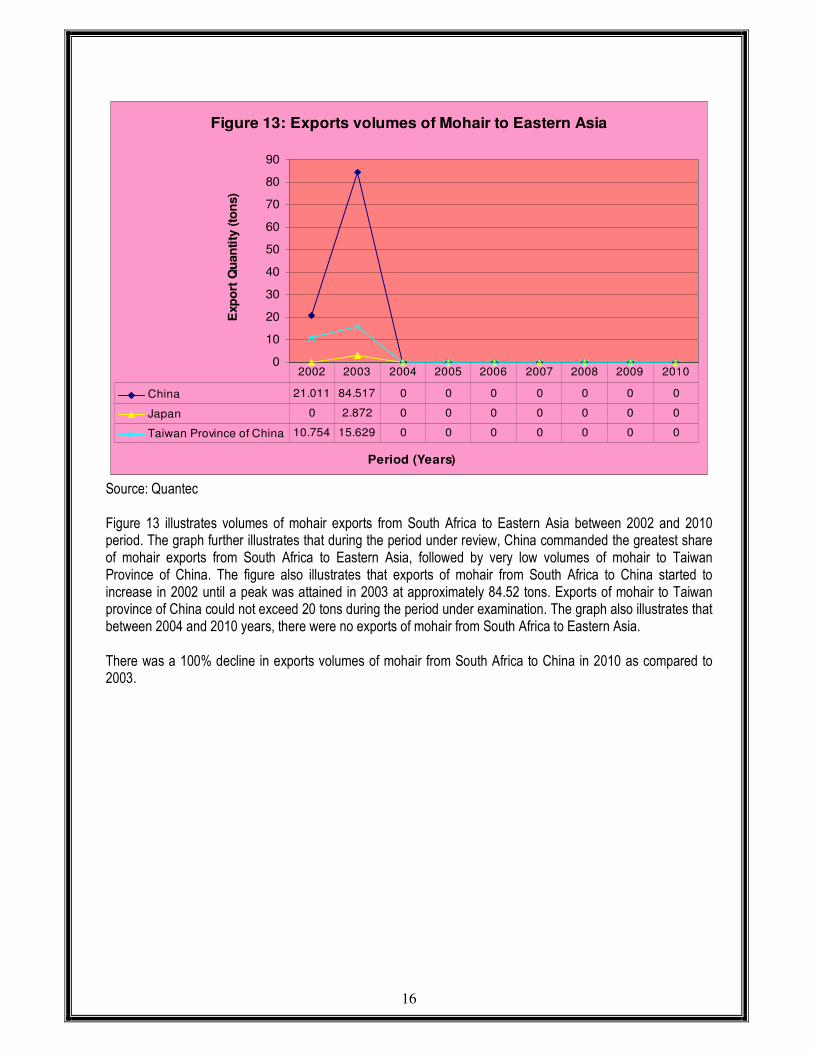
Source: Quantec Figure 13 illustrates volumes of mohair exports from South Africa to Eastern Asia between 2002 and 2010 period. The graph further illustrates that during the period under review, China commanded the greatest share of mohair exports from South Africa to Eastern Asia, followed by very low volumes of mohair to Taiwan Province of China. The figure also illustrates that exports of mohair from South Africa to China started to increase in 2002 until a peak was attained in 2003 at approximately 84.52 tons. Exports of mohair to Taiwan province of China could not exceed 20 tons during the period under examination. The graph also illustrates that between 2004 and 2010 years, there were no exports of mohair from South Africa to Eastern Asia. There was a 100% decline in exports volumes of mohair from South Africa to China in 2010 as compared to 2003.

17
Figure 14: Exports volumes of Mohair to Europe
0
100
200
300
400
500
600
700
800
900
Period (Years)
Exp
ort
Qu
an
tity
(to
ns)
European Union 782.324 767.742 801.546 798.108 600.252 137.549 0 25.443 0
2002 2003 2004 2005 2006 2007 2008 2009 2010
Source: Quantec Figure 14 shows volumes of mohair exports from South Africa to Europe between 2002 and 2010 period. The graph further shows that during the period under scrutiny, European Union commanded the greatest share of exports of mohair from South Africa to Europe. The graph also shows that exports of mohair to the European Union started to increase in 2004 and during the same period attained a peak at an export volume of approximately 801.55 tons. The graph also shows that between 2005 and 2007 years, there was a dramatic decline in exports of mohair from South Africa to the European Union during the period under examination. In 2008 and 2010 years, there were no exports of mohair from South Africa to the European Union. In 2009, there was a slight increase in exports of mohair to the European Union to approximately 25.4 tons. In 2010, there was a 100% decline in exports volumes of mohair from South Africa to European Union as compared to 2009.
18
Figure 15: Exports volumes of Mohair to European Union
0
100
200
300
400
500
600
700
800
900
Period (Years)
Exp
ort
Qu
an
tity
(to
ns)
Germany 0 4.3 0 0 0 0 0 0 0
France 648.514 730.281 791.788 793.484 600.249 137.549 0 0 0
United Kingdom 103.799 19.057 0.018 4.624 0.003 0 0 25.443 0
Ireland 0 0 9.74 0 0 0 0 0 0
Italy 30.011 14.104 0 0 0 0 0 0 0
2002 2003 2004 2005 2006 2007 2008 2009 2010
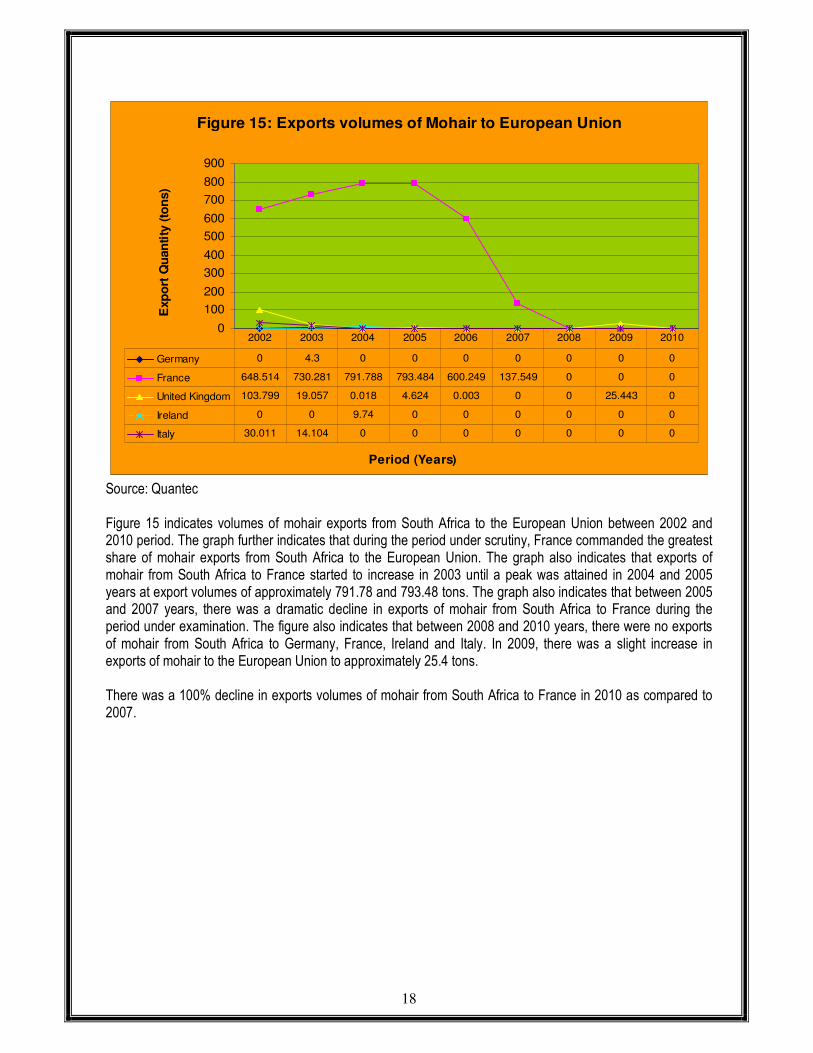
Source: Quantec Figure 15 indicates volumes of mohair exports from South Africa to the European Union between 2002 and 2010 period. The graph further indicates that during the period under scrutiny, France commanded the greatest share of mohair exports from South Africa to the European Union. The graph also indicates that exports of mohair from South Africa to France started to increase in 2003 until a peak was attained in 2004 and 2005 years at export volumes of approximately 791.78 and 793.48 tons. The graph also indicates that between 2005 and 2007 years, there was a dramatic decline in exports of mohair from South Africa to France during the period under examination. The figure also indicates that between 2008 and 2010 years, there were no exports of mohair from South Africa to Germany, France, Ireland and Italy. In 2009, there was a slight increase in exports of mohair to the European Union to approximately 25.4 tons. There was a 100% decline in exports volumes of mohair from South Africa to France in 2010 as compared to 2007.

19
6.1 Exports of Mohair by Provinces of South Africa
Figure 16: Value of Mohair exports by Provinces
0
50000000
100000000
150000000
200000000
250000000
Period (Years)
Ex
po
rt V
alu
e (
Ra
nd
s)
Western Cape 0 1636342 0 0 0 0 2700 0 2201 0
Eastern Cape 134128725 198165114 150691532 152525738 183101832 173611126 83469100 95604816 68110103 105328740
Gauteng 1193233 48600 183962 42764 18976 910 98 3000 13880 6000
Mpumalanga 0 0 0 0 0 0 0 0 0 4472
2001 2002 2003 2004 2005 2006 2007 2008 2009 2010
Source: Quantec
Figure 16 depicts value of mohair exports by provinces of South Africa to the world between 2001 and 2010 period. The graph further depicts that the major exporter of mohair from South Africa to the world was Eastern Cape Province. The graph also depicts that exports of mohair from the Eastern Cape Province started to increase in 2002, and during the same period attained a peak at an export value of approximately R1.9 billion. Western Cape, Mpumalanga and Gauteng provinces had very low levels of mohair exports during the period under examination. The graph further depicts that between 2001 and 2009 years, there were no exports of mohair exports by Mpumalanga province. In 2001 and again between 2003 and 2006 years, there were no exports of mohair from the Western Cape Province during the period under review. During the period under examination, exports of mohair from Eastern Cape Province in value terms fluctuated between R6.8 million and R1.9 billion. In 2010, there was a 35.3% increase in value of mohair from the Eastern Cape Province to the world as compared to 2009.

20
Figure 17: Value of Mohair exports by Eastern Cape Province
0
50000000
100000000
150000000
200000000
250000000
Period (Years)
Ex
po
rt V
alu
e (
Ra
nd
s)
Cacadu District municipality 0 0 0 0 170256 0 0 0 23017685 25556025
Chris Hani District municipality 0 0 0 0 0 0 0 0 8452249 15482077
Nelson Mandela Metropolitan Municipality 134128725 198165114 150691532 152525738 182931576 173611126 83469100 95604816 36640169 64290638
2001 2002 2003 2004 2005 2006 2007 2008 2009 2010
Source: Quantec Figure 17 shows value of mohair exports by Eastern Cape Province of South Africa to the world between 2001 and 2010 period. The graph further shows that the major exporter of mohair from the Eastern Cape Province to the world was Nelson Mandela Metro, followed by Cacadu and Chris Hani Districts. The figure also shows that exports of mohair from Nelson Mandela Metro municipality started to increase in 2002, and during the same period attained a peak at an export value of approximately R1.9 billion. The figure further shows that, the Cacadu and Chris Hani District municipalities had very low levels of mohair exports during the period under review. The figure also shows that between 2007 and 2010 years, exports from Nelson Mandela Metropolitan municipality declined dramatically although there was a slight increase in 2010. There was a 43.0% increase in value of mohair exports from Nelson Mandela Metro to the world in 2010 as compared to 2009.

21
Figure 18: Value of Mohair exports by Western Cape Province
0
200000
400000
600000
800000
1000000
1200000
1400000
1600000
1800000
Period (Years)
Exp
ort
Valu
e (
Ran
ds)
City of Cape Tow n Metropolitan
Municipality
0 1636342 0 0 0 0 0 0 2201 0
Eden District municipality 0 0 0 0 0 0 2700 0 0 0
2001 2002 2003 2004 2005 2006 2007 2008 2009 2010
Source: Quantec Figure 18 illustrates value of mohair exports by Western Cape Province of South Africa to the world between 2001 and 2010 period. The graph further illustrates that during the period under examination, the major exporter of mohair from the Western Cape Province to the world was the City of Cape Town Metropolitan municipality. The figure further illustrates that exports of mohair from the City of Cape Town Metropolitan municipality started to increase in 2002, and during the same period attained a peak at an export value of approximately R1.6 million. The figure also illustrates that in 2001 and again between 2003 and 2008 years and 2010, there were no exports of mohair from the City of Cape Town Metro to the world. Between 2001 and 2006 years and again between 2008 and 2010 years, there were no exports of mohair from Eden District to the world. In 2010 there was a 100% decline in value of mohair exports from the City of Cape Town Metropolitan municipality to the world as compared to 2009.
22
Figure 19: Value of Mohair exports by Gauteng Province
0
200000
400000
600000
800000
Period (Years)
Exp
ort
Valu
e (
Ran
ds)
West Rand District Municipality 703753 0 139470 3050 3210 0 0 0 0 0
Ekurhuleni Metropolitan
Municipality
0 48600 0 0 0 100 98 0 9000 0
City of Johannesburg
Metropolitan Municipality
451600 0 44492 39714 15766 810 0 3000 2800 6000
City of Tshw ane Metropolitan
Municipality
37881 0 0 0 0 0 0 0 2080 0
2001 2002 2003 2004 2005 2006 2007 2008 2009 2010
Source: Quantec
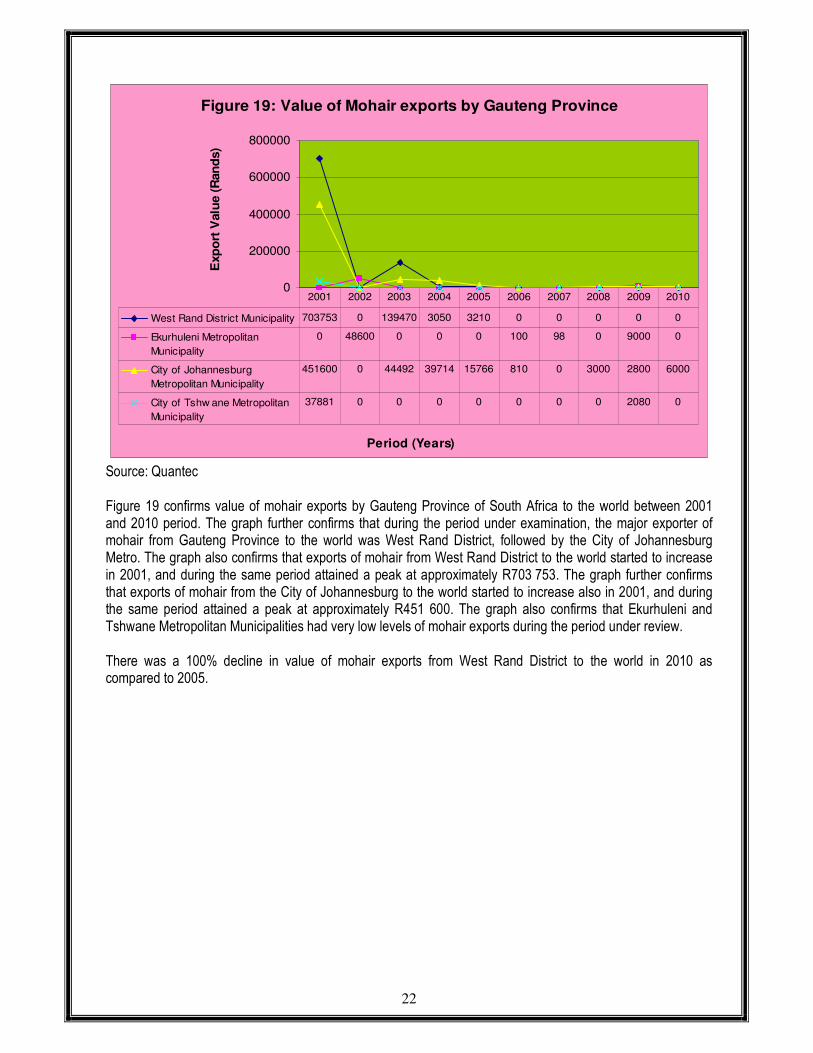
Figure 19 confirms value of mohair exports by Gauteng Province of South Africa to the world between 2001 and 2010 period. The graph further confirms that during the period under examination, the major exporter of mohair from Gauteng Province to the world was West Rand District, followed by the City of Johannesburg Metro. The graph also confirms that exports of mohair from West Rand District to the world started to increase in 2001, and during the same period attained a peak at approximately R703 753. The graph further confirms that exports of mohair from the City of Johannesburg to the world started to increase also in 2001, and during the same period attained a peak at approximately R451 600. The graph also confirms that Ekurhuleni and Tshwane Metropolitan Municipalities had very low levels of mohair exports during the period under review. There was a 100% decline in value of mohair exports from West Rand District to the world in 2010 as compared to 2005.

23
Figure 20: Value of Mohair exports by Mpumalanga Province
0
500
1000
1500
2000
2500
3000
3500
4000
4500
5000
Period (Years)
Exp
ort
Valu
e (
Ran
ds)
Nkangala District
municipality
0 0 0 0 0 0 0 0 0 4472
2001 2002 2003 2004 2005 2006 2007 2008 2009 2010
Source: Quantec Figure 20 indicates value of mohair exports by Mpumalanga Province of South Africa to the world between 2001 and 2010 period. The figure further indicates that the major exporter of mohair from Mpumalanga Province was Nkangala District during the period under review. The figure also indicates that exports of mohair from Nkangala District to the world started to increase in 2010, and during the same period attained a peak at approximately R4 472. The figure also indicates that between 2001 and 2009 years, there were no exports of mohair from Nkangala District to the world. In 2010, there was a 100% increase in value of mohair exports from Nkangala District to the world as compared to 2009.

24
7. SHARE ANALYSIS
Table 1: Share analysis of provincial mohair exports to the total RSA mohair exports (%) Years Provinces
2001 2002 2003 2004 2005 2006 2007 2008 2009
2010
Eastern Cape 99.12 99.2 99.9 99.9 99.9 99.9 99.9 99.9 99.9 99.9 Western Cape 0.00 0.82 0.00 0.00 0.00 0.00 0.00 0.00 0.00 0.00 Gauteng 0.88 0.02 0.12 0.03 0.01 0.00 0.00 0.00 0.02 0.01 Mpumalanga 0.00 0.00 0.00 0.00 0.00 0.00 0.00 0.00 0.00 0.00 Total 100 100 100 100 100 100 100 100 100 100
Source of data: Quantec From Table 1, it is clear that Eastern Cape Province commanded the greatest share of South African mohair exports. This is due to the fact that Eastern Cape is the main production area of mohair and it is the main auction market and nearest exit point to the world. Tables 2 to 5 illustrates analysis of district mohair exports. Table 2: Share of district mohair exports to the total Eastern Cape provincial mohair exports (%) Years Districts
2001 2002 2003 2004 2005 2006 2007 2008 2009
2010
Cacadu District 0.00 0.00 0.00 0.00 0.01 0.00 0.00 0.00 33.8 24.3 Chris Hani 0.00 0.00 0.00 0.00 0.00 0.00 0.00 0.00 12.4 14.7 Nelson Mandela 100 100 100 100 99.9 100 100 100 53.8 61.0 Total 100 100 100 100 100 100 100 100 100 100
Source of data: Quantec
From Table 2, shows that Nelson Mandela Metro commanded the greatest share of district mohair exports from Eastern Cape Province.
Table 3: Share of district mohair exports to the total Western Cape provincial mohair exports (%)
Years Districts
2001 2002 2003 2004 2005 2006 2007 2008 2009
2010
City of Cape Town
0.00 100 0.00 0.00 0.00 0.00 0.00 0.00 100
0.00 Eden District 0.00 0.00 0.00 0.00 0.00 0.00 100 0.00 0.00 0.00 Total 0.00 100 0.00 0.00 0.00 0.00 100 0.00 100 0.00
Source of data: Quantec
From Table 3, shows that City of Cape Town Metro commanded the greatest share of district mohair exports from Western Cape Province.

25
Table 4: Share of district mohair exports to the total Gauteng provincial mohair exports (%) Years Districts
2001 2002 2003 2004 2005 2006 2007 2008 2009
2010
West Rand District
59.0 0.00 75.8 7.13 16.9 0.00 0.00 0.00 0.00
0.00 Ekurhuleni Metro 0.00 100 0.00 0.00 0.00 11.0 100 0.00 64.8 0.00 City of Johannesburg
37.8 0.00 24.2 92.9 83.1 89.0 0.00 100 20.2
100
City of Tshwane 3.17 0.00 0.00 0.00 0.00 0.00 0.00 0.00 15.0 0.00 Total 100 100 100 100 100 100 100 100 100 100
Source of data: Quantec
From Table 4, shows that City of Johannesburg commanded the greatest share of district mohair exports from Gauteng Province. Table 5: Share of district mohair exports to the total Mpumalanga provincial mohair exports (%) Years Districts
2002 2003 2004 2005 2006 2007 2008 2009
2010
Nkangala District 0.00 0.00 0.00 0.00 0.00 0.00 0.00 0.00 0.00 100 Total 0.00 0.00 0.00 0.00 0.00 0.00 0.00 0.00 0.00 100
Source of data: Quantec

26
8. IMPORTS VOLUMES
South Africa imports small quantities of mohair. Most of the imports are re-exported after processing. Figure 16 show the import of mohair over the past decade.
Figure 21: Imports volumes of Mohair from various regions
0
0.1
0.2
0.3
0.4
0.5
0.6
Period (Years)
Imp
ort
s Q
uan
tity
(to
ns)
Americas 0 0 0 0.005 0 0 0 0 0 0
Asia 0 0 0 0 0 0 0 0.002 0 0
Europe 0 0.08 0.132 0.506 0 0 0.003 0.075 0.005 0.019
2001 2002 2003 2004 2005 2006 2007 2008 2009 2010
Source: Quantec
Figure 21 illustrates volumes of Mohair imports from various regions of the world into South Africa between 2001 and 2010 period. The graph further illustrates that during the period under examination, the major import markets of Mohair into South Africa was Europe. The figure also illustrates that imports of Mohair from Europe into South Africa started to increase in 2002, until a peak was attained in 2004 at approximately 0.5 tons. The graph further illustrates that from 2005 to 2007, there were very low imports of mohair from Europe into South Africa. The graph further illustrates that Americas and Asia had very low or minimal imports volumes of Mohair into South Africa during the period under scrutiny. There was a 73.7% increase in imports volumes of mohair from Europe into South Africa in 2010 as compared to 2009.

27
Figure 22: Imports volumes of Mohair from the Americas
0
0.001
0.002
0.003
0.004
0.005
0.006
Period (Years)
Imp
ort
Qu
an
tity
(to
ns)
NAFTA 0 0 0 0.005 0 0 0 0 0 0
2001 2002 2003 2004 2005 2006 2007 2008 2009 2010
Source: Quantec Figure 22 depicts imports volumes of mohair from the Americas into South Africa between 2001 and 2010 period. The graph further depicts that during the period under scrutiny, NAFTA commanded greatest share of mohair imports from Americas into South Africa. The figure also depicts that imports of mohair from NAFTA into South Africa started to increase in 2004, and during the same period attained a peak at approximately 0.005 tons. The figure also depicts that between 2001 and 2003 years and again between 2005 and 2010 years, there were no imports of mohair from NAFTA into South Africa. In 2010, there was a 100% decline in imports volumes of mohair from NAFTA into South Africa as compared to 2004.

28
Figure 23: Imports volumes of Mohair from Asia
0
0.0005
0.001
0.0015
0.002
0.0025
Period (Years)
Imp
ort
Qu
an
tity
(to
ns)
South-central Asia 0 0 0 0 0 0 0 0.002 0 0
2001 2002 2003 2004 2005 2006 2007 2008 2009 2010
Source: Quantec Figure 23 shows imports volumes of mohair from Asia into South Africa between 2001 and 2010 period. The graph further shows that during the period under scrutiny, South-central Asia commanded greatest share of mohair imports from Asia into South Africa. The figure also shows that imports of mohair from South-central Asia into South Africa started to increase in 2008, and during the same period attained a peak at approximately 0.002 tons. The figure also shows that between 2001 and 2007 years and again between 2009 and 2010 years, there were no imports of mohair from South-central Asia into South Africa. There was a 100% decline in imports volumes of mohair from South-central Asia into South Africa in 2010 as compared to 2008.

29
Figure 24: Imports volumes of Mohair from Europe
0
0.1
0.2
0.3
0.4
0.5
0.6
Period (Years)
Imp
ort
Qu
an
tity
(to
ns)
European Union 0 0.08 0.132 0.506 0 0 0.003 0.075 0.005 0.019
2001 2002 2003 2004 2005 2006 2007 2008 2009 2010
Source: Quantec Figure 24 indicates imports volumes of mohair from Europe into South Africa between 2001 and 2010 period. The graph further indicates that during the period under review, the major import market of Mohair into South Africa was the European Union. The figure also indicates that imports of Mohair from the European Union into South Africa started to increase in 2002, until a peak was attained in 2004 at approximately 0.5 tons. The graph further illustrates that from 2005 to 2007, there were very low imports volumes of mohair from the European Union into South Africa. The graph further indicates that in the year 2010, there was a slight increase in Mohair imports volumes from the European Union into South Africa. In 2010, there was a 73.7% increase in imports volumes of mohair from the European Union into South Africa as compared to 2009.

30
9. MOHAIR VALUE CHAIN
Figure 25: Structure of the mohair industry.
50.00 Million Consumers (Estimate for 2010)
0.20 % of Agricultural Production
Retailers
Manufacturers
Import:
1, 537 160 kg
Export: 3,5
million kg
3 GROWER MOHAIR ASSOCIATIONS
1. Camdeboo Mohair
2. South African Mohair Growers
Association
3. Emerging Mohair Growers Association
6 BUYERS
1. A Dewavrin Freres (Pty) Ltd.
2. Cape Produce Wool Company
3. Mosenthals Wool & Mohair SA (Pty) Ltd
4. Samil (Pty) Ltd
5. Seal South Africa
6. Stucken & Company (Pty) Ltd
7. New England Wool SA
8. Standard Wool Production :
2.3 million kg
3 PROCESSORS
1. Border Combing Company
2. Gubb & Inggs
3. Mohair Spinners South Africa (Pty) Ltd
26 MANUFACTURERS
1. Abafazi
2. Annette Oelofse Mohair Products
3. Adele’s Mohair
4. Ali-Jean Fibre Design
5. Cape Mohair Limited
6. Coral Stephens
7. Elsa Barnard Mohair Carpets
8. Hinterveld
9. Jan Paul Barnard
10. Loubear Mohair
11. Mohair Weavers
12. Momento’s of Africa
13. Peta-Lee
14. Shuttleworth Weaving
15. The Scarf Initiative
16. Umsobomvu textiles
17. Wolskuur Spinners CC
Angora Goat Numbers
718 000
Export of Raw
Mohair
Export of
mohair top or
scoureds
Export of
yarn and
fabric
Import of
Raw Mohair
Import of yarn
and fabric
3 Auction Ports 1. Port Elizabeth
2. Durban
3. Cape Town
3 Brokers 1. BKB
2. Cape Mohair &
Wool
3. Blue Crane
Wool & Mohair

31
The value chain of mohair starts with 3 Grower Mohair Associations with members that owns 718 000 angora goats. Production in 2010 was estimated at 2,3 million kg of mohair that was traded through 3 auction ports managed by 3 brokers. Auctions are held every Wednesday during the production seasons and around 32 auctions took place throughout the year. There are 8 main buyers of mohair acting on behalf of local and international processors. Direct sales occur on a small scale. Processors process mohair into tops and scoureds and sent them to 16 manufacturers. Manufacturers produce products such as blankets, scarves, shawls, throws, plaids, bedcovers, cushions, yarn, fabric, etc. Import and export of mohair occurs in every stage of the value chain; from raw wool to yarn and fabric. Import of raw mohair is mainly to be processed and re-exported. Import amounted to 1,5 million kg of mohair while export was 3,5 million kg.
10. BARRIERS TO PARTICIPATION BY THE EMERGING SECTOR
The quantity and quality of mohair produced by small-scale producers vary from season to season due to:
• Very difficult conditions under which they farm, which is according to the communal pastoral system,
whereby the veld belongs to the community.
• Breeding programmes are difficult and complicated to apply because all types of goats run together in the veld. This problem is aggravated during the mating season because the producer has to tend the goats day and night in order to avoid crossbreeding.
• Small-scale mohair producers lack sufficient and easy accessible sheltering, this poses a problem
because Angora goats are very sensitive to drastic weather changes, usually more than one large shelter has to be erected on different locations on the farm and this can be quite costly.
• There is no sufficient shearing and mohair sorting equipment, applicable hair sorting and classing and
classing knowledge of both farmer and labourers is minimal.
11. BLACK ECONOMIC EMPOWERMENT INITIATIVES
The SA Mohair industry fully supports BEE policy of government since its initiation in 2006, and has accepted the responsibility for Black Economic Empowerment and it has established projects as follows: a. The combined project with SAMIL and governmental organizations to establish training centers with
the aim of training individuals in all aspects of mohair farming.
b. The Hardwood project at Klipplaat (Mentoring).
c. The mentoring project at Prince Albert.
d. The mentoring project at Pearston. The industry latest focus is on the area around Matatiele in the north eastern part of the Eastern Cape Province. Most Angora goats owned by people of colour are found in this part of the country. Efforts will therefore to be made by the mohair industry to help the villagers obtain superior brreding material, especially rams. No classing of mohair is done in the area, once more the industry will have to step in and conduct classing demonstrations to teach the people the very basic principles of classing mohair.

32
11.1 Representation within the Empowerment Trust
• The emerging farmers are represented in the Mohair Trust as well as in the Empowerment Trust; • The National agricultural Marketing Council also has two trustees in the empowerment Trust, which, it
is accepted, will be ethnically representative of the demographic of the South African population. • The other trustees are:
� The Chairman and Vice-Chairman of the Mohair Trust � The Chairman of Mohair South Africa Limted. � The President of SA Moahir Growers Association.
33
12. MARKET ACCESS
12.1 Export tariffs for mohair
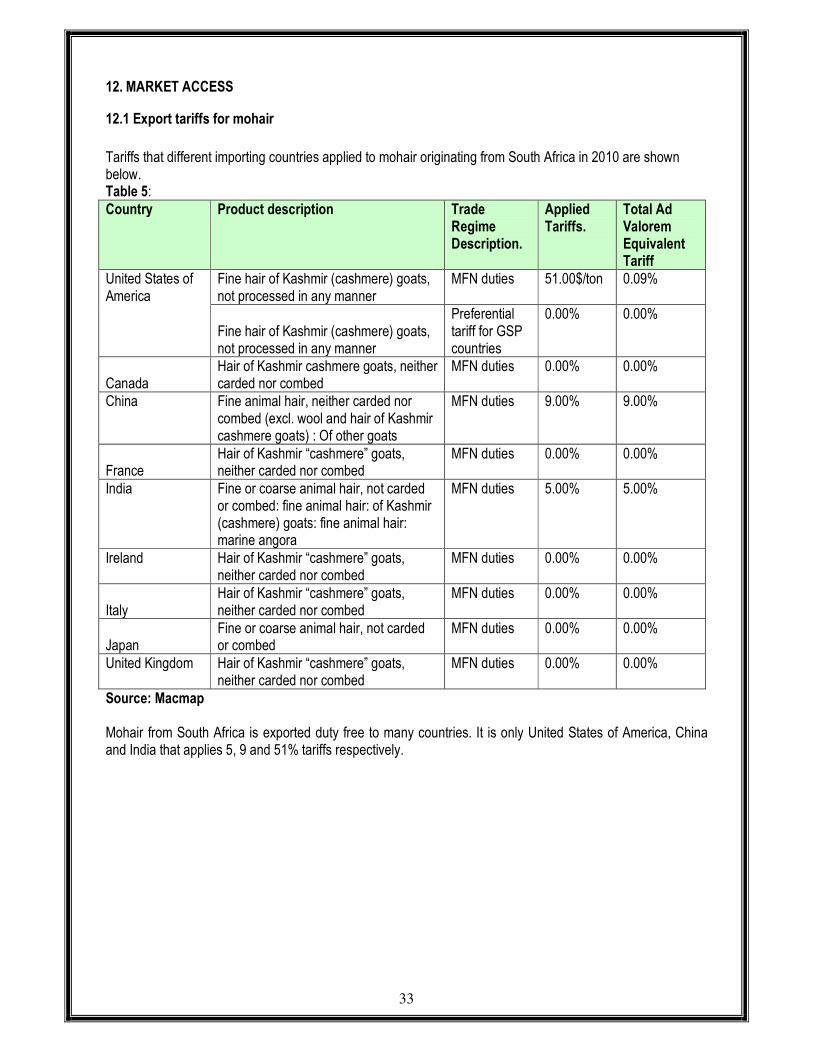
Tariffs that different importing countries applied to mohair originating from South Africa in 2010 are shown below. Table 5: Country Product description Trade
Regime Description.
Applied Tariffs.
Total Ad Valorem Equivalent Tariff
United States of America
Fine hair of Kashmir (cashmere) goats, not processed in any manner
MFN duties 51.00$/ton 0.09%
Fine hair of Kashmir (cashmere) goats, not processed in any manner
Preferential tariff for GSP countries
0.00% 0.00%
Canada Hair of Kashmir cashmere goats, neither carded nor combed
MFN duties 0.00% 0.00%
China Fine animal hair, neither carded nor combed (excl. wool and hair of Kashmir cashmere goats) : Of other goats
MFN duties 9.00% 9.00%
France Hair of Kashmir “cashmere” goats, neither carded nor combed
MFN duties 0.00% 0.00%
India Fine or coarse animal hair, not carded or combed: fine animal hair: of Kashmir (cashmere) goats: fine animal hair: marine angora
MFN duties 5.00% 5.00%
Ireland Hair of Kashmir “cashmere” goats, neither carded nor combed
MFN duties 0.00% 0.00%
Italy Hair of Kashmir “cashmere” goats, neither carded nor combed
MFN duties 0.00% 0.00%
Japan Fine or coarse animal hair, not carded or combed
MFN duties 0.00% 0.00%
United Kingdom Hair of Kashmir “cashmere” goats, neither carded nor combed
MFN duties 0.00% 0.00%
Source: Macmap Mohair from South Africa is exported duty free to many countries. It is only United States of America, China and India that applies 5, 9 and 51% tariffs respectively.

34
12.2 Import tariffs for mohair
Tariffs that South Africa applied to imports of mohair originating from all possible countries in 2010 are shown in table 6 below. Table 6: Country Product Description Trade
Regime Description.
Applied Tariffs.
Total Ad Valorem Equivalent Tariff
Austria Coarse animal hair, neither carded nor combed (excl. wool, hair and bristles used in the manufacture of brooms and brushes & horsehair from the mane or tail) : Not further processed
MFN duties (Applied)
0.00% 0.00%
Coarse animal hair, neither carded nor combed (excl. wool, hair and bristles used in the manufacture of brooms and brushes & horsehair from the mane or tail) : Other
MFN duties (Applied)
8.50% 8.50%
India Hair of Kashmir “cashmere” goats, neither carded nor combed: Not further processed than bleached
MFN duties (Applied)
0.00% 0.10%
Italy Coarse animal hair, neither carded nor combed (excl. wool, hair and bristles used in the manufacture of brooms and brushes & horsehair from the mane or tail) : Other
MFN duties (Applied)
8.50% 8.50%
Coarse animal hair, neither carded nor combed (excl. wool, hair and bristles used in the manufacture of brooms and brushes & horsehair from the mane or tail) : Other
Preferential tariff for European Union Countries
2.13% 2.13%
United Kingdom
Fine animal hair, neither carded nor combed (excl. wool and hair of Kashmir goats): Other
MFN duties (Applied)
0.00% 0.00%
United States of America
Coarse animal hair, neither carded nor combed (excl. wool, hair and bristles used in the manufacture of brooms and brushes & horsehair from the mane or tail) : Other
MFN duties (Applied)
8.50% 8.50%
Source: Macmap The table indicates that mohair from other countries to South Africa attracts a tariff of 8.50% in 2010 except mohair that moves within the European Union countries where a tariff of 2.13% is applied.

35
13. MARKET INTELLIGENCE
Table 7: List of importing markets for fine or coarse animal hair exported by South Africa in 2010 (Product: 5102 Fine or coarse animal hair not carded or combed) South Africa’s exports represent 3.39% of world exports for this product; its ranking in world exports is 7.
Importers
Trade Indicators Tariff
(estimated) faced by
South Africa (%)
Exported value 2010
(USD thousand)
Share in South Africa's
exports (%)
Exported quantity
2010 (tons)
Unit value (USD/unit)
Exported growth in value between 2006-2010 (%, p.a.)
Exported growth in quantity
between 2006-2010 (%, p.a.)
Exported growth in value between 2009-2010 (%, p.a.)
World 7404 100 665 11134 -14 -8 83 Italy 3438 46.4 263 13072 69 49 27 0 China 1985 26.8 169 11746 15 22 666 9 United Kingdom 1343 18.1 183 7339 -16 6 91 0 India 327 4.4 28 11679 -26 -33 285 5 Hong Kong, China 169 2.3 13 13000 46 0 Belgium 80 1.1 5 16000 0 Japan 38 0.5 2 19000 -29 -28 -84 0 Nepal 10 0.1 1 10000 -16 -16 5 Canada 6 0.1 1 6000 4 0 Mauritius 4 0.1 0 -23 0 Germany 3 0 0 -77 0 Source: ITC calculations based on COMTRADE statistics

36
Table 7 shows the list of importing markets for fine or coarse animal hair exported by South Africa in 2010. In 2010 South Africa exported a total of 665 tons of fine or coarse animal hair at an average value of US$ 11 134/unit. Italy and United Kingdom were the leading importers of fine or coarse animal hair, accounting for 46.4% share and 18.1% share respectively of South Africa’s export market. Italy is the world’s 1st leading importer of this product while United Kingdom is 2nd. Italy’s imports worldwide experienced a growth in value of 69% and United Kingdom experienced a negative growth of 16% per annum over the period between 2006 and 2010, and the growth of the world market over the same period was -14% per annum. However the table also shows that South African import market increased in 2010 compared to 2009 with a growth rate of 83%. At the same time Italy’s imports to South Africa experienced an extraordinary increase of 27%, while United Kingdom experienced an increase of 91% in value between 2009 and 2010.

37
Figure 26: Growth in demand for fine or coarse animal hair, not carded or combed exported by SA in 2010
Source: ITC (Trade map)

38
Figure 26 indicates growth in demand for fine or coarse hair, not carded or combed exported by South Africa in 2010. The graph further indicates that Italy was the largest importer of fine or coarse animal hair during the period under scrutiny. However, South Africa’s exports of fine or coarse animal hair to Italy increased by 70% while Italy’s imports from the world decreased by 8% between 2006 and 2010. Although United Kingdom is one of the biggest markets of fine or coarse animal hair from South Africa, it’s annual growth of South Africa exports decreased by 18-19% share, while China‘s imports from the world increased by 30%. China’s annual exports intoSouth Africa’s increased by 19% between 2006 and 2010. The graph also indicates that Japan and Mauritius were declining markets of fine or coarse animal hair from South Africa between 2006 and 2010 period.

39
Figure 27: Prospects for market diversification for fine or coarse animal hair, not carded or combed exported by SA in 2010
Source: ITC (Trade map)

40
Figure 27 shows prospects for market diversification for fine or coarse animal hair, not carded or combed exported by South Africa in 2010. The figure further shows that if South Africa has to diversify its exports of fine or coarse animal hair, the other markets exist in China, United Kingdom, Austria, Canada and Hong Kong. Between 2006 and 2010 South Africa’s fine or coarse animal hair exported to China and United Kingdom were growing at a rate that is more than their import growth from the rest of the world. During the same period, South Africa’s fine or coarse animal hair exports to Italy, United Kingdom, India and Hong Kong were growing at a rate that is greater than their exports to the rest of the world. By adding a horizontal line representing the world market growth and a vertical line representing the average growth of South Africa’s import of this product, the following conclusions can be made: � South Africa’s exports for fine or coarse animal hair to India and Hong Kong were growing while world’s
imports were also growing but at a slower pace than South Africa’s exports. � South Africa’s exports for fine or coarse animal hair to Italy were growing faster than world’s imports. � South Africa’s exports for fine or coarse animal hair to China were increasing at the same rate with world’s
imports. � South Africa’s exports for fine or coarse animal hair to United Kingdom were growing faster while world’s
imports were declining.
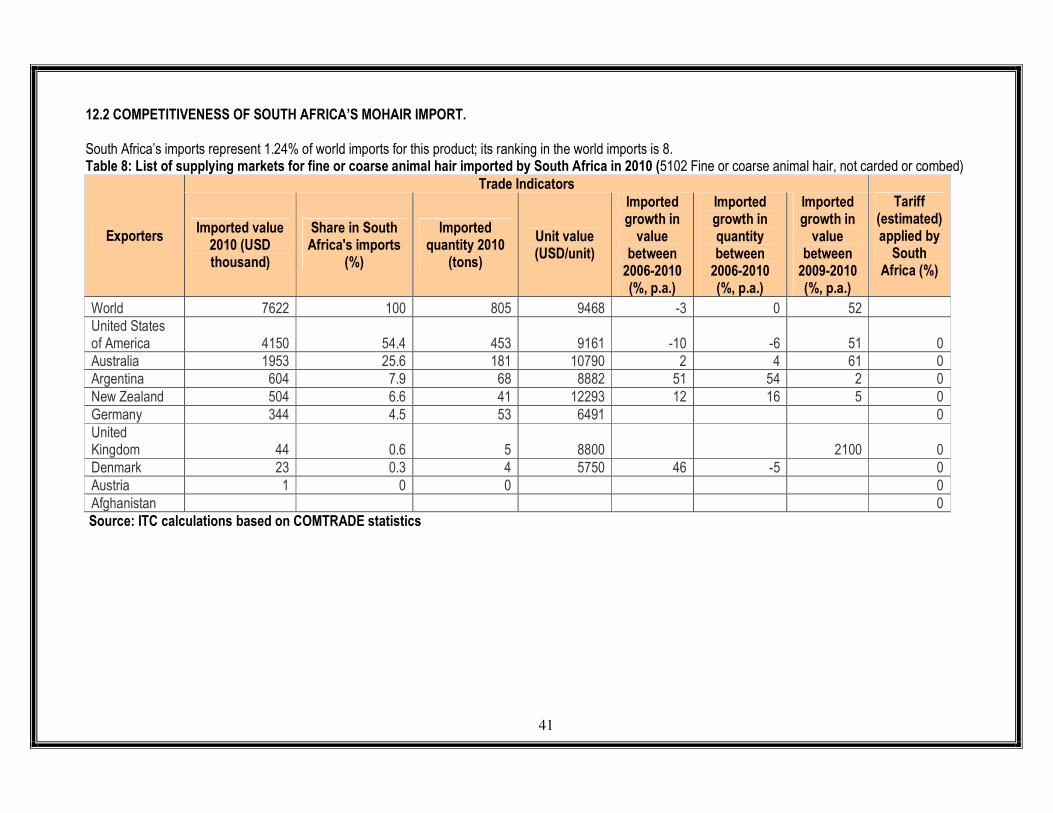
41
12.2 COMPETITIVENESS OF SOUTH AFRICA’S MOHAIR IMPORT. South Africa’s imports represent 1.24% of world imports for this product; its ranking in the world imports is 8. Table 8: List of supplying markets for fine or coarse animal hair imported by South Africa in 2010 (5102 Fine or coarse animal hair, not carded or combed)
Exporters
Trade Indicators Tariff
(estimated) applied by South
Africa (%)
Imported value 2010 (USD thousand)
Share in South Africa's imports
(%)
Imported quantity 2010
(tons)
Unit value (USD/unit)
Imported growth in value
between 2006-2010 (%, p.a.)
Imported growth in quantity between 2006-2010 (%, p.a.)
Imported growth in value
between 2009-2010 (%, p.a.)
World 7622 100 805 9468 -3 0 52 United States of America 4150 54.4 453 9161 -10 -6 51 0 Australia 1953 25.6 181 10790 2 4 61 0 Argentina 604 7.9 68 8882 51 54 2 0 New Zealand 504 6.6 41 12293 12 16 5 0 Germany 344 4.5 53 6491 0 United Kingdom 44 0.6 5 8800 2100 0 Denmark 23 0.3 4 5750 46 -5 0 Austria 1 0 0 0 Afghanistan 0 Source: ITC calculations based on COMTRADE statistics

42
Table 8 depicts the list of supplying markets for fine or coarse animal hair imported by South Africa in 2010. The table further depicts that during 2010 period, South Africa imported a total of 805 tons of fine or coarse animal hair at an average value of US$ 9468/unit. United States of America, Australia, Argentina and New Zealand were the leading suppliers of fine or coarse animal hair, accounting for a share of 54.4%, 25.6%, 7.9% and 6.6% respectively of South Africa’s import market. United States of America is the world’s 8th leading exporter of this product while Australia is 15th. United States of America and Australia’s exports worldwide experienced a growth in value respectively of -10% and 2% p.a. over the period from 2006 to 2010, and the growth of the world market over the same period was -3% per annum. However the table also depicts that South African import market increased in 2010 compared to 2009 with a growth rate of 52%. At the same time United States of America’s exports to South Africa experienced a growth rate of 51% while Australia experienced a growth rate of 61% in value.

43
Figure 28: Competitiveness of suppliers to South Africa for fine or coarse animal hair, not carded or combed for fine or coarse animal hair imported by SA in 2010
Source: ITC (Trade map)

44
Figure 28 illustrates competitiveness of suppliers to South Africa for fine or coarse animal hair import from the world in 2010. The figure further illustrates that between 2005 and 2010 South Africa’s fine or coarse animal hair imported from New Zealand was growing at a rate that is less than their export growth to the rest of the world. During the same period, South Africa’s fine or coarse animal hair from United States of America and Australia were growing at a rate that is greater than their exports to the rest of the world. By adding a horizontal line representing the world market growth and a vertical line representing the average growth of South Africa’s import of this product, the following conclusions can be made: � South Africa’s imports for fine or coarse animal hair from United States of America and Australia were
declining together with world’s exports. � South Africa’s imports for fine or coarse animal hair from New Zealand were growing at a slow pace than
world’s exports between 2006 and 2010 period.

45
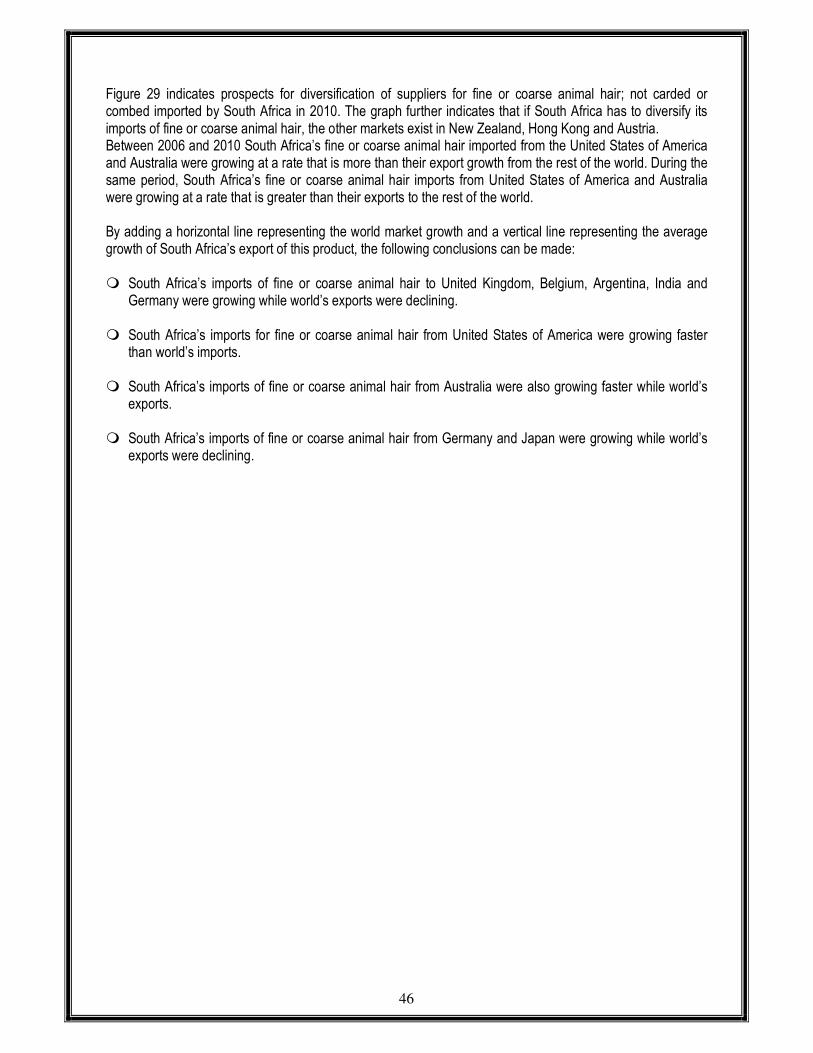
Figure 29: Prospects for diversification of suppliers for fine or coarse animal hair; not carded or combed imported by SA in 2010
Source: ITC (Trade map)
46
Figure 29 indicates prospects for diversification of suppliers for fine or coarse animal hair; not carded or combed imported by South Africa in 2010. The graph further indicates that if South Africa has to diversify its imports of fine or coarse animal hair, the other markets exist in New Zealand, Hong Kong and Austria. Between 2006 and 2010 South Africa’s fine or coarse animal hair imported from the United States of America and Australia were growing at a rate that is more than their export growth from the rest of the world. During the same period, South Africa’s fine or coarse animal hair imports from United States of America and Australia were growing at a rate that is greater than their exports to the rest of the world. By adding a horizontal line representing the world market growth and a vertical line representing the average growth of South Africa’s export of this product, the following conclusions can be made: � South Africa’s imports of fine or coarse animal hair to United Kingdom, Belgium, Argentina, India and
Germany were growing while world’s exports were declining. � South Africa’s imports for fine or coarse animal hair from United States of America were growing faster
than world’s imports. � South Africa’s imports of fine or coarse animal hair from Australia were also growing faster while world’s
exports. � South Africa’s imports of fine or coarse animal hair from Germany and Japan were growing while world’s
exports were declining.

47
13. ACKNOWLEDGEMENTS
The following information sources are acknowledged: D: Economic Analysis and Statistics www.daff.gov.za Fin24.com http://www.fin24.com Mohair South Africa http://www.mohair.co.za Momento’s of Africa. http://www.momentos.co.za Ikhwezi municipality http://www.ikwezi.gov.za Quantec www.quantec.co.za Trade Map www.trademap.org Absa Agri-Business (Mohair Outlook) www.absa.co.za Disclaimer: This document and its contents have been compiled by the Directorate: Marketing of the Department of Agriculture, Forestry and Fisheries for the purpose of detailing the Mohair industry. Anyone who uses the information as contained in this document does so at his/her own risk. The views expressed in this document are those of the Department of Agriculture, Forestry and Fisheries with regard to the industry, unless otherwise stated. The Department of Agriculture, Forestry and Fisheries, therefore accepts no liability that can be incurred resulting from the use of this information.