module ii: conducting a needs assessment to identify priority areas … · module ii: conducting a...
TRANSCRIPT

Systemic Local Educational Agency
(LEA) Plan Development
Module II: Conducting a Needs Assessment to
Identify Priority Areas of Focus in the LEA Plan
CALIFORNIA DEPARTMENT OF EDUCATION Tom Torlakson, State Superintendent of Public Instruction
1

TOM TORLAKSON State Superintendent of Public Instruction
Welcome
• Introduction of presenters: – Name/contact information – Name/contact information
2
Facilitators should include their own contact information on this slide.
2

Meeting Norms TOM TORLAKSON
State Superintendent of Public Instruction
• Start and end meetings on time. • Stay focused on the topic. • Listen to others with best
intentions. • Seek clarification when needed.
3
Facilitator Notes: Post chart paper to record off-topic discussions to be addressed at a later time.
3 3

Purpose of the Series TOM TORLAKSON
State Superintendent of Public Instruction To develop expertise among district
administrators, leadership teams, and technical assistance providers in writing and implementing a clear and educationally sound Local Educational Agency (LEA) Plan.
44444444
The purpose of the series is to guide participants through a step-by-step process for developing and using a local educational agency plan (LEA Plan) that is strategic and useful for improving student achievement. Such a plan will include specific actions, identify persons who will be doing the work, provide timely completion dates, and post authentic funding target amounts and sources.
The content of this training is geared toward LEAs in Program Improvement that must revise their LEA Plan, but the processes and methods described are applicable to all LEAs in writing and revising the LEA Plan.
4 4

Systemic Planning Functions
TOM TORLAKSON 1. Examining the LEA Plan in Federal,State Superintendent of Public Instruction
State, and Local Context 2. Conducting a Needs Assessment to
Identify Priorities of the LEA Plan 3. Developing the LEA Plan to
Address Priorities 4. Implementing and Monitoring the
LEA Plan 55555555
The training is offered in four separate modules. Each module may stand alone as a single training, modules may be delivered as a series; or trainers may draw slides from the modules for their own use. Module I addresses statutes and regulations governing the LEA Plan for districts receiving funding and those in various stages of Program Improvement (PI). It addresses common challenges in the local context and the use of various categorical funding to implement the LEA Plan. Module II guides districts through an analysis of student achievement data and use of state program evaluation tools. Participants examine student achievement data toidentify priority areas of focus in the LEA Plan. It includes overviews of the Academic Program Survey (APS), English Learner Subgroup Self-Assessment (ELSSA), Inventory of Services and Supports (ISS) for Students with Disabilities, District Assistance Survey (DAS). Module III is an in-depth examination of the DAS and how to use it in concert with Module II data. This module presents a model process for a district leadership team (DLT) to develop the LEA Plan. Module IV focuses on the roles of district leaders and advisory teams in implementing and monitoring the LEA Plan. It includes an examination of the alignment between the LEA Plan and school plans. This module describes a process for effective monitoring of the LEA Plan.
5 55

The LEA Plan • Establishes district priorities.
TOM TORLAKSON State Superintendent of Public Instruction
• Documents major district initiatives to address priorities.
• Addresses five major performance goals set by the Elementary and Secondary Education Act (ESEA).
• Is a single, coordinated, and comprehensive plan.
66666666
The LEA Plan is the district foundation for improved student achievement.
Rather than a bureaucratic exercise with limited potential for improving student achievement, the most successful plans include thoughtful, educationally sound actions that (a) can be implemented within specific time frames, and (b) will lead to improved student achievement. These plans reflect year-to-year changes in student performance, resource allocation, and instructional practices in the district.
6 6

Module II Topics TOM TORLAKSON
State Superintendent of Public Instruction • Overview of the needs assessment
• Orientation to state level and local data
• Orientation to the state program evaluation tools
• Needs assessment scenario
7
Module II synthesizes existing professional development from a variety of sources to guide participants through an analysis of their state level data, local data, and state program evaluation tools. (See California Education Code Section 52055.57(b)).
This module provides participants with:
• a brief overview of the needs assessment process.
• an opportunity to analyze state level and local data as part of the needs assessment.
• an overview of the four state program evaluation tools.
• practice in analyzing and interpreting state and local date, including the analysis and interpretation of state level and local data, analysis and interpretation of findings from the state program evaluation tools, and synthesis of the analyses to set the stage in the next module when we will identify high priority areas in the LEA Plan.
Facilitator Notes: Facilitators may have participants bring their own data to the training, if preferred.
7

TOM TORLAKSON State Superintendent of Public Instruction
Overview of the Needs Assessment
8
We will begin with an overview of conducting a thorough needs assessment.
In order to be useful, an LEA Plan needs to be grounded in actual student performance data on both state and local assessment measures. In this module participants will review student learning data and school and district program data in order to set the stage for identifying district priorities.
8

Needs Assessment Process 1. Form a district leadership team
TOM TORLAKSON State Superintendent of Public Instruction (DLT).
2. Organize and present data for the needs assessment.
3. Review and analyze student achievement and program data.
4. Identify priority areas of focus in the LEA Plan.
9
The following slides provide a basic overview of the needs assessment process.
9

Form a District Leadership Team
TOM TORLAKSON State Superintendent • LEAs in Program Improvement (PI) of Public Instruction
must develop an LEA Plan inconcert with district educators,parents and the community.
• The District Leadership Team (DLT) assesses needs, identifies priorityareas of focus, writes LEA goals, and supports implementation of the LEA Plan.
10
The DLT is an advisory body to the superintendent, the cabinet, and the local board. Its primary responsibility is to develop the LEA Plan, work with schools in the implementation and monitoring of the LEA Plan, and revise the LEA Plan as necessary. The DLT should potentially include:
• District superintendent • Members of the cabinet (including curriculum and instruction,
human resources, business office, special services, and data systems personnel)
• Principals • Teachers • Parents and community members • Bargaining unit (s) representatives
The LEA Plan is a product of these individuals working together and should not be developed in isolation by the categorical program director.
The next slide illustrates the potential composition of the DLT.
10

Formation of the DLT TOM TORLAKSON
State Superintendent of Public Instruction
Other:
• Superintendent’s Cabinet
• Academic coach(es)
• Counseling staff
• Student services representative
• EL/migrant representative
District Leadership
Team
Parent Representative(s)
Curriculum and
Instruction Director
Principal(s)
Superintendent
Teacher Leaders
Bargaining Unit
Representative
Assistant Superintendent
Human Resources
Data or Testing Administrator
District Financial Officer
School Board Member
11
District Leadership Team: This graph illustrates a recommended composition for a District Leadership Team to fulfill the requirements of the ESEA for writing the LEA Plan (Section 1116(c)(7)(A)). The DLT should, at minimum, have the following representation:
• Superintendent—oversees the work of the DLT and confers with the local board.
• Local Governing Board representative—works with the superintendent to ensure governance standards are addressed and monitored.
• Data administrator, human resources and other members of the cabinet to ensure representation of necessary functions are interrelated in the improvement effort.
Each of the member representatives of the DLT will contribute his/her expertise in the survey and analysis of the district’s needs. This will become more apparent in Module III. An in-depth discussion of the central role of the DLT in developing and implementing the LEA Plan occurs in Module IV.
11

Organize and Present Data • Organize and present data to
TOM TORLAKSON State Superintendent of Public Instruction facilitate understanding of student
achievement progress. Include: – At least three years of data. – Data disaggregated by student groups
as well as by all students. – Data by school, course, and grade
span. – Comparative data including schools,
district, county, and state.
12
Step two of the needs assessment process begins with the organization and presentation of data. As discussed in later slides in this module, student achievement data are the central organizer of the needs assessment. However, data needs to draw from multiple sources and be displayed in meaningful ways for all DLT members to review.
12

Review and Analyze Data
TOM TORLAKSON State Superintendent of Public Instruction • Review and analyze data to identify
priority areas of focus in the LEA Plan.
– Use student achievement data identify underperforming student groups.
– Use state program evaluation tools to evaluate the LEA’s instructional program.
13
The analysis of student achievement data, in conjunction with state program evaluation tools, facilitates the LEA’s identification of priority areas of focus. Look for disparate achievement among various student groups, under-performance in particular schools, in selected content areas, grade levels and courses. In addition, state program evaluation tools facilitate the LEA’s assessment of the presence, coherence, and level of implementation of instructional programs.
13
TOM TORLAKSON State Superintendent of Public Instruction Orientation to State
Level and Local Data
14
In this section, we review state and local student achievement data sources.
14

State Level Data
TOM TORLAKSON State Superintendent of Public Instruction Accountability
• Adequate Yearly Progress (AYP) • Academic Performance Index (API)
Statewide Testing Programs • Standardized Testing and Reporting
(STAR) • California High School Exit
Examination (CAHSEE) • California English Language
Development Test (CELDT) 15
State level data provides the starting place for a comprehensive needs assessment to determine priority areas of focus in the LEA Plan. An examination of the Academic Performance Index (API) and the Adequate Yearly Progress (AYP) data provides an overview of student achievement levels. It is important to understand what state assessment data can and cannot tell us about student achievement and the instructional program.
STAR includes the California Standards Test (CST), California Alternate Performance Assessment (CAPA), and California Modified Assessment (CMA) from which both federal and state accountability measures are constructed.
Note that we will be discussing Adequate Yearly Progress (AYP) for federal accountability and the Academic Performance Index (API) for state accountability.
15

TOM TORLAKSON State Superintendent of Public Instruction Adequate Yearly
Progress (AYP)
16
AYP is the federal measure used to describe a district’s progress toward meeting growth targets for proficiency in English/language arts and mathematics.
For AYP information, please see the CDE 2011 Adequate Yearly Progress Report Information Guide at http://www.cde.ca.gov/ta/ac/ay/documents/aypinfoguide11.pdf
16
AYP
TOM TORLAKSON State Superintendent of Public Instruction • Annual academic performance
goals established for schools, LEAs, and the state as a whole.
• Required under Title I of the ESEA.
1717
If a school, an LEA, or a student group misses any one criterion of AYP, the school or LEA does not make AYP and could be identified for PI. Potentially, a school or an LEA may have up to 50 different criteria to meet in order to make AYP.
17

AYP (Cont.)
TOM TORLAKSON State Superintendent AYP Components:of Public Instruction
1. Participation rate • English-language arts (ELA) and
mathematics 2. Percent proficient
• ELA and mathematics 3. API 4. Graduation rate
18• High schools only
Under California’s approved ESEA criteria, schools and LEAs are required to meet or exceed requirements within each of the four areas listed in order to make AYP annually. Participation rate and percent proficient are calculated using STAR and CAHSEE (tenth grade only) assessments.
• Participation rate: 95 percent to make AYP targets • Percent Proficient: Ascending scale. Proficiency targets are set by each
state and approved by United States Department of Education (US ED).
18

TOM TORLAKSON State Superintendent of Public Instruction
AYP (Cont.) • Indicates percentage of all students
and student groups scoring proficient in ELA and mathematics.
• Indicates progress of all students and student groups in ELA and mathematics.
• Provides achievement gap data in ELA and mathematics.
19
19

Limitations of AYP
TOM TORLAKSON State Superintendent of Public Instruction
AYP does not: • provide information about students
scoring below proficiency. • provide information on how well students
in grades nine through eleven are doing on CSTs.
• explain low proficiency levels for students groups in ELA and mathematics.
2020
AYP data are measures of overall student achievement and, therefore, are limited in their ability to assist the DLT in developing specific goals to address priority areas of focus for the LEA Plan.
To answer DLT questions relating to instructional program effectiveness, specifically inconsistencies in the district, STAR data and the state tools provide for a more comprehensive analysis.
20

TOM TORLAKSON State Superintendent of Public Instruction Standardized Testing
and Reporting (STAR)
21
21

TOM TORLAKSON
STAR STAR Program Assessments: • California Standards Tests (CSTs)
State Superintendent of Public Instruction ─California English–language arts Standards
Test (CST in ELA) ─California Mathematics Standards Test (CST
in mathematics) ─California History-social science Standards
Test (CST in HSS) ─California Science Standards Test (CST in
science) • California Modified Assessment (CMA) • California Alternate Performance
Assessment (CAPA) 22
The STAR Program assessments include: CSTs
• ELA and math, grades two through eleven • Writing, grades four and seven • Social Science, grades eight through eleven • Science, grades five and eight through eleven
CMA (Students whose individualized education program [IEP] indicates assessment with the CMA)
CAPA (Students with significant cognitive disabilities.)
22

CSTs TOM TORLAKSON • Assess students' knowledge of the State Superintendent
of Public Instruction California content standards
• Used in API and AYP calculations
• Five performance levels 1. Advanced 2. Proficient 3. Basic 4. Below Basic 5. Far Below Basic
23
CST data provides evidence for an analysis of the distribution of student performance across five levels, by grade level, subgroup, content area, and course.
For example, through the analysis of student performance in a particular course such as Algebra I, the DLT can begin to identify priority areas of focus.
23

CSTs (Cont.) TOM TORLAKSON
State Superintendent of Public Instruction • Analyze CST data in tables or
graphs. • Examples:
– Proficiency level on CST ELA bygrade level and student group.
– Proficiency level on CST ELA byEnglish language proficiency level.
– Proficiency level on CST Algebra Iby grade level and bysocioeconomic status.
2424
An in-depth needs assessment incorporates analysis of CST data in tables to display two or more variables. This allows the DLT to identify relationships and patterns that uncover areas that need further investigation. This technique, which requires using the STAR Data CD and data mining software (including Excel), enables LEAs to identify specific areas of underperformance and target priority areas of need in the LEA Plan.
24

CMA TOM TORLAKSON
State Superintendent of Public Instruction • Measures progress of students
whose disabilities preclude them from achieving grade-level proficiency on the CSTs with or without accommodations.
• Based on content standards for ELA, mathematics, and science in grades three through eleven.
2525
The decision to administer the CMA is based upon a student’s individualized education program (IEP) committee and must reflect criteria found on the CDE CMA Participation Criteria and Definition of Terms Web page at http://www.cde.ca.gov/ta/tg/sr/participcriteria.asp.
25

CMA (Cont.) • For students with disabilities (SWDs)TOM TORLAKSON
State Superintendent of Public Instruction with Individualized Education Plans
(IEPs) – IEP specifies if the students may take the
CMA. – Students scored below basic or far below
basic on a previous CST. – Students are not eligible to take the CAPA.
• Performance levels are included in API and AYP calculations.
2626
The CMA allows students with disabilities (SWDs) greater access to an assessment that helps measure how well they are achieving California's content standards.
In November 2008 and 2009, the State Board of Education (SBE) adopted performance levels for the CMA, and the AYP reports were updated to include test results in the percent proficient calculations. In March 2011, the SBE adopted performance levels for the CMA in ELA in grade 9, Algebra I, and Life Science in grade 10.
26

CAPA TOM TORLAKSON
State Superintendent of Public Instruction • Measures progress of students
whose cognitive disabilities prevent them from taking the CST with accommodations or modifications, or the CMA with accommodations.
• Links to ELA, mathematics, and science standards at grades 2-11.
2727
The CAPA is to be provided to SWDs whose cognitive abilities preclude them from addressing the performance level assessed in the statewide assessment, even with accommodations or modifications.
The decision to administer the CAPA must be based on a set of criteria found on the CDE CAPA Web page at http://www.cde.ca.gov/ta/tg/sr/participcritria.asp.
The student’s IEP must specify that the student is to take the CAPA in place of the grade-level CST.
27
TOM TORLAKSON State Superintendent of Public Instruction
CAPA (Cont.)
• Reflects portions of the standards accessible to students with significant cognitive disabilities.
• Student performance levels mirror CSTs.
• Performance levels are included in API and AYP calculations.
2828
28
TOM TORLAKSON State Superintendent of Public Instruction California High School
Exit Exam (CAHSEE)
29
For information about CAHSEE, please see the CDE California High School Exit Exam Explaining and Using 2010-11 CAHSEE Summary Results at http://www.cde.ca.gov/ta/tg/hs/documents/cahsee11eusumres.pdf
29

TOM TORLAKSON State Superintendent of Public Instruction
3030
CAHSEE
• The primary purpose of the CAHSEE is to: 1. prompt significant improvement in student
achievement in public high schools. 2. ensure that students who graduate from
public high schools can demonstrate grade level competency in reading, writing, and mathematics.
• All high school students in California public schools must satisfy the CAHSEE requirement.
Handout: CAHSEE Scale Scores
Presently, students must achieve a passing score on CAHSEE to receive a high school diploma in California.
The CAHSEE helps identify students who are not developing skills that are essential for life after high school and encourages LEAs to give these students the attention and resources needed to help them achieve these skills during their high school years.
The AYP for high schools is determined based upon the first administration of the CAHSEE to a district’s 10th grade students.
For AYP, proficient or above in high schools is a scale score of 380 or higher for either the English language arts (ELA) or the mathematics part of the CAHSEE. For API and a high school diploma, a scale score of 350 or higher is considered passing for either the ELA or the mathematics part of the CAHSEE.
30

CAHSEE (Cont.) TOM TORLAKSON
State Superintendent of Public Instruction • Currently SWDs:
– take CAHSEE as tenth graders. – are eligible for an exemption from
meeting the CAHSEE requirement as a condition of graduation if indicated in their IEPs and they do not pass CAHSEE in tenth grade.
3131
Currently, California Education Code Section 60852.3 provides an exemption from meeting the CAHSEE requirement as a condition of receiving a diploma of graduation for eligible students with disabilities who have an IEP or a Section 504 plan. The IEP or Section 504 plans must state that the student is scheduled to receive a high school diploma and has satisfied or will satisfy all other state and local requirements for high school graduation, on or after July 1, 2009. (In effect until July 2012.)
31

TOM TORLAKSON State Superintendent of Public Instruction Academic
Performance Index (API)
32
For additional information on the analysis of API, please see the California Department of Education (CDE) 2010-11 Academic Performance Index Reports Information Guide at http://www.cde.ca.gov/ta/ac/ap/documents/infoguide11.pdf.
32

API
TOM TORLAKSON • Based on student performance onState Superintendent of Public Instruction
statewide assessments across multiple subject areas.
• Single number ranges from 200– 1000.
• Cross-sectional look at student achievement—does not track individual student progress.
3333
The API is calculated for LEAs, schools, and for each numerically significant student group at a school or an LEA. It is based on an improvement model. It reflects the performance of STAR Program Assessments (CST, CMA, CAPA) in grades two through eleven and CAHSEE in grades ten through twelve. The purpose of the API is to measure the academic performance and growth of schools. Schools and student groups have annual API growth targets of five percent of the difference between the school’s or student group’s Base API and the statewide performance target of 800. It is a snapshot comparison of school and LEA level achievement results from one year to the next. It includes subgroup data to address achievement gaps. API data does not track individual student progress.
33

TOM TORLAKSON State Superintendent of Public Instruction
API (Cont.)
• Measures academic performance and growth of student groups, schools, districts, and the state.
• Is calculated from STAR and CAHSEE results and used to rank schools for statewide comparisons.
• Meets one of the federal AYP requirements under the Elementary and Secondary Education Act (ESEA).
34
34

Limitations of API
TOM TORLAKSON The API does not tell us:State Superintendent of Public Instruction
• Which content areas are improving. • How many students are scoring at
each performance level in each content area.
• Where to focus instructional resources. • Whether specific instructional
intervention programs were effective.
3535
API data provides an overall picture of student performance at the LEA, school, and student group levels. However, API data does not provide information on which content areas are improving, the distribution of student performance levels, or the effectiveness of instructional programs.
35

TOM TORLAKSON State Superintendent of Public Instruction Local Data
36
The array of local data each LEA should consider will vary depending on the LEA. This section covers those assessments that all LEAs should use in conducting the academic needs assessment.
36

Local Data
TOM TORLAKSON • Initial assessments determine State Superintendent of Public Instruction
students’ placement in a program. • Diagnostic assessments identify
areas of strengths and weakness. • Formative assessments
demonstrate students’ progress toward meeting identified benchmarks.
37
The SBE-adopted core and intervention instructional materials for ELA and mathematics contain strategies and tools for regularly measuring student achievement. Some formative assessments may be locally developed and administered. The use of a data management system at the LEA is critical for frequent, on-going assessment results to track student progress.
The next slide elaborates on the uses of formative assessments to inform the school and the district.
37

TOM TORLAKSON State Superintendent of Public Instruction
38
Local Data (Cont.)
• Formative assessments – Monitor progress toward meeting
standards. – Identify students for interventions. – Inform instructional decision-making. – Inform parents and students of student
progress.
Handout: 6th Grade Unit Assessment
Routinely administered (i.e., every 6 weeks) formative assessments (e.g., SBE-adopted curriculum embedded assessments and locally developed assessments) allow LEAs to:
• Monitor student progress toward meeting the standards. • Identify students who need strategic and intensive interventions to
achieve the standards. • Inform instructional decision making. Timely data is essential for
successful teacher collaboration and decision-making regarding instruction and student support.
• Help teachers keep parents and students informed about students' progress.
Look at the handout of assessment results for sixth grade.
Facilitator Question: How might these results inform instructional decision-making?
38

Other Local Data TOM TORLAKSON
State Superintendent of Public Instruction • Additional data to be included in
the needs assessment: – graduation and dropout rates – demographics – attendance – suspensions and expulsions
39
Examining some types of local data listed on the slide may provide insight into the academic performance of the student populations.
• Graduation rate is used an additional indicator in determining AYP, and LEAs with significant challenges in this area need to construct an approach to this issue as they consider their strategies in the LEA Plan for improving academic performance.
• High dropout rates affect the graduation rate, and challenges in this area may require investigation. The LEA may need to construct an approach to address dropout rates to improve student achievement.
• Demographic factors to review may include changes in: • Patterns of language dominance • Socio-economic status • Densities of ethnic populations • Declining or increasing enrollments • Student mobility
• High absence rates in the school and district will significantly affect student learning and achievement.
• Suspensions and expulsions often have complex causes. If suspensions and expulsions are a significant challenge, examination of this data should be part of a discussion among all members of the DLT and strategies for addressing this should appear in the LEA Plan.
39

TOM TORLAKSON State Superintendent of Public Instruction
Data Sources • CDE DataQuest Web page
http://www.cde.ca.gov/ds/sd/cb/dataquest.asp
• Educational Results Partnership http://edresults.org/data/ (Outside Source)
• Data Driven Classroom http://www.datadrivenclassroom.com/ (OutsideSource)
• The New School Profiler http://www98.achievedata.com/schoolprofiler/?mainpage(Outside Source)
40
The sites listed are a few sources to support the DLT in the analysis of student achievement data for conducting the needs assessment.
40

TOM TORLAKSON • For an additional in-depth discussion on
State Superintendent of Public Instruction conducting a needs assessment, please
view the California Comprehensive Center (CA CC) at WestEd’s What to do with the Data: From Analysis to Planning Improved Student Achievement Web page at
http://www.cacompcenter.org/cs/cacc/print/ htdocs/cacc/esea-requirements.htm#data (Outside source).
41
The Webinar cited contains a thorough explanation of state assessment data and its uses.
41

TOM TORLAKSON State Superintendent of Public Instruction Orientation to State
Program Evaluation Tools
42Handout: State Tools Basic Review Quiz
The state program evaluation tools provide critical data about the services and implementation of the LEA’s instructional program. Facilitator Notes: Question for discussion: To what extent are the state program self evaluation tools being used in your district? If time permits, administer the State Tools Basic Review Quiz developed by Los Angeles County Office of Education.
42
TOM TORLAKSON State Superintendent of Public Instruction
Introduction to the Four State Tools
• Academic Program Survey (APS) • English Learner Subgroup Self
Assessment (ELSSA) • Inventory of Services and Support
(ISS) for Students with Disabilities(SWDs)
• District Assistance Survey (DAS)
All tools are available at http://www.cde.ca.gov/ta/ac/ti/stateassesspi.asp
43
The tools will be discussed and their use defined in the next slides, with the exception of the DAS. The DAS synthesizes the results from the other three tools, and it will be thoroughly discussed in Module III.
43
Tool Use • Tools should be used:
TOM TORLAKSON – Collectively with an inclusive cross State Superintendent of Public Instruction
section of stakeholders. – To provide multiple perspectives of
district-wide program implementation. – To foster common understanding of
student achievement data and agreement on improvement strategies.
• Module III will focus on this conversation.
44
The intention is that the tools be used collectively and with an inclusive group of stakeholders in order to provide a more complete picture of district-wide efficacy to ensure that the school and district plans reflect a common understanding of the student achievement data and tool results.
44

TOM TORLAKSON State Superintendent of Public Instruction Academic Program
Survey (APS)
45
The APS is the primary academic program evaluation tool to be used at the school and district level.
45

APS: Purpose TOM TORLAKSON
State Superintendent of Public Instruction • The APS is designed to help a
school: – Analyze the extent to which it is
providing a coherent instructional program.
– Identify resource and program support needs for academicimprovement.
46
The APS is organized around nine Essential Program Components (EPCs) for instructional success. Although focused primarily on the implementation of ELA and mathematics standards, each EPC is a constituent part of a coherent instructional system. Three grade-span surveys measure the relative presence of the EPCs. In assessing the academic programs for the district, past practice suggests that individual schools should complete the APS and the results should be aggregated at the district level. This ensures that the site level perspective informs the district discussions and the contents of the revised LEA Plan.
46

TOM TORLAKSON State Superintendent of Public Instruction
Essential Program Components (EPC) Order
Implementation of Instructional Materials 1. Instructional Program 2. Instructional Time 3. Lesson Pacing Guide Initial and Ongoing Professional Development and Support 4. School Administrator Training 5. Credentialed Teachers and Professional Development 6. Ongoing Instructional Assistance &Support for Teachers Achievement Monitoring and Teacher Collaboration 7. Student Achievement Monitoring System 8. Monthly Collaboration for Teachers Facilitated by Principal Fiscal Support 9. Fiscal Support
47
This slide shows how the nine EPCs are grouped to best reflect a systemic approach to school improvement. In 2009, the APS organization was modified and EPCs were updated to reflect changes in the ESEA and in new constraints resulting from budget cuts to schools and LEAs. The EPCs were realigned and renumbered in the restructuring.
This slide shows the realigning and clustering of the EPCs to reflect the systemic nature of fully implementing all nine EPCs. The numbers on the left reflect the former numbering system; the numbers on the right represent the realigned EPCs which will be used henceforth in describing the academic program evaluation.
Cluster 1 (EPCs 1, 2, and 3): Implementation of Instructional Materials
Cluster 2 (EPCs 4, 5, and 6): Initial and On-going Professional Development and Support
Cluster 3 (EPCs 7 and 8): Achievement Monitoring and Teacher Collaboration
Cluster 4 (EPC 9): Fiscal Support
47

APS: EPC 1.1
TOM TORLAKSON State Superintendent of Public Instruction
Essential Program
Component Objective Criteria and Clarifications
Implementation Status and Key Components
Review and identify which key components apply. Circle the most appropriate rating.
1. Instructional Program
1.The school/district provides the current* State Board of Education (SBE)-adopted, standards-based, basic core instructional programs and materials in Reading/ Language Arts (RLA)/English language development (ELD), including ancillary materials for universal access. These programs are implemented as designed and documented to be in daily use in every classroom with materials for every student. * Pending State Board of Education (SBE) action and as a result of ABX4 2, the SBE RLA/ELD 2008 and Mathematics 2007 adoptions and the previous SBE standards-based adoptions will meet the intent of this objective.
Full implementation means that all students, including English learners (ELs), students with disabilities (SWDs), students with learning difficulties, and advanced learners in all grade levels, are provided the SBE-adopted basic core instructional program materials in RLA/ELD. These materials are implemented daily as designed to support the needs of all students. •At all levels, teachers use the adopted basic core and program ancillary materials designed for universal access/differentiated instruction to meet the needs of students, including strategic learners. •All SBE-adopted programs have been designed with additional ancillary materials including intensive vocabulary instructional support kindergarten through grade three (K-3), and reading intervention kits (grades one through three) that are to be used with and beyond the basic program. The ancillary materials are used for universal access. Universal access is a term that describes differentiated instruction that meets the needs of all students, including ELs, students with reading difficulties, students with disabilities (SWDs), and advanced learners. •Some SWDs may need special modifications and/or accommodations of curriculum or instruction, as specified in their individualized education program (IEP), to enable them to participate successfully in a basic core classroom.
Objective Fully Substanti ally
Partiall y
Minim ally
1.1 4 100%
3 At least
75%
2 At least
50%
1 Less than 50%
Key Components Appropriate Instructional program materials All students are ___ assessed, ___placed, and ___provided appropriate SBE-adopted instructional program materials.
Number of Students: ____ All Students. ____ ELs. ____ SWDs. Appropriate Use Identify all that apply: ____ Basic core materials are used daily as designed. ____ Ancillary materials are used daily as designed.
Documentation Additional Comments
Reading/Language Arts/ELD
District Purchase Date:
School Distribution Date:
Classroom Distribution Date:
Attach publisher purchase order (PO) documentation for sets of classroom basic core materials.
Handout: APS Introduction 48
This slide is a sample page from the Elementary Grade Span Academic Program Survey.
Note that the description of “full implementation” has now been expanded. It now includes ELs and SWDs in the descriptions for “effective implementation.”
Other changes include:
• More detailed ratings charts and “key components” sections assist in rating the school and the district.
• Citations and references are no longer listed in the center column. They are now a separate document.
48

APS: Cluster 1 (EPCs 1, 2, and 3)
TOM TORLAKSON Instructional Materials: State Superintendent of Public Instruction
• Include 2001/2002/2005 SBE adoptions in definition of current instructional materials in ELA and mathematics.
• Clearly define use of ancillary materials in the basic core adoption.
• Define daily use of English-language development (ELD) materials for ELs at their assessed level of need.
49
EPCs 1, 2, and 3 comprise Cluster 1, which focuses on effective implementation of a basic core instructional program and materials.
SBE adoptions are not listed in the APS, but are listed in the citations section as a separate document.
Use of ancillary materials is explicitly defined. They are:
• Used during basic core universal access time to differentiate instruction for all learners.
• Used during additional strategic intervention time.
English-language development (ELD) instruction is urged as additional time beyond the time required for the basic core program and strategic academic support.
49

APS: Cluster 1 (Cont.) Strategic Interventions:
TOM TORLAKSON State Superintendent • Time for strategic support is defined in of Public Instruction
elementary grades. • In secondary grades, high-priority
strategic students receive an additional period of strategic support.
• Secondary strategic students performing closer to grade level can be supported in the core classroom through targeted support activities.
50
In elementary grades, kindergarten through grade six, the instructional minutes for strategic intervention is defined as 30 minutes beyond core instructional time.
In secondary, grades seven through twelve, the strategic intervention should be at least 30–45 minutes or an additional period.
The requirement of an additional period for students in grades seven through twelve should be determined by assessing the level of needed support to achieve grade level standards.
50

APS: Cluster 1 (Cont.) Intensive Interventions:
TOM TORLAKSON State Superintendent of Public Instruction • Mathematics (2008 SBE adoption)
includes SBE-adopted intensive interventions: – Grades four through seven
intervention programs are to be used with core materials (not in-lieu).
– Eighth grade Algebra Readiness is to be used in-lieu of eighth grade Algebra.
51
The need for intensive intervention is defined in accordance with the recommendations of the ELA and Mathematics frameworks.
Intensive interventions are determined based on careful diagnostic assessment of student need.
51

APS: Cluster 1 (Cont.)
TOM TORLAKSON State Superintendent of Public Instruction • For secondary schools, students
testing on the California English Language Development Test (CELDT) Levels 1–3 should be receiving ELD instruction beyond a core English class.
52
The recommendation for additional time for ELs scoring below Level 3 on the California English Language Development Test (CELDT) will be further explored in the examination of the ELSSA later in this training.
52

APS: Cluster 1 (Cont.) Pacing Guides:
TOM TORLAKSON State Superintendent of Public Instruction • High school focus—English 9 and 10,
Algebra I, and Algebra Readiness. • English 9 and 10 and Algebra I use
core pacing guide for the respective strategic support classes.
• For ELA, students receive at least the minimum course of study as described by the publisher.
53
Additional language about the “minimum course of study” is in the high school version to ensure that all students have instruction in all ELA standards.
53

APS: Cluster 2 (EPCs 4, 5, and 6)
TOM TORLAKSON Professional Development and Support:State Superintendent of Public Instruction
• Definitions of materials-based professional development for principals and teachers include: – Guidelines for training content based upon
AB430 Principal Training Program and SB472 Teacher Instructional Materials Training.
– Trainings provided by knowledgeable, experienced providers.
54
The second grouping of the EPCs, Cluster 2, focuses on improving the instructional program through professional development for both administrators and teachers. Cluster 2 defines initial and on-going professional development and support for fully implementing ELA and mathematics adoptions for all students.
Revision of the definition of materials-based professional development reflects ABX4 2, SBX3 4 and 2009 budget flexibilities allowing LEAs to delay purchase of the most recent ELA and mathematics adoptions
The description of the content of materials-based professional development mirrors that of AB430 Principal Training Program and SB472 Teacher Instructional Materials Training. In the current budget climate, LEAs may provide professional development other than SB472 for teachers or AB430 for administrators. SB472 and AB430 may still be available and, if so, are a good professional development option.
Trainings no longer must be provided by SBE-approved trainers.
54

APS: Cluster 2 (Cont.) • For site administrators and teachers of
TOM TORLAKSON State Superintendent ELA and mathematics, recommendedof Public Instruction
SBE-adopted instructional materials training includes:
• Administrators (40 hours institute training, 40 hours structured practicum).
• Teachers (40 hours institute training and 80 hours structured practicum).
• Additional APS component 4.3 provides support to principals beyond the practicum to ensure full implementation of the adoptions and the EPCs.
55
Elementary school principals should do Module I in both ELA and mathematics to facilitate their instructional leadership roles.
Secondary principals can do either ELA or Intensive Intervention and mathematics.
The added objective for administrator professional development is to encourage the LEA to adopt and monitor an instructional coaching program for site principals and other site administrators.
55

APS: Cluster 2 (Cont.)
Instructional Support for Teachers: TOM TORLAKSON
State Superintendent of Public Instruction • Continues instructional assistance and
support for all ELA and math teachers. • Provides examples of ongoing
assistance. • Provides guidance for training
instructional experts and coaches. • Encourages principals to structure and
monitor the use and impact of coachingservices on student achievement.
56
EPC 6 expands the classroom coaching model to include monitoring and evaluation by the site administrator to determine the effect on instruction and achievement.
56

APS: Cluster 3 (EPCs 7 and 8)
TOM TORLAKSON State Superintendent Achievement Monitoring System: of Public Instruction
• Clarifies district responsibility to provide a data management system to support easy and timely data use at the school.
• Defines purpose for data monitoring: student achievement results from entry level, diagnostic, curriculum-embedded and formative and summative data inform student placement, classroom instruction and teacher collaboration.
57
The LEA must provide a usable data monitoring system that supplies teachers and site administrators with timely assessment data. It is a critical element of improved student achievement. The LEA must implement a data system that quickly processes periodic student assessment data in formats that are easy for teachers to use for evaluating individual, classroom, and grade-level data.
57

APS: Cluster 3 (Cont.) TOM TORLAKSON
State Superintendent of Public Instruction Regular teacher collaboration:
• Defines collaboration: LEA/Principal facilitates monthly structured collaboration meetings (preferably two per month).
• Clarifies features of data-driven collaboration.
58
At monthly structured collaboration meetings, teachers: • Analyze and discuss results of student assessments. • Use data to guide student placement, instructional planning, and delivery.
The Cluster 3 EPCs clarify features of data driven collaboration:
• The school or district facilitates development of a data team collaboration protocol.
• The school or district provides teacher training on the analysis of various types of data and the collaboration protocol that is used for the regular collaboration time.
58
APS: Cluster 4 (EPC 9) TOM TORLAKSON Clarifies the importance of aligning State Superintendent
of Public Instruction
resources and priorities in the Single Plan for Student Achievement (SPSA) with the LEA Plan and documenting full implementation of the EPCs.
• Aligns use of general and categorical funds in the LEA Plan and the SPSA.
• SPSA expenditures document EPC alignment.
59
The LEA prioritizes and coordinates use of general and categorical funds to align expenditures for full implementation of the EPCs with school Single Plans for Student Achievement (SPSA).
Schools document the use of funds within the SPSA as developed with the School Site Council and approved by the local governing board.
59
Administration of the APS: Process
TOM TORLAKSON State Superintendent of Public Instruction • Discuss and agree on each rating (by
grade/course level teachers). • Review ratings (school leadership
team). • Validate results (i.e., external team
and/or site validation classroom visits, interviews, focus groups).
• Leadership team completes APS for their school.
60
A suggested process for administering the APS might include: • Teachers complete the APS (in grade level groups) or via a web-based
survey. • Results are aggregated and reviewed by a school leadership team. • Leadership team sends the results to the external provider or a district contact
person. • Providers/district staff validate the results through activities, such as
classroom observations, focus groups, and interviews.
It is important that a "critical" eye be applied to the APS to ensure that the results are accurate. For example, if schools are not exclusively using SBE-adopted materials in their ELA or math classrooms, even though the APS rates that EPC as “Fully,” the LEA must develop an action plan that addresses the need to provide SBE-adopted or standards aligned ELA and mathematics curricula.
60
Administration of the APS: Process (Cont.)
TOM TORLAKSON State Superintendent of Public Instruction • Examine clusters of results across grade
spans and departments to prioritize needs for the school’s instructional program.
• Begin at Cluster 1, Implementation of the Instructional Materials.
• Ensure that all resources in EPC 9 are allocated to high priority EPCs.
61
Validated results of the APS should be discussed at grade-level and course-level meetings to ensure validity of the ratings.
61

APS Reflection TOM TORLAKSON
State Superintendent of Public Instruction Table group conversation:
• What portion of the APS still needs further clarification?
• Which APS components are the most difficult to implement in your district and why?
62
This slide provides some questions in thinking about the APS.
Facilitator notes: Provide a few minutes for small groups to consider the questions. Another question might be:
• What questions do you have about the administration and use of the APS at school levels to inform district decision making?
62

TOM TORLAKSON State Superintendent of Public Instruction For a more in-depth discussion for
using the APS, view the Webinar at:
http://www.cacompcenter.org/cs/cacc/print /htdocs/cacc/esea-requirements.htm (Outside source)
63
63

TOM TORLAKSON State Superintendent of Public Instruction English Learner
Subgroup Self-Assessment (ELSSA)
64
The ELSSA differs from the other tools in its approach; it uses individual student assessment results to analyze the needs of the English Learner (EL) program. The following section explores the use of the ELSSA as an LEA assessment tool.
The complete ELSSA is located at the CDE Web page at http://www.cde.ca.gov/sp/el/t3/documents/t3elssa11.xls.
64

ELSSA: Purpose • The ELSSA is a highly
TOM TORLAKSON State Superintendent of Public Instruction recommended tool for LEAs that
have not met Title III Annual Measurable Achievement Objectives (AMAOs) for two or four consecutive years.
• It is a required tool for LEAs in Title I PI Year 1 because of the Englishlearner (EL) student group.
65
Title III requires that states hold LEAs accountable for meeting three annual measurable achievement objectives (AMAOs) for ELs.
The first AMAO relates to students making annual progress on the CELDT.
The second relates to student who attain English proficiency on the CELDT.
The third AMAO relates to meeting AYP in ELA and mathematics by the EL subgroup at the LEA level.
California highly recommends LEAs that have not met AMAOs administer the ELSSA.
California requires LEAs that are in PI Year 1 to administer the ELSSA.
65

ELSSA TOM TORLAKSON
State Superintendent of Public Instruction • To meet accountability requirements for
Title III and LEA PI Year I, the ELSSA must be completed and its findings uploaded and attached to: – The Title III Year 2 Improvement Plan
Addendum. – The Title III Year 4 LEA Action Plan. – The Title I Program Improvement Plan
related to the EL student group. 66
The ELSSA template is available at the CDE Web page http://www.cde.ca.gov/sp/el/t3/documents/t3elssa11.xls.
66

ELSSA (Cont.) • The tool is highly recommended for use
TOM TORLAKSON by LEAs, District Assistance andState Superintendent of Public Instruction
Intervention Teams (DAITs), and technical assistance providers to examine their programs and services for ELs.
• It helps identify key challenge areas and explore root causes for ELs not meeting the AMAOs.
67
Though not required of all LEAs, the ELSSA provides LEAs with significant information about services to ELs.
67

ELSSA: Design
• Assembles data from CST, CELDT, TOM TORLAKSON
State Superintendent of Public Instruction and the CAHSEE and shows
progress in meeting AMAO 1, AMAO 2, and AMAO 3.
• Disaggregates data by years a student has been in U.S. schools, achievement scores, and language proficiency.
68
See DataQuest on CDE Web page at http://www.cde.ca.gov/ds/sd/sd/.
68

ELSSA: Design (Cont.) TOM TORLAKSON
State Superintendent of Public Instruction • Provides guiding questions to facilitate
conversations about the data. • Helps identify areas to improve EL
student achievement. • Demonstrates direct alignment to the
APS to integrate the needs of ELs in a quality core instructional system.
• Pinpoints specific language learners issues.
69
The quality core instructional program for ELs will include: • Appropriately authorized teachers that provide ELD and Specially Designed
Academic Instruction in English (SDAIE) strategies. • Placement/exit criteria for ELs, including
• Self-contained, departmentalized, or mainstreamed placement. • Intensive and strategic interventions for ELD support.
• Use of formative and summative student achievement data to monitor EL progress in core and ELD.
• Access to ELD materials and support as well as a quality basic core curriculum which includes universal access time within core and strategic academic time.
• Use of research-based instructional strategies when teaching the SBE-adopted academic core and ELD materials.
• Collaborative use of multiple data sources to inform professional development of teachers and administrators.
69

TOM TORLAKSON State Superintendent of Public Instruction
What the ELSSA Does Not Do • Give school level information. • Analyze data. • Address Highly Qualified Teachers
or other aspects of ESEA not directly related to ELs.
• Evaluate the programs and services for ELs.
70
70

TOM TORLAKSON State Superintendent of Public Instruction
ELSSA: Process
The ELSSA process begins with the collection, display, and analysis ofdata to frame big questions.
Some sample questions: • Why are so many ELs who have been in our
schools for four or more years only scoring atthe intermediate level of CELDT?
• Are 100 percent of EL students reaching proficiency in a reasonable amount of time?
• Why are EL students who are proficient on CELDT not meeting proficiency on the CST?
71
71

TOM TORLAKSON State Superintendent of Public Instruction
Organization of the ELSSA
The ELSSA is assembled in an Excel workbook with four worksheets: • Worksheet 1: Introduction and Directions • Worksheet 2: Enter LEA Data.
– Tables 1–3: Progress in meeting AMAO’s 1, 2, and 3.
Handout: ELSSA 72
In this module, we will be using a sample ELSSA which is also used in the scenario.
Take a few minutes to look through the handout to familiarize yourselves with the format and the organization of the document. We will examine it in earnest after a couple of minutes.
The ELSSA is organized in four sheets in an Excel document:
Worksheet 1 is a narrated explanation with directions for the rest of the document.
Worksheet 2 is a series of tables for the LEA to fill in their local data.
• Tables 1 through 3 contain grade level progress in meeting AMAOs 1, 2, and 3.
• Tables 4 and 5 are discussed on the next slide.
72

Organization of the ELSSA (Cont.)
TOM TORLAKSON State Superintendent of Public Instruction • Worksheet 2: Enter LEA Data (Cont.)
– Table 4: (AMAO 1) Progress of EL students at each level of the CELDT.
– Table 5: (AMAO 2) Progress of ELs based on length of time in United States schools and in the local district.
73
Table 4: The LEA should enter data documenting progress at each level of CELDT. A question the LEA should consider for this table is:
• Are students appropriately placed, instructed, and monitored?
Table 5: A question that the LEA should consider based on the data entered for this table:
• How are EL students performing on the CELDT based on the length of time in US schools? Length of time in the district?
73

Organization of the ELSSA (Cont.)
TOM TORLAKSON State Superintendent of Public Instruction • Worksheet 2: Enter LEA Data.
(Cont.) – Tables 6–10: (AMAO 3) Performance
of ELs at various levels of CELDT proficiency on state tests (CSTs [ELA and math] and CAHSEE).
74
Tables 6–10 are all data related to AMAO 3: progress in ELA and mathematics for ELs.
Table 6 asks the LEA to examine CST performance of ELs scoring at the intermediate level on the CELDT in ELA and mathematics.
Table 7 asks the LEA to examine CST performance of ELs scoring English Proficient on the CELDT in ELA and mathematics.
Table 8 is examination of CST performance of Reclassified Fluent English Proficient (RFEP) students in ELA and mathematics.
Tables 9 and 10 examine ELs and RFEPs performance on CAHSEE.
74

Organization of the ELSSA (Cont.)
TOM TORLAKSON State Superintendent of Public Instruction • Worksheet 3: Discuss Data and
Rate Survey Items. (Survey items are aligned to APS) – Tables 1–10: Discuss findings from
“Enter LEA Data” for all CELDT levels, conclude themes of student performance, deduce essential questions for actions.
75
The ELSSA survey items are located on the Discuss Data and Rate Items sheet, Worksheet 3. Items are rated on a four-point Likert-scale like that used by the APS. APS citations are provided following each item in parenthesis. Items must receive at least a rating of 3 for the school or LEA to be considered as meeting that objective at an acceptable level. The 3 rating indicates an acceptable level of implementation.
75
Organization of the ELSSA (Cont.)
TOM TORLAKSON State Superintendent of Public Instruction • Worksheet 4: Survey Results by
Category – Aggregate results of Worksheet 3
survey item findings by category. 1. ELD 2. Access to core and opportunity to learn
(ELA, math, intervention, placement) 3. Professional Development 4. Assessment 5. Accountability
76
This summary of all the survey questions by categories is very helpful in looking at programmatic considerations to support the learning of the English language and academic achievement.
Its stated alignment to the APS makes it easier to connect the findings of these two state tools.
76

ELSSA: Restructuring
TOM TORLAKSON • ELSSA toolkit: provides State Superintendent of Public Instruction
administration and table completion guidance.
• Survey items: located on the same page as the relevant data tables.
• Survey items: rated on the same rating scale as the APS.
77
The ELSSA was restructured in 2009 to align with the APS.
The chart on the next slide shows the parallel nature of the ELSSA survey and the APS.
77

TOM TORLAKSON State Superintendent of Public Instruction
ELSSA and APS Rating Scale
1 Few = Rarely = Minimal level of Less than 50% Less than 50% Implementation of students of the time
2 Partial level of Implementation
Some = 50% of
students
Inconsistently = 50% of the time
3 Substantial level
of Implementation
Most = 75% of
students
Consistently = 75% of the time
4 Full level of
Implementation
All = 100% of students
Uniformly = 100% of the
time
78
Note Bold Font: All items must receive at least a rating of 3 for the school or LEA to be considered as performing that objective at an acceptable level.
78
Administration of the ELSSA: District
TOM TORLAKSON State Superintendent of Public Instruction 1. Completes the data tables.
2. Convenes a select group of people who have a variety of roles in the district (e.g., District Curriculum and Instruction [C&I] administrator and EL coordinator, principal, ELA coach, ELD and ELA teachers, counselor) to analyze the data and its implications.
79
There is no one best way to complete the ELSSA; methods may vary depending on district organization.
The organization of the ELSSA document provides discussion prompts and questions with each table in the “Discuss Data and Rate Items” worksheet (Worksheet 3) to facilitate group response.
When the results are entered into the tables, they will automatically calculate an average rating for the section.
When using the results for planning purposes, also consider the results of the APS items that are noted in each ELSSA survey section. The APS and ELSSA are aligned, and information from both tools used together can help to pinpoint areas that need attention.
79

Administration of the ELSSA: District (Cont.)
TOM TORLAKSON State Superintendent of Public Instruction 3. District leader/external provider
compiles the ELSSA Summary for DLT review and discussion. The summary will include • Major findings and considerations. • Consistent ( and inconsistent) findings
with the APS.
Option: District also may ask school-site group(s) to complete the surveys and then compare the results to the LEA’s survey.
80
The analysis in Step 3 is best completed by an English Learner expert with the results then shared with the members of the DLT.
Alternatively, the district may ask school-site groups to complete the surveys and then compare the results with the district’s LEA survey.
80

TOM TORLAKSON
ELSSA: Activity
• Review a set of data tables and State Superintendent of Public Instruction survey questions that inform one
another as ELSSA users … – Determine the ELs in greatest need
of support (by CELDT level and grade span).
– Identify district processes, programmatic and instructional considerations for improvement.
81
Overview: The following slides demonstrate the correlation between the questions posed in the first worksheet and the subsequent analysis conducted in the survey.
Facilitator Note: Activity: The data tables and survey tables have been populated by numbers and ratings. Facilitators 1) can ask participants to read the tables and draw conclusions (answers provided in the notes), or 2) can guide the participants through the slides by having them read each slide, noting how they inform one another.
Connections among the slides for ELA/ELD:
Slide 82– AMAO #1: EL progress in meeting CELDT English Language targets.
Slide 83 – Survey questions related to the effectiveness of the ELD program–note in all cases there is a correlating APS objective that relates to the EL system component.
Slide 84 – Data Table which focuses in on Intermediate ELs (most consistent EL group that is not making progress on AMAO 1) to determine progress toward academic standards.
81

TOM TORLAKSON State Superintendent of Public Instruction
Closer Look At How ELSSA Sections Work Together
Questions to consider: • At which level do most students score? • How well did students progress from one level to the next? • Which groups of students merit further review?
Handout: CELDT Performance 82
This ELSSA table from AMAO #1, Worksheet 2 displays the language proficiency levels on the left side, and shows the number and percent of students that advanced one ELD level from one CELDT exam to the next.
Look at the Beginning group at the top left side of the table. Looking across this row, notice there were 407 ELs at this level, and that they were 15.5 percent of the EL population. 248 of them (or 60.9 percent) made progress to the next level on the CELDT the following year. This is below the state average of 66.7 percent of the beginners who made progress in the early intermediate level.
Look at the other groups of students and note how they progressed reading from left to right on each row.(pause a moment to let them take a look). Consider each of the questions under this chart.
Q: At which level do most students score? Intermediate (36.4 percent)
Q: How well did students progress from one level to the next? Almost every group performed underthe state average. The exception is the last row of English Proficient students.
Q: Which groups of students merit further review? We suggest that the intermediate students need further review. Most students score at the Intermediate level, and made the least amount of progress– which was lower than the state average. Also, the students at the “Early/Adv. – Adv. Not Proficient”progressed below the state average merit review. “Not Proficient” means that one or more sub skills (L-S-R-W) on the CELDTwere below the intermediate level on the CELDT. The district needs to run a report to look specifically at which skills present the most challenges so thatintervention can be provided in this area.
Overall: Oak Tree is below the state average for most groups (the last group exceeded the state percentage of students making progress).Intermediate students are making the least amount of progress.
On the next 2 tables, we’ll take a closer look at how the Intermediate students are performing in ELA.
82

TOM TORLAKSON State Superintendent of Public Instruction
Questions to consider: • What areas need improvement as indicated by the ELSSA? • What additional information is provided by the APS?
83
Here are the ELSSA Survey items that address key indicators of an effective ELD program (worksheet 3). The previous slide indicated that the students in this district were not progressing as well as their statecounterparts in learning the English language; therefore, look at the instructional program and supportthey are receiving in learning English and academic ELA standards. Notice that in the parentheses, specific APS objectives are listed that address the same issues for ELs.
Have participants read over the ratings and answer the questions to consider:
Q: Which areas need improvement as indicated by the ELSSA? From this information, the district is not fully implementing interventions included in the core program for intermediate ELs. Nor does there appear to be a consistent amount of ELD set aside for identified students. The criteria forplacing students is less defined at the secondary level than the self-contained classrooms. Thecriteria for ELD instruction in mainstreamed English classes is also not clearly defined. It doesn’t appear that strategies are being applied to help students in the classroom, and that ELD assessments may not be used to monitor ELD progress.
Q: What additional information is provided by the APS? The APS items are noted at the end of each item on the ELSSA. If an area is determined to be weak on the ELSSA, look for the related APS items that will have more detail in each of these areas.
In this case, the APS summary indicated that: • The use of EL ancillary materials were inconsistently used. • ELs were not receiving a consistent ELD curriculum. • Instructional time allotted for ELD instruction varied greatly among the schools, specifically
Title I versus Non-title I schools. • All ELs identified needing an intensive reading intervention were not receiving this
instruction.
83

TOM TORLAKSON State Superintendent of Public Instruction
Questions to consider: • At which level do most students score for each grade level? • Which groups of students merit further review?
84
This slide is from the previous worksheet (Worksheet 2) and shows the progress of Intermediate ELs toward learning the academic content standards. The data table disaggregates Intermediate ELs by grade level and shows the percent of students in each CST performance level. From a earlier examination of the data (slide 81), it was apparent that many Intermediate level students did not make the expected ELD progress on the CELDT.
The performance levels are noted on the left side for each row, and the grade levels are along the top. Let’s look at one together- Grade 7. This shows that the intermediate ELs in seventh grade have 53 students. 4 scored at the proficient level, 21 were at basic and 22 were at below basic. 6 students were far below basic.
Q: At which level do most student score for seventh grade? Below basic (22) and Basic (21) – almost an even split.
Q: Which groups of students merit further review? The intermediates have a good amount of English, and with the appropriate instruction/intervention/scaffolding, should be able to move up to the proficient level. We will want to look closely at the basic/below basic students to see if they are appropriately placed, assessed, and if the instructional strategies that would benefit them are being employed in the classrooms.
NOTE: In the total column on the right, most students (47 percent) are at the basic level.
Facilitator Note: Continue by having participants review the other grade levels and discuss what they see.
84

ELSSA: Reflection Activity
• Think about and discuss the experiences TOM TORLAKSON State Superintendent of Public Instruction you have had in completing the ELSSA.
Some topics to consider: – Pointers on how to do it efficiently. – Connections among the data table and
survey questions that can help reveal areasfor improvement.
– Key issues that surfaced from the data review.
– Connections of key issues and relationship to the APS results.
– Changes in your instructional system as a result of ELSSA analysis.
85
Facilitator Notes: Have participants discuss the slide questions and report out to the whole group:
• How many have completed an ELSSA? • What are some suggestions on how to administer it efficiently? • How can the connections among the data tables and survey questions
be helpful in determining areas of needed improvement? • What are some of the major/key issues that the data review revealed?
How did these issues relate to the APS results? • What changes did you make in your instructional system as a result of
the ELSSA data?
85

TOM TORLAKSON State Superintendent of Public Instruction
For a more in-depth discussion for using the ELSSA, view the Webinar:
http://www.cacompcenter.org/cs/cacc/print/htdocs/cacc/esea-requirements.htm (Outside source).
86
86

TOM TORLAKSON State Superintendent of Public Instruction Inventory for Support
and Services (ISS) for Students with
Disabilities (SWD)
87
The Inventory for Support and Services (ISS) for SWD replaces the Least Restrictive Environment (LRE) tool.
87

ISS for SWD TOM TORLAKSON
State Superintendent of Public Instruction
The new tool, which replaces the Least Restrictive Environment (LRE) Self-Assessment Tool, was designed to identify the systemic issues of SWDs.
88
This tool was restructured in 2009 to reflect changes in the relationship of academic supports in the APS to other self-assessment tools for LEAs.
88
What Happened to the LRE Tool?
TOM TORLAKSON • The LRE Tool was useful, but when all the State Superintendent of Public Instruction tools were revised, a new tool was developed
to: – Be a closer fit with the standards for the
work of district level technical assistance providers.
– Better align with other tools used in LEA Plan development and Program Improvement.
– Coordinate with the APS findings. – Use existing data.
89
The tool was revised to align with other evaluation instruments in use at the district to help streamline the self-assessment process.
89
ISS for SWD: Purpose
TOM TORLAKSON The ISS is intended to:State Superintendent of Public Instruction
• Assist districts in assessing program and services for SWDs.
• Expand upon information about SWDs explicitly included in the APS and the DAS data.
• Target elements for an in-depth analysis to guide actions for increased student achievement.
90
The ISS for SWD provides: • Deeper understanding of why SWDs are not meeting proficiency targets. • Insights into ‘how’ to address the educational needs of SWDs within the LEA
Plan. • Data to help plan action steps to improve results for SWDs.
90

TOM TORLAKSON State Superintendent of Public Instruction
ISS for SWD: Design • Alignment with or expansion of
standards for district level technical assistance.
• Objectives as quality statements. • Criteria and clarifications use “full
implementation” descriptors. • Evidence lists existing documents
and activities to collect data. • Synthesis statement about
information gathered leading to important conclusions.
Handout: Inventory of Services and Support 91
The ISS for SWDs is aligned to the seven areas in the California Education Code at section 52059 for work at the district level. These include:
A. Governance B. Alignment of Curriculum, Instruction and Assessment C. Fiscal Operations D. Parent and Community Involvement E. Human Resources F. Data Systems and Achievement Monitoring G. Professional Development
91

ISS for SWD: Activity TOM TORLAKSON
State Superintendent of Public Instruction • At your table groups, read through
your section of the ISS noting/highlighting the “big ideas” in each column.
• Discuss your findings with your colleagues.
92
Facilitator notes (suggested activity): • Divide participants into groups or assign each participant at a table to examine the
ISS for SWD by the following standards groupings: ─ Governance, Fiscal Operations, and Parental and Community Involvement ─ Alignment of Curriculum, Instruction, and Assessment ─ Human Resources and Data Systems and Achievement Monitoring ─ Professional Development
• As a table group, discuss ─ Ideas that are new to your regular education and special education staff. ─ Challenges/barriers your district may have in moving your schools toward full
implementation.
92

Administration of the ISS for SWD
TOM TORLAKSON State Superintendent of Public Instruction 1. Review achievement data and data
from other tools. 2. Administer the ISS with appropriate
staff to better understand and analyze program and services for SWDs.
3. Confirm the results of ISS findings with classroom walkthroughs, gradelevel and/or department levelinterviews, student shadowing, and other data.
93
It is important to remember in administering the ISS and analyzing the results that: • SWDs are included specifically in the APS. • Districts should develop a multi-tiered learning system including benchmark,
strategic and intensive intervention supports that serve and support SWDs when appropriate.
• Programs for SWDs are an integral part of a school-wide and district-wide system.
• A system-wide collaboration between “general education” and “special education” staff at all levels of the system is critical.
• In this initial phase, the ISS does not have ratings or rankings for the objectives.
93

TOM TORLAKSON State Superintendent of Public Instruction
Administration of the ISS for SWD (Cont.)
4. Complete the “Synthesis Statement” based on data gathered.
5. Review/discuss, determine, and document important conclusions.
94
94

TOM TORLAKSON State Superintendent of Public Instruction
For a more in-depth discussion for using the ISS for SWD, view the Webinar:
http://www.cacompcenter.org/cs/cacc/print/htdocs/cacc/esea-requirements.htm (Outside Source)
95
95
TOM TORLAKSON State Superintendent of Public Instruction Overview of the District
Assistance Survey (DAS)
96
The DAS is a cumulative tool. It is informed by both the results of administering the other three tools and by skillful facilitation.
96
Tool Findings Guide District LEA Plan
TOM TORLAKSON State Superintendent of Public Instruction 1. The findings from the APS
(supplemented by the ELSSA and ISS) identify the areas of the instructional core program to be improved and supported at specific schools and grade levels in order to increase the achievement of all students.
97
The findings from the tools surveys will be crucial in completing a district-wide evaluation of the instructional programs in ELA and mathematics. In Module III, participants will use their findings from the APS, ISS, and ELSSA to complete the DAS.
97

Tool Findings Guide District LEA Plan (Cont.)
TOM TORLAKSON State Superintendent of Public Instruction 2. Findings inform the DAS to
determine actions for student academic improvement.
3. The actions determined by conducting the DAS become the goals and strategies of the LEA Plan.
98
The DLT will use the findings from the tools in administering the DAS and will conclude actions for improving student academic achievement. The findings focus the DAS conversation on what the district needs to do to support the full implementation of a quality basic instructional program for all its schools and students.
Through the process of conducting and analyzing data from the DAS, the DLT will develop goals for writing the LEA Plan.
98
DAS: Purpose
TOM TORLAKSON State Superintendent of Public Instruction The DAS is designed to guide LEAs
and their technical assistance providers in assessing the nature and alignment of district operations and the district’s capacity to support the full implementation of the California standards-based adopted curriculum and the EPCs in district schools.
99
The following slides provide a brief overview of the DAS. A thorough review of DAS administration occurs in Module III.
99

TOM TORLAKSON State Superintendent of Public Instruction
DAS: Design
• Organized around seven areas of district operation.
• Measures the implementation of the standards for district work at EC Section 52089.
• Describes “full implementation” of the standard following the APS format.
• Rating scale is different from the APS.
Handout: District Assistance Survey 100
Rating scale for the DAS compared to the rating scale for APS: DAS is based on a 3 point scale, APS is based on a 4 point scale. DAS
3=full implementation
2=partial implementation
1=minimal implementation
APS 4=full implementation 3=substantial implementation 2=partial implementation 1=minimal implementation
100

Areas of District Work TOM TORLAKSON A. GovernanceState Superintendent
of Public Instruction
B. Alignment of Curriculum, Instruction,and Assessment to State Standards
C. Fiscal Operations D. Parent and Community Involvement E. Human Resources F. Data Systems and Monitoring G. Professional Development
101101
These areas of district operation were introduced earlier in the discussion of the ISS, as the ISS reflects the organization of the DAS.
101

Administration of the DAS TOM TORLAKSON
State Superintendent of Public Instruction • A complete description of the
features and uses of the DAS in LEA Planning is a central topic in Module III.
102
102
TOM TORLAKSON State Superintendent of Public Instruction Needs Assessment
Scenario
103
The following provides an opportunity to practice conducting a needs assessment using multiple sources of student achievement data and results of state evaluation tools surveys.
Facilitator Note: If participants have their own LEA data, they may prefer to use it to practice completing the needs assessment.
103
Oak Tree Unified Needs Assessment Scenario
TOM TORLAKSON State Superintendent of Public Instruction
• This scenario provides a model analysis of student achievement data and information from the tools to determine priority areas of focus in the LEA Plan.
104
LEAs at risk of PI or in PI likely have a number of areas where reform is needed at the district or system level. The purpose of this method is to aid a district to focus on two or three critical improvement areas in a given year and to develop strategies to fully implement those strategies. Thus, it is incumbent upon the facilitator/technical assistance provider to thoroughly review the data and guide the DLT to limit their recommendations for high priority improvement areas.
The priority areas identified in this scenario will be used to focus the DAS conversation in Module III as the district builds its LEA Plan goals and strategies.
Prior to conducting a needs assessment with a DLT, the DAIT/technical assistance provider should consider the following:
• The reliability of the student achievement data, especially local data, to be included in the needs assessment.
• The analysis of achievement data and the use of the state tools may take several meetings.
• Sub-committee meetings focused on specific topics such as cabinet meetings may take place between DLT meetings.
• The DLT’s level of familiarity with the state tools will determine the required amount of training on the tools prior to their use in the needs assessment.
104

TOM TORLAKSON State Superintendent of Public Instruction
105
Needs Assessment Scenario Oak Tree Unified
Program Improvement Year 3 District – Corrective Action 6 imposed by SBE but no
specific technical assistance provider required – Entered PI due to ELs, SWDs and Socioeconomically
Disadvantaged students (SEDs).
Seventeen thousand plus students – Eleven elementary schools: seven K-5 and four K-8 – Five secondary schools: two 6-8, two 9-12, a 9-12
charter high school and one continuation high school (data not included)
Handout: Oak Tree USD Scenario & Demographics
Facilitator Notes: One of the design elements of this training is to show districts how to review a great deal of data and narrow the district focus to the high priority student populations and schools that need to be addressed in the LEA Plan.
With each of these scenario data sets the participants will be asked to review data, answer basic guiding questions, and complete the Data Summary Sheet – which asks participants to identify which schools, grade levels and student populations are not achieving targets.
105

TOM TORLAKSON State Superintendent of Public Instruction
106
Data Worksheet Data Source Schools, Student
Groups, Grade Spans What other
information is needed?
API
AYP
CSTs
AMAOs
Local Assessments
Handout: Data Worksheet
This Data Worksheet will be used in this practice analysis for examining API, AYP, and CST data. As a template, LEAs may include analyses of AMAO and local assessments for a more detailed examination.
106

TOM TORLAKSON State Superintendent of Public Instruction
107107
AYP Analysis Activity
Working in pairs: • Examine data tables for the LEA. • Note significant student groups (All
students, racial and ethnic significant groups, ELs, SED, andSWD).
• Discuss the questions. • Fill out the Data Worksheet.
Handout: AYP Data Tables
Facilitator Notes:
Put issues on a chart or overhead for participant viewing.
• At the district level, discuss which groups have met AYP targets in ELA and mathematics.
• Identify all schools that have shown consistent improvement over three years.
• From the Achievement Gap chart, discuss the performance of African-American and Hispanic-Latino students’ compared to White students.
Complete the Data Worksheet.
107

TOM TORLAKSON State Superintendent of Public Instruction
108108
CST: Analysis Activity
• Examine all student district performance by performance band.
• Examine student group performance and compare with all student performance.
• Answer questions on chart. • Fill out the Data Worksheet.
Handout: CST Data Tables
Facilitator Notes: Prepare a chart or overhead for the following issues: Students scoring Proficient and Advanced: • Discuss observations about CST district performance in the proficient and
advanced bands, and note any schools and grade levels that are progressing well.
• Compare district performance to the state performance.
Students scoring Below Basic (BB) and Far Below Basic (FBB): • Discuss observations about CST district performance over time for students
scoring in reducing the BB/FBB band. How do they compare to the state performance for students in these bands?
• Note any schools and grade levels not reducing the percentage of students in BB/FBB.
• Note significant disparities in achievement and progress among grade levels.
Student group performance: Note student groups that have the highest percentage of BB/FBB in comparison to their state counterparts. What questions does this information generate about student groups in this LEA?
108

TOM TORLAKSON State Superintendent of Public Instruction
109109
API Analysis Activity
Working in pairs: • Study one elementary school and one
secondary school. • Note significant student groups (All
students, racial and ethnic significant groups, ELs, SES, and SWD).
• Fill out the Data Worksheet.
Handout: API Data Tables
Facilitator Notes: Prepare a chart or overhead with the following questions for analysis of the API:
Study the API Data Tables and discuss the following questions: 1. What do you notice about the cumulative growth district-wide over three
years? About pockets of consistent growth? Pockets of consistent lack of growth?
2. Which schools are experiencing the greatest progress in subgroup scores? Which are making flat or negative progress in subgroup scores? Note and discuss the relationship of numbers of students tested and scores. Determine what other data is needed to come to conclusions about progress for subgroups.
Table group debrief – Chart at each table (see next slide)
109

TOM TORLAKSON State Superintendent of Public Instruction
110
Analyzing and Prioritizing Student Achievement Data
The Process
110

Achievement Data Summary TOM TORLAKSON
State Superintendent From the Data Worksheet: of Public Instruction
• Determine which student groups are consistently meeting growth targets.
• Determine which student groups consistently fail to meet growth targets.
• Determine other data that should be examined to evaluate progress.
111
Facilitator Notes: In your table groups, look at the completed Data Worksheet and come to agreement on the slide questions.
The district may have other key data which impacts student achievement to include in their data review and eventually in the LEA Plan. (See Slide 38 for examples of local assessments.)
Look at the determinations from the administration of the APS and/or other state program evaluation tools to help determine focus areas for the LEA Plan.
111
Using the State Program Evaluation Tools
TOM TORLAKSON State Superintendent of Public Instruction • Key question: What basic core program
and support services are provided to all the students of Oak Tree Unified? – The APS will reveal the instructional
system. – To include ELs (if applicable) and
SWDs, administer the ELSSA and ISS.
112
The district should:
• ensure it is offering a quality standards-based core program to all of its students as well as addressing the specific needs of its student groups.
• integrate findings from the ELSSA and ISS tool administration with the APS to ensure that SWDs and ELs have access to a quality core program and receive the additional support they need to learn the academic standards.
The next activity slides will provide practice in using summaries of the tools’ administration to determine priority areas of needed improvement.
Facilitator notes: The handouts are summaries of the scenario district’s tools administration. Participants will read the summaries, identify areas of needed improvement and then prioritize based upon relationship to APS Cluster 1.
Prepare charts for each tool activity and for a synthesis of the tools findings. After each tool activity, display priorities identified by participants on chart paper and restate agreed-upon priorities. Use the synthesis chart to summarize, group, and categorize priorities identified in the three tools
In an actual needs assessment, this probably would not happen in one day and may need further clarification meetings and/or work of small sub-committees to come to an agreement.
112

TOM TORLAKSON State Superintendent of Public Instruction
113
Activity: APS Summary
• Using either the elementary or secondary APS summary report: – Read assigned portions of the APS
Summary • EPC 1 • EPC 2–3 • EPC 4–6 • EPC 7–9
Handout: APS Summary
The tools analysis will assist in:
• Uncovering deeper insights and more comprehensive information about the school and district from careful administration of the tools.
• Collaborating with a larger group (i.e., DLT) to build a common understanding of the actions that need to be taken in order to improve student achievement for all students.
• Developing a coherent snapshot of the instructional program for all students in the LEA.
• Focusing discussion among collaborators to come to agreement concerning academic needs in the schools.
• Prioritizing most pressing needs (i.e., What do we do first?).
A district leader/external provider may do this another way, but a DLT and leadership team need to agree about priorities before administering the DAS (Module III).
Facilitator Note: Prior to beginning the activity, review the format of the summary explaining that the summary contains more than the schools’ initial ratings. It also includes such validation activities as:
• Conversations with principals and teachers.
• Focus groups.
• Validation observations for implementation.
• Review of school schedules.
Each group will read an assigned portion of the APS Summary. (See bulleted groupings of the EPCs above.)
113

Activity: APS Summary (Cont.)
• Identify concerns that must be addressed in TOM TORLAKSON
State Superintendent of Public Instruction order to fully implement the EPCs addressed
in the APS Cluster your group is reading.
• Cross-reference identified concerns with the needs of student groups identified in the assessment activities. Write one area of improvement that is needed on a post-it note.
• As a table group, begin to prioritize needs.
114
Facilitator Notes:
Activity – A chart for initial post-its is on Slide 116.
Participants write each improvement needed on a large post-it and place on chart on the wall (grouping with similar ideas as you go). Facilitator should place an asterisk (*) on post-its with needs related to Cluster I.
Once ideas have been posted and APS Cluster 1 activities have been noted, have table groups place the improvements in priority order. When an actual group engages in this activity, contextual issues will impact positioning of priorities.
To debrief this activity, group may do a Gallery Walk with one person staying to explain their priorities or each group could report out.
Facilitator synthesizes the needed improvement areas.
114

Prioritizing the Findings
TOM TORLAKSON State Superintendent of Public Instruction
• The APS priority order: – Implementation of Cluster 1 is a
first priority. – All other EPC components build
on Cluster 1.
115
Facilitator notes:
Make sure participants understand that priority is not determined by the lowest scores (i.e., We’ll address all the 1s.).
Cluster 1: The district provides:
• coherent standards-based reading/language arts and mathematics instructional programs (kindergarten through grade eight, SBE-adopted).
• sufficient instructional time to master grade level standards.
• separate instructional materials and time for ELs needing ELD.
• instructional and program support for students having difficulty attaining grade level standards.
The other two EPC Clusters (Ongoing Professional Development and Assessment and Progress Monitoring) can be addressed in the order that best facilitates systemic implementation for the district. This allows the district to consider local context issues such as budget, culture, etc.
It is important to note that while Cluster 1 is foundational and must be fully implemented, some associated priorities, such as strategic interventions in mathematics, may take time (up to two years) to fully implement, which should be noted in the LEA Plan.
115

TOM TORLAKSON State Superintendent of Public Instruction
116
APS Priorities
Year 2
APS Priorities (* those related to Cluster 1) Indicate Grade Span or other identifiers
Year 1
116
TOM TORLAKSON State Superintendent of Public Instruction
ISS for SWDs Activity
• All participants read the Oak Tree ISS Summary.
• As a table group, chart ISS priorities and those related to the EPC/APS Cluster 1.
Handout: ISS Summary
117
Facilitator Notes: Have participants compare the ISS Summary handout with the ISS tool from earlier in
the training. The summary compares the situation at the district against the ISS tool standards. Have participants record on chart paper:
• Observations about what is in place for SWDs compared to the standards for SWDs.
• Notes and suggestions for addressing areas of need in providing services and support for SWDs.
Highlight from the notes and suggestions, any that relate to Cluster 1 of the APS.
List in Year 1 any suggestions that require immediate attention; suggestions that require more time or pre-requisites in place should be entered in Year 2.
117

TOM TORLAKSON State Superintendent of Public Instruction
ISS Priorities
Year 2
118
ISS Priorities (* those related to APS Cluster 1) Indicate Grade Span or other identifiers
Year 1
118
TOM TORLAKSON State Superintendent of Public Instruction
ELSSA Activity • Read the ELSSA Summary for Oak
Tree Unified. • Note:
– areas in which ELs are performing well.
– area/s in which EL performance needs improvement.
Handout: ELSSA Summary 119
Facilitator Notes: These are basic questions that will be answered as participants work through the ELSSA. In which areas are ELs performing well?
In which area/s does EL performance need improvement?
• ELD progress • ELA performance • Math performance
119

TOM TORLAKSON State Superintendent of Public Instruction
Summary of Survey Results Excel Worksheet 4
• At each table, quickly review the summary of survey ratings for each of the 5 categories: 1. ELD 2. Access to Core and Opportunity to Learn
(ELA, Math, Interventions, Placement) 3. Professional Development 4. Assessment 5. Accountability
Handout: Oak Tree USD ELSSA 120
Facilitator notes: Using the Oak Tree Unified School District ELSSA or participants own data, have participants quickly view the comments and questions from “Discuss Data and Rate Items” and “Survey Results” sections of the completed ELSSA. Point out that the Survey results and the Summary are similar.
Using the Summary document for the ELSSA (handout from previous slide) and the completed ELSSA, group the findings into the five categories from the slide: ELD, Access to Core and Opportunity to Learn, Professional Development, Assessment, and Accountability.
Highlight the findings by relationship or connections to implementing Cluster 1 for ELs. Discuss the importance of the findings and their relationship to Cluster 1. This may require discussion about the local context of ELs and ELD implementation.
List findings as priorities by their relationship to full implementation of Cluster 1 EPCs.
120

TOM TORLAKSON State Superintendent of Public Instruction
ELSSA Priorities
Year 2
121
ELSSA Priorities (* those related to APS Cluster 1) Indicate Grade Span or other identifiers
Year 1
121
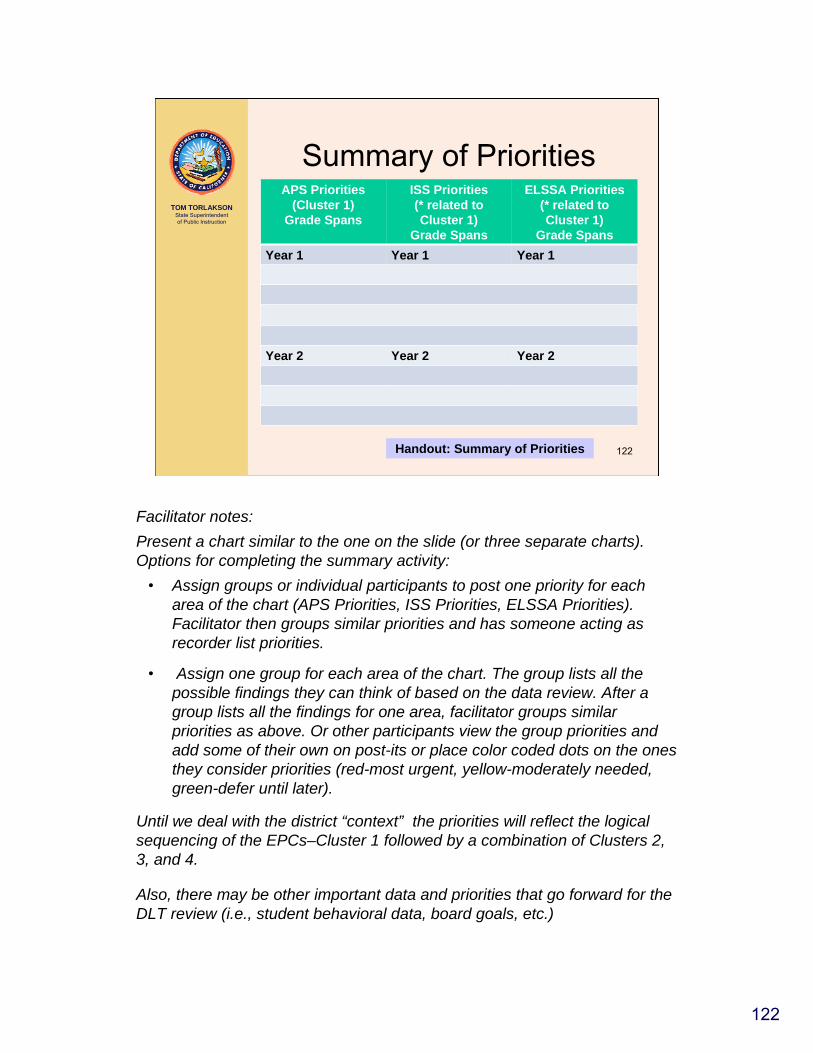
TOM TORLAKSON State Superintendent of Public Instruction
122
Summary of Priorities APS Priorities
(Cluster 1) Grade Spans
ISS Priorities (* related to Cluster 1)
Grade Spans
ELSSA Priorities (* related to Cluster 1)
Grade Spans Year 1 Year 1 Year 1
Year 2 Year 2 Year 2
Handout: Summary of Priorities
Facilitator notes: Present a chart similar to the one on the slide (or three separate charts). Options for completing the summary activity:
• Assign groups or individual participants to post one priority for each area of the chart (APS Priorities, ISS Priorities, ELSSA Priorities). Facilitator then groups similar priorities and has someone acting as recorder list priorities.
• Assign one group for each area of the chart. The group lists all the possible findings they can think of based on the data review. After a group lists all the findings for one area, facilitator groups similar priorities as above. Or other participants view the group priorities and add some of their own on post-its or place color coded dots on the ones they consider priorities (red-most urgent, yellow-moderately needed, green-defer until later).
Until we deal with the district “context” the priorities will reflect the logical sequencing of the EPCs–Cluster 1 followed by a combination of Clusters 2, 3, and 4.
Also, there may be other important data and priorities that go forward for the DLT review (i.e., student behavioral data, board goals, etc.)
122

Need Assessment Recommendations
TOM TORLAKSON State Superintendent of Public Instruction • List the areas/strategies and target
student populations that will be the focus for Oak Tree Unified’s LEA Plan.
• These findings become the recommendations the DLT will apply as they review the DAS to determine what activities the district will establish, implement, and support in its LEA Plan (Module III).
123
Facilitator Notes:
Process–Can be facilitated in larger DLT, but may need sub-committees if there are issues that must be addressed before agreement can be reached.
In an actual needs assessment, these priorities will be solidified over time as the different data sets are layered into the conversation.
Suggested recommendations for this scenario: • Full implementation of the adopted programs (focus: use of ancillary materials
and using the materials as per pacing). • Development of a consistent and coherent ELD program (focus: intermediate). • Development of a consistent and coherent intervention system. • Development of a curriculum embedded assessment system to be able to
inform classroom instruction.
123

A Closing Thought: TOM TORLAKSON
State Superintendent of Public Instruction The biggest room in
the world is the room for improvement.
Unknown
124
Note that the next step in developing an effective LEA Plan, including conducting the DAS, is thoroughly discussed in the third module of this series of trainings.
124