modulation of diffusion rate of therapeutic peptide … · modulation of diffusion rate of...
TRANSCRIPT

1
Modulation of diffusion rate of therapeutic peptide drugs using graphene
oxide membranes.
T. M. Puvirajesinghe1,2,3*
, Z.L. Zhi4, R. V. Craster
5, and S. Guenneau
3,6,7.
1CRCM, Inserm, U1068, Marseille, F-13009, France;
2Institut Paoli-Calmettes, Marseille, F-
13009, France; 3Aix-Marseille Université, F-13284, Marseille, France.
4Diabetes Research
Group, King’s College London Faculty of Life Sciences and Medicine, Guy’s Hospital, London,
United Kingdom; 5Department of Mathematics, Imperial College London, United Kingdom;
6Centrale Marseille, 38 Rue Frédéric Joliot Curie, F-13013 Marseille, France;
7Institut Fresnel,
CNRS, UMR 7249, Avenue Escadrille Normandie Niemen, F-13013, Marseille, France.
* Corresponding author.
KEYWORDS: graphene oxide; peptide drugs; mass diffusion; finite elements.
We investigate diffusion of a peptide drug through Graphene Oxide (GO) membranes that
are modeled as a porous layered laminate constructed from aligned flakes of GO. Our
experiments using a peptide drug show a tunable non-linear dependence of the peptide
concentration upon time. This is confirmed using numerical simulations with a diffusion
equation accounting for the photothermal degradation of fluorophores and an effective
percolation model. This modeling yields an interpretation of the control and delay of drug
diffusion through GO membranes. The ability to modulate the density of hydrogel-like GO
2
membranes to control drug release rates could be a step forwards in tailoring drug release
properties of the hydrogels for therapeutic applications.
Graphene, a single-atom thick free-standing layer of graphite, has been studied in various
physical and chemical contexts. It is a single-layer honeycomb lattice of carbon atoms consisting
of two interlocking triangular lattices, which has been extensively studied in various physical and
chemical contexts1,2
. The present work explores the diffusion-type features in graphene through
an effective medium approach. However, the electronic properties of graphene underpin the
physics at the nanoscopic scale and we find it worthwhile recalling related results to understand
the basis of our modelling approach of diffusion of a peptide drug through a GO membrane.
Well-known experiments on graphene include the demonstration that its electrical conductivity
as a function of charge density increases symmetrically on either side of a minimum value at the
neutrality point3. It is now believed that minimum conductivity might be an artifact of extrinsic
electrons and hole puddles for which similar theoretical conductivity estimates exist on the basis
of percolation and tunneling between adjacent puddles4. Other properties of graphene
underpinned by diffusion and percolation models include filtration applications of water
molecules5 at the nanometric scale within a GO flake. Inspired by all these works we investigate,
theoretically and experimentally, a path towards control and delay of drug release with hydrogel-
like GO membranes.
We have previously adapted the concept of transformation thermodynamics6, whereby the flux
of temperature is controlled via anisotropic heterogeneous diffusivity, for the diffusion and
transport of mass concentration. The n-dimensional, time-dependent, anisotropic heterogeneous
Fick's equation was considered6, which is a parabolic partial differential equation applicable to

3
heat diffusion, for instance, in fluids. Finite-element computations were initially used to model
liposome particles surrounded by a spherical multi-layered cloak consisting of layers of fluid
with an isotropic homogeneous diffusivity, deduced from an effective medium approach6. This
theoretical model has been experimentally validated for chemical engineering, whereby a steel
structure in a concrete foundation can be protected from seawater corrosion by surrounding the
structure with substances according to their anisotropic heterogeneous diffusivity7. Such an
effect of invisibility in chemical engineering was inspired by earlier works in optics and
acoustics8-12
. Other applications include invisibility cloaks controlling light diffusion in water-
based media13
. We now investigate how the concept of anisotropic homogenous diffusion can be
applied to tune drug delivery. Peptide and protein drugs have serum half-lives of minutes to
hours, however conjugation to polymers in hydrogels results in the retardation of kidney
filtration and a corresponding increase in plasma half-life of the therapeutic drug14
. Clinical
advantages include fewer injections for patients and reduced side effects for the health of
patients. Based on the homogenization model applied in Guenneau and Puvirajesinghe, 20136,
GO was selected because of its low permeability15
. GO has already been described to be a
molecular sieve as the GO laminates only allow the permeation of ions of a certain hydrated
radius5,16
. GO has been used in combination with other composite materials to control drug
release within hydrogels17-19
. This study demonstrates similarities with GO membranes and clay
and clay-based materials. Indeed this explains the combination of the two materials for the
fabrication of clay-graphene composites20-22
. To model GO hydrogel-like membranes, we
employ a porous layered laminate to describe the percolation of an aqueous medium in these
structures23,24
. In combination with numerical stimulations, the concentration of GO in hydrogels
can be used as a parameter to vary the rate of diffusion of a therapeutic peptide drug in order to

4
achieve tunable drug release. Using these principles, one can fine-tune the drug release
properties of GO hydrogels by calculating the overall GO composition.
Results
GO membranes and measurement of the diffusion rate of a fluorescence anticancer lytic
peptide
GO has already been employed in hydrogels and provides advantages such as water solubility,
high specific surface area and good biocompatibility. The anti-cancer agent used in this study is a
previously characterized cationic lytic peptide, whose mechanism of action was based on
disintegrating the cell membrane, leading to cell death. Incubation of MDA-MB-231 (human
breast basal epithelial cancer cells) with different concentrations of the peptide has been reported
to show a dose-dependent reduction in cell proliferation25
. The peptide drug was chemically
synthesized with the addition of a fluorescein isothiocyanate (FITC) fluorophore at the N-
terminal of the peptide. This enabled the monitoring of the presence of the peptide using green
fluorescence. The concentration of the peptide was proportional to the fluorescence intensity and
calibration curves can be derived to measure peptide drug concentration (Supplementary Fig.
S1).
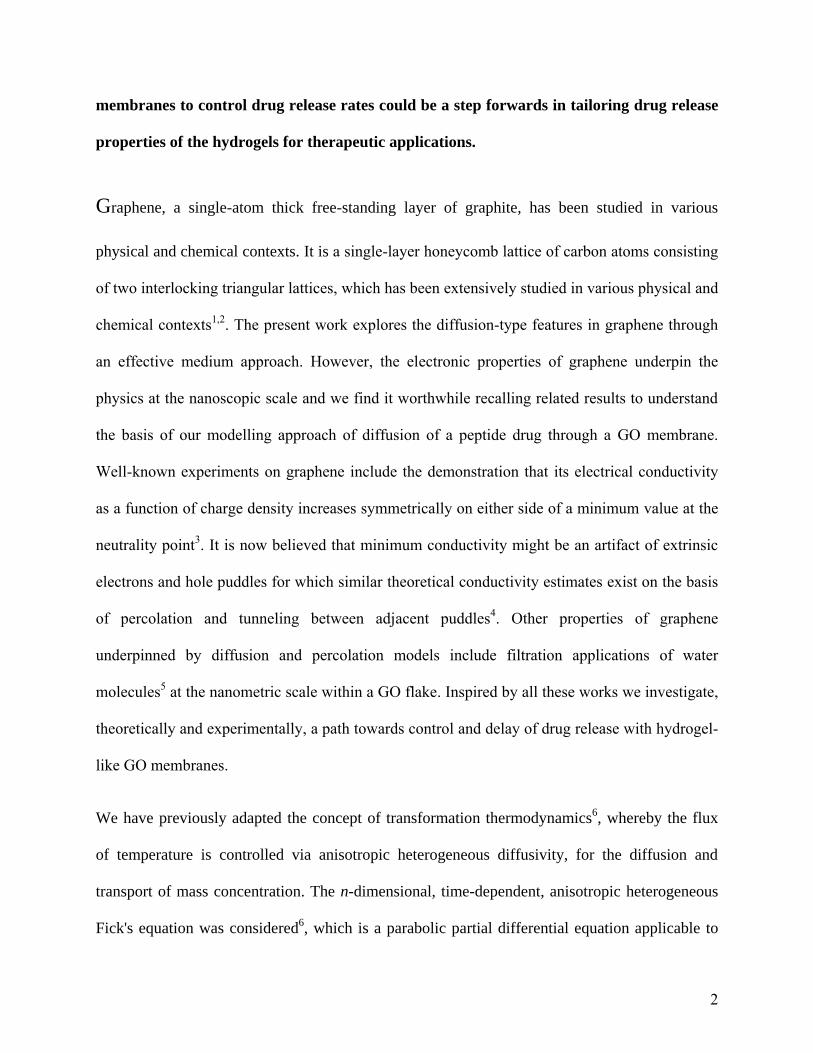
In order to study the diffusion rate of the fluorescently labelled drug, we used cell culture
membrane inserts made of polyethylene membrane with a porosity of 0.4 microns. The GO was
deposited onto the membrane itself (Fig. 1a) and dried by exposure to high heat. A fluorescent
plate reader was used to monitor the rate of drug diffusion by measuring the accumulated
fluorescence signal from the lower chamber (Fig. 1b, c and d). Automatic readings were taken

5
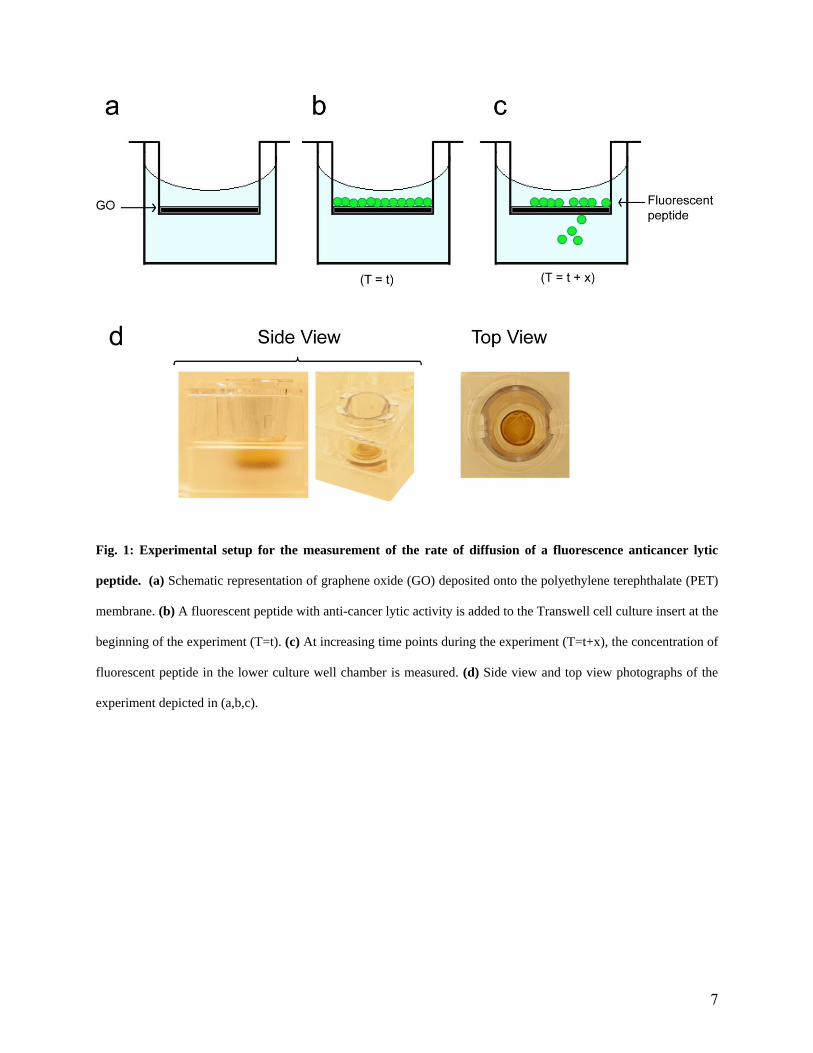
from the bottom of the plate at regular intervals of 3 min for 12 h 45 min (Fig. 2). In the absence
of the GO membrane, the time taken for half the maximum amount of peptide to pass through the
membrane was 18 min. Increasing the GO membrane density retards, and eventually halts, the
rate of transport (see Supplementary Fig. S2). In comparison to no GO membrane the density
increases to 0.06, 0.09 and 0.17 ng/mm3 retard the peptide drug by 4, 6, 7 fold and completely,
respectively.
Curves depicting the diffusion of the drug (Fig. 2) showed that the magnitude of GO density
affected the rate of drug transport. Depositing increasing densities of GO lead to a gradual
decrease in the time taken for the drug to reach half of its maximal intensity (t1/2). Therefore the
density of GO determines the rate of retardation of drug transport.
In order to interpret this phenomenon, the membrane compactness of GO was characterized
using transmission electron microscopy (TEM). Based on the fact that GO consists of a high
proportion of carbon atoms, for which the low atomic number reduces scattering of the electron
beam, a good contrast and a sharp image was acquired in TEM experiments without the need of
the addition of a contrast agent. Low GO densities show isolation of GO structures (Fig. 3a).
When the density of the GO membrane increased, TEM images showed that the heterogeneous
GO have the tendency to aggregate, causing overlap of GO structures (Fig. 3b). However upon
reaching a certain concentration of GO, complete overlap was evident, which leads to
superimposition of particulates, as evidenced by an overall dark grey image, shown in (Fig. 3c).
Therefore in conclusion, there is strong evidence to validate our proposal of the application of
GO for the tunable delivery of therapeutic drugs. Next, we compare the acquired experimental
results with effective mathematical models, which showed a close match between the numerical
data and the experimental data (Supplementary Fig. S3).

6
For the numerical and analytical simulations, we recall that the assembly of aligned GO flakes
resembles a porous layered laminate. It has been previously shown that a homogenization
approach of Fick’s equation can be used to control processes of mass diffusion for biological and
engineering applications6. We use the same equation to retrieve in (Fig. 4) the main features of
the experiments reported in (Fig. 2). However, one notes that there is a decrease in the
concentration after a certain time in (Fig. 2), whereas (Fig. 4c) only displays a plateau. We
explain how this can be corrected by considering certain activation terms in the diffusion
equation so as to account for photothermal degradation of fluorophores, described in the later
section on methods.
7
Fig. 1: Experimental setup for the measurement of the rate of diffusion of a fluorescence anticancer lytic
peptide. (a) Schematic representation of graphene oxide (GO) deposited onto the polyethylene terephthalate (PET)
membrane. (b) A fluorescent peptide with anti-cancer lytic activity is added to the Transwell cell culture insert at the
beginning of the experiment (T=t). (c) At increasing time points during the experiment (T=t+x), the concentration of
fluorescent peptide in the lower culture well chamber is measured. (d) Side view and top view photographs of the
experiment depicted in (a,b,c).
8
Fig. 2: Varying the density of the GO membranes controls the rate of diffusion of an anticancer lytic peptide.
GO dispersion in water is prepared at different densities and dried onto translucent cell culture inserts made from
PET membrane, with a porosity of 0.4 microns. The concentration of the fluorescent peptide in the lower culture
well chamber is measured and plotted against time. Each reading is representative of an average measurement of 24
readings taken from the circumference of each well of the culture dish. Readings are taken every 3 min during a
period of 12 h 45 min.

9
Fig. 3: TEM images showing GO of varying densities. Images are acquired using a Morgagni FEI 80KV Camera
digital View III Olympus camera. For clarity the prominent sheets are outlined with dashed lines. (a) An image of
one sheet, note that the contrast is very similar to that of the background surface. (b) Several sheets, each sheet is
again outlined and the contrast is increased when additional sheets are superimposed. (c) Multiple sheets showing a
sharp increase in the contrast when many GO flakes are stacked together, thereby substantially increasing the gray
scale of the images. Scale bar (500 nm).

10
Fig. 4: Finite element simulations for effective diffusion rate. (a) A long water-filled rectangular domain with no
flux boundary conditions on the left, right and bottom sides; an imposed concentration on the top and GO flakes
overlying a porous (PET) membrane. (b,d) Concentration of the peptide at time steps t=1min and t= 200 min. (c,e)
Concentration of the peptide for low and high density of GO flakes. (f) Geometry of PET overlaid with a high
density of GO. (g) Variation of the concentration of the peptide with time for low, intermediate and high densities of
GO flakes. Normalization was used in order to compare similar initial peptide concentrations.

11
Discussions
Our numerical simulations carried out with the commercial finite element software COMSOL
Multiphysics (Fig. 4) clearly reproduce most of the features of the experimental data (Fig. 2).
However, after a period of time, the concentration decreases in Fig. 2, unlike the monotonically
increasing solution to the diffusion equation in Fig. 4. The experimental data fits the modeling
data if one adds a term to the diffusion equation in order to account for photobleaching, see
Supplementary Fig. S3. We note that other work on filtration applications of water molecules5
at the nanometric scale within a GO flake was underpinned by van der Waals interaction26,27
which played a prominent role at the nanometric scale, but this is not the case in the present
work.
Methods
Peptide synthesis and diffusion experiments
Peptides were synthesized by GenScript, based on the previously published peptide sequences25
,
with conjugation of FITC fluorophore to the N-terminal of the peptide. A fluorescence plate
reader (FLUOstar Optima, BMG Labtech) is used to carry out drug diffusion assays, using
excitation filter of 485 nm and an emission filter of 538 nm. The density of graphene oxide is
measured by the quantity of GO (ng) deposited onto a total area (mm) of a 24-well culture plate
Transwell PET membrane insert and then represented as ng/mm3.
Transmission electron microscopy

12
GO dispersion in water, 4 mg/mL (Sigma-Aldrich) is diluted 100 times with water. 2 µL of the
diluted solution is deposited onto an electron microscopy grid. After 20 seconds, the drop is
removed with a small fragment of filter paper. A 200 kV with a Tecnai G2 (FEI, Netherlands)
and Velata camera (Olympus, Japan) is used for image acquisition.
Effective model and numerical simulations
We apply an effective model for porous media to obtain the results in Fig. 3. The effective and
“free” diffusivities are usually related28
[according to the equation Deff = De /t where ε is the
porosity of the structure and τ the tortuosity, which is a measure of the actual length per unit
effective length a molecule has to diffuse in a porous structure. To calculate the porosity of the
modeled structure we consider the ratio of the perforations to the total computational area, the
concentration then obeys Fick’s equation29
.
e
¶tc-Ñ.(DeffÑc) = 0
(1)
Tortuosity is usually expressed as a power of the porosity30,31
therefore the effective diffusivity
varies as Deff = De p
.
We note that applying Fick’s equation simply leads to an increase in concentration reaching a
plateau (steady state) at long times, which does not explain the relative decrease in concentration
observed in Fig. 1d.
The physical system suffers degradation due to photobleaching. We build in this decay through
an additional term 0<aeff<<1 where aeff
is the rate of photobleaching32-34
13
¶tc-Ñ.(DeffÑc)+aeff c= 0 (2)
We verified that the concentration versus time then follows the same trend as in Fig. 2, see
Supplementary Fig. S3.
AUTHOR INFORMATION
Corresponding Author: Tania M. Puvirajesinghe: [email protected].
Competing financial interests
The authors declare no competing financial interests.
Author Contributions
T.M.P, Z.L. designed and carried out experiments. R.V.C. and S.G. were responsible for
carrying out physical and mathematical approaches and S.G performed COMSOL simulations.
All authors have contributed to the writing of this manuscript and given approval to the final
version of the manuscript.
ACKNOWLEDGMENTS
The electron microscopy experiments were performed on PiCSL-FBI core facility (IBDM UMR
CNRS 7288, Aix-Marseille University), member of the France-BioImaging national research
infrastructure. Electron Microscopy analysis was carried out by Fabrice Richard and Jean-Paul
Chauvin, with assistance from Aicha Aouane in the Electron Microscopy Platform, IBDML -
Institut de Biologie du Développement de Marseille Luminy

14
UMR 7288, Marseille. Authors would like to thank Samuel Granjeaud for critical comments of
the work. The authors wish to acknowledge Vincent Pagneux for useful comments on the
diffusion equation to model some degradation effects probably due to photobleaching. This work
has been carried out thanks to A*MIDEX project (no ANR-11-IDEX-0001-02) funded by the
Investissements d’Avenir French Government program, managed by the French National
Research Agency (ANR) with Aix Marseille Université (TMP, A_M-AAP-ID-14-15-140314-
09.45-GUENNEAU-PUVIRAJESINGHE-HLS_SAT).
ABBREVIATIONS
GO: graphene oxide; TEM: Transmission Electron Microscopy; PET: polyethylene terephthalate.
REFERENCES
1 Geim, A. K. Graphene: status and prospects. Science 324, 1530-1534, (2009).
2 Wolf, E. L. A new paradigm in condensed matter and device physics. (Oxford University
Press, 2014).
3 Novoselov, K. S. et al. Electric field effect in atomically thin carbon films. Science 306,
666-669, (2004).
4 Ponomarenko, L. A. et al. Tunable metal–insulator transition in double-layer graphene
heterostructures. Nature Physics Letters 7, 958-961, (2011).
5 Nair, R. R., Wu, H. A., Jayaram, P. N., Grigorieva, I. V. & Geim, A. K. Unimpeded
permeation of water through helium-leak-tight graphene-based membranes. Science 335,
442-444, (2012).
6 Guenneau, S. & Puvirajesinghe, T. M. Fick's second law transformed: one path to
cloaking in mass diffusion. J R Soc Interface 10, 20130106, (2013).
7 Zeng, L. & Song, R. Controlling chloride ions diffusion in concrete. Sci Rep 3, 3359,
(2013).
8 Pendry, J. B., Schurig, D. & Smith, D. R. Controlling electromagnetic fields. Science
312, 1780-1782, (2006).
9 Leonhardt, U. Optical conformal mapping. Science 312, 1777-1780, (2006).
10 Greenleaf, A., Kurylev, Y., Lassas, M. & Uhlmann, G. Isotropic transformation optics:
approximate acoustic and quantum cloaking. New J. Physics 10, 115024 (2008).
11 Kohn, R. V., Shen, H., Vogelius, M. S. & Weinstein, M. I. Cloaking via change of
variables in electric impedance tomography. Inverse Problems 24, 015016, (2008).
15
12 Xu, J. et al. Molding acoustic, electromagnetic and water waves with a single cloak. Sci
Rep 5, 10678, (2015).
13 Schittny, R., Kadic, M., Buckmann, T. & Wegener, M. Metamaterials. Invisibility
cloaking in a diffusive light scattering medium. Science 345, 427-429, (2014).
14 Ashley, G. W., Henise, J., Reid, R. & Santi, D. V. Hydrogel drug delivery system with
predictable and tunable drug release and degradation rates. Proc Natl Acad Sci U S A
110, 2318-2323, (2013).
15 Ruzicka, B. A. et al. Hot carrier diffusion in graphene. Phys. Rev. B 82, 195414, (2010).
16 Joshi, R. K. et al. Precise and ultrafast molecular sieving through graphene oxide
membranes. Science 343, 752-754, (2014).
17 Wang, J., Liu, C., Shuai, Y., Cui, X. & Nie, L. Controlled release of anticancer drug
using graphene oxide as a drug-binding effector in konjac glucomannan/sodium alginate
hydrogels. Colloids Surf B Biointerfaces 113, 223-229, (2014).
18 Hu, X. et al. Preparation of Biocompatible Graphene Oxide Composite Hydrogel to
Deliver Ophthalmic Drugs. Journal of Macromolecular Science, Part A: Pure and
Applied Chemistry 50, 1201-1208, (2013).
19 Wu, J. et al. Hierarchical construction of a mechanically stable peptide-graphene oxide
hybrid hydrogel for drug delivery and pulsatile triggered release in vivo. Nanoscale 7,
1655-1660, (2015).
20 Nethravathi, C., Viswanath, B., Shivakumara, C., Mahadevaiah, N. & Rajamathi, M. The
production of smectite clay/graphene composites through delamination and co-stacking.
Carbon 46, 1773–1781, (2008).
21 Zhang, R. et al. Thermally reduced kaolin-graphene oxide nanocomposites for gas
sensing. Sci Rep 5, 7676, (2015).
22 Nethravathi, C., Rajamathi, J. T., Ravishankar, N., Shivakumara, C. & Rajamathi, M.
Graphite oxide-intercalated anionic clay and its decomposition to graphene-inorganic
material nanocomposites. Langmuir 24, 8240–8244 (2008).
23 Yuan, P. et al. Synthesis and characterization of delaminated iron-pillared clay with
meso-microporous structure. Microporous and Mesoporous Materials 88, 8-15, (2006).
24 Okamoto, M. et al. A House of Cards Structure in Polypropylene/Clay Nanocomposites
under Elongational Flow. Nano Letters 1, 295–298, (2001).
25 Kawamoto, M., Horibe, T., Kohno, M. & Kawakami, K. HER2-targeted hybrid peptide
that blocks HER2 tyrosine kinase disintegrates cancer cell membrane and inhibits tumor
growth in vivo. Mol Cancer Ther 12, 384-393, (2013).
26 Washburn, E. W. The Dynamics of Capillary Flow. Physical Review 17 273, (1921).
27 Lucas, R. Ueber das Zeitgesetz des Kapillaren Aufstiegs von Flussigkeiten. Kolloid Z 23,
(1918).
28 Welty, J., Wicks, C. E., Rorrer, G. L. & Wilson, R. E. Fundamentals of Momentum, Heat
and Mass Transfer, 5th Edition. (John Wiley and Sons Ltd, 2008).
29 Sahimi, M. Applications of percolation theory. (CRC Press, 1994).
30 Pisani, L. Simple Expression for the Tortuosity of Porous Media. Transport in Porous
Media. 88, 193-203, (2011).
31 Zalc, J. M., Reyes, S. C. & Iglesia, E. The effects of diffusion mechanism and void
structure on transport rates and tortuosity factors in complex porous structures. Chemical
Engineering Science 59, 2947-2960, (2004).

16
32 Vicente, N. B., Zamboni, J. E. D., Adur, J., Paravani, E., V. & Casco, V. H. in 16th
Argentine Bioengineering Congress and the 5th Conference of Clinical Engineering. (ed
Journal of physics.) (IOP Publishing).
33 Benson, D. M., Bryan, J., Plant, A. L., Gotto, A. M., Jr. & Smith, L. C. Digital imaging
fluorescence microscopy: spatial heterogeneity of photobleaching rate constants in
individual cells. J Cell Biol 100, 1309-1323, (1985).
34 Song, L., Hennink, E. J., Young, I. T. & Tanke, H. J. Photobleaching kinetics of
fluorescein in quantitative fluorescence microscopy. Biophys J 68, 2588-2600, (1995).