modernizing iso, en and astm air leakage standards
TRANSCRIPT
Page 1 of 12
MODERNIZING ISO, EN AND ASTM AIR LEAKAGE STANDARDS … more accuracy in less time rev-2011-09-26
Colin Genge
Retrotec Inc. 1060 East Pole Rd.
Everson, WA 98247 USA
ABSTRACT
A building was tested the equivalent of over 1,000,000 times under windy conditions where each test satisfied the
conditions of ASTM, CGSB, ISO, EN, ATTMA and USACE testing standards in every respect. The air flow
measurements made at lower reference pressures, such as 4 and 10 Pa, varied over a wide range of +87% to -45%
from the average, while the results at 50 Pa varied 15% from the average. The basis for a mathematical model
was created to evaluate the error potential of existing standards and to advance new test procedures that would
achieve the desired level of accuracy for results referenced to any pressures from 4 to 75 Pa, in the least amount of
testing time over the widest possible range of test conditions.
Variations in flow measurements at 4 Pa were reduced to 7%, while at 75 Pa they were reduced to 5.7%. The
95% confidence interval calculation was checked against several batches of tests but the actual confidence interval
was no better than a 60%. The new mathematical model could be used to accurately predict the potential variation
for any result.
KEYWORDS
Air leakage measurement, baseline, USACE, Induced Variation, baseline variation, confidence interval SUMMARY The data in Table 1 shows the variation in results that occurred when repeated tests were done on the same
building: according to existing standards, and using the test procedure proposed in this paper.
Table 1. Tests were performed in compliance with the standards shown.
INTRODUCTION The existing paradigm for air leakage measurement in buildings has remained relatively unchanged for 25 years
but during that time, modern electronics has allowed the operator to effortlessly collect thousands of readings in
an unbiased fashion. Since 1985, gauge accuracy has improved at least 8 times and test fan accuracy has
increased threefold but existing standards take no consideration of that improvement. Standards designed to test
residential houses are now being ineffectively applied to large buildings, where stack and wind pressures can be 5
to 10 times greater than testing houses, making those standards obsolete in some geographic areas (over 75% of
the time). Clearly, large building specific testing standards must be developed to be robust in most weather
conditions. House testing standards will benefit from a fresh look at their procedures as well.
Test in strong wind Existing standards Proposed
1 direction
Proposed
2 directions
ASTM CGSB ISO, EN
&
ATTMA
USACE 1-1d 2-1d 1-2d 2-2d
Total test-fan time, seconds 60 90 100 320 300 300 240 240
Results at 4 Pa +78%
-42%
+87%
-45%
+15-
13%
±7%
Results at 10 Pa 43% +12-
11%
±6%
Results at 50 Pa 14% 15% 15% 6.5% 6.5% ±6% ±6%
Results at 75Pa 9.3% 6.1% ±5.7%

Page 2 of 12
All of today's air leakage testing standards evolved from the CGSB and ASTM standards dating back to the early
1980s. Many standards still require gauge accuracies to be within 2 Pa, however wind fluctuations could add
another 2 Pa of uncertainty. With a desire to get results at low reference pressures, such as 10 and 4 Pa, and it
becomes clear that large uncertainties can exist. Currently committees are revising ISO and ASTM standards in
efforts to standardize not only the test methods but also the test results themselves.
Air leakage test results are typically referenced to pressures such as 75, 50, 10 and even 4 Pa. Data is taken over a
range of test-fan induced pressures, and a curve fit provides information on the building‟s air leakage at any
specific reference pressure. Since baseline pressures of 1 Pa or more are virtually always present, results that are
referenced to low pressures such as 4 Pa are affected to a relatively large degree. When baseline pressures increase
to 3, 5 and even 10 Pa, obtaining stable results at 4 Pa becomes impossible. This effect has never been quantified,
either theoretically or experimentally for results at low reference pressures. Essentially, a strategy is required to
determine a stable result at 4 Pa where the baseline pressure represents a significant percentage of the reference
pressure.
METHODOLOGY The same building was tested the equivalent of over 1,000,000 times under windy conditions where each test
satisfied the conditions of ASTM, CGSB, ISO, EN, ATTMA and USACE testing standards in every respect. A
calibrated three phase 2 HP test fan, driven by a variable frequency drive for stability, was used for this project.
The pressure pickups were set up in two different locations: a dual pickup with one open tube (with a rain cover)
on the same balcony as the fan (west side), and a second open tube (with cover) in the top end of the south east
door; a single pickup at the bottom end of the east sliding door (we expected this pickup to display approximately
-1 Pa of stack pressure due to the temperature difference between inside and outside of ~8C).
Figure 1. Test schematic. The yellow circle and red rectangle represent the Door Fan location; green stars represent the dual
pressure pickup locations, and the orange star represents the single pressure pickup location.
Figure 2. Test Building: the fan setup is visible in the balcony door of unit 611/610 (above).
The test fan was always on the Leeward side of the building.
Tests were completed using Retrotec‟s FanTestic software, allowing for a variety of testing configurations.
Options to change the testing configuration included: number of baseline pressure points, number of test fan
induced pressure points, range of test pressures, and number of readings within each baseline/induced test
pressure point (based on time for collection). Several combinations of these configurations were used. In the final
round of testing, data was collected continuously for 600 seconds at each point and broken up into a series of
individual tests for analysis later.
Data was analyzed in Excel; of specific importance were ranges of maximum and minimum baseline pressure
values, over several averaged “bins”. A collection or “bin” of data readings is called a “point”. Assuming that
FanTestic was set to deliver one reading per second, the bins were averaged over 5, 10, 15, 20, 30, 40, 60, 120 and
Page 3 of 12
240 seconds for both the induced building test pressures and the baseline pressures. Each raw induced building
test pressure reading was adjusted to account for the overall average baseline pressure taken during the test. The
maximum pressure variation was then determined from the overall average baseline for each binned dataset; this
was used to create the four points of a trapezoid, in which all data should fall. This model is discussed further.
Understanding the effect of wind It became clear after analyzing all the above variables that the mechanics of the equipment could be easily
quantified and understood, but that wind was the true chaos generator and its effect had to be well documented
before progress could be made. For example, many of the standards require a baseline pressure to be taken,
usually for about 10 seconds. Figure 3 shows a continuous stream of baseline pressures that were taken for 10
seconds each. Depending on when the pressure was observed, the value read could have been somewhere between
-0.3 to -5.5 Pa. Each one of these values would have appeared legitimate to the operator but would have meant
very different corrections applied to the induced building pressures. For example, if the operator unwittingly
measured the baseline as being -1 Pa, it is extremely likely that by the time the test fan was turned on to create an
induced envelope pressure, this baseline could easily have shifted to -5 Pa. This would mean that the operator was
actually testing at 6 Pa when the operator mistakenly thought that the real corrected test pressure was 10 Pa.
Data set 918, of baseline averages shown on the next few figures, were done under especially windy conditions
and without the benefit of shielding and wind averaging, in order to amplify the effects. A robust methodology
should be developed to handle these highly fluctuating baseline pressures; In addition, the existing standards only
refer to average baseline pressures and say nothing about fluctuations. They require the magnitude of the average
to fall within certain limits but we discovered in the course of the study that the magnitude of the baseline has had
little to do with the variation of results from test to test. The truly important factor is, “what is the range of
fluctuation that could occur when induced envelope pressures are being measured?” It is possible to have a
baseline average of zero but the fluctuations could have swung 10 Pa in both directions, making induced pressure
readings dependent upon which way the baseline pressure had swung at a particular instance in time. In the past, it
has always been assumed that taking more test points than the minimum 5 or 7 would somehow handle these wind
fluctuations. What we have experienced over the past 30 years in analyzing this type of data is that only one of the
test points, taken during the fluctuations, can wildly affect the results. Often it was blamed on the lowest test point
but in fact none of the test points were safe from the effect of these fluctuations since there was no telling when
they would occur. It was clear that intermediate points in the typical curve fit only acted as pivot points and did
not constrain the data from the effects of fluctuations at the lowest test points. What did have an effect, was taking
sufficient readings at the lowest test point so the effect of the fluctuations was reduced to insignificance. In order
to understand how long this lower test point must be taken, a clear picture must be obtained by carefully
examining the fluctuations that were occurring over the baseline pressure measurement period.
It turned out that these fluctuations were the dominant effect that dictated how accurate and/or repeatable a
particular test was. Fluctuations in baseline pressure test points were used to predict the variation that was likely
to be occurring while test fan readings were taken.
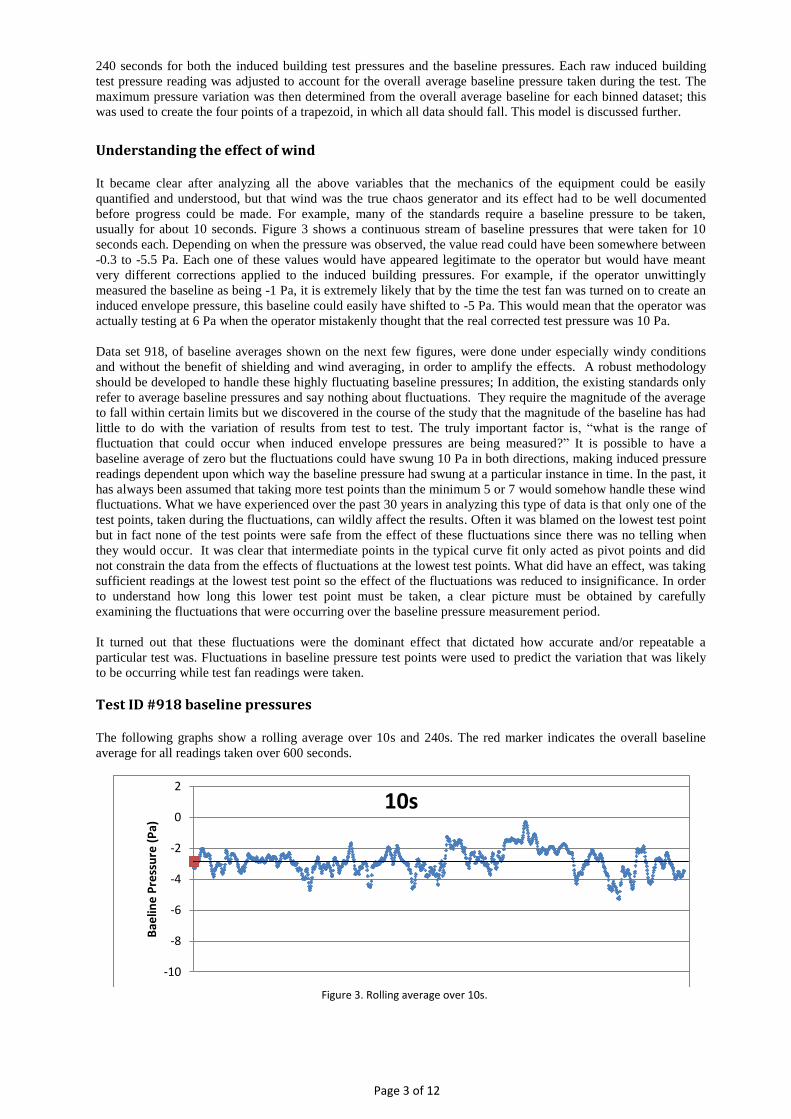
Test ID #918 baseline pressures The following graphs show a rolling average over 10s and 240s. The red marker indicates the overall baseline
average for all readings taken over 600 seconds.
Figure 3. Rolling average over 10s.
-10
-8
-6
-4
-2
0
2
Bae
line
Pre
ssu
re (
Pa)
10s

Page 4 of 12
Figure 4. Rolling average over 240s.
THE MODEL How the model works A mathematical model was developed in an attempt to predict the effect of wind, how to eliminate it and how
other factors influence accuracy and repeatability. The model‟s real value comes from having a tool that will look
at a wide range of data collection possibilities in order to determine the most effective model. First, the model
was checked against real data and then by making some realistic assumptions, an evaluation of existing
standardized test methods was performed. This would be the mathematical equivalent of performing millions of
tests on the same building under different test conditions. Next, all the Factors affecting accuracy were adjusted to
optimize the accuracy of air leakage tests at different reference pressures.
Figure 5 illustrates the mathematical model, based on a trapezoidal shape. The lowest test point is used to create
the base of a trapezoid which is centered on a control value, considered to be the true result. The width of the
trapezoid‟s base is defined on one side by the sum of the squares of the baseline variation plus the gauge error
around zero, plus the sum of the squares of the induced variation plus the gauge error in the range of induced
pressure. This results in a pressure that is added on both sides of the centered control value. Perpendicular wings
are added to the space in the direction of the y-axis and are defined by the test fan flow error at that test pressure.
This process is repeated for the top of the trapezoid.
Figure 5. Trapezoid model used to verify assumptions.
The model uses the variables listed below to calculate the maximum range of errors for a variety of reference
pressures. The model is validated by plotting actual test data against the model's predicted space in which test data
should fall (within the trapezoid). In the Figure 6, the rolling average of the data was created based on 600
seconds of streaming data that would emulate a series of approximately 600 test points. In other words, for 5
second averaging, data was converted into a series of test points that contained all the data taken during a 5 second
interval. Since a rolling average was used, a continuous stream of 5 second test points, updated every second, was
created that would have a similar effect to having taken the point 595 times.
-10
-8
-6
-4
-2
0
2
Bas
elin
e P
ress
ure
(P
a)
240s
Page 5 of 12
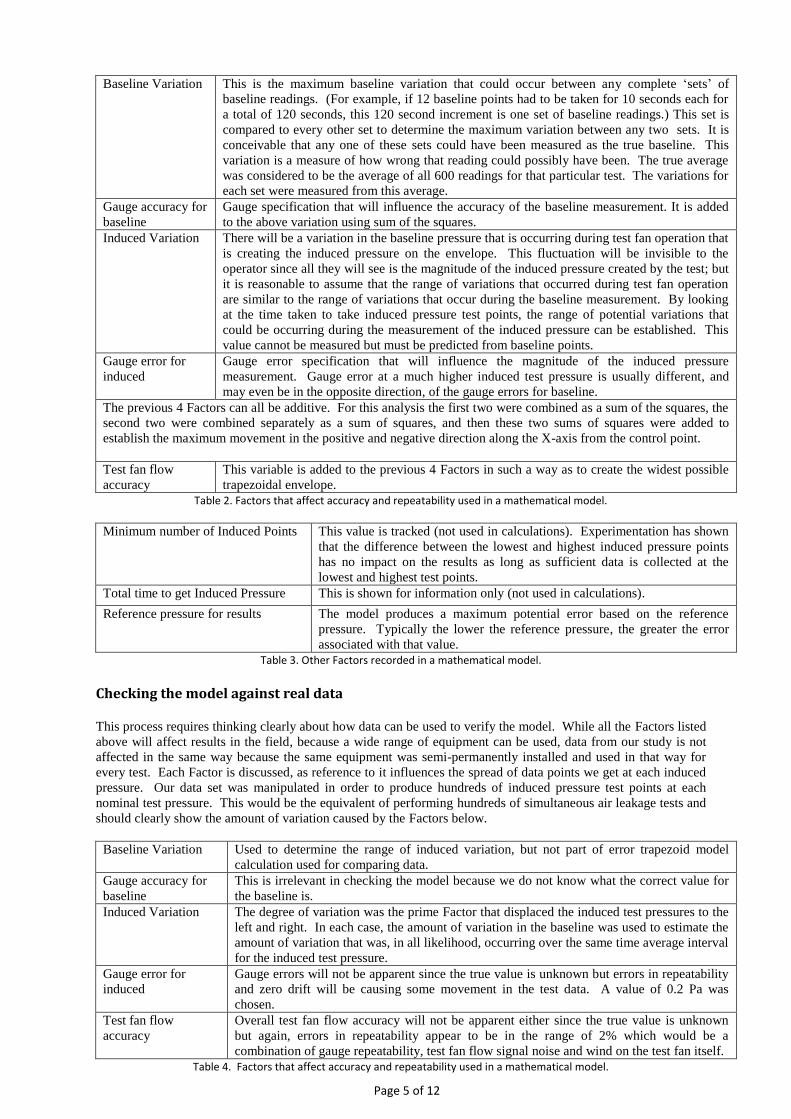
Baseline Variation This is the maximum baseline variation that could occur between any complete „sets‟ of
baseline readings. (For example, if 12 baseline points had to be taken for 10 seconds each for
a total of 120 seconds, this 120 second increment is one set of baseline readings.) This set is
compared to every other set to determine the maximum variation between any two sets. It is
conceivable that any one of these sets could have been measured as the true baseline. This
variation is a measure of how wrong that reading could possibly have been. The true average
was considered to be the average of all 600 readings for that particular test. The variations for
each set were measured from this average.
Gauge accuracy for
baseline
Gauge specification that will influence the accuracy of the baseline measurement. It is added
to the above variation using sum of the squares.
Induced Variation There will be a variation in the baseline pressure that is occurring during test fan operation that
is creating the induced pressure on the envelope. This fluctuation will be invisible to the
operator since all they will see is the magnitude of the induced pressure created by the test; but
it is reasonable to assume that the range of variations that occurred during test fan operation
are similar to the range of variations that occur during the baseline measurement. By looking
at the time taken to take induced pressure test points, the range of potential variations that
could be occurring during the measurement of the induced pressure can be established. This
value cannot be measured but must be predicted from baseline points.
Gauge error for
induced
Gauge error specification that will influence the magnitude of the induced pressure
measurement. Gauge error at a much higher induced test pressure is usually different, and
may even be in the opposite direction, of the gauge errors for baseline.
The previous 4 Factors can all be additive. For this analysis the first two were combined as a sum of the squares, the
second two were combined separately as a sum of squares, and then these two sums of squares were added to
establish the maximum movement in the positive and negative direction along the X-axis from the control point.
Test fan flow
accuracy
This variable is added to the previous 4 Factors in such a way as to create the widest possible
trapezoidal envelope.
Table 2. Factors that affect accuracy and repeatability used in a mathematical model.
Minimum number of Induced Points This value is tracked (not used in calculations). Experimentation has shown
that the difference between the lowest and highest induced pressure points
has no impact on the results as long as sufficient data is collected at the
lowest and highest test points.
Total time to get Induced Pressure This is shown for information only (not used in calculations).
Reference pressure for results The model produces a maximum potential error based on the reference
pressure. Typically the lower the reference pressure, the greater the error
associated with that value.
Table 3. Other Factors recorded in a mathematical model.
Checking the model against real data This process requires thinking clearly about how data can be used to verify the model. While all the Factors listed
above will affect results in the field, because a wide range of equipment can be used, data from our study is not
affected in the same way because the same equipment was semi-permanently installed and used in that way for
every test. Each Factor is discussed, as reference to it influences the spread of data points we get at each induced
pressure. Our data set was manipulated in order to produce hundreds of induced pressure test points at each
nominal test pressure. This would be the equivalent of performing hundreds of simultaneous air leakage tests and
should clearly show the amount of variation caused by the Factors below.
Baseline Variation Used to determine the range of induced variation, but not part of error trapezoid model
calculation used for comparing data.
Gauge accuracy for
baseline
This is irrelevant in checking the model because we do not know what the correct value for
the baseline is.
Induced Variation The degree of variation was the prime Factor that displaced the induced test pressures to the
left and right. In each case, the amount of variation in the baseline was used to estimate the
amount of variation that was, in all likelihood, occurring over the same time average interval
for the induced test pressure.
Gauge error for
induced
Gauge errors will not be apparent since the true value is unknown but errors in repeatability
and zero drift will be causing some movement in the test data. A value of 0.2 Pa was
chosen.
Test fan flow
accuracy
Overall test fan flow accuracy will not be apparent either since the true value is unknown
but again, errors in repeatability appear to be in the range of 2% which would be a
combination of gauge repeatability, test fan flow signal noise and wind on the test fan itself.
Table 4. Factors that affect accuracy and repeatability used in a mathematical model.

Page 6 of 12
The following graphs in Figure 6 to 8 show the true or control value using a dashed line. The sides of the
trapezoid are defined by straight lines which are affected by the factors described above, and determine the width
of the trapezoid‟s base and top. As the amount averaging period for baseline pressure readings increases, the
variation in the dataset decreases. Various standards require different minimum time intervals and will produce
similarly different results if the test is repeated hundreds of times. While these graphs do a good job of showing
how well the model performs, they do not represent the full extent of results variation that would be expected
when the effect of the major Factors are added on to the variations displayed.
Figure 6. Test ID 918. 595 test points plotted at 15 and 60Pa where each point consists of an induced pressure and the flow
required to induce that pressure, averaged over 5s. Note how the trapezoid contains this data fairly well.
Figure 7. Test ID 918. 480 test points plotted similarly but averaged over 120s. Note how the trapezoid contracts with the data because the variation in baseline is reduced because of the longer time interval.
Figure 8. Test ID 801. 110 test points for a third data set at each of 12 different induced pressures, from 15 to 70Pa over 10s for each point. Data for each induced pressure was taken for 120 seconds but plotted as 110 ten second chunks.
500
5,000
1 10 100 Flo
w (
CFM
)
Pressure (Pa)
500
5,000
1 10 100 Flo
w (
CFM
)
Pressure (Pa)
500
5,000
1 10 100 Flo
w (
CFM
)
Pressure (Pa)

Page 7 of 12
APPLYING THE MODEL TO DIFFERENT STANDARDS In this section, we are using the Model to show how much variation would have occurred using the Factors from
different standards under the conditions that data set 918 was collected under. Had 500 or so tests been conducted
over 40 minutes on the same building, much variation would occur in the results if all Factors were set to the
widest ranges of values allowed by those standards. Each Factor was looked at individually and added
cumulatively from one table to the next, in order to understand their respective effects. Factors are highlighted in
green when they are first added onto the table. Baseline variations cause errors Data for Test ID 918 consisted of a continual sampling of baseline pressures for 600 seconds. A series of rolling
averages were created for 10, 30, 60, 120 and 240 seconds to quantify the variation within each group against the
600 second average. Examining Figure 6, which is a running 10s average of baseline data for 600 seconds, we
notice that we could have recorded a baseline average between zero and -5 Pa, and this variability is recorded in
Table 5 under NEBB and ASTM. The variability in the baseline for ISO, EN and ATTMA is 3 Pa (from -4 to -1)
based on 30 s averages and USACE is 2 Pa based on 120 s averages. The average over 600 seconds is subtracted
from the highest and lowest baseline in order to find the maximum Baseline Variation from the average.
Test ID #918 Test Standard
NEBB ASTM CGSB ISO & EN &
ATTMA
USACE
Number of Baseline test points 1 1 1 30 12
Time to take each point 10 10 10 1 10
Total Time to get Baseline 10 10 10 30 120
Highest Baseline based on Total Time
-5 -5 -4.5 -4 -3.5
Lowest Baseline based on Total Time
0 0 -0.5 -1 -1.5
Average over 600 seconds -3 -3 -3 -3 -3
Baseline Variation from the Average 2.6 2.6 2.5 2.0 1.5
Table 5. Effect of all the above Factors on Test ID 918.
Testing in both directions Testing in both directions allows accuracy requirements for baseline measurements to be relaxed because errors in
determining the correct value largely cancel out when the same baseline value is added to a test in one direction
and then subtracted from the test in the other direction. For example, if the baseline was measured incorrectly as
being +5 Pa when it should have been zero, then the result would be that an induced test pressure of +25 Pa as
read on the gauge would be improperly corrected to +20 Pa. During the test in the opposite direction, an induced
test pressure of -25 Pa, as read on the gauge, would be corrected to -30 Pa. Both resulting curve fits would be
wrong because of the baseline error, but when the curves are combined, that error would effectively disappear.
Since both baseline variation and gauge error essentially cancel out when testing in both directions, the potential
error is dramatically reduced. It is also entirely probable that there would be some reduction in the induced
variation since it is unlikely that the same magnitude of variation would occur in the same but opposite directions
when testing both ways.
These results also indicate that the common practice of taking the lowest test point at a higher pressure, to reduce
the effects of wind, actually has the opposite effect. Errors are drastically increased by increasing the lowest test
point. It appears as if the best scenario may be testing from 10 to 60 Pa when results at 4 Pa are required.

Page 8 of 12
Figure 9. Trapezoid model diagram for testing in both directions. Notice how many of the variations cancel.
Errors using existing standards for test ID 1540 were reduced to half from when tested in both directions. Test ID #1540 - test in both directions
Existing standards New Factors
NEBB ASTM CGSB ISO & EN
ATTMA
USACE 1 2 3
Number of Baseline test points 1 1 1 30 12 30 30 12
Time to take each point 10 10 10 1 10 90 30 30
Total time to get Baseline 10 10 10 30 120 2700 900 360
Allowable variation, 1 Baseline pt 1 2 2
Max variation in any 1 Baseline pt 1 1.89 1.89
Baseline Variation over total time 3.03 3.03 2.5 1.89 3.03 0.4 0.5 0.50
Gauge accuracy near zero 2.4 0.25 2 2 0.25 0.25 0.25 0.25
Induced Pressure Variation 3.03 3.03 2.5 3.03 2.45 0.6 0.85 0.85
Time to take 1 Induced Point 10 10 10 10 20 360 120 120
Gauge error for induced 2.4Pa 5% 2Pa 2Pa 1% 1% 1% 1%
Test fan flow accuracy 4% 5% 7% 7% 5% 3% 5% 5%
Lowest test point, at least 10 10 15 10 25 15 15 25
Highest test point, at least 75 50 50 50 75 60 60 75
Minimum # of Induced Points 5 5 8 5 10 2 2 2
Results at 4 Pa +35% -25%
+45% -31%
7% -7%
Results at 10 Pa 24% 9%
Results at 50 Pa 10% 11% 11% 6%
Results at 75Pa +6% 7% 5.9% Table 6. Effects of all variables when testing in both directions, including new Factors.
New confidence interval calculation
A series of air leakage tests were used to see if the confidence interval generated by the ASTM standard was wide
enough to include successive tests that were done under exactly the same conditions. Tests were grouped in
batches that had exactly the same set of conditions. It doesn't appear as if this method of statistical analysis can
accurately predict the type of variation that was witnessed due to variations in baseline pressure and their effect on
the induced pressure readings.
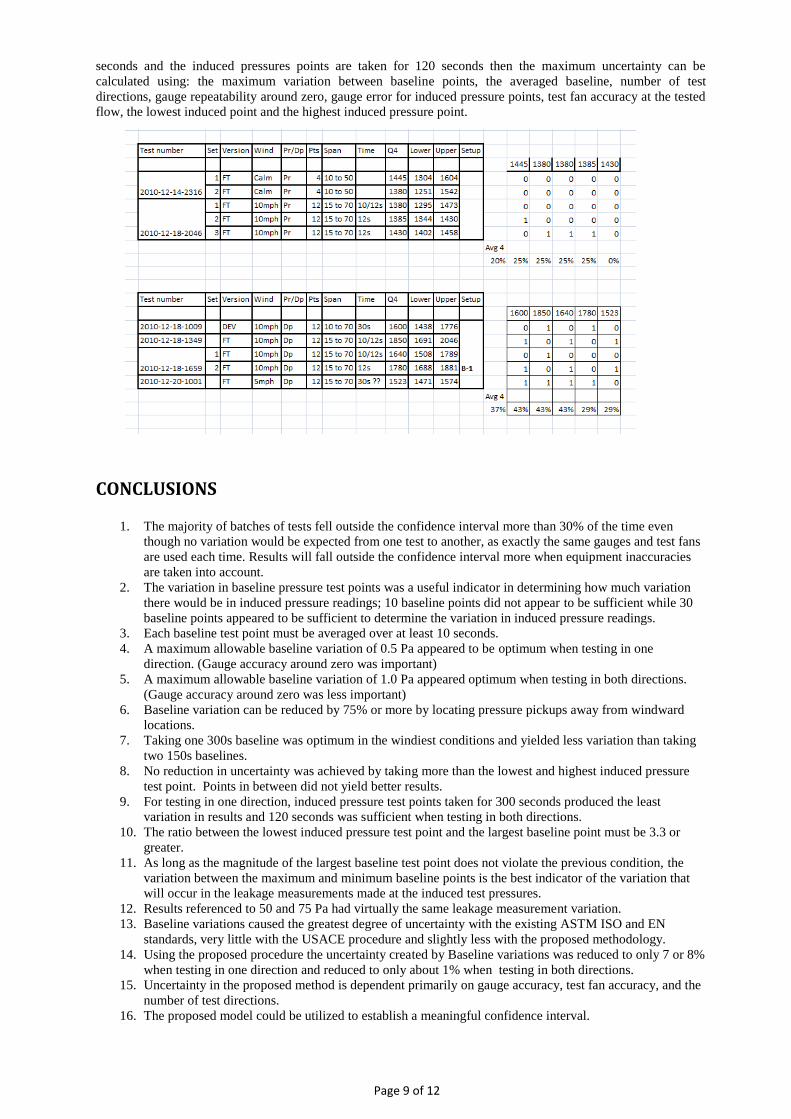
The uncertainties elsewhere in this paper were calculated using the Model in Excel that could be converted into an
equation for use in standards. If the procedure is conducted as described using 30 baseline points for at least 10
Page 9 of 12
seconds and the induced pressures points are taken for 120 seconds then the maximum uncertainty can be
calculated using: the maximum variation between baseline points, the averaged baseline, number of test
directions, gauge repeatability around zero, gauge error for induced pressure points, test fan accuracy at the tested
flow, the lowest induced point and the highest induced pressure point.
CONCLUSIONS
1. The majority of batches of tests fell outside the confidence interval more than 30% of the time even
though no variation would be expected from one test to another, as exactly the same gauges and test fans
are used each time. Results will fall outside the confidence interval more when equipment inaccuracies
are taken into account.
2. The variation in baseline pressure test points was a useful indicator in determining how much variation
there would be in induced pressure readings; 10 baseline points did not appear to be sufficient while 30
baseline points appeared to be sufficient to determine the variation in induced pressure readings.
3. Each baseline test point must be averaged over at least 10 seconds.
4. A maximum allowable baseline variation of 0.5 Pa appeared to be optimum when testing in one
direction. (Gauge accuracy around zero was important)
5. A maximum allowable baseline variation of 1.0 Pa appeared optimum when testing in both directions.
(Gauge accuracy around zero was less important)
6. Baseline variation can be reduced by 75% or more by locating pressure pickups away from windward
locations.
7. Taking one 300s baseline was optimum in the windiest conditions and yielded less variation than taking
two 150s baselines.
8. No reduction in uncertainty was achieved by taking more than the lowest and highest induced pressure
test point. Points in between did not yield better results.
9. For testing in one direction, induced pressure test points taken for 300 seconds produced the least
variation in results and 120 seconds was sufficient when testing in both directions.
10. The ratio between the lowest induced pressure test point and the largest baseline point must be 3.3 or
greater.
11. As long as the magnitude of the largest baseline test point does not violate the previous condition, the
variation between the maximum and minimum baseline points is the best indicator of the variation that
will occur in the leakage measurements made at the induced test pressures.
12. Results referenced to 50 and 75 Pa had virtually the same leakage measurement variation.
13. Baseline variations caused the greatest degree of uncertainty with the existing ASTM ISO and EN
standards, very little with the USACE procedure and slightly less with the proposed methodology.
14. Using the proposed procedure the uncertainty created by Baseline variations was reduced to only 7 or 8%
when testing in one direction and reduced to only about 1% when testing in both directions.
15. Uncertainty in the proposed method is dependent primarily on gauge accuracy, test fan accuracy, and the
number of test directions.
16. The proposed model could be utilized to establish a meaningful confidence interval.

Page 10 of 12
PROPOSAL TO IMPROVE ACCURACY AND REPEATABILITY
Some of the foregoing proposal is based on conclusions that are well documented by this paper while other
conclusions can easily be induced by our operation of the model or by further manipulations of the data taken
during the study. No statistical gurus have so far contributed to the study and I'm sure that additional contributions
can be made to polish this way of analyzing enclosure air leakage testing data. We welcome their contributions.
Number of baseline test points
The more test points that are used, the more likely it is that the maximum variation will be uncovered. Twelve is
probably the minimum number and there may not be any value in going beyond 30. Either way, evaluating the
difference between these points is an essential way of determining the amount of variation that will probably be
occurring later during induced envelope pressure test points.
It is proposed that when testing in both directions, an initial baseline pressure be taken and then a final baseline
pressure taken only after the 2nd direction is completed, assuming the change in test directions occurs before any
environmental conditions change too drastically. The reason for this proposal is that if intermediate baseline
pressures are taken after the first test and before the 2nd test, a different baseline value may be applied to the first
test when compared to the 2nd. Since baseline pressure measurements tend to go through a lot of variation not
much additional accuracy is gained by taking a total of 4 sets baseline pressure test points versus only 2. What is
more likely is that accuracy will be lost because an incorrect baseline will be subtracted from a test in one
direction versus the other. As long as the baseline pressure does not change from one test direction to the other, it
is more accurate to apply the baseline correction to both test directions equally. In fact, when testing in both
directions a good case can be made for not correcting the data at all, however, the important function of using
baseline variations to determine induced pressure variation is lost as is the ability to evaluate the accuracy of the
test using this method.
Baseline pressure readings should be measured at the lowest elevation of the building which is generally away
from the maximum impact of the wind. Determining pressure differentials at the top of the building can best be
performed from inside the building rather than exposing pressure probes to the high velocity winds at the top.
Averaging pressures on all 4 sides of the building will reduce the impact of wind and may be done electronically
or pneumatically.
Minimum time required to take each baseline point
Each baseline point must be averaged over a minimum time period in order that the total time to acquire all points
is long enough to detect any wind gusts that may be occurring. Time required for testing in one direction is at
least double the amount of time required for testing in both directions because in the latter case, variations almost
completely cancel out.
Allowable variation, one baseline point
This is the maximum allowable variation between any one baseline point and the average of all points and is that
at 1 Pascal for testing in one direction except for results at 4 Pa where it should be a maximum variation of 0.5 Pa.
For testing in both directions these values are doubled because this variation has very little impact on the results.
As the total time used to acquire a baseline point increases this variation tends to decrease.
Gauge accuracy near zero
The magnitude of baseline pressures do not present nearly as much of a problem as the variation in the baseline
over time. When successive baselines are taken under mildly windy conditions over a period of 10 seconds for
example the resultant test points vary substantially. By taking 30 baseline test points for 30 seconds each, an
accurate picture of the variability can be obtained. As the time taken to measure each baseline point is increased,
the variation from one baseline point to another is decreased. Even under windy conditions taking 30 baseline test
points for 30 seconds each, where the maximum variation between baseline pressure test points and the overall
average 1.0 Pa or less will yield a baseline average that is within 0.25 Pa of the true value.
Minimum time to take one induced pressure test point
Since the total number of induced pressure test points has been reduced down to only 2, it makes sense to take
more time on those 2 points. The overall testing time can be reduced and accuracy will increase. For testing in
one direction, take each induced pressure test point for one half the time required to acquire all baseline pressure
test points.
Page 11 of 12
Gauge error for induced pressure test points
The baseline variation can be used as a guide to how long the induced pressure test point should be taken. It is
only necessary to take test points at the lowest and highest test pressures, since those in the middle add little to the
accuracy of the overall result. It is better to spend more time taking one accurate point then to waste time taking
test points at mid-test pressures which have little impact on the overall result. It is reasonable that if the variation
in the baseline pressure test points is only 0.5 Pa, than the time taken for induced pressure test points can be cut in
half to 180 seconds each with no loss of accuracy. Similarly, if the variation is only 0.25 Pa, then the induced
pressure test point can be cut down to 90 seconds, again with no loss of accuracy.
Modern digital gauges will have accuracies of +/ -1% or 0.25 Pa, whichever is greater. Many air leakage standards
were written in the 1980s, when accuracies of +/-2 Pa were all that could be expected.
Test fan accuracy
Calibrated test fan accuracies are commonly 5%, which would be an appropriate requirement for most testing.
Where test results are required at a reference pressure of 4 Pa, accuracy requirements of 3% is recommended. The
model can be used to test different scenario accuracies and evaluate the impact on the desired accuracy of the end
result.
Lowest test point, at least
The lowest induced pressure test point must be at least 15 Pa for results that are referenced at pressures up to 50
Pa. For reference pressure is above 50 Pa there is no need for this test point to go below 25 Pa.
Highest test point, at least
The highest test point must be at least as high as the reference pressure. There must be a ratio between the lowest
and highest induced pressure must be greater than the ratio between the lowest test point and the reference
pressure. If the test is conducted between 15 and 60 Pa which is a ratio of 4 to 1 then the lowest reference
pressure could be one quarter of 15 Pa which 3.75 which would accommodate a reference to 4 Pa.
Minimum number of induced points
Taking only 2 induced pressure test points is proposed because it appears to be considerably more accurate to take
more readings over longer period of time to firmly establish to test points at the lowest and highest is pressures
that it does to take numerous test points between these 2 extremities. By reducing the number of test points but
increasing the amount of data taken for each point, the overall accuracy of the test is improved while the time to
complete the test may be decreased.
Confidence interval calculation
The majority of batches of tests fell outside the confidence interval more than 30% of the time even though no
variation would be expected from one test to another, as exactly the same gauges and test fans are used each time.
Results will fall outside the confidence interval more when equipment inaccuracies are taken into account.
A new method of calculating uncertainty based on the instability of the baseline pressure readings and equipment
accuracy shows a lot of promise in improving the quality of his calculation. Once variation was reduced by taking
one longer Baseline reading and two induced pressure points the primary factors in determining confidence of
results came from gauge and test fan accuracy. Uncertainty due to Baseline variation was reduced from 7% or 8%
to below 1% when testing in one and two directions respectively. Baseline variations caused the greatest degree of
uncertainty with the existing ASTM ISO and EN standards, very little with the USACE procedure and slightly
less with the proposed methodology.
Proposal for testing in one, and testing in both directions
The major advantage of testing in both directions is that 2 of the major sources of error virtually cancel out and
others are reduced. It was showed that testing times can be vastly reduced, and accuracy maintained, by simply
testing in both directions. If induced pressure tests occur under the same conditions, it is better to perform only
one initial set of baseline pressure test points and then only one set of final baseline pressure test points after the
2nd induced pressure test is completed.

Page 12 of 12
Factors
Proposal
1 direction
Proposal
2 directions
1-1d 2-1d 1-2d 2-2d
Number of Baseline test points 30 30 30 30
Minimum time to acquire each baseline point 10 10 10 10
Total time to acquire all baseline points (s) ≥ 300 300 300 300
Allowable maximum variation between Baseline pts (Pa) 0.5 Pa 0.5 Pa 1 Pa 1 Pa
Gauge accuracy near zero cancels for both ways 0.25 0.25
Gauge repeatability and drift (Pa) 0.1 0.25
Time to take 1 Induced Point (s) ≥ 300 300 120 120
Gauge error for induced Points ≤ 1% 1% 1% 1%
Test fan flow accuracy ≤ 5% 5% 5% 5%
Lowest Induced Point must be (Pa) ≥ 10 25 10 25
Lowest Induced Point must be (Pa) ≤ 15 50 15 50
Lowest Induced Point ≥3.3 times the largest baseline point
(in magnitude)
3.3 X 3.3 X 3.3 X 3.3 X
Highest Induced Point (Pa) ≥ 50 75 50 75
Number of Induced Points = 2 2 2 2
Reference pressure for results (Pa) 4 to 50 50 to 75 4 to 50 50 to 75
Minimum total time to complete test 900 900 1080 1080
Maximum uncertainty at 4 Pa
Maximum uncertainty at 10 Pa
Maximum uncertainty at 50 Pa
Maximum uncertainty at 75 Pa
+15-13%
+12-11%
6.5%
6.5%
6.1%
7%
6%
6%
6%
5.7%
Table 7. Proposals 1 and 2 for testing in single and both directions.
Alternatively, the testing requirements could state the degree of confidence required and the model could be used
to determine the uncertainty.
Factors that must become constants:
10 x 30s baseline points (it would be possible to reduce the amount of time required to take each
point under stable conditions but such a relationship has not yet been determined and it may be far
simpler to require the 300 s baseline to be taken in every case which would be useful to determine
stability).
2 -300s induced pressure points for testing in one direction or two 120s induced pressure points for
testing in two directions
Lowest and highest Induced Point values prescribed.
The remaining Factors would be used to calculate the uncertainty to be expected:
Maximum Variation in Baseline Points
Gauge and test fan accuracy that would have to be verified for the range of pressures and flows
measured.
Lowest and highest induced pressures
Reference pressure
Largest baseline point (in magnitude)- possibly. We are unsure of the relationship between the largest baseline
point and the uncertainty. As long as it's within the prescribed limits it would be small for testing in two directions
but potentially more error for testing in one direction.
REFERENCES Sherman and Palmiter. 1995. Uncertainties in Fan Pressurization Measurements. ASTM Airflow Performance Conference, April 13, 1995. Murphy, Colliver and Percy. 1991. Repeatability and Reproducibility of Fan Pressurization Devices in Measuring Building Air Leakage. AHSRAE Transactions, Volume 97(II).