modern trend analysis in software product development… · modern trend analysis in software...
TRANSCRIPT

Harvest (Online); Bi-Annual Trend Analysis in Software Development Volume 2, 2016
ISSN 2456-6551 Page 43
MODERN TREND ANALYSIS IN SOFTWARE PRODUCT DEVELOPMENT: A PATH
MODEL FOR PREDICTING TECHNOLOGY
Suvayan Sengupta
IT Analyst
Business Role: Software Architect / SME
Follow me on KNOME: https://knome.ultimatix.net/u/suvayan.sengupta
Tata Consultancy Services
Building 1A,Ecospace
Plot - IIF/12,New Town, Rajarhat,
Kolkata - 700156,West Bengal
India
Buzz:- 82449
Cell:- +91 8013777267 Mailto: [email protected]
Website: http://www.tcs.com
Abstract
A CMMI Level 3 certified organization has been explored for this project work. One particular
project is selected as a focus project to analyze the modern processes with their tools and
techniques. However, there are some other projects selected and evaluated to compare the
performance of the focus project with those projects of the organization. This project is selected
as the success rate in software industry is very less. Detailed statement of problem is mentioned
in Idea Generation section.
Research Methodology with different data collection methods are described in section 3.5
[Methodology].
Findings & recommendations are described in the section 7.0 [Conclusion &
Recommendation].
Keywords :
Modern trend analysis, project management, software product development, research
organization
List of Symbols, Abbreviations and Nomenclature:
NASA - National Aeronautics and Space Administration US – United States PMI - Project
Management Institute PMP - Project management Professional USA - United States of
America IT - Information Technology NA - Not Applicable FR - Functional Requirement

Harvest (Online); Bi-Annual Trend Analysis in Software Development Volume 2, 2016
ISSN 2456-6551 Page 44
FS - Functional Specification SDD - Software Design Document WBS - Work Breakdown
Structure PDLC - Product Development Life Cycle PLC - Product Life Cycle IS -
Information Service HR - Human Resource OOAD – Object Oriented Analysis& Design
VSS – Visual Source Safe JDBC – Java Data Base Connectivity PL/SQL – Procedural
Language/ Structure Query Language UML – Unified Modeling Language SPM – Software
Project Manager AMC – Annual Maintenance Contract CR – Change Request BAP –
Business Assurance Program 7 CSI - Customer Satisfaction Index CTD - Cumulative Till
Date DRE - Defect Removal Efficiency RE - Review Effectiveness TE - Test
Effectiveness MTTRSP - Time Taken To Respond MTFB - Mean Time taken To Solve
QMS - Quality Management System GUI – Graphical User Interface QAG - Quality
Assurance Group QAT – Quality Audit Team IQA – Internal Quality Audit PPQA –
Process& Product Quality Assurance CI – Configuration Item CEO – Chief Executive
Officer SPD – Software Product DevelopmentPMBoK – Project Management Body of
Knowledge CMMI – Capability Maturity Model Integration TBD – To Be Decided
Introduction:
The explosion of internet has occurred enabling instant accessibility of any kind of information
to anyone willing to invest a modest amount for this facility. This has made possible the virtual
project office. Enterprise Resource Planning and e-procurement are widely adopted by several
companies. This implies that we are now in a period where velocity is the key word for survival
or growth of companies. Although many large private and public limited companies and
companies in the public sector are now adopting scientific project management techniques in
India, this profession is still evolving in our country. In this context, it is noteworthy that good
practices in project management developed and being updated every few years by the Project
Management Institute (PMI), U.S.A is also gaining acceptance in India, as seen by companies
encouraging their selected employees to obtain the PMP certification (Project management
Professional) launched by PMI. PMI is a professional organization for people who manage
projects. A major objective of PMI is to advance project management as a profession.

Harvest (Online); Bi-Annual Trend Analysis in Software Development Volume 2, 2016
ISSN 2456-6551 Page 45
Define, Measure, analyze, improve, standardize (DMAIS)
Define– benchmark, customer requirement, process flow map, quality function deployment,
project management plan.
Measure – data collection, defect metrics, sampling.
Analyze – cause and effect, failure modes and effect analysis, decision and risk analysis, root
cause analysis, reliability analysis.
Improve – design of experiments, modeling, and robust design.
Standardize – control charts, time series, procedural adherence, performance management,
preventive activities.
2.0 Project Scope
Scope of this Assignment is limited to modern trends of project management used in software
product development for the research organization.
Following is the major list regarding the scope of this project work.
1. Software project management methods and processes are followed or not.
2. Different project management tools & techniques are used or not.
3. Different processes are monitored or not.
4. Whether findings or outcome of different processes are analyzed or not.
5. Find out improvement scope in any area of project management processes.

Harvest (Online); Bi-Annual Trend Analysis in Software Development Volume 2, 2016
ISSN 2456-6551 Page 46
6. Finally, preparation of a recommendation list for future project.
3.0 Aims and Objectives
The aim of this particular paper: Verifies and tests existing facts and theory and these help
improving our knowledge and ability to handle situations and events.
General laws developed through research may enable us to make reliable predictions of events
yet to happen. It aims to analyze inter-relationships between variables and to derive causal
explanations: and thus enables us to have a better understanding of the project to control it.
Objectives are set under three headings:
3.1 Performance and Quality
The end result of a project must fit the purpose for which it was intended. At one time, quality
was seen as the responsibility of the quality control department. In more recent years the concept
of total quality management has come to the fore, with the responsibility for quality shared by all
staff from top management downwards. We can control this by measuring defect density and
analyzing the root cause of identified defects.
3.2 Effort/Budget
The project must be completed without exceeding the authorized expenditure. Financial sources
are not always inexhaustible and a project might be abandoned altogether if funds run out before
completion. If that was to happen, the money and effort invested in the project would be forfeited
and written off. In extreme cases the project contractor could face ruin. There are 21 many
projects where there is no direct profit motive, however it is still important to pay proper
attention to the cost budgets, and financial management remains essential. We can control this by
monitoring the effort & cost variance (actual vs. budgeted).
3.3 Time to Completion
Actual progress has to match or beat planned progress. All significant stages of the project must
take place no later than their specified dates, to result in total completion on or before the
planned finish date. The timescale objective is extremely important because late completion of a
project is not very likely to please the project purchaser or the sponsor. We can control this by
monitoring the schedule variance (actual vs. baseline).
3.4 Hypothesis to be tested
The hypothesis to be tested here is “Whether complete modern trends are followed or not”.
3.5 Methodology
3.5.1 Research Type
Here we used Descriptive Study type of research through empirical observation. It is a fact-
finding investigation with adequate interpretation. It is the simplest type of research. It is more
specific than an exploratory research. It aims at identifying the various characteristics of a
community or institution or problem under study and also aims at a classification of the range of

Harvest (Online); Bi-Annual Trend Analysis in Software Development Volume 2, 2016
ISSN 2456-6551 Page 47
elements comprising the subject matter of study. It can highlight important methodological
aspects of data collection and interpretation. The information obtained may be useful for
prediction about areas of social life outside the boundaries of the research. They are valuable in
providing facts needed for planning social action program.
3.5.2 Sources of data : Primary sources of data are used for analysis which is directly collected
& precisely according to research needs.
3.5.3 Data Collection: Method Primary data are first hand information collected through
Interview and participative observation method.
3.5.3.1 Interview : Data for this Project has been collected through interviews of the project
managers of the on-going and past projects.
3.5.3.2 Observation : In this observation, the observer is a part of the phenomenon or group
which is observed and he acts as both an observer and a participant. Here modern trends in
project management are studied by a team leader by taking part in software product development
and data are collected up to 2 decimal places. The advantages of participant observation are: The
observer can understand the actual result of the observed events, and get a deeper insight of their
occurrences. The observer will be able to record the context which gives meaning to the
observed behavior.
3.5.3.3 Records : I have used existing records of the projects of different types.
4.0 Idea Generation
4.1 Need Identification
Most software projects fail. In fact, the Standish group reports that over 80% of projects are
unsuccessful either because they are over budget, late, missing function, or a combination.
Moreover, 30% of software projects are so poorly executed that they are canceled before
completion. In our experience, software projects using modern technologies such as Java, J2EE,
XML, and Web Services are no exception to this rule. A survey of IT experts revealed 43 percent
of their organizations had recently killed an IT project. Not only that, now companies want to
deliver products and services better, faster, and cheaper. At the same time, in the high-
technology environment of the twenty-first century, nearly all organizations have found
themselves building increasingly complex products and services. Today, a single company
usually does not develop all the components that compose a product or service. More commonly,
some components are built in-house and some are acquired; then all the components are
integrated into the final product or service. Organizations must be able to manage and control
this complex development and maintenance process. The problems these organizations address
today involve enterprise wide solutions that require an integrated approach. Effective
management of organizational assets is critical to business success. In essence, these
organizations are product and service developers that need a way to manage an integrated
approach to their development activities as part of achieving their business objectives. So Project
management process is very much necessary to develop a software application across all IT
industries. This research describes modern trends of project management process that help to
improve the success of any project.

Harvest (Online); Bi-Annual Trend Analysis in Software Development Volume 2, 2016
ISSN 2456-6551 Page 48
4.2 Alternative evaluation
The project life cycles (Project development life cycle, product development life cycle, Project
delivery & implementation life cycle etc.) are evaluated for different types of projects. Different
processes of standard like CMMI, ISO, PMBoK and some modern key processes are evaluated
for different types of projects (like - Pure development Project, AMC project, MSO project, BAP
project etc). Selection of a project life cycle or certain project management processes are done
depending on project complexity, resource expertise, technology used etc.
4.3 Project defined processes
4.3.1 PMBoK Processes
The objective of this Project Management Process is to ensure that the project management
functionaries focus on dispatching project deliverables as per expressed, implied and agreed
client expectations, on agreed dates, and in a mode that is acceptable to the client. While doing
so, due attention is paid to optimum utilization of project resources and optimization of project
costs Project management processes are divided into five groups, defined as the Project
Management Process Groups, each group comprising one or more processes. This grouping
helps in understanding the relevance and significance of the sequence of, and interaction between
the various processes in project management. However, a process group is not a totally discrete
phase occurring in isolation from another process group, and the processes have inherent
interactions between themselves throughout the implementation life cycle of a project.
Brief definition of these process groups are as under:
1. Initiating process group – defines and authorizes the project or a project phase.
2. Planning process group – defines and redefines objectives and plans the course of action
required to attain the objectives and scope that the project was undertaken to address.
3. Executing process group – integrates people and other resources to carry out the project
management plan for the project.
4. Controlling process group – regularly measures and monitors progress to identify variances
from the project management plan so that corrective action can be taken when necessary to meet
project objectives.
5. Closing process group – formalizes acceptance of the product, service or result and brings the
project or a project phase to an orderly end. Broadly, the process groups tend to be deployed in
the sequence listed as the project progresses. In the event that a project goes off-course, re-
planning comes into play, and if a project is found to be in serious trouble, it may have to go all
the way back to the initiating process to be restarted. To summarize, the result or output of one
process group often becomes an input to another. In the central process groups planning,
executing and control), all the links are looped i.e. the links of these central process groups are
iterated – planning provides execution with a documented plan early on, and then provides
documented updates to the plan, as the project progresses.

Harvest (Online); Bi-Annual Trend Analysis in Software Development Volume 2, 2016
ISSN 2456-6551 Page 49
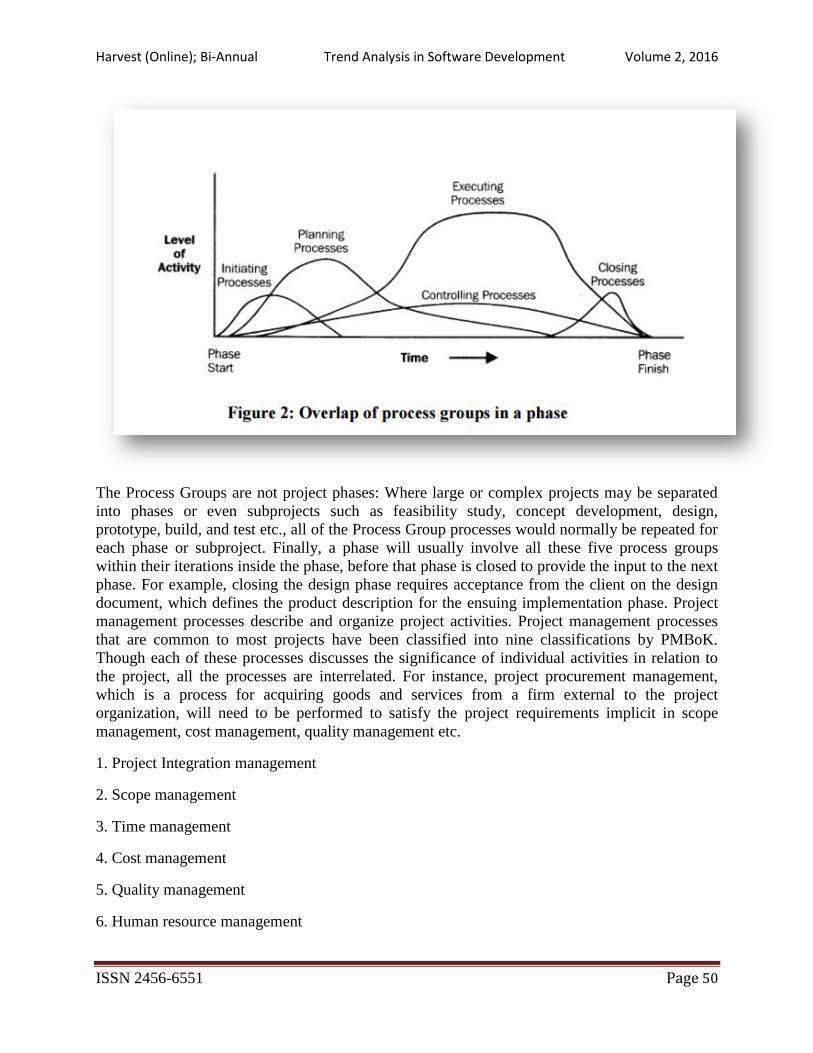
Figure 1: Links among Process Groups in a Phase
Also, though these process groups are presented above as discrete, one-time events; these events
overlap and take place at different levels of activity across each phase in the project life cycle.
Fig. 1 illustrates this overlapping.
Harvest (Online); Bi-Annual Trend Analysis in Software Development Volume 2, 2016
ISSN 2456-6551 Page 50
The Process Groups are not project phases: Where large or complex projects may be separated
into phases or even subprojects such as feasibility study, concept development, design,
prototype, build, and test etc., all of the Process Group processes would normally be repeated for
each phase or subproject. Finally, a phase will usually involve all these five process groups
within their iterations inside the phase, before that phase is closed to provide the input to the next
phase. For example, closing the design phase requires acceptance from the client on the design
document, which defines the product description for the ensuing implementation phase. Project
management processes describe and organize project activities. Project management processes
that are common to most projects have been classified into nine classifications by PMBoK.
Though each of these processes discusses the significance of individual activities in relation to
the project, all the processes are interrelated. For instance, project procurement management,
which is a process for acquiring goods and services from a firm external to the project
organization, will need to be performed to satisfy the project requirements implicit in scope
management, cost management, quality management etc.
1. Project Integration management
2. Scope management
3. Time management
4. Cost management
5. Quality management
6. Human resource management

Harvest (Online); Bi-Annual Trend Analysis in Software Development Volume 2, 2016
ISSN 2456-6551 Page 51
7. Communications management
8. Risk management
9. Procurement management
Table 1:
Requirements Traceability Matrix
Project Code: ABC
Project Name: ABC
Customer Name: Internal

Harvest (Online); Bi-Annual Trend Analysis in Software Development Volume 2, 2016
ISSN 2456-6551 Page 52
5.3 Research Life cycle
The concept of a Life Cycle is central to software engineering methods. The purpose of a
Product Development Life Cycle (PDLC) definition is to provide an understanding of the
underlying software engineering processes so that those can be planned and monitored. There are
many different representations of the related software product development life cycle models,
which comprises of various phases. All product development projects must pass through these
phases, with a different emphasis placed on each, depending on the type of the product being
developed. Product Life Cycle (PLC) refers to the life cycle phases and activities relevant for the
development, implementation and maintenance of a software product.
Typically, a PLC may be sub-divided into 3 broad phases:
Product Development phase
Product Delivery and Implementation phase
Product Support and Maintenance phase.
Due to the nature of customer requirements and the priorities of the management, it was decided
to use a new set of technologies to enable the delivery of the user experience over a web
browser. The incremental model was chosen as Product Development Lifecycle Process for this
project as it is the most appropriate choice. The Incremental Model combines the elements of
Waterfall model with the philosophy of an iterative approach. As illustrated below, it applies the
linear sequences in the Waterfall Model in a staggered manner as the calendar time progresses.
Each linear sequence produces an incremental deliverable of the software. The first increment is
often a core software system where the basic requirements are addressed, but many
supplementary features remain undelivered. The core software system is reviewed in detail by
the customer and may be even used. As a result of the detailed review and/or use of the core
software system a plan is developed for the next increment. The plan addresses the modification

Harvest (Online); Bi-Annual Trend Analysis in Software Development Volume 2, 2016
ISSN 2456-6551 Page 53
of the core software system to better meet the needs of the customer and delivery of the
additional features and functionality. This process is repeated following the delivery of each
increment until the complete software system is developed. This has a number of distinct
advantages over the traditional sequential development model. This is the best choice for projects
that has high technical risks, and objective is achieved by breaking down the project organization
and systems construction into manageable subprojects. The advantage of this model is that the
development team understands customer’s expectations in gradual steps and gets the opportunity
to implement changes in the same incremental steps. It is particularly useful when staffing is
unavailable for a complete implementation of the full system by the project deadline. The core
software system can be implemented with fewer staff that can be put to use by the user. If the
core software system is well received by the user, additional staff is added to work on the
subsequent increment(s).
A series of activities was carried out as part of the project’s defined process prior to starting
work on the increments as per the incremental model. The activities identified are as follows:
1. Study of customer requirements
2. Study of existing functionalities
3. Enumerate generic features of certain modules Analysis Design Coding Unit Testing Delivery
of 1st Increment Analysis Design Coding Unit Testing Delivery of 2nd Increment Analysis
Design Coding Unit Testing Delivery of 3rd Increment
4. Identification of architectural attributes to be retained in the application.
5. Preparation of Functional specifications and incorporate new requirements identified in step 1
6. Identification of candidate technologies and tools for evaluation
7. Evaluation of identified alternative technologies and tools by prototyping
Harvest (Online); Bi-Annual Trend Analysis in Software Development Volume 2, 2016
ISSN 2456-6551 Page 54
8. Selection of tool and technology set for delivering the subsequent increments
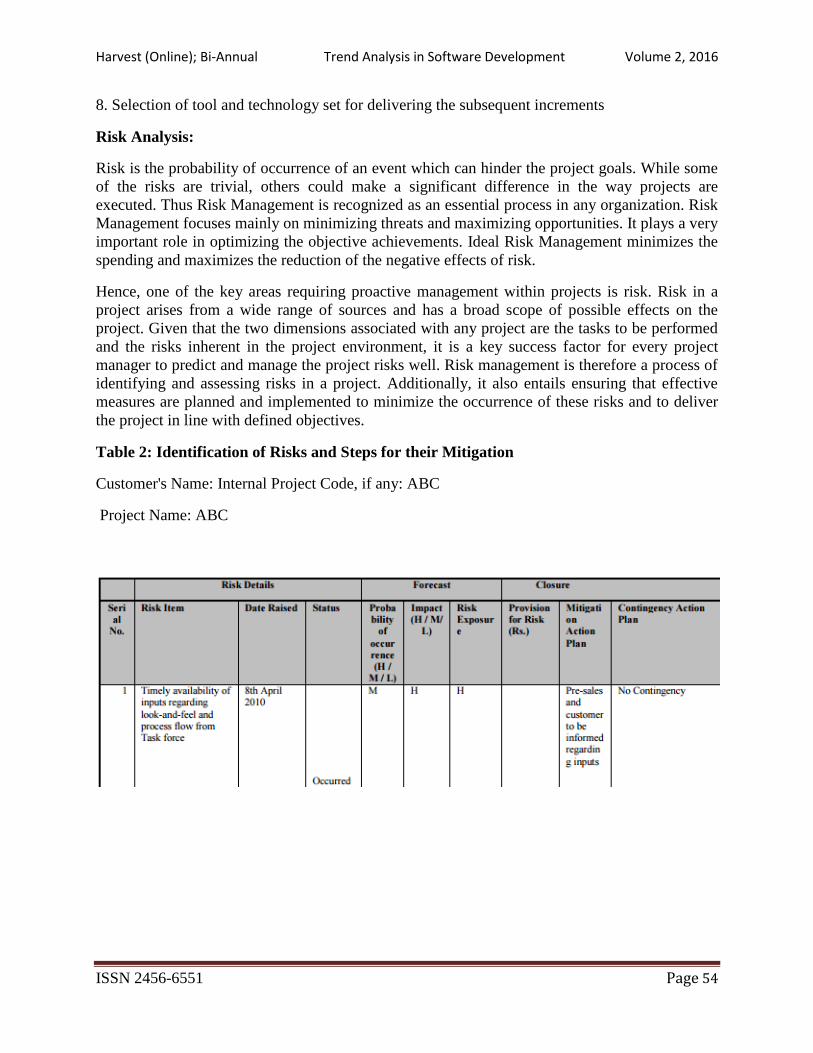
Risk Analysis:
Risk is the probability of occurrence of an event which can hinder the project goals. While some
of the risks are trivial, others could make a significant difference in the way projects are
executed. Thus Risk Management is recognized as an essential process in any organization. Risk
Management focuses mainly on minimizing threats and maximizing opportunities. It plays a very
important role in optimizing the objective achievements. Ideal Risk Management minimizes the
spending and maximizes the reduction of the negative effects of risk.
Hence, one of the key areas requiring proactive management within projects is risk. Risk in a
project arises from a wide range of sources and has a broad scope of possible effects on the
project. Given that the two dimensions associated with any project are the tasks to be performed
and the risks inherent in the project environment, it is a key success factor for every project
manager to predict and manage the project risks well. Risk management is therefore a process of
identifying and assessing risks in a project. Additionally, it also entails ensuring that effective
measures are planned and implemented to minimize the occurrence of these risks and to deliver
the project in line with defined objectives.
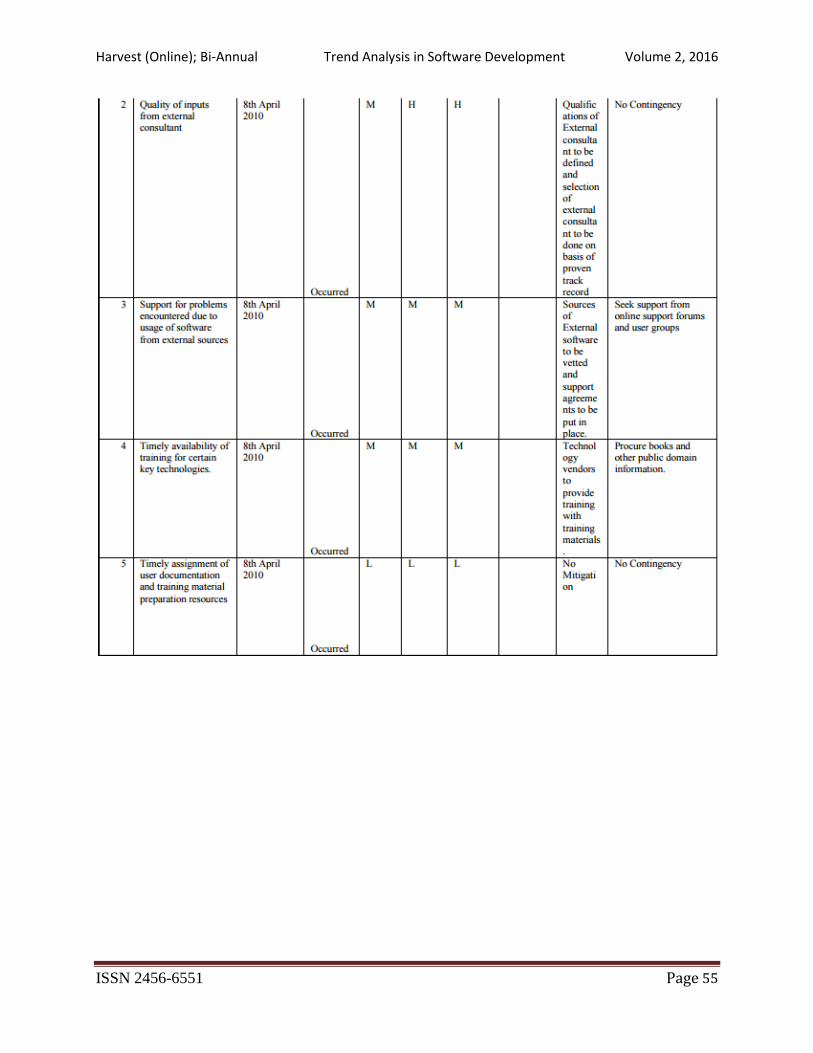
Table 2: Identification of Risks and Steps for their Mitigation
Customer's Name: Internal Project Code, if any: ABC
Project Name: ABC
Harvest (Online); Bi-Annual Trend Analysis in Software Development Volume 2, 2016
ISSN 2456-6551 Page 55

Harvest (Online); Bi-Annual Trend Analysis in Software Development Volume 2, 2016
ISSN 2456-6551 Page 56
Team Building:
Team Building refers to a wide range of activities, presented to businesses designed for
improving team performance. Team building is pursued via a variety of practices, and can range
from simple bonding exercises to complex simulations and multi-day team building retreats
designed to develop a team. It generally sits within the theory and practice of organizational
development, but can also be applied to sports teams, school groups, and other contexts.
Teambuilding is an important factor in any environment, its focus is to specialize in bringing out
the best in a team to ensure self development, positive communication, leadership skills and the
ability to work closely together as a team to problem solve. Work environments tend to focus on
individuals and personal goals, with reward & recognition singling out the achievements of
individual employees.
Reasons for Team Building
Reasons for Team Building include Improving communication Making the workplace more
enjoyable Motivating a team Getting to know each other Getting everyone "onto the same
page", including goal setting Teaching the team self-regulation strategies Helping
participants to learn more about themselves (strengths and weaknesses) 50 Identifying and
utilizing the strengths of team members Improving team productivity Practicing effective
collaboration with team members
Harvest (Online); Bi-Annual Trend Analysis in Software Development Volume 2, 2016
ISSN 2456-6551 Page 57
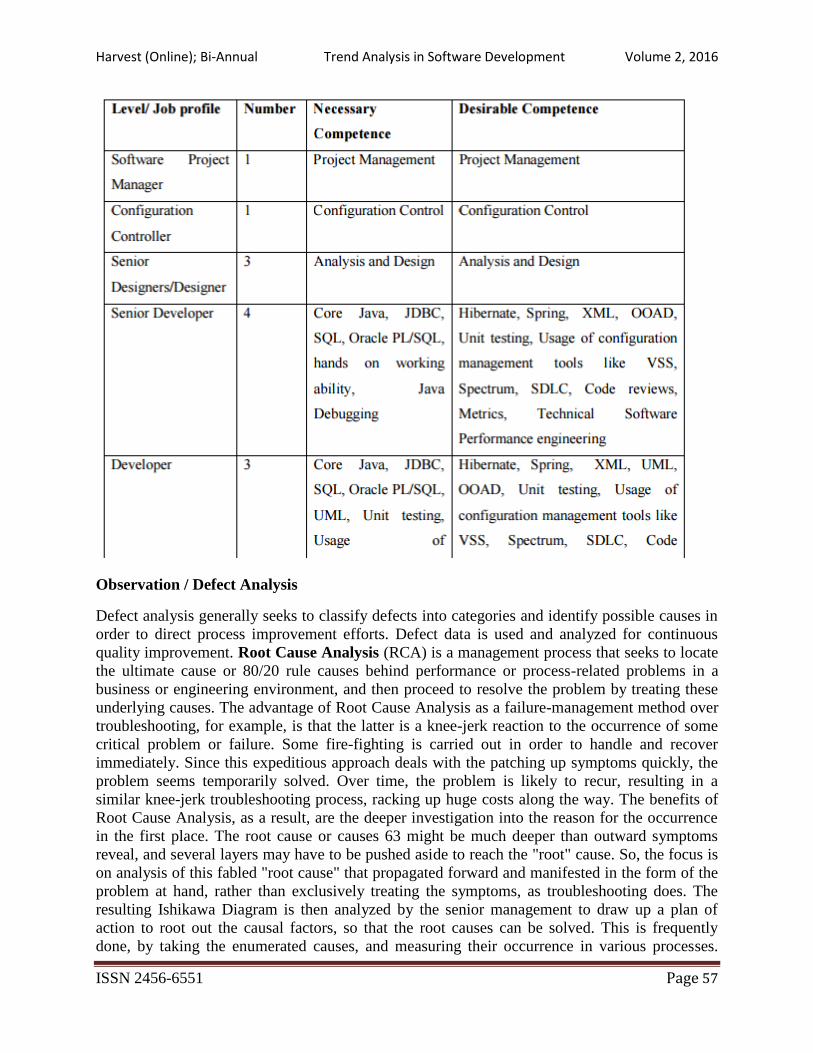
Observation / Defect Analysis
Defect analysis generally seeks to classify defects into categories and identify possible causes in
order to direct process improvement efforts. Defect data is used and analyzed for continuous
quality improvement. Root Cause Analysis (RCA) is a management process that seeks to locate
the ultimate cause or 80/20 rule causes behind performance or process-related problems in a
business or engineering environment, and then proceed to resolve the problem by treating these
underlying causes. The advantage of Root Cause Analysis as a failure-management method over
troubleshooting, for example, is that the latter is a knee-jerk reaction to the occurrence of some
critical problem or failure. Some fire-fighting is carried out in order to handle and recover
immediately. Since this expeditious approach deals with the patching up symptoms quickly, the
problem seems temporarily solved. Over time, the problem is likely to recur, resulting in a
similar knee-jerk troubleshooting process, racking up huge costs along the way. The benefits of
Root Cause Analysis, as a result, are the deeper investigation into the reason for the occurrence
in the first place. The root cause or causes 63 might be much deeper than outward symptoms
reveal, and several layers may have to be pushed aside to reach the "root" cause. So, the focus is
on analysis of this fabled "root cause" that propagated forward and manifested in the form of the
problem at hand, rather than exclusively treating the symptoms, as troubleshooting does. The
resulting Ishikawa Diagram is then analyzed by the senior management to draw up a plan of
action to root out the causal factors, so that the root causes can be solved. This is frequently
done, by taking the enumerated causes, and measuring their occurrence in various processes.

Harvest (Online); Bi-Annual Trend Analysis in Software Development Volume 2, 2016
ISSN 2456-6551 Page 58
After recording these data for a specific period, the results are examined in a Pareto Chart,
wherein the 80/20 rule makes it apparent where to invest the appropriate organizational effort to
reduce the unwanted effects so analyzed in this process (or perhaps to increase intended positive
effects). As can be seen above, the Cause and Effect exercise may be seen as the first step toward
any quality management effort. Problem-solving techniques continue where this exercise leaves
off. An innovation on the Ishikawa fishbone is the "lateral tree", which is supposed to have an
edge over the former when it comes to handling more complicated scenarios involving causal
branches of several depths. The latter strives to vertically align all items on the same causal level,
thus providing more perspective to analysts.

Harvest (Online); Bi-Annual Trend Analysis in Software Development Volume 2, 2016
ISSN 2456-6551 Page 59

Harvest (Online); Bi-Annual Trend Analysis in Software Development Volume 2, 2016
ISSN 2456-6551 Page 60
Quality Management Plan & Audit Process:
This Quality Management Process comprises of procedures being followed at the Company for
Quality Management activities, viz. establishing the organizational policies for quality
management and the management organization, defining and maintaining the Quality
Management System, QMS performance reporting, and ensuring Corrective and Preventive
actions for detected /reported non-conformities.
All these procedures facilitate continuous improvement of the company’s
products, services, operations, and the quality management system.
The objectives of defining and implementing the Quality Audit process are to:
Standardize on the procedures which would be followed throughout the
organization
Determining the degree of conformance of the implemented Quality
System with the documented Quality Management System through the
audit process
Facilitate continuous improvement
Quality Control
Standards Applicable
1. Java coding standard.
2. Documentation standard.
3. GUI standard as per customer representative input.

Harvest (Online); Bi-Annual Trend Analysis in Software Development Volume 2, 2016
ISSN 2456-6551 Page 61
Table 3: Product Review & Testing
Table 4: Quality Audit Plan

Harvest (Online); Bi-Annual Trend Analysis in Software Development Volume 2, 2016
ISSN 2456-6551 Page 62
Table 5: Software quality audit report
5.13 Configuration Management
Objective of configuration management is to ensure appropriate level of access
control to the work products produced by projects, departments or groups. This
process describes the Configuration Management Process that shall be
followed for establishing and maintaining the integrity of the work products of
the project throughout the project life cycle.
Moreover, work products produced by different department or groups shall
also be under configuration management process of the Company. The prime
objective of the Configuration Management Process is to
Plan configuration management activities
Identify and control selected work products
Control identified changes to the work products,
Publish the status
Distribute baselines to all the affected groups in the Company and
Conduct audit in regular intervals over to ensure smooth operation of
configuration management activities.
Configuration Control Procedure
This will be as per the Configuration Management Process defined in QMS, i.e.
Identify the configurable Items
Maintaining a proper directory structure along with the access rights of team members in the
folders
Standardize the naming convention of the files
Version maintenance
Change Request management
Harvest (Online); Bi-Annual Trend Analysis in Software Development Volume 2, 2016
ISSN 2456-6551 Page 63
VSS tool is used for configuration control like access control, base lining and release of CI
Retention Period of each CI
1 year after CI is OBSOLETE
Procedure for base lining a CI
Microsoft VSS is used to manage all CIs
Procedure for moving to a new baseline is:
Doing Change Management on the CI
Send new version for approval to relevant stakeholder
On-approval, update CI Register to incorporate new version as baseline.
5.14 Metrication Plan
A Measure is a quantitative value that indicates some characteristic aspect(s)
of a project, product, or process. Typically a ratio of measures (even a
distribution data) is referred to as a metric. Through proper analysis of metrics
data we can have better control over a project, product quality, or a process. It
helps the management to react proactively rather than reactively. To achieve
the desirable product quality and process performance, proper implementation
of the metrication program of the organization is essential.
Setting Control Limits
When metrics data are being analyzed and plotted in a Control Chart, control
limits need to be set to facilitate setting the organizational goals.
The guidelines for setting the control limits shall be as given below.
Let us assume X is the mean and is the standard deviation. Then,
X ± 3 is used in the organization to set the control limit. 73
The following is a list of desirable metrics for use by the projects in the organization.
a) Customer Satisfaction Index (CSI)

Harvest (Online); Bi-Annual Trend Analysis in Software Development Volume 2, 2016
ISSN 2456-6551 Page 64
This metrics is used to identify the customer satisfaction level over a period of
time and taking appropriate measure for improving, if any gap is perceived.
N: Total number of questions answered in the questionnaires.
S: Total number derived, adding all the points against each question answered.
Formula (Total number derived, adding all the points against each question answered
(S))/ (Total number of questions answered in the questionnaires)
Source, frequency and format of data capture
Source: Customer Satisfaction Survey Questionnaire
Frequency: Quarterly
Data Capture: Data is captured through the defined format: Customer
Satisfaction Survey Questionnaire
Frequency of metrics data reporting and analysis
After every three months of a Project tenure and also End of each project
Method of metrics data analysis
The figure in an ideal world should be 100. Once this figure is reached it is
established that the customer requirements is truly satisfied. The collected
figures are to be plotted and the figure is lying outside the control limits of
organization need to be performed appropriate exploration.
Benefits
Measures can be taken to improve the CSI in case it’s tending towards
unfavorable figure
b) Effort Variance – Original
This metric helps in finding out the overall effort slippage in a project as
compared to the original estimated effort during the execution stage and at the
end of the project.
A: Actual effort spent in the project CTD (Cumulative Till Date)
O: Original total estimated effort
E: Effort to complete the balance work

Harvest (Online); Bi-Annual Trend Analysis in Software Development Volume 2, 2016
ISSN 2456-6551 Page 65
Formula
[{(A+E) – O} * 100] / O
Source, frequency and format of data capture
Source: Time sheet
Frequency: Monthly
Data Capture: Data is captured through the Project Status Report
Frequency of metrics data reporting and analysis
Month end
Method of metrics data analysis
The figure ideally should be zero, which will prove that project has been
completed as per initial estimation. If the figure is falling outside the control
limits of organization then estimation process / techniques needs to be
revisited or other associated process followed during execution of the project
is required to be analyzed.
Benefits Necessary measure can be taken and appropriate reason can be established for
satisfying organization goal. Also it helps out for setting up new control limits.
c) Schedule Variance – Original
This metric is useful for finding out the overall schedule slippage of a project
as compared to the originally estimated scheduled duration during the
execution stage and at the end of the project.
Calculation of Schedule Variance is tricky and can often be misleading. To
calculate this metric during the execution stage of a project, one would need to
consider only the latest completed activity on only the Critical Path in the
project schedule and compare it with the originally planned schedule using the
formula below.
For projects which are completed, the formula II may be used.
Ac: Actual date of completion of the latest completed activity on Critical Path.
A: Actual duration of the project
O: Originally estimated project duration
Harvest (Online); Bi-Annual Trend Analysis in Software Development Volume 2, 2016
ISSN 2456-6551 Page 66
Formula:
(A – O)*100 / O
Source, frequency and format of data capture
Source: Project Schedule
Frequency: Monthly
Data Capture: Data is captured through the Project Status Report 76
Frequency of metrics data reporting and analysis
Monthly
Project end
Method of metrics data analysis
The figure preferably should be zero. Once this figure is arrived then it is
confirmed that project is running as per the originally estimated schedule.
If the figure is outside the control limits of organization then processes followed
during execution of the needs to be analyzed in detail.
Benefits This is very much useful for taking any corrective action during the execution
stage to avoid any overrun. Also it helps out for setting up new control limits of
the organization.
d) Average Defect density - Pre-Release & Post-Release
This metric aims to measure the quality of the product before and after delivery
to the customer.
There may be several metrics under this category. The typical classification is
Average pre-Release Defect Density and Average post- Release Defect Density.
These may be further classified by the severity of the defects found, e.g.
Average pre-Release Defect Density – Critical Defects
Average pre-Release Defect Density – Major Defects

Harvest (Online); Bi-Annual Trend Analysis in Software Development Volume 2, 2016
ISSN 2456-6551 Page 67
Average pre-Release Defect Density – All Defects
Average post-Release Defect Density – Critical Defects
Average post-Release Defect Density – Major Defects
Average post-Release Defect Density – All Defects
Nn pre-release: Total number of defects of severity n (n can be critical, major,
minor) detected before release of a product.
Nn post-release: Total number of defects of severity n (n can be critical, major,
minor) detected after release of a product.
S: Latest estimated or measured size of the software product.
Formula Average pre-Release Defect Density – Critical Defects = ((Nn prerelease)* 100)/S, where Nn
pre-release is measured for n = critical
Average pre-Release Defect Density – Total Defects = ((Nn pre-release)*100)/S,
where Nn pre-release is measured for n = all defects i.e. critical + major + minor
defects
Average post-Release Defect Density – Critical Defects = ((Nnpostrelease)*
100) /S, where Nn post-release is measured for n = critical
Average post-Release Defect Density – Total Defects = ((Nnpostrelease)*
100) /S, where Nn post-release is measured for n = all defects i.e. critical + major
+ minor defects
Source, frequency and format of data capture
Source: Test Log, Review Report
Frequency: Phase wise
Data Capture: Data is captured through the Project Status Report
Frequency of metrics data reporting and analysis
Project end
Method of metrics data analysis
The numbers ideally should be zero it can be plotted for analysis.

Harvest (Online); Bi-Annual Trend Analysis in Software Development Volume 2, 2016
ISSN 2456-6551 Page 68
Benefits Appropriate reason can be established for satisfying organization goal, if there
is any deviation. This is used for setting up new control limits for improvement.
e) Defect Severity Ratio
This metric gives an indication of the proportion of defects of a particular
severity type with respect to the total number of defects. A high proportion of
defects of severity Fatal or Serious is a great cause of concern. Causal analysis
is to be done by the Project Manager/Project leader and preventive actions are to
be taken to minimize the defects (in addition to the required corrective actions).
Formula
Defect Severity Ratio of severity n = Number of Defects of Severity n /Number of Defects where
n can be Critical, Major or Minor
Source, frequency and format of data capture
Source: Review Report/Defect Log Sheet
Frequency: As and when data review/testing is conducted
Format: Project Status Report
Frequency of metrics data reporting and analysis
The frequency of Metrics data reporting and analysis will be phase end/Project end.
Method of metrics data analysis
Histogram needs to be plotted for Defect Severity Ratio.
Benefits
Organization wide corrective measures can be taken to minimize the critical defects and
recurring major defects, which can lead to critical defects later.
Defect Removal Efficiency (DRE %)
This metric gives an indication of how much defect has been removed from the
product so that minimum defects are carried forward to post deliver stage.
Formula
Overall Defect Removal Efficiency (DRE) %=
(Total Number of defects prior to delivery X 100)/Total No of defects (Pre
delivery and post delivery)
It can also be calculated / done at the end of each phase.

Harvest (Online); Bi-Annual Trend Analysis in Software Development Volume 2, 2016
ISSN 2456-6551 Page 69
Source, frequency and format of data capture
Source: Review report/Defect Log Sheet
Frequency: As and when data review/testing is conducted
Format: Project Status Report
Frequency of metrics data reporting and analysis
The frequency of Metrics data reporting and analysis will be phase end/Project
end.
Method of metrics data analysis
Defects prior to delivery: All defects identified before the product is
released to the client.
Defects post delivery: All defects reported after the release to client.These defects may
originate from any source but after analysis are 80 attributed to the base version. A period of 1
year, following the release, will be considered to capture this metric.
For all Customization Projects
Defects prior to delivery: All customization defects identified before the product is accepted to
the client (External Client)
Defects post delivery: All defects reported after the acceptance of client (External Client).
These defects may originate from any source but after analysis are attributed to the customized
version. A period of 1 year, following the release, will be considered to capture this data.
Benefits
This indicates that how much defects are being delivered to the customer,
which were not detected and fixed before delivery. Organization should strive
to achieve DRE of 100%.
f) Review Effectiveness (RE) %
Harvest (Online); Bi-Annual Trend Analysis in Software Development Volume 2, 2016
ISSN 2456-6551 Page 70
This metric gives an indication of the efficacy of the Review process.
Formula
Review Effectiveness Ratio (RE) %=
(Total Number of defects found during all reviews X 100)/Total number of
defects
Source, frequency and format of data capture
Source: Review Notes
Frequency: As and when data review/testing is conducted
Format: Project Status Report 81
Frequency of metrics data reporting and analysis
The frequency of Metrics data reporting and analysis will be phase end/Project
end.
Method of metrics data analysis
Histograms for individual projects are plotted against TE. It is compared with
the Process Capability Baseline and Organization Goal. It should approach to
100%.
Benefits
It gives us the scope for improvement of the testing process.
g) Test Effectiveness (TE) %
This metric gives an indication of the efficacy of the testing process.
Formula
Test Effectiveness Ratio (TE) %= (Total Number of defects found during testing X 100) / Total
number of defects
Source, frequency and format of data capture
Source: Defect Log Sheet
Frequency: As and when data review/testing is conducted
Format: Project Status Report
Frequency of metrics data reporting and analysis

Harvest (Online); Bi-Annual Trend Analysis in Software Development Volume 2, 2016
ISSN 2456-6551 Page 71
The frequency of Metrics data reporting and analysis will be phase end/Project
end.
Method of metrics data analysis
Histograms for individual projects are plotted against TE. It is compared with
the Process Capability Baseline and Organization Goal. It should approach to
100%.
Benefits
It gives us the scope for improvement of the testing process.
Table 6: Metrics for the project and the corresponding goals to be achieved
Table 7: Effort Variance (MM %)

Harvest (Online); Bi-Annual Trend Analysis in Software Development Volume 2, 2016
ISSN 2456-6551 Page 72
Table 8: Mean Time Taken To Respond (MTTRSP)
Table 9: Mean Time taken To Solve (MTFB)
Table 10: Defect Rate
Table 11: Defect Rate (Post-release)

Harvest (Online); Bi-Annual Trend Analysis in Software Development Volume 2, 2016
ISSN 2456-6551 Page 73
Table 12: Defect Rate (Pre-release)
Table 13: Defect Distribution (phase wise)
Table 14: Pre-Shipment Defect Severity Ratio

Harvest (Online); Bi-Annual Trend Analysis in Software Development Volume 2, 2016
ISSN 2456-6551 Page 74
Table 15: Post-Shipment Defect Severity Ratio
Table 16: Total Defect Severity Ratio

Harvest (Online); Bi-Annual Trend Analysis in Software Development Volume 2, 2016
ISSN 2456-6551 Page 75
Figure 6: Compare Effort Variance
Figure 7: Compare Schedule Variance

Harvest (Online); Bi-Annual Trend Analysis in Software Development Volume 2, 2016
ISSN 2456-6551 Page 76
Figure 8: Compare Pre-Shipment Defect Density
Figure 9: Compare Post-Shipment Defect Density

Harvest (Online); Bi-Annual Trend Analysis in Software Development Volume 2, 2016
ISSN 2456-6551 Page 77
Figure 10: Compare Major Defect Ratio
Figure 11: Compare Review Effectiveness

Harvest (Online); Bi-Annual Trend Analysis in Software Development Volume 2, 2016
ISSN 2456-6551 Page 78
Figure 12: Compare Requirement Volatility
Figure 13: Compare Defect Removal Efficiency

Harvest (Online); Bi-Annual Trend Analysis in Software Development Volume 2, 2016
ISSN 2456-6551 Page 79
Figure 14: Compare Defect Severity
Figure 15: Compare Defect Severity – Post Delivery
Harvest (Online); Bi-Annual Trend Analysis in Software Development Volume 2, 2016
ISSN 2456-6551 Page 80
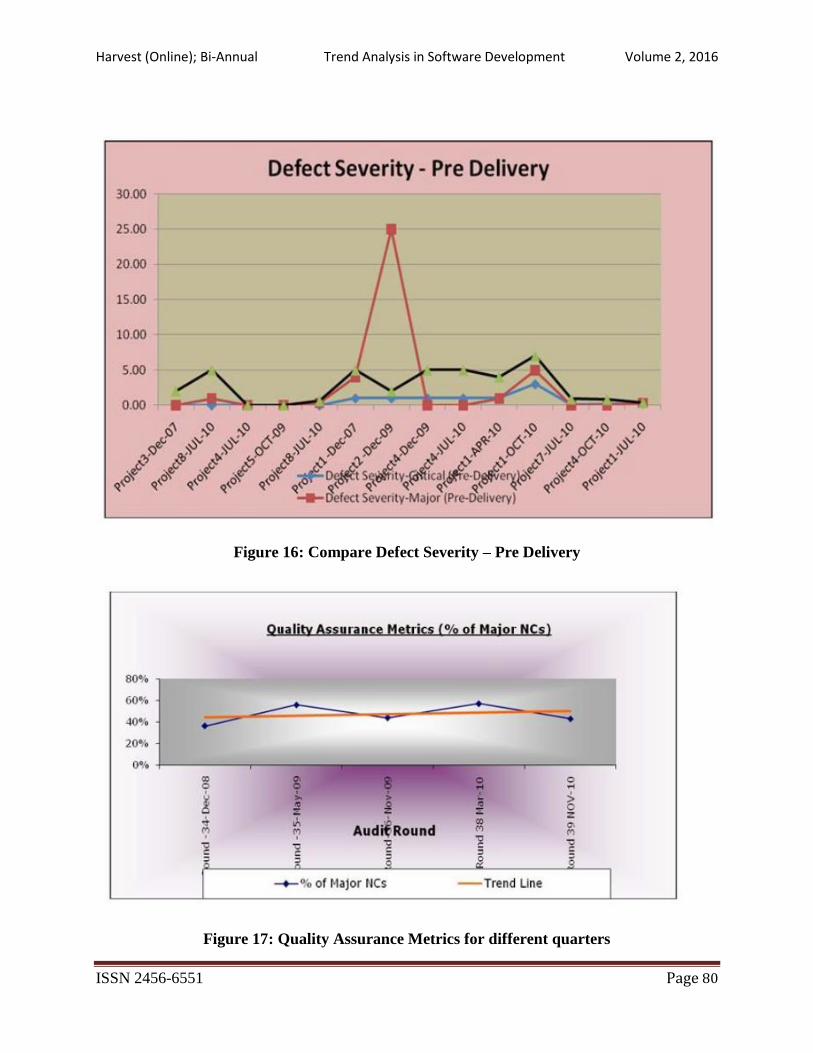
Figure 16: Compare Defect Severity – Pre Delivery
Figure 17: Quality Assurance Metrics for different quarters
Harvest (Online); Bi-Annual Trend Analysis in Software Development Volume 2, 2016
ISSN 2456-6551 Page 81
Analysis of Data
The goal of this Journal was to analyze current and future trends of the allied
management disciplines that influence project management. We asked project
managers, team members and different stake-holders about the availability of
knowledge and the potential impact of allied disciplines on project
management. We were able to assess where the allied disciplines currently
stand in terms of availability and impact as well as make predictions about the
future. The thoughts and visions collected from this research provide valuable
insights for identifying trends in the allied disciplines and their impact on the
future of project management, as well as opportunities, challenges, and
obstacles.
Mainly different types of risks, metrics data related to effort, schedule, and
different types of defects are analyzed to understand the performance of the
project and try to find out the areas of improvement.
A lack of standardization has been clearly understood to be existing in
the project oriented organizations, which can be critical in time of perfect
competitive scenario.
Furthermore, the target being drawn by a typical project management
team is often arbitrary (as no well defined industry guidelines could be
identified in this context). This often creates to misunderstanding among
the various project teams resulting in higher chances of time over-run.
There is no serious effort to eradicate the “root causes”. Though the
teams are found to be hundred percent concerned about the efficacy of
the end result (deliverables) but none are serious about the “defects”
which are resultant by product.
No standard risk registers/metric registers are available for different
types of projects executed in the organization (as observed).
Technological limitation (state-of-the-art) has been found to be existing
within the organization which happens to be a problem in itself.
7.0 Conclusion & Recommendation
This Project clubbed with the field research provided a list of best practices/standards that can
help improve in the success of a software development project. By following these best
practices, IT-Industries have a better chance of completing their project successfully. All the
Harvest (Online); Bi-Annual Trend Analysis in Software Development Volume 2, 2016
ISSN 2456-6551 Page 82
managers’ have to know the recent trends in the project management in order to apply them to
his problem solving methodology. The focus should be to understand and follow these trends to
tackle similar IT product development problem today and tomorrow.
Recommendation for further improvements
Take actions on findings
Root causes are identified for each and every defect but there is no evidence to rectify them. If
Causal Analysis and Resolution [CMMI ML5 process] can be followed to identify causes of
defects and other problems and take action to prevent them from occurring in the future, then the
project can be managed even in better way to make it ultimate success.
Here, Fish bone diagram can be used to find out the direction of exact root cause with cause &
effect analysis by a brain storming session.
Availability of standard registers
At present there is no standard risk register/metric list available for different types of projects
executed in the organization. In most of the cases, Project managers are confused during
selection of different risks/metrics for their project to measure the performance of different
activities. So, brain storming session is must and a pre-requisite activity once a new project is
started in the organization.
Budget must be directly linked with effort
There is no link of budget with estimated effort (in the above mentioned
research data parametric). Hence, it has been observed that effort and
budget were having a clear and logical gap. To take this into concern the
above mentioned process needs to be given a relook and thought. Both 95
are maintained separately. If any effort variance occurred during
execution of the project, there is no proper visibility of profit/loss to the
Sr. management.
MS-Project can be used to do this activity.
Go for CMMI Level 5 implementation
The organization is certified for CMMI Level 3. There are some important
processes & key practices available in CMMI Level 5 which can be used in
all projects of the organization to control & monitor them in better way.
Synchronize Organization Goal with Industry Goal
Harvest (Online); Bi-Annual Trend Analysis in Software Development Volume 2, 2016
ISSN 2456-6551 Page 83
There is no proper visibility of setting organization goal for each & every
metrics with the goal setting by similar kind of industry. It would not be
a case of over statement or mollified statement to state that the industry
benchmark is clearly elusive so far as this research is concerned. The
industry benchmark not being available had to be clearly ignored which
might create some variable differences with that of the organization goal
as well as industry goal. Therefore, it should be synchronized with other
industries in equal aspect. In some cases project goal as well as
organizational are not yet set.
Acknowledgements
Firstly,
I would like to thank the organization for giving me the opportunity to do this project. I would
like to thank all the project managers and other colleagues of the organization for their
contribution to complete this project successfully.
Secondly,
My parents Sri Subhasis Sengupta and Smt. Atashi Sengupta for their inspiration along with Dr.
Supatra Sen for providing me with valuable guidelines before the start of this study, which has
helped me throughout the process of making the same.
BIBLIOGRAPHY
Basic Coverage
1.The Fast Forward MBA in Project Management.
2. CMMI® for Development, Version 1.2 – SEI(Carnegie Mellon University) 96
3. Quality Manual – QMS of the Organization.
4. Project Management Body of Knowledge – Third Edition Version 1.2, PMI, USA.
5. Research Methodology, Theory & Practice.
6. Making Things Happen: Mastering management.
7. Strategic Project Management Made Simple – Practical Tools for Leaders and Teams
Websites
1.https://balancedscorecard.org/Shop/Product-Details/ProductID/1
2.www.goodreads.com/shelf/show/strategic-management
3.http://www.envisionsoftware.com/articles/Root_Cause_Analysis.html
4. http://www.ibm.com/developerworks/websphere/library/techarticles/030
6_perks/perks2.html