models for an ecosystem approach to fisheries
TRANSCRIPT

477FA
OM
od
els for an
ecosystem
app
roach
to fi
sheries
477
ISSN 0429-9345
FAO
FISHERIES TECHNICAL
PAPER
This report reviews the methods available for assessing the impacts of interactions between species and fisheries and their implications for marine fisheries management.
A brief description of the various modelling approaches currently in existence is provided, highlighting in particular features of these models that have general relevance to the field
of ecosystem approach to fisheries (EAF). The report concentrates on the currently available models representative of general types such as bionergetic models, predator-prey models and minimally realistic models. Short descriptions are given of model parameters,
assumptions and data requirements. Some of the advantages, disadvantages and limitations of each of the approaches in addressing questions pertaining to EAF are
discussed. The report concludes with some recommendations for moving forward in the development of multispecies and ecosystem models and for the prudent use of the
currently available models as tools for provision of scientific information on fisheries in an ecosystem context.
Models for an ecosystemapproach to fisheriesModels for an ecosystemapproach to fisheries

Cover:Illustration by Elda Longo

FAOFISHERIES
TECHNICAL PAPER
477
by Éva E. PlagányiUniversity of Cape TownSouth Africa
Models for an ecosystem approach to fisheries
FOOD AND AGRICULTURE AND ORGANIZATION OF THE UNITED NATIONS Rome, 2007

The designations employed and the presentation of material in this information product do not imply the expression of any opinion whatsoever on the part of the Food and Agriculture Organization of the United Nations concerning the legal or development status of any country, territory, city or area or of its authorities, or concerning the delimitation of its frontiers or boundaries. The mention of specific companies or products of manufacturers, whether or not these have been patented, does not imply that these have been endorsed or recommended by the Food and Agriculture Organization of the United Nations in preference to others of a similar nature that are not mentioned.
The views expressed in this publication are those of the author(s) and do not necessarily reflect the views of the Food and Agriculture Organization of the United Nations.
ISBN 978-92-5-105734-6
All rights reserved. Reproduction and dissemination of material in this information product for educational or other non-commercial purposes are authorized without any prior written permission from the copyright holders provided the source is fullyacknowledged. Reproduction of material in this information product for resale or other commercial purposes is prohibited without written permission of the copyright holders. Applications for such permission should be addressed to: Chief Electronic Publishing Policy and Support BranchCommunication Division FAO Viale delle Terme di Caracalla, 00153 Rome, Italy or by e-mail to: [email protected]
© FAO 2007

iii
Preparation of this document
The increased awareness of the importance of taking into account interactions among fishery resources and the ecosystem in fisheries management has prompted the need to improve the knowledge base on how ecosystems function including how they are impacted by marine capture fisheries. Over time this has led to the development of different approaches for the modelling of ecological interactions in marine ecosystems exploited by fisheries. This paper reviews the models available for assessing the impacts of ecological (indirect) direct interactions between species and fisheries and the implications these have for fisheries management.
As this is a broad and rapidly-evolving issue, the report provides an overview of the main types of modelling approaches rather than detail each aspect of the models. Moreover, it includes a critical analysis of the advantages, disadvantages and limitations of each modelling approach for representing ecosystem dynamics and interactions between ecosystems and human activities, including in particular, fisheries. This report is expected to serve as a useful reference for fisheries scientists and managers seeking an overall view of the relative merits of the main types of modelling approaches available for fisheries assessment in an ecosystem context.
The report was funded by the FAO project “Capacity Building for an Ecosystem Approach to Fisheries” (GCP/INT/920/JPN).

iv
Abstract
This report reviews the methods available for assessing the impacts of interactions between species and fisheries and their implications for marine fisheries management. A brief description of the various modelling approaches currently in existence is provided, highlighting in particular features of these models which have general relevance to the field of the ecosystem approach to fisheries (EAF). The report concentrates on the currently available models representative of general types such as bionergetic models, predator-prey models and minimally realistic models. Short descriptions are given of model parameters, assumptions and data requirements. Some of the advantages, disadvantages and limitations of each of the approaches in addressing questions pertaining to EAF are discussed. The report concludes with some recommendations for moving forward in the development of multi-species and ecosystem models and for the prudent use of the currently available models as tools for provision of scientific information on fisheries in an ecosystem context.
Plagányi, É.E. Models for an ecosystem approach to fisheries.FAO Fisheries Technical Paper. No. 477. Rome, FAO. 2007. 108p.

v
Contents
Preparation of this document iiiAbstract ivList of tables and figures viiAcknowledgements viiiAbbreviation and acronyms ixExecutive summary xi1. Introduction 1
2. Review of current modelling approaches 32.1 Whole ecosystem and dynamic system models 10
2.1.1 ECOPATH with ECOSIM (EwE) 102.1.2 Biogeochemical models 142.1.3 ERSEM and SSEM 142.1.4 IGBEM, BM2 and ATLANTIS 152.1.5 SEPODYM/SEAPODYM 18
2.2 Minimum realistic models 202.2.1 The original MRM 212.2.2 ESAM (Extended Single-species Assessment Models) 242.2.3 MSVPA approach 252.2.4 MULTSPEC, BORMICON and GADGET 272.2.5 Multi-species statistical models 29
2.3 Individual-based models 302.3.1 OSMOSE 302.3.2 INVITRO 32
2.4 Bioenergetic models 332.5 CCAMLR model development 34
2.5.1 Predator-prey models 342.5.2 KPFM (Krill-Predator-Fishery Model) 352.5.3 EPOC model (Ecosystem Productivity Ocean Climate Model) 362.5.4 Mori and Butterworth multi-species model 362.5.5 SMOM (Spatial Multi-species Operating Model) 37
3. Comparison of models 393.1 Level of complexity and realism 393.2 Functional response formulations 393.3 Whole ecosystem models vs MRMs 423.4 Advantages, disadvantages and limitations 43
4. Potential of tools to address multi-species research questions 45
5. Roles for models in operational management procedure development 49
6. Moving models forward – future developments 51
7. Prudent use of the precautionary principle 53
8. Pointers from previous studies and workshops 558.1 Modelling interactions between marine mammals and fisheries 558.2 Areas of focus 578.3 General guidelines 578.4 Ecosystem-based management strategies 588.5 Practical steps to implementing an EAF 58

vi
9. Summary of model comparisons and recommendations 61
10. References 65
Appendix 81
Tables A 1a-d Model comparison 83
Tables A 2a-d Model comparison 95
Tables A 3a-d Summary of advantages, disadvantages and limitations of each method 103
Tables A 4 Model comparison to address EBFM questions 107

vii
List of tables and figures
Table 1 List of model acronyms 5
Table 2 Categorization of models according to model units, feeding relationships assumed 7
Figure 1 Flowchart summarizing the classification of various models 4
Figure 2 Schematic summary showing the trophic level focus of different multi-species models 8
Figure 3 Schematic summarizing the typical (current) number of modelled species or model compartments for selected models 9
Figure 4 Schematic comparing consumption rate formulations for two contrasted cases 40
viii
Acknowledgements
This study was funded by the Fisheries and Aquaculture Department of the Food and Agriculture Organization of the United Nations (FAO), Rome, with logistical support provided by the University of Cape Town, South Africa. This report benefited enormously from frequent discussions and inputs from Prof. Doug Butterworth at the University of Cape Town. Dr Beth Fulton is thanked for having been the most thorough critic and contributor, and she also wrote the section on INVITRO.
The other reviewers, Dr Villy Christensen, Dr Mariano Koen-Alonso and Prof. Gunnar Stefannson and the editors, Drs Kevern Cochrane and Marcelo Vasconcellos, also provided useful suggestions and additions leading to a greatly improved manuscript. I am grateful for the assistance of Drs Kerim Aydin, Andrew Constable, Patrick Lehodey, John Tschirhart and George Watters, who provided me with necessary material and answers to queries. Sections of this manuscript are drawn from the author’s PhD thesis and support from the Marine Resource Assessment and Management Group (MARAM) within the Department of Mathematics and Applied Mathematics at UCT is gratefully acknowledged.
ix
Abbreviations and acronyms
(See also the list of model acronyms in Table 1.)
ABM Agent-Based ModelsADMB AD Model Builder AGGMULT Simplified version of MULTSPEC with only the age structure
retainedASPM Age-Structured Production ModelBENEFIT Benguela Environment Fisheries Interaction and Training
ProgrammeBM2 Bay Model 2BORMICON BOReal MIgration and CONsumption modelCCAMLR Commission for the Conservation of Antarctic Marine Living
ResourcesCITES Convention on International Trade in Endangered SpeciesCPUE Catch per Unit EffortDEAT Department of Environmental Affairs and Tourism (South Africa)EAF Ecosystem Approach to FisheriesEBFM Ecosystem-based Fisheries ManagementECONMULT Model for describing the economy of the Barents Sea fisheries
under different harvesting control rulesENSO El Niño Southern OscillationEPOC Ecosystem Productivity Ocean Climate ModelERSEM European Regional Seas Ecosystem ModelESAM Extended Single-species Assessment ModelESD Ecologically Sustainable DevelopmentEwE ECOPATH with ECOSIMFAO Food and Agriculture Organization of the United NationsGADGET Globally applicable Area-Disaggregated General Ecosystem
ToolboxGEEM General Equilibrium Ecosystem ModelGIS Geographical Information SystemGLM Generalised Linear ModelGOTM General Ocean Turbulence ModelIBM Individual-Based ModelsICES International Council for the Exploration of the SeaIGBEM Integrated Generic Bay Ecosystem ModelIMR Institute of Marine Research, Bergen, NorwayIWC International Whaling CommissionKPFM Krill-Predator-Fisheries ModelLME Large Marine EcosystemMCM Marine and Coastal Management, South AfricaMOOVES Marine Object Oriented Virtual Ecosystem SimulatorMP Management Procedure (analogous to OMP and MSE)MPA Marine Protected AreaMRM Minimally Realistic ModelMSE Management Strategy Evaluation (analogous to MP and OMP)

x
MSFOR Multi-species Forecasting ModelMSM Multi-species Statistical ModelMSVPA Multi-species Virtual Population AnalysisMSY Maximum Sustainable YieldMULTSPEC Multi-species model for the Barents SeaNAMMCO North Atlantic Marine Mammal CommissionNMFS National Marine Fisheries ServiceOMP Operational Management Procedure (analogous to MP and MSE)OSMOSE Object-oriented Simulator of Marine ecOSystems ExploitationP ProductionP/B Production:Biomass ratioPPBIM Port Philip Bay Integrated ModelPVM Parallel Virtual MachineQ/B Consumption per unit biomass (or per capita biomass)R A language and environment for statistical computing (R
Development Core Team. 2003)SAM Single-species Assessment ModelSKEBUB SKEleton BUlk Biomass ecosystem modelSEAPODYM Spatial Ecosystem And Population Dynamics ModelSEASTAR Stock Estimation with Adjustable Survey observation model and
TAg-Return dataSIR Sampling-Importance-Resampling algorithmSMOM Spatial Multi-species Operating ModelSPM Sequential Population AnalysisSSEM Shallow Seas Ecological ModelSSMU Small-Scale Management UnitsSystMod System Model for the Norwegian and Barents SeaTAC Total Allowable CatchVPA Virtual Population AnalysisWSSD World Summit on Sustainable Development

xi
Executive summary
This report reviews the methods available for assessing the impacts of interactions between species and fisheries and their implications for marine fisheries management. The focus is on modelling methods and multi-species population dynamics effects, rather than on the full range of ecosystem aspects of fishing which encompass, for example, environmental effects and technical interactions (e.g. bycatch issues), although minor mention of these is made.
The first section takes a broad overview of some of the most commonly applied multi-species/ecosystem approaches to fisheries management. The next section summarizes the results and conclusions reached by previous studies and workshops on the subject, including the ICES/SCOR Symposium on Ecosystem Effects of Fishing, the Workshop on the Use of Ecosystem Models to Investigate Multi-species Management Strategies for Capture Fisheries, the International Whaling Commission (IWC) Modelling Workshop on Cetacean-Fishery Competition, the North Atlantic Marine Mammal Commission (NAMMCO) workshops and the Workshop on Ecosystem Approaches to Fisheries in the southern Benguela.
A brief description of the various modelling approaches currently in existence is provided, highlighting particular features of these models which have general relevance to the field of the ecosystem approach to fisheries (EAF). Models discussed include: whole ecosystem/dynamic system models, minimum realistic models, individual-based models and bioenergetic models.
These models are compared in a series of tables and figures, using the following criteria:
1. the level of complexity and realism, e.g. the number of modelled species, the representation of size/age structure of the species, and the types of processes represented (physical and biological);
2. the types of functional responses of predators to changes in abundance of prey species and their consequences and limitations;
3. how uncertainties in model structure, parameters and data are treated;4. how environmental effects and interactions with non-target species (e.g. marine
mammals; sea turtles; sea birds) are incorporated;5. the spatial representation of species interactions and habitat related processes;6. model suitability for dealing with migratory species, i.e. species that cross
ecosystem boundaries;7. where possible, model adequacy to allow the analysis of the different types of
management controls in use, such as effort control, minimum size, total allowable catch, protected areas and closed seasons;
8. model adequacy to allow the assessment of the effects of short, medium and long-term ecosystem changes;
9. model suitability to conduct assessment and policy exploration, considering the model’s potential use to conduct historical reconstruction of resources to describe the current status of the ecosystem and to evaluate the potential effects of various kinds of decisions (short and long term);
10. model transparency of operation and ease of use; and11. data requirements and model suitability for data poor areas.A description is also given of model parameters, some important assumptions, data
requirements, technical information such as the computing platform, a list of examples where the approach has been used, notes on the model history as well as any additional

xii
useful features of an approach. Some advantages, disadvantages and limitations of each of the 20 approaches are listed, together with notes on the ease of presentation of model outputs and the user-level of programming and mathematical skills required.
The most widely used approach is undoubtedly ECOPATH with ECOSIM (EwE), which is likely to remain a forerunner given the user friendly interface and on-going improvements to the software. However, faced with incomplete knowledge of ecosystem functioning, there has been increasing recognition that definitive conclusions cannot be drawn from a single model structure. There has thus been a parallel increase in efforts to modularize models so that different components can be easily substituted. Spatial considerations are similarly playing an increasingly important role in the development of ecosystem modelling approaches. Nonetheless, even some of the earliest approaches such as Multi-species Virtual Population Analysis (MSVPA) are still being used and improved. A summary is presented of some recent advances being planned for the different modelling approaches.
A set of commonly asked questions pertaining to EAF is identified and the potential of the various modelling approaches to address these questions is assessed. This preliminary analysis suggests that a range of different model constructions are needed; no one model is necessarily superior to all others in all respects. EwE is capable of addressing the widest range of topical EAF research questions. The model considered to show the greatest potential to contribute to practical fisheries management advice (such as changes to total allowable catch (TAC)) is Globally applicable Area Disaggregated General Ecosystem Toolbox (GADGET). Although still under development, this is currently the model with the most rigorous statistical framework for testing multi-species based management advice. It is also the modelling approach most capable of detailed sensitivity investigations to alternative growth, consumption and recruitment formulations. Additionally, it operates within a spatial framework and overcomes many of the associated computing constraints by running on multiple computers in parallel. Nonetheless, it too has limitations in that it is capable of representing only a relatively small component of the ecosystem and is not suitable for all systems. Models such as EwE and ATLANTIS are more appropriate for addressing broader questions.
The incorporation of ecosystem considerations into current Operational Management Procedures (OMPs) and other management strategies for marine resources is also discussed. ATLANTIS is ranked the best operating model within a simulation testing framework. Unfortunately it seems unlikely that sufficient data will be available to implement an ecosystem operating model framework in most marine systems. Further development is encouraged of approaches that take explicit account of uncertainty and management issues, for example, through the use of a simulation framework incorporating feedback control rules used in actual management.
Approaches such as the Extended Single-Species Assessment Models (ESAM) are often a good first step. Similarly, examples are given of equations that provide a useful starting template for multi-species modelling approaches, being built up slowly and in synchrony with data availability. Some of the less well-known (in a global context) modelling approaches are shown to include some additional useful features, for example, SEAPODYM’s (Spatial Environmental POpulation DYnamics Model) habitat index and OSMOSE’s (Object-oriented Simulator of Marine ecOSystem Exploitation) explorations with simple individual predation rules.
This report is a first step towards initiating more detailed discussions of these models, their uses and their limitations. This process is considered critical in moving forward the development of methods for assessing indirect ecosystem impacts of fisheries. Arguments are presented that whereas a good range of models has been developed for the task of EAF, greater focus is needed on strengthening these approaches and conducting the necessary data collection and experimentation to underpin confidence in these approaches. Would-be model developers are encouraged to assess whether

xiii
they would be adding anything to the current suite of models, given that approaches such as EwE and GADGET have benefited from an extensive network of collaborators over a number of years.
Considerable scope exists for significant future developments in multi-species and ecosystem models, particularly with respect to their use as tools in EAF. Some of the major areas of current research include:
• investigations pertaining to the effects of model complexity – in particular, the effect of specific formulations (often feeding functional responses) on model outputs;
• the treatment of uncertainty;• representation of socio-economic factors and human behavioural drivers;• multiple sector dynamics and management (with OMPs being an increasingly
popular method); and• the effective (and feasible) representation of biodiversity.


1
1. Introduction
The 21st century has ushered in a new era in fisheries management in which the prevalent terminology is the ecosystem approach to fisheries (EAF; Garcia et al., 2003) in contrast to more “dated” terms such as surplus production and single-species models. This is at least in part attributable to the increasing pressure exerted on species subject to fishing (and interconnected species in the ecosystem) and a growing realization of the need to consider broader socioeconomic effects as well as the ecosystem effects of fishing. Although computational restraints are much less of a problem due to improvements in modern computing power, progress in this field is still (and may always be!) impeded by imprecise parameter estimation given limited and noisy data and the associated limited understanding of ecosystem functioning.
Nonetheless, as powerful new tools such as ECOPATH with ECOSIM (EwE) (Polovina, 1984; Christensen and Pauly, 1992; Walters, Christensen and Pauly, 1997; Walters et al., 2000) are further developed and distributed, there is a growing body of scientists being drawn to this challenging new field. In practice, single species models are still the dominant tool worldwide for providing timeous and reliable scientific advice regarding the management of commercially valuable stocks. As single-species and EAF approaches become increasingly merged in the development of management advice, it is important that modellers have a good understanding of both single-species and ecosystem approaches. Multi-species considerations are yet to be formally included in the stock assessment approaches for the major fisheries resources globally. However, considerable work has been conducted worldwide to construct multi-species models and, more recently, in implementing EwE (Walters, Christensen and Pauly, 1997), which is currently the most widely utilized approach worldwide.
The aim of this report is to review the methods available for assessing the impacts of interactions between species and fisheries, in particular ecological (indirect) interactions and their implications for fisheries management. A wide variety of different methods are at hand to address this issue (e.g. Pope et al., 1988; Larska and Wootton, 1998; Boyd and Murray, 2001; Eisenack and Kropp, 2001; Kaschner et al., 2001; Crawford, 2004; Dalton, 2004; Drapeau et al., 2004; Yemane, Field and Griffiths, 2004; Daan et al., 2005), but the focus here is specifically restricted to modelling methods. Given that this is a large topic on its own, the field of ecosystem indicators (e.g. Rice, 2000) is not discussed and the reader is referred to the International Council for the Exploration of the Sea (ICES) Journal of Marine Science vol. 62, 2005 for a recent review of this topic. The scope of this report is on multi-species population dynamics effects, rather than on the full range of ecosystem aspects of fishing encompassing, for example, environmental effects and technical interactions (e.g. bycatch issues), although minor mention of these is made. Although some of the discussions are relevant to freshwater or estuarine fisheries, this report focuses only on marine fisheries. The potential of approaches to contribute broadly to fisheries management is discussed as well as their more specific potential to contribute to practical advice. To achieve the latter, a multi-species modelling approach should provide at least qualitative and ideally defensible quantitative guidance as to the management of marine natural resources. One of the most obvious uses relates to modifications in annual allowable catch levels deemed necessary because of the predicted effects that fishing on a target species will have on other components of the ecosystem (Plagányi and Butterworth, 2004), but ultimately these tools may be called upon to give advice on all potential management levels (including spatial management, temporal closures, gear restrictions and discarding

Models for an ecosystem approach to fisheries2
practices).The first part of this review takes a broad overview of some of the most commonly
applied multi-species/ecosystem approaches to fisheries management. The next section summarizes the results and conclusions reached by previous studies and workshops on the subject, including the ICES/SCOR Symposium on Ecosystem Effects of Fishing (ICES Journal of Marine Science 57, n.3, June 2000), the Workshop on the Use of Ecosystem Models to Investigate Multi-species Management Strategies for Capture Fisheries (Pitcher and Cochrane, 2002), the IWC Modelling Workshop on Cetacean-Fishery Competition (Journal of Cetacean Res. Manage. 6 (Suppl.) 2004) and the Workshop on Ecosystem Approaches to Fisheries in the southern Benguela (African Journal of Marine Science 26, 2004).
The need for an EAF is well recognized and indeed mandated. However, there is still a need for, on the one hand, many ecosystem modellers to better acquaint themselves with the practical realities of providing reliable management advice and, on the other hand, for single-species modellers to step back from the often frantic process of conducting stock assessments and use their expertise to guide the development and implementation of multi-species management tools. Given the potentially large scope of this study, the focus has been restricted to the most widely-applied or well-known approaches as well as those considered by the author to show promise in advancing this field. This manuscript is not intended as a final authoritative view to compare the different modelling approaches but is rather a working document to assist and direct further discussion of the various modelling approaches.
The choice of an appropriate model depends not only on the question to be addressed but also on other logistical constraints such as the person power and associated costs. The various modelling approaches discussed will roughly be compared giving consideration to the above.

3
2. Review of current modelling approaches
An overview is given below of some of the current approaches to modelling multi-species/ecosystem effects in the context of their possible application to fisheries management. This review is by no means exhaustive but has attempted to capture broadly the main model types that are either well known and widely available and show potential as a tool in this context. The aim here was thus not to exactly describe every multi-species/ecosystem model developed – models such as that by May et al. (1979), Beddington and May (1982), Skeleton bulk biomass ecosystem model (SKEBUB) (Bax, 1985) and Pech et al. (2001) were not deemed to meet these criteria but future revisions will take into account approaches that are sufficiently strongly supported. Moreover, the purpose of comparing the models is to assist in greater understanding of the models available and in making informed decisions in instances where resources are limited and hence it is important to select the best possible model upfront. It is acknowledged that the choice of method depends on the question and research objectives and that the ideal (if not always practical) scenario is one in which a suite of models is developed and compared (Fulton, Smith and Johnson, 2003a). Moreover, in ideal circumstances the suite of models will be drawn from a wide range of types, as the model structure (and even its development history) can have significant implications for the potential range of dynamics displayed (Fulton and Smith, 2004).
Plagányi and Butterworth (2004) outline an increasing hierarchy of multi-species model complexity to account for biological interactions that pertain to commercially important species. It is important to appreciate that increasing model complexity to take better account of biological realism which can lead to an associated increase in scientific uncertainty, as a result both of lack of knowledge of functional relationships and of imprecision in estimates of the associated parameter values. The reader is referred to other texts (e.g. Fulton, Smith and Johnson, 2003a; Raick, Soetaert and Grégoire, 2006) for further discussions dealing with the important issue of model complexity. The reader is also referred to the excellent text of Walters and Martell (2004) for an overview of food web modelling, parameterization of ecosystem models and strategies for ecosystem management.
The simplest multi-species models explore the question of how to harvest a target population appropriately, whilst simultaneously accounting for the needs of a predator dependent on that population as prey. If both predator and prey are subject to exploitation, it is necessary to simultaneously model both predator and prey populations as functions of physical variability, catch levels and the strength and nature of the functional relationship between the two populations. If an intermediate trophic level species is targeted (in a “wasp-waist” system, see Cury et al., 2000 in particular), it may be necessary to account for the functional relationships between the targeted species and its key predators, competitors and prey items. In this case appropriate catch levels are likely to be affected by variability in both upper and lower trophic levels. The most complex multi-species models strive to suggest modifications in the catch level of a species based on the direct and indirect predation and competition effects associated with the simultaneous removal of other food web components. In addition, it may be necessary to consider negative feedback loops such as cannibalism. Other factors such as human and fleet dynamics may also play a role at various levels, but consideration of these factors was considered beyond the scope of this report.

Models for an ecosystem approach to fisheries4
Models and their categorization The different models discussed can broadly be categorized according to the framework presented in Hollowed et al. (2000) which has been slightly modified and updated as shown in Figure 1. Models which represent only a subset of the ecosystem are termed Minimally Realistic Models and typically focus on inter-species interactions only and hence may also be termed Dynamic multi-species models. They may however also include some consideration of physical and environmental forcing actors. In contrast, Dynamic system models incorporate the environment and lower trophic levels, although this is often at the expense of not representing the higher trophic levels in sufficient detail (when considered in a fisheries management context). In classifying models further, it is important to differentiate between models that take age structure and spatial aspects into account (Figure 1). Finally, the term Whole ecosystem models is reserved for models that attempt to represent all trophic levels in an ecosystem in a balanced way. Note further that Figure 1 is necessarily simplistic as it does not reflect other important details relevant to the organization and regulation of ecological systems (M. Koen-Alonso, pers. comm.) – for example, modelling predation as size-dependent produces different results to models assuming age-dependent predation (de Roos, Persson and McCauley, 2003; de Roos and Persson, 2005). This review focuses on the following types of models (Figure 1, Table 1):
- Whole ecosystem models: models that attempt to take into account all trophic levels in the ecosystem, including ECOPATH (Polovina, 1984; Christensen and Pauly, 1992), ECOSIM (Walters, Christensen and Pauly, 1997) and ECOSPACE (Walters et al., 2000) and other bioenergetic trophodynamics models (e.g. Yodzis, 1998; Koen-Alonso and Yodzis, 2005);
FIGURE 1A flowchart summarizing the classification of the various models listed in Table 1.
The flowchart has been modified and updated from that presented in Hollowed et al. (2000). Boxes with models covered in this report are highlighted
Biologicalinteractionsdescribed
Predator preyfeedback
Handles theenvironmentand lowertrophic levels
Technical interactionmodels MSYPRMurawski 1984
Predators added to single-speciesmodels e.g. SEASTARGulland 1983; Livingston and Methot1998; Hollowed et al. 2000; Plagányi2004; Tjelmeland and Lindstrøm 2005
No
No
Yes
Yes
Handlesage/sizestructureHandles age
structure
No Yes
Aggregate systemmodels e.g. EwE,SKEBUB, SSEM
Spatial dynamic systemsmodels e.g. ATLANTIS,ERSEM, SEAPODYM
Multispecies ProductionModels e.g. Horbowy 2005
YesNo
Dynamic multi-species modelsBORMICON, GADGET, MRMs,MSVPA& MSFOR, MSM,MULTSPEC, OSMOSE
No
Handlesspatialstructure
Yes
No
Dynamic systems modelse.g. some recent EwEapplications
YesHandlesspatialstructureNo
Spatial aggregatesystems models e.g.ECOSPACE
Yes

5
TABLE 1Alphabetical list of model acronyms, full names and references to primary developers/users
Model Name References
ATLANTIS ATLANTIS Fulton, Smith and Johnson, 2004; Fulton, Smith and Punt, 2004; Fulton, Smith and Punt, 2005
Bioenergetic/allometric model
Multi-species trophodynamic model using bioenergetic and allometric approach
Yodzis and Innes, 1992; Yodzis, 1998; Koen-Alonso and Yodzis 2005
BORMICON BOReal Migration and CONsumption model Bogstad, Hauge and Ulltang, 1997; Stefansson and Palsson 1998
CCAMLR models Commission for the Conservation of Antarctic Marine Living Resources
Butterworth and Thomson 1995; Thomson et al., 2000; Mori and Butterworth 2004, 2005, 2006
EPOC Ecosystem Productivity Ocean Climate model Constable 2005, 2006
ERSEM II European Regional Seas Ecosystem Model Baretta, Baretta-Bekker and Ruardij, 1996; Baretta-Bekker and Baretta, 1997~; Download from http://www.ifm.uni-hamburg.de/~wwwem/dow/ERSEM/
ESAM Extended Single-species Assessment Models - Models that are extensions to more conventional single-species stock assessment models
Livingston and Methot, 1998; Hollowed et al., 2000; Plaganyi, 2004; Tjelmeland and Lindstrøm, 2005
EwE ECOPATH with ECOSIM Polovina, 1984; Christensen and Pauly, 1992; Walters, Christensen and Pauly, 1997; Walters et al., 2000; Christensen and Walters, 2000, 2004; Christensen, Walters and Pauly, 2000; Website: www.ecopath.org
GADGET Globally applicable Area Disaggregated General Ecosystem Toolbox (GADGET); old name was BORMICON (BOReal Migration and CONsumption model); Fleksibest is a variant of Gadget.
Trenkel, Pinnegar and Tidd, 2004; Begley and Howell, 2004; Taylor et al., 2004; Taylor and Stefansson, 2004; Begley, 2005. Website: www.hafro.is/gadget,
GEEM General Equilibrium Ecosystem Model Tschirhart and Finnoff, 2003; Tschirhart, 2004; Eichner and Tschirhart (in press)
IBM Individual-Based Models (e.g. OSMOSE) DeAngelis and Gross, 1992; Shin and Cury, 2001; Ginot, LePage and Souissi, 2002; Ginot et al., 2006; Alonzo, Switzer and Mangel, 2003; Colomb et al., 2004; Kirby et al., 2004
IGBEM Integrated Generic Bay Ecosystem Model Fulton, 2001; Fulton, Smith and Johnson, 2004
INVITRO INVITRO Gray et al., 2004; Gray et al., 2006
KPFM Krill-Predator-Fishery Model (KPFM, also KPFM2) Watters et al., 2005, 2006
MRM Minimally Realistic Model E.g. Punt and Butterworth, 1995
MSM Multi-species Statistical Model Jurado-Molina, Livingston and Ianelli, 2005; Jurado-Molina, Livingston and Gallucci, 2005
MSVPA and MSFOR Multi-species Virtual Population Analysis and Multi-species Forecasting Model
Helgason and Gislason, 1979; Pope, 1979, 1991; Sparre, 1991; Magnússon, 1995; Vinther, 2001
MULTSPEC Multi-species model for the Barents Sea; simplified version is AGGMULT which is also connected to a ECONMULT - a model describing the economies of the fishing fleet
Bogstad, Hauge and Ulltang, 1997; Tjelmeland and Bogstad, 1998
MOOVES Marine Object-Oriented Virtual Ecosystem Simulator
Colomb et al., 2004
OSMOSE Object-oriented Simulator of Marine ecOSystem Exploitation
Shin and Cury, 2001, 2004
SEAPODYM Spatial Ecosystem and Population Dynamics Model (SEAPODYM) - previously Spatial Environmental Population Dynamics Model (SEPODYM)
Bertignac, Lehodey and Hampton, 1998; Lehodey et al. 1998; Lehodey, 2001; Lehodey, Chai and Hampton, 2003; www.seapodym.org
SEASTAR Stock Estimation with Adjustable Survey observation model and TAg-Return data
Tjelmeland and Lindstrøm, 2005
SKEBUB SKEleton BUlk Biomass ecosystem model Bax, 1985
SMOM Spatial Multi-species Operating Model Plagányi and Butterworth, 2006 a,b
SSEM Shallow Seas Ecological Model Sekine et al., 1991
SystMod System Model for the Norwegian and Barents Sea Hamre and Hattlebakk, 1998
Review of current modelling approaches
Models for an ecosystem approach to fisheries6
- Dynamic multi-species models or Minimum Realistic Models: models restricted to represent a limited number of species most likely to have important interactions with a target species of interest, for example, Punt and Butterworth (1995). The term Minimally Realistic Model (MRM) was first coined by Butterworth and Harwood (1991) in response to recommendations to this effect made at a preceding international workshop. Other models that fall into this category include Multi-species Virtual Population Analysis MSVPA and MSFOR (Pope, 1991; Sparre, 1991; Magnússon, 1995; Vinther, 2001); Scenario Barents Sea (Schweder, Hagen and Hatlebakk, 2000); Systmod (System Model) (Hamre and Hattlebakk, 1998); MULTSPEC (Bogstad, Hauge and Ulltang, 1997; Tjelmeland and Bogstad, 1998); BORMICON (A BOReal Migration and CONsumption model) (Stefansson and Palsson, 1998); SEASTAR; GADGET (Globally applicable Area-Disaggregated General Ecosystem Toolbox) (see e.g. webpage http://www.hafro.is/gadget; coordinator G. Stefánsson); CCAMLR predator-prey models (e.g. Butterworth and Thomson, 1995; Thomson et al., 2000), Individual-Based Models (IBM) and MSM (Multi-species Statistical Models) (Jurado-Molina, Livingston and Ianelli, 2005);
- Dynamic System Models: models that attempt to represent both bottom-up (physical) and top-down (biological) forces interacting in an ecosystem, including Individual-Based Models (IBM), OSMOSE (Object-oriented Simulator of Marine ecOSystem Exploitation) (Shin and Cury, 2001; Shin, Shannon and Cury, 2004), INVITRO (Gray et al., 2006), biogeochemical models e.g. IGBEM (Integrated Generic Bay Ecosystem Model) (Fulton et al., 2004) ATLANTIS (Fulton and Smith, 2004) and SEPODYM/SEAPODYM (Spatial Environmental POpulation DYnamics Model) (Bertignac, Lehodey and Hampton, 1998; Lehodey et al., 1998; Lehodey, 2001; Lehodey, Chai and Hampton, 2003).
- Extensions of single-species assessment models: models that expand on current single-species assessment models taking only a few additional interactions into account (e.g. Livingston and Methot, 1998, Hollowed et al., 2000; Tjelmeland and Lindstrøm, 2005). For convenience, these models are here termed ESAM (Extended Single-species Assessment Models).
Models can be classified as Minimally Realistic Models (MRM) on the one hand and “ecosystem” models on the other. A MRM seeks to include only those species considered likely to have important interactions with the species of primary interest. The MRM group includes MSVPA and its derivatives which project into the future (e.g. Vinther, 2001), MULTSPEC, BORMICON/GADGET, Seastar, Scenario Barents Sea and the original seal-hake MRM of Punt and Butterworth (1995). Shared characteristics of these models include the following (NAMMCO, 2002):
• they are system specific;• only a small selected component of the ecosystem is modelled, and• lower trophic levels and primary production are modelled as constant or varying
stochastically.In contrast, the ATLANTIS and ECOPATH/ECOSIM models, for example, are
generic and capable of explicitly including most ecosystem components as well as incorporating lower trophic levels and primary production, though naturally they can also be applied in a simplified form closer to the MRM concept.
In discussing these different modelling approaches below, it is useful to further classify models (see Table 2) as either “Efficient predator” models or “Hungry predator” models (Butterworth and Plagányi, 2004). In the former set of models the predator is assumed to always get its daily ration (e.g. MSVPA, MULTSPEC), though the species composition of this ration may change with varying prey abundances over time. In contrast, in the latter set, predators are assumed to compete with others of the same (and possibly other) species for limited vulnerable proportions of prey (e.g. “foraging arena”-based models applied in approaches such as ECOSIM).

7
TABLE 2Categorization of models according to feeding relationships assumed as well as whether the primary model focus is on the effects of non-target species on a commercial prey species, the effects of fishing on the population of interest or on effects operating in both directions
Model Model units (biomass or nutrient pools)
“Efficient predator” or “Hungry predator” model
Primary model focus
ATLANTIS Nutrient Hungry predator Effects in both directions
Bioenergetic/allometric models Biomass Both Effects in both directions
CCAMLR models Biomass Efficient predator Effects of fisheries on protected or other species
ERSEM II Nutrient Hungry predator Effects in both directions
EwE Biomass Hungry predator Effects in both directions
GADGET Biomass Both Ecosystem effects on target population
IGBEM Nutrient Hungry predator Ecosystem effects on target population
Individual-based Models (IBM) Biomass Efficient predator Ecosystem effects on target population
INVITRO Biomass Efficient/Hungry1 predator
Effects in both directions
KPFM Biomass Efficient predator Effects of fisheries on protected or other species
MRM (Punt and Butterworth 1995)
Biomass Efficient predator Ecosystem effects on target population
MSM Biomass Mixed Limited effects in both directions
MSVPA and MSFOR Biomass Efficient predator Ecosystem effects on target population
MULTSPEC Biomass Efficient predator Ecosystem effects on target population
OSMOSE Biomass at different levels of aggregation
Efficient predator but can starve
Effects in both directions
ESAM Biomass Efficient predator Ecosystem effects on target population
SEAPODYM Biomass Efficient predator Ecosystem effects on target population
SEASTAR Biomass Efficient predator Ecosystem effects on target population
SMOM Biomass Efficient predator Effects of fisheries on protected or other species
SSEM Nutrient Efficient predator Ecosystem effects on target population
1Dependent on agent types used
In general, the models presented also differ substantially (Table 2) in terms of whether they represent:
i. only the effects of non-target species on a commercial prey species (e.g. MSVPA, BORMICON and other models were originally constructed with the primary aim of assessing fish stocks);
ii. only the effects of fishing (e.g. resulting in prey depletion) on the population of interest (e.g. CCAMLR models constructed with this aim in mind); or
iii. effects operating in both directions (e.g. ECOSIM).
Review of current modelling approaches
Models for an ecosystem approach to fisheries8
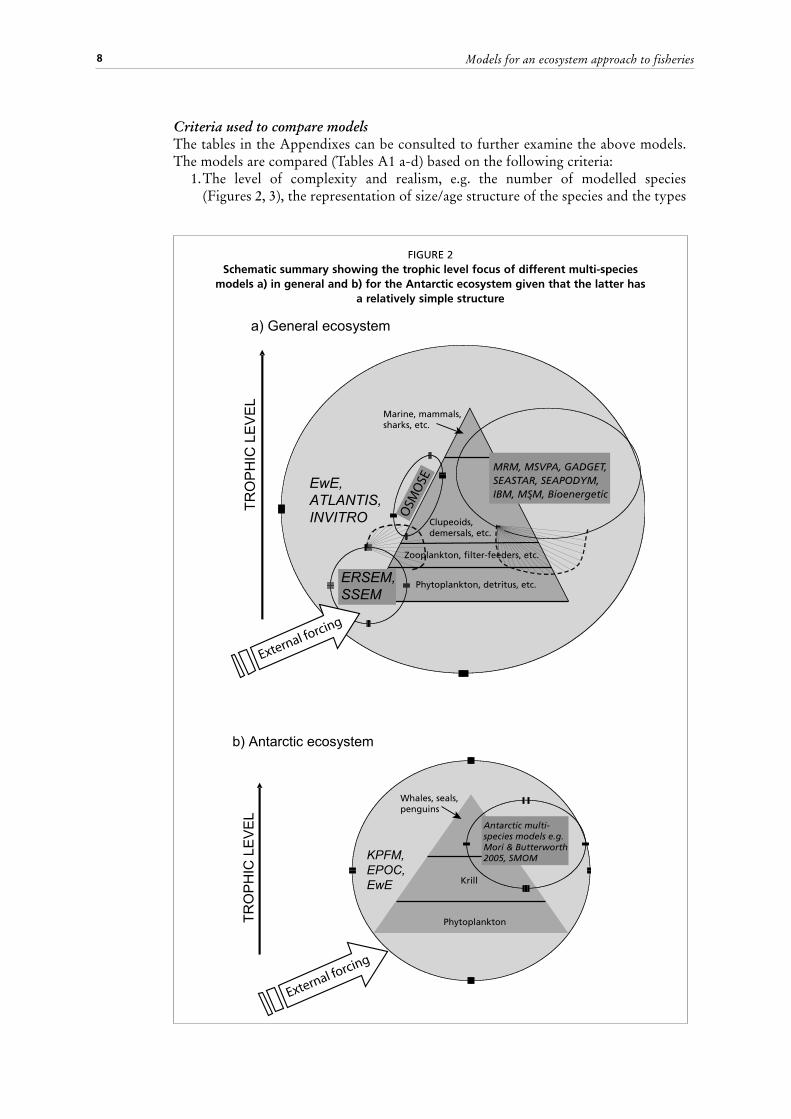
Criteria used to compare modelsThe tables in the Appendixes can be consulted to further examine the above models. The models are compared (Tables A1 a-d) based on the following criteria:
1. The level of complexity and realism, e.g. the number of modelled species (Figures 2, 3), the representation of size/age structure of the species and the types
FIGURE 2Schematic summary showing the trophic level focus of different multi-species
models a) in general and b) for the Antarctic ecosystem given that the latter has a relatively simple structure
����������������
����������������
������������������������������������������������������������
���
���
�����������������������������
��������������������������
��������������������������������
�����������������������������
�������������
�����
�����������������������
���������������������������������������������������������������

9
of represented processes (physical and biological). Although it is not the subject of the report, brief commentary is provided regarding the representation of technical interactions or the direct ecosystem effects of fisheries (e.g. bycatch);
2. The types of functional responses of predators to changes in abundance of prey species and their consequences and limitations;
3. How uncertainties in model structure, parameters and data are treated;4. How environmental effects and interactions with non-target species (e.g. marine
mammals; sea turtles; sea birds) are incorporated;5. The spatial representation of species interactions and habitat related processes;6. Model suitability for dealing with migratory species, i.e. species that cross
ecosystem boundaries;7. Where possible, model adequacy to allow the analysis of the different types of
management controls in use, such as effort control, minimum size, total allowable catch, protected areas and seasons;
8. Model adequacy to allow the assessment of the effects of short, medium and long-term ecosystem changes;
9. Model suitability to conduct assessments and policy exploration, considering its potential use to conduct historical reconstruction of resources to describe the current status of the ecosystem and to evaluate the potential effects of various kinds of decisions (short and long term);
10. Model transparency of operation and ease of use;11. Data requirements and model suitability for data poor areas.A second set of tables (Tables A2 a-d) summarizes for each of the 20 models
compared, a description of model parameters, some important assumptions, data requirements, technical information such as the computing platform, a list of examples where used, notes on the model history as well as any additional useful features of an approach. Finally, a summary is presented in a third set of tables (Tables A3 a-d) of some advantages, disadvantages and limitations of each method, as well as notes
112
EwE
NO.O
FSPECIES/C
OMPONENTS 30 +
20
10
5
3
2
ATLA
NTIS
ERSEM
INVITRO
OSMOSE
GADGET
BORMICON
MSVPA
MULTSPEC
MSM
SEAPODYM
ESAM
MRM
SEASTAR
Bioenergenetic
type
FIGURE 3Schematic summarizing (approximately) the typical (current) number of modelled species or model compartments for selected models as listed in Table 1. The solid
rectangles represent the range whereas the dashed lines indicate either rare/unusual applications or intended future extensions to the model.
Review of current modelling approaches

Models for an ecosystem approach to fisheries10
on the ease of presentation of model outputs and the user-level of programming and mathematical skills required.
A preliminary comparison is attempted of the potential of the different modelling approaches to address a range of Ecosystem-Based Fisheries Management (EBFM) research questions outlined in the text (Tables A4).
Discussion is also provided regarding the incorporation of ecosystem considerations into current Operational Management Procedures (OMPs) and other management strategies for marine resources. An OMP is the combination of a prescribed set of data to be collected and the analysis procedure to be applied to these data, to provide a scientific recommendation for a management measure, such as a Total Allowable Catch (TAC), for a resource (Butterworth, Cochrane and Oliveira, 1997; Butterworth and Punt, 1999; Cooke, 1999). A key aspect of the OMP approach is that the analysis procedure has been tested across a wide range of scenarios for the underlying dynamics of the resource using computer simulation. This is to ensure that the likely performance of the OMP in terms of attributes such as (high) expected catch and (low) risk of unintended depletion is reasonably robust to the primary uncertainties about such dynamics. By way of example, this approach is used at present to manage South Africa’s three most valuable fisheries: for hake, for pilchard and anchovy and for west coast rock lobster (De Oliveira et al., 1998; Butterworth and Punt, 1999; Geromont et al., 1999) and initial progress has been made in including ecosystem considerations into these OMPs (Plagányi et al., 2007).
In what follows, a relatively brief description of the various modelling approaches is presented with much of the supplementary information given in the Tables. The author’s discretion has been used in drawing the reader’s attention to aspects of the various modelling approaches that may be of interest and hence, unlike in the Tables, model descriptions given in the text hereunder are presented at different levels of details.
2.1 WHOLE ECOSYSTEM AND DYNAMIC SYSTEM MODELSSuch approaches attempt to take all trophic levels in the ecosystem into account, from primary producers to top predators. Quite sweeping simplifications and assumptions may need to be made in this process. Examples are the ECOPATH with ECOSIM (EwE) framework, which is usually applied in this manner and biogeochemical models such as IGBEM and ATLANTIS (Fulton, 2001; Fulton, Smith and Johnson, 2004; Fulton, Smith and Punt, 2004).
2.1.1 ECOPATH with ECOSIM (EwE)Given that the ECOPATH (Polovina 1984; Christensen and Pauly, 1992), ECOSIM (Walters, Christensen and Pauly, 1997) and ECOSPACE (Walters, Pauly and Christensen, 1999) suite is currently dominating attempts worldwide to provide information on how ecosystems are likely to respond to changes in fishery management practices, it is important that the applicability of these approaches to answering questions in this context be carefully reviewed (Aydin and Friday, 2001; Aydin, 2004; Aydin and Gaichas 2006; Plagányi and Butterworth, 2004). A description of the ECOPATH with ECOSIM approach is given below (see also www.ecopath.org):
Briefly, the fundamental ECOPATH mass balance equation is based on that originally proposed by Polovina (1984). This balance for each functional group i in an ecosystem (detritus excepted) is described by (Walters and Martell, 2004):
is described by (Walters and Martell 2004): � � � � iii
jjijjiii NMBACBDCBQEEBPB �������� � (1)
where B and B are the biomasses of i and the consumers (j) of i respectively;
(1)
where Bi and Bj are the biomasses of i and the consumers (j) of i respectively;
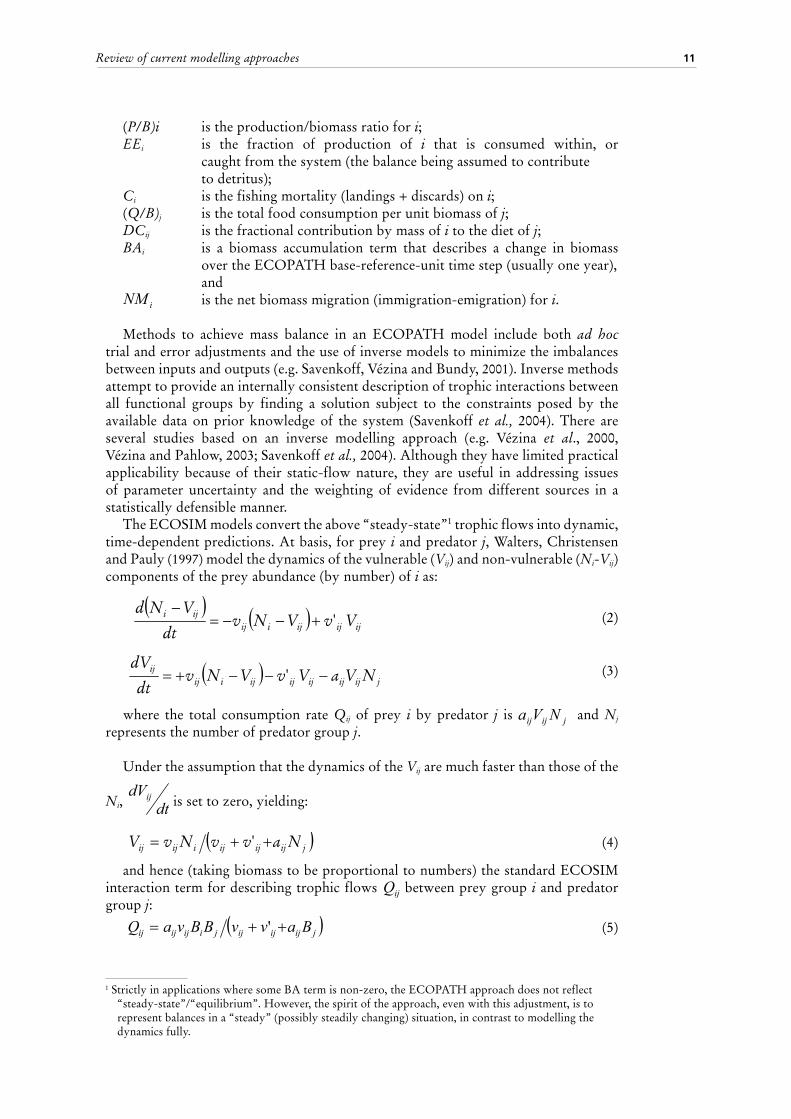
11
(P/B)i is the production/biomass ratio for i;EEi is the fraction of production of i that is consumed within, or
caught from the system (the balance being assumed to contribute to detritus);Ci is the fishing mortality (landings + discards) on i;(Q/B)j is the total food consumption per unit biomass of j; DCij is the fractional contribution by mass of i to the diet of j; BAi is a biomass accumulation term that describes a change in biomass
over the ECOPATH base-reference-unit time step (usually one year), and
iNM is the net biomass migration (immigration-emigration) for is the net biomass migration (immigration-emigration) for i.
Methods to achieve mass balance in an ECOPATH model include both ad hoc trial and error adjustments and the use of inverse models to minimize the imbalances between inputs and outputs (e.g. Savenkoff, Vézina and Bundy, 2001). Inverse methods attempt to provide an internally consistent description of trophic interactions between all functional groups by finding a solution subject to the constraints posed by the available data on prior knowledge of the system (Savenkoff et al., 2004). There are several studies based on an inverse modelling approach (e.g. Vézina et al., 2000, Vézina and Pahlow, 2003; Savenkoff et al., 2004). Although they have limited practical applicability because of their static-flow nature, they are useful in addressing issues of parameter uncertainty and the weighting of evidence from different sources in a statistically defensible manner.
The ECOSIM models convert the above “steady-state”1 trophic flows into dynamic, time-dependent predictions. At basis, for prey i and predator j, Walters, Christensen and Pauly (1997) model the dynamics of the vulnerable (Vij) and non-vulnerable (Ni-Vij) components of the prey abundance (by number) of i as:
� � � � ijijijiijiji VvVNv
dt
VNd'����
� (2)
(2)
� � jijijijijijiijij NVaVvVNv
dt
dV����� ' (3)
(3)
where the total consumption rate Qij of prey i by predator j is is jijij NVa , and and Nj represents the number of predator group j.
Under the assumption that the dynamics of the Vij are much faster than those of the
Ni, are much faster than those of the Ni, dtdVij is set to zero, yielding:
� �jijijijiijij NavvNvV ��� ' (4)
(4)
and hence (taking biomass to be proportional to numbers) the standard ECOSIM interaction term for describing trophic flows
and hence (taking biomass to be proportional term form describing trophic flows ijQ between prey group between prey group i and predator
group j:
� �jijijijjiijijij BavvBBvaQ ��� ' (5)
(5)
1 Strictly in applications where some BA term is non-zero, the ECOPATH approach does not reflect “steady-state”/“equilibrium”. However, the spirit of the approach, even with this adjustment, is to represent balances in a “steady” (possibly steadily changing) situation, in contrast to modelling the dynamics fully.
Review of current modelling approaches
Models for an ecosystem approach to fisheries12
where where ija is the rate of effective search for prey is the rate of effective search for prey i by predator j and , and ijv , , , ijv' are prey are prey vulnerability parameters.
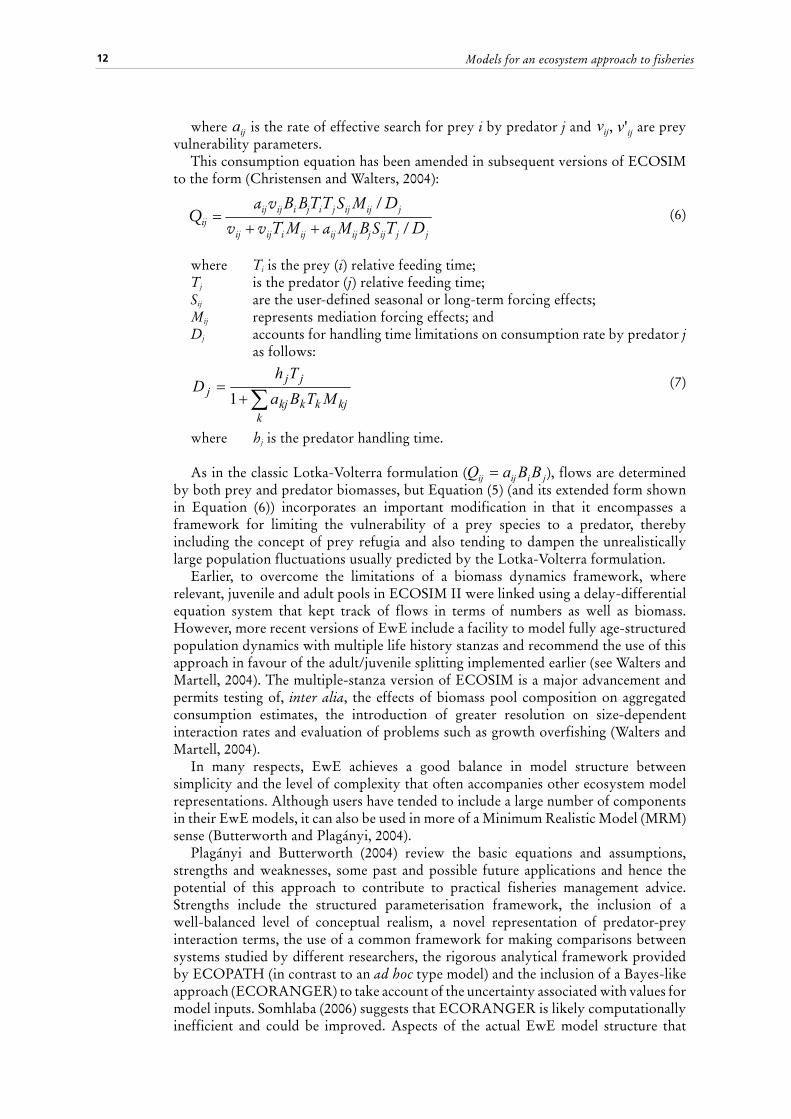
This consumption equation has been amended in subsequent versions of ECOSIM to the form (Christensen and Walters, 2004):
(6)
where Ti is the prey (i) relative feeding time;Tj is the predator (j) relative feeding time;Sij are the user-defined seasonal or long-term forcing effects;Mij represents mediation forcing effects; and Dj accounts for handling time limitations on consumption rate by predator j
as follows:
��
�
kkjkkkj
jjj MTBa
ThD
1 (7)
(7)
where hj is the predator handling time.
As in the classic Lotka-Volterra formulation (As in the classic Lotka-Volterra formulation ( jiijij BBaQ � ), flows are determined by both prey ), flows are determined by both prey and predator biomasses, but Equation (5) (and its extended form shown in Equation (6)) incorporates an important modification in that it encompasses a framework for limiting the vulnerability of a prey species to a predator, thereby including the concept of prey refugia and also tending to dampen the unrealistically large population fluctuations usually predicted by the Lotka-Volterra formulation.
Earlier, to overcome the limitations of a biomass dynamics framework, where relevant, juvenile and adult pools in ECOSIM II were linked using a delay-differential equation system that kept track of flows in terms of numbers as well as biomass. However, more recent versions of EwE include a facility to model fully age-structured population dynamics with multiple life history stanzas and recommend the use of this approach in favour of the adult/juvenile splitting implemented earlier (see Walters and Martell, 2004). The multiple-stanza version of ECOSIM is a major advancement and permits testing of, inter alia, the effects of biomass pool composition on aggregated consumption estimates, the introduction of greater resolution on size-dependent interaction rates and evaluation of problems such as growth overfishing (Walters and Martell, 2004).
In many respects, EwE achieves a good balance in model structure between simplicity and the level of complexity that often accompanies other ecosystem model representations. Although users have tended to include a large number of components in their EwE models, it can also be used in more of a Minimum Realistic Model (MRM) sense (Butterworth and Plagányi, 2004).
Plagányi and Butterworth (2004) review the basic equations and assumptions, strengths and weaknesses, some past and possible future applications and hence the potential of this approach to contribute to practical fisheries management advice. Strengths include the structured parameterisation framework, the inclusion of a well-balanced level of conceptual realism, a novel representation of predator-prey interaction terms, the use of a common framework for making comparisons between systems studied by different researchers, the rigorous analytical framework provided by ECOPATH (in contrast to an ad hoc type model) and the inclusion of a Bayes-like approach (ECORANGER) to take account of the uncertainty associated with values for model inputs. Somhlaba (2006) suggests that ECORANGER is likely computationally inefficient and could be improved. Aspects of the actual EwE model structure that
����������������
��������������� ����������
����������
�
�

13
may merit further attention or are potentially problematic include the need to initiate projections from “steady state” ECOPATH solutions2 (in standard applications), the questionable handling of life history responses such as compensatory changes in the natural mortality rates of marine mammals, possible problems in extrapolating from the microscale to the macroscale3, as well as some (though not too far-reaching in practice) mathematical inconsistencies in the underlying equations.
Many of the shortcomings of EwE applications are attributable to user misuse (or insufficient use) rather than to the actual model structure. Uncritical use of default parameter settings or setting of vulnerability values to the same constant for all species is unsatisfactory, because inter alia it assumes the same prior exploitation history for all species and may result in overcompensatory stock–recruitment relationships. There is a paucity of systematic and stepwise investigations into model behaviour and properties. As with all multi-species approaches, the major limitation in applying the EwE approach lies in the quality and quantity of available data. Plagányi and Butterworth (2004) argue that current EwE applications generally do not adequately address uncertainty in data inputs and model structure. Recent improvements to the software that use a computer-automated iterative technique for mass-balancing Ecopath models are a step in the right direction in the sense that it incorporates a facility for Monte Carlo–based explorations of sensitivity to different starting conditions (Kavanagh et al., 2004). Nevertheless such developments must be used with care as dependence solely on such methods can see the modeler lose their sense of the model’s driving forces and many useful insights into system dynamics can be lost (E. Fulton, pers. comm.).
Implications of the ECOSIM interaction representationPlagányi and Butterworth (2004) argue that models need to be closely scrutinized to understand the extent to which underlying model assumptions predetermine or have implications for the results obtained. By virtue of EwE being packaged in a form that is readily digested by as many people as possible, undiscerning users can more readily use it as a “black-box”, neglecting to test the appropriateness of default parameter settings and conferring inadequate consideration to alternative functional relationships. The modular version currently under development is likely to improve issues of transparency and accessibility as well as forcing less discerning users to better explore the robustness of their model predictions.The ECOSIM “foraging arena” concept (see Walters, Christensen and Pauly, 1997; Walters and Kitchell, 2001; Walters and Martell, 2004) (see Equations 5 and 6), is a novel functional response representation that is supported to some extent by studies of fish populations. However, complications to be borne in mind include the fact that EwE cannot straightforwardly depict instances where the foraging arena V’s (vulnerability pools) are used simultaneously by multiple predators. This may be important in instances such as when a fish predator targets similar prey to those targeted by a marine mammal, or in which there are overlaps in the vulnerability pools available to marine mammals and to fisheries. EwE as presently configured implicitly assumes that direct interference between predator species (which it ignores) is inherently different from within-species interference (explicitly modelled by Equation (5)).
Caution is advised regarding earlier published results from ECOSIM in which users adopted earlier default settings. As explained in Plagányi and Butterworth (2004, 2005),
2 As with most modelling approaches, it is problematic to extrapolate to situations far from the initial/equilibrium state.
3 The point here is that if one has a particular functional form at the microscale and the parameters of that form vary from place to place, this does not mean that when you integrate that form over space the resultant functional form will necessarily lie within the set of forms covered by varying the parameters of the original form. This is a problem that persists with almost all models.
Review of current modelling approaches

Models for an ecosystem approach to fisheries14
these early versions of ECOSIM could not yield pure-replacement results when predicting the effects of a “predator” (a fishing fleet, say, that acts identically in terms of prey selection) in supplanting marine mammals. Expressed another way, this argument is that default parameter value selections for the model effectively hard-wired it to such an extent that they effectively swamped other signals pertinent to predicting the effects of a marine mammal reduction. Cooke (2002) similarly demonstrated through the use of a simple model that whether or not the reduction in cetaceans results in higher fishery yields than would otherwise, other things being equal, be obtained, depends critically on the assumed vulnerability of the fish to the whales. It is only under scenarios assuming a high vulnerability of fish to whales that fishery yields are predicted to be sensitive to the abundance of whales. These results highlight the importance of exploring robustness to assumptions related to consumption because a priori assumptions in this regard strongly influence model outcomes in terms of whether or not they yield pure-replacement results. Values other than default could of course be selected, for example, Mackinson et al. (2003) showed that particular combinations of ECOSIM settings can be used to produce alternative “emergent” forms of functional responses, specifically Type I and II, but not Type III, behaviours. In recent years Type II and Type III functional responses have been built into the ECOSIM general functional response, which even permits combinations of these variants and hence is now extremely flexible.
The current and future EwE A number of modifications and improvements have recently been added to EwE. Given fairly recent improvements in terms of age-structure handling, many of the older models have or are in the process of being modified and this is likely to result in valuable new insights. EwE has in the past been criticized for inadequate handling of issues of uncertainty (e.g. Plagányi and Butterworth, 2004) but the more recent versions include improved capabilities to balance models based on uncertainty, examine the impact of uncertainty as part of the management process and to quantify input parameter uncertainty to run ECOSIM using a Monte Carlo approach to fit to time series (V. Christensen, University of British Columbia, Canada, pers comm., Kavanagh et al., 2004). (see also Future Developments section).
2.1.2 Biogeochemical modelsThis category of models differs from the other models discussed in being nutrient-pool based rather than biomass-based (Table 2).
2.1.3 ERSEM and SSEM The European Regional Seas Ecosystem Model (ERSEM) was developed to simulate the annual cycles of carbon, nitrogen, phosphorus and silicon in the pelagic and benthic components of the North Sea (Baretta, Baretta-Bekker and Ruardij, 1996). ERSEM model version II (VII) is described in the special issue of the Journal of Sea Research Vol. 38 (Baretta-Bekker and Baretta, 1997). The model requires detailed data inputs and focuses on the phytoplankton and zooplankton groups, with detailed representation of microbial, detrital and nutrient regeneration dynamics. The model is driven by a wide range of forcing factors including irradiance and temperature data, atmospheric inputs of nitrogen, suspended matter concentration, hydrodynamical information to describe advective and diffusive transport processes and inorganic and organic river load data (Lenhart, Radach and Ruardij, 1997). The spatial scope of the model encompasses the entire North Sea. More recently, Blackford, Allen and Gilbert (2004) provide a mathematical description of ERSEM-2004 (developed from ERSEM II) together with a description of its application to six contrasting sites within the North, Catalan, Cretan and Arabian Seas. They conclude that when coupled to high resolution hydrodynamic
15
models, ERSEM can be applied over large geographical and temporal scales and is thus a useful tool for studies focusing on lower trophic levels.
The consumers module of ERSEM includes mesozooplankton, microzooplankton and heterotrophic flagellates. Consumer uptake is of a Michaelis-Menton form and depends on both food availability and water temperature. A “food matrix” is used as an input to describe the relative prey availability or preference of the different food sources for each consumer (Solé, Estrada and Garcia-Ladona, 2006). A useful feature described in Blackford, Allen and Gilbert (2004) is the introduction of a Michaelis-Menton term to prevent excessive grazing of scarce prey based on a lower threshold feeding parameter.
In the current context, one of the most useful applications pertains to attempts to link ERSEM to individual growth models for fish (Bryant et al., 1995; Heath, Scott and Bryant, 1997). The entire North Sea herring population was modelled using an age-structured cohort model that was linked by adjusting the biomass of groups in ERSEM to reflect prey uptake by herring and conserving carbon and nutrient balances by accounting for defecation, excretion and mortality products from the fish (Heath, Scott and Bryant, 1997). The detailed representation of transport processes within ERSEM allowed simulation of important juvenile growth processes such as year-specific dispersal and timing of larval recruitment. The model was useful in demonstrating the extent to which hydrographic and planktonic conditions are responsible for short-term year-to-year variability in growth but the model failed to explain longer-term underlying trends thought to be due primarily to density-dependence.
ERSEM could be adapted for other regions as it is essentially a generic model which is then coupled to an appropriate physical model for a region, such as the General Ocean Turbulence Model (GOTM). ERSEM has been shown to be equally applicable in tropical and warm temperate systems such as the Arabian Sea, Mediterranean and Irish Seas (Allen, Blackford and Radford, 1998; Allen, Sommerfield and Siddorn, 2002; Crise et al., 1999). Adapting it to other systems requires a fair amount of data. Given that the focus of ERSEM is on the lower trophic levels, it is unlikely to be able to contribute to practical fisheries management but is nonetheless a good tool for understanding environmental drivers and bottom-up processes impacting fish populations.
The Shallow Sea Ecological Model (SSEM) (Sekine et al., 1991) also includes detailed representation of processes such as swimming, advection and diffusion and requires inputs in the form of water temperature, currents and nutrient loads from surrounding land masses. It has specifically been developed to predict the impact on fisheries of coastal development activities. It is thus adequately tailored for this use but would not be suitable for broader questions related to the ecosystem impacts of fisheries.
2.1.4 IGBEM, BM2 and ATLANTISIGBEM (Integrated Generic Bay Ecosystem Model) (Fulton et al., 2004) is a coupled physical transport-biogeochemical process model constructed through amalgamation of ERSEM II and the Port Phillip Bay Integrated Model (PPBIM) (Murray and Parslow, 1999). Some of its main features are summarized in Tables A1a to A4, but it is not further discussed here given that this model is essentially superseded by ATLANTIS. ATLANTIS (Fulton, Smith and Punt, 2004) was developed from the “Bay Model 2” (BM2) ecosystem model of Fulton et al. (2004), first applied to Port Philip Bay, Australia. Its development has been tightly coupled to efforts to evaluate potential methods and tools (such as ecological indicators) for use in ecosystem-based fisheries management using a Management Strategy Evaluation (MSE) approach. This approach requires not only models of how the management decisions are made (including associated monitoring activities), but at its core it must have an operating model to represent the “real world” including the impact of fishing and other anthropogenic effects. ATLANTIS is arguably currently the best model worldwide to play this role for some of the following reasons:
Review of current modelling approaches

Models for an ecosystem approach to fisheries16
1. It includes the full trophic spectrum;2. It has a more simplified representation of physiological processes than most other
biogeochemical models, following a detailed sensitivity analysis to determine the importance of including various processes (Fulton, 2001). On the other hand, some processes not considered in other models, such as mixotrophy, are included as they are considered important;
3. Vertebrates such as fish are modelled using age-structured formulations; 4. Lower trophic level groups are represented better than in most whole ecosystem
models (in that it allows some age structuring at the juvenile-adult level for potentially important invertebrates such as cephalopods and large crustaceans), whereas the upper trophic level groups are represented better than in other biogeochemical models;
5. The model is spatially resolved;6. Multiple vertical layers can be considered;7. The modular structure allows the substitution of a wide range of different sub-
models for various components; 8. The nutrient-pool formulation allows testing of effects such as nutrient inputs
from point sources;9. There is detailed coupling between physical and biological processes
10. Multiple representations of some of the processes are included, thereby allowing the user to choose the preferred option for their modelled system.
Given the above, it is perhaps of interest to briefly describe the equations used to model fish populations in particular. The rates of change for a vertebrate group (FX) are given by (Fulton, Smith and Punt, 2004):
� �siFX
si GdtFXd
,
, � (8)
(8)
dt (8)� �
riFXri G
dtFXd
,
, � (9) (9)
dt (9)� �
iiii FX
groupspredatorj
jFX,FXFXEMFXIMMdi FPMTT
dtFXd
����� ��
,,,
(10)
(10)
where s represents structural weight (skeletal and other non-reabsorbable material), r reserve weight (fats and other tissues that are broken down when food is limiting), d density and i age class (either a single year class or a proportion of the total life span of the animal). The rate of change includes consideration of the difference between movement into (change includes consideration of the difference between movement into (
iFXIMMT , ) and out of ((iFXEMT , ) a cell, and removals due to natural mortality ) a cell and removals due to natural
mortality M, predation mortality P (see below) and fishing mortality F. Six alternative functional response representations are currently included, with a
common feature being the use of prey availability terms (discussed below). An example of one of the most commonly chosen grazing term formulations which describes the consumption of a particular prey group by CX is given by:
CX
refugeCXprey
CX
preyCXP
�
��
�
CXDR,DRCX,CXDL,DLCX,preyj
CXj, p�pjp
CX
CXprey,CX,
k1
pk
������
�
�
��
�
��� �
��
�����
�
(11)
(11)
17
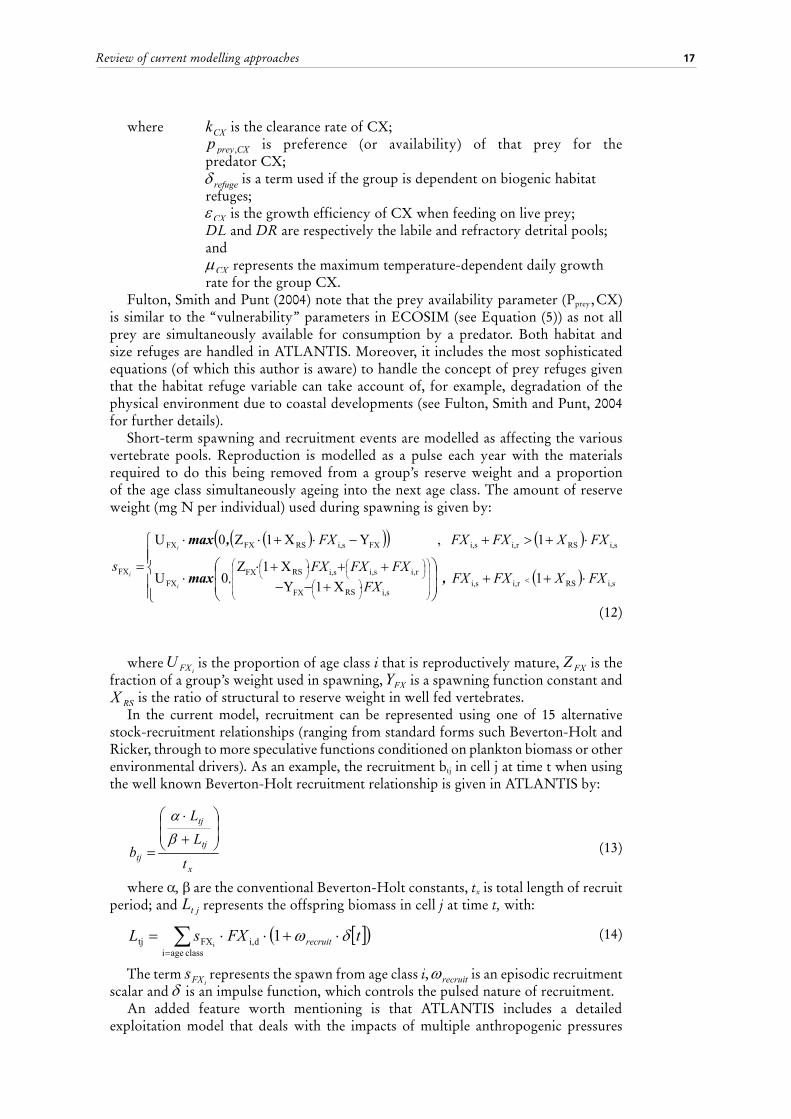
where where CXk is the clearance rate of CX;
CXpreyp , is preference (or availability) of that prey for the predator CX;
refuge� is a term used if the group is depe is a term used if the group is dependent on biogenic habitat refuges;
CX� is the growth efficiency of CX when feeding on live prey; DL and DR are respectively the labile and refractory detrital pools;
and
CX� represents the maximum temperature-dependent daily growth rate for the group CX.
Fulton, Smith and Punt (2004) note that the prey availability parameter (Pprey, CX) is similar to the “vulnerability” parameters in ECOSIM (see Equation (5)) as not all prey are simultaneously available for consumption by a predator. Both habitat and size refuges are handled in ATLANTIS. Moreover, it includes the most sophisticated equations (of which this author is aware) to handle the concept of prey refuges given that the habitat refuge variable can take account of, for example, degradation of the physical environment due to coastal developments (see Fulton, Smith and Punt, 2004 for further details).
Short-term spawning and recruitment events are modelled as affecting the various vertebrate pools. Reproduction is modelled as a pulse each year with the materials required to do this being removed from a group’s reserve weight and a proportion of the age class simultaneously ageing into the next age class. The amount of reserve weight (mg N per individual) used during spawning is given by:
� �� �� � � �
� ����
���
�
������
����
�����
������
���������
��
����
�
�
����
�
�
���
���
���
���
���
���
1X1YX1Z
0U
1,YX1Z0U
i,sRSri,i,si,sRSFX
ri,i,si,sRSFXFX
i,sRSri,i,sFXi,sRSFXFX
FX FXXFXFXFXFXFXFX
FXXFXFXFX
si
i
i ,max
,max
,
(12)
(12)
where where iFXU is the proportion of age class i that is reproductively mature, that is reproductively mature, FXZ is the fraction of is the
fraction of a group’s weight used in spawning, a group’s weight used in spawning, FXY is a spawning function constant and is a spawning function constant and RSX is the ratio of structural to reserve weight in well fed vertebrates.
In the current model, recruitment can be represented using one of 15 alternative stock-recruitment relationships (ranging from standard forms such Beverton-Holt and Ricker, through to more speculative functions conditioned on plankton biomass or other environmental drivers). As an example, the recruitment btj in cell j at time t when using the well known Beverton-Holt recruitment relationship is given in ATLANTIS by:
x
tj
tj
tj t
LL
b���
����
�
�
�
���
(13)
(13)
where α, β are the conventional Beverton-Holt constants, tx is total length of recruit period; and jtL represents the offspring biomass in cell represents the offspring biomass in cell j at time t, with:
� �� ���
�����classagei
di,FXtj 1i
tFXsL recruit �� (14)
(14)
The term The term iFXs represents the spawn from age class i, represents the spawn from age class i, recruit� is an episodic recruitment
scalar and � is an impulse function, which controls the pulsed nature of recruitment.An added feature worth mentioning is that ATLANTIS includes a detailed
exploitation model that deals with the impacts of multiple anthropogenic pressures
Review of current modelling approaches

Models for an ecosystem approach to fisheries18
(pollution, coastal development and broad-scale environmental change), with a focus on the dynamics of fishing fleets. Multiple fleets can be simulated, each with their own characteristics (in the form of gear selectivity, habitat association, targeting, effort allocation and management structures). Multiple alternative formulations are available, with the more complicated capable of explicitly handling economics (including quota trading), compliance decisions, exploratory fishing and other complicated real world concerns.
The exploitation model interacts with the biological model and also supplies ‘simulated data’ to the sampling and assessment sub-model. The ‘simulated data’, which may be sector dependent or independent data (via a user defined monitoring scheme), include realistic levels of measurement uncertainty in the form of bias and variance. The simulated data are then input to actual assessment models (to date, these have included surplus production, ADAPT-VPA and fully integrated assessments) and the output of these acts as input to the management sub-model that applies a set of decision rules and management actions (currently only detailed for the fisheries sector). The management sub-model includes a broad range of possible management instruments such as gear restrictions, spatial and temporal zoning, discarding restrictions, bycatch mitigation and biomass reference points.
A negative surrounding the breadth and flexibility of the various sub-models (and their modular form) is that it can seem a daunting and parameter-intensive tool that may be associated with large uncertainties (E. Fulton, pers comm.). Supporting software and methods to make this task easier are under parallel development. In a data rich situation, ATLANTIS may be well suited to a user’s needs, whereas it may be argued that in a data poor situation the framework is still quite useful for asking “what-if” questions. As with all modelling approaches, ATLANTIS is not appropriate in all circumstances and must be used sensibly.
2.1.5 SEPODYM/SEAPODYMTuna fisheries are typically high value multi-species and multi-gear fisheries in which interactions can occur and hence it is not surprising that considerable effort has been focused on developing a Spatial Environmental POpulation DYnamics Model (SEAPODYM, previously SEPODYM) (Bertignac, Lehodey and Hampton, 1998; Lehodey, 2001; Lehodey, Chai and Hampton, 2003). SEAPODYM is a two-dimensional coupled physical-biological interaction model at the ocean basin scale, developed for tropical tunas in the Pacific Ocean (Lehodey, Chai and Hampton, 2003; Lehodey, 2005). The model includes an age-structured population model of tuna species, together with a movement model which is based on a diffusion-advection equation such that swimming behaviour is modelled as a function of habitat quality. The inclusion of spatial structure was essential given the need to account for fishing effort distribution, the widely ranging swimming behaviour of tuna and environmental variations (Bertignac, Lehodey and Hampton, 1998). The latter are simulated using input data in the form of sea surface temperature (SST), oceanic currents and primary production, predicted either from coupled physical-biogeochemical models such as OGCM (Ocean General Circulation Model, Li et al., 2001) or satellite-derived data (Lehodey, Chai and Hampton, 2003).
SEAPODYM has thus far only been run in the Pacific Ocean and the first multi-species simulation including three tuna species (skipjack Katsuwonus pelamis, yellowfin Thunnus albacares and bigeye T. obesus) has only recently been completed. However, there are plans to develop additional modules for other oceanic predators (P. Lehodey, CLS, Toulouse, France, pers. comm.). Moreover, the model executable, associated software and documentation, including a manual (Lehodey, 2005) are available on the website www.seapodym.org. The model structure differs from the other models in the Dynamic systems model category (Figure 1) in terms of representing only a small

19
subset of the species in the ecosystem but it is linked to a physical model and hence allows investigation of, for example, the relationship between climate variability and recruitment and biomass fluctuations (Lehodey, Chai and Hampton, 2003).
Habitat index and model equationsSEAPODYM incorporates a number of features which render it useful in a broader context, particularly to explore the dynamics of upper trophic level predators which are highly mobile. Several fish and top predator species are likely to distribute themselves spatially based on the availability of prey and the physical characteristics of the environment as is the case for tuna (Lehodey et al., 1998). The habitat index Ha included as part of SEAPODYM is thus designed to preferentially distribute tuna in regions with large food availability and temperature in a range deemed favourable for the species in question. Tuna larvae are assumed to be passively transported by surface currents whereas young and adult tuna movements are constrained by the adult habitat index. The rate of movement into and out of favourable and unfavourable habitats is modelled by including a function to increase the diffusion (D) and advection () and advection ( � ) at ) at low values of habitat index. Movement is also proportional to the size of the fish such that:
� �� �� �� �� �� �aaaa
aaaa
HgHLHgHLDD
����������
10
2
11
�� (15)
(15)
where where aD and and a� are respectively the diffusion and advection at age a, La the length of fish at age a and g1 and g2 two coefficients constraining the shape of the function. Parameterisation is achieved by comparing with the results of tagging studies (Lehodey, Chai and Hampton, 2003). The above approach is fairly straightforward and could usefully be applied in other systems/models too provided physical information is available on sea surface temperature, currents and primary production. Tagging information is also required to estimate the parameters of the movement model.
The natural mortality rate in the model depends also on an index of habitat quality. As in more traditional single-species models, the fishing mortality is computed as proportional to the fishing effort fishing effort tjiE ,, , the catchability coefficient of the fishery q and the gear-and age-specific selectivity coefficients sa, i.e.
tjiaatji qEsF ,,,,, � (16)
(16)
where where atjiF ,,, , is the fishing mortality rate of age class a fish in spatial cell i, j during time period t. A knife-edge selectivity function is assumed.
Recruitment is modelled as independent of the adult population density. Instead spawning occurs in all cells in which mature tuna are present and SST is above a limit value. Thereafter the larvae are distributed passively by sea currents. The model has also been extended to permit investigations of the effect of other environmental factors, such as food availability and predation, on larval survival and pelagic fish recruitment (Lehodey, Chai and Hampton, 2003). This aspect of the model is thus suitable for extending to other pelagic species such as sailfish, swordfish and sharks.
SEAPODYM has several features which suggest that it could be a useful tool if applied to model marine mammals such as whales, but the recruitment formulations would need to be modified for this purpose. Another limitation relates to the lumping of all the tuna forage items into a single model compartment (as was indeed necessary given the original aims of the model) (Lehodey et al., 1998, Lehodey, 2001). This means that the model is not suitable for exploring hypotheses in which it is important to differentiate between the quality and quantity of different types of prey items or to represent unavailable fractions of this component. The model does not explicitly
Review of current modelling approaches

Models for an ecosystem approach to fisheries20
model inter-species and inter-trophic level interactions and hence is not suitable as a tool to address questions related, for example, to impacts mediated through trophic interactions.
The population dynamics equations underlying SEPODYM are relatively straightforward and as such are generally applicable to a wide range of species. Population size (P) is determined as follows:
RZPxHP
xxPD
xtP
�����
���
��
��
����
���
��
��
���
0� (17)
(17)
where R is recruitment and Z is the total mortality rate. The equation above is generalized to two dimensions and solved using the finite difference method using discrete time steps of one month and 1˚-square spatial cells (Bertignac, Lehodey and Hampton, 1998). Other methods are used to solve the other partial differential equations and advection terms. In general it appears the numerical solution methods are slow because computing power is currently the major impediment to adding more species groups to the model (P. Lehodey, pers comm.).
SEAPODYM is an improved version of SEPODYM in that it incorporates an improved description of intermediate trophic levels in three vertical layers, as well as improved handling of multiple predators (Lehodey, 2005). Moreover, an improved numerical scheme allows the use of spatial stretched grids so that resolution can be changed (reducing computation time), depending on the level of interest of a region. The six components of the mid-trophic level included in SEAPODYM are epipelagic, migrant mesopelagic, non-migrant mesopelagic, migrant bathy-pelagic, highly migrant bathy-pelagic and non-migrant bathy-pelagic. Given that the most recent version includes several forage components, revisions were necessary to simulate the coupling of forage mortality to the density of predators. This has essentially been done by adding a single mean daily food ration parameter for each predator species, which is used to compute the total forage required by each predator from the various forage components (Lehodey, 2005). Potential problems with this simple approach include the possibility of the combined predator forage requirements exceeding the available forage biomass.
SEAPODYM thus fits under the “fixed ration” model category defined earlier. Most of the models in this category do not include any feedback from predators to prey. SEAPODYM similarly does not explicitly include such feedbacks, but has a number of potential indirect feedback loops in that changes in foraging mortality can change both spawning habitat and feeding habitat, with changes in the latter in turn resulting in changes in natural mortality and fish spatial distribution (Lehodey, 2005).
SEAPODYM is a valuable tool for integrating data from the environment, fisheries and biology of target species to explore bottom-up forces that affect fish populations. An example is the use of SEPODYM to explore the biological consequences of an ENSO (El Niño Southern Oscillation) event in the pelagic ecosystem for the equatorial western and central Pacific ocean (Lehodey, 2001) as well as to explore global warming scenarios (Loukos et al., 2003).
2.2 MINIMUM REALISTIC MODELSPunt and Butterworth (1995) developed the first so-called MRM in response to a need to quantify the potential effect of seals on hake, the most valuable fishery for both South Africa and Namibia. The Punt and Butterworth (1995) approach was founded in the recommendations of a workshop held in Cape Town in 1991 to develop a basis to evaluate fur seal-fishery interactions off the west coast of South Africa (Butterworth and Harwood, 1991). This led to the coining of the term Minimum Realistic Model (MRM) to describe the concept of restricting a model to those species most likely to
21
have important interactions with the species of interest. A critical issue raised in this context relates to the optimal level of complexity for
multi-species models (see e.g. Pinnegar et al., 2005; Quince, Higgs and McKane, 2005). Reducing the number of species considered, or aggregating similar species into groups, reduces the number of inter-species links which need to be modelled, but consequently also reduces the number of weak links included in the model. Yodzis (1998) used a food web model of the Benguela ecosystem to show that the exclusion of feeding links representing less than 10 percent of consumption both by and of any species had minimal effect on model predictions, but that above this threshold for linkage strength the model predictions started to become unreliable. The reasons why simplified model outcomes varied drastically from outcomes based on detailed foodweb structure is likely due to the presence of potentially strong diffuse effects in complex food webs (Yodzis, 2000).
2.2.1 The original MRM Off the South African west coast, the fur seal population (Arctocephalus pusillus pusillus) is estimated to consume about as much hake as is landed by fishers (Butterworth et al., 1995), begging the question of whether the hake fishery would benefit in response to a seal cull. The commercially valuable hake consists of two species, a shallow-water (Merluccius capensis) and a deep-water species (M. paradoxus), with the larger of the shallow-water species eating the smaller individuals of the deep-water species.
The Punt and Butterworth (1995) model was restricted to the two species comprising the hake resource, seals, a grouped category of large predatory fish and the hake fishery. Together these were estimated to account for more than 90 percent of all mortality of hake. The level of detail taken into account for each component depends on that considered necessary to capture the key aspects of its dynamics. Thus fully age-structured models were used for the two hake species (to capture cannibalism and interspecies predation effects), but the “other” predatory fish components were simply lumped into either a small or large fish category.
One advantage of the Punt and Butterworth (1995) model is that a realistic population dynamics model (Butterworth et al., 1995) was used to simulate the seal population, in contrast to the more usual practice of trying to adapt models originally constructed to simulate fish dynamics. A summary of the major features and assumptions of this approach is listed below:
• the model is discrete (with half-year time-steps);• the dynamics of the two hake species are modelled separately using a (modified)
age-structured production model. The two species are treated as one in a sensitivity test;
• the model includes both cannibalism and interspecific predation;• equations (18) and (19) below include noise terms which were ignored for all the
deterministic calculations and handled in a rather ad hoc way for the stochastic runs. This aspect could be improved, for example, through the use of Bayesian methods (A.E. Punt, School of Aquatic and Fishery Sciences, University of Washington, pers. comm.); and
• natural mortality for hake has four sources:1. Predation/cannibalism by hake: this is affected by three factors: the number
of predators, the number of prey and the “desirability” of different species/age-classes to a particular predator. The daily hake ration of a predator of species j (either seals, M. capensis or M. paradoxus) is assumed to be given by a Holling Type II feeding function relationship, as recommended by Butterworth and Harwood (1991), on the grounds of simplicity and availability of sufficient data to allow parameter estimation. The daily hake ration of a predator of species j and age a during the first half of the year y is thus given by:
Review of current modelling approaches

Models for an ecosystem approach to fisheries22
� �)exp(1~ 2/,,
2, ���� ����jayeVRR j
ayja
ja
jay (18)
� ��y aj N, ( ; )from 0 2
(18)
where where jayR , is the mass of hake consumed is the mass of hake consumed each day by predators of species j and
age a during year y;jaR~
is the maximum daily ration for a predator of species j and age a;ja� determines the extent of saturation in the feeding function
relationship, jayV , is the total biomass of hake which is available for consumption by
predators of species j and age a during the first half of year y; and�� reflects the extent of the annual variation in the diet.
2. Predation by seals – the same form as above.3. Predation by “other predatory fish” (e.g. snoek Thyrsites atun, kingklip
Genypterus capensis and sharks): assumed that the number of hake of species i and age a which are eaten by these fish is related to the abundance of such hake by a Holling Type II feeding relationship. The number, D, of hake of species i and age a which are eaten during the first half of the year is given by:
� �� �2/,
,,
2,,
41exp1 ��� �
�����
predfishiayeNwvBuD i
ayia
ia
opfy
ia
predfishiay
predfishiay,,� from � �2;0 ��N (19)
(19)
where where iau is the maximum number of hake of species is the maximum number of hake of species i and age a per unit
biomass of other predatory fish which could plausibly be eaten (pre-exploitation level);
exploitation level); opfyB is the biomass of “other predatory fish”, as a fraction of the pre-
exploitation level;
iaw 4
1� is the individual mass of hake of age is the individual mass of hake of age is the individual mass of hake of age 4
1�a ; ;
iayN , is the number of hake of species i and age a in year y;
iav determines the extent of saturation in the feeding function relationship;
and
�� reflects the extent of the annual variation in the diet.
Note that Note that iau and Note that and i
av were pre-specified inputs (sensitivity to their values was were pre-specified inputs (sensitivity to their values was examined).
4. Basal natural mortality rate (Mb) – mortality attributed to “other causes” not included in the model. This was somewhat arbitrarily set to 0.1 yr -1.
Of the many factors considered in the sensitivity tests by Punt and Butterworth (1995), notable changes to the base-case trial were obtained only by increasing the extent of predation by seals on M. paradoxus. There thus exists a need to examine more recent data to check the validity of the assumption in the original model that seals feed mainly in shallow waters and hence that their hake consumption is presumably nearly all constituted by M. capensis. A second aspect of the Butterworth et al. (1995) seal model which may need to be revised concerns the model structure lacking any feedback
23
between a paucity of hake and a population-dynamic response in (for example) weight-at-age, survival and/or reproduction of seals, i.e. it was assumed that there was always sufficient “other” food for such predators.
The hake model used a Holling Type II feeding function relationship. The way in which the daily ration of a predator is comprised of different hake species and age-classes depends in part on the “desirability” (
daily ration of a predator is comprised of differeon the “desirability” ( ij
aa,,'� - see eqn. App.II.12 in Punt and Bu - see eqn. App.II.12 in Punt and
Butterworth, 1995) that predators of species j and age a’ exhibit for hake of i and age a, as estimated from available feeding data.
Punt and Leslie (1995) computed estimates of diet composition and daily ration for the Cape hakes using information on stomach contents collected during demersal trawl surveys by the SFRI (Sea Fisheries Research Institute – now MCM) between 1988 and 1994. Estimates of evacuation rates for Cape hake were obtained using a model of the stomach evacuation process and data for juvenile Cape hake and other gadoids. Of interest is that their estimates of evacuation time were notably larger than those used in earlier analyses, suggesting that the time to evacuate 90 percent of a prey item ranges from 2 to 10 days depending on the meal size and the size of the predator. A key feature of this study was the conclusion that hake meal frequency decreased rapidly with hake size, so that the largest hake were feeding about once every 10 days only. Without this low feeding rate, the model produced a perpetual-fishing-machine - large hake would be so effective at eating small ones, that the harder one fished and removed larger hake, the more smaller hake escaped such predation and became available to make for even larger sustainable fishery catches (D.S. Butterworth, UCT, pers. comm.).
The notion that digestion time constraints likely put a cap on the consumption rates of hakes is important in discussing the appropriate form of the functional response because, for example, it runs counter to one of the assumptions underlying ECOSIM’s functional response formulation, namely that “predators with full stomachs are not a common field observation” (Walters and Kitchell, 2001). Walters and Martell (2004) note further that studies such as that by Schindler and Eby (1997) (based on 18 freshwater fish species in lakes) suggest that realized growth rates are typically only 26 percent of the maximum possible rate predicted from bioenergetics. Other data such as that in Table I of Punt and Leslie (1995) suggests predators such as hake regularly show full stomachs, but there is evidence in the literature in support of both views. For example, Arrington et al. (2002) showed that across 254 fish species the mean percentage of empty stomachs was some 16 percent, but this varied from 0 percent to 79.4 percent among individual species. Arrington et al. (2002) suggest that piscivorous fish in particular regularly experience long periods of empty stomachs.
A potential problem with the “desirability” parameters concerns the fact that these are assumed to be independent of density. This could be addressed to some extent by a more intensive stomach sampling exercise, for example by using techniques to smooth spatial and temporal variability in food composition and predator abundance, such as the geostatistical approach of kriging (Bulgakova, Vasilyev and Daan, 2001). A further example of methods used to separate prey size preference from prey availability is given in Floeter and Temming (2003) (who consider North Sea cod).
Management procedure considerationsA noteworthy feature incorporated in the Punt and Butterworth (1995) approach involved taking explicit account of uncertainty and management issues through the use of a simulation framework that incorporated the feedback control rules actually in place for setting TACs for the hake fishery. The purpose of this approach was to check whether, even if a seal reduction did increase hake sustainable yields, the management system applied to compute TACs was such as to be able to take advantage of this. In a similar context, Cooke (2002) stresses the importance of considering management
Review of current modelling approaches

Models for an ecosystem approach to fisheries24
constraints and issues of uncertainty as integral components of attempts to assess the effects of changing cetacean abundance on fishery yields. The approach of Punt and Butterworth (1995) provided a useful framework for further work in this field and it is encouraging that there are currently a steadily increasing number of multi-species Management Procedure/MSE studies taking this approach beyond single and limited multi-species applications to consider much broader aspects of ecosystems or assemblages.
2.2.2 ESAM (Extended Single-species Assessment Models)Livingston and Methot (1998) and Hollowed, Ianelli and Livingston (2000) explicitly modelled predation mortality in a catch-at-age stock assessment model applied to the Gulf of Alaska walleye Pollock (Theragra chalcogramma). They incorporated the effect of three predators: arrowtooth flounder (Atheresthes stomias), Pacific halibut (Hippoglossus stenolepis) and Steller sea lion (Eumetopias jubatus) by defining predation mortality as a type of fishery. Two important features of this approach were the use of a flexible functional response form capable of reflecting varying levels of predator satiation and of statistical methods to fit the model to the data. Tjelmeland and Lindstrøm (2005) provide a further example of the incorporation of predators into standard fish stock assessment models. They incorporated predation by northeast Atlantic minke whales in the SeaStar herring stock assessment model and estimated the parameters of the consumption formula by directly including the consumption term in the likelihood function maximized.
A first step to constructing a multi-species model based on a rigorous assessment model is to include the various predators simply as alternative “fishing fleets”, rather than estimating their effects as part of a “natural mortality” term. Gulland (1983) outlined methodology for extending single-species models to take account of multi-species considerations. Plagányi (2004) similarly applied the “predators as a fishing fleet” approach to a simple representation that incorporated the two Cape hake species as two separate species with M. capensis preying on M. paradoxus and both of the hake species acting as a predator on juveniles of their own species to emulate the cannibalism known to occur. Seals were included as a separate “fishing fleet” that preyed on M. capensis. Each predator was ascribed a selectivity function (based on stomach content data). The two hake species were modelled simultaneously using an age-structured production model (ASPM) (e.g. Hilborn, 1990; Butterworth and Rademeyer, 2005) approach and by fitting to GLM-standardized CPUE data.
As in a typical ASPM, the predator-specific catch by mass in year y is given by:
predy
predaay
m
aa
predy FSNwC ,
0��
� (20)
(20)
wherewhere aw is the mass of an animal of age a;
ayN , is the number of animals of age a at the start of year y;
predaS is the fishing selectivity-at-age for a predator pred; and
predyF is the fishing “mortality” (strictly here that proportion of the fully
selected numbers present which are caught by predator pred).
The proportion of the selected component of the resource harvested each year (The proportion of the resource harvested each year ( pred
yF ) by predator pred is therefore given by:

25
predy
predy
predy BCF ˆ/� (21)
(21)
with the number of animals of age a taken by predators in year y (y predayC , ) given by:
aypredy
preda
preday NFSC ,, � (22)
(22)
The major challenge in constructing such a model obviously lies in the choice of a suitable interaction term. The simplest way to estimate the predator-specific catch by mass in year y is to use a Lotka-Volterra-type interaction of the form:
preyy
predy
predpredy BBaC � (23)
(23)
where where preda is an “availability” constant (i.e. the in is an “availability” constant (i.e. the interaction constant). However, this is a particularly strong interaction form and alternative forms should be explored, such as:
� �preyy
predpreyy
predy
predpredy BbBBaC �� 1 (24)
(24)
which allow for predator satiation. More complicated functional response formulations (such as the various Holling functional response formulations or ECOSIM’s foraging arena formulation) can readily be incorporated in a simple model of this form.
Plagányi (2004) simultaneously estimated biomasses of the two hake species in the model fitting process and initial attempts were made to fit the extra parameters, namely the interaction constants corresponding to each interaction (e.g. estimate
t the extra parameters, constants corresponding to each interaction (e.g. estimate preda describing predation by
describing predation by M. capensis on M. paradoxus). Initial investigations suggested that the data were not sufficient to support estimation of (all of) these additional parameters. However, given appropriate data, it may be possible to input estimates of the predator-specific catch by mass in year y directly, e.g. seal predation on M. capensis could be fixed in a base-case.
The development of a simple “fishing fleet” type model as described above is a good starting point to address multi-species issues, particularly because it could be based upon existing single-species models (preferably length-based). The approach could be improved by building on length-structured models given that most feeding interactions are strongly size-based (see discussion under OSMOSE). By building these models in a stepwise fashion, they could be extended to achieve greater realism, or moulded to provide greater insight into predation-mediated changes (BENEFIT, 2004).
A further example relating to modifying conventional age-structured assessment models to investigate multi-species effects is presented in Chouinard et al., 2005. They investigated the hypothesis that increased predation by a growing number of Grey seals Halichoerus grypus resulted in increases in the natural mortality (M) of Atlantic cod Gadus morhua, thereby playing a role in the decline of this species. Rather than explicitly modelling seals, their approach entailed estimating trends in M using sequential population analysis (SPM) within an ADAPT framework.
2.2.3 MSVPA approachMulti-species Virtual Population Analysis (MSVPA) is a technique that uses commercial fisheries catch-at-age and fish stomach-content data to estimate both the past fishing mortalities and the predation mortalities on some of the major fish species of interest
Review of current modelling approaches

Models for an ecosystem approach to fisheries26
(see e.g. Sparre, 1991; Magnússon, 1995). Unlike VPA (Virtual Population Analysis) which assumes that the natural mortality rate remains the same over time and usually also age, here natural mortality is split into two components: predation due to predators explicitly included in the model (M2) which depends on time and age because of variations in predator abundance and residual mortality (M1) due to all additional factors which are customarily taken to be constant. Based on the estimates of M2 that result, forward-looking simulations (MSFOR) are then used to determine the average long-term consequences of changing patterns of fishing.
One disadvantage of this approach is that it requires substantial data pertaining to the predation ecology of the predators included in the model, to the extent that tens of thousands of stomachs were sampled in the North Sea in 1981 and 1991, the “Years of the Stomach”, under the auspices of the International Council for the Exploration of the Sea (ICES). MSVPA applications have mainly focused on the North Sea, with the considerable data requirements generally impeding the application of this approach to other areas, although similar approaches have been applied to the Baltic Sea (Sparre, 1991), Georges Bank (Tsou and Collie, 2001), Eastern Bering Sea (Livingston and Jurado-Molina, 2000; Jurado-Molina and Livingston, 2002) and Barents Sea as well as to the Gulf of Maine.
A second potential problem with MSVPAs in general is that they concentrate on the impacts of predators on prey but ignore any potential effects that changing prey populations may have on the predators themselves (because of the approach’s constant ration assumption – see below). Nonetheless, the approach has some utility in quantifying the relative losses in prey biomass attributable to other predatory fish, marine mammals and commercial fisheries. Moreover, the MSVPA studies have made a start (e.g. Rice et al., 1991, Rindorf, Gislason and Lewy, 1998, Jurado-Molina, Livingston and Ianelli, 2005) in trying to determine the extent to which the consumption of a given prey is a simple linear function of its relative abundance in an ecosystem (the constant suitability assumption). “Suitability” is an important input to MSVPA and specifies the relative preference that a predator would have for different prey species, if all were present in equal abundances.
Although most areas lack sufficient data to permit the application of a full MSVPA approach (for which collection of all necessary data is exorbitantly expensive [Hilborn and Walters, 1992]) such as that applied in the North Sea, there is the possibility of applying a slightly simpler or even hybrid version. The data intensive requirements of MSVPA could be reduced (obviously at the expense of increasing model uncertainty) by restricting the focus to a smaller subset within the ecosystem and by making various assumptions regarding the length of the time period over which data such as age-length keys and stomach samples are assumed to be adequately representative.
Hybrid MSVPA approachesMohn and Bowen (1996) used a hybrid-type approach to model the impact of Grey seal (Halichoerus grypus) predation on Atlantic cod (Gadus morhua) on the eastern Scotian Shelf. Their approach involved first running a standard VPA using commercial landings and research survey data and then adding the consumption of cod by grey seals to the commercial landings and repeating the VPA which was retuned to take grey seal predation into account. They incorporated two alternative models of food consumption by seals (a constant ration predation model in which the fraction of cod in the diet was assumed constant and a proportional ration model in which the fraction of cod in the diet was assumed proportional to cod abundance), with these two predation models yielding substantially different estimates of the amount of cod consumed by grey seals.
A further limitation for MSVPA in some contexts is that it is age- rather than length-based and the latter is frequently inescapable for tropical areas for example. However,

27
age/length hybrid MSVPA versions have been produced (Christensen, 1995b). These approaches are based on length-based catch information as well as a number of other relationships such as the mean weight of length classes, length-age growth parameters and prey size selection functions.
2.2.4 MULTSPEC, BORMICON and GADGETThese models (and others not described in detail here such as Scenario Barents Sea (Schweder, Hagen and Hatlebakk, 2000), Seastar (Lindstrøm, Tjelmeland and Haug, 2002) and FLEXIBEST (IWC, 2004a)) are all of Northern Hemisphere origin and have variously incorporated predation by marine mammals. A common feature is that they are area-disaggregated which is a definite advantage given the migratory behavior of many marine mammals and the consequent importance of considering spatial-temporal overlaps between fisheries, marine mammals and shared prey species. In brief, MULTSPEC (see Bogstad, Hauge and Ulltang, 1997) is a length-, age- and area-structured simulator for the Barents Sea that includes cod, capelin, herring, polar cod, harp seal and minke whales. Predation interactions are modelled only as one-way in the case of marine mammals, which in the model do not react to changes in prey availability. BORMICON (A BOReal Migration and CONsumption model) is another area-structured approach for the multi-species modelling of Arcto-boreal ecosystems (Stefánsson and Palsson, 1998).
Given that work is not currently continuing on MULTSPEC and that BORMICON is being incorporated as a special implementation of GADGET, the focus here falls instead on a brief review of GADGET (Globally applicable Area-Disaggregated General Ecosystem Toolbox) (Begley, 2005; see also webpage http://www.hafro. is/ gadget; coordinator G. Stefánsson). Current case studies include the Celtic Sea, Icelandic waters, southern Benguela hake populations and the North Sea and North Atlantic herring. Plagányi and Butterworth (2005) note that GADGET is still being developed but shows great promise for modelling indirect interactions between marine mammals and fisheries (and has been recommended for such – NAMMCO, 2002).
In GADGET, populations can be split by species, size class, age group, area and time step. The model platform is flexible in permitting the easy addition/substitution of alternative model components of biological processes such as growth, maturation and predator-prey interactions. Thus, for example, there are currently seven growth functions from which to choose, including forms such as a simplified “MULTSPEC” type growth equation, a von Bertalanffy equation, two simplified forms of this as well as an extended version which allows for spatial and temporal growth differences, an extended form of the Jones growth function which includes the concept of starvation and a simple power-based growth equation (Begley, 2005). The beta statistical distribution is then used to distribute the growths around the mean.
GADGET’s consumption formulationsPrey consumption rate Cp is modelled as dependent on the length of both the predator and the prey p, as well as the relative abundance of the prey (when compared to the total amount of food available). Values of C can affect predator growth depending on the growth function selected. The consumption equations are of interest as they are formulated in a particularly flexible form as follows (Begley, 2005):
�
�
pp
pLLLp LlF
LlFMNLlC
),(),(
),(�
(25)
(25)
where Fp (l,L), which governs the amount of prey consumed by a predator, depends on the product of prey biomass, energy content Ep and the suitability S, such that:
Review of current modelling approaches
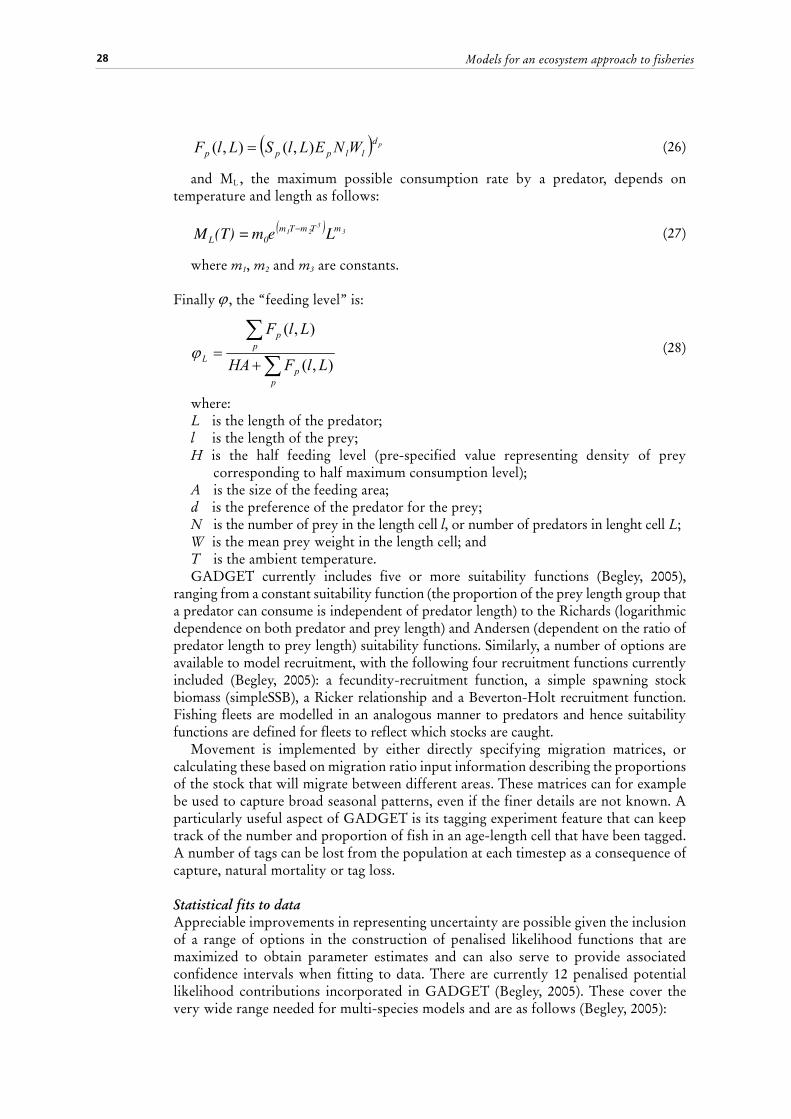
Models for an ecosystem approach to fisheries28
� � pdllppp WNELlSLlF ),(),( � (26)
(26)
and ML , the maximum possible consumption rate by a predator, depends on temperature and length as follows:
(27)
where m1, m2 and m3 are constants.
Finally Finally � , the “feeding level” is: , the “feeding level” is:
�
��
�
pp
pp
L LlFHA
LlF
),(
),(� (28)
(28)
where:L is the length of the predator;l is the length of the prey;H is the half feeding level (pre-specified value representing density of prey
corresponding to half maximum consumption level);A is the size of the feeding area; d is the preference of the predator for the prey;N is the number of prey in the length cell l, or number of predators in lenght cell L;W is the mean prey weight in the length cell; andT is the ambient temperature.GADGET currently includes five or more suitability functions (Begley, 2005),
ranging from a constant suitability function (the proportion of the prey length group that a predator can consume is independent of predator length) to the Richards (logarithmic dependence on both predator and prey length) and Andersen (dependent on the ratio of predator length to prey length) suitability functions. Similarly, a number of options are available to model recruitment, with the following four recruitment functions currently included (Begley, 2005): a fecundity-recruitment function, a simple spawning stock biomass (simpleSSB), a Ricker relationship and a Beverton-Holt recruitment function. Fishing fleets are modelled in an analogous manner to predators and hence suitability functions are defined for fleets to reflect which stocks are caught.
Movement is implemented by either directly specifying migration matrices, or calculating these based on migration ratio input information describing the proportions of the stock that will migrate between different areas. These matrices can for example be used to capture broad seasonal patterns, even if the finer details are not known. A particularly useful aspect of GADGET is its tagging experiment feature that can keep track of the number and proportion of fish in an age-length cell that have been tagged. A number of tags can be lost from the population at each timestep as a consequence of capture, natural mortality or tag loss.
Statistical fits to dataAppreciable improvements in representing uncertainty are possible given the inclusion of a range of options in the construction of penalised likelihood functions that are maximized to obtain parameter estimates and can also serve to provide associated confidence intervals when fitting to data. There are currently 12 penalised potential likelihood contributions incorporated in GADGET (Begley, 2005). These cover the very wide range needed for multi-species models and are as follows (Begley, 2005):
( ) 33
210
mTmTmL Le mM −(T) =

29
Data likelihood contributions:(1) Catchdistribution (age, length or age-length grouped catch data); (2) Catchstatistics (biological data such as mean length at age or mean weight at age); (3) StockDistribution (biological properties of different stock components (e.g. immature and mature components)); (4) Surveyindices (standardized indices of abundance or age-length indices); (5) SurveyDistribution; (6) StomachContent; (7) Recaptures (data from field tagging experiments); (8) RecStatistics, and (9) CatchInKilos.
Penalty functions:(10) Boundlikelihood (assigns a penalty weight to parameters that move outside pre-specified bounds); (11) Understocking (penalty term for overconsumption by a predator or fleet), and (12) MigrationPenalty (penalty term for nonsensical values in the migration matrices).
Formulations are available to deal with data that are aggregated into either age, length or age-length groups. The “goodness of fit” of the model is assessed using a weighted sum of penalised likelihoods for a range of individual components. The use of a powerful algorithm to conduct global maximization of the penalised likelihood is a definite advantage as is the continuing work to derive improved statistical measures of uncertainty.
A large range of variants are available to define the type of linear regression equation (e.g. linear or log-linear regressions with fixed or estimated slope and intercept) to be used in the likelihood calculations or the choice of assumed statistical distributions for the error components of the (implicit) models relating data to model variables (Multinomial, Pearson, gamma or log).
GADGET is thus extremely flexible in terms of methods for fitting to data, being comprehensive and incorporating state-of-the-art features, with the only disadvantage of these being that it is foreboding for a novice user! Although the GADGET manual is fairly comprehensive, it doesn’t always include the underlying equations for some components making it difficult to follow these. New users will battle to get going on their own, suggesting the need for more workshop type sessions as is successfully done for EwE. Advanced users will greatly appreciate the fact that GADGET is capable of running on multiple computers in parallel using PVM (Parallel Virtual Machine) (Begley and Howell, 2004).
As with the other modelling approaches, a major impediment to applying this approach in many cases is the current lack of adequate data to describe feeding relationships, especially when considering situations where resource abundances and their ratios differ greatly from those of the recent periods for which data are available. A strong advantage however is that GADGET incorporates a data warehouse that provides the flexibility for ready use of data at the different levels of aggregation that may be required across a number of investigations.
Some of the recent changes (GADGET versions 2.1.01 and 2.1.02) (Begley, 2005) to the model include the addition of the Richards and Gamma suitability functions, a capability to deal with catch information by number rather than mass, of a prey energetic content component and of parameters to allow for a Type III functional response.
2.2.5 Multi-species statistical modelsOne of the most well-known and utilized fisheries assessment methods is VPA or cohort analysis which is a recursive algorithm utilising catch-at-age information with no underlying statistical assumptions. Hilborn and Walters (1992) distinguish between this method and so-called “Statistical Catch-at-Age Methods” which rely on the formal statistical estimation of parameters. Single-species statistical catch-at-age models are widely used in fisheries management but there have been fewer attempts
Review of current modelling approaches

Models for an ecosystem approach to fisheries30
to extend these approaches to multiple species models. Unlike more traditional multi-species models such as MSVPA, Multi-species Statistical Models (MSM) are forward-fitting and hence use likelihood maximisation algorithms for parameter estimation. This is the same general approach as employed by models discussed elsewhere in this report, such as Punt and Butterworth (1995), Livingston and Methot (1998) and Hollowed et al. (2000). However, the MSM approach currently being developed by Jurado-Molina, Livingston and Ianelli (2005) is categorized separately here because unlike these other statistical catch-at-age models discussed in this report, it includes predator-prey feedback dynamics. Thus, changes in the prey population can impact the predator population and vice versa rather than a one-way interaction only in which the predator ration is fixed and changes in prey abundance have no effect on predator populations. The initial application includes only walleye pollock and Pacific cod Gadus macrocephalus (including cannibalism), but there are plans to incorporate more species in future model versions (Jurado-Molina, Livingston and Ianelli, 2005).
A distinct advantage of the MSM approach is the use of formal statistical methods for estimating the parameters of multi-species models and quantifying the associated uncertainty.
2.3 INDIVIDUAL-BASED MODELSIndividual-based models (IBMs) (e.g. DeAngelis and Gross, 1992; Van Winkle, Rose and Chambers, 1993; Grimm, 1999) follow the fate of individuals through their life cycle, under the assumption that individual behaviour has an appreciable effect on a population’s dynamics. They are thus useful in situations in which an understanding is needed of how individual behaviour might affect the dynamics of a system. These models are sometimes referred to as “agent-based” models with the “individual/agent” being represented by either individual animals and plants, or composite units such as fish schools or fishing fleets. They have typically been applied to investigate the dynamics of a single population within the marine environment, but a number of applications extend these analyses to consider multi-species dynamics as well (e.g. Shin and Cury, 2001; Ginot, Le Page and Souissi, 2002; Ginot et al., 2006; Alonzo, Switzer and Mangel, 2003; Kirby et al., 2004; Gray et al., 2003). Megrey, Hinckley and Dobbins (2002) developed a visualization tool that can be useful in analysing the outputs from IBM simulations, given that these are often voluminous and complicated. Grimm et al. (2006) propose a useful standard protocol for describing individual-based and agent-based models, although only minor mention is made regarding higher-level entities such as communities consisting of populations. Attention is focused here on the multi-species individual-based model OSMOSE (Object-oriented Simulator of Marine ecOSystem Exploitation) (Shin, Shannon and Cury, 2004) and the agent-based ecosystem model INVITRO (Gray et al., 2003; 2006).
2.3.1 OSMOSEOSMOSE (Shin and Cury, 2001; Shin, Shannon and Cury, 2004) is a spatial individual-based model that uses simple individual predation rules to model trophic interactions. It is thus an excellent framework to explore the hypothesis that predation is a size-based opportunistic process, depending only on size suitability and spatial co-occurrence between predators and their prey. Given the need as motivated in this review for alternative representations of species interactions, OSMOSE has a potentially important role to play as an alternative modelling approach that can help to identify consistent patterns in attempting to understand the ecosystem effects of fisheries (Shin, Shannon and Cury, 2004). It is however limited to some extent in this regard, in that, for example, when comparing model outputs to those produced by EwE, OSMOSE is initialized using ECOPATH-based estimates of biomass, annual natural mortality and fishing mortality values (Shin, Shannon and Cury, 2004). This

31
constrains OSMOSE somewhat in the extent to which it can posit an entirely different ecosystem make-up. Also, estimates from one modelling approach are usually specific to that approach and hence great caution should be taken when transplanting estimates into another approach or even when assuming the same inputs.
The focus of OSMOSE is on piscivorous fish species, with fish schools moving in a two-dimensional square-celled grid with closed overall boundaries. In the model, fish move to adjacent cells with the highest biomass of potential prey. Plankton and other invertebrate species are represented through a total carrying capacity term and top predators such as marine mammals and seabirds are represented simply using an additional natural mortality term.
As with the other multi-species models discussed, OSMOSE requires a large number of input parameters in the form of growth, reproduction and survival parameters. Some of these parameters are common to different species and ecosystems which facilitates the parameterisation process. However, there are a number of influential parameters upon which the model is based and the sensitivity of results to alternative defensible choices needs to be examined. Specifically, the model assumes a minimal predator-prey size ratio (a minimal predator-prey size ratio (� ) of 3.5 (the theoretical ratio between predator and prey body lengths) (from Froese and Pauly, 1998) and that individual fish of all species require 3.5g of food per body gram per annum (based on Laevastu and Larkins, 1981; Gislason and Helgason, 1985; Longhurst and Pauly, 1987 – cited in Shin, Shannon and Cury, 2004). The constant maintenance food ration assumption adopted here needs to be borne in mind in interpreting model outputs because it does not account, for example, for differences between species, for effects due to temperature or for energetic differences of diverse prey types, or the potentially seasonal nature of major feeding opportunities. However, a useful feature of the model is that the mean fish growth rate depends on the quantity of food ingested and if this quantity falls below the basic maintenance requirement, fish are assumed to die of starvation. A predation efficiency (starvation. A predation efficiency ( i� ) coefficient is computed based on the ratio between the ) coefficient is computed based on the ratio between the food ingested by a group and the maximal ration requirement. When this falls below a critical threshold level, the starvation mortality rate is modelled as a linear function of the predation efficiency.
The values which are possibly the most problematic and difficult to obtain are those for the relative fecundity (relative fecundity ( S� ) parameters which are input for each ) parameters which are input for each species and represent the number of eggs spawned per gram of mature female. The reproduction formulation is one of the simplest possible, with the abundance of recruits of species S at time t (assuming an equal sex ratio) determined by simple linear proportionality:
��
� ��S
SM
A
aataStStSStS BSSBwithSSBN ,,,,1,0, 2
1� (29) =
(29)
where where Ma is the age at maturity, A the terminal age for a species S, SSB is spawning biomass and B is biomass. The current formulation does not permit exploration of scenarios in which fecundity is a non-linear function of size. Instead of directly modelling recruitment levels, these emerge from the annual survival of eggs and juveniles based on modelled predation pressure and the carrying capacity term in the model. By explicitly modelling predation pressure on fish larval stages, the model provides a useful comparison with the results obtained from other modelling approaches. However, without further development, it seems unlikely that OSMOSE will be accepted into the realm of models contributing to practical fisheries management advice.
A similar age- and size-structured individual-based model termed MOOVES (Marine Object-Oriented Virtual Ecosystem Simulator) (Colomb et al., 2004) is being applied to the ecosystem of Guinea.
Review of current modelling approaches
Models for an ecosystem approach to fisheries32
2.3.2 INVITROTraditionally two main types of ecological models have been used: aggregate state models (like EwE) and individual based models (such as OSMOSE). Formal separation of these model types is not always easy. For instance, within the latter form of model, the individuals may represent schools, patches of homogeneous ground cover, flocks, patches of reef, or some other subset of a population that could be treated as equivalent to an entity. From this it is clear that most aggregate state models can be seen as a special case of an individual (or more properly agent) state model. Consequently, we can treat aggregate state models as agents within an Agent-Based Model (ABM) system. This is the approach that has been taken in INVITRO (Gray et al., 2006), which is currently used as the basis for MSE-based studies focusing on the multiple-use ecosystem-level management questions within the coastal waters of Australia (e.g. on the Northwest Shelf of Australia, Little et al., 2006).
Until recently decision-based ABMs have usually been tightly focused on a small subset of a system (e.g. a single fish in DeAngelis et al., 1991, or a small part of the food web, as in Van Nes, Lammens and Scheffer, 2002). Advances in the use of hybrid models, has (within the last five years) seen the incorporation of a wide variety of ecosystem components into ABMs - facilitated by the coupling of classical dynamic models, using differential equations and decision-based agents. In this way, the best means of representing each ecosystem component can be used - for example in INVITRO classical metapopulation models are used for habitats while IBMs are used for higher trophic levels or species of conservation concern, such as whales.
To make this conjunction of aggregate state and individual-based models seamless, INVITRO embeds them in a time-sharing universe. With each model-type (i.e. each instance of an agent) allowed operating at the most appropriate time and space scales – the scales that match the native resolution of the processes and their associated data sets. Seasonal cycles, for example, do not adhere to time steps appropriate for tidal larval migration. This treatment does have its consequences, not least of which was that it demanded the development of a sophisticated (operating system-like) scheduler.
INVITRO includes a range of alternative agent types, which can be modularly combined to create the final ecosystem (the open source nature of the code means additional modules can also be written by interested users). Currently it contains modules for three dimensional physical and environmental forcing (not just of typical fields like temperature, light and currents, but also more unusual fields such as catastrophic storms), larvae, mobile and sessile fauna from many trophic levels (including top predators), primary producers, biogenic habitat (such as reefs, seagrass beds and mangrove forests) a wide range of human activities (including commercial and recreational fishing, nutrient pollution, salt extraction, shipping, tourism, coastal development, conservation and oil and gas exploration) and their associated assessment and management tools (including standard options like spatial management, but also more hypothetical structures such as alternative management institutions that may be confined to single sectors or span across multiple sectors). The behaviour and representation of each agent is specific to its type. Consequently, mobile agents may be represented as individuals (e.g. turtles and sharks), or small groups (e.g. schools or sub-populations of fin-fish and prawns), while sedentary habitat-defining agents represent entire patches (e.g. an entire reef complex).
While this array of agent types is fairly comprehensive (and allows for immense flexibility) the computational costs of constructing an ecosystem in this way mean that in practice an MRM approach is taken to model structure, with only a subset of the ecosystem that incorporates the dominant system components included explicitly in the model. To date this has meant that only the commercially valuable fish and crustaceans, top predators, species of special interest (e.g. vulnerable species such as turtles), benthic communities (or forage communities if in the pelagic system) and primary producers
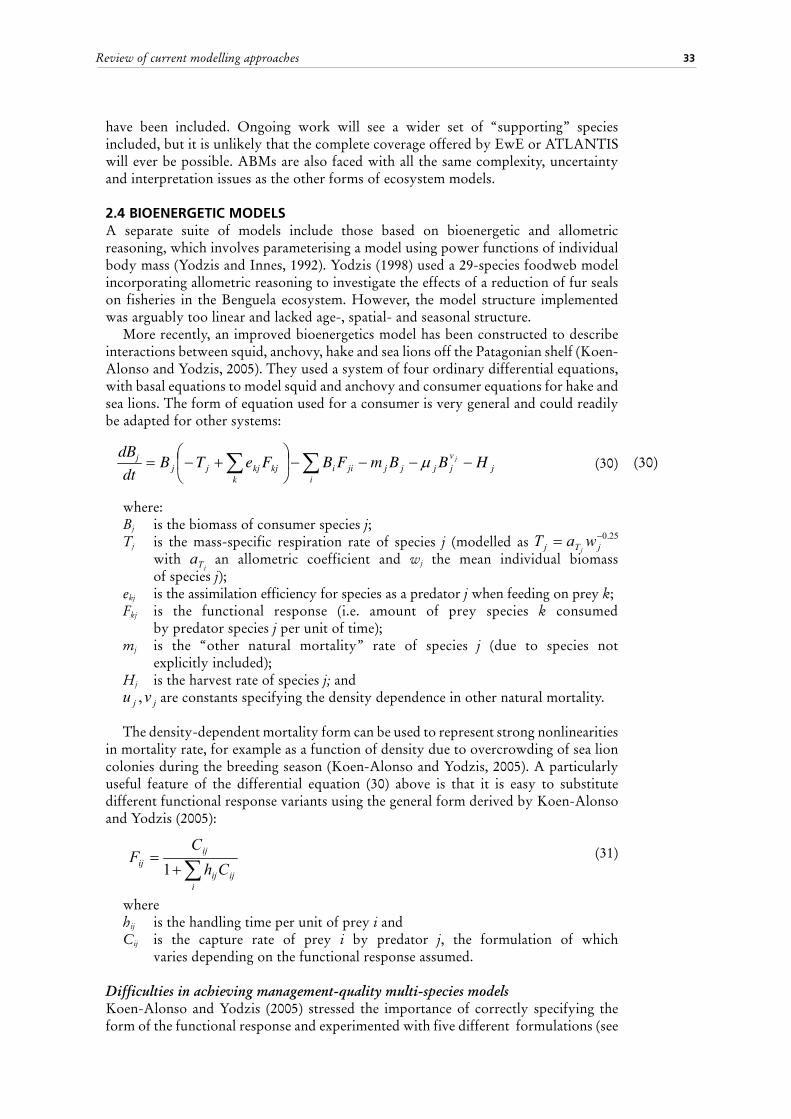
33
have been included. Ongoing work will see a wider set of “supporting” species included, but it is unlikely that the complete coverage offered by EwE or ATLANTIS will ever be possible. ABMs are also faced with all the same complexity, uncertainty and interpretation issues as the other forms of ecosystem models.
2.4 BIOENERGETIC MODELSA separate suite of models include those based on bioenergetic and allometric reasoning, which involves parameterising a model using power functions of individual body mass (Yodzis and Innes, 1992). Yodzis (1998) used a 29-species foodweb model incorporating allometric reasoning to investigate the effects of a reduction of fur seals on fisheries in the Benguela ecosystem. However, the model structure implemented was arguably too linear and lacked age-, spatial- and seasonal structure.
More recently, an improved bioenergetics model has been constructed to describe interactions between squid, anchovy, hake and sea lions off the Patagonian shelf (Koen-Alonso and Yodzis, 2005). They used a system of four ordinary differential equations, with basal equations to model squid and anchovy and consumer equations for hake and sea lions. The form of equation used for a consumer is very general and could readily be adapted for other systems:
(30)
where:Bj is the biomass of consumer species j;Tj is the mass-specific respiration rate of species j (modelled as (modelled as 25.0�� jTj waT
j with
with with jT
a an allometric coefficient and wj the mean individual biomass of species j);
ekj is the assimilation efficiency for species as a predator j when feeding on prey k;Fkj is the functional response (i.e. amount of prey species k consumed
by predator species j per unit of time);mj is the “other natural mortality” rate of species j (due to species not
explicitly included);Hj is the harvest rate of species j; and
jj vu , are constants specifying the density dependence in other natural mortality.
The density-dependent mortality form can be used to represent strong nonlinearities in mortality rate, for example as a function of density due to overcrowding of sea lion colonies during the breeding season (Koen-Alonso and Yodzis, 2005). A particularly useful feature of the differential equation (30) above is that it is easy to substitute different functional response variants using the general form derived by Koen-Alonso and Yodzis (2005):
���
iijij
ijij Ch
CF
1 (31)
(31)
where hij is the handling time per unit of prey i andCij is the capture rate of prey i by predator j, the formulation of which
varies depending on the functional response assumed.
Difficulties in achieving management-quality multi-species modelsKoen-Alonso and Yodzis (2005) stressed the importance of correctly specifying the form of the functional response and experimented with five different formulations (see
Review of current modelling approaches
jvjjjj
ijiikj
kkjjj
j HBBmFBFeTBdt
dBj
� � ����������������

Models for an ecosystem approach to fisheries34
Table A1a-d). Apart from the allometry-derived parameters, they estimated the model parameters by minimising the negative log-likelihood for observed (from a database compiling all the time-series data) biomasses. Particularly commendable is that, unlike most of the multi-species models presented, they attempted a detailed analysis of parameter uncertainty using the sample-importance-resample (SIR) algorithm (Punt and Hilborn, 1997; McAllister et al., 1994). The major contribution of this approach thus far resides in it having highlighted the dangers of drawing definitive conclusions from a single model structure.
The Koen-Alonso and Yodzis (2005) multi-species trophodynamic modelling approach is both time-consuming and data intensive, but is a useful tool in systems where biomass (and catch) estimates are available for a subset (at least) of the ecosystem. Bjørge et al. (2002) present another data intensive approach that uses a combined Geographic Information System GIS and energetics modelling approach. They used radio-tracking data to construct an energetics simulation model of a population of harbor seals in Norway. By integrating their results into a GIS model, they were able to analyse the co-occurrence of fishing operations and seals. They showed that harbor seal predation probably negatively impacted some fisheries but had a positive effect on shrimp catches due to the removal of benthic-feeding fishes by seals. More recently, Cornick, Neill and Grant (2006) used a bioenergetics modelling approach to project Steller sea lion (Eumetopias jubatus) population trends under various scenarios of walleye Pollock harvest. Their model included a sea lion life history component, a sea lion bioenergetics component and a groundfish energetic component. The last component did not explicitly model the groundfish population – instead it converted randomly-drawn standing stock biomass into energy available to the Steller sea lions. It provides an interesting example of a tailored approach including only as much detail as required to address a specific question. Their simulations were unable to produce energy deficits sufficient to account for the observed declines in the western US stock of the Steller sea lion.
2.5 CCAMLR MODEL DEVELOPMENT
2.5.1 Predator-prey modelsThe adoption of the Convention for the Conservation of Antarctic Marine Living Resources (CCAMLR) and particularly Article II thereof (for a discussion of the implications see, e.g. Butterworth, 1986), was a crucial step forward in acknowledging the importance of maintaining the ecological relationships between harvested, dependent and related populations of marine resources. Krill is the primary food source of a number of marine mammal species in the Antarctic and concern has been expressed that a rapidly expanding krill fishery might negatively impact (retard) the recovery of previously overexploited populations such as the large baleen whales of the Southern Hemisphere.
Predator-prey modelling procedures have been developed through CCAMLR to assess the impact of Antarctic krill harvesting on krill predator populations and to explore means of incorporating the needs of these predators into the models that are used for recommending annual krill catch levels. Initial modelling procedures estimated the level of krill fishing intensity that would reduce krill availability and hence the population of a predator to a particular level (Butterworth and Thomson, 1995; extended in Thomson et al., 2000). More recently models such as KPFM, EPOC and SMOM have been developed to consider these krill predation issues (see more details below). Hill et al. (2006) also present a recent review of models pertaining to the Southern Ocean.
A particular concern in CCAMLR has been the potential negative effects of concentration of krill fishing in the vicinity of land-based predator breeding colonies, for which the foraging ranges of parents are necessarily restricted. Mangel and Switzer
35
(1998) developed a model at the level of the foraging trip for the effects of a fishery on krill (Euphausia superba) predators, using the Adelie penguin (Pygoscelis adeliae) as an example. Their approach of incorporating advection and diffusion processes in a spatio-temporal framework to model krill availability in relation to the location of breeding colonies could usefully be extended and applied to situations involving seal populations. Given the large interannual fluctuations observed in krill biomass, these models may also need to include the capacity to incorporate physical forcing of prey dynamics (Constable, 2001; Atkinson et al., 2004). Alonzo, Switzer and Mangel (2003) have developed a model using individual-behaviour to predict the indirect effects of Antarctic krill fisheries on penguin foraging.
In general, initiatives such as these pursued under CCAMLR recognize the need to balance the needs of predators with the socio-economic pressures underlying fishery harvests.
2.5.2 KPFM (Krill-Predator-Fishery Model)The krill–predator–fishery model (KPFM) of Watters et al. (2005, 2006) is being developed specifically to address options for subdivision of the precautionary krill catch limit in the Antarctic Peninsula region (Statistical Area 48) amongst SSMUs (Small Scale Management Units) with areas in the range 104 to 93x104 km2. The model is a whole ecosystem model in that it can be used to investigate the roles of transport, production, predation and harvesting, but it also resembles a MRM in some aspects as it focuses on aspects considered to be most important rather than fully specifying the entire spectrum of ecosystem processes and species. The model is spatially resolved to the level of SSMUs and surrounding oceanic areas and it uses a transition matrix approach to model the transport of krill between areas (Watters et al., 2005). Spatially-explicit delay-difference models are used to describe krill and predator population dynamics. In the model krill populations are split into juvenile and adult stages and predators are split into juveniles, breeding adults and non-breeding adults. The model is currently set up to include from one to four stocks of predators per spatial cell. These are typically generic seals, penguins, whales and fish, but specific rather than generic groups may be included instead. Recent modifications (KPFM2) include extensions to represent seasonality and a structure for allowing predators to move between SSMUs (Watters et al., 2006). The model has an interesting formulation pertaining to the way in which predator recruitment (but not survival) depends on krill consumption. Associated work has focused on compiling data and input parameters for ecosystem dynamics models of the region (Hill et al., in press), facilitating the comparison of outputs from different modelling approaches (see below).
A notable feature of the approach is that a Monte Carlo simulation framework is being used to integrate the effects of numerical uncertainty (Watters et al., 2005, 2006). Multiple simulations employing alternative assumptions are run to assess structural uncertainty. Performance measures are being developed both to evaluate catch-allocation procedures and to assess tradeoffs between predator and fishery performance.
The model thus has a number of very useful features, but also some disadvantages such as that krill in transit between SSMUs do not suffer predation and fishing mortalities and the delay-difference dynamics do not capture full age-structured complexity. An important assumption that is being tested and is a big unknown in the model is the extent to which predators and the fishery are equal competitors and hence are equally efficient at competing for limited resources.
The KPFM will permit evaluation of a wide range of management options that account for the needs of other species when deciding krill catch limits in different regions. This modelling work is being complemented to some extent by a krill flux model (Plagányi and Butterworth, 2005b) that is currently being developed to quantify the flux of krill past islands in the Antarctic Peninsula region and by the SMOM
Review of current modelling approaches

Models for an ecosystem approach to fisheries36
described below. CCAMLR (2006) noted the broad agreement in trajectories between SMOM and KPFM2 in simulation trials when the parameterisation of the two models was consistent, increasing confidence in these modelling approaches for evaluating different fishing options.
2.5.3 EPOC model (Ecosystem Productivity Ocean Climate Model)An Ecosystem Productivity Ocean Climate (EPOC) model (Constable, 2005, 2006), initially applied only to krill, is being developed using an object-oriented framework built around the following modules: (i) biota; (ii) environment; (iii) human activities; (iv) management; (v) outputs, and (vi) presentation, statistics and visualization. Each element within a module is an object carrying all its own functions and data. It is thus designed to be a fully flexible plug-and-play modelling framework in response to a need to easily explore the consequences of uncertainty in model structures as well as widely varying knowledge on different parts of the ecosystem. The model is being set up to easily examine the sensitivity of outcomes to changes in model structures, not only in terms of the magnitudes of parameters but also in the spatial, temporal and functional structure of the system. An added advantage is that within the same simulation, different species can be modelled at different spatial and temporal scales as well as with different biological and ecological levels of complexity (Constable, 2005).
The model is currently being used for developing a Heard Island whole ecosystem model that will also include oceanographic features (A. Constable, Australian Antarctic Division, pers. comm.).
2.5.4 Mori and Butterworth multi-species modelMori and Butterworth (2004, 2005, 2006) developed a model to investigate whether predator– prey interactions alone can broadly explain observed population trends in the Antarctic ecosystem since the onset of seal harvests in 1780. The final model components include krill, four baleen whale (blue, fin, humpback and minke) and two seal (Antarctic fur and crabeater) species in two large sectors of the Antarctic. The Atlantic/Indian and Pacific sectors are differentiated because of much larger past harvests in the former, which consequently shows far greater changes in species abundances in the model outpat. Unlike most of the other models discussed, the Mori and Butterworth krill-whale-seal model is fitted to available data on predator abundances and trends, whilst acknowledging that these data are not without their problems. The model is successful in explaining observed population trends in the Southern Ocean on the basis of predator– prey interactions alone, though some difficulties were encountered.
Early model versions (Mori and Butterworth, 2004) considered baleen whales and krill only, but an important finding was that it is necessary to also consider other species in order to explain observed trends. In particular, crabeater seals appear to play an important role.
The model equations were constructed to be as simple as possible whilst still capturing the important population dynamics features. The dynamics of krill are described by (Mori and Butterworth, 2006):
� �� � � ��
��
���
�
�
���
�
�
��
�
�
��
�
�����
jna
yna
ajy
nay
j
a
aya
yaa
yay
BBj
NBKB
BrBB,
1 1�
(32)
(32)
where:where: ayB is the biomass of krill in region a is the intrinsic growth rate of krill in region
is the biomass of krill in region a in year y; ar is the intrinsic growth rate of krill in region is the intrinsic growth rate of krill in region a; aK is the carrying capacity of krill in region a; j� is the maximum per capita consumption rate of krill by predator species is the maximum per capita consumption rate of krill by predator species j;
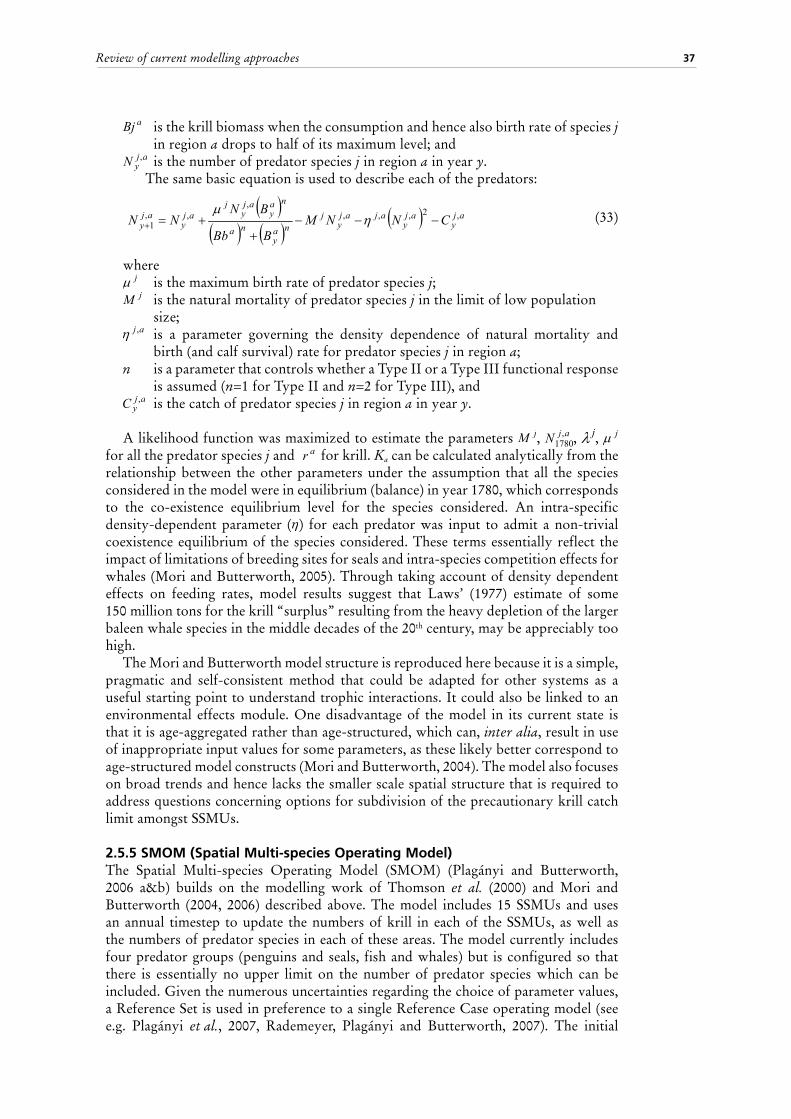
37
aBj is the krill biomass when the consumption and hence also birth rate of species is the krill biomass when the consumption and hence also birth rate of species j in region a drops to half of its maximum level; anddrops to half of its maximum level, and
ajyN, is the number of predator species j in region a in year y.
The same basic equation is used to describe each of the predators:
� �� � � �
� � ajy
ajy
ajajy
jna
yna
nay
ajy
jaj
yaj
y CNNMBBb
BNNN ,2,,,
,,,
1 ����
��� ��
(33)
where
(33)
wherej� is the maximum birth rate of predator species is the maximum birth rate of predator species j; jM is the natural mortality of predator species j in the limit of low population
size; aj ,� is a parameter governing the density depende is a parameter governing the density dependence of natural mortality and
birth (and calf survival) rate for predator species j in region a; n is a parameter that controls whether a Type II or a Type III functional response
is assumed (n=1 for Type II and n=2 for Type III), and aj
yC, is the catch of predator species is the catch of predator species j in region a in year y.
A likelihood function was maximized to estimate the parameters d to estimate the parameters jM , j , ajN ,1780, 1780 ,
j� , j� , j� for all the for all the predator species j and , and ar for krill.
between the other parameters under the assumption th for krill. Ka can be calculated analytically from the
relationship between the other parameters under the assumption that all the species considered in the model were in equilibrium (balance) in year 1780, which corresponds to the co-existence equilibrium level for the species considered. An intra-specific density-dependent parameter (a-specific density-dependent parameter (� ) for each ) for each predator was input to admit a non-trivial coexistence equilibrium of the species considered. These terms essentially reflect the impact of limitations of breeding sites for seals and intra-species competition effects for whales (Mori and Butterworth, 2005). Through taking account of density dependent effects on feeding rates, model results suggest that Laws’ (1977) estimate of some 150 million tons for the krill “surplus” resulting from the heavy depletion of the larger baleen whale species in the middle decades of the 20th century, may be appreciably too high.
The Mori and Butterworth model structure is reproduced here because it is a simple, pragmatic and self-consistent method that could be adapted for other systems as a useful starting point to understand trophic interactions. It could also be linked to an environmental effects module. One disadvantage of the model in its current state is that it is age-aggregated rather than age-structured, which can, inter alia, result in use of inappropriate input values for some parameters, as these likely better correspond to age-structured model constructs (Mori and Butterworth, 2004). The model also focuses on broad trends and hence lacks the smaller scale spatial structure that is required to address questions concerning options for subdivision of the precautionary krill catch limit amongst SSMUs.
2.5.5 SMOM (Spatial Multi-species Operating Model)The Spatial Multi-species Operating Model (SMOM) (Plagányi and Butterworth, 2006 a&b) builds on the modelling work of Thomson et al. (2000) and Mori and Butterworth (2004, 2006) described above. The model includes 15 SSMUs and uses an annual timestep to update the numbers of krill in each of the SSMUs, as well as the numbers of predator species in each of these areas. The model currently includes four predator groups (penguins and seals, fish and whales) but is configured so that there is essentially no upper limit on the number of predator species which can be included. Given the numerous uncertainties regarding the choice of parameter values, a Reference Set is used in preference to a single Reference Case operating model (see e.g. Plagányi et al., 2007, Rademeyer, Plagányi and Butterworth, 2007). The initial
Review of current modelling approaches

Models for an ecosystem approach to fisheries38
Reference Set used comprises 12 alternative combinations that essentially try to bound the uncertainty in the choice of survival estimates as well as the breeding success relationship. Stochastic replicates are produced to explore different hypotheses such as those related to the transport of krill.
SMOM is intended for use as an operating model in a formal Management Procedure (MP) framework. Different MPs are simulation tested with their performances being compared on the basis of an agreed set of performance statistics which essentially compare the risks of reducing the abundance of predators below certain levels, as well as comparing the variability in future average krill catches per SSMU associated with each MP. CCAMLR (2006) has encouraged the further development of spatially-explicit management frameworks and the development and evaluation of operating models and decision rules for adjusting fishing activities (e.g. catch limits) based on field data in the future.

39
3. Comparison of models
3.1 LEVEL OF COMPLEXITY AND REALISMThere is a wide range in the levels of complexity of the 20 modelling approaches considered here (Tables A1-A4, Figures 1-3). Most of the models may be categorized as of the MRM-type, with only EwE and ATLANTIS representing the full trophic spectrum (Figure 2). There is typically a trade-off between the range in trophic levels considered and the corresponding detail with which each group is represented – for example, in practice EwE models cannot represent the full age-structure of all groups whereas models built using a restricted subset only of the ecosystem may include very detailed length/age structure information (e.g. GADGET).
It was not considered practical or feasible to list model parameters in detail for all 20 modelling approaches. However, entries in Table A2 are intended to give a rough idea of the sorts and numbers of parameters required for each model. By their nature, ecosystem models are parameter- and data-hungry. It is sometimes argued that single-species assessment models contain as many or more parameters. However, these parameters are typically estimated by fitting to data and it is relatively straightforward to test sensitivity to alternative values. The difficulty with considering multi-species effects is that the field is still wide open in terms of understanding of the functional forms of interaction and the availability of data to specify or estimate many of the parameter values is limited. In the synthesis presented here, attention is drawn to selected parameter values to which it is difficult to ascribe values conclusively.
3.2 FUNCTIONAL RESPONSE FORMULATIONSThe different functional form of interactions in EwE’s foraging arena (per-capita consumption by a predator decreases with the overall abundance of that predator) compared to MSVPA’s (and other models’) constant ration model (per-capita consumption is set equal to the predator’s required daily ration) for predator feeding has important implications for model behaviour and predictions. It tends (desirably) to damp the large amplitude oscillations in population size that are frequently predicted by multi-species models (see, for example, Mori and Butterworth, 2004). However, this has additional consequences as detailed below.
Butterworth and Plagányi (2004) contrast the assumptions of the MSVPA (and its associated derivatives that provide projections) and ECOSIM approaches, which they categorize as “efficient predator models” and “hungry predator models” respectively. MSVPA assumes that a predator is always able to consume its desired daily ration of food. If predator is always able to consume its desired daily ration of food. If jN is the number of is the number of predators of species j and the number of their prey species i (i ( iN ) is kept fixed, then Fig. 4a ) is kept fixed, then Figure 4a shows the implication of the MSVPA assumption for how the total consumption rate tion for how the total consumption rate ijQ of prey i by predator j grows as the number of predators increases: linear proportionality.
On the other hand, ECOSIM is based upon the foraging arena model (Walters, Christensen and Pauly, 1997) (Equation 5) which leads to the form of relationship between total consumption rate lationship between total consumption rate ijQ and the number of predators number of predators jN as shown in Figure 4b. When used in combinations, MSVPA and ECOSIM can possibly make a first attempt at bounding the likely impact on a fishery of, for example, a reduction in seal numbers in that, based on the assumed forms of interaction, the former approach is likely to overestimate the effect and the latter to underestimate it (at least when using default or low vulnerability settings) (Plagányi and Butterworth, 2005). The data

Models for an ecosystem approach to fisheries40
FIGURE 4Schematic showing how the total consumption rate of prey species i by predator species pecies � gr
nd its de grows as the number of predators increase for the two contrasted cases: a)
MSVPA (and its derivatives providing projections) showing a linear proportionality relationship and b) ECOSIM’s foraging arena-based model (shape shown typical for
default parameters) in which the total rate saturates at a constant level for high numbers of predators (from Plagányi and Butterworth, 2004, 2005a)
(a)
CO
NS
UM
PT
ION
RA
TE
NUMBER OF PREDATORS Nj
(b)
hungry nature of MSVPA does not necessarily preclude the use of MSFOR to predict forwards, provided the model is initialized using sensible assumptions based on at least some data (see IWC, 2004a).
Walters et al. (2000) advance two arguments to support the foraging arena over the constant ration model, namely that satiation is rare in nature “predators with full stomachs are not a common field observation” (Walters and Kitchell, 2001) and that handling time effects are trivial in the field because if animals increased their rate
41
of effective search to the extent where handling time became an issue, they would be exposed to additional risk of predation hence they avoid doing this. Walters and Martell (2004) explain further that the basic idea of EwE’s foraging arena theory is that marine species have limited access to prey resources because of spatial habitat-choice behaviours aimed at moderating their predation risk. The IWC (2004a) describes the biological underpinnings of the foraging arena model as “controversial and uncertain” because there appears to be little observational evidence to distinguish the two models.
One of the key issues in moving the development of multi-species models forward is thus the appropriate form of the functional response formulations to be considered in the models. At opposite extremes, formulations such as that used by ECOSIM depict per-capita consumption by a predator as decreasing with the overall abundance of that predator, whereas constant ration formulations (such as that used in MSVPA approaches) set per-capita consumption as equal to the predator’s required daily ration. It is strongly recommended that effort be focused on appropriate data collection and/ or experiments to assist in shedding light as to the most appropriate choice of model form to represent feeding behaviour. Fenlon and Faddy (2006) argue that rather than using mechanistic models to interpret data from predator-prey systems, simple logistic regression analyses are more consistent with the data and take stochastic variation into account. They present some models for dealing with over-dispersion, including one based on the beta-binomial distribution which is shown to provide a better fit to experimental data.
However, extrapolations from the microscale to the macroscale require integrating the form of a functional response over the area concerned and independent estimates of parameters at the microscale will not necessarily remain appropriate if the same functional form is assumed to govern macroscale behaviour. Experimental estimates of suitability often refer only to the microscale, but multi-species models require parameter values that reflect effective responses at the macroscale level (Lindstrøm and Haug, 2001). Reliable integration of microscale estimates of suitabilities over the spatio-temporal distributions for both predators and prey to provide macroscale parameter values, is likely a realistic objective for the longer term only; in the shorter term, regression approaches will probably be needed to attempt to relate macroscale changes in diet to variations in prey abundance. Studies comparing the performance or predictions of models representing processes at different scales and/or with different levels of spatial aggregation can also be informative (Fulton, Smith and Johnson, 2003a).
Most multi-species models utilize a hyperbolic (Type II) functional relationship (Jeschke, Kopp and Tollrian, 2002; Mackinson et al., 2003). Although difficult to implement because additional parameters need to be estimated, a sigmoidal (Type III) functional response is likely more appropriate when modelling generalist predators, such as whales (Mackinson et al., 2003). This is because these predators are generalists and hence exert less of a strong effect on depleted prey stocks, as can be depicted using a sigmoidal relationship. Given model structural uncertainty due to a paucity of knowledge on functional responses, definitive conclusions cannot be drawn from models based on a single structure (Koen-Alonso and Yodzis, 2005). However, the biomass of available food is often such that it spans a limited section of the functional response curves where they are all very similar so that it is hard to differentiate between alternative representations, unless there exists some form of extreme or transient conditions either temporally or spatially (Walters 1986, Fulton, Smith and Johnson, 2003b). Ideally, evaluations to provide advice on the impact of, say, the effects of fishing a predator on fisheries for prey species should not be based on a single representation of species interactions; but rather the robustness of results across a range of plausible functional forms needs to be considered. Bayesian methods
Comparison of models
Models for an ecosystem approach to fisheries42
are a useful tool for taking account of variability in and uncertainty about feeding relationships.
3.3 WHOLE ECOSYSTEM MODELS VS MRMSAs highlighted by an international review panel at the 2004 BENEFIT Stock Assessment Workshop (BENEFIT, 2004), the choice of which multi-species models to use needs to be linked to scientific goals and/or management objectives. For objectives related to broad-scale questions regarding the structure of the ecosystem, ECOPATH/ECOSIM models might be used; other models may be more appropriate for more specific questions. Unlike EwE, individually tailored approaches such as MRMs have more flexibility in modelling the dynamics of marine predators, but usually ignore any potential effects that changing prey populations may have on the predators themselves. Fulton and Smith (2004) strongly recommend that ideally a suite of different “minimum-realistic” ecosystem models should be constructed and their results compared. However, given limited person-power and pressure to produce results, it is important first to engage in discussions regarding which are the preferred modelling approach/es to be pursued in each context. Thus, for example, as a first attempt to address hake multi-species interactions, the 2004 BENEFIT Workshop recommended that existing models should be adapted to provide estimates of the predation mortality on hake that is generated by the two hake species. Similarly, CCAMLR has tended to consider simpler predator-prey type models for the Southern Ocean (e.g. Thomson et al., 2000).
Nevertheless, whole ecosystem models clearly have an important role to play, given that few of the other models discussed are suitable for exploring broader ecosystem questions (Figure 3, Table A4). While predictive multi-species population models may have limited impact on management decisions in the short-term, if only because of considerations of lack of data, model complexity and uncertainty and research costs, there are some initiatives that are being pursued with the information that is at hand at present. It may be instructive to investigate possibilities of closer links between ECOPATH data inputs and single-species stock assessment models. In considering ECOPATH’s potential to contribute to single-species models, there is a need to pursue the question of whether the constraints provided by the ECOPATH mass-balance equation appreciably reduce uncertainties associated with single species models. The mass-balance relationships of the ECOPATH approach (Christensen and Pauly, 1992) provide some information beyond that conventionally incorporated in single-species assessments and do so essentially independent of concerns about how best to model the functional forms of species interactions. Preliminary computations (Somhlaba et al., 2004; Somhlaba, 2006) suggest that for the Benguela system, the precision of single-species assessment estimates is unlikely to be improved through taking account of mass-balance constraints. On the other hand, outputs from single-species stock assessment models may have some utility for improving biomass and productivity estimates (and their associated variance estimates) used as inputs to ECOPATH and hence ECOSIM. Recent additions to the EwE software (Christensen and Walters, 2004) mean that it is possible to include more life history stages in ECOSIM models.
Butterworth and Plagányi (2004) suggest that until “Whole Ecosystem” approaches have been shown to demonstrate adequate robustness in their predictions to uncertainties in input data and alternative plausible choices for the functional forms of interactions between species, they should have lower priority than the development of Minimum Realistic Models, given an aim of providing inputs on say catch levels of a target species. They argue that in the context of providing fisheries management advice, MRMs would seem the obvious first step to take in the process of moving from single-species models to the extremely ambitious and demanding aim of a reliable predictive model for all major ecosystem components. On the other hand, depending on the

43
nature of the question, whole ecosystem models may be the only suitable tool to use, particularly when management strategies other than simple TAC application are being considered. Ecosystem-based management is still in its infancy and hence there is as yet no consensus on what are the most appropriate management tools. In many areas there is the realisation that TACs spatial or temporal are unlikely to be appropriate (or feasible) for all species and that other tools such as closures and gear mitigation devices may need to be called upon (E. Fulton, pers. comm.). In this context, multi-species and ecosystem models have a large role to play in assessing the utility of these tools and even the effectiveness of proposed monitoring schemes or indicators (e.g. Fulton, Smith and Punt, 2005).
3.4 ADVANTAGES, DISADVANTAGES AND LIMITATIONSSelected advantages, disadvantages and limitations of the 20 modelling approaches considered are listed in Table A3. This is by no means a comprehensive list and it would be instructive for future studies to expand this list. In its current form, it provides a rough overview of some of the strengths and weaknesses of the different approaches.
Comparison of models

45
4. Potential of tools to address multi-species research questions
In reviewing the methods available for assessing the impacts of ecological interactions between species and fisheries, it is important not to lose sight of the aims of the various approaches. In the current (fisheries management) context, most of the questions to be addressed by multi-species/ecosystem models fall under one of the following headings.
1. Understanding ecosystem structure and functioning, e.g. relative roles of top-down and bottom-up processes.
2. What is the impact of a target fish species on other species in the ecosystem? For example, does the removal of the target species negatively impact other species which depend on it as prey (e.g. Gislason, 2003)? Bycatch issues are dealt with separately under 13 below.
3. What is the effect on top predators of removing their prey? This question is listed separately given that it is the focus of many multi-species studies. The classic example is CCAMLR’s focus on the possible impacts on Southern Ocean predators of an expanding krill fishery.
4. What is the extent of competition between marine mammals and fisheries (see e.g. Trites, Christensen and Pauly, 1997; Harwood and McLaren, 2002; Kaschner, 2004; Plagányi and Butterworth, 2002; 2005a)? This includes consideration of both “direct competition”, which involves reduction (by consumption or utilisation) of a limited resource, but with no direct interactions between the competing species (Clapham and Brownell, 1996), as when a marine mammal eats a fish that could otherwise have been caught by a fisherman and “indirect competition” (e.g. Pauly and Christensen, 1995) in which the competitors may target different resources but these are linked because of a foodweb effect (e.g. when a marine mammal consumes a fish that is an important prey species of a commercially desirable fish species).
5. What ecosystem considerations need to be taken into account to rebuild depleted fish stocks?
6. Is the single-species-based assessment of the status and productivity of a target species severely biased because of a failure to consider multi-species interactions (e.g. Pope, 1991; Walters and Kitchell, 2001; Walters et al., 2005)?
7. Is there an ecologically or economically better way to distribute fishing effort in an ecosystem? The focus here is, for example, on the extent to which different species should be targeted so as to optimise use of the ecosystem both ecologically and economically.
8. Are there relatively unexploited species in an ecosystem which could be targeted without having a detrimental effect on other components of the ecosystem?
9. Is fishing on particular stocks driving the ecosystem to a less productive/less desirable state (e.g. a new stable state or an adverse shift in marine communities (Trites et al., 1999, Scheffer, Carpenter and de Young, 2005)?
10. Is the spatial and temporal concentration of fishing negatively impacting the longterm viability of species such as land-breeding marine mammal predators and seabirds? Should the spatial distribution of fishing effort be altered to account for the needs of e.g. land-breeding predators. This includes consideration of, for example, fishing exclusion zones and MPAs (see e.g. Dalton, 2004; Hilborn et al., 2004).

Models for an ecosystem approach to fisheries46
11. Effects of physical/environmental factors on the resources on which fisheries depend.
12. Effects of habitat modification. This includes consideration of effects such as trawling damaging benthic habitats and hence having an indirect negative effect on fish stocks.
13. What are the impacts of bycatch?14. Effects of the introduction of non-native species.Naturally there is a large number of very specific questions that models have been
constructed to address and every (good) model is useful in the context for which it has been designed. The list above is far from complete, but encompasses most of the commonly phrased questions.
In terms of a broad overview of the usefulness of the different modelling approaches discussed here, some preliminary suggestions are presented in Table A4 which highlights those models considered by the report’s author to show the most potential to address each of the questions above. This is not intended as the final word on the subject, but rather as a starting point to compare the models with slightly more specific aims in mind. Given that it can be argued that any ecosystem model contributes to one’s understanding of the system, the models have been categorized as either showing the potential to contribute to an understanding of the functioning of the ecosystem as a whole or to a subset only, recognizing that both these aims are important in different contexts. Glancing across the 20 modelling approaches considered in Table A4, it is evident that collectively they cover all the research questions posed here, but that there are fairly large gaps in the suitability of specific approaches to address subsets of the questions posed above. Although the finer details of Table A4 can and indeed should be further debated, the schematic presented here may be useful as a first step to assist in choosing between models given specific EBFM research questions. Note that although EwE, ATLANTIS and INVITRO emerge as the clear “winners” in terms of the range of questions they are capable of addressing, a word of caution is necessary here because that feature alone does not guarantee that they necessarily provide the best approaches to address a specific issue.
The research question that emerged as most poorly addressed across all models was that of the effects of habitat modification, with only ATLANTIS rating highly as a tool in this regard (Table A4). ECOSPACE can also be used to evaluate the effects of habitat modification and EwE has some potential for indirectly exploring aspects of this issue, through trophic mediation. Although there are fairly straightforward examples of this issue, less direct cases can be rather intractable (see e.g. Sainsbury et al., 1997, Auster and Langton 1998). On the other hand, the deleterious effects of trawling have long rung alarm bells (e.g. McConnaughey, Mier and Dew, 2000) and this may point to a need for more focussed attention to address this issue – naturally in combination with empirical studies. In contrast, Table A4 suggests that there has been a definite increasing trend towards constructing models capable of being driven by physical and other environmental variables. This may be in response to the indication that trophic interactions are limited in the extent to which they can explain observed trends and changes in the ecosystem.
A separate category altogether pertains to ecosystem models constructed with the primary purpose of being used for model testing (e.g. Yodzis, 1998), comparison purposes (e.g. Fulton et al., 2004) or in a simulation testing framework. An example of the latter is the use of ATLANTIS as an operating model (see next section) to evaluate the performance of ecological indicators (Fulton, Smith and Punt, 2004). These are critical issues to be addressed and it is hoped that in future as much effort will be focused on these questions as on the further development of new or existing models. It is particularly useful to test ecosystem models such as EwE by generating simulated data with known parameters using an operating model such as ATLANTIS. In testing

47
ECOPATH in this way, it was found that while useful for capturing snapshots and giving great insight into ecosystem structure and potentially counter-intuitive system responses in a “what-if” context, it was ill suited in the role of an assessment model (Fulton, Smith and Punt, 2005; E. Fulton, pers. comm.). This was due to changing error structures through time, the potential problems with data compatibility (particularly when diet data was collected at a point in time that is distant from the time the biomass estimates are made) and the potential to miss once rare links that can become important if conditions change substantially (E. Fulton, pers. comm.). These are the same sorts of problems likely to afflict most ecosystem models, highlighting the importance of seeking the same thorough understanding of the limitations of ecosystem models as is the case for single-species assessment models.
Potential of tools to address multi-species research questions


49
5. Roles for models in operational management procedure development
Operational Management Procedure (OMP) (Butterworth, Cochrane and De Oliveira, 1997; de Oliveira et al., 1998, Butterworth and Punt, 1999), or Management Strategy Evaluation (MSE) approaches (Smith, Sainsbury and Stevens, 1999), provide scientific recommendations for management measures such as TACs, closures, gear modifications and monitoring schemes. The OMP approach has the potential to complement multi-species approaches through its focus on the identification and modelling of uncertainties, as well as through balancing different resource dynamics representations and associated trophic dependencies and interactions (Sainsbury, Punt and Smith, 2000). It has already been used in this role in Australia (Little et al., 2006; Smith et al., 2004) and a spatial and multi-species MP is being developed for the Antarctic Peninsula krill-predator-fishery system (Plagányi and Butterworth, 2006, a&b). Elsewhere in the world attempts are increasingly been documented to incorporate bycatch, stock structure and spatial aspects into MPs (e.g. Punt, Smith and Cui, 2002; Dichmont et al., 2005).
OMPs typically involve both “Decision Models” and “Operating Models” (also termed “Testing Models”). The former essentially integrate resource-monitoring information (e.g. CPUE, survey indices of abundance) together with a control rule to provide a scientific recommendation for management such as a TAC and thus do not necessarily provide an accurate representation of the possible underlying resource dynamics (Butterworth and Plagányi, 2004). In contrast Operating Models should accurately reflect alternative possibilities for the true underlying dynamics of the resource or resources under consideration. They may seek a high degree of realism and hence may be quite complex (e.g. IWC, 2003; Fulton, Smith and Punt, 2004). Operating models provide the basis for simulation testing to assess how well alternative candidate Decision Models achieve the objectives sought by the management authority.
Butterworth and Plagányi (2004) speculate that there is clearly an immediate role for ecosystem models as Operating Models, but that the development of tactical ecosystem models as the basis for computing harvest limits within the OMPs themselves still seems some time off. This is primarily because of the uncertainty surrounding appropriate choices for the numerous parameter values and the functional forms to describe species interactions. Cochrane (1998, 2002) and Sainsbury, Punt and Smith (2000) note that it remains to be seen whether or not the associated levels of uncertainty can be adequately constrained to yield scientifically defensible and practically useful conclusions. Prior to the work of Fulton, Smith and Punt (2004), the inclusion of ecosystem effects in OMP evaluation exercises was generally implicit only. For example, rather than using a full multi-species operating model in simulation testing of its Revised Management Procedure, the Scientific Committee of the International Whaling Commission (IWC) used a simpler approach that allowed for time-dependence in the intrinsic growth rate and carrying capacity parameters to mimic the typical impacts on that population of changing levels of other predator and prey species (IWC, 1989). OMP testing procedures for some key South African resources have similarly used changes in single species parameters (such as K) as a surrogate for ecosystem effects (Rademeyer, Plagányi and Butterworth, 2005) and

Models for an ecosystem approach to fisheries50
attempts are underway to incorporate functional relationships between seabirds and their prey into the operating models for sardine (Sardinops sagax) and anchovy (Engraulis encrasicolus), with these in turn augmented by population dynamic model/s for the predator/s of concern (Plagányi et al., 2007).
51
6. Moving models forward – future developments
This report has focused on describing many of the multi-species and ecosystem models in their current form. However, in several cases, these are constantly evolving and there is currently a global increase in the effort directed at developing ecosystem models. This ranges from increasing attempts to extend single-species assessment models to include additional important prey or predator species, to extending ecosystem models to evaluate policy options for management.
The MSVPA/MSFOR class of models, initially applied to the ICES areas, were some of the first multi-species approaches to be developed but are still being applied and adapted (e.g. Livingston and Jurado-Molina, 2000). Hybrid versions (e.g. Mohn and Bowen, 1996) have been developed and more recently MSFOR is bring rewritten as MSM (Multi-species Statistical Model) (Jurado-Molina, Livingston and Ianelli, 2005; Jurado-Molina, Livingston and Gallucci, 2005). Lewy and Vinther (2004) (see also Lewy and Nielsen, 2003) are similarly developing a stochastic multi-species model that takes account of uncertainties in catch-at-age, stomach content and other data.
Regarding other MRMs, there are plans to revise the original Punt and Butterworth (1995) MRM of hake-seal interactions in the southern Benguela. The BORMICON model has evolved into GADGET and the latter is currently still being developed with case-studies having commenced only recently. A Mediterranean Sea model is being developed and is the first attempt at including a very large number of species in a GADGET model (see e.g. http://www1.uni-hamburg.de/BECAUSE/content/case_study_5.html).
The pelagic ecosystem model SEAPODYM has evolved from the earlier SEPODYM. Recent work has focused on running simulations at a global scale (with a resolution of one month x 1° latitude x 2° longitude) and preliminary predictions have been produced for the mid-trophic (forage) components, with a run covering 1860-2100, using a Intergovermental Panel on Climate Change (IPCC) climate change scenario for the coming century. New modules are on the table to be developed, first for marine turtles and then for sharks, marine mammals or even small pelagics such as anchovies and sardines. Similar advances are being made in other biological models tied to global ocean models, such as NEMURO (Nishikawa and Yasuda, 2005; Kishi, Nakajima and Kamezawa, 2005).
EwE has evolved considerably over the past few years and a large project is currently underway to develop a new generation of EwE (see www.lenfestoceanfutures.org) that will be fully modularized. A building-block version is to be created that will facilitate construction of individually tailored versions (V. Christensen, University of British Columbia, Canada, pers. comm.). The new version is scheduled for release by September, 2007 and may substantially advance ecosystem-based fisheries management by providing a readily accessible and easy to use tool capable of producing predictions based on user inputs by managers and others.
Several hybrid EwE versions have already been constructed to date (e.g. Aydin et al., 2002) and are being used as sensitivity analyses in stock assessments, for example to address questions such as the potential impacts of a single-species TAC on other species (K. Aydin, pers comm.). Given a growing appreciation of the need to consider economic factors, one encouraging development is that of the GEEM (General Equilibrium Ecosystem Model) (Tschirhart and Finnoff, 2003; Tschirhart, 2004,

Models for an ecosystem approach to fisheries52
Eichner and Tschirhart in press) which combines multi-species and economic sector modelling. The starting base is the same as ECOPATH, but GEEM incorporates a novel approach to predict functional responses by allowing predators to make “rational economic choices” based on the expected energetic gain from different prey types (K. Aydin, pers. comm.).
The bioenergetic-allometric modelling approach of Koen-Alonso and Yodzis (2005) is being extended to permit investigation of some of the potential effects of temperature, with a longer term goal being the integration of economic considerations into ecosystem-based management (Koen-Alonso, Northwest Atlantic Fisheries Centre, Fisheries and Oceans Canada, pers comm.). Temperature-dependence is being introduced into the dynamics based on the framework developed by Vasseur and McCann (2005). This will permit initial investigations of the potential effects of global warming through an analysis of, inter alia, the effects of temperature on basic metabolic pathways.
Substantial progress has been made in coupling physical models to biological models. Taking this one step further, others have argued for the importance of considering the coupling between ecosystems – the meta-ecosystem approach (Loreau, Mouquet and Holt, 2003; Varpe, Fiksen and Slotte, 2005). This is particularly important when considering species such as salmon which migrate from oceanic feeding grounds to rivers and lakes and species such as herring which migrate between feeding, overwintering and spawning areas (Varpe, Fiksen and Slotte, 2005). In a similar vein, Vidal and Pauly (2004) recently demonstrated how a number of local ECOPATH models can be combined into a single integrated, spatially explicit large marine ecosystem (LME) – scale model.
This idea of linking across systems is also helping to drive the current development path of the Australian models ATLANTIS and INVITRO. While both are benefiting from collaborative work that is expanding the ecological potential of the model, there has been a growing focus on developing the socio-economic components and the links to other ecosystem types (such as river catchments) so that broad flow-on and multiple use management questions can be considered (E. Fulton, pers. comm.).
Nevertheless the development of moderately easy to use full meta-ecosystem approaches that are useful to management seems some way off. Rather, it is likely that there will be an increase in the trend to incorporate greater spatial detail into models, as has been done in ECOSPACE and is being achieved with GADGET and ATLANTIS for example. Considerable efforts need to be devoted to compile spatially-explicit or GIS-based data to meet this aim. Parallel increases in computing power and efficiency of numerical and optimisation methods seem a necessary prerequisite for further developments on this front. GADGET appears to be a forerunner in terms of the use of multiple computers to speed runtime as well as attempts to base multi-species models on a robust statistical framework comparable to that used in single-species assessment models.
There is an increasing interest in the use of ecosystem models as Operating Models used to test OMPs. This is an excellent approach to providing a strategic and practical framework for developing an operational ecosystem approach to management. However, data limitations are likely to restrict the number of multi-species models that reach the stage of being considered viable operating models to assist in the management of target species. At the current level of development, most multi-species models cannot provide quantitatively reliable predictions. However, if a variety of alternative plausible models yield qualitatively similar predictions, this could provide a basis for management response.
53
7. Prudent use of the precautionary principle
Given the difficulties of providing definitive scientific advice on stock status and ecosystem “quality” and interactions, managers are increasingly called upon to apply the precautionary principle or approach (FAO, 1995). The “Precautionary Principle” (Principle 15 of the UNCED Rio Declaration (Agenda 21) of 1992) requires that “where there are threats of serious or irreversible damage, lack of full scientific certainty shall not be used as a reason for postponing cost-effective measures to prevent environmental degradation” (FAO 1995) (see also Hilborn et al., 2001). However, Plagányi and Butterworth (2005) argue that naive application must be avoided because unsubstantiated claims and overstatements can damage scientific credibility. Acknowledging the difficulties of providing definitive scientific advice on ecosystem effects, arguments based on best scientific evaluations, rather than upon unsubstantiated impressions of the state of a resource, may better safeguard the interests of scientific credibility (and hence resource conservation) in the long run. Notwithstanding, it is increasingly being recognized that at least some ecosystem-based management may need to be based on qualitative considerations only.


55
8. Pointers from previous studies and workshops
Several factors have contributed to the current worldwide boom in developing multi-species and ecosystem models to advise fisheries management decisions, with interest in this topic evinced by a number of recent conferences on ecosystem considerations, including the ICES-SCOR, 1999 ecosystem effects of fishing symposium in Montpelier, France (ICES, 2000), the 2001 FAO expert consultation on ecosystem-based fisheries management held in Reykjavik, Iceland (FAO, 2003b, see also Sinclair and Valdimarsson, 2003), the Workshop on the Use of Ecosystem Models to Investigate Multi-species Management Strategies for Capture Fisheries (Fisheries Centre Research Reports Vol. 10, no. 2, 2002), the IWC Modelling Workshop on Cetacean-Fishery Competition (IWC, 2004a) and the 2002 Workshop on an Ecosystem Approach to Fisheries Management in the Southern Benguela, held in Cape Town, South Africa (African Journal of Marine Science 26, 2004). A number of policy documents have attempted to set targets, establish universal definitions of terms such as an “ecosystem approach to fisheries” or EAF (Garcia et al., 2003) and formulate guidelines to operationalise EAF by suggesting ways of implementing it at a practical level (FAO, 2003a, b). These initiatives date roughly from the 1982 UN Convention on the Law of the Sea, to the influential 1995 FAO Code of Conduct for Responsible Fisheries and finally to the somewhat ambitious 2002 World Summit on Sustainable Development which “encourage (d) the application by 2010 of the ecosystem approach.” and set as a target to “Maintain or restore stocks to levels that can produce the maximum sustainable yield with the aim of achieving these goals for depleted stocks on an urgent basis and where possible not later than 2015” (WSSD, 2002). Unfortunately the socio-economic reality in most cases of resources well below their MSY level is that the large short-term catch reductions needed to achieve anything other than a relatively slow rate of recovery are very unlikely to be politically acceptable in many countries.
8.1 MODELLING INTERACTIONS BETWEEN MARINE MAMMALS AND FISHERIESButterworth and Punt (2003) argue that consideration of the indirect interactions between marine mammals and fisheries is an appropriate starting point for developing and testing multi-species models because of the lesser number of foodweb linkages for apex predators. It is thus instructive to begin discussion with a fairly narrow focus, namely that of bodies interested predominantly in a small subset of ecosystem interactions, as it should in theory be easier to reproduce these than the full spectrum of ecosystem interactions. The North Atlantic Marine Mammal Commission (NAMMCO) has focused for a number of years on marine mammal-fisheries interactions. For example, workshops have been convened to investigate the role of minke whales, harp seals and hooded seals in the North Atlantic (NAMMCO, 1998), the economic aspects of marine mammal–fisheries interactions (NAMMCO, 2001), the main uncertainties in extrapolating from feeding behaviour or stomach contents to annual consumption (NAMMCO, 2002) and to model marine mammal-fisheries interactions in the North Atlantic (NAMMCO, 2003). Given the conclusion of the first of these workshops, namely that marine mammals have substantial direct and indirect effects on commercial fisheries in the North Atlantic (NAMMCO, 1998), attention was focused on studies related to competition and the economic aspects of marine mammal-fisheries interactions (e.g. NAMMCO, 2001).

Models for an ecosystem approach to fisheries56
In light of uncertainties in calculations of consumption by marine mammals, concrete recommendations were sought with regard to estimating this consumption in the North Atlantic (NAMMCO, 2002). The next step was to review how available ecosystem models could be adapted to quantify marine mammal-fisheries interactions in the North Atlantic. The lessons learnt in this exercise provide a useful framework in terms of assessing different multi-species models. NAMMCO (2003) listed the following requirements as being particularly relevant in identifying the desirable features of a multi-species modelling framework:
1) flexibility of functions for prey selection;2) flexibility of age structuring (from fully age-structured to fully aggregated);3) accessible code and transparent operation (not “black-box”);4) able to be tailored to area and species of concern;5) includes interactions accounting for most of the natural mortality, M, for species
of concern;6) spatial and temporal resolution able to be tailored for target species; and7) uncertainty in data and model structure reflected in results.One of the conclusions arising from the most recent in this series of workshops
(NAMMCO, 2003) was that while the output from a model such as GADGET was not expected to be able to predict all aspects of future states of the ecosystem, the model was seen to have potential utility for management through testing scenarios where abundances of target species are manipulated. In addition, the workshop recommended the development of a generic (or “template”) North Atlantic model, based on GADGET and including major fish and marine mammal species. The main use of such a model was seen to be to identify the inputs which had the greatest effect on model predictions and hence to guide research priorities in different regions each subject to different deficiencies in data.
Plagányi and Butterworth (2005) assessed a number of models in terms of these seven requirements, as well as the additional requirement that marine mammals be explicitly included, rather than treated as exogenous components. They concluded that GADGET and Minimally Realistic Models (MRM), such as the approach of Punt and Butterworth (1995), show the most promise as tools to assess indirect interactions between marine mammals and fisheries. Bioenergetic/allometric modelling approaches such as that of Koen-Alonso and Yodzis (2005) have a role to play too in attempting to characterize the finer details of these interactions. Given that the Antarctic marine ecosystem could be viewed as a case on its own, further development of the suite of CCAMLR predator-prey models (essentially also MRM-type models) is considered the most appropriate approach for this region. The importance of applying different modelling approaches to the same system is stressed (provided that appropriate resources, in terms of both person power and data, are available). This is particularly useful for qualitative cross-checking to determine whether different approaches give similar results and therefore gauging how much confidence can be placed in their reliability. Furthermore, given the importance of comparing the outputs of different modelling approaches as well as the need to test model predictions both against simulations and against reality, the suggestion has been made that there needs to be an internationally-coordinated effort to provide a structure within which model testing can take place (I. Boyd, University of St Andrews, pers. comm.).
An appreciation for the need to understand the assumptions underlying each model considered emerged from both the NAMMCO workshop on modelling marine mammal–fisheries interactions (NAMMCO, 2003) and the IWC workshop on cetacean-fishery competition (IWC, 2004a). Both meetings stressed the need for:
• careful consideration as to whether or not underlying model assumptions are appropriate for the case under investigation;
57
• tests of the sensitivity of predictions to alternative assumptions, particularly regarding interaction terms (e.g. Vasconcellos and Gasalla, 2001, Mackinson et al., 2003); and
• addressing uncertainty, in particular by focusing research on the discrimination of alternative assumptions that yield appreciably different predictions.
8.2 AREAS OF FOCUSA further pragmatic recommendation from the IWC workshop (IWC, 2004a) was that modelling efforts should focus on specific areas/systems where there is the greatest chance of success. Given a choice of systems to model, it does seem sensible to start with the “easier” cases, but naturally practical realities may mean that analyses are needed for more “difficult” areas/systems. Key characteristics of systems proposed for initial focus included reasonable data availability, relatively simple foodwebs, strong species interactions, relatively closed system boundaries and low (or obvious) environmental forcing (IWC, 2004a). One ideal ecosystem for such investigations is the Barents Sea, where there is evidence of relatively tight predator-prey coupling with only a few fish species (herring, cod and capelin) playing key roles. Systems characterized by strong physical forcing (bottom-up control) are likely to show little or no response to the removal of predators because even strong trophic interactions may be insufficient to increase the spatial and temporal variability in the abundance of a species in systems characterized by high residual variabilities as a result of such physical forcing (Benedetti-Cecchi, 2000). Navarrete et al. (2005) demonstrated that in benthic communities, the strength of species interactions depends to some extent on regional discontinuities in oceanographic conditions. The Antarctic ecosystem has often been proposed as a suitable starting point for developing ecosystem models because it is a relatively simple ecosystem that has suffered large impacts from overfishing (e.g. Mori and Butterworth, 2004). However, as with other high-latitude regions with short links to high trophic levels, it is subject to large physical variability that may need to be better understood before reliable conclusions can be drawn regarding trophic interactions.
The agreed conclusion of the IWC’s Scientific Committee following discussion of the report of its workshop (IWC, 2004b) provides some useful insights and reads:
“for no system at present are we in the position, in terms of data availability and model development, to provide quantitative management advice on the impact of cetaceans on fisheries, or of fisheries on cetaceans. However, this does not rule out the possibility of providing qualitative advice if a number of different approaches yield qualitatively similar results.”
8.3 GENERAL GUIDELINESGeneral guidelines stressed by most of the previous studies and workshops include:
• the overriding importance of further investigations regarding the appropriate form for functional responses (the prey-predator interaction terms) and feeding selectivities/suitabilities;
• the need to consider operational (i.e. management) issues;• the need for further systematic investigations (presumably through simulation
studies) of the numbers of links that have to be included in a non-trivial ecosystem model for reliable predictive ability.
There is a growing realisation that substantial progress towards implementing reliable ecosystem models is still some way off given the need in most regions for considerable data collection and complex analysis. On the other hand, progress in this field has likely developed faster than anticipated given the encouraging number of researchers drawn to the field, the necessary legislation having been put in place, the availability of funding for ecosystem research and the development of tools that are widely accessible as a first step to explore the issues. Given the resource-hungry nature of ecosystem investigations, it is nonetheless important that research priorities in this
Pointers from previous studies and workshops

Models for an ecosystem approach to fisheries58
area be carefully and realistically chosen and weighed against other research needs (Butterworth and Plagányi, 2004).
8.4 ECOSYSTEM-BASED MANAGEMENT STRATEGIESThe objective of the 2000 UBC Workshop on the Use of Ecosystem Models to Investigate Multi-species Management Strategies for Capture Fisheries (Pitcher and Cochrane, 2002) was to explore the impact of different multi-species harvesting strategies, with a view to searching for fishing rates and patterns that would maximize ecological, social or economic goals (Cochrane, 2002). A wide range of EwE models were used by participants to identify the management strategies which would come closest to achieving the objectives for each of the ecosystems considered, as well as estimating the consequences of the various management strategies. This was made possible following the development of routines within EwE to assist the user in exploration of fisheries strategies or policies (Walters, Christensen and Pauly, 2002), effectively using the EwE models in a similar manner to operating models (Cochrane, 2002).
The workshop also stressed the importance of investigating the sensitivity of these policies to uncertainties in trophic dynamics (e.g. by considering a range of vulnerability settings). The workshop stressed the dangers of not using the software cautiously and thoughtfully (Cochrane, 2002). Model results obtained at the workshop were useful in highlighting the types of tradeoffs encountered in trying to simultaneously maximize economic, social and ecological goals, and identifying the need for better economic and other data (e.g. on prices per species and fleet operational costs) before trade-offs can be computed with any confidence (e.g. Bundy, 2002; Vasconcellos, Heymans and Bundy, 2002).
8.5 PRACTICAL STEPS TO IMPLEMENTING AN EAFThe 2002 Cape Town workshop “An ecosystem approach to fisheries management in the southern Benguela: introducing the concept and looking at our options” had two objectives, stated as:
(i) to introduce the concept of ecosystem-based fisheries management to South African fisheries scientists and to present modelling tools to achieve this, in particular the ECOPATH/ECOSIM approach; and
(ii) to propose a framework of practical ways in which the incorporation of ecosystem considerations (potentially using information from ECOPATH/ECOSIM and other types of multi-species modelling approaches) into current Operational Management Procedures (OMPs) and other management strategies for South Africa’s marine resources could be attempted.
Consensus was reached that an EAF would be highly desirable and should be implemented immediately using an incremental approach (Shannon et al., 2004). As a step in this direction, a project being implemented by the Benguela Current Large Marine Ecosystem project and the FAO held “Risk Assessment for Sustainable Fisheries” Workshops for a range of stakeholders in each of Angola, Namibia and South Africa. These used the method of Ecological Risk Assessment developed under the National Ecologically Sustainable Development (ESD) framework for prioritizing issues across valuable Western Australian fisheries (Fletcher et al., 2002; Fletcher, 2005). Initial work identified issues surrounding fisheries and the management thereof and ranked these according to the likelihood that an issue occurs and the severity of its consequence (Nel, 2005). This has at least made a first attempt at highlighting important areas to focus modelling efforts. In South Africa, as presumably in many other areas of the world, many of the major ecosystem issues identified are non-trophic (Shannon et al., 2004), emphasizing that biological models may often have a

59
relatively small role to play in an EAF. Alternatively, this may be a consequence of a lack of information and knowledge about the way trophic (indirect) interactions affects fisheries (M. Vasconcellos, FAO, pers. comm.).
The conclusions of the Cape Town workshop overlapped considerably with those discussed elsewhere in this document, namely that the following are important shortcomings of ecosystem modelling studies to be borne in mind (Shannon et al., 2004):
• It may be important to consider the effects of short-term variability;• Models need to improve their representation of regime shifts and other longer
term ecosystem dynamics;• Predator-prey functional responses are in need of further investigation;• Increased attention should be focused on assessing the robustness of a model to
a range of major uncertainties, acknowledging that full sensitivity testing is not always possible.
The workshop stressed that the long term benefits of an EAF need to be strongly emphasized and clearly explained. This follows particularly given that in the short-term at least, it may result in less fish being made available to fishers (D.S. Butterworth, University of Cape Town, South Africa, pers. comm.) and is likely to result in increased political and social pressures as well as stretching limited capacity and resources (Cochrane et al., 2004). An important consideration is that efforts towards this end are impeded by the fact that there is a current paucity of examples of successful case studies to show that an EAF is successful and beneficial (Cochrane et al., 2004).
Pointers from previous studies and workshops

61
9. Summary of model comparisons and recommendations
Attention worldwide is increasingly being concentrated on establishing frameworks for fisheries management that are ecosystem-oriented, notwithstanding that the operational aspects of this goal are fraught with difficulty (Hall and Mainprize, 2004). This field is still very new and major gaps still exist between single-species and multi-species or ecosystem approaches to practical fishery management.
Three particularly important areas requiring attention are the following:1. Review of underlying shortcomings and assumptions of available multi-species/
ecosystem approachesThis aspect is seen as critical to advancing attempts to incorporate ecosystem considerations in practical fisheries management. Unfortunately endeavours in this regard appear to be lagging considerably behind the ever-growing number of documented applications of ecosystem models. Critical reviews of methods assist in highlighting weaknesses and hence ultimately in strengthening applications of an ecosystem approach. Where applied most effectively, conventional single-species modelling approaches used to inform the management of commercially important stocks are typically subject to intense scrutiny. Ecosystem models are likely to be subject to a similar level of scrutiny when they reach the state of being used as the basis for management recommendations or decisions (with implications for economically valuable and socially important fisheries in particular). There is therefore a need for parallel processes of model development, application and scrutiny – otherwise the danger exists that considerable time and effort will have been wasted in developing ecosystem models that are later rejected out of hand when they attempt to enter the management arena or that bad management decisions, with potentially serious consequences, will be made on the basis of poor scientific advice.
2. Systematic analyses of alternative functional response formulations to be considered in modelsAlthough progress in this field is primarily impeded by a lack of suitable data and experimental studies (noting that the focus here is on recommended modelling endeavours), simulation and modelling studies can nevertheless contribute. This issue is critical and hence attention should be focused both on the need to carefully check model robustness to alternative interaction representation hypotheses and on simulation exercises to systematically and thoroughly explore this issue.
3. Consideration of uncertainty in model structure, parameter estimates and data.Models need to account for key levels of uncertainty, preferably within a strategic and practical framework. This aspect of multi-species/ecosystem models has lagged unsatisfactorily behind other aspects of model development, given (understandable) arguments to the effect that detailed sensitivity analyses are a major undertaking for these models and there are typically inadequate data available for fitting purposes. While many studies are currently underway (E. Fulton and F. Pantus, CSIRO, pers. comm.), the most prominent published example is that of Ginot et al. (2006), which demonstrates the usefulness of ANOVA-based global sensitivity analyses for exploring which parameters (in models with only a moderate number of parameters) have an impact on model output and the interactions between the parameters.

Models for an ecosystem approach to fisheries62
It is also important to remember that an assessment method (however rigorously applied) and associated recommendations are unable to successfully achieve conservation when management fails. As stressed by Parma et al. (2003), sustainability of a fishery is likely to be achieved only when the right incentives are provided, such as in the form of secure long-term access rights. The correct incentives and management structures need to be firmly in place if success is to be achieved. To reach this goal it is insufficient simply to perfect existing models. Stakeholder participation and dialogue need to be seen as integral components of multi-species fisheries management and scientists need to avoid the temptation to use loosely constructed ecosystem models to justify a preferred point of view. Moreover, although the discussion throughout has focused on specific modelling perspectives, it is important to bear in mind that in some cases the best approach would likely depend on experimental studies and an adaptive management approach (e.g. Walters 1986; Hilborn and Walters 1992; Sainsbury, Punt and Smith, 2000). For example, an actively adaptive management strategy applied to the Australian multi-species fishery was successful in resolving key uncertainties about resource dynamics and sustainable resource use (Sainsbury et al., 1997). The approach involved identifying four different plausible hypotheses and adopting an experimental process involving the sequential closure of areas to trawl fishing. After a period of a few years, the experiment was successful in discriminating among the competing hypotheses (Sainsbury et al., 1997; Sainsbury, Punt and Smith, 2000). The success of this earlier work has lead to its extension into the multiple use realm (Little et al., 2006).
In summary, this report has aimed to document all of the well-known, as well as several of the less well-known multi-species and ecosystem modelling approaches used in Ecosystem-Based Fisheries Management (EBFM). Some 20 approaches have been described (Tables A1-A3), ranging from ESAM (which entails no more than the addition of one or two species to current single-species assessment models) to ATLANTIS (covering the full trophic spectrum) at the opposite extreme. The most widely used approach is undoubtedly EwE, which is likely to remain a forerunner given the user-friendly interface and on-going improvements to the software. Faced with incomplete knowledge of ecosystem functioning, there has been increasing recognition that definitive conclusions cannot be drawn from a single model structure. There has thus been a parallel increase in efforts to modularize models so that different components can be easily substituted. Spatial considerations are similarly playing an increasingly important role in the development of ecosystem modelling approaches. Nonetheless, even some of the earliest approaches such as MSVPA are still being used and improved. To give an idea of directions being taken in on-going model development, a summary has been presented of some other recent advances being planned for the different modelling approaches.
This preliminary analysis of the potential of the various modelling approaches to address specific EBFM research questions suggests that a range of different model constructions are needed; no one model is superior to all others in all respects. This review has stressed several times that ideally a range of models should be applied, but this is not always possible because of limitations on resources available to undertake such analyses. Nonetheless, it may be argued that the model with the greatest potential to contribute to practical fisheries management advice in regions with reasonable data availability is GADGET, although as stated throughout, the preferred approach is parallel development of different models. Although still under development, GADGET is currently the model with the most rigorous statistical framework for developing multi-species based management advice. It is also the modelling approach most capable of detailed sensitivity investigations to alternative growth, consumption and recruitment formulations. Additionally, it operates within a spatial framework

63
and overcomes many of the associated computing constraints by running on multiple computers in parallel using PVM. Nonetheless, it too has its limitations in that it is capable of representing only a relatively small subset of the ecosystem and may be less useful in tropical regions with much higher species diversity. Models such as EwE and ATLANTIS are more appropriate for considering broader questions. In particular, EwE is capable of addressing the widest range of topical EBFM research questions. The multiple-stanza version of ECOSIM is a major advancement and greatly expands the potential of this approach to investigate important questions such as the effects of biomass pool composition on aggregated consumption estimates as well as being able to represent cannibalism through size-dependent interaction rates (Walters and Martell, 2004). ATLANTIS is ranked here as the best operating model within a simulation testing framework. Although it seems unlikely that sufficient data will be available to achieve such testing in most marine systems, some argue that “what-if” approaches are becoming more acceptable such that progress could be made on this front. Approaches that have more recently followed in the footsteps of the Punt and Butterworth (1995) MRM approach also deserve a closer look in that such Management Procedure approaches take explicit account of uncertainty and management issues through the use of a simulation framework incorporating feedback control rules used in actual management.
As discussed, simple extensions to current single-species assessment models, termed ESAM approaches here, are often a good first step. Similarly, equations such as those presented in Mori and Butterworth (2005) are a useful starting template for multi-species modelling approaches being built up slowly and in synchrony with data availability. Some of the less well-known (in a global context) approaches have been shown to include some additional useful features, for example, SEAPODYM’s habitat index, OSMOSE’s explorations with simple individual predation rules and Koen-Alonso and Yodzis’s (2005) approach for substituting different functional response variants.
This report is a first step towards initiating more detailed discussions of these models, their uses and their limitations. This process will be critical in moving forward the development of methods for assessing indirect ecosystem impacts of fisheries. Whereas the modelling tool-box is reasonably well developed and diverse, high levels of uncertainty around the nature and consequences of most ecosystem interactions will hinder the efficient application of an EAF. Greater focus is needed on reducing these uncertainties and conducting the necessary data collection and experimentation to strengthen confidence in these approaches. Indeed, before embarking on the construction of a new ecosystem-type model, would-be model developers should assess whether they would be adding anything to the current suite of models, given that approaches such as EwE and GADGET have benefited from an extensive network of collaborators over a number of years. Hopefully, a review such as this will assist in selecting the most appropriate general form of model to match the question of interest.
Summary of model comparisons and recommendations

65
10. References
Allen, J.L., Blackford, J.C. and Radford, P.J. 1998. A 1-D vertically resolved modelling study of the ecosystem dynamics of the middle and southern Adriatic sea. J. Mar. Sys., 18: 265-286.
Allen J.I., Somerfield P. and Siddorn, J. 2002 Primary and Bacterial Production in the Mediterranean Sea: A modelling study. J. Mar. Sys., 33-34: 473-496.
Alonzo, S.H., Switzer, P.V. and Mangel, M. 2003. An ecosystem-based approach to management: using individual-behaviour to predict the indirect effects of Antarctic krill fisheries on penguin foraging. J. Appl. Ecol., 40: 692-702.
Arreguín-Sánchez, F. 2000. Octopus-red grouper interaction in the exploited ecosystem of the northern continental shelf of Yucatan, Mexico. Ecol. Model., 129: 119-129.
Arrington, D.A., Winemiller, K.O., Loftus, W.F. and Akin, S. 2002. How often do fishes “run on empty”? Ecology, 83: 2145-2151.
Atkinson, A., Siegel, V., Pakhomov, E. and Rothery, P. 2004. Long-term decline in krill stock and increase in salps within the Southern Ocean. Nature, 432: 100-103.
Auster, P.J. and Langton, R.W. 1998. The Effects of Fishing on Fish Habitat. Report submitted to Committee on Fisheries, Ocean Studies Board, National Research Council.
Aydin, K.Y. 2004. Age structure or functional response? Reconciling the energetics of surplus production between single-species models and ECOSIM. In L.J. Shannon, K.L. Cochrane S.C. Pillar (eds). Ecosystem approaches to fisheries in the Southern Benguela. Afr. J. Mar. Sci., 26: 289-301.
Aydin, K.Y. and Friday, N. 2001. The early development of ECOSIM as a predictive multi-species fisheries management tool. Paper IWC SC/53/E WP2, presented to the International Whaling Commission Scientific Committee, July 2001. 5 pp.
Aydin, K.Y. and Gaichas, S.K. 2006. Towards a representation of uncertainty in multi-species models. IWC SC/58/E48.
Aydin, K.Y., Lapko, V.V., Radchenko, V.I. and Livingston, P.A. 2002. A comparison of the eastern Bering and western Bering Sea shelf and slope ecosystems through the use of mass-balance food web models. U.D. Dept. Commerce, NOAA Tech. Memo. NMFS- AFSC-130. 78 pp.
Baretta, J.W., Baretta-Bekker, J.G. and Ruardij, P. 1996. From EMS to ERSEM, towards generic coastal ecosystem models. Aquabiol., 104: 197-209 (translated from Japanese).
Baretta-Bekker, J.G. and Baretta, J.W. (eds). 1997. Special Issue: European Regional Seas Ecosystem Model II. J. Sea Res., 38: 169-436.
Bax, N.J. 1985. Application of multi- and univariate techniques of sensitivity analysis to SKEBUB, a biomass-based fisheries ecosystem model, parameterized to georges bank. Ecol. Model., 29: 353-382.
Bax, N.J. 1998. The significance and prediction of predation in marine fisheries. ICES J. Mar. Sci., 55: 997-1030.
Beddington, J.R. and May, RM. 1982. The harvesting of interacting species in a natural ecosystem. Sci. Am., 247:42-50.
Begley, J. 2005. Gadget User Guide. Available from website www.hafro.is/gadget. 95 pp.Begley, J. and Howell, D. 2004. “An overview of GADGET, the Globally applicable Area-
Disaggregated General Ecosystem Toolbox”. ICES CM 2004/FF:13: 15 pp.Benedetti-Cecchi, L. 2000. Variance in ecological consumer-resource interactions. Nature,
407: 370-374.
Models for an ecosystem approach to fisheries66
BENEFIT. 2004. Report of the BENEFIT stock assessment workshop, University of Cape Town, 12-17 January 2004. BENEFIT Programme, Swakopmund. 48 pp.
Bertignac, M., Lehodey, P. and Hampton, J. 1998. A spatial population dynamics simulation model of tropical tunas using habitat index based on environmental parameters. Fish. Oceanogr., 7: 326-334.
Bigler, B.S., Welch, D.W. and Helle, J.H. 1996. A review of size trends among North Pacific salmon (Oncorhynchus spp.). Can. J. Fish. Aquat. Sci., 53: 455-465.
Bjørge, A., Bekkby, T., Bakkestuen, V. and Framstad, E. 2002. Interactions between harbor seals (Phoca vitulina) and fisheries in complex coastal waters explored by combined Geographic Information System (GIS) and energetics modelling. ICES J. Mar. Sci., 59: 29-42.
Blackford, J.C., Allen, J.I. and Gilbert, F.J. 2004. Ecosystem dynamics at six contrasting sites: a generic modelling study. J. Mar. Sys., 52: 191-215.
Bogstad, B., Hauge, K.H. and Ulltang, O. 1997. MULTSPEC: a multi-species model for fish and marine mammals in the Barents Sea. J. N. Atl. Fish. Sci., 22: 317-341.
Bogstad, B., Tjelmeland, S., Tjelta, T. and Ulltang, Ø. 1992. Description of a multi-species model for the Barents Sea (MULTSPEC) and a study of its sensitivity to assumptions on food preferences and stock sizes of harp seals and minke whales. Int. Whal. Comm.. Sci. Comm. Pap., 44 (09). 47 pp.
Boyd, I.L. and A. Murray,W.A. 2001. Monitoring a marine ecosystem using responses of upper trophic level predators. J. Anim. Ecol., 70: 747-760.
Bryant, A.D., Heath, M.R., Broekhuizen, N., Ollason, J.G., Gurney, W.S.C., and Greenstreet, S.P.R. 1995. Modelling the predation, growth and population dynamics of fish within a spatially-resolved shelf-sea ecosystem model. Neth. J. Sea Res., 33: 407-421.
Bulgakova, T., Vasilyev, D. and Daan, N. 2001. Weighting and smoothing of stomach content data as input for MSVPA with particular reference to the Barents Sea. ICES J. Mar. Sci.. 58: 1208-1218.
Bundy, A. 2002. Exploring multi-species harvesting strategies on the eastern Scotian Shelf with Ecosim. In T.J. Pitcher and K. Cochrane (eds). The Use of Ecosystem Models to Investigate Multi-species Management Strategies for Capture Fisheries. Fisheries Centre Research Reports, 10: 112-117.
Bundy, A. 2005. Structure and functioning of the eastern Scotian Shelf ecosystem before and after the collapse of groundfish stocks in the early 1990s. Can J. Fish. Aquat. Sci., 62: 1453-1473.
Burnham, K.P. and Anderson, D.R. 2002. Model Selection and Multi-Model Inference: a Practical Information-Theoretic Approach. Springer, New York. 353 pp.
Butterworth, D.S. 1986. Antarctic marine ecosystem management. Polar Record, 23: 37-47.
Butterworth, D.S. and Harwood, J. (eds). 1991. Report on the Benguela Ecology Programme Workshop on seal-fishery biological interactions. Rep. Benguela Ecol. Progm. S. Afr., 22: 65 pp.
Butterworth, D.S. and Plagányi, É.E. 2004. A brief introduction to some multi-species/ecosystem modelling approaches in the context of their possible application in the management of South African fisheries. In L.J. Shannon, K.L. Cochrane and S.C. Pillar (eds). Ecosystem approaches to fisheries in the Southern Benguela. Afr. J. Mar. Sci., 26: 53-61.
Butterworth, D.S. and Punt, A.E. 1999. Experiences in the evaluation and implementation of management procedures. ICES J. Mar. Sci., 56: 985-998.
Butterworth, D.S. and Punt, A.E. 2003. The role of harvest control laws, risk and uncertainty and the precautionary approach in ecosystem-based management. In M. Sinclair and G. Valdimarsson (eds). Responsible Fisheries in the Marine Ecosystem.

67
FAO and CABI Publishing. pp. 311-319.Butterworth, D.S. and Rademeyer, R.A. 2005. Sustainable management initiatives for the
southern African hake fisheries over recent years. Bull. Mar. Sci.: 76(2): 287-319Butterworth, D.S. and Thompson, R.B. 1995. Possible effects of different levels of krill
fishing on predators: some initial modelling attempts. CCAMLR Science, 2: 79-97.Butterworth, D.S., Cochrane, K.L. and De Oliveira, J.A.A. 1997. Management
procedures: a better way to manage fisheries? The South African experience. In E.L. Pikitch, D.D. Huppert and M.P. Sissenwine (eds). Global Trends: Fisheries Management. Bethesda, Maryland: pp. 83-90. American Fisheries Society Symposium No. 20,
Butterworth, D.S., Punt, A.E., Oosthuizen, W.H. and Wickens, P.A. 1995. The effects of future consumption by the Cape fur seal on catches and catch rates of the Cape hakes. 3. Modelling the dynamics of the Cape fur seal (Arctocephalus pusillus pusillus). S. Afr. J. Mar. Sci., 16: 161-183.
Caddy, J.F. 1999. Fisheries management in the twenty-first century: will new paradigms apply? Rev. Fish Biol. Fisheries, 9: 1-43.
CCAMLR [Commission for the Conservation of Antarctic Marine Living Resources]. 2004. Report of the meeting of the working group on ecosystem monitoring and management, Siena, Italy, 12 to 23 July 2004. 87 pp.
CCAMLR [Commission for the Conservation of Antarctic Marine Living Resources]. 2005. Report of the workshop on management procedures, Yokohama, Japan, 4-8 July 2005. 47 pp.
CCAMLR [Commission for the Conservation of Antarctic Marine Living Resources]. 2006. Report of the workshop on management procedures, Walvis Bay, Namibia, 17-21 July 2006. WG-EMM-06/40, 36 pp.
Chouinard, G.A., Swain, D.P., Hammill, M.O. and Poirier, G.A. 2005. Covariation between grey seal (Halichoerus grypus) abundance and natural mortality of cod (Gadus morhua) in the southern Gulf of St. Lawrence. Can. J. Fish. Aquat. Sci., 62: 1991-2000.
Christensen, V. 1995a. Ecosystem maturity: towards quantification. Ecol Model., 77: 3-32.Christensen, V. 1995b. A Multi-species virtual population analysis incorporating
information of size and age. ICES C.M. 1995, D:8Christensen, V. 1998. Fishery-induced changes in a marine ecosystem: insights from
models of the Gulf of Thailand. J. Fish Biol., 53 (Suppl.) S1: 128-142.Christensen, V. and Pauly, D. 1992. ECOPATH II: a software for balancing steady-state
models and calculating network characteristics. Ecol. Model., 61: 169-185.Christensen, V. and Walters, C.J. 2000. Ecopath with Ecosim: methods, capabilities and
limitations. In D. Pauly and T.J. Pitcher (eds). Methods for Evaluating the Impacts of Fisheries on North Atlantic Ecosystems. Fisheries Centre Research Reports, 8: 79- 105.
Christensen, V. and Walters, C.J. 2004. Ecopath with Ecosim: methods, capabilities and limitations. Ecol. Model., 172: 109-139.
Christensen, V., Walters, C.J. and Pauly, D. 2000. Ecopath with Ecosim: a User’s Guide, October 2000 Edition. Fisheries Centre, University of British Columbia, Vancouver, Canada and ICLARM, Penang, Malaysia. 130 pp.
Clapham, P.J. and Brownell Jr. , R.L. 1996. The potential for interspecific competition in baleen whales. Rep. Int. Whal. Comm., 46: 361-367.
Cochrane, K.L. 1998. FAO’s interest in and expectations of this workshop. In D. Pauly and G. Weingartner (eds). Use of Ecopath with Ecosim to evaluate strategies for sustainable exploitation of multi-species resources. Fisheries Centre Research Reports, 6(2): 6-7.
Cochrane, K.L. 2002. The use of ecosystem models to investigate ecosystem-based management strategies for capture fisheries: introduction. In T. Pitcher and K.L. Cochrane (eds). The use of ecosystem models to investigate multi-species management strategies for capture fisheries. Fisheries Centre Research Reports 10(2): 5-10.
Cochrane, K.L., Augustyn, C.J., Cockcroft, A.C., David, J.H.M., Griffiths, M.H.,
References

Models for an ecosystem approach to fisheries68
Groeneveld, J.C., Lipinski, M.R., Smale, M.J., Smith, C.D. and Tarr R.J.Q. 2004. An ecosystem approach to fisheries in the southern Benguela context. Afr. J. Mar. Sci., 26: 9-35.
Colomb, A., Shin, Y-J., Gascuel, D. and Le Fur, J. 2004. Using MOOVES, an individual-based model of the Guinean ecosystem, for assessing the response of Trophodynamic and size-based indicators to fishing pressure. ICES CM 2004/FF: 14.
Committee on the Alaska Groundfish Fishery and Steller Sea Lions. 2003. Decline of the Steller sea lion in Alaskan waters: untangling food webs and fishing nets. National Academies Press, Washington, DC. 204 pp.
Constable, A.J. 2001. The ecosystem approach to managing fisheries: achieving conservation objectives for predators of fished species. CCAMLR Science, 8: 37-64.
Constable, A.J. 2005. Implementing plausible ecosystem models for the Southern Ocean: an ecosystem, productivity, ocean, climate (EPOC) model. Workshop document presented to WG-EMM subgroup of CCAMLR (Commission for the Conservation of Antarctic Marine Living Resources), WG-EMM-05/33. (20 pp.).
Constable, A.J. 2006. Using the EPOC modelling framework to assess management procedures for Antarctic krill in Statistical Area 48: evaluating spatial differences in productivity of Antarctic krill. Workshop document presented to WG-EMM subgroup of CCAMLR (Commission for the Conservation of Antarctic Marine Living Resources), WG-EMM- 06/38.
Constable, A.J., de la Mare, W.K., Agnew, D.J., Everson, I. and Miller, D. 2000. Managing fisheries to conserve the Antarctic marine ecosystem: practical implementation of the Conservation of Antarctic Marine Living Resources (CCAMLR). ICES J. Mar. Sci., 57: 778-791.
Cooke, J.G. 1999. Improvement of fishery-management advice through simulation testing of harvest algorithms. ICES J. Mar. Sci., 56: 797-810.
Cooke, J.G. 2002. Some aspects of the modelling of effects of changing cetacean abundance on fishery yields. Paper SC/J02/FW10 presented to the International Whaling Commission Modelling Workshop on Cetacean-Fishery Competition, June 2002: 5 pp.
Cornick, L.A., Neill, W. and Grant, W.E. 2006. Assessing competition between Steller sea lions and the commercial groundfishery in Alaska: a bioenergetics modelling approach. Ecol. Model., 199: 107-114.
Cox, S.P., Essington, T.E., Kitchell, J.F., Martell, S.J.D., Walters, C.J., Boggs, C. and Kaplan, I. 2002. Reconstructing ecosystem dynamics in the central Pacific Ocean, 1952-1998. II. A preliminary assessment of the trophic impacts of fishing and effects on tuna dynamics. Can. J. Fish. Aquat. Sci., 59: 1736-1747.
Crawford, R.J.M. 2004. Accounting for food requirements of seabirds in fisheries management – the case of the South African purse-seine fishery. In L.J. Shannon, K.L. Cochrane and S.C. Pillar (eds). Ecosystem approaches to fisheries in the Southern Benguela. Afr. J. Mar. Sci., 26: 197-203.
Crise A., Allen, J.I., Baretta, J., Crispi, G., Mosetti, R. and Solidoro, C. 1999. The Mediterranean pelagic ecosystem response to physical forcing. Prog. Oceanogr., 44: 219-243.
Cury, P., Bakun, A., Crawford, R.J.M., Jarre, A., Quiñones, R.A., Shannon, L.J. and Verheye, H.M. 2000. Small pelagics in upwelling systems: patterns of interaction and structural changes in ‘‘wasp-waist’’ ecosystems. ICES Journal of Marine Science, 57: 603–618
Daan, N. and M.P. Sissenwine (eds). 1991. Multi-species models relevant to management of living resources. ICES Marine Science Symposium 193.
Daan, N., Gislason, H., Pope, J.G. and Rice, J.C. 2005. Changes in the North Sea fish community: evidence of indirect effects of fishing? ICES J. Mar. Sci., 62: 177-188.
Dalton, T.M. 2004. An approach for integrating economic impact analysis into the
69
evaluation of potential marine protected area sites. J. Environ. Manage., 70: 333-349.Daskalov, G.M. 2002. Overfishing drives a trophic cascade in the Black Sea. Mar. Ecol.
Prog. Ser., 225: 53-63. DeAngelis, D.L. and Gross, M.J. 1992. Individual-based models and approaches in
ecology: populations, communities and ecosystems. Chapman and Hall, New York.DeAngelis, D.L., Shuter, B.J., Ridgeway, M.S., Blanchfield, P., Friesen, T. and Morgan,
G.E. 1991. Modeling early life-history stages of smallmouth bass in Ontario lakes. Trans. Amer. Fish. Soc., September: 9-11.
De Oliveira, J.A.A., Butterworth, D.S., Roel, B.A., Cochrane, K.L. and Brown, J.P. 1998. The application of a management procedure to regulate the directed and bycatch fishery of South African sardine (Sardinops sagax). S. Afr. J. Mar. Sci., 19: 449-469.
De Roos, A.M., Persson, L. and McCauley, E. 2003. The influence of size-dependent life-history traits on the structure and dynamics of populations and communities. Ecology Letters, 6: 473-487.
De Roos, A.M. and Persson, L. 2005. The influence of individual growth and development on the structure of ecological communities. In P.C. de Ruiter, V. Wolters and J.C. Moore (eds). Food webs. dynamic food webs- multi-species assemblages, ecosystem development and environmental change. pp. 89-100, Academic press.
Dichmont, C.M., Deng, A.R., Venables, W.N., Punt, A.E., Haddon, M. and Tattersall, K. 2005. A new approach to assessment in the NPF: spatial models in a management strategy environment that includes uncertainty. Report of FRDC 2001/002. CSIRO Marine Research, Cleveland, Australia.
Doedel, E.J., Champneys, A.R., Fairgrieve, T.F., Kuznetsov, Y.A., Sandstede, B. and Wang, X. 1998. AUTO 97: continuation and bifurcation software for ordinary differential equations. Available from ftp://ftp.cs.concordia.ca/pub/doedel/auto.
Drapeau, L., Pecquerie, L., Fréon, P. and Shannon, L.J. 2004. Quantification and representation of potential spatial nteractions in the southern Benguela ecosystem. In L.J. Shannon, K.L. Cochrane and S.C. Pillar (eds). Ecosystem approaches to fisheries in the Southern Benguela. Afr. J. Mar. Sci., 26: 141-159.
Eichner, T. and J. Tschirhart. (in press). Efficient ecosystem services and naturalness in an Ecological/Economic Model Environmental and Resource Economics.
Eisenack, K. and Kropp, J. 2001. Assessment of management options in marine fisheries by qualitative modelling techniques. Marine Pollution Bulletin, 43: 215-224.
FAO. 1995. Precautionary approach to fisheries. Part 1: Guidelines on the precautionary approach to capture fisheries and species introductions. FAO Fisheries Technical Paper. No. 350, Part 1. Rome, FAO. 52 p.
FAO. 2002. The state of world fisheries and aquaculture. FAO, Fisheries Department, Rome. 149 pp.
FAO. 2003a. The ecosystem approach to fisheries. FAO Technical Guidelines for Responsible Fisheries. No. 4, Suppl. 2. Rome, FAO. 112 pp.
FAO. 2003b. Report of the expert consultation on ecosystem-based fisheries management, Reykjavik, Iceland, 16-19 September 2002. FAO Fisheries Report, No. 690. Rome, FAO. 31 pp.
Fenton, J.S. and Faddy, M.J. 2006. Modelling predation in functional response. Ecol. Model., 198: 154-162.
Fletcher, W.J. 2005. The application of qualitative risk assessment methodology to prioritize issues for fisheries management. ICES J. Mar. Sci., 62: 1576-1587.
Fletcher, W.J., Chesson, J., Fisher, M., Sainsbury, K.J., Hundloe, T., Smith, A.D.M. and Whitworth, B. 2002. National ESD Reporting Framework for Australian Fisheries: the “How To” Guide for Wild Capture Fisheries. Fisheries Research and Development
References

Models for an ecosystem approach to fisheries70
Corporation Project 2000/145, Canberra, Australia. 120 pp.Floeter, J. and Temming, A. 2003. Explaining diet composition of North Sea cod
(Gadus morhua): prey size preference vs. prey availability. Can J. Fish. Aquat. Sci., 60: 140-150.
Froese, R. and Pauly, D. 1998. FishBase 98: Concepts, Structure and Data Sources. Manila: International Center for Living Aquatic Resources Management. Updates: <http://www.fishbase.org>
Frøysa, K.G., Bogstad, B. and Skagen, D.W. 2002. Fleksibest – an age-length structured fish stock assessment tool with application to Northeast Arctic cod (Gadus morhua L.). Fish. Res. 55: 87-101.
Fulton, E.A. 2001. The Effects of Model Structure and Complexity on the Behaviour and Performance of Marine Ecosystem Models. Ph.D. thesis, School of Zoology, University of Tasmania, Hobart. 429 pp.
Fulton, E.A. and Smith, A.D.M. 2002. Ecosim case study: Port Philip Bay, Australia. In T.J. Pitcher and K.L. Cochrane (eds). The Use of Ecosystem Models to Investigate Multi-species Management Strategies for Capture Fisheries. Fisheries Centre Research Reports, 10: 83-93.
Fulton, E.A. and Smith, A.D.M. 2004. Lessons learnt from the comparison of three ecosystem models for Port Philip Bay, Australia. In L.J. Shannon, K.L. Cochrane and S.C. Pillar (eds). Ecosystem approaches to fisheries in the Southern Benguela. Afr. J. mar. Sci., 26: 219-243.
Fulton, E.A., Smith, A.D.M. and Johnson, C.R. 2003a. Effect of complexity on marine ecosystem models. Mar. Ecol. Prog. Ser., 253: 1-16.
Fulton, E.A., Smith, A.D.M. and JohnsonC.R. 2003b. Mortality and predation in ecosystem models: is it important how these are expressed? Ecol. Model. 169: 157 – 178.
Fulton, E.A., Smith, A.D.M. and JohnsonC.R. 2004. Biogeochemical marine ecosystem models. I. A model of marine bay ecosystems. Ecol. Model., 174: 267-307.
Fulton, E.A., Smith, A.D.M. and Punt, A.E. 2004. Ecological indicators of the ecosystem effects of fishing: Final Report. Report No. R99/1546, Australian Fisheries Management Authority, Canberra.
Fulton, E.A., Smith, A.D.M. and Punt, A.E. 2005. Which ecological indicators can robustly detect effects of fishing? ICES J. Mar. Sci., 62: 540-551.
Fulton, E.A., Parslow, J.S., Smith, A.D.M. and Johnso, C.R. 2004. Biogeochemical marine ecosystem models. 2. The effect of physiological detail on model performance. Ecol. Model., 173: 371-406.
Garcia, S.M., Zerbi, A., Aliaume, C., Do Chi, T. and Lasserre, G. 2003. The ecosystem approach to fisheries. Issues, terminology, principles, institutional foundations, implementation and outlook. FAO Fisheries Technical Paper, No. 443. Rome, FAO. 71 pp.
Geromont, H.F., De Oliveira, J.A.A., Johnston, S.J. and Cunningham, C.L. 1999. Development and application of management procedures for fisheries in southern Africa. ICES J. Mar. Sci., 56: 952-966.
Ginot, V., LePage, C. and S. Souissi. 2002. A multi-agents architecture to enhance end-user individual-based modelling. Ecol. Model., 157: 21-41.
Ginot, V., Gaba, S., Beaudouin, R., Aries, F. and Monod, H. 2006. Combined use of local and ANOVA-based global sensitivity analyses for the investigation of a stochastic dynamic model: Application to the case study of an individual-based model of a fish population. Ecol. Model., 193: 479-491.
Gislason, H. 2003. Effects of fishing on non-target species. In M. Sinclair and G. Valdimarsson (eds). Responsible Fisheries in the Marine Ecosystem. FAO and CABI Publishing, UK: pp. 255-274.
Gislason, H. and Helgason, T. 1985. Species interaction in assessment of fish stocks with special application to the North Sea. Dana, 5: 1-44.

71
Gray, R., Fulton, E.A., Little, L.R. and Scott, R. 2006. Ecosystem Model Specification Within an Agent Based Framework. North West Shelf Joint Environmental Management Study Technical Report – Vol 16.
Gray, R., Fulton, E.A., Hatfield, B., Little, L.R., Lyne, V., McDonald, A.D., Sainsbury, K. and Scott, R. 2003. InVitro – Agents in glass. In Proceedings of the CABM/HEMA Workshop, 11-12 July 2003, Melbourne, Australia.
Grimm, V. 1999. Ten years of individual-based modelling in ecology: what have we learnt and what could we learn in future? Ecol. Model., 115: 129-148.
Grimm, V., Berger, U., Bastiansen, F., Eliassen, S., Ginot, V., Giske, J., Goss-Custard, J., Grand, T., Heinz, S.K., Huse, G., Huth, A., Jepsen, J.U., Jørgensen, C., Mooij, W. M., Müller, B., Pe’er, G., Piou, C., Railsback, S.F., Robbins, A.M., Robbins, M.M., Rossmanith, E., Rüger. N., Strand, E., Souissi, S., Stillman, R.A., Vabø, R., Visser, U. and DeAngelis, D.L. 2006. A standard protocol for describing individual-based and agent-based models. Ecol. Model., 198: 115-126.
Gulland, J.A. 1983. Species interactions. In J.A. Gulland (ed.). Fish Stock Assessment: A manual of basic methods, pp. 186-201. John Wiley and Sons, Chichester: 223 pp.
Hall, S.J. and Mainprize, B. 2004. Towards ecosystem-based fisheries management. Fish and Fisheries, 5: 1-20.
Hamre, J. and Hattlebakk, E. 1998. System model (Systmod) for the Norwegian Sea and the Barents Sea. In T. Rødseth (ed.). Models for Multi-species Management, pp. 93-115. Springer-Verlag.
Harvey, C.J., Cox, S.P., Essington, T.E., Hansson, S. and Kitchell, J.F. 2003. An ecosystem model of food web and fisheries interactions in the Baltic Sea. ICES J. Mar. Sci., 60: 939- 950.
Harwood, J. and McLaren, I. 2002. Modelling interactions between seals and fisheries: model structures, assumptions and data requirements. IWC document SC/J02/FW4.
Heath, M., Scott, B. and Bryant, A.D.1997. Modelling the growth of herring from four different stocks in the North Sea. J. Sea Res., 38: 413-436.
Helgason, Th. and H. Gislason. 1979. VPA – analysis with species interaction due to predation. ICES Committee Meeting, 1979/G: 52.
Hilborn, R. 1990. Estimating the parameters of full age-structured models from catch and abundance data. Bull. Int. N. Pac. Fish. Comm., 50: 207-213.
Hilborn, R. and Walters, C.J. 1992. Quantitative Fisheries Stock Assessment: Choice, Dynamics and Uncertainty. Chapman and Hall, New York.
Hilborn, R., Maguire, J.-J., Parma, A.M. and Rosenberg, A.A. 2001. The Precautionary Approach and risk management: can they increase the probability of successes in fishery management? Can. J. Fish. Aquat. Sci., 58: 99-107.
Hilborn, R., Stokes, K., Maguire, J.-J., Smith, T., Botsford, L.W., Mangel, M., Orensanz, J., Parma, A., Rice, J., Bell, J., Cochrane, K.L., Garcia, S., Hall, S.J., Kirkwood, G.P., Sainsbury, K., Stefansson, G. and Walters, C. 2004. When can marine reserves improve fisheries management? Ocean and Coastal Management, 47: 197-205.
Hill, S., Murphy, E.J., Reid, K., Trathan, P.N. and Constable, A. 2006. Modelling Southern Ocean ecosystems: krill, the food-web and the impacts of harvesting. Biol. Rev., 81: 581- 608.
Hill, S., Reid, K., Thorpe, S., Hinke, J. and Watters, G. (in press). A compilation of parameters for ecosystem dynamics models of the Scotia Sea - Antarctic Peninsula region. CCAMLR Sci.
Hollowed, A.B., Ianelli, J.N. and Livingston, P.A. 2000. Including predation mortality in stock assessments: a case study for Gulf of Alaska walleye pollock. ICES J. Mar. Sci., 57:
References

Models for an ecosystem approach to fisheries72
279-293.Hollowed, A.B., Bax, N., Beamish, R., Collie, J., Fogarty, M., Livingston, P., Pope, J. and
Rice, J.C. 2000. Are multi-species models an improvement on single-species models for measuring fishing impacts on marine ecosystems? ICES J. Mar. Sci., 57: 707-719.
Horbowy, J. 2005. The dynamics of Baltic fish stocks based on a multi-species stock production model. J. Appl. Ichthyology, 21: 198-204.
Hulse, G. 2001. Modelling habitat choice in fish using an adapted random walk. Sarsia, 86: 477-483.
ICES [International Council for the Exploration of the Sea]. 2000. Ecosystem effects of fishing. ICES Journal of Marine Science, 57(3): 791.
IWC [International Whaling Commission]. 1989. Comprehensive Assessment workshop on management procedures. In The Comprehensive Assessment of Whale Stocks: the Early Years. Rep. Int. Whal. Comm. Special Issue, 11: 29-44.
IWC [International Whaling Commission]. 2003. Specifications of the North Pacific minke whaling trials. J. Cetacean Res. Manage., 5 (Suppl.): 133-149.
IWC [International Whaling Commission]. 2004a. Report of the Modelling Workshop on Cetacean-Fishery Competition, La Jolla, 25-27 June, 2002. J. Cetacean Res. Manage., 6 (Suppl.):413-426.
IWC [International Whaling Commission]. 2004b. Report of the Scientific Committee. J. Cetacean Res. Manage., 6 (Suppl.):1-60.
Jeschke, J.M., Kopp, M. and Tollrian, R. 2002. Predator functional responses: discriminating between handling and digesting prey. Ecol. Monogr., 72: 95-112.
Jurado-Molina, J., Livingston, P.A. and Ianelli, J.N. 2005. Incorporating predation interactions to a statistical catch-at-age model for a predator-prey system in the eastern Bering Sea. Can. J. Fish. Aquat. Sci., 62(8): 1865-1873.
Jurado-Molina, J., Livingston, P.A. and Gallucci, V.F. 2005. Testing the stability of the suitability coefficients from the eastern Bering Sea. ICES J. Mar. Sci., 62(5):915-924.
Jurado-Molina J. and Livingston, P.A. 2002. Multi-species perspectives on the Bering Sea groundfisheries management regime. N. Amer. J. Fish. Manage., 22:1164-1175.
Kaschner, K. 2004. Modelling and mapping of resource overlap between marine mammals and fisheries on a global scale. PhD thesis, MMRU, Fisheries Centre, Department of Zoology, University of British Columbia, Vancouver, Canada.
Kaschner, K., Watson, R., Christensen, V., Trites, A.W. and Pauly, D. 2001. Modelling and mapping trophic overlap between marine mammals and commercial fisheries in the North Atlantic. In D. Zeller and R.D. Pauly Watson (eds). Fisheries impacts on North Atlantic ecosystems: catch, effort and national/regional datasets. Fisheries Centre Research Reports, 9(3): 35-45.
Kavanagh, P., Newlands, N., Christensen, V. and Pauly, D. 2004. Automated parameter optimization for Ecopath ecosystem models. Ecol. Model., 172: 141-149.
Kirby, D.S., Allain, G., Lehodey, P. and Langley, A. 2004. Individual/Agent-based modelling of fishes, fishers and turtles. Working Paper SCTB17. 17th Meeting of the Standing Committee on Tuna and Billfish, Majuro, Marshall Islands, 9-18 August 2004.
Kishi, M.J., Nakajima, I. and Kamezawa, Y. 2005. Fish growth comparisons around Japan using NEMURO.FISH. North Pacific Marine Science Organisation Fourteenth Annual Meeting, Program Abstracts, 19 September–9 October 2005, Vladivostok, Russia. 79 pp.
Koen-Alonso, M. and Yodzis, P. 2005. Multi-species modelling of some components of northern and central Patagonia, Argentina. Can. J. Fish. Aquat. Sci., 62: 1490-1512.
Laevastu, T. and Larkins, H. 1981. Marine Fisheries Ecosystem: Its Quantitative Evaluation and Management. Farnham, England, Fishing News Books. 162 pp.
Larska, M.S. and Wootton, J.T. 1998. Theoretical concepts and empirical approaches to measuring interaction strength. Ecology, 79: 461-476.
Laws, R.M. 1977. The significance of vertebrates in the Antarctic marine ecosystem.
73
In G.A. Llano (ed.). Adaptations Within Antarctic Ecosystems: Third Symposium on Antarctic Biology. Scientific Committee for Antarctic Research.
Lehodey, P. 2001. The pelagic ecosystem of the tropical Pacific Ocean: dynamic spatial modelling and biological consequences of ENSO. Prog. Oceanogr., 49: 439-468.
Lehodey, P. 2005. Reference manual for the Spatial Ecosystem and Population Dynamics Model SEAPODYM. 58 pp. Available from: <http://www.seapodym.org>.
Lehodey, P., André, J-M., Bertignac, M., Hampton, J., Stoens, A.C., Menkes, L. and Memery, G.N. 1998. Predicting skipjack forage distributions in the Equatorial Pacific: preliminary results using a coupled dynamical bio-geochemical model. Fish. Oceanogr., 7: 317-325.
Lehodey, P., Chai, F. and Hampton, J. 2003. Modelling climate-related variability of tuna populations from a coupled ocean-biogeochemical-populations dynamics model. Fish. Oceanogr., 12: 483-494.
Lenhart, H.J., Radach, G. and Ruardij, P. 1997. The effects of river input on the ecosystem dynamics in the continental coastal zone of the North Sea using ERSEM. J. Sea Res., 38: 249-274.
Lewy, P. and Nielsen, A. 2003. Modelling stochastic fish stock dynamics using Markov Chain Monte Carlo. ICES J. Mar. Sci., 60: 743-752.
Lewy, P. and M. Vinther. 2004. Modelling stochastic age-length-structured multi-species stock dynamics. ICES CM 2004/FF: 20.
Li, X., Chao, Y., McWilliams, J.C. and Fu, L.-L. 2001. A comparison of two vertical-mixing schemes in a Pacific Ocean general circulation model. J. Climate, 14: 1377-1398.
Lindstrøm, U. and T. Haug. 2001. Feeding strategy and prey selectivity in common minke whales (Balaenoptera acutorostrata) foraging in the southern Barents Sea during early summer. J. Cetacean Res. Manage., 3: 239-249.
Lindstrøm, U., Haug, T. and Røttingen, I. 2001. Predation on herring (Clupea harengus) by minke whales (Balaenoptera acutorostrata) in the Barents Sea. ICES J. Mar. Sci., 59: 58-70.
Lindstrøm, U., Tjelmeland, S. and Haug, T. 2002. Implementing predation by marine mammals in fish stock assessments – minke whales and Norwergian spring spawning herring as case study. Unpublished IWC document SC/102/FW6.
Little, L.R., Fulton, E.A., Gray, R., Hayes, D., Lyne, V., Scott, R., McDonald, A.D. and Sainsbury, K. 2006. Results and Discussion for the Management Strategy Evaluation North West Shelf. North West Shelf Joint Environmental Management Study Technical Report – Vol 14.
Livingston, P.A. and Jurado-Molina, J-J. 2000. A multi-species virtual population analysis of the eastern Bering Sea. ICES J. Mar. Sci., 57: 294-299.
Livingston, P.A. and Methot, R.D. 1998. Incorporation of predation into a population assessment model of eastern Bering Sea walleye pollock. Fishery Stock Assessment Models, Alaska Sea Grant College Program, AK-SG-98-01.
Livingston, P.A. and Tjelmeland, S. 2000. Fisheries in Boreal ecosystems. ICES J. Mar. Sci., 57: 619-627.
Longhurst, A.R. and Pauly, D. 1987. Ecology of Tropical Oceans. San Diego, Academic press. 407 pp.
Loreau, M., Mouquet, N. and Holt, R.D. 2003. Meta-ecosystems: a theoretical framework for a spatial ecosystem ecology. Ecol. Lett., 6: 673-679.
Loukos, H., Monfray, P., Bopp, L. and Lehodey, P. 2003. Potential changes in skipjack tuna habitat from a global warming scenario: modelling approach and preliminary results. Fish. Oceanogr., 12: 474-482.
Mackinson, S., Blanchard, J.L., Pinnegar, J.K. and Scott, R. 2003. Consequences of alternative functional response formulations in models exploring whale-fishery
References

Models for an ecosystem approach to fisheries74
interactions. Mar. Mamm. Sci., 19: 661-681.Magnússon, K.G. 1995. An overview of the multi-species VPA: theory and applications.
Rev. Fish Biol. Fish., 5: 195-212.Mangel, M. and Switzer, P.V. 1998. A model at the level of the foraging trip for the indirect
effects of krill (Euphausia superba) fisheries on krill predators. Ecol. Model., 105: 235-256.
Martell, S.J.D., Beattie, A.I., Walters, C.J., Nayar, T. and Briese, R. 2002. Simulating fisheries management strategies in the Strait of Georgia ecosystem using Ecopath and Ecosim. In T. Pitcher and K.L. Cochrane (eds). The use of ecosystem models to investigate multi-species management strategies for capture fisheries. Fisheries Centre Research Reports, 10(2): 16-23.
Martell, S.J.D., Essington, T.E., Lessard, B., Kitchell, J.F., Walters, C.J. and Boggs, C.H. Interactions of productivity, predation risk and fishing effort in the efficacy of marine protected areas for the central Pacific. Can. J. Fish. Aquat. Sci., 62: 1320-1336.
May, R.M., Beddington, J.R., Clark, C.W., Holt, S.J. and Laws, R.M. 1979. Management of Multi-species Fisheries. Science, 205:267-277.
McAllister, M.K., Pikitch, E.K., Punt, A.E. and Hilborn, R. 1994. A Bayesian approach to stock assessment and harvest decisions using the sampling/importance resampling algorithm. Can. J. Fish. Aquat. Sci., 51: 2673-2687.
McAllister, M.K. and Ianelli, N.J. 1997. Bayesian stock assessment using catch-age data and the sampling-importance resampling algorithm. Can. J. Fish. Aquat. Sci., 54: 284-300.
McConnaughey, R.A., Mier, K.L. and Dew, C.B. 2000. An examination of chronic trawling effects on soft-bottom benthos of the eastern Bering Sea. ICES J. Mar. Sci., 57: 1377-1388.
Megrey, B.A., Hinckley, S. and Dobbins, E.L. 2002. Using scientific visualization tools to facilitate analysis of multi-dimensional data from a spatially explicit, biophysical, individual-based model of marine fish early life history. ICES J. Mar. Sci., 59: 203-215.
Mohn, R. and W. Bowen. 1996. Grey seal predation on the eastern Scotian Shelf: modelling the impact on Atlantic cod. Can. J. Fish. Aquat. Sci., 53: 2722-2738.
Mori, M. and Butterworth, D.S. 2004. Consideration of multi-species interaction in the Antarctic: an initial model of the minke whale-blue whale-krill interaction. In L.J. Shannon K.L. Cochrane and S.C. Pillar (eds). Ecosystem approaches to fisheries in the Southern Benguela. Afr. J. Mar. Sci., 26: 245-259.
Mori, M. and Butterworth, D.S. 2005. Modelling the predator-prey interactions of krill, baleen whales and seals in the Antarctic ecosystem. Workshop document presented to WG-EMM subgroup of CCAMLR, WG-EMM-05/34. 51 pp.
Mori, M. and Butterworth, D.S. 2006. A first step towards modelling the krill - predator dynamics of the Antarctic ecosystem. CCAMLR Sci., 13: 217-277.
Murray, A.G. and Parslow, J.S. 1999. Modelling of nutrient impacts in Port Philip Bay – a semi-enclosed marine Australian ecosystem. Mar. Freshwater Res., 50: 597-611.
NAMMCO [North Atlantic Marine Mammal Commission]. 2003. Report of the NAMMCO Scientific Committee Working Group on Modelling Marine Mammal Fisheries Interactions in the North Atlantic, Annex 2, Report of the 10th Meeting of the Scientific Committee. In Annual Report 2003. NAMMCO, Tromsø: pp. 259-281.
NAMMCO [North Atlantic Marine Mammal Commission]. 1998. Report of the Scientific Committee Working Group on the Role of Minke Whales, Harp Seals and Hooded Seals in the North Atlantic Ecosystems. In NAMMCO Annual Report 1997. NAMMCO, Tromsø: pp. 125-146.
NAMMCO [North Atlantic Marine Mammal Commission]. 2001. Report of the

75
Scientific Committee Working Group on the Economic Aspects of Marine Mammal – Fisheries Interactions. In NAMMCO Annual Report 2000. NAMMCO, Tromsø: pp. 169-202.
NAMMCO [North Atlantic Marine Mammal Commission]. 2002. Report of the Scientific Committee. In NAMMCO Annual Report 2001. NAMMCO, Tromsø, pp. 147-249.
NAMMCO [North Atlantic Marine Mammal Commission]. 2003. Report of the Scientific Committee. In NAMMCO Annual Report 2002. NAMMCO, Tromsø, pp. 173-259.
Navarrete, S.A., Wieters, E.A., Broitman, B.R. and J.C. Castilla. 2005. Scales of benthic-pelagic coupling and the intensity of species interactions: from recruitment limitation to top-down control. PNAS 102: 18046-18051.
Nel, D. 2005. Report on the Risk Assessment for Sustainable Fisheries (RASF) Workshop for the South African Demersal Hake Fishery, Cape Town, 30 May-3 June 2005. Department of Environmental Affairs and Tourism: 38 pp.
Nishikawa, H. and Yasuda, I. 2005. Population decline of Japanese sardine and variation of mixed layer depth in the Kuroshio Extension. North Pacific Marine Science Organisation Fourteenth Annual Meeting, Program Abstracts, 19 September–9 October 2005, Vladivostok, Russia. 52 pp.
Parma, A.M., Orensanz, J.M., Elías, I. and Jerez, G. 2003. Diving for shellfish and data: incentives for the participation of fishers in the monitoring and management of artisanal fisheries around southern South America. In S.J. Newman, D.J. Gaughan, G. Jackson, M.C. Mackie, B. Molony, J. St. John and P. Kailola (eds). Towards Sustainability of Data-Limited Multi-Sector Fisheries. Australian Society for Fish Biology Workshop Proceedings, Bunbury, Western Australia, 23-24 September 2001. Fisheries Occasional Publications No. 6, May 2003, Department of Fisheries, Perth, Western Australia, 186 pp.
Pauly, D. and Christensen, V. 1995. Primary production required to sustain global fisheries. Nature, 374: 255-257.
Pauly, D., Christensen, V. and Walters, C. 2000. ECOPATH, ECOSIM and ECOSPACE as tools for evaluating ecosystem impact of fisheries. ICES J Mar. Sci., 57: 697-706.
Pauly, D., Christensen, V., Dalsgaard, A., Froese, R. and Torres, J. 1998. Fishing down marine food webs. Science, 279: 860-863.
Pech, N., Samba, A., Drapeau, L., Sabatier, R. and Laloë, F. 2001. Fitting a model of flexible multifleet-multi-species fisheries to Senegalese artisanal fishery data. Aquat. Living Resour., 14: 81-98.
Pinnegar, J.K., Blanchard, J.L., Mackinson, S., Scott, R.D. and Duplisea, D.E. 2005. Aggregation and removal of weak-links in food-web models: system stability and recovery from disturbance. Ecol. Model., 184: 229-248.
Pitcher, T. and Cochrane, K.L. 2002. The use of ecosystem models to investigate multi-species management strategies for capture fisheries. Fisheries Centre Research Reports, 10(2): 156.
Plagányi, É.E. 2004. Walking the bridge from single- to multi-species approaches in southern African fisheries management. PhD thesis, University of Cape Town, Rondebosch, South Africa.
Plagányi, É.E. and Butterworth, D.S. 2002. Competition with fisheries. In W.F. Perrin, B. Würsig and H.G.M. Thewissen (eds). Encyclopedia of Marine Mammals, pp. 268-273. San Diego, Academic Press.
Plagányi, É.E. and Butterworth, D.S. 2004. A critical look at the potential of Ecopath with Ecosim to assist in practical fisheries management. In L.J. Shannon, K.L. Cochrane and S.C. Pillar (eds). Ecosystem approaches to fisheries in the Southern Benguela. Afr. J. Mar. Sci., 26: 261-287.
Plagányi, É.E. and Butterworth, D.S. 2005a. Indirect fishery interactions. In J.E.
References

Models for an ecosystem approach to fisheries76
Reynolds III, W.F. Perrin, R.R. Reeves, T.J. Ragen and S. Montgomery (eds). Looking to the Horizon: Future Directions in Marine Mammal Research, pp. 19-45. John Hopkins University Press, Baltimore, Maryland. 240 pp.
Plagányi, É.E. and Butterworth, D.S. 2005b. Modelling the impact of krill fishing on seal and penguin colonies. Workshop document presented to WG-EMM subgroup of CCAMLR, WG-EMM-05/14. 14 pp.
Plagányi, É.E. and Butterworth, D.S. 2006a. A spatial multi-species operating model (SMOM) of krill-predator interactions in small-scale management units in the Scotia Sea. Workshop document presented to WG-EMM subgroup of CCAMLR, WG-EMM-06/12. 28 pp.
Plagányi, É.E. and Butterworth, D.S. 2006b. An illustrative management procedure for exploring dynamic feedback in krill catch limit allocations among small-scale management units. Workshop document presented to WG-EMM subgroup of CCAMLR, WG-EMM-06/28. 17 pp.
Plagányi, É.E. and Butterworth, D.S. (in press). Competition between marine mammals and fisheries – can we successfully model this using ECOPATH with ECOSIM? Proceedings of the 4th World Fisheries Congress, Vancouver, Canada, 2004.
Plagányi, É.E., Rademeyer, R.A., Butterworth, D.S., Johnston, S.J. and Cunningham, C.L. 2007. Making management procedures operational – innovations implemented in South Africa. ICES J. Mar. Sci, 64.
Polovina, J.J. 1984. Model of a coral reef ecosystem I. The ECOPATH model and its application to French Frigate Shoals. Coral Reefs, 3: 1-11.
Pope, J.G. 1979. A modified cohort analysis in which constant natural mortality is replaced by estimates of predation levels. ICES Committee Meeting, 1979/H: 16.
Pope, J.G. 1991. The ICES multi-species assessment group: evolution, insights and future problems. ICES Mar. Sci. Symp., 193: 23-33.
Pope, J.G., Stokes, T.K., Murawski, S.A. and Idoine, S. 1988. A comparison of fish size-composition in the North Sea and on Georges Bank. In W. Wolff, C.J. Soeder and F.R. Drepper (eds). Ecodynamics, Contributions to Theoretical Ecology, pp. 146-152. Springer, Berlin. 349 pp.
Punt, A.E. and Butterworth, D.S. 1995. The effects of future consumption by the Cape fur seal on catches and catch rates of the Cape hakes. 4. Modelling the biological interaction between Cape fur seals (Arctocephalus pusillus pusillus) and Cape hakes (Merluccius capensis and M. paradoxus). S. Afr. J. Mar. Sci., 16: 255-285.
Punt, A.E. and Hilborn, R. 1997. Fisheries stock assessment and decision analysis: the Bayesian approach. Rev. Fish. Biol. Fish., 7: 35-63.
Punt, A.E. and Leslie, R.W. 1995. The effects of future consumption by the Cape fur seal on catches and catch rates of the Cape hakes. 1. Feeding and diet of the Cape hakes (Merluccius capensis and M. paradoxus). S. Afr. J. Mar. Sci., 16: 37-55.
Punt, A.E., Smith, A.D.M. and Cui, G. 2002. Evaluation of management tools for Australia’s South East Fishery. 1. Modelling the South East Fishery taking account of technical interactions. Marine and Freshwater Research, 53: 615-629.
Quince, C., Higgs, P.G. and McKane, A.J. 2005. Topological structure and interaction strengths in model food webs. Ecol. Model., 187: 389-412.
R Development Core Team. 2003. R: A language and environment for statistical computing. R Foundation for Statistical Computing, Vienna, Austria. ISBN 3-900051 00-3, <http://www.R-project.org>.
Rademeyer, R.A., Plagányi, É.E. and Butterworth, D.S. 2005. Management Procedure Robustness Tests for the South African Merluccius paradoxus and M. capensis Resources under Empirical-Based Candidate OMP1a-ii. Marine and Coastal Management document WG/11/05/D:H:45. 5 pp.
Rademeyer, R.A., Plagányi, É.E. and Butterworth, D.S. 2007. Tips and tricks in designing

77
management procedures. ICES J. Mar. Sci., 64: 626-32.Raick, C., Soetaert, K. and Grégoire, M. 2006. Model complexity and performance: How
far can we simplify? Prog. Oceangr., 70: 27-57. Rice, J.C. 2000. Evaluating fishery impacts using metrics of community structure.
ICES J. Mar. Sci., 57: 682-688.Rice, J.C., Daan, N., Pope, J.G. and Gislason, H. 1991. The stability of estimates of
suitabilities in MSVPA over four years of data from predator stomachs. ICES Mar. Sci. Symp., 193: 34-45.
Rindorf, A. 2002. The effect of stomach fullness on food intake of whiting in the North Sea. J. Fish. Biol., 61: 579-593.
Rindorf, A. Gislason, H. and Lewy, H. 1998. Does the diet of cod and whiting reflect the species composition estimated from trawl surveys? ICES C.M. 1998/CC: 5.
Sainsbury, K.J. 1991. Application of an experimental management approach to management of a tropical multi-species fishery with highly uncertain dynamics. ICES Mar. Sci. Symp., 193: 301–320.
Sainsbury, K.J., Campbell, R.A., Lindholm, R. and Whitelaw, W. 1997. Experimental management of an Australian multi-species fishery: examining the possibility of trawl-induced habitat modification. In E.L. Pikitch, D.D, Huppert and M.P. Sissenwine (eds). Global Trends: Fisheries Management. American Fisheries Society Symposium, 20: 107-112. Bethesda, Maryland, USA
Sainsbury, K.J., Punt, A.E. and Smith, A.D.M. 2000. Design of operational management strategies for achieving fishery ecosystem objectives. ICES J. Mar. Sci., 57: 731-741.
Savenkoff, C., Vézina, A.F. and Bundy, A. 2001. Inverse analysis of the structure and dynamics of the whole Newfoundland-Labrador Shelf ecosystem. Can. Tech. Rep. Fish. Aquat. Sci., 2354: viii+56 pp
Savenkoff, C., Castonguay, M., Vézina, A.F., Despatie, S-P., Chabot, D., Morissette, L. and Hammill, M.O. 2004. Inverse modelling of trophic flows through an entire ecosystem: the northern Gulf of St. Lawrence in the mid-1980s. Can. J. Fish. Aquat. Sci., 61: 2194-2214.
Scheffer, M., Carpenter, S. and de Young, B. 2005. Cascading effects of overfishing marine systems. TREE 20: 579-581.
Schindler, D. and Eby, L. 1997. Stochiometry of fishes and their prey: implications for nutrient cycling. Ecology, 78: 1816-1831.
Schweder, T., Hagen, G.S. and Hatlebakk, E. 2000. Direct and indirect effects of minke whale abundance on cod and herring fisheries: a scenario experiment for the Greater Barents Sea. In G.A. Víkingsson and F.O. Kappel (eds). Minke whales, harp and hooded seals: major predators in the North Atlantic ecosystem. NAMMCO Scientific Publications, Vol. 2: 120-132.
Sekine, M., Nakanishi, H., Ukita, M. and Murakami, S. 1991. A shallow-sea ecological model using an object-oriented programming language. Ecol. Model., 57: 221-236.
Sekine, M., Nakanishi, H. and Ukita, M. 1996. Study on fish mortality caused by the combined effects of pesticides and changes in environmental conditions. Ecol. Model., 86: 259-264.
Sekine, M., Imai, T. and Ukita, M. 1997. A model of fish distribution in rivers according to their preference for environmental factors. Ecol. Model., 104: 215-230.
Shannon, L.J., Cochrane, K.L. and Pillar, S.C. 2004. Ecosystem approaches to fisheries in the Southern Benguela. Afr. J. Mar. Sci., 26: 328 pp.
Shannon, L.J., Cochrane, K.L., Moloney, C.L. and Fréon, P. 2004. Ecosystem approach to fisheries management in the southern Benguela: a workshop overview. Afr. J. Mar. Sci., 26: 1-8.
Shin, Y-J. and Cury, P. 2001. Exploring fish community dynamics through size-dependent trophic interactions using a spatialized individual-based model. Aquat. Living Resour.,
References
Models for an ecosystem approach to fisheries78
14: 65-80.Shin, Y-J. and CuryP. 2004. Using an individual-based model of fish assemblages to study
the response of size spectra to changes in fishing. Can. J. Fish. Aquat. Sci., 61: 414-431.Shin, Y-J., Rochet, M.-J., Jennings, S., Field, J.G. and Gislason, H. 2005. Using size-based
indicators to evaluate the ecosystem effects of fishing. ICES J. Mar. Sci., 62: 384-396.Shin, Y-J., Shannon, L.J. and Cury, P.M. 2004. Simulations of fishing effects on the
southern Benguela fish community using the individual-based model: learning from a comparison with ECOSIM. In L.J. Shannon, K.L. Cochrane and S.C. Pillar (eds). Ecosystem approaches to fisheries in the Southern Benguela. Afr. J. Mar. Sci., 26: 95-113.
Sinclair, M. and Valdimarsson, G. 2003. Responsible fisheries in the marine ecosystem. Rome, Italy and Wallingford, UK. FAO and CAB International.
Smith, A.D.M., Sainsbury, K.J. and Stevens, R.A. 1999. Implementing effective fisheries-management systems: management strategy evaluation and the Australian partnership approach. ICES J. Mar. Sci., 56: 967-979.
Smith, A.D.M, Shoulder, P., Sachse, M., Baelde, P., Geen, G., Prince, J., Knuckey., Smith, D., and Walker, T. 2004. Alternative Management Strategies for the Southern and Eastern Scalefish and Shark Fishery: Qualitative Assessment, Stage 1 Report. CSIRO, Hobart.
Solé, J., Estrada, M. and Garcia-Ladona, E. 2006. Biological conrol of harmful algal blooms: a modelling study. J. Mar. Sys.
Somhlaba, S., Plagányi, É.E, Butterworth, D.S. and Rademeyer, R.A. 2004. What is the potential for the constraints associated with ECOPATH to improve estimates of biomass and productivity in the southern Benguela region? Document presented to BENEFIT-NRF-BCLME Stock Assessment Workshop, January 2004, University of Cape Town. BEN/JAN04/SAH/5a: 12 pp.
Somhlaba, S. 2006. Observer Effects on Pelagic Fleet Operations and Bayesian-based explorations of the mass balance model Ecopath. MSc thesis, University of Cape Town. 109 pp.
Sparholt, H. 1991. Multi-species assessment of Baltic fish stocks. ICES Mar. Sci. Symp., 193: 64-79.
Sparre, P. 1991. Introduction to multi-species virtual population analysis. ICES Mar. Sci. Symp., 193: 12-21.
Steele, J.H. and Henderson, E.W. 1994. Coupling between physical and biological scales. Phil. Trans. R. Soc. Lond. B, Biol. Sci., 343: 5-9.
Stefansson, G. and Palsson, O.K. 1998. The framework for multi-species modelling of Arcto-boreal systems. Rev. Fish Biol. Fish., 8: 101-104.
Stefansson, G., Sigurjónsson, J. and Víkingsson, G.A. 1997. On dynamic interactions between some fish resources and cetaceans off Iceland based on a simulation model. J. Northw. Atl. Fish. Sci., 22: 357-370.
Stephenson, R.L. and Lane, D.E. 1995. Fisheries Management Science: a plea for conceptual change. Can. J. Fish. Aquat. Sci., 52: 2051-2056.
Taylor, L., Begley, J., Kupca, V. and Stefansson, G. 2004. A simple implementation of gadget for cod in Icelandic waters. ICES CM 2004/FF: 23.
Taylor, L. and G. Stefansson. 2004. Gadget models of cod-capelin-shrimp interactions in Icelandic waters. ICES CM 2004/FF: 29.
Thomson, R.B., Butterworth, D.S., Boyd, I.L. and Croxall, J.P. 2000. Modeling the consequences of Antarctic krill harvesting on Antarctic fur seals. Ecol. Appl., 10: 1806- 1819.
Thomson, R.B., Butterworth, D.S. and Kato, H. 1999. Has the age at transition of southern hemisphere minke whales declined over recent decades? Mar. Mamm. Sci., 15: 661-682.
Tjelmeland, S. 1997. Can the management of the Barents Sea capelin stock be improved by Multi-species modelling? Forage fishes in marine ecosystems. In Proceedings of the
79
International Symposium on the Role of Forage Fish in Marine Ecosystems, pp. 617-632. Alaska Sea Grant College Program Report No. 97-01. University of Alaska Fairbanks, 1997.
Tjelmeland, S. and Bogstad, B. 1998. MULTSPEC – a review of a Multi-species modelling project for the Barents Sea. Fish. Res., 37: 127-142.
Tjelmeland, S. and Lindstrøm, U. 2005. An ecosystem element added to the assessment of Norwegian spring spawning herring: implementing predation by minke whales. ICES J. Mar. Sci., 62: 285-294.
Trenkel, V.M., Pinnegar, J.K. and Tidd, A.N. 2004. Can Multi-species models be expected to provide better assessments for Celtic sea groundfish stocks? ICES CM 2004/FF: 05.
Trites, A.W., Christensen, V. and D. Pauly. 1997. Competition between fisheries and marine mammals for prey and primary production in the Pacific Ocean. J. Northw. Atl. Fish. Sci., 22: 173-187.
Trites, A.W., Livingston, P.A., Mackinson, S., Vasconcellos M.C., Springer, A.M. and Pauly, D. 1999. Ecosystem change and the decline of marine mammals in the Eastern Bering Sea. Testing the ecosystem shift and commercial whaling hypotheses. Fisheries Centre Research Reports, University of British Columbia. Vol. 7. 106 pp.
Tschirhart, J. and Finnoff, D. 2003. Protecting an Endangered Species while Harvesting its Prey in a General Equilibrium Ecosystem Model. Land Economics, 79: 160-180.
Tschirhart, J. 2004 A New Adaptive System Approach to Predator-prey Modeling. Ecol. Model., 176: 255-276.
Tsou, T.S. and Collie, J.S. 2001. Predation-mediated recruitment in the Georges Bank fish community. ICES J. Mar. Sci., 58: 994-1001.
Van Nes, E.H., Lammens, E.H.R.R. and Scheffer, M. 2002. PISCATOR, an individual-based model to analyze the dynamics of lake fish communities. Ecol. Model., 152: 261-278.
Van Winkle, W., Rose, K.A. and Chambers, R.C. 1993. Individual-based approach to fish population dynamics: an overview. Trans. Am. Fish. Soc., 122: 397-403.
Varpe, Ø., Fiksen, Ø. and Slotte, A. 2005. Meta-ecosystems and biological energy transport from ocean to coast: the ecological importance of herring migration. Oecologia, 146: 443-451.
Vasconcellos, M. and Gasalla, M.A. 2001. Fisheries catches and the carrying capacity of marine ecosystems in southern Brazil. Fish. Res., 50: 279-295.
Vasconcellos, M., Heymans, J. and Bundy, A. 2002. The use of Ecosim to investigate Multi-species harvesting strategies for capture fisheries of the Newfoundland-Labrador shelf. In T. Pitcher and K.L. Cochrane (eds). The use of ecosystem models to investigate multi-species management strategies for capture fisheries. Fisheries Centre Research Reports, 10(2): 68-72.
Vasseur, D. and McCann, K. 2005. A mechanistic approach for modelling temperature-dependent consumer-resource dynamics. Am. Nat., 165: 184-198.
Vézina, A.F. and Pahlow, M. 2003. Reconstruction of ecosystem flows using inverse methods: how well do they work? J. Mar. Sys., 40/41: 55-77.
Vézina, A.F., Savenhoff, C., Roy, S., Klein, B., Rivkin, R., Therriault, J.-C. and Legendre, L. 2000. Export of biogenic carbon and structure and dynamics of the pelagic food web in the Gulf of St. Lawrence. Part 2. Inverse analysis. Deep Sea Res., 47: 609-635.
Vidal, L. and Pauly, D. 2004. Integration of subsystems models as a tool toward describing feeding interactions and fisheries impacts in a large marine ecosystem, the Gulf of Mexico. Ocean and Coastal Manage., 47: 709-725.
Vinther, M. 2001. Ad hoc multi-species VPA tuning applied for the Baltic and North Sea fish stocks. ICES J. Mar. Sci,. 58: 311-320.
Vinther, M., Lewy, P., Thomsen, L. and Petersen, U. 1998. Specification and documentation of the 4M Package containing Multi-species, Multi-fleet and Multi-Area Models. Danish Institute for Fisheries Research, Charlottenlund.
References
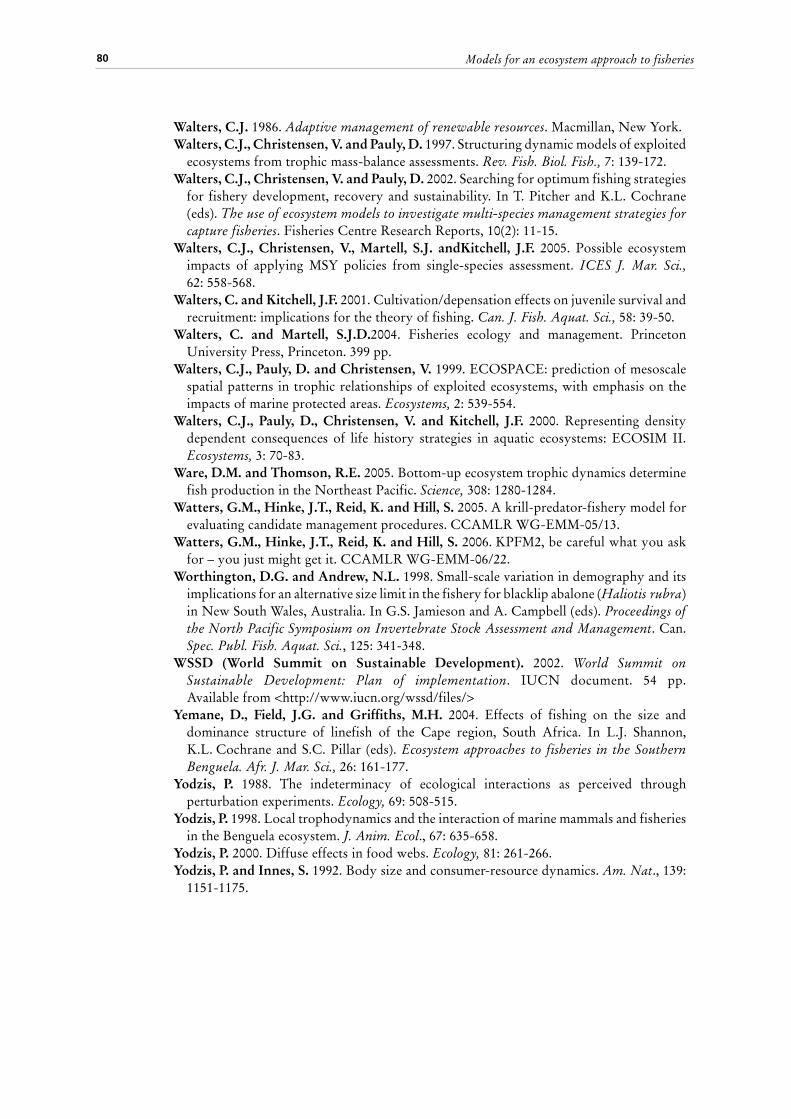
Models for an ecosystem approach to fisheries80
Walters, C.J. 1986. Adaptive management of renewable resources. Macmillan, New York.Walters, C.J., Christensen, V. and Pauly, D. 1997. Structuring dynamic models of exploited
ecosystems from trophic mass-balance assessments. Rev. Fish. Biol. Fish., 7: 139-172.Walters, C.J., Christensen, V. and Pauly, D. 2002. Searching for optimum fishing strategies
for fishery development, recovery and sustainability. In T. Pitcher and K.L. Cochrane (eds). The use of ecosystem models to investigate multi-species management strategies for capture fisheries. Fisheries Centre Research Reports, 10(2): 11-15.
Walters, C.J., Christensen, V., Martell, S.J. andKitchell, J.F. 2005. Possible ecosystem impacts of applying MSY policies from single-species assessment. ICES J. Mar. Sci., 62: 558-568.
Walters, C. and Kitchell, J.F. 2001. Cultivation/depensation effects on juvenile survival and recruitment: implications for the theory of fishing. Can. J. Fish. Aquat. Sci., 58: 39-50.
Walters, C. and Martell, S.J.D.2004. Fisheries ecology and management. Princeton University Press, Princeton. 399 pp.
Walters, C.J., Pauly, D. and Christensen, V. 1999. ECOSPACE: prediction of mesoscale spatial patterns in trophic relationships of exploited ecosystems, with emphasis on the impacts of marine protected areas. Ecosystems, 2: 539-554.
Walters, C.J., Pauly, D., Christensen, V. and Kitchell, J.F. 2000. Representing density dependent consequences of life history strategies in aquatic ecosystems: ECOSIM II. Ecosystems, 3: 70-83.
Ware, D.M. and Thomson, R.E. 2005. Bottom-up ecosystem trophic dynamics determine fish production in the Northeast Pacific. Science, 308: 1280-1284.
Watters, G.M., Hinke, J.T., Reid, K. and Hill, S. 2005. A krill-predator-fishery model for evaluating candidate management procedures. CCAMLR WG-EMM-05/13.
Watters, G.M., Hinke, J.T., Reid, K. and Hill, S. 2006. KPFM2, be careful what you ask for – you just might get it. CCAMLR WG-EMM-06/22.
Worthington, D.G. and Andrew, N.L. 1998. Small-scale variation in demography and its implications for an alternative size limit in the fishery for blacklip abalone (Haliotis rubra) in New South Wales, Australia. In G.S. Jamieson and A. Campbell (eds). Proceedings of the North Pacific Symposium on Invertebrate Stock Assessment and Management. Can. Spec. Publ. Fish. Aquat. Sci., 125: 341-348.
WSSD (World Summit on Sustainable Development). 2002. World Summit on Sustainable Development: Plan of implementation. IUCN document. 54 pp. Available from <http://www.iucn.org/wssd/files/>
Yemane, D., Field, J.G. and Griffiths, M.H. 2004. Effects of fishing on the size and dominance structure of linefish of the Cape region, South Africa. In L.J. Shannon, K.L. Cochrane and S.C. Pillar (eds). Ecosystem approaches to fisheries in the Southern Benguela. Afr. J. Mar. Sci., 26: 161-177.
Yodzis, P. 1988. The indeterminacy of ecological interactions as perceived through perturbation experiments. Ecology, 69: 508-515.
Yodzis, P. 1998. Local trophodynamics and the interaction of marine mammals and fisheries in the Benguela ecosystem. J. Anim. Ecol., 67: 635-658.
Yodzis, P. 2000. Diffuse effects in food webs. Ecology, 81: 261-266.Yodzis, P. and Innes, S. 1992. Body size and consumer-resource dynamics. Am. Nat., 139:
1151-1175.

Appendixes


83Appendixes
TABLE A1Methods available for assessing the impacts of ecological (indirect) interactions between species and fisheries and their implications for fisheries management. Model comparison including comparison of level of complexity and realism, functional responses, dealing with uncertainty, incorporation of environmental effects, spatial representation, handling of migratory species, adequacy re assessing different management controls and effects of ecosystem changes, suitability to conduct assessment and policy exploration, transparency of operation and suitability for data poor areas TABLE A1a MODEL COMPARISON
Type of model Whole ecosystem models
Biogeochemical ecosystem models
Biogeochemical ecosystem models
Dynamic multispecies models
Biogeochemical ecosystem models
MODEL Ecopath with Ecosim
IGBEM ATLANTIS INVITRO ERSEM II
1. Level of complexity and realism
a) No. of modelled species/groups
Can be very large; typically around 30
Large: 20-30 > 20 typically, though to date used with 15-61 groups (with multiple stocks per group in some cases)
10-20 groups typically (including habitat groups)
10-20 groups, mostly phytoplankton and zooplankton
b) Representation of size/age structure
Recently full age-structure capability for groups
Vertebrates - age-structured models; invertebrate and primary producer groups - aggregate biomass pools
Vertebrates - age-structured models; invertebrate and primary producer groups (defined based on role and size) - aggregate biomass pools; some invertebrate age structuring
Detailed representations, including age and size structure
Aggregate biomass pools
c) Physical/biological processes
Can be included to limited extent
Detailed representation of physical processes, input forcing of nutrients and physics
Detailed representation of physical processes with model driven by seasonal variation in irradiance and temperature, nutrient inputs from point sources, atmospheric nutrient inputs and exchanges with oceanic boundary components
Detailed representation of physical forces, but not nutrients (usually)
Detailed representation with e.g. light and temperature forcing functions
d) Technical interactions
Can be included Fishery discards - target species. Some incidental fishing mortality effects on bycatch groups
Excellent representation; includes bycatch groups e.g. discarded non-target groups, landed and marketed non-target by-product groups
Some bycatch groups, discards and incidental impacts are represented
No
2. Functional responses
Foraging arena formulation (see text) By choosing appropriate parameter combinations, EwE can generate a range of functional responses including Types II and III
Mixed (Type II, Type III)
Flexible e.g. Type II or Type III or other
Depending on agent types used there can be explicit feeding interactions OR the state of the habitat is taken as a proxy for foodweb state and fauna is assumed to be getting its ration if the habitat is in good condition
Type II

Models for an ecosystem approach to fisheries84
TABLE A1a (continued)
Type of model Whole ecosystem models
Biogeochemical ecosystem models
Biogeochemical ecosystem models
Dynamic multispecies models
Biogeochemical ecosystem models
MODEL Ecopath with Ecosim IGBEM ATLANTIS INVITRO ERSEM II
3. Uncertainties in model structure, parameters and data
ECORANGER - although this should/could be improved; recent improvements include capabilities to balance models based on uncertainty, fitting to time series and quantifying input parameter uncertainty by running ECOSIM using a Monte Carlo approach
Aspects considered by Fulton (2001), Fulton et al. (2004a)
Aspects considered by Fulton (2001), Fulton et al. (2004a,b) - no formal fitting to data within the modelling software, though limited fitting happens externally to the model (no feedback estimation as yet)
Aspects considered by bounding using “pessimistic”, “middle-of-the-road” and “optimistic” parameterisations. Some components (in particular target species, fisheries and biogenic habitat) undergo formal fitting
Explored to a limited extent
4a) Environmental effects
Incorporates a facility in the form of a (seasonal or longer term) forcing function routine to represent the mediation of physical or other environmental parameters
Detailed consideration.
Detailed consideration - light, nutrient, temperature inputs; long-term climate anomaly data
Forcing is typically currents, winds, rainfall and catastrophes
Detailed consideration - light, nutrient, temperature inputs; good representation of river inputs and atmospheric nutrient inputs
4b) Interactions with non-target species
Major focus of approach
More of a focus than target groups
More of a focus than target groups
Some consideration, but main focus is on target, vulnerable and habitat species
N/A
5. Spatial representation
a) Species interactions
Not explicitly but implicitly to some extent due to foraging arena formulation
Spatially explicit representation
Spatially explicit representation
Spatially explicit No
b) Habitat related processes
No explicit spatial representation in ECOSIM but ECOSPACE is spatially resolved
Detailed representations
Polygonal geometry matches geographical features; multiple vertical water column layers; subgrid scale representation of physical and habitat properties
Three dimensional in continuous space, with explicit habitats (and habitat related processes)
Good representation of transport processes for plankton groups
6. Migratory species
Doesn’t handle particularly well; ECOSPACE has more potential
No - aggregated species groups
Movement (migration and advective transfer) between areas and vertical layers (and also in/out of the model domain)
Movement through and in/out of the modelled area
N/A
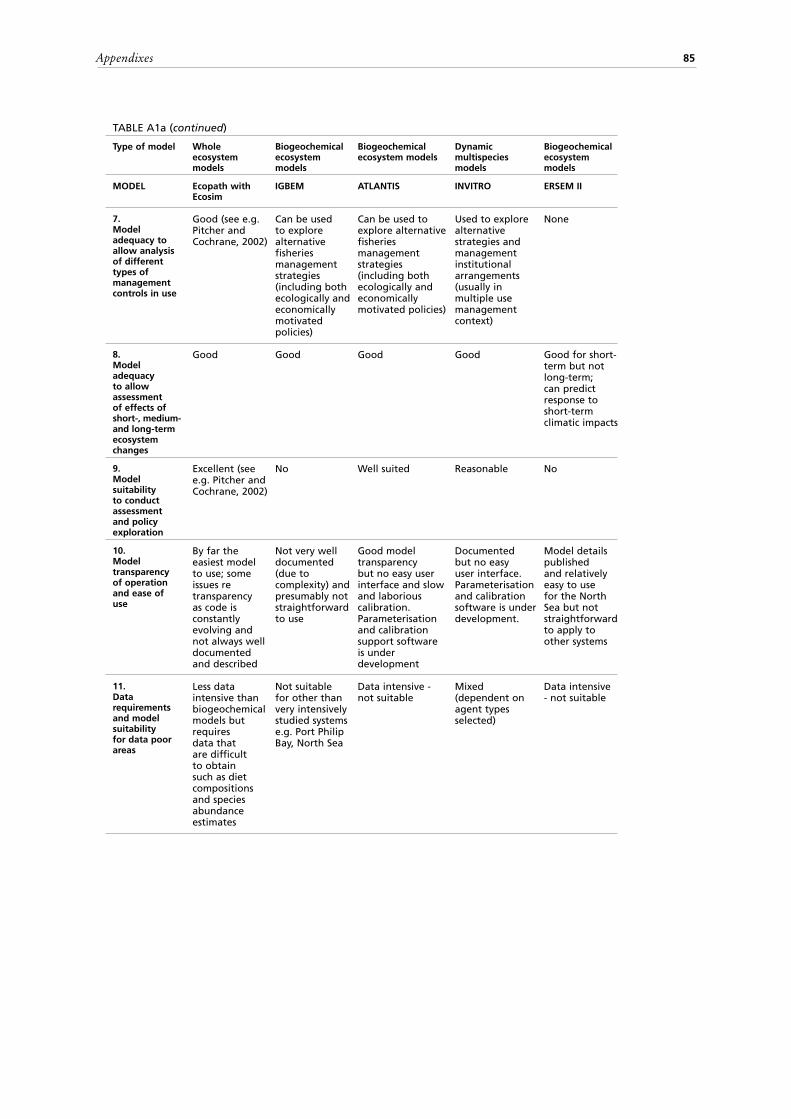
85Appendixes
TABLE A1a (continued)
Type of model Whole ecosystem models
Biogeochemical ecosystem models
Biogeochemical ecosystem models
Dynamic multispecies models
Biogeochemical ecosystem models
MODEL Ecopath with Ecosim
IGBEM ATLANTIS INVITRO ERSEM II
7. Model adequacy to allow analysis of different types of management controls in use
Good (see e.g. Pitcher and Cochrane, 2002)
Can be used to explore alternative fisheries management strategies (including both ecologically and economically motivated policies)
Can be used to explore alternative fisheries management strategies (including both ecologically and economically motivated policies)
Used to explore alternative strategies and management institutional arrangements (usually in multiple use management context)
None
8. Model adequacy to allow assessment of effects of short-, medium- and long-term ecosystem changes
Good Good Good Good Good for short-term but not long-term; can predict response to short-term climatic impacts
9. Model suitability to conduct assessment and policy exploration
Excellent (see e.g. Pitcher and Cochrane, 2002)
No Well suited Reasonable No
10. Model transparency of operation and ease of use
By far the easiest model to use; some issues re transparency as code is constantly evolving and not always well documented and described
Not very well documented (due to complexity) and presumably not straightforward to use
Good model transparency but no easy user interface and slow and laborious calibration. Parameterisation and calibration support software is under development
Documented but no easy user interface. Parameterisation and calibration software is under development.
Model details published and relatively easy to use for the North Sea but not straightforward to apply to other systems
11. Data requirements and model suitability for data poor areas
Less data intensive than biogeochemical models but requires data that are difficult to obtain such as diet compositions and species abundance estimates
Not suitable for other than very intensively studied systems e.g. Port Philip Bay, North Sea
Data intensive - not suitable
Mixed (dependent on agent types selected)
Data intensive - not suitable

Models for an ecosystem approach to fisheries86
TABLE A1b MODEL COMPARISON
MODEL SSEM KPFM MRM e.g. Punt and Butterworth (1995)
MSVPA and MSFOR
MSM
1. Level of complexity and realism
a) No. of modelled species/groups
Lumped model components e.g. fish, plankton, nutrients
Currently 1-4 predator stocks within each SSMU (Small-Scale Spatial Unit)
Typically few e.g. 4 components
Typically few (6-8)
Thus far 2 species (walleye pollock and Pacific cod - and cannibalism) but could be extended
b) Representation of size/age structure
Aggregate biomass pools
Krill: juvenile and adult components; predators: juvenile, breeding and non-breeding components
Detailed representations - age structure
Detailed representations - age structure
Fully age-structured
c) Physical/biological processes
Detailed representation with e.g. forcing using temperature, current and nutrient loads from land
Coupled to physical model to simulate transport of krill
No physical Not usually represented
None
d) Technical interactions
No No Not included Can be included Not currently included
2. Functional responses
Type II Flexible - Holling Type II and Type III functional responses
Type II Fixed ration that is independent of prey abundance in forecasts
Based on Type II

87Appendixes
TABLE A1b (continued)
MODEL SSEM KPFM MRM e.g. Punt and Butterworth (1995)
MSVPA and MSFOR
MSM
3. Uncertainties in model structure, parameters and data
Unknown Monte Carlo simulations to investigate numerical uncertainty; robustness to alternative model formulations explored; no formal fitting to data and hence considerable uncertainty re some parameter values which are input
Model fits to available data. Good initial explorations; could perhaps be improved using e.g. Bayesian methods
Explored to some extent
Good consideration of these
4a) Environmental effects
Forcing - currents, nutrient, temperature inputs
Some forcing from e.g. currents and several formulations linked to environmental index
Not included Can be included
Not included
4b) Interactions with non-target species
N/A Investigates effects of krill as target species on non-target predator species
Minor only Minor only Not currently considered
5. Spatial representation
a) Species interactions
No Spatially explicit at scale of SSMUs but not at smaller scales
Not spatial Not spatial No
b) Habitat related processes
No Model’s spatial cells match SSMUs which can have different physical and biological features
No No No
6. Migratory species
N/A Simulates movements of krill but not predators
No No Not suitable

Models for an ecosystem approach to fisheries88
TABLE A1b (continued)
MODEL SSEM KPFM MRM e.g. Punt and Butterworth (1995)
MSVPA and MSFOR
MSM
7. Model adequacy to allow analysis of different types of management controls in use
None Designed to address options for subdivision of the precautionary krill catch limit amongst SSMUs
Excellent Some Some
8. Model adequacy to allow assessment of effects of short-, medium- and long-term ecosystem changes
Short-term effects of changes in coastal system
Some No No No
9. Model suitability to conduct assessment and policy exploration
No Designed to address options for subdivision of the precautionary krill catch limit amongst SSMUs
Excellent Some contributions
No
10. Model transparency of operation and ease of use
Model details published ; easiness of use difficult to assess
Model still being developed so not generally available yet
Detailed model descriptions but complicated and time-consuming to use
Good model descriptions; moderately easy to use
Average transparency but not easy to use
11. Data requirements and model suitability for data poor areas
Data intensive but lumped components mean it may not be as bad as some other biogeochemical models
Can be adapted to match level of data available
Fairly data intensive but focuses on a few target species only for which more data usually exists even in data poor areas
Detailed stomach content data input to model makes it unsuitable for most regions, but there are hybrid versions that require less data
Some potential as focuses on few/target species for which there are typically some data
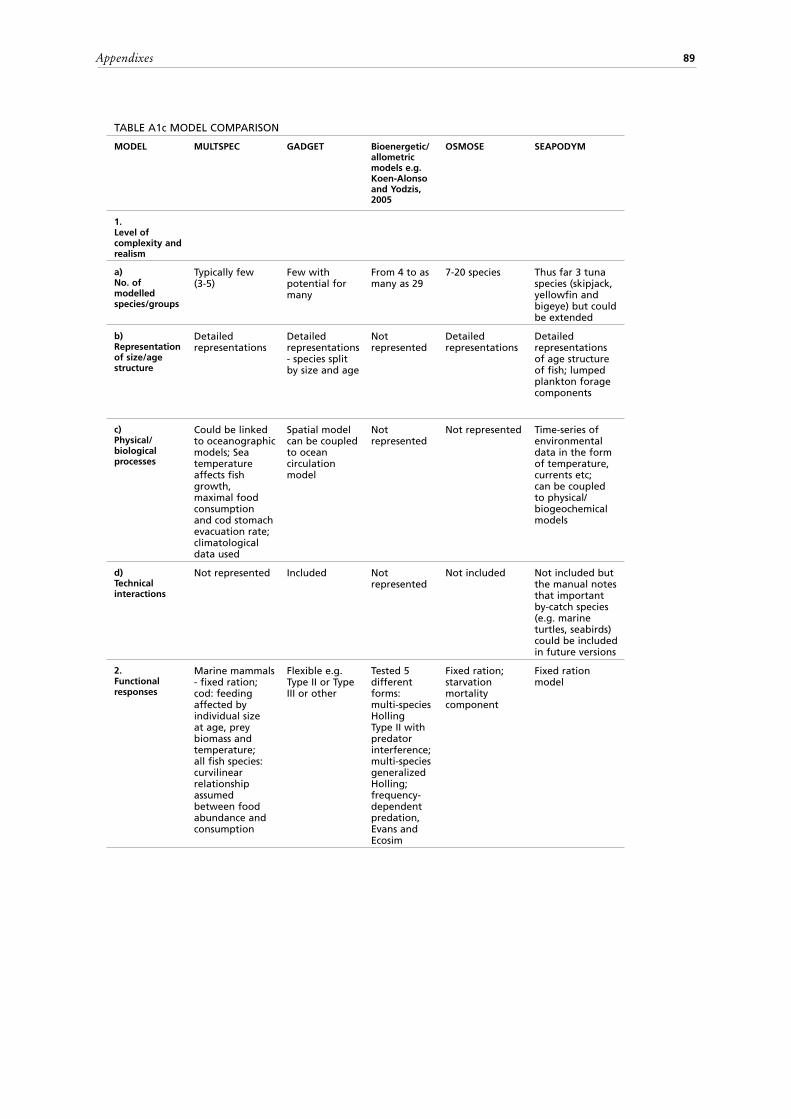
89Appendixes
TABLE A1c MODEL COMPARISON
MODEL MULTSPEC GADGET Bioenergetic/allometric models e.g. Koen-Alonso and Yodzis, 2005
OSMOSE SEAPODYM
1. Level of complexity and realism
a) No. of modelled species/groups
Typically few (3-5)
Few with potential for many
From 4 to as many as 29
7-20 species Thus far 3 tuna species (skipjack, yellowfin and bigeye) but could be extended
b) Representation of size/age structure
Detailed representations
Detailed representations - species split by size and age
Not represented
Detailed representations
Detailed representations of age structure of fish; lumped plankton forage components
c) Physical/biological processes
Could be linked to oceanographic models; Sea temperature affects fish growth, maximal food consumption and cod stomach evacuation rate; climatological data used
Spatial model can be coupled to ocean circulation model
Not represented
Not represented Time-series of environmental data in the form of temperature, currents etc; can be coupled to physical/biogeochemical models
d) Technical interactions
Not represented Included Not represented
Not included Not included but the manual notes that important by-catch species (e.g. marine turtles, seabirds) could be included in future versions
2. Functional responses
Marine mammals - fixed ration; cod: feeding affected by individual size at age, prey biomass and temperature; all fish species: curvilinear relationship assumed between food abundance and consumption
Flexible e.g. Type II or Type III or other
Tested 5 different forms: multi-species Holling Type II with predator interference; multi-species generalized Holling; frequency-dependent predation, Evans and Ecosim
Fixed ration; starvation mortality component
Fixed ration model

Models for an ecosystem approach to fisheries90
TABLE A1c (continued)
MODEL MULTSPEC GADGET Bioenergetic/allometric models e.g. Koen-Alonso and Yodzis, 2005
OSMOSE SEAPODYM
3. Uncertainties in model structure, parameters and data
Likelihood function used to estimate maturation parameters - fit to empirical maturation data; also likelihood function re predation parameters - based on extensive stomach content data; several explorations re alternative model formulations and hypotheses (e.g. Bogstad et al., 1992, Tjelmeland, 1997) but scope for more
Uses combined simulated annealing and Hooke&Jeeves optimisation methods to estimate best fit parameters according to a pre-specified likelihood function; modular form permits sensitivity investigation to range of alternative model structures
Investigated structural uncertainty by exploring sensitivity to alternative functional response representations; explored parameter uncertainty using the SIR algorithm (Punt and Hilborn, 1997, McAllister et al., 1994).
Large uncertainties not rigorously dealt with
Not well explored; Statistical estimation of parameters may be added
4a) Environmental effects
Not explicitly included but plankton described using time-varying functions with different parameters for various areas
Bottom-up explorations e.g. using adapted random walk (Hulse, 2001)
Not included Carrying capacity constraint can be varied to simulate e.g. random or periodic dynamics
Detailed consideration of effects of temperature, currents, etc.; suitable for investigating climate change scenarios and effect of e.g. ENSO events
4b) Interactions with non-target species
Some representation e.g. polar cod included in model
Represented Some - sea lions Explicit consideration of non-target fish species but not other
Considers impacts of these on target species and not really the other way around
5. Spatial representation
a) Species interactions
Division into areas (7 in Barents Sea) to describe east-west gradients in individual growth of species and migration patterns
Spatially explicit with migration matrices specifying movement between areas
No Spatially explicit with fish schools moving to areas with highest potential prey biomass
Spatially explicit with one degree cells
b) Habitat related processes
Minor only e.g. different temperatures in different areas
Could be tailored by linking with oceanographic models
No No Good (novel) spatial representation of differences in habitat quality (see text for details)
6. Migratory species
Multiple areas with migration between areas
Multiple areas with migration between areas
No explicit modelling of migration
No Can be handled through movement model linked to habitat quality
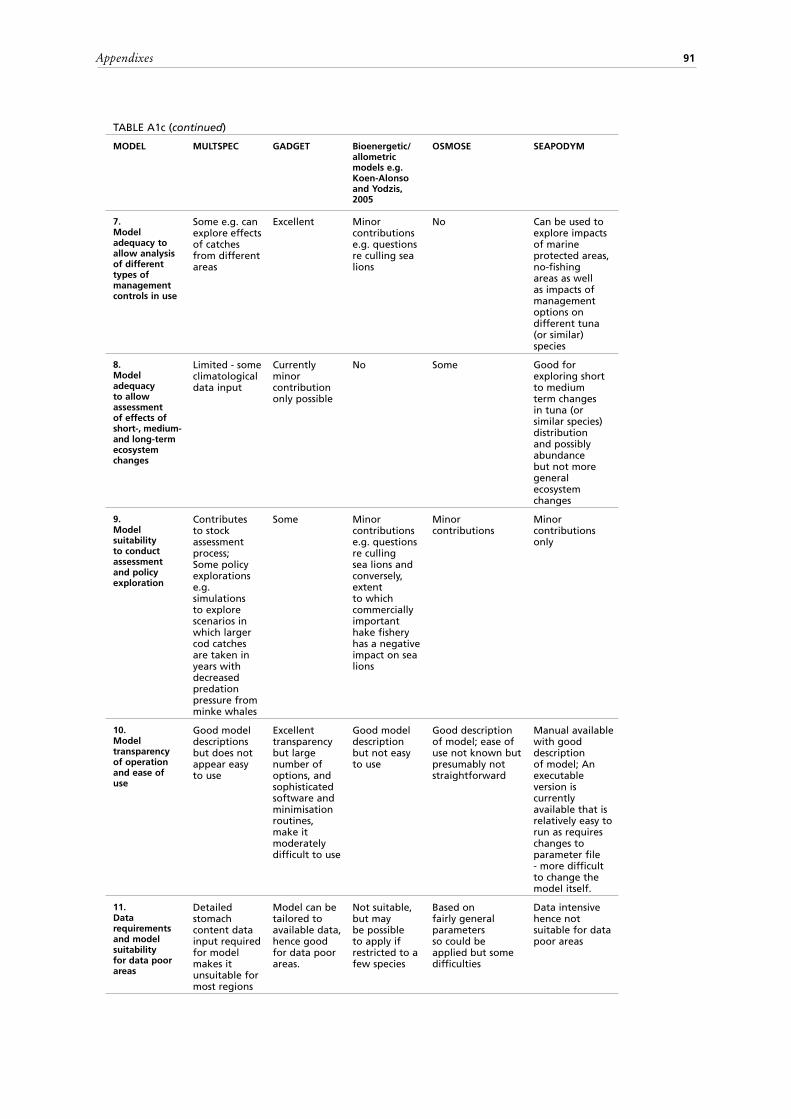
91Appendixes
TABLE A1c (continued)
MODEL MULTSPEC GADGET Bioenergetic/allometric models e.g. Koen-Alonso and Yodzis, 2005
OSMOSE SEAPODYM
7. Model adequacy to allow analysis of different types of management controls in use
Some e.g. can explore effects of catches from different areas
Excellent Minor contributions e.g. questions re culling sea lions
No Can be used to explore impacts of marine protected areas, no-fishing areas as well as impacts of management options on different tuna (or similar) species
8. Model adequacy to allow assessment of effects of short-, medium- and long-term ecosystem changes
Limited - some climatological data input
Currently minor contribution only possible
No Some Good for exploring short to medium term changes in tuna (or similar species) distribution and possibly abundance but not more general ecosystem changes
9. Model suitability to conduct assessment and policy exploration
Contributes to stock assessment process; Some policy explorations e.g. simulations to explore scenarios in which larger cod catches are taken in years with decreased predation pressure from minke whales
Some Minor contributions e.g. questions re culling sea lions and conversely, extent to which commercially important hake fishery has a negative impact on sea lions
Minor contributions
Minor contributions only
10. Model transparency of operation and ease of use
Good model descriptions but does not appear easy to use
Excellent transparency but large number of options, and sophisticated software and minimisation routines, make it moderately difficult to use
Good model description but not easy to use
Good description of model; ease of use not known but presumably not straightforward
Manual available with good description of model; An executable version is currently available that is relatively easy to run as requires changes to parameter file - more difficult to change the model itself.
11. Data requirements and model suitability for data poor areas
Detailed stomach content data input required for model makes it unsuitable for most regions
Model can be tailored to available data, hence good for data poor areas.
Not suitable, but may be possible to apply if restricted to a few species
Based on fairly general parameters so could be applied but some difficulties
Data intensive hence not suitable for data poor areas

Models for an ecosystem approach to fisheries92
TABLE A1d MODEL COMPARISON
MODEL CCAMLR models e.g. Mori & Butterworth 2005, 2006
EPOC SMOM ESAM SEASTAR
1. Level of complexity and realism
a) No. of modelled species/groups
Typically few e.g. 7
2 in current example; being extended
Currently 2 predator stocks within each SSMU
Few - typically 2 (and cannibalism) - 4
Few - typically 2 (and cannibalism) - 4
b) Representation of size/age structure
Not represented
Can select to include detailed age or size-structure; Trial example: krill: spatially and age-structured; predator: age-aggregated
Krill: lumped; predators: juvenile, breeding and non-breeding components
Detailed representations
Detailed representations
c) Physical/biological processes
Not represented
Various formulations can be accommodated e.g. advance and retreat of sea ice modelled; ocean transport may be included in future
Can be coupled to physical model to simulate transport of krill
Not represented Not represented
d) Technical interactions
Not represented
Not currently No Could be represented
Could be represented
2. Functional responses
Type II and Type III
Type I relationship in trial; designed to be flexible
Flexible - Holling Type II and Type III functional responses
Type I and II considered
Variable e.g. Type I, II or III

93Appendixes
TABLE A1d (continued)
MODEL CCAMLR models e.g. Mori & Butterworth 2005, 2006
EPOC SMOM ESAM SEASTAR
3. Uncertainties in model structure, parameters and data
Likelihood function used to fit model to all available data and indices of abundance; sensitivities to alternative formulations explored; need for a more systematic exploration of sensitivity to alternative input parameter choices
Should permit sensitivity to alternative model structures, but no formal statistical testing/fitting
Reference Set used comprises 12 alternative combinations that essentially try to bound the uncertainty in the choice of survival estimates as well as the breeding success relationship; Robustness to alternative model formulations explored; Some formal fitting to data
Bayesian methods; considered as rigorously as in single-species assessment approaches.
Usually considered as rigorously as in single-species assessment approaches; uncertainty evaluated using e.g. bootstrapping
4a) Environmental effects
Not included Could be linked to other physical oceanographic models but not yet developed
Could be linked to other physical oceanographic models but not yet developed
Not usually included
Not usually included
4b) Interactions with non-target species
Explicit consideration of krill-whale-seal interactions
Could be included
Investigates effects of krill as target species on non-target predator species
Focus is on target species
Focus is on target species
5. Spatial representation
a) Species interactions
Limited (two spatial strata)
Spatial subdivision into polygons (8 in trial version)
Spatially explicit at scale of SSMUs but not at smaller scales
Not usually Not usually
b) Habitat related processes
No Not currently Model spatial cells match SSMUs which can have different physical and biological features
No No
6. Migratory species
No explicit modelling of migration
Movement matrix can be included
Simulates movements of krill but not predators
Not usually Not usually
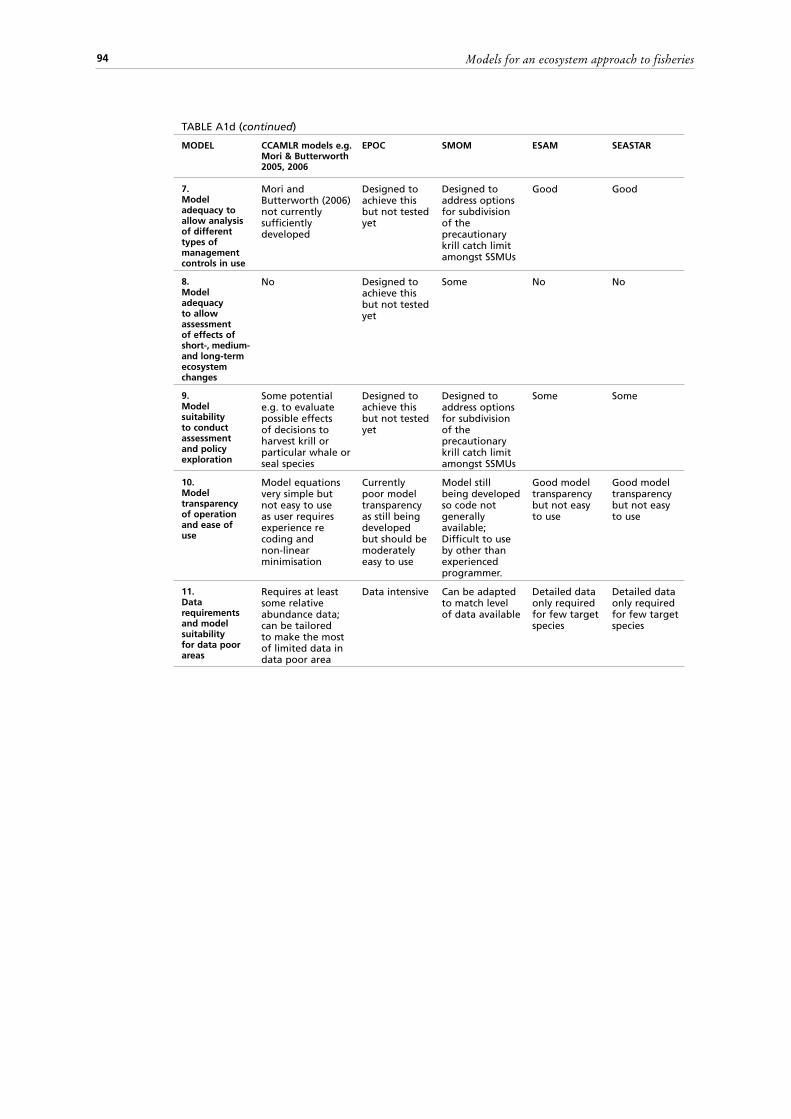
Models for an ecosystem approach to fisheries94
TABLE A1d (continued)
MODEL CCAMLR models e.g. Mori & Butterworth 2005, 2006
EPOC SMOM ESAM SEASTAR
7. Model adequacy to allow analysis of different types of management controls in use
Mori and Butterworth (2006) not currently sufficiently developed
Designed to achieve this but not tested yet
Designed to address options for subdivision of the precautionary krill catch limit amongst SSMUs
Good Good
8. Model adequacy to allow assessment of effects of short-, medium- and long-term ecosystem changes
No Designed to achieve this but not tested yet
Some No No
9. Model suitability to conduct assessment and policy exploration
Some potential e.g. to evaluate possible effects of decisions to harvest krill or particular whale or seal species
Designed to achieve this but not tested yet
Designed to address options for subdivision of the precautionary krill catch limit amongst SSMUs
Some Some
10. Model transparency of operation and ease of use
Model equations very simple but not easy to use as user requires experience re coding and non-linear minimisation
Currently poor model transparency as still being developed but should be moderately easy to use
Model still being developed so code not generally available; Difficult to use by other than experienced programmer.
Good model transparency but not easy to use
Good model transparency but not easy to use
11. Data requirements and model suitability for data poor areas
Requires at least some relative abundance data; can be tailored to make the most of limited data in data poor area
Data intensive Can be adapted to match level of data available
Detailed data only required for few target species
Detailed data only required for few target species
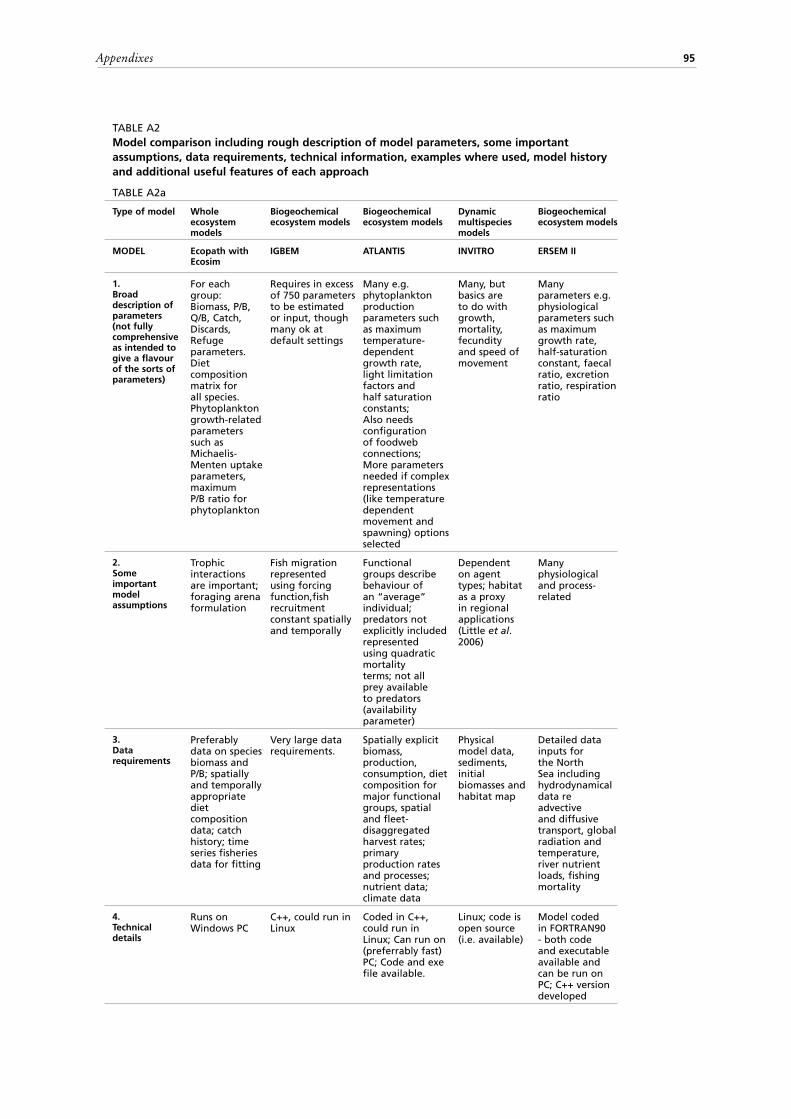
95Appendixes
TABLE A2Model comparison including rough description of model parameters, some important assumptions, data requirements, technical information, examples where used, model history and additional useful features of each approach
TABLE A2a
Type of model Whole ecosystem models
Biogeochemical ecosystem models
Biogeochemical ecosystem models
Dynamic multispecies models
Biogeochemical ecosystem models
MODEL Ecopath with Ecosim
IGBEM ATLANTIS INVITRO ERSEM II
1. Broad description of parameters (not fully comprehensive as intended to give a flavour of the sorts of parameters)
For each group: Biomass, P/B, Q/B, Catch, Discards, Refuge parameters. Diet composition matrix for all species. Phytoplankton growth-related parameters such as Michaelis-Menten uptake parameters, maximum P/B ratio for phytoplankton
Requires in excess of 750 parameters to be estimated or input, though many ok at default settings
Many e.g. phytoplankton production parameters such as maximum temperature-dependent growth rate, light limitation factors and half saturation constants; Also needs configuration of foodweb connections; More parameters needed if complex representations (like temperature dependent movement and spawning) options selected
Many, but basics are to do with growth, mortality, fecundity and speed of movement
Many parameters e.g. physiological parameters such as maximum growth rate, half-saturation constant, faecal ratio, excretion ratio, respiration ratio
2. Some important model assumptions
Trophic interactions are important; foraging arena formulation
Fish migration represented using forcing function,fish recruitment constant spatially and temporally
Functional groups describe behaviour of an “average” individual; predators not explicitly included represented using quadratic mortality terms; not all prey available to predators (availability parameter)
Dependent on agent types; habitat as a proxy in regional applications (Little et al. 2006)
Many physiological and process-related
3. Data requirements
Preferably data on species biomass and P/B; spatially and temporally appropriate diet composition data; catch history; time series fisheries data for fitting
Very large data requirements.
Spatially explicit biomass, production, consumption, diet composition for major functional groups, spatial and fleet-disaggregated harvest rates; primary production rates and processes; nutrient data; climate data
Physical model data, sediments, initial biomasses and habitat map
Detailed data inputs for the North Sea including hydrodynamical data re advective and diffusive transport, global radiation and temperature, river nutrient loads, fishing mortality
4. Technical details
Runs on Windows PC
C++, could run in Linux
Coded in C++, could run in Linux; Can run on (preferrably fast) PC; Code and exe file available.
Linux; code is open source (i.e. available)
Model coded in FORTRAN90 - both code and executable available and can be run on PC; C++ version developed
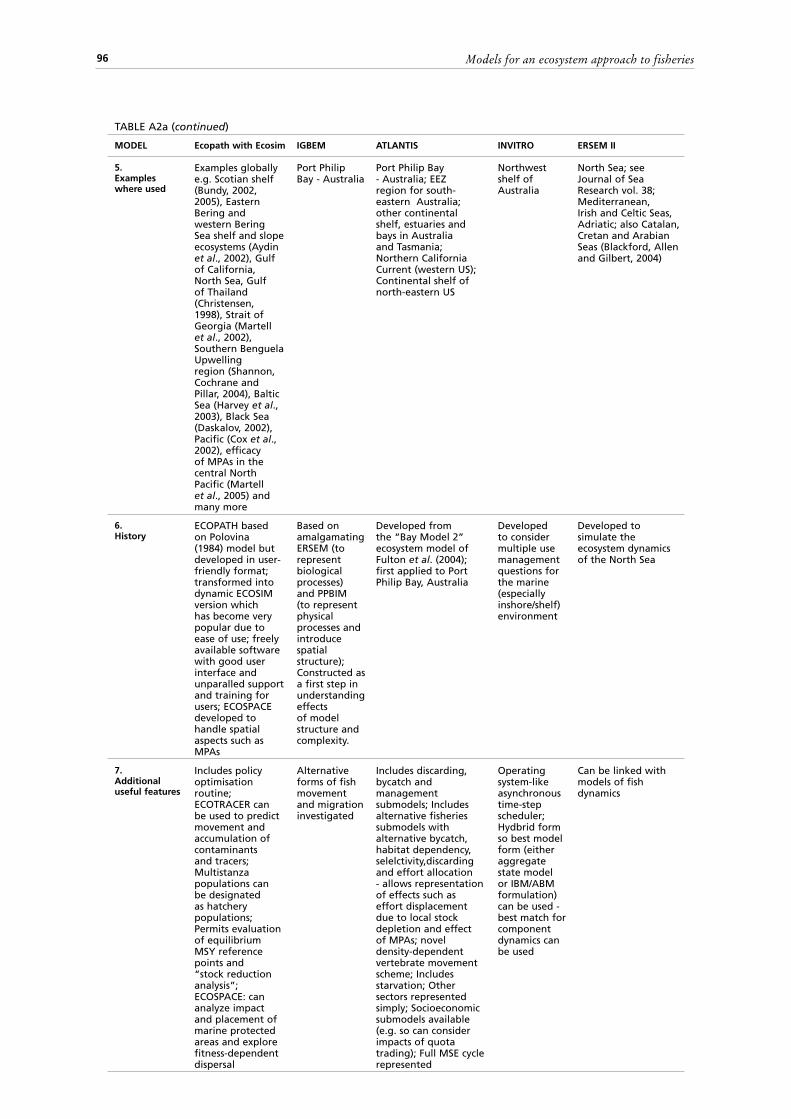
Models for an ecosystem approach to fisheries96
TABLE A2a (continued)
MODEL Ecopath with Ecosim IGBEM ATLANTIS INVITRO ERSEM II
5. Examples where used
Examples globally e.g. Scotian shelf (Bundy, 2002, 2005), Eastern Bering and western Bering Sea shelf and slope ecosystems (Aydin et al., 2002), Gulf of California, North Sea, Gulf of Thailand (Christensen, 1998), Strait of Georgia (Martell et al., 2002), Southern Benguela Upwelling region (Shannon, Cochrane and Pillar, 2004), Baltic Sea (Harvey et al., 2003), Black Sea (Daskalov, 2002), Pacific (Cox et al., 2002), efficacy of MPAs in the central North Pacific (Martell et al., 2005) and many more
Port Philip Bay - Australia
Port Philip Bay - Australia; EEZ region for south-eastern Australia; other continental shelf, estuaries and bays in Australia and Tasmania; Northern California Current (western US); Continental shelf of north-eastern US
Northwest shelf of Australia
North Sea; see Journal of Sea Research vol. 38; Mediterranean, Irish and Celtic Seas, Adriatic; also Catalan, Cretan and Arabian Seas (Blackford, Allen and Gilbert, 2004)
6. History
ECOPATH based on Polovina (1984) model but developed in user-friendly format; transformed into dynamic ECOSIM version which has become very popular due to ease of use; freely available software with good user interface and unparalled support and training for users; ECOSPACE developed to handle spatial aspects such as MPAs
Based on amalgamating ERSEM (to represent biological processes) and PPBIM (to represent physical processes and introduce spatial structure); Constructed as a first step in understanding effects of model structure and complexity.
Developed from the “Bay Model 2” ecosystem model of Fulton et al. (2004); first applied to Port Philip Bay, Australia
Developed to consider multiple use management questions for the marine (especially inshore/shelf) environment
Developed to simulate the ecosystem dynamics of the North Sea
7. Additional useful features
Includes policy optimisation routine; ECOTRACER can be used to predict movement and accumulation of contaminants and tracers; Multistanza populations can be designated as hatchery populations; Permits evaluation of equilibrium MSY reference points and “stock reduction analysis”; ECOSPACE: can analyze impact and placement of marine protected areas and explore fitness-dependent dispersal
Alternative forms of fish movement and migration investigated
Includes discarding, bycatch and management submodels; Includes alternative fisheries submodels with alternative bycatch, habitat dependency, selelctivity,discarding and effort allocation - allows representation of effects such as effort displacement due to local stock depletion and effect of MPAs; novel density-dependent vertebrate movement scheme; Includes starvation; Other sectors represented simply; Socioeconomic submodels available (e.g. so can consider impacts of quota trading); Full MSE cycle represented
Operating system-like asynchronous time-step scheduler; Hydbrid form so best model form (either aggregate state model or IBM/ABM formulation) can be used - best match for component dynamics can be used
Can be linked with models of fish dynamics

97Appendixes
TABLE A2b MODEL COMPARISON
Type of Model Biogeochemical ecosystem models
Whole ecosystem models
Dynamic multispecies models
Dynamic multispecies models
Dynamic system models
MODEL SSEM KPFM MRM e.g. Punt and Butterworth (1995)
MSVPA and MSFOR MSM
1. Broad description of parameters (not fully comprehensive as intended to give a flavour of the sorts of parameters)
Many parameters e.g. physiological parameters such as maximum growth rate, half-saturation constant, faecal ratio, excretion ratio, respiration ratio
Many parameters; Krill e.g. background mortality rate, 4 recruitment parameters including scalar that mediates environmental effects on krill, average weight, historical catches, instantaneous rate of movement parameter, fraction of abundance available for harvest and predation; Predators: natural mortality rate, age at recruitment to adult stage, 3 recruitment parameters, 3 consumption and functional response parameters
For hake and seal species: total daily ration, feeding function saturation parameter, parameter reflecting extent of annual variation in diet; Other predatory fish: maximum number of hake that could be eaten; feeding saturation and annual diet variation parameters; Background mortality rate. Other standard age-structured model parameters
Suitability parameters, predation mortality M2, spawner-recruit parameters, terminal fishing mortality rates, residual natural mortality rates
Initial 2-species application has 124 parameters related to initial age structure of populations, recruitment parameters, fishing mortality parameters and selectivity
2. Some important model assumptions
Many physiological and process-related
Predator recruitment (but not survival) depends on krill consumption; krill in transit between SSMUs do not suffer predation and fishing mortalities; predators and the fishery are competitors
Seals feed mainly in shallow waters, and hence consume mostly shallow-water hake M. capensis
Suitability of prey remains constant according to its biomass as a proportion of the total biomass of potential prey; constant M1 (residual mortality); catch-at-age measured without error
Fixed ration model, constant selectivity
3. Data requirements
Input data re temperature, currents, nutrient runoff from land
Data from a physical model re currents; basic biological data for predators; information re predator abundance; historic catch series; areas of SSMUs; estimates of krill density; estimates of predator demand; time series of environmental anomalies
Data re historic catches; trends in abundance e.g. cpue, surveys; length/age composition data; estimates of diet composition and daily ration for each species
Stomach content data to inform re predator rations and feeding preferences; catch-at-age in numbers, abundance indices and mean body weights as for single-species models
Catch-at-age data (landings and discards), maturity-at-age, weight-at-age, predator ration, predator diet information, prey weight-at-age in the predator stomach contents, predator annual ration, residual natural mortality
4. Platform
Can be run on UNIX or Windows PC
S-PLUS, also being recoded in R
Fortran model; needs to be recoded, possibly in ADMB
Runs on Windows PC; typically recoded by user
Solver routine in Microsoft Excel; SIR algorithm (McAllister et al., 1994; McAllister and Ianelli, 1997) implemented in Visual Basic

Models for an ecosystem approach to fisheries98
TABLE A2b (continued)
MODEL SSEM KPFM MRM e.g. Punt and Butterworth (1995)
MSVPA and MSFOR
MSM
5. Examples where used
Pesticide inflow and salinity change in drainage canal (Sekine, Nakanishi and Ukita, 1996), Experimental river system (Sekine, Imai and Ukita, 1997)
Antarctic Peninsula region
Southern Benguela Upwelling region
North Sea, Baltic Sea (Sparre 1991), Georges Bank (Tsou and Collie, 2001), Eastern Bering Sea (Livingston and Jurado-Molina, 2000; Jurado-Molina and Livingston, 2002)
Eastern Bering Sea, central Chile
6. History
Developed to predict impact of coastal development activities on fisheries
Developed to assist CCAMLR in evaluating options for subdividing the krill catch among SSMU’s (Small-Scale Management Units) in Antarctic Peninsula region
Developed in response to debates whether increasing fur seal numbers were negatively impacting the commercially important hake fishery in the southern Benguela region
Developed by ICES Multi-species working group; main use was in revising predation mortality estimates input to single-species management models
Motivated by desire to incorporate predation equations from MSVPA in a statistical framework that allows the fitting of parameters by considering how errors enter into the models
7. Additional useful features
Can be used to investigate effect of pesticides
Includes a range of performance measures that can be used to evaluate catch-allocation procedures and assess tradeoffs between predator and fishery performance
Takes explicit account of uncertainty and management issues through the use of a simulation framework incorporating feedback control rules actually in place for setting TACs for the fishery
Includes a prediction model MSFOR
Incorporates standard tools such as Bayesian methods and decision analysis into a multi-species context

99Appendixes
TAB
LE A
2c M
OD
EL C
OM
PAR
ISO
N
Typ
e o
f m
od
elD
ynam
ic m
ult
isp
ecie
s m
od
els
Dyn
amic
mu
ltis
pec
ies
mo
del
sD
ynam
ic m
ult
isp
ecie
s m
od
els
Dyn
amic
sys
tem
mo
del
sD
ynam
ic s
yste
m m
od
els
MO
DEL
MU
LTSP
ECG
AD
GET
Bio
ener
get
ic/a
llom
etri
c m
od
els
e.g
. Ko
en-A
lon
so a
nd
Yo
dzi
s,
2005
OSM
OSE
SEA
POD
YM
1.
Bro
ad d
escr
ipti
on
o
f p
aram
eter
s (n
ot
fully
co
mp
reh
ensi
ve
as in
ten
ded
to
g
ive
a fl
avo
ur
of
the
sort
s o
f p
aram
eter
s)
2 m
atu
rati
on
par
amet
ers
(cap
elin
),
2 p
red
atio
n p
aram
eter
s (c
od
) (m
axim
um
co
nsu
mp
tio
n a
nd
pre
y ab
un
dan
ce w
her
e co
nsu
mp
tio
n is
h
alf
of
max
. co
nsu
mp
tio
n)
and
3
mig
rati
on
par
amet
ers
(cap
elin
)
Var
ies
dep
end
ing
on
mo
del
bu
t e.
g.
gro
wth
par
amet
ers,
mat
ura
tio
n,
flee
t se
lect
ion
, rec
ruit
men
t, in
itia
l p
op
ula
tio
n a
nd
co
nsu
mp
tio
n
For
each
sp
ecie
s: in
trin
sic
P/B
rat
io; c
arry
ing
cap
acit
y;
com
pet
itio
n c
oef
fici
ent;
fr
acti
on
of
max
imu
m
ph
ysio
log
ical
cap
acit
y fo
r p
rod
uct
ion
rea
lized
by
spec
ies;
al
lom
etri
c co
effi
cien
ts; m
ean
in
div
idu
al b
iom
ass;
“o
ther
m
ort
alit
y” r
ate;
den
sity
-d
epen
den
t m
ort
alit
y te
rm
Gro
wth
: 3 v
on
Ber
tala
nff
y g
row
th p
aram
eter
s +
1 c
on
dit
ion
fa
cto
r p
er s
pec
ies;
rep
rod
uct
ion
: an
nu
al r
elat
ive
fecu
nd
ity
per
sp
ecie
s an
d a
ge
at m
atu
rity
; su
rviv
al: m
axim
al a
ge,
ag
e at
re
cru
itm
ent
and
ad
dit
ion
al
ann
ual
nat
ura
l mo
rtal
ity;
NB
p
aram
eter
inp
ut
is p
red
ato
r/p
rey
size
rat
io d
eter
min
ing
min
imal
th
resh
old
fo
r p
red
atio
n t
o o
ccu
r;
also
par
amet
er d
escr
ibin
g f
oo
d
bio
mas
s to
fu
lfil
vita
l fu
nct
ion
s
von
Ber
tala
nff
y g
row
th
par
amet
ers;
len
gth
-wei
gh
t p
aram
eter
s; a
ge
at f
irst
m
atu
rity
; SST
lim
it f
or
pre
pro
du
ctio
n, l
eng
th o
f p
assi
ve t
ran
spo
rt p
has
e fo
r ju
ven
iles;
nat
ura
l mo
rtal
ity;
in
itia
l sto
ck b
iom
ass
(eq
uili
bri
um
); s
ever
al
fora
gin
g, h
abit
at a
nd
te
mp
erat
ure
par
amet
ers;
d
iffu
sio
n a
nd
ad
vect
ion
co
effi
cien
ts
2.
Som
e im
po
rtan
t m
od
el
assu
mp
tio
ns
Feed
ing
an
d g
row
th r
ate
of
pre
dat
ors
(m
inke
an
d h
arp
sea
l)
assu
med
to
be
con
stan
t; C
urv
ilin
ear
rela
tio
nsh
ip b
etw
een
fo
od
ab
un
dan
ce a
nd
fis
h c
on
sum
pti
on
; M
amm
al p
red
atio
n a
ffec
ts f
ish
bu
t n
o f
eed
bac
k fr
om
fis
h a
bu
nd
ance
to
mar
ine
mam
mal
s; S
tro
ng
her
rin
g
recr
uit
men
t si
mu
late
d t
wo
yea
rs in
ro
w e
very
8 y
ears
Ran
ge
of
mo
del
ass
um
pti
on
s d
epen
ds
on
mo
du
les
use
d a
s e.
g.
a n
um
ber
of
dif
fere
nt
gro
wth
an
d
con
sum
pti
on
fo
rmu
lati
on
s fr
om
w
hic
h t
o c
ho
ose
An
cho
vy a
nd
sq
uid
pre
y n
ot
mo
del
led
hen
ce a
ssig
ned
ca
rryi
ng
cap
acit
ies
and
co
mp
etit
ion
co
effi
cien
ts (
to
exp
ress
die
tary
ove
rlap
);
den
sity
-dep
end
ent
mo
rtal
ity
of
sea
lion
s as
sum
ed d
ue
to c
row
din
g-r
elat
ed e
ffec
ts
du
rin
g b
reed
ing
sea
son
; pre
y-in
dep
end
ent
dig
esti
ve p
ause
(s
ee J
esch
ke, K
op
p a
nd
To
llria
n,
2002
)
Fish
pre
dat
ion
dep
end
s o
n
size
su
itab
ility
an
d s
pat
ial c
o-
occ
urr
ence
bet
wee
n a
pre
dat
or
and
its
pre
y; c
arry
ing
cap
acit
y co
nst
rain
t; s
tarv
atio
n m
ort
alit
y im
pac
ts f
ish
wh
en n
utr
itio
nal
re
sou
rces
lim
ited
Mo
vem
ent
dep
end
s o
n
tem
per
atu
re a
nd
pre
y av
aila
bili
ty; r
ecru
itm
ent
is in
dep
end
ent
of
adu
lt
bio
mas
s
3.
Dat
a
req
uir
emen
ts
Larg
e d
atab
ase
wit
h s
tom
ach
co
nte
nt
dat
a -
pri
mar
ily c
od
st
om
ach
s b
ut
also
e.g
. her
rin
g
and
had
do
ck; h
isto
rica
l dat
a o
n
cap
elin
cat
ch in
nu
mb
ers
by
len
gth
g
rou
p, m
on
th a
nd
are
a; V
PA-b
ased
es
tim
ates
of
no
. of
cod
; su
rvey
d
ata
use
d r
e ar
ea d
istr
ibu
tio
n f
or
imm
atu
re c
od
an
d o
ther
sp
ecie
s;
esti
mat
es o
f p
op
ln s
izes
of
oth
er
spec
ies;
dat
a re
sea
tem
per
atu
re;
clim
ato
log
ical
dat
a u
sed
Cat
ch d
ata;
Len
gth
dis
trib
uti
on
s,
age
len
gth
key
s, m
ean
len
gth
/w
eig
ht
at a
ge;
su
rvey
ind
ices
by
len
gth
or
age,
cat
ch C
PUE,
sto
mac
h
con
ten
t d
ata,
dat
a o
n p
rop
ort
ion
m
atu
re a
t ag
e/le
ng
th. N
o c
atch
-at
-ag
e d
ata
nec
essa
ry; D
ata
seri
es
do
no
t n
eed
to
be
con
tin
uo
us.
Sp
atia
lly r
eso
lved
an
d f
leet
-sp
ecif
ic
dat
a re
qu
ired
dep
end
ing
on
mo
del
; N
o li
mit
on
no
. of
dat
a fi
les
Cat
ch d
ata
and
bio
mas
s tr
end
in
form
atio
n f
or
each
sp
ecie
sD
ata
on
mea
n s
pat
ial
dis
trib
uti
on
of
each
sp
ecie
sD
etai
led
dat
a re
SST
, cu
rren
ts, p
rey
avai
lab
ility
; p
refe
rab
ly t
agg
ing
dat
a
4.
Tech
nic
al
det
ails
HP9
35 W
ork
stat
ion
UN
IX c
om
pu
tin
g p
latf
orm
tes
ted
fo
r So
lari
s, L
inu
x, M
ac O
SX a
nd
C
ygw
in; a
lso
cap
able
of
run
nin
g o
n
mu
ltip
le c
om
pu
ters
in p
aral
lel u
sin
g
PVM
(Pa
ralle
l Vir
tual
Mac
hin
e)
Fort
ran
77
run
on
PC
Dev
elo
ped
in J
ava
(Jd
K 1
.1.3
, Su
nM
icro
syst
ems)
Sou
rce
cod
e in
C+
+ o
bje
ct
ori
ente
d la
ng
uag
e w
ith
ex
ecu
tab
les
avai
lab
le
for
Win
do
ws
and
Lin
ux
pla
tfo
rms.
Als
o p
aral
lel
soft
war
e in
Jav
a
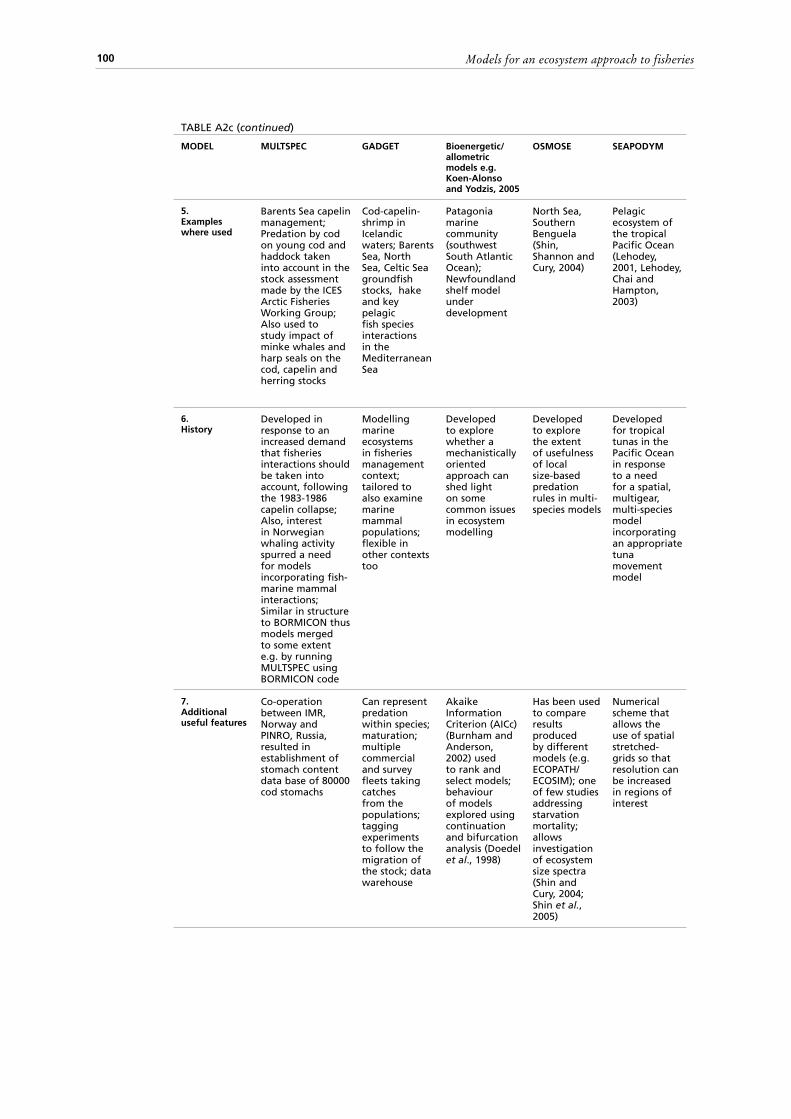
Models for an ecosystem approach to fisheries100
TABLE A2c (continued)
MODEL MULTSPEC GADGET Bioenergetic/allometric models e.g. Koen-Alonso and Yodzis, 2005
OSMOSE SEAPODYM
5. Examples where used
Barents Sea capelin management; Predation by cod on young cod and haddock taken into account in the stock assessment made by the ICES Arctic Fisheries Working Group; Also used to study impact of minke whales and harp seals on the cod, capelin and herring stocks
Cod-capelin-shrimp in Icelandic waters; Barents Sea, North Sea, Celtic Sea groundfish stocks, hake and key pelagic fish species interactions in the Mediterranean Sea
Patagonia marine community (southwest South Atlantic Ocean); Newfoundland shelf model under development
North Sea, Southern Benguela (Shin, Shannon and Cury, 2004)
Pelagic ecosystem of the tropical Pacific Ocean (Lehodey, 2001, Lehodey, Chai and Hampton, 2003)
6. History
Developed in response to an increased demand that fisheries interactions should be taken into account, following the 1983-1986 capelin collapse; Also, interest in Norwegian whaling activity spurred a need for models incorporating fish-marine mammal interactions; Similar in structure to BORMICON thus models merged to some extent e.g. by running MULTSPEC using BORMICON code
Modelling marine ecosystems in fisheries management context; tailored to also examine marine mammal populations; flexible in other contexts too
Developed to explore whether a mechanistically oriented approach can shed light on some common issues in ecosystem modelling
Developed to explore the extent of usefulness of local size-based predation rules in multi-species models
Developed for tropical tunas in the Pacific Ocean in response to a need for a spatial, multigear, multi-species model incorporating an appropriate tuna movement model
7. Additional useful features
Co-operation between IMR, Norway and PINRO, Russia, resulted in establishment of stomach content data base of 80000 cod stomachs
Can represent predation within species; maturation; multiple commercial and survey fleets taking catches from the populations; tagging experiments to follow the migration of the stock; data warehouse
Akaike Information Criterion (AICc) (Burnham and Anderson, 2002) used to rank and select models; behaviour of models explored using continuation and bifurcation analysis (Doedel et al., 1998)
Has been used to compare results produced by different models (e.g. ECOPATH/ECOSIM); one of few studies addressing starvation mortality; allows investigation of ecosystem size spectra (Shin and Cury, 2004; Shin et al., 2005)
Numerical scheme that allows the use of spatial stretched-grids so that resolution can be increased in regions of interest

101Appendixes
TABLE A2d MODEL COMPARISON
Type of Model Dynamic multispecies models
Whole ecosystem models
Whole ecosystem models
Dynamic multispecies models
Dynamic multispecies models
MODEL CCAMLR models e.g. Mori and Butterworth, 2005, 2006
EPOC SMOM ESAM SEASTAR extension
1. Broad description of parameters (not fully comprehensive as intended to give a flavour of the sorts of parameters)
Krill: intrinsic growth rate; 2 consumption parameters; Each predator: maximum birth rate; natural mortality; density-dependent mortality or birth rate parameter
Krill example: Natural mortality rate from krill yield assessment; 3 von Bertalanffy growth parameters; 2 weight-length parameters; 4 Beverton-Holt spawning stock recruit relationship parameters; Predator - abundance and feeding function parameters
Krill: intrinsic growth rate; 2 consumption parameters; Each predator: maximum birth rate; natural mortality; density-dependent mortality or birth rate parameter
Hollowed, Ianelli and Livingston, (2000): consumption rate, satiation point and satiation response parameters; other typical single-species age-structured model parameters e.g. catchability coefficient, several recruitment parameters, residual mortality, mean body weight, proportion mature at age, selectivity parameters
Tjelmeland and Lindstrøm (2005) example: Predation and natural mortality rates; prey species-specific suitability parameters, prey-specific switching coefficient, terminal F‘s, tagging survival
2. Some important model assumptions
Density-dependent mortality parameters are mathematically necessary; presumably reflect the impact of limitations of breeding sites for seals, and intra-species competition effects for whales
Model still being developed
Predators do not move between SSMUs; Predator breeding success depends on krill consumption
Hollowed, Ianelli and Livingston (2000): summer dietary information assumed representative for entire yr i.e. no seasonal changes; abundance of alternative prey assumed a constant proportion of predator’s food requirements; Spatial distribution of predator and prey constant over time
Tjelmeland and Lindstrøm example: assumes weak feedback from fish to marine mammal abundance; prey switching of minke whales; no. of whales in study area described by bell-shaped function over time
3. Data requirements
Historic catch data.; abundance trend data
Krill: maturity ogive; weight at age; matrix of probabilities of moving from origin to destination polygons
Basic biological data for predators; information re predator abundance; historic catch series: Areas of SSMUs: Estimates of krill density; Estimates of predator demand
Hollowed, Ianelli and Livingston (2000): multi-species data - time-series of predator abundance, annual predator consumption rates and age composiiton of prey consumed; other usual: total catch biomass, bottom trawl survey estimates of biomass, egg production, fisheries catch-at-age, survey size and age compositions
Tjelmeland and Lindstrøm example: time series of minke whales and alternative prey, tag-return data; other typical single-species data; abundance estimates; biomass of cod input
4. Technical details
AD Model Builder run on PC
R statistical language (R Development Core Team, 2005)
AD Model Builder run on PC
AD Model Builder or other run on PC
Developed in user’s preferred code e.g. SeaStar extension in Mathematica
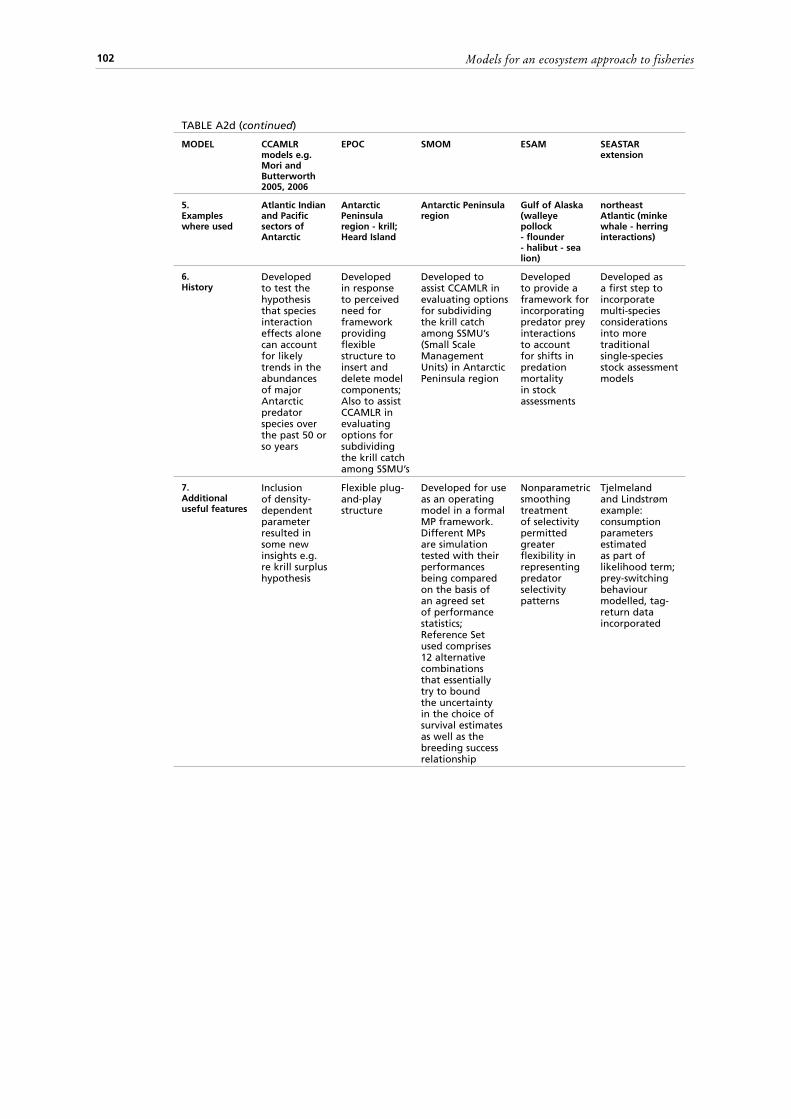
Models for an ecosystem approach to fisheries102
TABLE A2d (continued)
MODEL CCAMLR models e.g. Mori and Butterworth 2005, 2006
EPOC SMOM ESAM SEASTAR extension
5. Examples where used
Atlantic Indian and Pacific sectors of Antarctic
Antarctic Peninsula region - krill; Heard Island
Antarctic Peninsula region
Gulf of Alaska (walleye pollock - flounder - halibut - sea lion)
northeast Atlantic (minke whale - herring interactions)
6. History
Developed to test the hypothesis that species interaction effects alone can account for likely trends in the abundances of major Antarctic predator species over the past 50 or so years
Developed in response to perceived need for framework providing flexible structure to insert and delete model components; Also to assist CCAMLR in evaluating options for subdividing the krill catch among SSMU’s
Developed to assist CCAMLR in evaluating options for subdividing the krill catch among SSMU’s (Small Scale Management Units) in Antarctic Peninsula region
Developed to provide a framework for incorporating predator prey interactions to account for shifts in predation mortality in stock assessments
Developed as a first step to incorporate multi-species considerations into more traditional single-species stock assessment models
7. Additional useful features
Inclusion of density-dependent parameter resulted in some new insights e.g. re krill surplus hypothesis
Flexible plug-and-play structure
Developed for use as an operating model in a formal MP framework. Different MPs are simulation tested with their performances being compared on the basis of an agreed set of performance statistics; Reference Set used comprises 12 alternative combinations that essentially try to bound the uncertainty in the choice of survival estimates as well as the breeding success relationship
Nonparametric smoothing treatment of selectivity permitted greater flexibility in representing predator selectivity patterns
Tjelmeland and Lindstrøm example: consumption parameters estimated as part of likelihood term; prey-switching behaviour modelled, tag-return data incorporated

103Appendixes
TABLE A3 Summary of some advantages, disadvantages and limitations of each method, as well as notes on the ease of presentation of model outputs and the user-level of programming and mathematical skills required
TABLE A3a
MODEL Ecopath with Ecosim
IGBEM ATLANTIS INVITRO ERSEM II
Main advantages
Ease of use, large no. of users, structured parameterisation framework, well-balanced level of conceptual realism, novel representation of predator-prey interaction terms
Detailed representation of processes within well-studied temperate bay, from representation of sediment chemistry to average biomass of fish
Spatially explicit biomass dynamics in response to different fisheries management scenarios; Applications as an Operating Model; simpler but adequate representation of processes than most other biogeochemical models; includes mixotrophy which is considered important
Agent-based so uses a targeted representation across multiple scales and sectors.
Can be used to explore hydrographic and planktonic conditions impacting juvenile fish; includes detailed representations of the benthic system which is important e.g. in shelf seas; decouples carbon and nutrient dynamics; can be coupled to different physical models
Main disadvantages
Ease of use can lead to poorly constructed models that may mislead rather than advance understanding
Very detailed representation of physiological processes; Very data intensive
Data intensive and no easy user interface
No easy user interface
Data intensive; Very detailed representation of physiological processes
Limitations No explicit spatial structure in ECOSIM; equilibrium structure; foraging arena formulation not always appropriate; no allowance for detailed energetic considerations (Aydin and Friday, 2001; Aydin, 2004) and alternative prey types treated as energetically equivalent; problems re modelling marine mammal populations (Plaganyi and Butterworth, 2004, 2005a&b)
Birds, marine mammals and sharks not represented as dynamic pools but rather simply as mortality terms on fish; Invertebrate fisheries not represented; No bycatch component
Base biological rate parameters are fixed in any one run
Cannot be easily applied to whole-of-ecosystem (in the sense of ATLANTIS or EwE, though agent types do span all trophic levels); must target its use carefully
Not designed for detailed representation of higher trophic levels such as fish and top predators
Ease of presentation of model outputs
Excellent Visualisation software (Olive) available
Visualisation software (Olive) and Excel and R analysis support sheets available
Visualisation software and R analysis scripts available
Some presentation software developed
User-level of programming and mathematical skills required
Entry point requires no programming or mathematical skills; more advanced users can benefit from these skills
Fair level required
Fair level required
Fair level required
Some programming skills required although explorations with currently existing models should be relatively straightforward

Models for an ecosystem approach to fisheries104
TABLE A3b MODEL COMPARISON
MODEL SSEM KPFM MRM e.g. Punt and Butterworth (1995)
MSVPA and MSFOR
MSM
Main advantages
Useful for exploring effects of nutrient and pesticide runoffs in coastal systems
Has attempted to synthesize state-of-the-art knowledge re the system into a relatively simple model
Rigorous model that fits to data; focuses on groups of interest only with these accounting for 90% of hake mortality in system
Large concerted effort concentrated on approach (e.g. Daan and Sissenwine, 1991) with attendant large sampling effort and studies to test underlying assumptions plus subsequent efforts to improve and modify approach
Provides measures of parameter uncertainty
Main disadvantages
Data intensive; not as well tested as other models
Includes several parameters that are difficult to quantify, hence considerable uncertainty re these
Difficult to implement
Data hungry, Lack of statistical structure to take account of uncertainty in parameter estimates
Difficult for most to implement
Limitations Not suitable for investigations re fisheries other than coastal impacts
Initialized from uncertain data; does not include growth models and delay-difference dynamics do not capture full age-structured complexity; No fleet dynamics; no framework for fitting to data or formal statistical testing
No feedback between changes in hake abundance affecting seal dynamics; desirability parameters assumed independent of density; No explicit inclusion of environmental effects although noise terms included
Age-based rather than length-based as required for some regions; predation modelled as one-way interaction with predators impacting prey but no effect on predators of changing prey population; Sensitivity to recruitment assumptions
Considers only small subset of ecosystem
Ease of presentation of model outputs
Unknown Useful parameter visualisation and tuning + summary performance measures in EXCEL; Not fully automated outputs
Not automated Average Unknown
User - level of programming and mathematical skills required
Unknown Not currently generally available although ultimately version in R will be accessible to users with moderate programming skills
Very high - specific examples need to be coded and minimisation process is complex
Fairly high; some user-friendly packages e.g. 4M for the Baltic (Vinther et al., 1998)
High

105Appendixes
TABLE A3c MODEL COMPARISON
MODEL MULTSPEC GADGET Bioenergetic/allometric models e.g. Koen-Alonso and Yodzis, 2005
OSMOSE SEAPODYM
Main advantages
Time-varying spatial overlaps between predators and prey handled; Detailed stomach content data and consumption formulations incorporated; Includes cannibalism
Flexibility re model as different modules can be substituted; permits efficient optimisation/fitting to data; Sensitivity analysis routine identifies parameters with minor impacts only which can thus be fixed in future runs; Possible to estimate separate parameters for each year e.g. if growth or selectivity differences between years
Explores sensitivity to alternative functional response formulations; detailed explorations re parameter uncertainty; does not require accurate data re diet composition
Recognises that size suitability is fundamental to fish predation as well as spatial co-occurrence between a predator and its prey
Attempts to incorporate environmental data directly into a spatial population-dynamics simulation model; novel movement model; level of implication closely linked to the level of information available on each aspect
Main disadvantages
Detailed stomach content data required plus spatially-resolved information
Current lack of examples demonstrating its use
Requires estimation of a large no. of parameters
Includes a relative fecundity parameter that is difficult to estimate
Insufficient resolution of mid-trophic levels to explore trophic interactions at all levels
Limitations Model simulates effects of marine mammal predation on fish but no feedback in opposite direction; Prey selection depends on prey species but doesn’t account for prey or predator size; Growth depends on feeding level and temperature only, no energetic considerations; Model tailored fairly specifically for Barents Sea region
Difficult (but not impossible) to apply to the whole ecosystem; Lower trophic levels not well represented
No physical/environmental forcing considered; age-structure not considered
Only fish dynamics explicitly modelled thus e.g. top predators included only as additional mortality term
Tailored very specifically for tuna; absence of a formal fitting procedure for the estimation of parameters
Ease of presentation of model outputs
Unknown Good e.g. automatic sensitivity analysis plots and postscript output files; print files for comparing output
Not automated Unknown SeapodymView software includes tools for manipulating and visualising data and outputs
User - level of programming and mathematical skills required
Fair Intermediate; some initial training to understand basics of UNIX/Linux; require understanding of e.g. optimisation process but no need to recode oneself; paramin program allows use of multiple computers to speed up runtime but is for the more advanced user
High - ability to code plus experience re nonlinear minimisation
The simulation framework can be defined using a graphical interface
Low level required to run executables but considerably more to alter programs as would be needed to adapt for other regions / species

Models for an ecosystem approach to fisheries106
TABLE A3d MODEL COMPARISON
MODEL CCAMLR models e.g. Mori & Butterworth 2005, 2006
EPOC SMOM ESAM SEASTAR
Main advantages
Simple but pragmatic, biologically realistic equations; fits to data
Flexible addition/substraction of modules
Relatively simple model designed to produce probability distribution rather than a single output; Management Procedure framework
Includes ability to statistically evaluate the fit of the model to the data; results directly applicable to stock assessment e.g. natural mortality shown to vary inter-annually
Focuses on target species of interest, builds models in a stepwise fashion starting from simplest possible, fairly statistically rigorous
Main disadvantages
Age-aggregated and tailored fairly specifically for krill-centric ecosystem
Still under development and hence not tested
Considers only limited subset of the ecosystem
Considers only limited subset of ecosystem
Considers only very limited subset of ecosystem
Limitations No physical/environmental forcing considered; can’t explicitly represent observed changes in age at sexual maturity due to lack of age structure
No framework for fitting to data or formal statistical testing
Initialized from uncertain data; does not include detailed krill growth model ; no seasonality or fleet dynamics
Typically no physical/environmental forcing but could be included; lower trophic levels not considered; no feedback effect of prey consumption affecting predator populations
Typically no physical/environmental forcing but could be included; lower trophic levels not considered; often no feedback effect of prey consumption affecting predator
Ease of presentation of model outputs
Not automated Good Not fully automated outputs
Not automated Not automated
User - level of programming and mathematical skills required
High - ability to code plus experience in nonlinear minimisation
Moderate - knowledge of R required
High - ability to code plus some experience re nonlinear minimisation
High - ability to code plus experience in nonlinear minimisation
High - ability to code plus experience in nonlinear minimisation

107Appendixes
TAB
LE A
4Pr
elim
inar
y co
mp
aris
on
of
sele
cted
dif
fere
nt
mo
del
ling
ap
pro
ach
es t
o a
dd
ress
a r
ang
e o
f EB
FM r
esea
rch
qu
esti
on
s o
utl
ined
in t
he
text
. Th
e sh
ared
reg
ion
s o
f th
e ta
ble
h
igh
ligh
t th
ose
ap
pro
ach
es c
urr
entl
y m
ost
ap
pro
pri
ate
or
sho
win
g p
ote
nti
al t
o a
dd
ress
th
e ai
ms
as in
dic
ated
, as
asse
ssed
by
the
auth
or
Typ
e o
f m
od
elW
ho
le
eco
syst
em
mo
del
s
Bio
geo
chem
ical
ec
osy
stem
m
od
els
Bio
geo
chem
ical
ec
osy
stem
m
od
els
Wh
ole
ec
osy
stem
m
od
els
Bio
geo
chem
ical
ec
osy
stem
m
od
els
Bio
geo
chem
ical
ec
osy
stem
m
od
els
Wh
ole
ec
osy
stem
m
od
els
Dyn
amic
m
ult
isp
ecie
s m
od
els
Dyn
amic
m
ult
isp
ecie
s m
od
els
Dyn
amic
sys
tem
m
od
els
12
34
56
78
910
RES
EAR
CH
QU
ESTI
ON
/ M
OD
ELEc
op
ath
wit
h
Eco
sim
an
d
ECO
SPA
CE
IGB
EMA
TLA
NTI
SIN
VIT
RO
ERSE
M II
SSEM
KPF
M*
MR
M e
.g.
Pun
t an
d
Bu
tter
wo
rth
(1
995)
MSV
PA a
nd
M
SFO
RM
SM
1a.
Un
der
stan
din
g -
su
bse
t o
f ec
osy
stem
1b.
Un
der
stan
din
g -
co
mp
lete
ec
osy
stem
2.
Imp
act
of
targ
et s
pec
ies
3.
Effe
ct o
f to
p p
red
ato
rs
4.
Co
mp
etit
ion
: mar
ine
mam
mal
s -
fish
erie
s
5.
Reb
uild
ing
dep
lete
d f
ish
sto
cks
6.
Bia
ses
in s
ing
le-s
pec
ies
asse
ssm
ent
7.
Way
s to
dis
trib
ute
fis
hin
g e
ffo
rt
amo
ng
fis
her
ies
8.
Un
der
-exp
loit
ed s
pec
ies
9.
Ch
ang
e in
eco
syst
em s
tate
10.
Spat
ial c
on
cen
trat
ion
of
fish
ing
11.
Envi
ron
men
tal/
ph
ysic
al e
ffec
ts
12.
Effe
cts
of
hab
itat
mo
dif
icat
ion
13.
Effe
cts
of
by-
catc
h
14.
Intr
od
uct
ion
of
no
n-n
ativ
e sp
ecie
s
* St
ill b
ein
g d
evel
op
ed
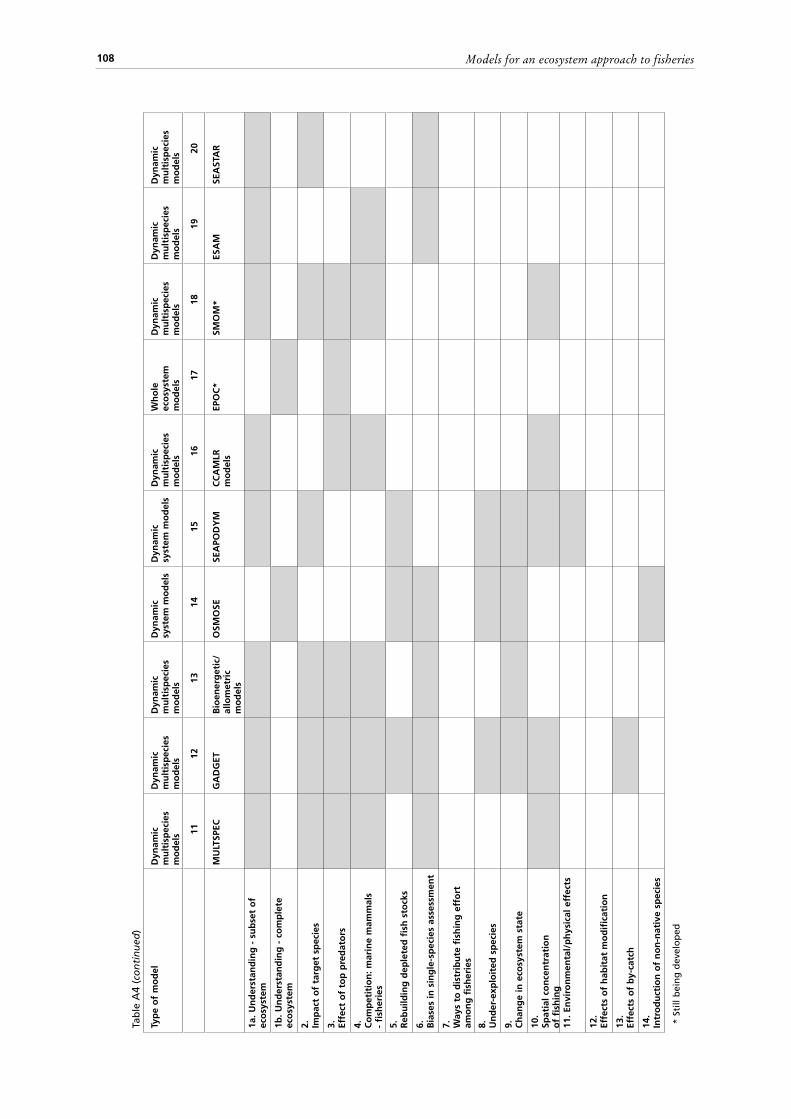
Models for an ecosystem approach to fisheries108
Tab
le A
4 (c
on
tin
ued
)
Typ
e o
f m
od
elD
ynam
ic
mu
ltis
pec
ies
mo
del
s
Dyn
amic
m
ult
isp
ecie
s m
od
els
Dyn
amic
m
ult
isp
ecie
s m
od
els
Dyn
amic
sy
stem
mo
del
sD
ynam
ic
syst
em m
od
els
Dyn
amic
m
ult
isp
ecie
s m
od
els
Wh
ole
ec
osy
stem
m
od
els
Dyn
amic
m
ult
isp
ecie
s m
od
els
Dyn
amic
m
ult
isp
ecie
s m
od
els
Dyn
amic
m
ult
isp
ecie
s m
od
els
1112
1314
1516
1718
1920
MU
LTSP
ECG
AD
GET
Bio
ener
get
ic/
allo
met
ric
mo
del
s
OSM
OSE
SEA
POD
YM
CC
AM
LR
mo
del
sEP
OC
*SM
OM
*ES
AM
SEA
STA
R
1a. U
nd
erst
and
ing
- s
ub
set
of
eco
syst
em
1b. U
nd
erst
and
ing
- c
om
ple
te
eco
syst
em
2.
Imp
act
of
targ
et s
pec
ies
3.
Effe
ct o
f to
p p
red
ato
rs
4.
Co
mp
etit
ion
: mar
ine
mam
mal
s -
fish
erie
s
5.
Reb
uild
ing
dep
lete
d f
ish
sto
cks
6.
Bia
ses
in s
ing
le-s
pec
ies
asse
ssm
ent
7.
Way
s to
dis
trib
ute
fis
hin
g e
ffo
rt
amo
ng
fis
her
ies
8.
Un
der
-exp
loit
ed s
pec
ies
9.
Ch
ang
e in
eco
syst
em s
tate
10.
Spat
ial c
on
cen
trat
ion
o
f fi
shin
g11
. En
viro
nm
enta
l/p
hys
ical
eff
ects
12.
Effe
cts
of
hab
itat
mo
dif
icat
ion
13.
Effe
cts
of
by-
catc
h
14.
Intr
od
uct
ion
of
no
n-n
ativ
e sp
ecie
s
* St
ill b
ein
g d
evel
op
ed


477FA
OM
od
els for an
ecosystem
app
roach
to fi
sheries
477
ISSN 0429-9345
FAO
FISHERIES TECHNICAL
PAPER
This report reviews the methods available for assessing the impacts of interactions between species and fisheries and their implications for marine fisheries management.
A brief description of the various modelling approaches currently in existence is provided, highlighting in particular features of these models that have general relevance to the field
of ecosystem approach to fisheries (EAF). The report concentrates on the currently available models representative of general types such as bionergetic models, predator-prey models and minimally realistic models. Short descriptions are given of model parameters,
assumptions and data requirements. Some of the advantages, disadvantages and limitations of each of the approaches in addressing questions pertaining to EAF are
discussed. The report concludes with some recommendations for moving forward in the development of multispecies and ecosystem models and for the prudent use of the
currently available models as tools for provision of scientific information on fisheries in an ecosystem context.
Models for an ecosystemapproach to fisheriesModels for an ecosystemapproach to fisheries