ecosystem models for fisheries management: nding the...
TRANSCRIPT

Ecosystem models for fisheries management: finding thesweet spot
Jeremy S Collie1, Louis W Botsford2, Alan Hastings3, Isaac C Kaplan4, John L Largier5, Patricia A Livingston6,�Eva Plag�anyi7, Kenneth A Rose8, Brian K Wells9 & Francisco E Werner10
1Graduate School of Oceanography, University of Rhode Island, Narragansett, RI, 02882, USA; 2Wildlife, Fish and
Conservation Biology, University of California Davis, Davis, CA, 95616, USA; 3Environmental Science and Policy,
University of California, Davis, CA, 95616, USA; 4Conservation Biology Division, Northwest Fisheries Science Center,
National Marine Fisheries Service, National Oceanic and Atmospheric Administration, 2725 Montlake Blvd E., Seattle,
WA, 98112, USA; 5Bodega Marine Laboratory, University of California Davis, Bodega Bay, CA, 94923, USA; 6NOAA
Fisheries, Alaska Fisheries Science Center, 7600 Sand Point Way NE, Seattle, WA, 98115, USA; 7CSIRO Wealth from
Oceans Flagship, PO Box 2583, Brisbane, Qld, 4001, Australia; 8Department of Oceanography and Coastal Sciences,
Louisiana State University, Baton Rouge, LA, 70803, USA; 9Fisheries Ecology Division, Southwest Fisheries Science
Center, National Marine Fisheries Service, 110 Shaffer Road, Santa Cruz, CA, 95060, USA; 10Southwest Fisheries
Science Center, National Marine Fisheries Service, 8901 La Jolla Shores Drive, La Jolla, CA, 92037, USA
AbstractThe advent of an ecosystem-based approach dramatically expanded the scope of fish-
eries management, creating a critical need for new kinds of data and quantitative
approaches that could be integrated into the management system. Ecosystem models
are needed to codify the relationships among drivers, pressures and resulting states,
and to quantify the trade-offs between conflicting objectives. Incorporating ecosystem
considerations requires moving from the single-species models used in stock assess-
ments, to more complex models that include species interactions, environmental
drivers and human consequences. With this increasing model complexity, model fit
can improve, but parameter uncertainty increases. At intermediate levels of complex-
ity, there is a ‘sweet spot’ at which the uncertainty in policy indicators is at a
minimum. Finding the sweet spot in models requires compromises: for example, to
include additional component species, the models of each species have in some cases
been simplified from age-structured to logistic or bioenergetic models. In this paper,
we illuminate the characteristics, capabilities and short-comings of the various mod-
elling approaches being proposed for ecosystem-based fisheries management. We
identify key ecosystem needs in fisheries management and indicate which types of
models can meet these needs. Ecosystem models have been playing strategic roles by
providing an ecosystem context for single-species management decisions. However,
conventional stock assessments are being increasingly challenged by changing natu-
ral mortality rates and environmentally driven changes in productivity that are
observed in many fish stocks. Thus, there is a need for more tactical ecosystem models
that can respond dynamically to changing ecological and environmental conditions.
Keywords ecosystem-based management, fisheries, marine, model complexity,
trade-off
Correspondence:
Jeremy Collie, Univer-
sity of Rhode Island,
Graduate School of
Oceanography,
Narragansett,
RI 02882, USA
Tel.: 401-874-6859
Fax: 401-874-6240
E-mail: jcollie@mail.
uri.edu
Received 11 Mar
2014
Accepted 28 Jul
2014
© 2014 John Wiley & Sons Ltd DOI: 10.1111/faf.12093 1
F I SH and F I SHER I E S

Introduction 2
Fishery ecosystem models 3
Characteristics of models: complexity and uncertainty 3
Considerations in choosing and developing models 4
Maintaining population realism 4
Incorporating species interactions 5
Incorporating environmental drivers 6
Incorporating human dimensions 7
Use of ecosystem models in fisheries management 8
What are the key ecosystem needs for models? 8
What types of models can meet these needs? 9
Strategic ecosystem models to inform fisheries management 9
Tactical ecosystem models to specify harvest policy 10
How can these models be used? 11
Ecosystem reference points and indicators 11
Multispecies biological reference points 12
Visualization and communication 13
Existing applications to management 15
Models with environmental drivers 15
Multispecies models 16
Discussion 16
Progress in following best practices in ecosystem modelling 17
Finding the sweet spot 18
Application of ecosystem models to fisheries management 18
Summary and conclusions 19
Acknowledgements 20
References 20
Introduction
With the increasing efforts towards ecosystem-
based fisheries management (EBFM) and the loom-
ing prospect of substantial changes in marine eco-
systems from climate change, a number of
quantitative approaches to describing marine eco-
systems for management purposes have emerged.
Several countries, including Australia, have for-
mally adopted an ecosystem-based approach to
fisheries management (Essington and Punt 2011;
Kruse et al. 2012). In the United States, the regio-
nal fisheries management councils are at various
stages of developing ways to implement an ecosys-
tem approach. In parallel, large-scale oceano-
graphic research programmes such as GLOBEC
(Barange et al. 2010) have been aimed at under-
standing how climate change and variability will
translate into changes in the structure and
dynamics of marine ecosystems and fish produc-
tion. Although there have been preliminary efforts
to compare and evaluate early quantitative
approaches (Hollowed et al. 2000; Cury et al.
2008; FAO 2008), there remains a need for com-
prehensive comparison, with an emphasis on con-
trasting and evaluating the various alternative
approaches in the context of the specific fisheries
management issues that need to be addressed.
Most quantitative approaches to ecosystem
assessment involve models to organize and quan-
tify our understanding of ecological processes and
to project the likely consequences of regulations
on populations and communities in the context of
a changing ecosystem (Dickey-Collas et al. 2013).
A variety of modelling approaches have been
applied to this problem, motivated primarily by a
quest for greater holism through the inclusion of
species interactions, environmental variability and
socio-economic effects (Botsford et al. 1997; Pi-
kitch et al. 2004,). However, there has been little
scrutiny of how well these models can be expected
to represent the dynamics of the added ecosystem
2 © 2014 John Wiley & Sons Ltd, F ISH and F ISHER IES
Fishery ecosystem models J S Collie et al.

components. Similarly, there is a range of needs
and uses for models in EBFM, and some models
may serve certain purposes better than others.
The terms associated with ecosystem-based fish-
eries management (EBFM) have varied definitions
(Pikitch et al. 2004; Sissenwine and Murawski
2004; Fogarty 2014). Here, we focus on steps
towards EBFM that account for interactions
among the key species present, and the influences
of a variable environment on those species. We
place less emphasis on the social and economic
considerations that are also part of an ecosystem
approach. Socio-economic considerations have
long been part of conventional fisheries manage-
ment, but they need to be considered more explic-
itly in EBFM, especially where there are multiple
conflicting objectives (Kellner et al. 2011). The
quantitative approaches we evaluate here are
mainly different types of ecological models (i.e.
logistic type, age/size-structured, food web, multi-
species oceanographic simulations) and various
proposed indicators of ecosystem state. Our focus
is somewhat narrower than the full range of mod-
elling considerations, as we do not attempt to pro-
vide a systematic review of ecosystem models (see
FAO 2008). Rather, we focus on how well models
will represent ecosystem dynamics to inform deci-
sion-makers in the pursuit of their specific ecosys-
tem goals.
While an ecosystem perspective is conceptually
desirable, ecosystems are complex and unpredict-
able, and there will likely be limited financial
resources with which to formulate ecosystem mod-
els. Process-based data needed to configure ecosys-
tem models and the long-term data required for
model validation will also be limited in many situ-
ations (Livingston et al. 2011b). These constraints
have led to the development of models that incor-
porate more ecosystem components, but do so
with a simpler description of the population
dynamics of each species, compared with the
assessment models used in single-species manage-
ment. One of our primary goals in this paper is to
describe the consequences of such simplifications.
We seek to inform scientists and decision-makers
regarding the nature of results possible from vari-
ous types of models. We start by reviewing the
consequences of adding complexity and the data
needs of ecosystem models being developed for
fisheries management. Next, we identify the key
ecological considerations that these models must
address in fisheries management and the types of
models that could meet these needs. We evaluate
the extent to which best practices for ecosystem
modelling (FAO 2008) are being followed. Finally,
we review the present use of ecosystem models in
decision-making and discuss impediments that
hinder the uptake of ecosystem considerations in
fisheries management.
Fishery ecosystem models
Characteristics of models: complexity and
uncertainty
The call to include ecosystem considerations
requires models to move from simple to complex
as they include additional factors, ecosystem com-
ponents and variability in space or time (Fig. 1).
To maintain a tractable model and to avoid
exceeding data availability, one approach is to
simplify the description of each component, as
more components are added. But overly simple
models may not be able to represent important
aspects of ecosystem dynamics and can thus have
large model bias. On the other hand, fully aug-
mented models require increased understanding of
species and environmental interactions to specify
the dynamics in greater detail. The uncertainty in
these models shifts from bias to parameter uncer-
tainty, arising from the sheer number of parame-
Complexity (number of parameters estimated)
Mod
el u
ncer
tain
ty
Modelbias
Parameteruncertainty
‘Sweet spot’
Varianceof policyindicator
Figure 1 A schematic view of the way in which model
bias declines and parameter uncertainty increases with
increasing model complexity. Model bias is related to
model fit, as measured by the residual error variance. If
the number of parameters is too large, a statistical model
will ‘fit the noise’ and can give biased predictions.
Parameter uncertainty is measured by the variance–
covariance matrix of the parameter estimates. The
variance of key policy indicators is the product of these
two sources of error and therefore has a minimum at an
intermediate level of complexity (adapted from Walters
1986).
© 2014 John Wiley & Sons Ltd, F I SH and F I SHER IES 3
Fishery ecosystem models J S Collie et al.

ters and therefore the amount of data needed to
estimate them. To reduce this uncertainty requires
additional observations to estimate parameter
values and to constrain model predictions. While
the need for realism pushes model choice towards
complexity, the need for empirically based parame-
ters of the system limits complexity. Walters
(1986) developed a mathematical treatment of this
trade-off to show that the variance of key policy
indicators (such as harvest rates or reference
points) is the product of these two sources of error.
In the end, the model used should be as simple as
possible without neglecting any essential compo-
nents or processes. For most specific purposes, a
model of intermediate complexity is thus preferable
(Plag�anyi et al. 2014).
Starting from a non-structured, single-species
model with no environmental or human influ-
ences, model complexity can develop in at least
four different dimensions: (i) increased population
structure in time, space, age or stage; (ii) increased
environmental influences affecting larval dispersal,
lower trophic levels, and the growth, fecundity
and survival of upper trophic levels; (iii) increased
number of species, with nonlinear trophic interac-
tions among food-web components; and (iv)
increased human interactions beyond harvest (e.g.
fleet dynamics, economics and policy influences).
Each ecosystem model that is used to inform man-
agement will have augmented complexity in one
or more of these, with a full ecosystem model
being one that includes additional complexity in
all four dimensions. Along this gradient from sim-
ple to more complex, there is a ‘sweet spot’ that
balances diminishing model bias with increasing
parameter uncertainty (Fig. 1). We use the term
‘sweet spot’ as the level of complexity that will
maximize the usefulness of ecosystem models to
fishery management.
Considerations in choosing and developing models
Maintaining population realism
One of the ways that ecosystem models could be
simplified is to adopt a simpler form of the popula-
tion component (e.g. go from an age-structured
population model to a logistic model). Age-struc-
tured and logistic models have a long history of
parallel use in fisheries since the 1950s (Schaefer
1954; Beverton and Holt 1957). The rationale
underlying why population models can improve
with increased structure is based on the funda-
mental definition of what makes an adequate state
variable (Caswell 2001). In most fish populations,
a logistic model would not be considered to repre-
sent an adequate state variable because the heter-
ogeneity in age, size or space was not included;
rather ‘the population is to be regarded, in effect,
as a continuous, homogeneous mass of living mat-
ter’ (Beverton and Holt 1957, p. 330). These
authors advocated inclusion of the age-dependence
of survival, growth and fecundity, noting that the
effect of a unit of biomass on population dynamics
would depend on whether it was part of a repro-
ductively mature individual. A similar sensitivity
to aggregating population numbers over age clas-
ses was illustrated with a stage-structured model;
combining every two ages led to a dramatic, unre-
alistic reduction in environmentally induced popu-
lation variability (Botsford et al. 2011).
Many demographic parameters depend on size,
life-history stage or age (Caswell 2001). Individuals
have a maturity schedule, natural mortality typi-
cally decreases with size, and most fishing gears
are size-selective. If growth rate does not vary with
time, the behaviour of age-structured models is
essentially the same as that of size-structured mod-
els, which is why most stock assessment models
are age-structured. However, age-structured mod-
els require age-structured data to enable parameter
estimation and model validation. Age determina-
tion is laborious and expensive and often is there-
fore limited to species of commercial importance.
Size-based models are good candidates for eco-
system models because length distributions are
routinely measured for a larger suite of species. If
size information is available, then the model can
be size-structured, as long as the growth pattern
(size vs. age) is known. Size-spectrum models,
which base an individual’s contribution to dynam-
ics on size, have provided useful insights on how
perturbations propagate through food webs (Kerr
and Dickie 2001; Benoıt and Rochet 2004).
Within the size-spectrum, species mature at differ-
ent sizes and grow to different asymptotic lengths.
To be an adequate description of the state of an
ecosystem, size-based models need to track individ-
ual species (Hall et al. 2006; Andersen and Peder-
sen 2010), not just the total abundance across
species at each size. An advantage of size-based
models is that they can be based on allometric
relationships and can therefore be parameterized
with a small number of parameters for each
species (Pope et al. 2006).
4 © 2014 John Wiley & Sons Ltd, F ISH and F ISHER IES
Fishery ecosystem models J S Collie et al.

A second consideration in structuring models is
space. If individuals at each age have different
vital rates at different locations, or if they are
exposed to different fishing mortality rates [either
in or out of a marine protected area (MPA), for
example], then spatial structure must be taken
into account. Although spatial structure had been
considered in classic population dynamics models
used in fisheries (Beverton and Holt 1957), inclu-
sion of spatial detail became essential when MPAs
became a popular management tool (Hastings and
Botsford 1999; Botsford et al. 2001).
In addition to variability in fishing mortality
rates over space, another reason for making mod-
els spatially explicit is the specific consideration of
habitat. If there are differences in individual vital
rates among habitats, then explicit representation
of these habitats may improve the representation
of state. Spatial resolution is also needed to assess
the impacts of bottom fishing on benthic commu-
nities and to provide habitat information needed
for spatial management. The U.S. Magnuson-Ste-
vens Act requires essential fish habitat (EFH) to be
defined for all federally managed species. In Aus-
tralia, quantitative models are starting to be used
to assess impacts on benthic species (Dichmont
et al. 2008). An approach adopted in Australia,
termed Ecological Risk Assessment for the Effects
of Fishing, has been used to assess over 2000 spe-
cies and more than 200 habitat types (e.g. see
Hobday et al. 2011).
In summary, even at the single-species level,
there is a broad range of population models based
on different definitions of state. These range from
models in which all individuals in a population
are assumed to be identical to those in which indi-
viduals at different ages, sizes and locations have
different vital rates, and ultimately to assuming
each individual is unique. Individual-based models
(IBMs) are based on the idea that variability
among individuals (even with an age or size class)
is important to population and community
dynamics (DeAngelis and Mooij 2005). While the
individual-based approach is popular in fish model-
ling, the high data demands have generally con-
fined IBMs for use as theoretical and strategic
tools, not in tactical fisheries management.
Thus far, we have focused on the number of
variables and the amount of data (Fig. 1). As we
now turn our attention from the population to the
ecosystem level by considering multiple species,
environmental variability and human interactions,
we will not be merely adding variables or objects
modelled. Moving forward we need to also account
for the mechanisms underlying the interactions
among model components.
Incorporating species interactions
New models for EBFM will include descriptions of
species interactions, to improve descriptions of the
state dynamics and to account for the indirect
effects of harvesting one species on other species.
Viewed from a state variable point of view, addi-
tion of other component species is required to
describe the state of the ecosystem and the compo-
nent populations. This step presumes an under-
standing of the interactive relationships and the
data on which to base that understanding.
There is a long history of studying the trophic
interactions among species and representing them
with mathematical models. The need for a mecha-
nistic understanding has led to exploration of
alternative bases for dynamics. One thread started
with food webs, which began as mass-balance
energy budgets (Steele 1974) and were later con-
verted to dynamic systems of coupled differential
equations (Walters et al. 1997). The second thread
started with Lotka-Volterra predator–prey dynam-
ics and was then extended to include more species
with more realistic interaction terms (May et al.
1979). While these two threads are interwoven
and have converged at dynamic multispecies mod-
els, the two strands can still be distinguished. The
food-web thread has led to complex end-to-end
models that are often used to simulate ecosystem
dynamics, but lack structure for individual species.
The predator–prey thread has led to age and size-
structured multispecies models, such as Multispe-
cies Virtual Population Analysis (MSVPA, Sparre
1991), but lack a holistic ecosystem view.
The dynamic behaviour of population models
quickly becomes highly complex with the addition
of multiple species linked with interaction terms
with complex feedback loops. Even moving from
one to two species complicates the analytical com-
putation of system dynamics, stability properties,
and the impacts of harvesting and choice of target
reference points. Model analysis shifts from mathe-
matical methods to numerical simulation. As a
result, there remains little theoretical underpin-
ning of these multispecies models. Overly complex
models can be avoided by including only those
species needed to address a specific management
question. Plag�anyi et al. (2014) suggested a rule
© 2014 John Wiley & Sons Ltd, F I SH and F I SHER IES 5
Fishery ecosystem models J S Collie et al.

of thumb that includes sufficient fishing sectors
and predators to account for at least 90% of the
mortality on each prey species.
Statistical multispecies age-structured models
are extensions of MSVPA, which in turn was
derived from Andersen and Ursin’s (1977) full eco-
system model of the North Sea. Species are linked
by natural mortality, which is a dynamic function
of predator abundance and prey availability. Multi-
species age-structured models require diet composi-
tion data by predator age, in addition to the
catch-at-age and survey data typically used in
age-structured stock assessments. One of the first
statistical, multispecies, age-structured models was
developed for the eastern Bering Sea (Jurado-Moli-
na et al. 2005); this approach has also been
employed in a number of other ecosystems, includ-
ing the North Sea, Baltic Sea, Aleutian Islands,
Gulf of Alaska and Georges Bank. Advantages of
this multispecies model formulation are the simi-
larity with existing age-structured stock assess-
ments and the ability to quantify uncertainty with
statistical model fitting (Curti et al. 2013).
Incorporating environmental drivers
Accounting for the effects of the environment in
fisheries has a long history stretching back to
early debates of whether unusual variability in a
fishery was due to natural variability or the fact
that the population had been fished (e.g. the cod
stocks in Lofoten in the early 20th century, Rollef-
sen 1954). Measures of environmental variability
have been used to adjust productivity (Quinn and
Deriso 1999), survival (Scheuerell and Williams
2005) and growth estimates (Wells et al. 2007,
2008b; Satterthwaite et al. 2012). For example,
Schirripa et al. (2009) incorporated sea surface
height in a spawner–recruit curve for sablefish
(Anoplopoma fimbria, Anoplopomatidae). Similarly,
upwelling values have been used to adjust expec-
tations of coho salmon (Oncorhynchus kisutch, Sal-
monidae) production and survival (Logerwell et al.
2003; Scheuerell and Williams 2005).
The potential advantages of accounting for envi-
ronmental variability are to better understand the
drivers of population dynamics and to provide bet-
ter predictions based on available or inexpensive
observations of the state of the physical environ-
ment. The failure of a number of environmentally
based predictors has led to some scepticism regard-
ing their usefulness in stock assessments for fear
that the models will fail to work over the long
term as environmental conditions shift (Walters
and Collie 1988; Myers 1998). To reduce the like-
lihood of these events, we argue that the mecha-
nisms that link environmental variables to
biological responses be specified and quantified
appropriately and used in that context for the pre-
diction of population trends. The mechanistic con-
nections between upper trophic-level fish and their
environment can be complex, depending not only
on the trophic level of the fish but also on the flex-
ibility of its diet and habitat needs. Likewise, mod-
els designed for lower trophic-level fish can be
complicated by bottom-up and top-down impacts.
Wells et al. (2008a) proposed using path analysis,
in combination with quantitative multivariate sta-
tistics, as a method for constructing reasonable
connections and deriving mechanistic understand-
ing of how an environmental factor, as well as
predators and prey, directly or indirectly affects
the fish population of interest.
A more comprehensive understanding of the
biophysical coupling that drives population
dynamics will be facilitated by the increasing
breadth of observations of ocean state becoming
available from land, sea and satellite monitoring
platforms. While long time series of modelled and
observed ocean surface conditions have been avail-
able at a relatively gross spatial scale, remotely
sensed data series now comprise over a decade of
high-resolution spatially and temporally explicit
surface conditions. Further, improved data man-
agement has made these data series readily acces-
sible. Such improved data and increased
availability have permitted the development of
mechanistic models representing the relationships
between the environment and the biological
responses at the appropriate spatial and temporal
scales (see Chassot et al. 2011 for a more exhaus-
tive review). For example, the cumulative spawn-
ing habitat available for sardine (Sardinops sagax,
Clupeidae) and anchovy (Engraulis mordax, Engra-
ulidae) was evaluated across the California Cur-
rent by relating shipboard collection with remote-
data series of sea surface temperature (Reiss et al.
2008). Bi et al. (2008) used satellite-derived chlo-
rophyll a data and water depth to characterize the
habitat usage of juvenile chinook (Onchorynchus
tshawytscha, Salmonidae) and coho salmon off the
U.S. west coast. Remote sensing is also quite useful
for spatial management of fisheries resources and
protected species. Hobday and Hartmann (2006)
and Howell et al. (2008) used remote sensing for
6 © 2014 John Wiley & Sons Ltd, F ISH and F ISHER IES
Fishery ecosystem models J S Collie et al.
the near-real time locations of potential habitat for
species of concern. With this information avail-
able, fishery managers could make educated deci-
sions about the risk of interactions with these
protected species.
A second advance that will aid in the addition
of environmental variables is development of
improved circulation models. Advances in regional
oceanographic model simulations (e.g. ROMS,
Shchepetkin and McWilliams 2005) now allow for
the retrospective analysis of horizontal and vertical
oceanographic conditions at relatively high spatial
and temporal resolution. These model-derived data
now make it possible to examine the relationships
between the biology and estimates of oceano-
graphic conditions in three spatial dimensions over
time. Huff et al. (2012) provide a recent example
wherein the habitat of benthic green sturgeon is
modelled from representations of flow, temperature
and oxygen conditions in the bottom 5 m of the
California Current. Similarly, Song et al. (2012)
ground-truthed physical circulation results for
describing potential spawning habitat of sardines.
At the coarsest spatial and temporal scales, global
climate models can project future environmental
conditions in the context of global climate change.
Improving these models and linking them with
biological models is critical to understanding how
best to plan mitigation in the future (Hobday and
Lough 2011; Stock et al. 2011).
In summary, there is a growing understanding
of how oceanographic processes affect the life-his-
tory stages of marine species and a growing ability
to measure the oceanographic variables at the
appropriate spatial scales. Models that incorporate
these environmental linkages will have increased
explanatory power and require much-increased
computer power. Such modelling efforts must bear
in mind that environmental effects tend to be non-
additive (Planque et al. 2010) and that new
approaches may be required to address this state
dependence (Deyle et al. 2013).
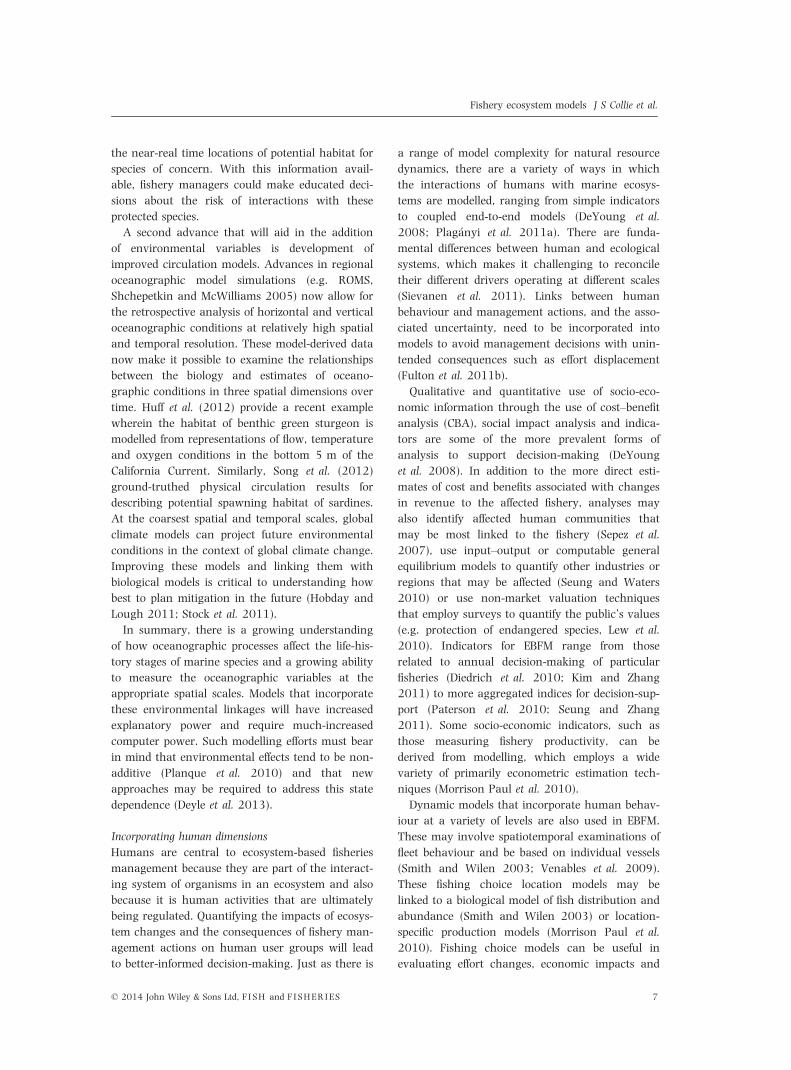
Incorporating human dimensions
Humans are central to ecosystem-based fisheries
management because they are part of the interact-
ing system of organisms in an ecosystem and also
because it is human activities that are ultimately
being regulated. Quantifying the impacts of ecosys-
tem changes and the consequences of fishery man-
agement actions on human user groups will lead
to better-informed decision-making. Just as there is
a range of model complexity for natural resource
dynamics, there are a variety of ways in which
the interactions of humans with marine ecosys-
tems are modelled, ranging from simple indicators
to coupled end-to-end models (DeYoung et al.
2008; Plag�anyi et al. 2011a). There are funda-
mental differences between human and ecological
systems, which makes it challenging to reconcile
their different drivers operating at different scales
(Sievanen et al. 2011). Links between human
behaviour and management actions, and the asso-
ciated uncertainty, need to be incorporated into
models to avoid management decisions with unin-
tended consequences such as effort displacement
(Fulton et al. 2011b).
Qualitative and quantitative use of socio-eco-
nomic information through the use of cost–benefit
analysis (CBA), social impact analysis and indica-
tors are some of the more prevalent forms of
analysis to support decision-making (DeYoung
et al. 2008). In addition to the more direct esti-
mates of cost and benefits associated with changes
in revenue to the affected fishery, analyses may
also identify affected human communities that
may be most linked to the fishery (Sepez et al.
2007), use input–output or computable general
equilibrium models to quantify other industries or
regions that may be affected (Seung and Waters
2010) or use non-market valuation techniques
that employ surveys to quantify the public’s values
(e.g. protection of endangered species, Lew et al.
2010). Indicators for EBFM range from those
related to annual decision-making of particular
fisheries (Diedrich et al. 2010; Kim and Zhang
2011) to more aggregated indices for decision-sup-
port (Paterson et al. 2010; Seung and Zhang
2011). Some socio-economic indicators, such as
those measuring fishery productivity, can be
derived from modelling, which employs a wide
variety of primarily econometric estimation tech-
niques (Morrison Paul et al. 2010).
Dynamic models that incorporate human behav-
iour at a variety of levels are also used in EBFM.
These may involve spatiotemporal examinations of
fleet behaviour and be based on individual vessels
(Smith and Wilen 2003; Venables et al. 2009).
These fishing choice location models may be
linked to a biological model of fish distribution and
abundance (Smith and Wilen 2003) or location-
specific production models (Morrison Paul et al.
2010). Fishing choice models can be useful in
evaluating effort changes, economic impacts and
© 2014 John Wiley & Sons Ltd, F I SH and F I SHER IES 7
Fishery ecosystem models J S Collie et al.

biological benefits of various spatial closures, and
also for conducting management strategy evalua-
tions (Dichmont et al. 2008).
Incorporating human considerations is still in its
infancy, but a number of lessons have been
learned to date. These include understanding the
motives and behaviours underlying bycatch and
discards (Pascoe 1997), how human behavioural
responses can undermine management intent (Ful-
ton et al. 2011b) and how ignoring sociopolitical
and economic factors can aggravate illegal fishing
and hence derail a fishery management system
(Raemaekers et al. 2011). Including sociocultural
considerations may help avoid unintended conse-
quences and thus improve future potential policy
outcomes (Plag�anyi et al. 2013). These insights
should improve strategies for achieving the goals
of EBFM with better predictive capabilities when
using fleet dynamics models (Van Putten et al.
2012) and strategies for maximizing economic
yield in multispecies fisheries (Dichmont et al.
2010).
A large focus of the efforts to join biological and
economic models is with respect to quantifying
impacts of climate change on marine ecosystems.
As noted by Haynie and Pfeiffer (2012), it is essen-
tial to consider fishermens’ behaviour in these
models to improve understanding of the possible
trajectories of impact, even though this may
broaden the range of outcomes. A range of model
complexity is being used for both the biophysical
and human dynamics (Fulton 2011; Ianelli et al.
2011; Plag�anyi et al. 2011a,b).
Use of ecosystem models in fisheriesmanagement
What are the key ecosystem needs for models?
The continuum of ecosystem models can be catego-
rized as (i) conceptual models aimed at developing
understanding of ecosystem processes; (ii) models
for strategic management decisions; or (iii) models
for short-term tactical management advice (FAO
2008). Whole ecosystem models are often used for
pedagogical purposes, to impart and illustrate an
understanding of ecosystem dynamics. Strategic
advice concerns broad, policy-setting, context-level
issues such as ecosystem services, system-wide pro-
ductivity and biodiversity goals. Tactical advice
involves the specification of harvest rates and quo-
tas so as to meet the strategic objectives.
Fishery ecosystem models should be focused on
specific objectives and attributes of interest to
stakeholders or managers (Dickey-Collas et al.
2013). The key ecosystem dimensions of fisheries
are well known, and in some cases, fishery man-
agers have considered them in decision-making
for some time (Sissenwine and Murawski 2004).
They include (i) accounting for environmental
variability and climate change; (ii) protecting fish
habitat; (iii) trophic interactions among harvested
species; and (iv) the ecological effects of mixed-
stock fisheries, bycatch and discards. For all four
types of ecosystem consideration, models tailored
to the interacting components have been devel-
oped to project the likely consequences of man-
agement actions as evidenced in the northeast
Pacific examples provided by Hollowed et al.
(2011).
The quantitative state of an ecosystem can be
integrated into fisheries management at a number
of points, ranging from informing the manage-
ment system of general results about key ecosys-
tem components and long-term dynamics to
specifying harvest guidelines. At the level of con-
ceptual understanding, single-species models can
simply be examined in the context of ecosystem
status. At this level, a broad range of ecosystem
models could be used together with empirical eco-
system indicators to provide a qualitative assess-
ment of when to add more precaution to annual
single-species management advice, as done in
Alaska (Livingston et al. 2005, 2011a). At the
strategic level, ecosystem models can be run in
parallel with single-species assessments to check
whether medium-term harvest policies will impact
other ecosystem components or conversely
whether key parameters of single-species models
need adjusting in response to shifts in ecosystem
structure. At this level, the single and multispecies
dynamics may remain unlinked or there may be
unidirectional links. For example, multispecies
models can provide estimates of natural mortality
for use in single-species models (Garrison et al.
2010). Conversely, projections of single-species
models can be used to check for adverse effects on
dependent predators. When concerned with envi-
ronmental linkages, one-way linkages may suffice
because environmental variability affects single-
species dynamics, but single species do not affect
environmental variability. In many cases, the tro-
phic feedback is in two directions, which necessi-
tates a fully coupled dynamic model. Tactical
8 © 2014 John Wiley & Sons Ltd, F ISH and F ISHER IES
Fishery ecosystem models J S Collie et al.

models used to specify harvest guidelines will be
models of intermediate complexity that incorporate
the important ecosystem components with strong
linkages (Plag�anyi et al. 2014).
What types of models can meet these ecosystem
needs?
Strategic ecosystem models to inform fisheries
management
There is an interplay between tactical and strate-
gic models, as tactics provide the means to strate-
gic ends. The development of simpler tactical
models has often led to questions about the impor-
tance of environmental considerations, which in
turn motivated the development of strategic mod-
els to address these issues. By highlighting sensi-
tive or key system components (e.g. the level of
productivity) and identifying which management
tools are most useful in the particular ecosystem
of interest, the output of strategic models provides
context for tactical management decisions. Once
the output from a strategic (or even conceptual)
model has indicated which tool to use, tactical
models can be implemented to determine the spe-
cific level for that management tool.
Ecosystem models that are used in strategic
roles include Ecosim and Ecospace (EwE, Walters
et al. 1997), OSMOSE (Shin and Cury 2004) and
Atlantis (Fulton 2004; Fulton et al. 2011a). Stra-
tegic models must be based on the best available
data and, when possible, should capture and prop-
agate the uncertainty in the input data (e.g. Eco-
sense routines, Aydin et al. 2007). Fitting complex
ecosystem models to data remains a challenge.
Parameters of these models typically are not fit
statistically to data, although at least one example
exists where this has been done using EwE (Gai-
chas et al. 2011). Sensitivity of model outputs to
model form can and should be tested with
‘bounded parameterizations’ for key parameters
(Fulton 2010); however, long computer run times
usually preclude more complete exploration of the
parameter space. Selection of bounded parameter-
izations requires careful decisions by the model
developer and a preliminary understanding of the
sensitivity of the model. Such bounded scenarios
for strategic models have a direct analogue in sin-
gle-species fisheries management, where the deci-
sion-table framework is often used to highlight key
uncertainties (‘states of nature’) in biology and
fisheries (Hilborn and Walters 1992). An example
of such a bounding scenario for a strategic ecosys-
tem model is shown below (Fig. 2).
Forward projections of strategic ecosystem mod-
els that include human behaviour have been used
to inform management related to multiple sectors
such as energy, tourism and fishing (InVitro, Ful-
ton et al. 2011b). Management systems such as
southeast Australia’s Alternative Management
Strategies project (Fulton et al. 2014) and NOAA’s
Integrated Ecosystem Assessment (Levin et al.
2009) have applied strategic models to evaluate
and rank the performance of broad fisheries man-
agement strategies such as closed areas, quotas
and fishing gear requirements. Perhaps the most
promising strategic role for complicated ecosystem
models is as an operating model for Management
Strategy Evaluation (Sainsbury 2000; Fogarty
2014), in which the performance of simulated
monitoring, assessment and management deci-
sions can be tested within complex ecosystem
operating models.
A key question in providing management
advice for some stocks or in some jurisdictions
pertains to the economic optimization of multispe-
cies harvests. One example is provided by a study
of optimal fishing policies for parrotfish, snapper
and grouper in the Caribbean. An important start-
ing point for understanding the dynamics of this
ecosystem is that parrotfish are essential as graz-
ers in maintaining healthy reefs by preventing
macroalgae from dominating the system (Mumby
et al. 2007). Thus, there is an existence value for
parrotfish, which can be assigned an economic
value from the role of reefs in ecotourism, in addi-
tion to the value of reefs for biodiversity. There
are also well-documented and modelled trophic
interactions among grouper, snapper and parrot-
fish: the primary predator of both snapper and
parrotfish is grouper, while the grouper has a
broad diet (Kellner et al. 2010). A set of bioeco-
nomic models for fishing in this system can be
made by optimizing fishing effort over time and
either looking at each species singly, or all three
at once, and also either by including the existence
value of parrotfish or not (Kellner et al. 2011).
Notable among the modelling results are that
there is little difference in optimal catch between
the models of each species by itself vs. looking at
all three species, but the inclusion of the existence
value for the parrotfish makes a substantial
change (reduction) in optimal fishing levels. This
bioeconomic model demonstrates the economic
© 2014 John Wiley & Sons Ltd, F I SH and F I SHER IES 9
Fishery ecosystem models J S Collie et al.

value of choosing harvest rates that differ from
the single-species optimum.
Tactical ecosystem models to specify harvest policy
Models of intermediate complexity for ecosystem
assessment (MICE) are considered by many the
way forward to provide tactical fisheries manage-
ment advice based on rigorous models that include
more than a single species (Plag�anyi et al. 2014).
One of the key characteristics of models used for
tactical fisheries decision-making is that the
parameters are statistically estimated from time-
series data collected for the ecosystem under con-
sideration, and diagnostic tools are applied to eval-
uate model performance (e.g. residual analysis,
variance estimation). It is common to include prior
information (e.g. on growth and predation rates,
assimilation efficiencies) and to include fits to diet
data in the objective function to be optimized (Kin-
zey and Punt 2009; Van Kirk et al. 2010). When
multiple data sources are available, each needs to
be weighted based on the confidence associated
with the data. In cases in which the data are
somewhat contradictory, data weighting needs to
be done carefully (Francis 2011), and the sensitivity
of the results to different data weighting schemes
should be explored.
A critical characteristic of tactical EBFM models
is that they adequately account for parameter
uncertainty with Markov Chain Monte Carlo
(MCMC) sampling, inversion of the Hessian matrix
or likelihood profiles. If available data are insuffi-
cient to support precise parameter estimation, then
an acceptable alternative would be to bound the
range of uncertainty (Plag�anyi et al. 2014). Given
the greater level of structural uncertainty associ-
ated with more complex ecosystem models (rela-
tive to single-species models), sensitivity to
structural uncertainty needs to be demonstrated,
for example, by testing alternative functional
response formulations (Gaichas et al. 2012) or
comparing the results from multiple (independent)
models (Smith et al. 2011).
Evaluating alternative model structures is a key
step in addressing uncertainty, which has been
identified as one of the critical areas for advancing
ecosystem modelling (Marasco et al. 2007). Hill
et al. (2007) provided a useful list of best practices
for dealing with structural uncertainty in ecosystem
modelling: (i) developing models or parameterizations
0.0
0.2
0.4
0.6
0.8
1.0
1.2
Larg
e pl
ank
vore
s
Smal
l pla
nkvo
res
Salm
on
Pacific
hak
e
Nea
rsho
re fi
sh(s
urfp
erch
)
Mis
c. p
elag
ic sh
arks
Ceph
alop
ods
Mes
ozoo
plan
kton
Mic
rozo
opla
nkto
n
Deep
ver
cal m
igra
tors
Yello
wey
e an
d co
wco
d
Skat
es a
nd ra
ys
Shrim
p
Larg
e zo
opla
nkto
n
Depo
sit f
eede
rs
Biom
ass i
n ye
ar 5
0/Bi
omas
s in
year
50
with
no
harv
est o
f eup
haus
iids
Figure 2 Analyses using the Horne et al. (2010) California Current Atlantis model suggest that complete depletion of
euphausiids (large zooplankton) would lead to substantial declines in many predators in the California Current. Using a
bounded parameterization approach, this figure asks how robust this result is to uncertainty in abundance of a key
predator, Pacific hake (Merluccius productus), quantified by Ralston et al. (2011). Results from the base scenario are
represented by black circles, and results from scenarios with high and low Pacific hake biomass are represented by
green crosses and red squares, respectively. Pacific hake abundance does little to vary the magnitude or direction of
effects that euphausiid depletion has on other food-web components. When euphausiids are fully depleted, varying
Pacific hake generally changes food-web effects by <5%.
10 © 2014 John Wiley & Sons Ltd, F ISH and F ISHER IES
Fishery ecosystem models J S Collie et al.

that represent plausible limits on key sources of
structural uncertainty; (ii) including models and
parameterizations that fall between these plausible
limits; (iii) considering whether to evaluate possi-
ble future scenarios that extend outside the range
of historic data; (iv) weighting models or parame-
terizations by their plausibility (if possible); and
(v) avoiding model averaging unless the distribution
of results across all models or parameterizations is
unimodal.
Best practice involves acknowledging the para-
mount importance of interaction terms among
species and between species and environmental
factors (FAO 2008). A first step towards integrat-
ing environmental drivers has been to incorporate
a single or limited number of key covariates
mapped to the life-history trait of interest (e.g.
recruitment, maturation) at the appropriate spatial
and temporal scale (Maunder and Watters 2003).
A probable mechanistic link should exist between
an environmental covariate and the biological
response. Otherwise, the chosen covariate may
simply be responding to a third unexamined vari-
able; an undetected change in that variable will
lead to a degradation of the model. For example,
wind characteristics aligned with coastal geogra-
phy create conditions conducive to improved krill
production in the California Current (Santora et al.
2011). The timing of the upwelling season and
development of krill is matched to the average tim-
ing of emigration by salmon to the sea, which is a
critical period for defining recruitment strength
(Beamish and Mahnken 2001). With this mecha-
nistic link, models can be extended to forecast sal-
mon recruitment from upwelling characteristics
and krill dynamics (Wells et al. 2012). Given that
many of the relationships between biology and
environment are nonlinear, there is a need to
monitor the relationships and adjust the models as
necessary.
Three primary considerations relate to the
covariation between a biological trait and the
environmental variable: timing, spatial scale and
inherent structure of the system. If the phenology
of the system changes, such that there is a secular
trend in the timing of the covariates of interest,
the defined mechanisms may change (Bograd et al.
2009). Similarly, changes in the spatial distribu-
tion of the environmental characteristics (Fried-
land et al. 1998; Song et al. 2012) or in the
distribution of the fish (Nye et al. 2009) will lead
to a spatial mismatch.
A logical first step in using ecosystem models in
tactical decision-making has been to build on
existing approaches. Hence, a handful of multispe-
cies models, which are essentially extensions of
single-species approaches, are being used to inform
management. Multispecies model results are most
sensitive to the consumption rate per predator,
predator functional responses (the prey–predator
interaction terms) and feeding selectivities or suit-
abilities (Tsou and Collie 2001; Fulton et al.
2003). The potential sensitivity to alternative
interaction representations demonstrates why it is
essential that model robustness to formulations be
examined (Kinzey and Punt 2009). Models need to
be closely scrutinized to understand the extent to
which underlying model assumptions and input
parameters predetermine the results obtained
(Plag�anyi and Butterworth 2004).
Tactical ecosystem models are increasingly pro-
ducing outputs that could be used for decision-
making. Several such models have been developed
to quantify predator–prey interactions in the Ant-
arctic (Mori and Butterworth 2006) and to assess
the impact on dependent predator populations of
different spatial distributions of krill (Plag�anyi and
Butterworth 2012; Watters et al. 2013). Despite
many models seemingly finding the sweet spot,
few if any have yet been fully integrated into the
decision-making process. Rather, their role to date
has been primarily in providing accessory informa-
tion as context, bounding possible outcomes or
providing estimates of the predation mortality rate
for explicitly modelled prey species (Gjøsaeter et al.
2002; Garrison et al. 2010), without necessarily
using the multispecies model itself to determine
appropriate levels of fishing mortality.
How can these models be used?
Ecosystem reference points and indicators
Ecosystem reference points or targets allow us to
judge the status or trend of an ecosystem relative
to a management objective. Reference points are
most often based on observable indicators that
allow us to concretely evaluate whether a broader
goal of ecosystem-based management has been
achieved (Link 2005). The use of ecosystem mod-
els in this case is to understand the shape of the
relationship between a pressure (e.g. fishing or
pollution) and an indicator (e.g. fish abundance or
human health effects), to quantify the trade-offs
between conflicting objectives. Ecosystem models
© 2014 John Wiley & Sons Ltd, F I SH and F I SHER IES 11
Fishery ecosystem models J S Collie et al.

have been used to identify ‘tipping points’, beyond
which harvesting would shift the ecosystem to a
different state, for instance in the Gulf of Alaska
(Gaichas et al. 2012). However, non-modelling
approaches can also be used to identify ecosystem
reference points, such as focusing on historical
baselines and time-series trends, identifying social
norms (Livingston et al. 2005; Samhouri et al.
2011) or making comparisons to other areas or
regions (Samhouri et al. 2012).
For Puget Sound, on the west coast of the Uni-
ted States, a science and management process (the
Puget Sound Partnership) mandated by the state
of Washington has identified ecosystem indicators
and reference levels (Samhouri et al. 2011). Eco-
system models have been used as one of several
tools to screen and identify potential ecological
indicators and used to test for the possible correla-
tion between ecosystem attributes and potential
indicators. Additionally, population models of pro-
tected species have been used to identity reference
levels for these ‘vital sign’ species, such as chinook
salmon and bald eagles (Kershner et al. 2011).
These vital sign species and associated reference
points are understood by the public to represent
general ecosystem condition, rather than the sta-
tus of only that single species. In a similar way,
shellfish have been monitored throughout the Uni-
ted States for over 20 years as proxies for environ-
mental contamination (Kimbrough et al. 2008),
with reference points based on functional relation-
ships between contaminant doses and human
health effects.
Link (2005) proposed 14 ecosystem indicators,
warning thresholds and limit reference points.
Although some of these reference points and
thresholds were based on ‘rules of thumb’ or
empirical observations from the northwest Atlan-
tic, others were informed by ecosystem and multi-
species models (Gislason and Rice 1998).
Indicators included those derived from body size
(e.g. slope of the size-spectrum), biomass of differ-
ent species (e.g. biomass of all piscivores), diversity
(e.g. species richness), trophic dynamics (interac-
tions per species), network properties of the food
web (e.g. number of cycles) and indicator species
(e.g. volume of gelatinous zooplankton). Although
these reference points have not directly influenced
management actions, many of these indicators are
included in documents that provide managers an
ecosystem context for fishery decisions (Ecosystem
Assessment Program 2009). A similar approach is
used to inform fishery managers off Alaska (Liv-
ingston et al. 2005). In Australia, Fulton et al.
(2005) used an Atlantis model to test a set of eco-
system indicators similar to those proposed by Link
(2005) and identified indicators that were strongly
correlated to attributes (e.g. diversity or food-web
structure) across a range of ecological and fishing
scenarios.
Multispecies biological reference points
Biological reference points (BRPs) for single fish
stocks are based on the concept of maximum sus-
tainable yield (MSY), maintaining a specified per-
centage of unfished biomass or other
precautionary levels (Quinn and Deriso 1999).
The single-species approach has been extended to
production models fit to data aggregated across
species in the community (Brown et al. 1976; Mu-
eter and Megrey 2006). These models imply com-
pensation in aggregate fish production and
supported the limit on total catch that formerly
existed in New England and the two million ton
limit on total harvest in the Bering Sea. However,
where multiple fleets catch multiple interacting
species, disaggregated multispecies models are
needed.
Using systems of coupled differential equations,
May et al. (1979) demonstrated that, for a preda-
tor–prey system, the joint sustainable yield is not
equivalent to the sum of the individual MSYs com-
puted based on single-species harvest principles.
Instead, the sustainable harvest of one species is
conditional on the abundance and hence harvest
rate of other species, which gives rise to trade-offs
in the sustainable harvest of predators and prey.
Computation of a global optimum, even for only
two species, is complicated further by consider-
ations of the ecological role, economic value and
practicalities of different industries targeting differ-
ent species (May et al. 1979). This landmark study
was motivated by the depletion of baleen whales
in the Southern Ocean. At that time, there was a
perception of a large harvestable surplus of Ant-
arctic krill and concern that a krill harvest could
jeopardize the recovery of whale populations. Since
that time, two main approaches have developed
for setting multispecies reference levels: precau-
tionary and dynamic.
The precautionary approach is based on the
broad objective of maintaining the relationships
between harvested and dependent species (Sains-
bury 2000). The Commission for the Conservation
12 © 2014 John Wiley & Sons Ltd, F ISH and F ISHER IES
Fishery ecosystem models J S Collie et al.
of Antarctic Marine Living Resources (CCAMLR)
adopted 75% of pristine spawner biomass as a pre-
cautionary reference point (Plag�anyi and Butter-
worth 2012). Predator–prey models for the krill
population were not used because they were
judged to be too uncertain. The operating model
included uncertainty in recruitment, growth and
mortality, and in the krill abundance estimates.
Renewed concerns about the status and impor-
tant ecosystem role of forage species have
prompted expert groups to recommend precaution-
ary harvest policies to ensure that biomass of for-
age species does not fall below 75% of unexploited
biomass (Smith et al. 2011). In these studies, mod-
els of several ecosystems have been used to iden-
tify generic thresholds for the safe harvest of
forage species, which can then be applied to data-
limited ecosystems. A precautionary approach is
especially appropriate when there are concerns
about protected, endangered or threatened species.
A weakness of this approach is that the proposed
harvest guidelines depend on assumptions of the
ecosystem models and estimates derived from
them. For example, the pristine biomass of small
pelagic fish species is notoriously difficult to esti-
mate because of their ‘spasmodic’ variability
(Caddy and Gulland 1983). Technical consider-
ations aside, in addition to their existence value,
predator and prey species have different values to
different sectors.
The dynamic approach stems from the realiza-
tion that biological reference points are conditional
on the abundance of interacting species and pre-
vailing environmental conditions (Collie and Gisla-
son 2001). For example, FMSY of herring (Clupea
harengus, Clupeidae) and sprat (Sprattus sprattus,
Clupeidae) in the Baltic Sea depends on the pre-
vailing level of cod (Gadus morhua, Gadidae) preda-
tion. Where these linkages are sufficiently well
understood and the interactions have been quanti-
fied, BRPs can be modified to account for trophic
interactions and dependencies (Tyrrell et al.
2011). Although it is important to recognize that
they can change over time, establishing BRPs for
harvest guidelines requires consensus among par-
ticipants in the management system; when BRPs
change, this consensus can be lost or questioned
(e.g. when setting rebuilding targets).
Considering the BRPs of multiple interacting
species leads to the concept of multispecies maxi-
mum sustainable yield. Worm et al. (2009) used a
size-based model to illustrate the trade-off between
total yield, biomass and number of collapsed spe-
cies in a community. In this example, all species
were subject to the same fishing pressure with
selectivity an increasing function of size. But the
same total yield could be caught by different com-
binations of fishing effort of fleets catching differ-
ent species. Maximizing the total biomass of
landings favours high-volume fisheries, often on
forage species. Economic optimization tends to
result in extreme solutions, depending on the rela-
tive value of predator and prey species (May et al.
1979), unless the optimization is constrained by
biological reference points. Either the prey species
are not harvested to provide food for the more
valuable predators, or the predators are sacrificed
for their more valuable prey.
Instead of maximizing the total yield, we can
think of multispecies sustainable yield as a region
in the parameter space defined by the fishing mor-
tality rates of interacting species, within which the
biomass of each species stays above its precaution-
ary level. Conventional theory can provide guid-
ance as to the parameter space in which a
community of species remains sustainable under
different fishing intensities, but additional socio-
economic considerations are necessary to inform
choices of appropriate targets. Using the results of
an MSVPA for the Baltic Sea, Gislason (1999)
identified combinations of pelagic and demersal
fishing effort within which cod, herring and sprat
would all be maintained above their respective
precautionary biomass levels.
Visualization and communication
Ecosystem models that are scientifically sound, tar-
geted at appropriate research questions, and built
around appropriate management reference points
(i.e. near the ‘sweet spot’) will still fail if they are
not communicated adequately to decision-makers.
Even in scientific papers it is difficult to provide all
the details of ecosystem models. The challenge is
to communicate the rationale and assumptions
underlying the model, not just the complex results.
Without adequate communication, visualization of
output, and subsequent model review and discus-
sion, such models are at risk of remaining aca-
demic exercises.
An example of ecosystem model communication
in the U.S. management arena is the incorporation
of food-web models into ecosystem considerations
chapters for stock assessments such as the Bering
Sea walleye pollock stock assessment. In the
© 2014 John Wiley & Sons Ltd, F I SH and F I SHER IES 13
Fishery ecosystem models J S Collie et al.

California Current, an Integrated Ecosystem
Assessment (IEA; Levin et al. 2013) has been one
venue to provide ecosystem context to fishery
managers. The IEA is a science framework to syn-
thesize and analyse natural and socio-economic
information, and present this information in the
context of the goals identified by managers and
stakeholders. This framework has provided oppor-
tunities to present output from a range of ecosys-
tem models and analyses, tailored to focus on key
species. For instance, in a briefing report to the
Pacific Fishery Management Council, Levin and
Wells (2011) distilled outputs from a suite of eco-
system approaches to focus on two primary fishery
target species (Pacific hake, Merluccius productus,
Merlucciidae and sablefish) and two rockfish (Se-
bastes) species of conservation concern. This nar-
row focus is appropriate given the incremental
nature of the shift to ecosystem-based fishery man-
agement and the need for clients of ecosystem
models – usually fishery managers – to identify
scientific and management needs that will shape
development of both tactical and strategic models.
AMOEBA plots have been used to display
changes in fishing mortality, landed value and
spawning stock biomass resulting from changes in
fishing effort in a multispecies, multifleet fishery
(Fig. 3). Ordination was used to give the shape of
the AMOEBAs functional meaning by relating fish
species to the fleets that catch them. The underly-
ing model incorporates both fishing fleet and pred-
ator–prey interactions (Collie et al. 2003). The
vector angles show which species are caught by
which fleets; the vector lengths indicate the mag-
nitude of each variable scaled by a reference level
given by the circle with unit radius. In this North
Sea example, effort levels for multispecies MSY
were obtained by simultaneously maximizing the
trl
sei
sth
ind
pel
btr
othfix
Effort multipliers
HADPOK
SANWHG
NOPHERMAC
SOL
PLE
COD
Fishing mortality rates
trl
sei
sth
ind
pel
btr
oth
fix
Landed value
HADPOK
SAN
WHGNOPHER
MAC
SOL
PLE
COD
Spawning stock biomass
Figure 3 AMOEBA plots for the North Sea with effort levels to maximize the landed value of each fleet. In each
AMOEBA, the circle represents the reference level, and the arrows are the levels predicted with the multispecies model.
Effort and landings were plotted relative to the status quo. Fishing mortality and spawning stock biomass were plotted
relative to their precautionary levels. Broken lines enclose each AMOEBA. The fleet abbreviations are as follows:
btr – beam trawl, fix – fixed gear, ind – industrial trawl, pel – pelagic, sth – saithe trawl, sei – seine net, trl – trawl,
oth – other gears. The species abbreviations are as follows: COD – cod, HAD – haddock, WHG – whiting, POK – saithe,
MAC – mackerel, HER – herring, NOP – Norway pout, SAN – sandeel, PLE – plaice, SOL – sole.
14 © 2014 John Wiley & Sons Ltd, F ISH and F ISHER IES
Fishery ecosystem models J S Collie et al.

landed value of each fleet. Relative to status-quo
effort levels, MSY would involve increasing effort
in the fixed, seine, trawl and saithe fisheries while
decreasing effort in the industrial and pelagic fish-
eries (Fig. 3). This result occurs primarily because
the former group of fleets targets ‘roundfish’,
which are far more valuable than the ‘industrial’
species targeted by the industrial and pelagic fleets.
Furthermore, herring and sandeel (Ammodytes du-
bius, Ammodytidae) are important prey species for
the roundfish. With more forage fish available,
there would be less predation among the round-
fish, thus increasing their yield.
Link et al. (2010) discussed the need for efforts
to improve visualization tools and recommended
further collaboration with cognitive psychologists
and computer visualization experts. In the Califor-
nia Current and Alaska, several recent efforts to
present ecosystem model output in relevant and
useful ways include Ecoviz diagrams (Fig. 4) and
colour-coded ocean condition indices. In practice,
these visualizations often convey status and trends
from model projections, few communicate major
uncertainties (e.g. see Watters et al. 2013). New
graphical interfaces have been developed that
allow the full distributions of parameters estimates
and policy outcomes to be visualized (Booshehrian
et al. 2012).
Existing applications to management
Models with environmental drivers
Characterized by its boom-and-bust dynamics, the
Pacific sardine is one of few species that has been
managed with an explicit consideration of the envi-
ronment in tactical decision-making. A generalized
additive model (GAM) was first used to quantify the
dependence of sardine recruitment on spawning
stock biomass (SSB) and the 3-year running mean
of sea surface temperature (SST, Jacobson and
MacCall 1995). This relationship formed the basis
of a temperature-dependent harvest rule that was
implemented by the Pacific Fishery Management
Council (PFMC 1998). Above a cut-off of
150 000 tons, the allowable catch was a quadratic
function of SST, ranging from 5% of available bio-
mass under cool conditions to 15% for warm SST. A
reanalysis of this relationship with 17 more years of
recruitment data used a temperature-dependent
Ricker model and SST measured from quadrants of
the Pacific Ocean corresponding to the sardine habi-
tat, rather than SST measured at Scripp’s Pier
(McClatchie et al. 2010). This analysis suggested
that the relationship between sardine recruitment
and SST was no longer significant; the temperature-
dependent harvest rule was abandoned in 2012.
Figure 4 Primary food web of sablefish. Major predators are pinnipeds and pelagic sharks (dark blue in the electronic
version of this document). Skates and rays and bocaccio are both prey and predators of sablefish (for instance, juvenile
sablefish may be eaten by bocaccio adults, but adult sablefish may eat juvenile bocaccio). All other species are major prey
items of sablefish (prey coloured green in the electronic version of this document). Position in the y-direction is
approximately related to trophic level. Size of the box is related to biomass of the group. Links between boxes represent
links in the food web; most diet information depicted here involves adult predators. The diagram excludes minor prey items
and predators that inflict small proportions of predation mortality on the focal group. Food-web visualization software
(ECOVIZ 2.3.6) was provided by the author, K. Aydin, NOAA, Alaska Fisheries Science Center, Seattle, WA, USA.
© 2014 John Wiley & Sons Ltd, F I SH and F I SHER IES 15
Fishery ecosystem models J S Collie et al.

A more recent analysis using the same model
formulation as Jacobson and MacCall (1995) with
data from 1981 to 2010 found that both SSB and
SST were significant terms in the GAM (Lindegren
and Checkley 2013). In situ temperatures from the
CalCOFI survey were better predictors of sardine
recruitment than Scripps Pier SST. Apart from the
anomalous 1983 El Ni~no year, the fitted relation-
ships were similar to a temperature-dependent
Ricker model. Weaknesses of these statistical
model approaches are that they assume stationary
relationships, ignore the time-series nature of the
data and do not readily accommodate potential
interactions between the effects of SST and SSB on
recruitment. State-space models provide an alter-
nate approach that allows the relationship been
recruitment and SST to depend on the level of
SSB. State-space models are appropriate for popu-
lations like the California sardine that exhibit non-
linear dynamics (Deyle et al. 2013). Convergent
cross-mapping was used to show that a model
incorporating SST was best able to predict recruit-
ment 1 year in advance.
There are several lessons to take away from this
example. The choice of model structure and the
specification of input variables both affected the
inference about the strength of the recruitment–
environment relationship. Methods should be used
that account for the autocorrelation inherent in
oceanic and coupled biological variables. Statistical
models should be cross-validated by testing their
ability to predict values not included in the origi-
nal fit. Even so, there remains a possibility that
recruitment–environment relationships will
change over time, particularly with altered cli-
matic conditions that have not been observed
before. Coupled environment-fisheries models
therefore need to be periodically updated. Finally,
environmental harvest-control rules need rigorous
simulation testing over a broad range of environ-
mental conditions and plausible model structures.
Multispecies models
A recent simple example from the U.S. west coast
illustrates how ecosystem models at the ends of
the complexity spectrum – very simple and quite
complex – can be used to provide strategic ecosys-
tem advice. In the context of the California Cur-
rent IEA (Levin and Wells 2011), Pacific Fishery
Management Council committees were briefed on
the ecosystem considerations relevant to four har-
vested species: sablefish, Pacific hake, bocaccio and
canary rockfish (Sebastes paucispinis and S. pinneg-
er, Sebastidae). Relatively simple qualitative model-
ling (Dambacher et al. 2009) and a fairly complex
Atlantis model (Horne et al. 2010) were both used
to identify key predators and prey for these four
species. A consensus list of predators and prey was
visualized with the Ecoviz approach developed by
NOAA’s Alaska Fishery Science Center (Fig. 4).
Such conceptual understanding is a first step by
which ecosystem models can inform future man-
agement actions.
The Baltic Sea fish community is relatively sim-
ple, comprising cod, herring and sprat, which lim-
its the number of interactions that need to be
quantified. Multispecies models – first MSVPA and
now the statistical multispecies model SMS – have
been used to provide estimates of predation mor-
tality by cod, which are then used in the single-
species assessments of herring and sprat (Lewy
and Vinther 2004). The SMS model has been used
to project the joint biomass and catch levels in
relation to the fishing mortality rates of the three
species (Fig. 5). With SMS, cod yields would be
maximized at higher fishing mortality rates than
with the corresponding single-species model. The
yields of herring and sprat depend strongly on the
rate of fishing mortality, and hence abundance, of
cod. The Baltic SMS model is providing insight on
multispecies target and limit biomass consider-
ations when considering trade-offs between preda-
tors, prey and cannibalism. The 2013 benchmark
workshop on Baltic Sea multispecies assessments
(WKBALT) ran the single-species and multispecies
models in parallel and used the results to frame
multispecies advice (ICES 2013). The Baltic Sea
provides an example of fisheries management
evolving over several decades from single-species
to a multispecies perspective.
Discussion
Having accepted the basic tenets of ecosystem-
based management (EBFM), governments and
their fishery management agencies around the
globe are facing the challenge of how best to
implement them. Here, we have drawn attention
to a predominant aspect of that challenge, the
question of how the levels of uncertainty in new
models being proposed can be evaluated and how
that information can be used to integrate results
from these models into the management process.
16 © 2014 John Wiley & Sons Ltd, F ISH and F ISHER IES
Fishery ecosystem models J S Collie et al.

The increase in holism that motivates the move
towards EBFM can reduce uncertainty in manage-
ment predictions if the appropriate data are avail-
able, but eventually the increase in the number of
parameters will begin to increase uncertainty.
Here, we have focussed on how the structure of
models creates the need for additional data, rather
than the data collection. Generally the needed data
have begun to accumulate as management agen-
cies focus on the broader range of issues. Informa-
tion on ecosystem functions has also accumulated
from focused large-scale oceanographic research
programmes such as GLOBEC, which have
increased our understanding of marine ecosystem
dynamics (Fogarty et al. 2013). This understand-
ing has been incorporated in a spectrum of ecosys-
tem models that range in their scope and
complexity. Improved ecosystem understanding
would lead to improved fisheries management if
the complex and uncertain science could be trans-
lated into improved decision-making. We list rea-
sons why the results of ecosystem models have had
limited use to date and suggest ways in which their
use in fisheries management could be facilitated.
Progress in following best practices for ecosystem
modelling
We find genuine progress in attempts to follow
best practice in ecosystem modelling, as stated in
the FAO (2008) technical guidelines for responsi-
ble fisheries. The development of models such as
MICE, SMS and GADGET are examples of increas-
ing efforts to account for parameter uncertainty,
model structural uncertainty and implementation
uncertainty. Structural uncertainty is being
0.4 0.5 0.6 0.7
7071
7273
74
Cod
F cod
Cod
yie
ld (1
000
t)
●
●●
●
●●
●
●●
●
●●
●
●
●
●
●
0.2 0.22 0.26 0.3
7071
7273
74
Cod
F herring
Cod
yie
ld (1
000
t)
●
●
●
●
●
●
●
●
●
●
●
●
●
●
●
●
●
●
●
●
●
●
●
●
●
●
●
●
●
●
● ●
●
0.3 0.34 0.38 0.42 0.46 0.5
7071
7273
74
Cod
F sprat
Cod
yie
ld (1
000
t)
0.4 0.5 0.6 0.7
150
160
170
180
Herring
F cod
Her
ring
yiel
d (1
000
t)
0.2 0.22 0.26 0.3
150
160
170
180
Herring
F herring
Her
ring
yiel
d (1
000
t)
0.3 0.34 0.38 0.42 0.46 0.5
150
160
170
180
Herring
F sprat
Her
ring
yiel
d (1
000
t)
0.4 0.5 0.6 0.7
200
210
220
230
240
Sprat
F cod
Spr
at y
ield
(100
0 t)
0.2 0.22 0.26 0.3
200
210
220
230
240
Sprat
F herring
Spr
at y
ield
(100
0 t)
0.3 0.34 0.38 0.42 0.46 0.5
200
210
220
230
240
Sprat
F sprat
Spr
at y
ield
(100
0 t)
Figure 5 Box plots of scenario results of yield at equilibrium from an SMS model (Lewy and Vinther 2004) of the
Baltic Sea for combinations of fishing mortality (F) on the three species. Simulations were conducted with stochastic
recruitment. Figure courtesy of Morten Vinther, DTU.
© 2014 John Wiley & Sons Ltd, F I SH and F I SHER IES 17
Fishery ecosystem models J S Collie et al.

acknowledged by checking whether structurally
different models predict qualitatively similar
results. Uncertainty in functional responses (the
prey–predator interaction term) has been
addressed in several studies (Kinzey and Punt
2009; Gaichas et al. 2012) but is ignored in the
majority of ecosystem model examples. There is
growing use of ecosystem models as part of man-
agement strategy evaluation to assess how well
alternative candidate harvest rules achieve the
objectives sought by management authorities (Fo-
garty 2014).
While more could be done regarding the inde-
pendent review of models, there have been several
large programmes and research projects to com-
pare outputs of different model forms. Progress has
been made on some fronts, but the number of eco-
system models that have been constructed globally
outweighs considerably the effort that has been
put into critical evaluation and review of these
approaches. There are almost no critical reviews of
how well the model predictions performed retro-
spectively, analogous to what is done for single-
species models, but recognizing also the challenges
of collecting data for multispecies assemblages.
Possibly not enough has been done to address the
FAO (2008) recommendation that process error,
arising from natural variation in model parame-
ters, needs to be included in projections when that
variation contributes substantially to uncertainty
in model outcomes.
Finding the sweet spot
What practical criteria can modellers and manag-
ers use to determine whether their models are too
simple or too complex? Models intended for tactical
use should be statistically fit to data with mea-
sures of uncertainty that are propagated from the
model parameters to the variables on which deci-
sions are made (e.g. exploitable biomass, fishing
mortality). Model uncertainty (e.g. different states
of nature) should be considered in addition to the
precision of the preferred model. In models with
multiple species, environmental drivers or human
responses, the mechanisms linking the interacting
components should be identified and supported
with process-oriented studies where available.
In the context of Fig. 1, a model is too simple
when a dynamic component has been omitted or
assumed constant over time (e.g. natural mortal-
ity, spatial distribution), creating bias in the policy
indicator. A model is too complex when its param-
eters cannot be estimated or are severely con-
founded with each other (e.g. |correlation
coefficients| >0.8). Models need to adapt to the
management question and are constrained by the
data available to develop and evaluate them, such
that finding the sweet spot depends on the con-
text. It may not be possible to statistically fit mod-
els to data for data-limited stocks or areas. In
these situations, qualitative models can indicate
the direction of management action instead of a
precise road map with reference levels.
A dialogue between modellers and managers is
required for ecosystem models to gain traction in
the management system. Model variables must be
commensurate with the quantities used to make
decisions, such as exploitable biomass, allowing for
the selectivity of fishing gears. Conversely, the
management system may need to adapt to an eco-
system approach, for example, by adjusting man-
agement boundaries, definitions of stock complexes
or biological reference points. As new policy indi-
cators are identified, model complexity may need
to be adjusted to realign the sweet spot.
Application of ecosystem models to fisheries
management
Integrated ecosystem assessments represent one
approach for furthering the use of ecosystem mod-
els in strategic management contexts. Still, most
such approaches suffer from a weak relationship
between model structure and suitability for address-
ing questions of strategy or tactics. The strength of
climate change signals has brought fishery and
environmental scientists closer together. Funda-
mental changes in ecosystem structure and func-
tion (regime shifts; DeYoung et al. 2008) reveal
inadequacies in classic fisheries models and create
new challenges of detecting ecosystem shifts and
accounting for changing productivity.
There is still a gap between theoretical ecologi-
cal research and its application to fisheries man-
agement. Complexity is introduced, not just by the
number of state variables, but also by the nature
of interactions among these variables. Complex
models can be solved numerically without fully
understanding their dynamical properties. We rec-
ognize the need for greater theoretical underpin-
ning of multispecies models, but not much has
been done since the seminal work of May et al.
(1979).
18 © 2014 John Wiley & Sons Ltd, F ISH and F ISHER IES
Fishery ecosystem models J S Collie et al.
Several misconceptions about ecosystem model-
ling may hinder its application to fisheries manage-
ment, but there are also true impediments.
Management agencies respond primarily to the
legal mandates that govern their operation. With-
out a mandate, ecosystem considerations are likely
to receive lower priority than other issues. In some
regions, action on fishery ecosystem plans has been
postponed by more pressing issues like rebuilding
overfished stocks. Management agencies receive
much more scrutiny of the decisions they make
(‘sins of commission’) than issues they ignore (‘sins
of omission’), which leads to a natural tendency to
consider only the essential elements.
Ecosystem models are considered by many to be
too complex for tactical management use (Fogarty
2014). Data needs increase with increasing com-
plexity, and the types of data required shift as a
model is used for strategic vs. tactical manage-
ment. Many feel that fisheries management is
complicated enough without adding another layer
of complexity. Further, our understanding of key
environmental linkages and species interactions
may be adequate for general understanding and
strategic evaluation of the long-term effects of
management actions, but still may be too uncer-
tain for tactical decision-making. A case in point is
the temperature-dependent harvest rule for Pacific
sardine. Management agencies may be reluctant
to implement ecosystem-based harvest strategies
until there is a higher level of confidence in the
underlying relationships. Rigorous and context-
specific model testing is necessary for the high
degree of model credibility that is required in order
for tactical decisions to be defensible.
Finally, there is a hesitation to use ecosystem
models for fisheries management decisions because
of the lack of detailed understanding of the models
by those charged to perform the assessments and
those who make the decisions. As stock assess-
ments become more sophisticated, assessment sci-
entists tend to focus more on the technical aspects
of parameter estimation and less on the underly-
ing ecological processes (Dickey-Collas et al.
2013). There is concern that incorporation of
environmental considerations will invariably lead
to more precautionary reference points and
reduced fishing opportunities. There is also a more
general fear of unknown outcomes, for example,
that the outcomes of multispecies management
advice could differ from the status quo in ways
that seem risky or alter the allocation of species
quotas. As understanding of ecosystem models
grows, these general perceptions need to be tested
with specific applications and the outcomes effec-
tively communicated.
Summary and conclusions
The recent push towards ecosystem-based fisheries
management has motivated considerable develop-
ment, implementation and testing of ecosystem
models. We presented in this paper the required
characteristics of ecosystem models and issues that
need to be addressed, especially the challenge of
increasing complexity. Depending on management
needs, moving from single-species management to
an ecosystem basis means that the complexity of
models can develop in four main ways: by adding
population structure, environmental influences,
trophic interactions and human interactions.
Increased availability and resolution of environ-
mental data has permitted the development of
mechanistic models representing the relationship
between the environmental and the biological
responses at appropriate spatial and temporal
scales. An ecosystem approach requires more com-
plete economic accounting because it makes the
trade-offs among competing resource uses more
explicit. Along the complexity continuum, there is
a sweet spot at intermediate complexity that bal-
ances model bias with parameter uncertainty.
Finding the sweet spot depends on effort, cost
and data to construct the models as well as the
key scientific questions asked or management poli-
cies being considered. Ecosystem models can be
used for strategic or tactical purposes, with the
output of strategic models providing context for
tactical management decisions. Complex ecosystem
models can also be used as operating models in
management strategy evaluations. Models of inter-
mediate complexity, which incorporate the impor-
tant ecosystem components with strong links, will
ultimately be most useful to specify harvest guide-
lines. Among other considerations, they need to be
statistically fit to data and account for structural
uncertainty (e.g. predator functional responses).
Precautionary and dynamic approaches exist for
determining multispecies biological reference
points. In an ecosystem context, the concept of
maximum sustainable yield can be replaced with
multispecies sustainable yield – the region of har-
vest rates within which all species are maintained
at sustainable levels. Methods exist to visualize the
© 2014 John Wiley & Sons Ltd, F I SH and F I SHER IES 19
Fishery ecosystem models J S Collie et al.

consequences of different combinations of harvest
rates within this sustainable region.
Ecosystem models are increasingly being used to
inform management by providing system-level con-
text, and in some cases, for strategic management
analyses. However, the use of ecosystem models in
tactical decision-making in fisheries management
has been slow to develop because the uncertainties
in model outputs do not allow sufficient confidence
for specific management decisions and because get-
ting new methods fully incorporated into the regu-
latory structure of marine fisheries management is
difficult. There are increasing numbers of examples
where single-species methods have been expanded
to include the effects of other species (mortality
rates) and environment influences on recruitment.
Age-structured, multispecies models are presently
being used to provide tactical advice in the Baltic
Sea, Barents Sea and elsewhere. But there is a large
gap from these enhancements of single-species
analyses to a full ecosystem-based evaluation. Facil-
itating the adoption of ecosystem models in fisheries
management requires critical evaluations of differ-
ent model forms and independent reviews of these
approaches. Finding the sweet spot of minimal
uncertainty will accelerate the use of ecosystem
models for strategic analyses and generate momen-
tum for their greater use in tactical decision-
making.
Acknowledgements
This article resulted from a workshop on Quantita-
tive Approaches to Ecosystem Assessment, hosted
by the Coastal and Marine Sciences Institute at UC
Davis. The workshop was funded by GLOBEC and
held at Bodega Bay, CA on 2–4 May 2012. It also
benefited from discussions with members of the
Ecosystem Science and Management Working
Group and participants in an ‘Ecosystem Outputs’
workshop in Woods Hole on 30–31 July 2013.
Tessa Francis and Iris Gray assisted with the fig-
ures. We thank Michael Fogarty, Marie-Jo€elle
Rochet and two anonymous reviewers for their
helpful comments on earlier drafts. US GLOBEC
Contribution Number 748.
References
Andersen, K.H. and Pedersen, M. (2010) Damped trophic
cascades driven by fishing in model marine ecosys-
tems. Proceedings of the Royal Society B 277, 795–802.
Andersen, K.P. and Ursin, E. (1977) A multispecies
extension of the Beverton and Holt theory of fishing,
with accounts of phosphorus circulation and primary
production. Meddelelser fra Danmarks Fiskeri-og Havun-
dersøgelser 7, 319–435.
Aydin, K.Y., Gaichas, S.K., Ortiz, I. and Friday, N.
(2007) A comparison of the Bering Sea, Gulf of
Alaska, and Aleutian Islands large marine ecosystems
through food web modeling. NOAA Technical Memoran-
dum NMFS-AFSC-178.
Barange, M.A., Field, J.G., Harris, R.H., Hofmann, E., Perry,
R.I. andWerner, F.E., eds. (2010) Global Change and Mar-
ine Ecosystems. Oxford University Press, Oxford, p. 464.
Beamish, R.J. and Mahnken, C. (2001) A critical size and
period hypothesis to explain natural regulation of sal-
mon abundance and the linkage to climate and cli-
mate change. Progress in Oceanography 49, 423–437.
Benoıt, E. and Rochet, M.-J. (2004) A continuous model
of biomass size spectra governed by predation, and the
effects of fishing on them. Journal of Theoretical Biology
226, 9–21.
Beverton, R.J.H. and Holt, S. (1957) On the dynamics of
exploited fish populations. Fishery Investigations (Vol
57). London.
Bi, H., Ruppel, R.E., Peterson, W.T. and Casillas, E.
(2008) Spatial distribution of ocean habitat of yearling
Chinook (Oncorhynchus tshawytscha) and coho
(Oncorhynchus kisutch) salmon off Washington and
Oregon, USA. Fisheries Oceanography 17, 463–476.
Bograd, S.J., Schroeder, I., Sarkar, N., Qiu, X., Sydeman,
W.J. and Schwing, F.B. (2009) Phenology of coastal
upwelling in the California Current. Geophysical
Reseach Letters 36, L01602.
Booshehrian, M., M€oller, T., Peterman, R.M. and Munzner,
T. (2012) Vismon: facilitating analysis of trade-offs,
uncertainty, and sensitivity in fisheries management
decision making. Proceedings of Eurographics Conference
on Visualization 2012 31, 1235–1244.
Botsford, L.W., Castilla, J.C. and Peterson, C.H. (1997)
The management of fisheries and marine ecosystems.
Science 277, 509–515.
Botsford, L.W., Hastings, A. and Gaines, S.D. (2001)
Dependence of sustainability on the configuration of
marine reserves and larval dispersal distance. Ecology
Letters 4, 144–150.
Botsford, L.W., Holland, M.D., Samhouri, J.F., White,
J.W. and Hastings, A. (2011) Importance of age struc-
ture in models of the response of upper trophic levels
to fishing and climate change. ICES Journal of Marine
Science 68, 1270–1283.
Brown, B.E., Brennan, J.A., Grosslein, M.D., Heyerdahl,
E.G. and Hennemuth, R.C. (1976) The effect of fishing
on the marine finfish biomass in the Northwest Atlantic
from the Gulf of Maine to Cape Hatteras. International
Commission for the Northwest Atlantic Fisheries Research
Bulletin 12, 49–68.
20 © 2014 John Wiley & Sons Ltd, F ISH and F ISHER IES
Fishery ecosystem models J S Collie et al.
Caddy, J. and Gulland, J.A. (1983) Historical patterns of
fish stocks. Marine Policy 7, 267–278.
Caswell, H. (2001) Matrix Population Models, 2nd edn. Si-
nauer Associates Inc., Sunderland, MA.
Chassot, E., Bonhommeau, S., Reygondeau, G. et al.
(2011) Satellite remote sensing for an ecosystem
approach to fisheries management. ICES Journal of
Marine Science 68, 651–666.
Collie, J.S. and Gislason, H. (2001) Biological reference
points for fish stocks in a multispecies context. Cana-
dian Journal of Fisheries and Aquatic Sciences 58, 2167–
2176.
Collie, J.S., Gislason, H. and Vinther, M. (2003) Using
AMOEBAs to display multispecies, multifleet fisheries
advice. ICES Journal of Marine Science 60, 709–720.
Curti, K.L., Collie, J.S., Legault, C. and Link, J.S. (2013)
Evaluating the performance of a multispecies statistical
catch-at-age model. Canadian Journal of Fisheries and
Aquatic Sciences 70, 470–484.
Cury, P.M., Shin, Y.J., Planque, B. et al. (2008) Ecosys-
tem oceanography for global change in fisheries.
Trends in Ecology and Evolution 23, 338–346.
Dambacher, J., Gaughan, D.J., Rochet, M.-J., Rossignol,
P.A. and Trenkel, V.M. (2009) Qualitative modelling
and indicators of exploited ecosystems. Fish and Fisher-
ies 10, 305–322.
DeAngelis, D. and Mooij, W.M. (2005) Individual-based
modeling of ecological and evolutionary processes.
Annual Review of Ecology, Evolution, and Systematics 36,
147–168.
Deyle, E.R., Fogarty, M., Hsieh, C. et al. (2013) Predict-
ing climate effects on Pacific sardine. Proceedings of the
National Academy of Sciences 110, 6430–6435.
DeYoung, C.A., Charles, A. and Hjort, A. (2008) Human
dimensions of the ecosystem approach to fisheries: an
overview of context, concepts, tools, and methods.
FAO Fisheries Technical Paper 489, 152 pp. Food and
Agriculture Organization of the United Nations, Rome.
Dichmont, C.M., Deng, R., Punt, A.E. et al. (2008)
Beyond biological performance measures in manage-
ment strategy evaluation: bringing in economics and
the effects of trawling on the benthos. Fisheries
Research 94, 238–250.
Dichmont, C.M., Pascoe, S., Kompas, T., Punt, A.E. and
Deng, R. (2010) On implementing maximum economic
yield in commercial fisheries. Proceedings of the National
Academy of Science United States of America 107, 16–
21.
Dickey-Collas, M., Payne, M.R., Trenkel, V.M. and Nash,
R.D.M. (2013) Hazard warning: model misuse ahead.
ICES Journal of Marine Science. doi:10.1093/icesjms/
fst215.
Diedrich, A., Tintor�e, J. and Navin�es, F. (2010) Balanc-
ing science and society through establishing indicators
for integrated coastal zone management in the Balearic
Islands. Marine Policy 34, 771–781.
Ecosystem Assessment Program (2009) Ecosystem Status
Report for the Northeast US Continental Shelf Large
Marine Ecosystem. Center Reference Document 09-11,
61 pp. Northeast Fisheries Science Center, Woods
Hole, MA.
Essington, T.E. and Punt, A.E. (2011) Implementing eco-
system-based fisheries management: advances, chal-
lenges and emerging tools. Fish and Fisheries 12, 123–
124.
FAO (2008) Fisheries management. 2. The ecosystem
approach to fisheries. 2.1 Best practices in ecosystem
modelling for informing an ecosystem approach to fisher-
ies. (Technical Guidelines No. 4, Suppl. 2, Add. 1), FAO
Technical Guidelines for Responsible Fisheries. FAO, Rome.
Fogarty, M.J. (2014) The art of ecosystem-based fishery
management. Canadian Journal of Fisheries and Aquatic
Sciences 71, 479–490.
Fogarty, M.J., Botsford, L.W. and Werner, F.E. (2013)
Legacy of the US GLOBEC Program: current and poten-
tial contributions to marine ecosystem-based manage-
ment. Oceanography 26, 116–127.
Francis, R.I.C.C. (2011) Data weighting in statistical fish-
eries stock assessment models. Canadian Journal of Fish-
eries and Aquatic Sciences 68, 1124–1138.
Friedland, K.D., Hansen, L.P. and Dunkley, D.A. (1998)
Marine temperatures experienced by postsmolts and
the survival of Atlantic salmon, Salmo salar L., in the
North Sea area. Fisheries Oceanography 7, 22–34.
Fulton, E. (2004) Biogeochemical marine ecosystem
models II: the effect of physiological detail on model
performance. Ecological Modelling 173, 371–406.
Fulton, E.A. (2010) Approaches to end-to-end ecosystem
models. Journal of Marine Systems 81, 171–183.
Fulton, E.A. (2011) Interesting times: winners, losers,
and system shifts under climate change around Aus-
tralia. ICES Journal of Marine Science 68, 1329–1342.
Fulton, E.A., Smith, A.D.M. and Johnson, C.R. (2003)
Mortality and predation in ecosystem models: is it
important how these are expressed? Ecological Model-
ling 169, 157–178.
Fulton, E.A., Smith, A.D.M. and Punt, A.E. (2005)
Which ecological indicators can robustly detect effects
of fishing? ICES Journal of Marine Science 62, 540–551.
Fulton, E.A., Link, J.S., Kaplan, I.C. et al. (2011a) Les-
sons in modelling and management of marine ecosys-
tems: the Atlantis experience. Fish and Fisheries 12,
171–188.
Fulton, E.A., Smith, A.D.M., Smith, D.C. and van Putten,
I.E. (2011b) Human behaviour: the key source of
uncertainty in fisheries management. Fish and Fisheries
12, 2–17.
Fulton, E.A., Smith, A.D.M., Smith, D.C. and Johnson, P.
(2014) An integrated approach is needed for ecosystem
based fisheries management: insights from ecosystem-
level management strategy evaluation. Public Library of
Science ONE 9, e84242.
© 2014 John Wiley & Sons Ltd, F I SH and F I SHER IES 21
Fishery ecosystem models J S Collie et al.
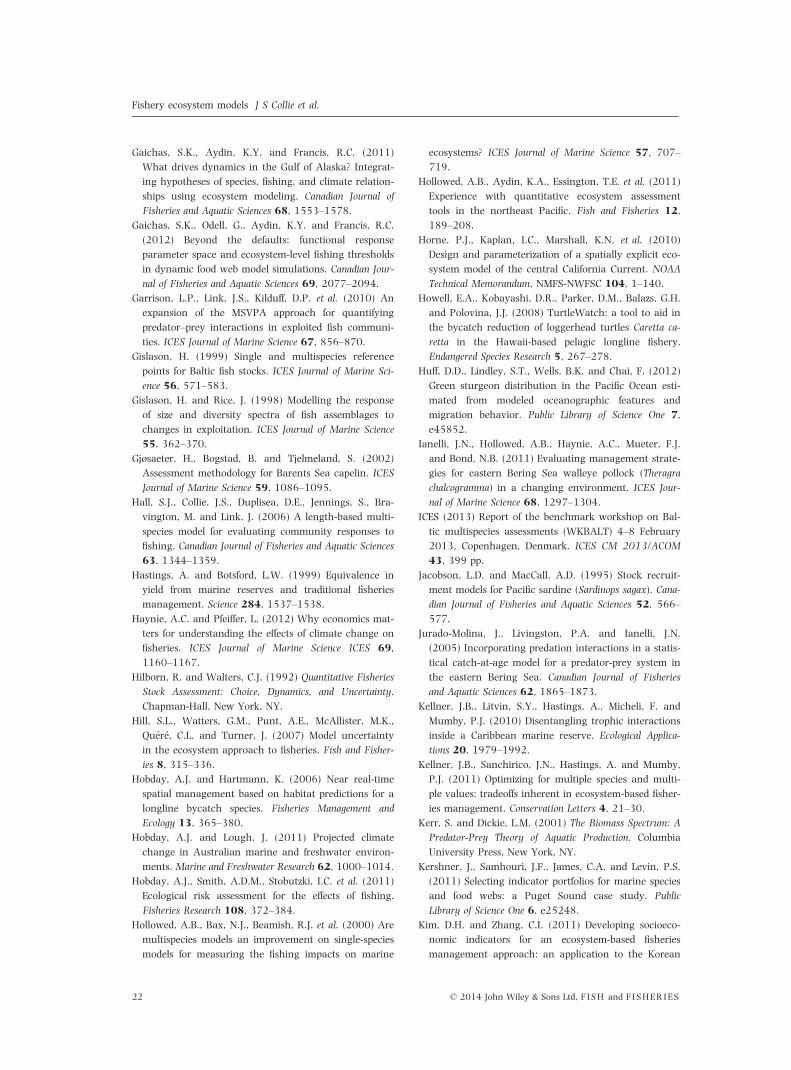
Gaichas, S.K., Aydin, K.Y. and Francis, R.C. (2011)
What drives dynamics in the Gulf of Alaska? Integrat-
ing hypotheses of species, fishing, and climate relation-
ships using ecosystem modeling. Canadian Journal of
Fisheries and Aquatic Sciences 68, 1553–1578.
Gaichas, S.K., Odell, G., Aydin, K.Y. and Francis, R.C.
(2012) Beyond the defaults: functional response
parameter space and ecosystem-level fishing thresholds
in dynamic food web model simulations. Canadian Jour-
nal of Fisheries and Aquatic Sciences 69, 2077–2094.
Garrison, L.P., Link, J.S., Kilduff, D.P. et al. (2010) An
expansion of the MSVPA approach for quantifying
predator–prey interactions in exploited fish communi-
ties. ICES Journal of Marine Science 67, 856–870.
Gislason, H. (1999) Single and multispecies reference
points for Baltic fish stocks. ICES Journal of Marine Sci-
ence 56, 571–583.
Gislason, H. and Rice, J. (1998) Modelling the response
of size and diversity spectra of fish assemblages to
changes in exploitation. ICES Journal of Marine Science
55, 362–370.
Gjøsaeter, H., Bogstad, B. and Tjelmeland, S. (2002)
Assessment methodology for Barents Sea capelin. ICES
Journal of Marine Science 59, 1086–1095.
Hall, S.J., Collie, J.S., Duplisea, D.E., Jennings, S., Bra-
vington, M. and Link, J. (2006) A length-based multi-
species model for evaluating community responses to
fishing. Canadian Journal of Fisheries and Aquatic Sciences
63, 1344–1359.
Hastings, A. and Botsford, L.W. (1999) Equivalence in
yield from marine reserves and traditional fisheries
management. Science 284, 1537–1538.
Haynie, A.C. and Pfeiffer, L. (2012) Why economics mat-
ters for understanding the effects of climate change on
fisheries. ICES Journal of Marine Science ICES 69,
1160–1167.
Hilborn, R. and Walters, C.J. (1992) Quantitative Fisheries
Stock Assessment: Choice, Dynamics, and Uncertainty.
Chapman-Hall, New York, NY.
Hill, S.L., Watters, G.M., Punt, A.E., McAllister, M.K.,
Qu�er�e, C.L. and Turner, J. (2007) Model uncertainty
in the ecosystem approach to fisheries. Fish and Fisher-
ies 8, 315–336.
Hobday, A.J. and Hartmann, K. (2006) Near real-time
spatial management based on habitat predictions for a
longline bycatch species. Fisheries Management and
Ecology 13, 365–380.
Hobday, A.J. and Lough, J. (2011) Projected climate
change in Australian marine and freshwater environ-
ments. Marine and Freshwater Research 62, 1000–1014.
Hobday, A.J., Smith, A.D.M., Stobutzki, I.C. et al. (2011)
Ecological risk assessment for the effects of fishing.
Fisheries Research 108, 372–384.
Hollowed, A.B., Bax, N.J., Beamish, R.J. et al. (2000) Are
multispecies models an improvement on single-species
models for measuring the fishing impacts on marine
ecosystems? ICES Journal of Marine Science 57, 707–
719.
Hollowed, A.B., Aydin, K.A., Essington, T.E. et al. (2011)
Experience with quantitative ecosystem assessment
tools in the northeast Pacific. Fish and Fisheries 12,
189–208.
Horne, P.J., Kaplan, I.C., Marshall, K.N. et al. (2010)
Design and parameterization of a spatially explicit eco-
system model of the central California Current. NOAA
Technical Memorandum, NMFS-NWFSC 104, 1–140.
Howell, E.A., Kobayashi, D.R., Parker, D.M., Balazs, G.H.
and Polovina, J.J. (2008) TurtleWatch: a tool to aid in
the bycatch reduction of loggerhead turtles Caretta ca-
retta in the Hawaii-based pelagic longline fishery.
Endangered Species Research 5, 267–278.
Huff, D.D., Lindley, S.T., Wells, B.K. and Chai, F. (2012)
Green sturgeon distribution in the Pacific Ocean esti-
mated from modeled oceanographic features and
migration behavior. Public Library of Science One 7,
e45852.
Ianelli, J.N., Hollowed, A.B., Haynie, A.C., Mueter, F.J.
and Bond, N.B. (2011) Evaluating management strate-
gies for eastern Bering Sea walleye pollock (Theragra
chalcogramma) in a changing environment. ICES Jour-
nal of Marine Science 68, 1297–1304.
ICES (2013) Report of the benchmark workshop on Bal-
tic multispecies assessments (WKBALT) 4–8 February
2013, Copenhagen, Denmark. ICES CM 2013/ACOM
43, 399 pp.
Jacobson, L.D. and MacCall, A.D. (1995) Stock recruit-
ment models for Pacific sardine (Sardinops sagax). Cana-
dian Journal of Fisheries and Aquatic Sciences 52, 566–
577.
Jurado-Molina, J., Livingston, P.A. and Ianelli, J.N.
(2005) Incorporating predation interactions in a statis-
tical catch-at-age model for a predator-prey system in
the eastern Bering Sea. Canadian Journal of Fisheries
and Aquatic Sciences 62, 1865–1873.
Kellner, J.B., Litvin, S.Y., Hastings, A., Micheli, F. and
Mumby, P.J. (2010) Disentangling trophic interactions
inside a Caribbean marine reserve. Ecological Applica-
tions 20, 1979–1992.
Kellner, J.B., Sanchirico, J.N., Hastings, A. and Mumby,
P.J. (2011) Optimizing for multiple species and multi-
ple values: tradeoffs inherent in ecosystem-based fisher-
ies management. Conservation Letters 4, 21–30.
Kerr, S. and Dickie, L.M. (2001) The Biomass Spectrum: A
Predator-Prey Theory of Aquatic Production. Columbia
University Press, New York, NY.
Kershner, J., Samhouri, J.F., James, C.A. and Levin, P.S.
(2011) Selecting indicator portfolios for marine species
and food webs: a Puget Sound case study. Public
Library of Science One 6, e25248.
Kim, D.H. and Zhang, C.I. (2011) Developing socioeco-
nomic indicators for an ecosystem-based fisheries
management approach: an application to the Korean
22 © 2014 John Wiley & Sons Ltd, F ISH and F ISHER IES
Fishery ecosystem models J S Collie et al.

large purse seing fishery. Fisheries Research 112,
134–139.
Kimbrough, K.L., Lauenstein, G.G., Christensen, J.D. and
Apeti, D.A. (2008) An assessment of two decades of
contaminant monitoring in the Nation’s Coastal Zone.
NOAA Technical Memorandum NOS-NCCOS 74.
Kinzey, D. and Punt, A.E. (2009) Multispecies and sin-
gle-species models of fish population dynamics: com-
paring parameter estimates. Natural Resource Modeling
22, 67–104.
Kruse, G.H., Browman, H.I., Cochrane, K.L. et al., eds.
(2012) Global Progress in Ecosystem-Based Fisheries
Management. Alaska Sea Grant, University of Alaska
Fairbanks, AK-SG-12-01PDF.
Levin, P.S. and Wells, B. (2011) Development of an
annual report on conditions in the California Current
ecosystem, Briefing Book, November 2011, Agenda
Item H.1.b. Pacific Fishery Management Council, Port-
land, Oregon.
Levin, P.S., Fogarty, M.J., Murawski, S.A. and Fluharty,
D. (2009) Integrated ecosystem assessments: develop-
ing the scientific basis for ecosystem-based manage-
ment of the ocean. Public Library of Science Biology 7,
e1000014.
Levin, P.S., Kelble, C.R., Shuford, R.L. et al. (2013) Guid-
ance for implementation of integrated ecosystem
assessments: a US perspective. ICES Journal of Marine
Science. doi:10.1093/icesjms/fst112.
Lew, D., Layton, D. and Rowe, R. (2010) Valuing
enhancements to endangered species protection under
alternative baseline tutures: the case of the Steller sea
lion. Marine Resource Economics 25, 133–154.
Lewy, P. and Vinther, M. (2004) A stochastic age-
length-structured multi-species model applied to North
Sea stocks. ICES CM 2004/FF: 19.
Lindegren, M. and Checkley, D.M. (2013) Temperature
dependence of Pacific sardine (Sardinops sagax) recruit-
ment in the California Current ecosystem revisited and
revised. Canadian Journal of Fisheries and Aquatic Sci-
ences 70, 245–252.
Link, J.S. (2005) Translating ecosystem indicators into
decision criteria. ICES Journal of Marine Science 62,
569–576.
Link, J.S., Ihde, T.F., Townsend, H.M. et al. (2010) Report
of the 2nd national ecosystem modeling workshop: bridging
the credibility gap dealing with uncertainty in ecosystem
models. U.S. Department of Commerce, National Oce-
anic and Atmospheric Administration, National Mar-
ine Fisheries Service.
Livingston, P.A., Aydin, K., Boldt, J., Ianelli, J. and Jura-
do-Molina, J. (2005) A framework for ecosystem
impacts assessment using an indicator approach. ICES
Journal of Marine Science 62, 592–597.
Livingston, P.A., Aydin, K., Boldt, J.L., Hollowed, A.B.
and Napp, J.M. (2011a) Alaska marine fisheries man-
agement: advances and linkages to ecosystem
research. In: Ecosystem Based Management: An Evolving
Perspective (eds A. Belgrano and C. Fowler). Cambridge
University Press, New, York, pp. 113–152.
Livingston, P.A., Kruse, G.H. and Richards, L.J. (2011b)
Progress toward ecosystem-based approaches for the
assessment of fisheries under data-limited situations.
Fisheries Research 112, 105–107.
Logerwell, E.A., Mantua, N.J., Lawson, P.W., Francis,
R.C. and Agostini, V.N. (2003) Tracking environmen-
tal processes in the coastal zone for understanding and
predicting Oregon coho (Oncorhynchus kisutch) marine
survival. Fisheries Oceanography 12, 554–568.
Marasco, R.J., Goodman, D., Grimes, C.B., Lawson, P.W.,
Punt, A.E. and Quinn, T.J. (2007) Ecosystem-based
fisheries management: some practical suggestions.
Canadian Journal of Fisheries and Aquatic Sciences 64,
928–939.
Maunder, M.N. and Watters, G.M. (2003) A general
framework for integrating environmental time series
into stock assessment models: model description, simula-
tion testing, and example. Fishery Bulletin 101, 89–99.
May, R.M., Beddington, J.R., Clark, C.W., Holt, S.J. and
Laws, R.M. (1979) Management of multispecies fisher-
ies. Science 405, 267–276.
McClatchie, S., Goericke, R., Auds, G. and Hill, K. (2010)
Re-assessment of the stock-recruit and temperature-
recruit relationships for Pacific sardine (Sardinops
sagax). Canadian Journal of Fisheries and Aquatic Sciences
67, 1782–1790.
Mori, M. and Butterworth, D.S. (2006) A first step
towards modelling the krill–predator dynamics of the
Antarctic ecosystem. CCAMLR Science 13, 217–277.
Morrison Paul, C.J., Felthoven, R.G. and Torres, M.O.
(2010) Productive performance in fisheries: modeling,
measurement, and management. Australian Journal of
Agricultural and Resource Economics 54, 343–360.
Mueter, F.J. and Megrey, B.A. (2006) Using multi-species
surplus production models to estimate ecosystem-level
maximum sustainable yields. Fisheries Research 81,
189–201.
Mumby, P.J., Harborne, A.R., Williams, J. et al. (2007)
Trophic cascade facilitates coral recruitment in a mar-
ine reserve. Proceedings of the National Academy of Sci-
ences 104, 8362–8367.
Myers, R. (1998) When do environment–recruitment
correlations work? Reviews in Fish Biology and Fisheries
8, 285–305.
Nye, J., Link, J., Hare, J. and Overholtz, W. (2009)
Changing spatial distribution of fish stocks in relation
to climate and population size on the Northeast United
States continental shelf. Marine Ecology Progress Series
393, 111–129.
Pascoe, S. (1997) Bycatch management and the econom-
ics of discarding. FAO Fisheries Technical Paper 370.
Paterson, B., Isaacs, M., Hara, M., Jarre, A. and Moloney,
C.L. (2010) Transdisciplinary co-operation for an eco-
© 2014 John Wiley & Sons Ltd, F I SH and F I SHER IES 23
Fishery ecosystem models J S Collie et al.

system approach to fisheries: a case study from the
South African sardine fishery. Marine Policy 34, 782–
794.
PFMC (Pacific Fishery Management Council) (1998) Amend-
ment 8 (to the Northern Anchovy Fishery Management Plan)
Incorporating a Name Change to the Coastal Pelagic Species
Fishery Management Plan. Pacific Fishery Management
Council, Portland, OR. Available at: http://www.pcouncil.
org/coastal-pelagic-species/fishery-management-plan-and-
amendments/amendment-8/ (accessed 13 August 2014).
Pikitch, E.K., Santora, C., Boyd, I.L. et al. (2004) Ecosys-
tem-based fishery management. Science 305, 346–
347.
Plag�anyi, E.E. and Butterworth, D.S. (2004) A critical
look at the potential of Ecopath with Ecosim to assist
in practical fisheries management. African Journal of
Marine Science 26, 261–287.
Plag�anyi, E.E. and Butterworth, D.S. (2012) The Scotia
Sea krill fishery and its possible impacts on dependent
predators - modelling localized depletion of prey. Eco-
logical Applications 22, 748–761.
Plag�anyi, E.E., Bell, J.D., Bustamante, J.M. et al. (2011a)
Modelling climate-change effects on Australian and
Pacific aquatic ecosystems: a review of analytical tools
and management implications. Marine and Freshwater
Research 62, 1132–1147.
Plag�anyi, E.E., Weeks, S.J., Skewes, M.T. et al. (2011b)
Assessing the adequacy of current fisheries manage-
ment under changing climate: a southern synopsis.
ICES Journal of Marine Science 68, 1305–1317.
Plag�anyi, �E.E., van Putten, I., Hutton, T. et al. (2013)
Integrating indigenous livelihood and lifestyle objec-
tives in managing a natural resource. Proceedings of
the National Academy of Sciences 110, 3639–3644.
Plag�anyi, �E.E., Punt, A.E., Hillary, R. et al. (2014) Multi-
species fisheries management and conservation: tacti-
cal applications using models of intermediate
complexity. Fish and Fisheries 15, 1–22.
Planque, B., Fromentin, J.M., Cury, P. et al. (2010) How
does fishing alter marine populations and ecosystems
sensitivity to climate? Journal of Marine Systems 79,
403–417.
Pope, J.G., Rice, J.C., Daan, N., Jennings, S. and Gislason,
H. (2006) Modelling an exploited marine fish commu-
nity with 15 parameters – results from a simple size-
based model. ICES Journal of Marine Science 63, 1029–
1044.
Quinn, T.J. and Deriso, R.B. (1999) Quantitative Fish
Dynamics. Oxford University Press, Oxford, p. 542.
Raemaekers, S., Hauck, M., Burgener, M. et al. (2011)
Review of the causes of the rise of the illegal South
African abalone fishery and consequent closure of the
rights-based fishery. Ocean and Coastal Management 54,
433–445.
Ralston, S., Punt, A.E., Hamel, O.S., DeVore, J.D. and
Conser, R.J. (2011) A meta-analytic approach to quan-
tifying scientific uncertainty in stock assessments. Fish-
ery Bulletin 109, 217–231.
Reiss, C.S., Checkley, D.M. and Bograd, S.J. (2008)
Remotely sensed habitat of Pacific sardine (Sardinops
sagax) and Northern anchovy (Engraulis mordax)
within the California Current. Fisheries Oceanography
17, 126–136.
Rollefsen, G. (1954) Observations on the cod and cod
fisheries of Lofoten. Rapports et Proc�es-Verbaux des
R�eunions du Conseil permanent international pour l’Explo-
ration de la Mer 136, 40–47.
Sainsbury, K. (2000) Design of operational management
strategies for achieving fishery ecosystem objectives.
ICES Journal of Marine Science 57, 731–741.
Samhouri, J.F., Levin, P.S., Andrew James, C., Kershner, J.
and Williams, G. (2011) Using existing scientific capac-
ity to set targets for ecosystem-based management: a
Puget Sound case study. Marine Policy 35, 508–518.
Samhouri, J.F., Lester, S.E., Selig, E.R. et al. (2012) Sea
sick? Setting targets to assess ocean health and ecosys-
tem services. Ecosphere 3, art41.
Santora, J.A., Sydeman, W.J., Schroeder, I.D., Wells,
B.K. and Field, J.C. (2011) Mesoscale structure and
oceanographic determinants of krill hotspots in the
California Current: implications for trophic transfer
and conservation. Progress in Oceanography 91, 397–
409.
Satterthwaite, W.H., Mohr, M.S. and Wells, B.K. (2012)
A Bayesian hierarchical model of size at age in ocean-
harvested stocks – quantifying effects of climate and
temporal variability. Canadian Journal of Fisheries and
Aquatic Sciences 69, 942–954.
Schaefer, M.B. (1954) Some aspects of the dynamics of
populations important to the management of the com-
mercial marine fisheries. Bulletin of the Inter-American
Tropical Tuna Commision 1, 27–56.
Scheuerell, M.D. and Williams, J.G. (2005) Forecasting
climate induced changes in the survival of Snake River
spring/summer Chinook salmon (Oncorhynchus
tshawytscha). Fisheries Oceanography 14, 448–457.
Schirripa, M.J., Goodyear, C.P. and Methot, R.M. (2009)
Testing different methods of incorporating climate data
into the assessment of US West Coast sablefish. ICES
Journal of Marine Science 66, 1605–1613.
Sepez, J., Norman, K. and Felthoven, R. (2007) A quanti-
tative model for identifying and ranking communities
involved in commercial fisheries. National Association of
Practicing Anthropologists Bulletin 28, 43–56.
Seung, C. and Waters, E. (2010) Impacts of recent
shocks to Alaska fisheries: a computable general equi-
librium (CGE) model analysis. Marine Resource Econom-
ics 25, 155–183.
Seung, C. and Zhang, C.I. (2011) Developing socioeco-
nomic indicators for fisheries off Alaska: a multi-attri-
bute utility function approach. Fisheries Research 112,
117–126.
24 © 2014 John Wiley & Sons Ltd, F ISH and F ISHER IES
Fishery ecosystem models J S Collie et al.
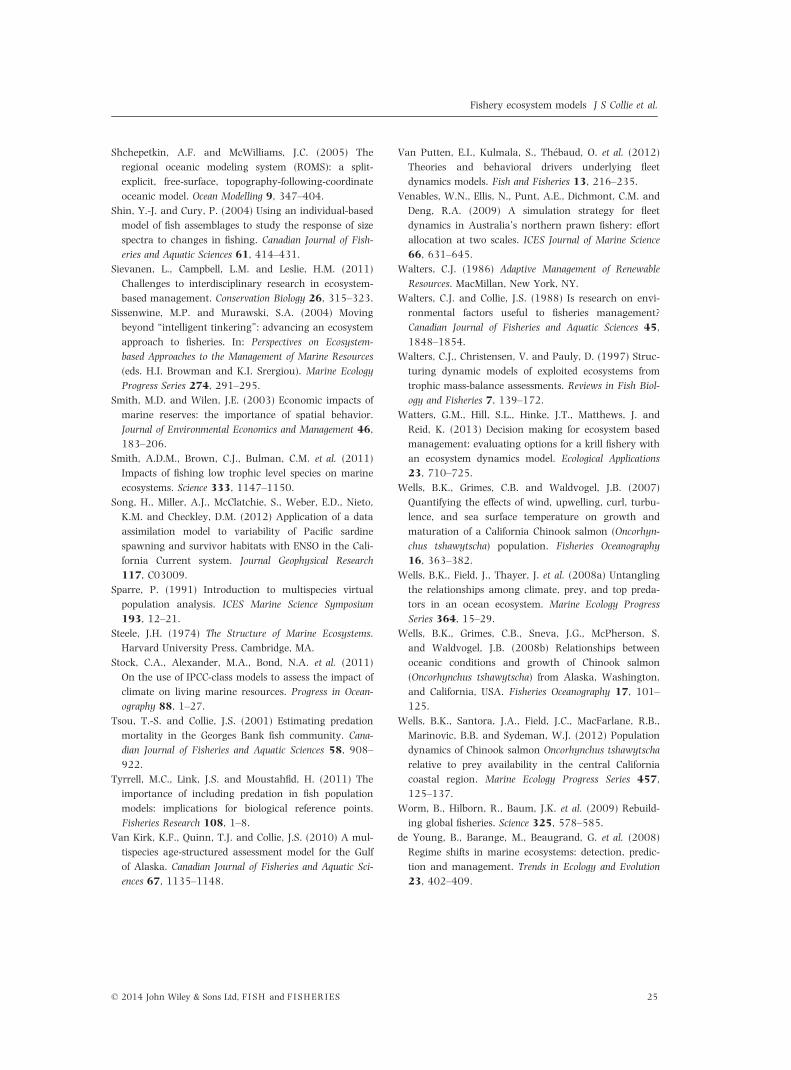
Shchepetkin, A.F. and McWilliams, J.C. (2005) The
regional oceanic modeling system (ROMS): a split-
explicit, free-surface, topography-following-coordinate
oceanic model. Ocean Modelling 9, 347–404.
Shin, Y.-J. and Cury, P. (2004) Using an individual-based
model of fish assemblages to study the response of size
spectra to changes in fishing. Canadian Journal of Fish-
eries and Aquatic Sciences 61, 414–431.
Sievanen, L., Campbell, L.M. and Leslie, H.M. (2011)
Challenges to interdisciplinary research in ecosystem-
based management. Conservation Biology 26, 315–323.
Sissenwine, M.P. and Murawski, S.A. (2004) Moving
beyond “intelligent tinkering”: advancing an ecosystem
approach to fisheries. In: Perspectives on Ecosystem-
based Approaches to the Management of Marine Resources
(eds. H.I. Browman and K.I. Srergiou). Marine Ecology
Progress Series 274, 291–295.
Smith, M.D. and Wilen, J.E. (2003) Economic impacts of
marine reserves: the importance of spatial behavior.
Journal of Environmental Economics and Management 46,
183–206.
Smith, A.D.M., Brown, C.J., Bulman, C.M. et al. (2011)
Impacts of fishing low trophic level species on marine
ecosystems. Science 333, 1147–1150.
Song, H., Miller, A.J., McClatchie, S., Weber, E.D., Nieto,
K.M. and Checkley, D.M. (2012) Application of a data
assimilation model to variability of Pacific sardine
spawning and survivor habitats with ENSO in the Cali-
fornia Current system. Journal Geophysical Research
117, C03009.
Sparre, P. (1991) Introduction to multispecies virtual
population analysis. ICES Marine Science Symposium
193, 12–21.
Steele, J.H. (1974) The Structure of Marine Ecosystems.
Harvard University Press, Cambridge, MA.
Stock, C.A., Alexander, M.A., Bond, N.A. et al. (2011)
On the use of IPCC-class models to assess the impact of
climate on living marine resources. Progress in Ocean-
ography 88, 1–27.
Tsou, T.-S. and Collie, J.S. (2001) Estimating predation
mortality in the Georges Bank fish community. Cana-
dian Journal of Fisheries and Aquatic Sciences 58, 908–
922.
Tyrrell, M.C., Link, J.S. and Moustahfid, H. (2011) The
importance of including predation in fish population
models: implications for biological reference points.
Fisheries Research 108, 1–8.
Van Kirk, K.F., Quinn, T.J. and Collie, J.S. (2010) A mul-
tispecies age-structured assessment model for the Gulf
of Alaska. Canadian Journal of Fisheries and Aquatic Sci-
ences 67, 1135–1148.
Van Putten, E.I., Kulmala, S., Th�ebaud, O. et al. (2012)
Theories and behavioral drivers underlying fleet
dynamics models. Fish and Fisheries 13, 216–235.
Venables, W.N., Ellis, N., Punt, A.E., Dichmont, C.M. and
Deng, R.A. (2009) A simulation strategy for fleet
dynamics in Australia’s northern prawn fishery: effort
allocation at two scales. ICES Journal of Marine Science
66, 631–645.
Walters, C.J. (1986) Adaptive Management of Renewable
Resources. MacMillan, New York, NY.
Walters, C.J. and Collie, J.S. (1988) Is research on envi-
ronmental factors useful to fisheries management?
Canadian Journal of Fisheries and Aquatic Sciences 45,
1848–1854.
Walters, C.J., Christensen, V. and Pauly, D. (1997) Struc-
turing dynamic models of exploited ecosystems from
trophic mass-balance assessments. Reviews in Fish Biol-
ogy and Fisheries 7, 139–172.
Watters, G.M., Hill, S.L., Hinke, J.T., Matthews, J. and
Reid, K. (2013) Decision making for ecosystem based
management: evaluating options for a krill fishery with
an ecosystem dynamics model. Ecological Applications
23, 710–725.
Wells, B.K., Grimes, C.B. and Waldvogel, J.B. (2007)
Quantifying the effects of wind, upwelling, curl, turbu-
lence, and sea surface temperature on growth and
maturation of a California Chinook salmon (Oncorhyn-
chus tshawytscha) population. Fisheries Oceanography
16, 363–382.
Wells, B.K., Field, J., Thayer, J. et al. (2008a) Untangling
the relationships among climate, prey, and top preda-
tors in an ocean ecosystem. Marine Ecology Progress
Series 364, 15–29.
Wells, B.K., Grimes, C.B., Sneva, J.G., McPherson, S.
and Waldvogel, J.B. (2008b) Relationships between
oceanic conditions and growth of Chinook salmon
(Oncorhynchus tshawytscha) from Alaska, Washington,
and California, USA. Fisheries Oceanography 17, 101–
125.
Wells, B.K., Santora, J.A., Field, J.C., MacFarlane, R.B.,
Marinovic, B.B. and Sydeman, W.J. (2012) Population
dynamics of Chinook salmon Oncorhynchus tshawytscha
relative to prey availability in the central California
coastal region. Marine Ecology Progress Series 457,
125–137.
Worm, B., Hilborn, R., Baum, J.K. et al. (2009) Rebuild-
ing global fisheries. Science 325, 578–585.
de Young, B., Barange, M., Beaugrand, G. et al. (2008)
Regime shifts in marine ecosystems: detection, predic-
tion and management. Trends in Ecology and Evolution
23, 402–409.
© 2014 John Wiley & Sons Ltd, F I SH and F I SHER IES 25
Fishery ecosystem models J S Collie et al.