modelling of bisphenol a migration from ldpe into …
TRANSCRIPT

MODELLING OF BISPHENOL A MIGRATION FROM LDPE
INTO FOOD SIMULANTS
By
Yining Xia
A THESIS
Submitted to
Michigan State University
in partial fulfillment of the requirements
for the degree of
MASTER OF SCIENCE
Packaging
2012

ABSTRACT
MODELLING OF BISPHENOL A MIGRATION FROM LDPE
INTO FOOD SIMULANTS
By
Yining Xia
Migration testing of bisphenol A (BPA) from low-density polyethylene (LDPE) into
food simulants was performed with three factors taken into account: temperature, initial
BPA concentration and food simulant type. BPA analysis was carried out by a HPLC-UV
method. Fick’s diffusion equations were applied to the migration modeling. Diffusion
coefficients ( ) and partition coefficients ( ) were determined by fitting the
migration curve with the diffusion equation. values obtained under different
conditions ranged from 10-10
to 10-8
cm2 s
-1. Statistical analysis showed significant effects
of all factors on the diffusion coefficient. No interaction effect was shown significant,
except for the interaction between temperature and food simulant type. The dependence
of diffusion coefficients on temperature followed an Arrhenius type of relationship with
the activation energy ( ) ranging from 118 to 134 kJ mol-1
for different food simulants.
An exponential relationship was found between the diffusion coefficient and initial BPA
concentration for each food simulant. Based on the statistical analysis, an empirical
model was developed to express the diffusion coefficient as a function of temperature and
initial BPA concentration.

iii
Acknowledgements
This thesis is based on nearly two years’ research. During the time, I have received
precious support from my friends and colleagues. With their contribution either directly
or indirectly to my work, I was able to overcome many difficulties and push the research
forward. Here, it is my pleasure to express my heartfelt thanks.
First, I would like to say thank you very much to Dr. Maria Rubino. As my
advisor, she gave me many valuable suggestions both on my experiment and thesis
writing. I appreciate the freedom and trust she gave me that I had an opportunity to
design and arrange my research. I appreciate her praise and encouragement, making me
brave and confident to finish my research successfully. I appreciate her tolerant heart on
mistakes in my research. I also appreciate her warm heard for many books and articles
she offered me, to greatly broaden the knowledge on my research. Overall, I’m so happy
to work with Dr. Rubino and this experience will become a good memory in all my life.
I would like to thank Suheewan from School of Packaging for her great help on
HPLC training. Another person I wish to say thank you is Michelle Sanderland, a
technician from Waters Company, for her hard work on the maintenance of HPLC, which
is very essential to my research. I also learned a lot about the instrument through our
conversation.
I would like to convert my gratitude to my Friend Jun Lai from Mathematical
Department who taught me MATLAB. I would also like to thank Katya and Wenzhao
Yang from CANR statistical consulting center with their great help on the statistical
analysis.

iv
During my thesis writing, I receive many help from my writing course (NSC 840).
Dr Snider, professor from writing center, has made a lot effort on the correction of
grammar and modification of sentences. My classmates also gave me many valuable
suggestions.
Finally, I wish to send my great appreciation to my dear parents. My academic
performance at MSU is their most concern. My success toward graduation is their
greatest wish. They are always my spirit pillar.
Thank you all
Yining Xia

v
TABLE OF CONTENTS
LIST OF TABLES...……………………………….……………....…………….…. vii
LIST OF FIGURES..………………………………………………….……..…..…. viii
ABBREVIATIONS AND SYMBOLS....…………………………………….…….. x
CHAPTER 1: Introduction…...……………………………………...………….…. 1
1.1 Background…………………………………………….…….………..……..…. 1
1.2 Motivation…………………….……………………………………..………….. 3
1.3 Goals and objectives………………..…..………..………..……………….…… 4
CHAPTER 2: Literature Review…………………...………………….…...……… 5
2.1 A brief description of BPA………………………………………………..……. 6
2.1.1 Characteristics and properties of BPA………………..…….……..……… 6
2.1.2 Potential risks of BPA………………………………....……………..…… 7
2.1.3 Public concerns and regulatory issues of BPA……………………..…….. 8
2.2 Mass transfer………………………………………………………...…..……… 9
2.2.1 Mass transfer in packaging system……………….……………...…..…… 9
2.2.2 Fick’s laws of diffusion……………………………………………..…..… 11
2.2.3 Effect of temperature on diffusion………….………………………..…… 13
2.2.4 Diffusion models for migration process………….…………….…....……. 14
2.3 Methodology of migration testing……………………………...………..……… 17
2.4 Instrumental analysis for the quantification of BPA………………….………… 19
2.4.1 Chromatographic techniques: liquid chromatography……………..…...… 20
2.4.2 Chromatographic techniques: gas chromatography…………...……..…… 23
2.4.3 Immunochemical techniques……………………………………...…….… 24
CHAPTER 3: Materials and Methods………..…………………………………… 25
3.1 Materials………………………..………………………………………..……… 26
3.2 Instrumental method for the quantification of BPA……………………..……… 26
3.3 Sample preparation for migration testing………………………………..……… 27
3.3.1 Preparation of LDPE + BPA masterbatch…………………………..…..… 27
3.3.2 Film sample formation for migration testing………………………..……. 28
3.4 Characterization of LDPE film…………………...………………………..…… 29
3.4.1 Determination of initial BPA content in LDPE film……………..…..…… 29
3.4.2 Determination of BPA distribution in LDPE film………………….…….. 30
3.4.3 Thermal analysis……………………………………..…..…………..…… 31
3.5 Migration experiment………………..……………………………………..…… 31
3.6 Estimation of DP and KP,F……………….………………………………...……. 33
3.7 Statistical analysis…………………………………………..………...………… 33

vi
3.8 Modelling of BPA concentration profiles in LDPE film……………..………… 34
CHAPTER 4: Results and Discussion…...………………………………………… 37
4.1 Performance of HPLC-UV method………………………………………...…… 37
4.2 Properties of LDPE film.………………………………………………...……… 38
4.3 DP and KP,F determination…………………………………………………..…... 39
4.4 Effects of various factors on the diffusion coefficient……………………..…… 45
4.5 Empirical model for BPA migration from LDPE film………...……………..…. 50
4.6 BPA concentration profiles in LDPE film………………………..………..…… 51
CHAPTER 5: Conclusions......................................................................................... 53
5.1 Outcomes from the study……………………………………………..………… 53
5.2 Prospects for the future work……………………………………………....…… 54
APPENDICES..........………………………………………………………………... 55
Appendix A Graphs for IR and thermal analysis of LDPE+BPA...……………..…. 56
Appendix B Migration graphs obtained under different conditions………………... 60
REFERENCES………………………………………………………………...……. 69

vii
LIST OF TABLES
Table 2.1 Chemical and physical properties of BPA……………………………… 7
Table 4.1 Absorbance of BPA (0.5 wt% in nominal) in LDPE film obtained by
HATR spectroscopy and transmission spectroscopy…………...……… 39
Table 4.2 Mean (±SD, N=3) diffusion coefficients ( ) (generated from equation
2.6) of BPA migration from LDPE under different conditions………… 40
Table 4.3 Mean (±SD, N=3) diffusion coefficients ( ) (generated from equation
2.8) of BPA migration from LDPE under different conditions………… 41
Table 4.4 Mean (N=3) partition coefficients ( ) (generated from equation 2.6) 42
of BPA between LDPE and food simulants under different conditions...
Table 4.5 Mean (N=3) RMSE values as a measure of fit between the
experimental data and the applied diffusion equation………………….. 43
Table 4.6 Effect of temperature, initial BPA concentration, food simulant type
and their interactions on the migration rate at α=0.05………………….. 45
Table 4.7 Dispersion ( ), polar ( ) and hydrogen bonding ( ) solubility
parameters for LDPE and different food simulants…………………….. 49
Table 4.8 Parameter estimation of the empirical equation 4.3 for BPA migration
from LDPE into different food simulants………………………………. 51

viii
LIST OF FIGURES
Figure 1.1 Molecular Structure of BPA……………………………………………. 3
Figure 2.1 Synthesis of BPA……………………………………………………….. 6
Figure 2.2 Diffusion process of a small molecule in the polymer matrix………….. 12
Figure 2.3 Two-sided contact migration between the polymer (P) and
food simulant (F)……………………………………………………….. 16
Figure 3.1 Schematic diagram of the study on BPA migration from LDPE into
food simulants……………………………………………………….….. 25
Figure 3.2 Electrically heated three-piece mixer with two roller style mixing
Blades…………………………………………………………………… 28
Figure 3.3 Carver Laboratory Press used for compression molding……………….. 29
Figure 3.4 Apparatus for two-sided contact migration testing……………………... 32
Figure 4.1 HPLC-UV chromatogram of a standard solution containing
10 μg L-1 BPA………………………………………………………….. 37
Figure 4.2 Amount of BPA migrated from LDPE into 95% ethanol at (a) 40ºC,
(b) 60ºC and (c) 80ºC relative to the initial amount in the polymer
(1.42 mg g-1)…………………………………………………………… 44
Figure 4.3 Mean (±SD, N=3) experimental and predicted diffusion coefficients of
BPA in LDPE contacting with three different food simulants………..... 47
Figure 4.4 Diffusion coefficient of BPA in LDPE in contact with water as a
function of initial BPA concentration at different temperatures………... 48
Figure 4.5 Concentration profiles (2D and 3D) of BPA in LDPE contact with
water at 60℃with an initial BPA concentration of 1.42 mg g-1……….. 52
Figure A1 FTIR graph of (a) BPA, (b) LDPE + BPA (0.5 wt%) and (c) LDPE.......
Figure A2 DSC graph for (a) LDPE and (b) LDPE + BPA (0.5 wt%)……………..

ix
Figure A3 TGA graph of BPA……………………………………………………...
Figure B1 Amount of BPA migrated from LDPE into water at (a) 40ºC, (b) 60ºC
and (c) 80ºC relative to the initial amount in the polymer (1.42 mg g-1
).
Figure B2 Amount of BPA migrated from LDPE into 3% acetic acid at (a) 40ºC,
(b) 60ºC and (c) 80ºC relative to the initial amount in the polymer (1.42
mg g-1
)…………………………………………………………………..
Figure B3 Amount of BPA migrated from LDPE into water at (a) 40ºC, (b) 60ºC
and (c) 80ºC relative to the initial amount in the polymer (0.41 mg g-1
).
Figure B4 Amount of BPA migrated from LDPE into 3% acetic acid at (a) 40ºC,
(b) 60ºC and (c) 80ºC relative to the initial amount in the polymer (0.41
mg g-1
)…………………………………………………………………..
Figure B5 Amount of BPA migrated from LDPE into 95% ethanol at (a) 40ºC, (b)
60ºC and (c) 80ºC relative to the initial amount in the polymer (0.41
mg g-1
)…………………………………………………………………..
Figure B6 Amount of BPA migrated from LDPE into water at (a) 40ºC, (b) 60ºC
and (c) 80ºC relative to the initial amount in the polymer (2.66 mg g-1
).
Figure B7 Amount of BPA migrated from LDPE into 3% acetic acid at (a) 40ºC,
(b) 60ºC and (c) 80ºC relative to the initial amount in the polymer (2.66
mg g-1
)…………………………………………………………………..
Figure B8 Amount of BPA migrated from LDPE into 95% ethanol at (a) 40ºC, (b)
60ºC and (c) 80ºC relative to the initial amount in the polymer (2.66
mg g-1
)…………………………………………………………………..
x
ABBREVIATIONS AND SYMBOLS
Diffusion coefficient
Chemical potential
Diffusion distance in the polymer
Permeant concentration
Diffusion time
Glass transition temperature
Activation energy
Gas constant
Absolute temperature
Pre-exponential factor
Diffusion coefficient in the polymer
Migrant concentration in the food or food simulant
Migration level at time t
Initial migrant concentration
Density of the polymer
Density of the food or food simulant
Polymer film thickness
Volume of the polymer
Volume of the food or food simulant

xi
Partition coefficient of the migrant
Migration level at equilibrium
Area of the polymer in contact with the food simulant
Excitation wave length
Emission wave length
Root mean-square error
Solubility parameter distance
Dispersion parameter
Polar parameter
Hydrogen bonding parameter

1
CHAPTER 1
Introduction
1.1 Background
In the food industry, packaging plays a very important role to the food product. The
main functions of food packaging [1] are: (a) to provide containment of the food product;
(b) to afford protection of the food product from the outer environment; and (c) to give
the consumer detailed information of the food product it contains. Various kinds of
materials are used for food packaging such as metal, glass, paper, wood and plastic.
Compare to other materials, plastic is a relatively new material and is used extensively in
food packaging due to its ability to adapt to specific requirements.
The synthetic plastic industry first started in 1909, with the development of a
phenol formaldehyde plastic by Baekeland [2]. After that, different types of plastic
materials were developed and used for packaging purposes. The demand for plastics as
packaging materials has grown year by year and they have been a good alternative to
other types of materials such as glass and metal. Plastics have some advantages that have
made them very useful as packaging materials, especially for food product applications
[3], such as easy to shape, low in cost, almost chemically inert, lightweight, superior
sealing ability, and relatively good barrier properties.
One important feature of plastic packaging materials is their semi-crystalline or even
non-crystalline morphology. The crystalline region helps to improve the mechanical and
barrier properties of the packaging materials. The amorphous region makes the packaging

2
materials more flexible and easier for processing. However, the existence of amorphous
region is one of the factors that enable the transfer of small molecules (such as gases,
liquids and solids) through the boundary layers of plastic materials [4]. One phenomenon
of the transfer of small molecules in the packaging system is migration, which
corresponds to the release of compounds from the packaging materials [5]. The released
components can be residual monomers, oligomers, processing aids and additives.
Additives, such as plasticizers, stabilizers, UV absorbers and anti-oxidants, make the
packaging materials more processable and durable. When those components go into the
food product, they may affect the quality and safety of the food product.
Bisphenol A (BPA) (Figure 1), or 2, 2-bis (4-hydroxyphenyl) propane, is a chemical
primarily used as a precursor in the synthesis of polycarbonate (PC) and epoxy resins, to
be used as rigid containers and metal can linings. It can also be used as an additive in
various plastic materials such as PVC and rubber to improve the durability (UV
resistance, heat stability, etc.) of the materials [6-8]. Migration of BPA happens when
those packaging materials are in direct contact with the food system [9-14]. Another
source of BPA migration could take place when the packaging materials are either
recycled or discarded in the landfill. In this situation, BPA migrates into the surrounding
environment such as river water [15, 16] and soil [17]. However, the migration of BPA
due to the direct contact of the packaging materials with the food system is the primary
concern since the food constitutes the main route of human exposure to BPA [18].

3
Figure 1.1 Molecular Structure of BPA.
BPA is also known as one of the endocrine disrupting compounds (EDCs), a group of
chemicals that interact with steroid hormone receptors of human and animals and disrupt
normal endocrine functions [19]. Since BPA is widely used in food packaging, in recent
years, there is an increasing concern regarding the level of BPA in the food system which
could impact the human health [20, 21]. Thus, there is a need to determine the level of
BPA that migrate into the food system and how BPA is released into the food system
from the packaging materials in order to ensure food safety.
1.2 Motivation
It is important to assess the level of BPA in the food system promoted by the
packaging materials being in direct contact with the food product. It is also important to
understand how the migration takes place and how fast or slow that BPA is released from
the packaging materials into the specific food or food simulant under specific conditions.
The conventional migration testing proposed by the US Food and Drug Administration
(FDA) usually measures the level of additives that migrate into a specific food simulant
[22]. But this method does not provide the profile of migration process. Mathematic
models have been developed in recent years aiming to predict the migration of additives
C
CH3
CH3
HO OH

4
and other low molecular weight components from plastic packaging materials into the
food or food simulants [23]. For example, diffusion equations derived from Fick’s second
law are applied to describe the migration process as a function of time, by solving
parameters such as diffusion coefficient (𝐷𝑃 ) and partition coefficient (𝐾𝑃,𝐹 ). The
prediction of migration using mathematical models may overcome some disadvantages
associated with conventional migration testing [22], such as (a) time consuming, (b)
difficult for the analysis of migrants at ultra-low concentrations, (c) expensive in analyses
used in migration testing, and (d) generating hazardous laboratory waste. Therefore,
model prediction is considered a promising alternative to the conventional migration
testing.
1.3 Goal and objectives
The overall goal is to describe the migration profile of BPA from plastic packaging
materials into the food system at different conditions. To reach the goal, the following
objectives are addressed, with special focuses on the development of methodologies to
describe BPA migration.
(1) Set up an analytical method for the quantification of BPA;
(2) Implement mathematical models in order to describe the migration process;
(3) Evaluate the effect of temperature, initial BPA concentration and food simulant type
on the migration process.

5
CHAPTER 2
Literature Review
This chapter starts with an introduction on bisphenol A (BPA), including the
characteristics and properties, potential health risks, public concerns and some regulatory
issues. Then, a brief description of mass transfer in packaging system will be given.
Fick’s diffusion theory is addressed to express the migration process involved in mass
transfer. Some diffusion models derived from Fick’s laws of diffusion are outlined. These
models can be used to describe the migration process within the packaging system. In
order to ensure food safety, migration testing of BPA is quite necessary. Methods of
migration testing recommended by the US Food and Drug Administration (FDA) are
introduced. The inspection of migration level is an important aspect of migration testing.
Instrumental techniques regarding the determination of BPA are listed, including the
conventional methods such as liquid chromatography and gas chromatography, as well as
a new method called immunochemical technique.

6
2.1 A brief description of BPA
2.1.1 Characteristics and properties of BPA
The synthesis of BPA was first reported by Zincke [24] using acid catalyzed
condensation of acetone and phenol (Figure 2.1). Chemical and physical properties [25]
of BPA are listed in Table 2.1. Commercial production of BPA began in 1950’s when it
was widely used in the manufacture of polycarbonate (PC) plastics and epoxy resins. The
demand of BPA has been grown worldwide with the continuous growth of the uses for
these plastic materials. Today, BPA is one of the world’s most widely produced chemicals,
with an annual production of over 2.2 million tones [26]. In the US, BPA ranks in the top
two percent of high production volume chemicals, with annual production exceeding a
billion pounds (0.5 million tons) [27]. Over 70% BPA are made into PC plastics and
about 21% BPA go into epoxy resins [28]. For food contact applications, less than 5%
BPA are used [29].
OH OH
CH3CH3
O
CH3
CH3
OH OH+ +H+
H2O
Figure 2.1 Synthesis of BPA.

7
Table 2.1 Chemical and physical properties of BPA.
Formula
Mw Mp
(ºC) Bp/Fp
a
(ºC)
Tdb
(ºC)
Density
(g/cm3)
Solubility
not soluble in water;
soluble in acetic acid;
very soluble in ethanol,
diethyl ether, benzene
C15H16O2 228 153 250/79 180 1.195
Note: a. Fp = flash point; b. Td = thermal decomposition point.
2.1.2 Potential risks of BPA
BPA was identified as a weak estrogenic chemical; approximately 1000-2000 fold
less potent than the natural estrogenic chemical 17-β estradiol [30]. A potential risk of
BPA is its estrogenic activity [30, 31], firstly proved by experiments on rats in the 1930s
[32]. Due to the accumulation of BPA in the body, adverse health effects are caused by
BPA at doses much lower than that would normally be expected, which is also known as
low dose effects [33]. Some examples of low dose effects in laboratory animals such as
rats and mice are: (a) early onset of sexual maturation in females [34], (b) increased
postnatal growth in both males and females [35, 36]; (c) altered immune function [37];
and (d) behavioral effects such as hyperactivity [38] and increase in aggressiveness [39].
The most serious problem of BPA is its carcinogenic activity [40] which can be correlated
to cancer such as breast cancer [41]. The potential risks of BPA on breast cancer are
attributed to two aspects: (a) BPA can alter the growth of mammary tissue that increase
the risk of breast cancer as well as increase the sensitivity of breast tissue to cancer

8
causing agents [42]; and (b) BPA can significantly promote the growth of cancer cells. An
example is the proliferation in MCF-7 human breast cancer cell line induced by BPA at
low doses [43].
2.1.3 Public concerns and regulatory issues of BPA
The public doubt whether present regulations on BPA are adequate to protect
human health according to the study on low dose effects of BPA. Adverse effects of low-
dose exposure to BPA on laboratory animals were first reported in 1997 [44]. By
December 2004, there were 115 published in vivo studies that dealt with low dose effects
of BPA [45]. Among those studies, 94 out of 104 government-funded studies have
reported significant adverse health effects, and 31 of them have reported effects caused
by doses at or below the current reference dose (RfD) which was set to be 50 μg kg-1
day-
1 by the US Environmental Protection Agency (EPA). However, none of the remaining 11
industry-funded studies reported any significant biological impact of BPA [30]. Thus,
there comes a debate regarding the safety of BPA [46]. One group suggests a higher
restriction on BPA and eventually a ban on its use in any food contact application. The
other group claims that the current use of BPA is safe.
The FDA has shown its concern regarding the safety of BPA for many years. A draft
assessment of BPA for its use in food contact applications was published in 2008 with
particular focuses on its developmental toxicity [47]. By far, the FDA considers that the
current level of exposure of BPA to adults and infants is safe based on the current RfD.

9
However, the FDA will keep on reviewing the safety of BPA as new data of BPA become
available, and the current regulations on BPA might be changed in the future.
Some actions have already been taken out to protect the human health by minimizing
the exposure of BPA to the human body. In 2008, Canada became the first country to
designate BPA as a toxic substance. As a consequence, Canada banned the import, sale
and advertisement of polycarbonate baby bottles containing BPA and carried out efforts
to reduce BPA contamination of infant formula in metal cans [48, 49]. In 2009,
Connecticut became the first state in the US to ban the use of BPA in any infant formula
and baby food containers, as well as in any reusable food or beverage container [50]. The
European Union will ban the use of BPA in plastic baby bottles from 2011 with the
support from the majority of its members [51].
2.2 Mass transfer
2.2.1 Mass transfer in packaging system
Interactions between plastic packaging materials and the food product are always
connected with mass transfer occurring within the packaging system including sorption,
permeation and migration. The driving force for the transport of a substance in the
packaging system is the gradient of chemical potential of that substance. Here, the
chemical potential can be interpreted as concentration or partial pressure of the substance.
The transport of the substance from higher chemical potential side to lower side is a
spontaneous process, in order to equilibrate the chemical potential between the two sides.

10
Sorption
Sorption refers to the uptake of food components such as flavor, lipids and
moisture by the plastic packaging materials. The extent of sorption depends on the initial
concentration of the sorbent in the food as well as the polymer properties [52]. The
sorption process causes the loss/change of flavor or quality of the food product which
will be unacceptable to the consumer [53].
Permeation
Permeation is the exchange of small molecules (gases, vapors and liquids) across the
packaging materials and can be expressed in three steps: (a) absorption of the substance
by the polymer surface at the higher concentration side; (b) diffusion of the substance
through the polymer toward the lower concentration side; and (c) desorption of the
substance at the lower concentration side.
Migration
Migration can be considered the opposite process of sorption which is the release of
components from the plastic packaging materials into the product. The components
released are also called migrants. Monomers and additives are two common types of
migrants existed in most of the plastic materials. Those components are usually under
intense legal control by the regulatory agencies to minimize their potential risk to human
health due to their migration into the food.

11
The migration process in the packaging system is controlled by both thermodynamics
and kinetics, or partition and diffusion, respectively [54-56]. The partition
(thermodynamics process) of the migrant between the polymer phase and the liquid (food
simulant) phase at equilibrium of migration is affected by the solubility and affinity of the
migrant in the two phases. The diffusion (kinetics process) provides information on the
migration velocity and is influenced by [57]: (a) molecular structure and molecular
weight of the migrant, (b) affinity of the migrant to the food simulant, and (c) affinity
between the polymer and the food simulant.
The affinity can be described by solubility parameter δ [58]. The principle for the use
of solubility parameter is “like dissolve like”, which means two liquids with similar δ
values are miscible with each other. This principle may also extend to the miscibility
between solid and liquid and solid and solid. The solubility parameter can be divided into
three components in order to precisely define the degree of likeness in a given system.
The three components are also known as Hansen solubility parameters [59] which are
given as 𝛿𝐷 , 𝛿𝑃 and 𝛿𝐻 , for dispersion, polar and hydrogen bonding contribution,
respectively. Therefore, the affinity can be calculated and compared based on the Hansen
solubility parameters.
2.2.2 Fick’s laws of diffusion
Mass transfer of the substance within the packaging system is usually associated with
the diffusion process in the polymer (Figure 2.2). Fick’s laws of diffusion [60] are useful

12
to quantitatively describe this process. For steady state, one dimension diffusion of a
substance in the polymer, Fick’s first law is used [57]:
𝐹 = −𝐷𝜕𝐶
𝜕𝑥 (2.1)
where is the transfer rate of the substance per unit area; is the substance concentration
in the polymer; 𝑥 is the diffusion distance; and is the diffusion coefficient of the
substance in the polymer. The negative sign indicates that the substance travels from the
higher concentration region to the lower one. For unsteady state, one dimensional
diffusion of the substance in the polymer, Fick’s second law is used [57]:
𝜕𝐶
𝜕𝑡= 𝐷
𝜕2𝐶
𝜕𝑥2 (2.2)
where t is the diffusion time.
Figure 2.2 Diffusion process of a small molecule in the polymer matrix.

13
Note: The graph was modified from the original graph on the website of Dr. Mauritz’s
research group: http://www.psrc.usm.edu/mauritz/diffuse.html. The existence of free
volume and mobility of polymer chains enable the diffusion of small molecules [4, 61].
Regarding equations 2.1 and 2.2, some assumptions [57] are made here:
(1) The value of D is assumed to be independent of both, the substance concentration
and the polymer chain relaxation;
(2) Diffusion processes through packaging materials are generally unidirectional and
perpendicular to the surface of the package;
(3) Solutions of diffusion equations are obtained for particular cases derived from the
corresponding boundary and initial conditions.
2.2.3 Effect of temperature on diffusion
When dealing with the problem of diffusion of the substance in the polymer, one
important feature that should be addressed is temperature as it significantly affects the
mobility of polymer chains. Diffusion mechanisms are different at temperatures above
and below the glass transition temperature, Tg, of the polymer. At temperature T>Tg,
polymers are at a “rubbery” state and respond rapidly to changes in their physical
condition. The time required for the substance-polymer system to reach a new
equilibrium state is much shorter than that required for the diffusion of the substance
through the polymer matrix, due to the fast relaxation of polymer chains [62-64].

14
When T<Tg, polymers are at a “glassy” state, polymer chains are “frozen” and
their mobility is restricted. There is not enough time for the relaxation of polymer chains
to completely reach a new equilibrium state when the substance transports through the
polymer matrix. Therefore, the polymer is not in a true equilibrium state below the glass
transition temperature [62, 65].
From these considerations, the diffusion behavior of a substance in polymers can
be summarized as followed:
(1) In rubbery polymers, the diffusion behavior is generally Fickian, excepting the case
when the sorption does not reach equilibrium at the polymer interfaces [66];
(2) In glassy polymers, the diffusion behavior can be categorized into three aspects [67]:
(a) Case I or Fickian diffusion, when the relaxation of the substance-polymer system
is faster than the diffusion of the substance; (b) Case II diffusion [68], when the
relaxation of the substance-polymer system is slower than the diffusion of the
substance; and (c) non-Fickian diffusion, when the relaxation rates of substance-
polymer system are comparable with the diffusion rates of the substance. In this case,
the diffusion process is mainly affected by the existence of holes and micro-cavities
in the polymer matrix.
2.2.4 Diffusion models for migration process
Fick’s second law of diffusion is useful to describe the migration process in
15
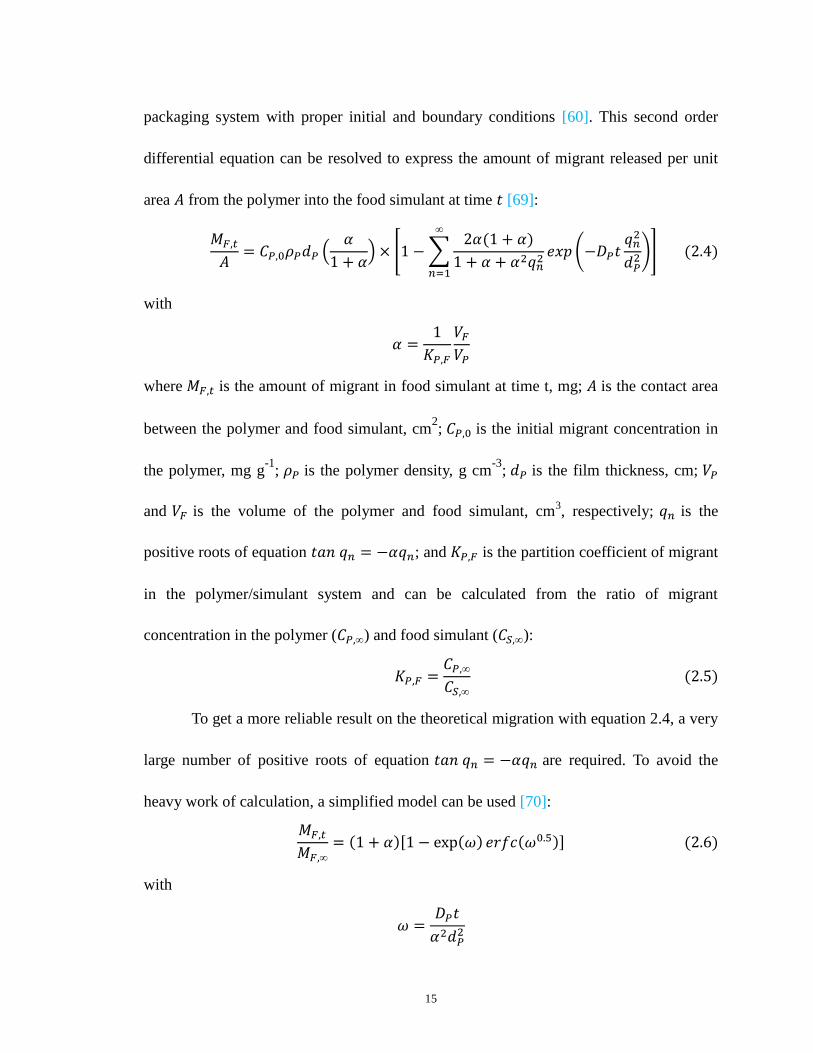
packaging system with proper initial and boundary conditions [60]. This second order
differential equation can be resolved to express the amount of migrant released per unit
area 𝐴 from the polymer into the food simulant at time 𝑡 [69]:
𝑀𝐹,𝑡𝐴= 𝐶𝑃,0𝜌𝑃𝑑𝑃 (
𝛼
1 + 𝛼) × [1 −∑
2𝛼(1 + 𝛼)
1 + 𝛼 + 𝛼2𝑞𝑛2𝑒𝑥𝑝 (−𝐷𝑃𝑡
𝑞𝑛2
𝑑𝑃2)
∞
𝑛=1
] (2.4)
with
𝛼 =1
𝐾𝑃,𝐹
𝑉𝐹𝑉𝑃
where 𝑀𝐹,𝑡 is the amount of migrant in food simulant at time t, mg; 𝐴 is the contact area
between the polymer and food simulant, cm2; 𝐶𝑃,0 is the initial migrant concentration in
the polymer, mg g-1
; 𝜌𝑃 is the polymer density, g cm-3
; 𝑑𝑃 is the film thickness, cm; 𝑉𝑃
and 𝑉𝐹 is the volume of the polymer and food simulant, cm3, respectively; 𝑞𝑛 is the
positive roots of equation 𝑡𝑎𝑛 𝑞𝑛 = −𝛼𝑞𝑛; and 𝐾𝑃,𝐹 is the partition coefficient of migrant
in the polymer/simulant system and can be calculated from the ratio of migrant
concentration in the polymer (𝐶𝑃,∞) and food simulant (𝐶𝑆,∞):
𝐾𝑃,𝐹 =𝐶𝑃,∞𝐶𝑆,∞
(2.5)
To get a more reliable result on the theoretical migration with equation 2.4, a very
large number of positive roots of equation 𝑡𝑎𝑛 𝑞𝑛 = −𝛼𝑞𝑛 are required. To avoid the
heavy work of calculation, a simplified model can be used [70]:
𝑀𝐹,𝑡𝑀𝐹,∞
= (1 + 𝛼)[1 − exp(𝜔) 𝑒𝑟𝑓𝑐(𝜔0.5)] (2.6)
with
𝜔 =𝐷𝑃𝑡
𝛼2𝑑𝑃2

16
where 𝑀𝐹,∞ is the amount of migrant in food simulant at equilibrium, mg. Equations 2.4
and 2.6 are applicable to both one-sided and two-sided contact migration. A two-sided
contact migration can be considered as the combination of two one-sided contact
migration due to the axis of symmetry at x=0 (Figure 2.3). For two-sided contact
migration, half layer thickness, dP/2, is used without any change of the equation [4].
Figure 2.3 Two-sided contact migration between the polymer (P) and food simulant (F).
In the case that migration is only diffusion controlled, a further simplified
equation can be used [57]:
𝑀𝐹,𝑡𝐴= 2𝐶𝑃,0𝜌𝑃 (
𝐷𝑃𝑡
𝜋)1/2
(2.7)
Equation 2.7 can be reorganized to express the migration process for a finite polymer-
finite food system or an infinite polymer-infinite food system [4]:
𝑀𝐹,𝑡𝑀𝐹,∞
=2
𝑑𝑃√𝐷𝑃𝑡
𝜋 (2.8)

17
In addition to the above-mentioned equations, several other semi-empirical
models for diffusion have been applied to match some specific requirements of the
migration testing [71-74].
2.3 Methodology of migration testing
In the US, the FDA is the institute to set regulations for migration testing under 21
CFR 170.39 (Threshold of regulation for substances used in food-contact articles).
Migration testing is usually carried out under finely controlled laboratory conditions and
designed to: (a) simplify the experimental operations, and (b) simulate the migration in
real case. Some recommendations for the design of migration experiment [75] are listed
below in three parts.
Description of the migration cell
The design of a migration cell should fully enable the characterization of migration
testing. Usually, the food container such as water bottle can be directly used as the
migration cell. Otherwise, a specifically designed migration cell should be considered
when: (a) the surface area of the food container cannot make sufficient extractives for
characterization; and (b) a soft film was used as the packaging material. A specimen of
known surface area and a food simulant of known volume are required for the use of a
migration cell. The specimen can be either one-sided contact or two-sided contact with
the food simulant (immersed into the food simulant). For the latter case, a two-sided

18
migration cell is usually adopted [76] with two essential features: (a) separation of
polymer films or sheets by inserting spacers (such as glass beads) to allow the free flow
of food simulant around each film or sheet; and (b) minimization of headspace with gas-
tight or liquid-tight seals. Two-sided contact migration testing is not suitable in some
cases, e.g., when a multilayer film is used. Therefore, the two-sided migration cell should
be replaced by other cell designs such as a one-sided migration cell [77]. For volatile
migrant or solvent, the migration cell must be sealed and kept away from the light.
Selection of Food simulants
Due to the complexity of food matrices, the extraction of migrant from the food is
difficult and time consuming [78]. Thus, migration testing is usually performed by using
food-simulating liquids to avoid the complicated extraction process. Food simulants
recommended by the FDA are: water for aqueous foods, 3% acetic acid for acid foods, 10
to 50% ethanol for low and high alcoholic foods, food oil (e.g. olive oil) or HB307 or
Miglyol 812 for fatty foods. When oil is used as food simulant, an extra extraction step is
required before injection. To avoid this step, some aqueous-based solvents are
recommended as alternatives for fatty-food simulants. For instance, absolute or 95%
ethanol is an effective fatty-food simulant for polyolefins, and 50% ethanol is used as
fatty-food simulant for rigid PVC, PS and rubber-modified PS [79]. The simulant
volume-to-specimen surface area ratio should match the value in actual food packaging.
In general, a ratio of 10 ml in-2
is recommended. Other ratios may also be acceptable
19
depending on the migrant solubility in the polymer and the food simulant.
Temperature and exposure time
The FDA has recommended the short-term accelerated testing to reflect the migration
for real applications. For room temperature applications, a temperature of 40ºC for 10
days is recommended, which is approximate equivalent to the migration for 6 months
under room temperature. For refrigerated or frozen food applications, the test temperature
of 20ºC is used. Other temperatures and exposure times could also be used to match the
conditions of different applications. Portions of the testing solution should be analyzed
during the migration testing. At least four samplings should be taken with variant time
intervals. Analysis of a control is also recommended.
2.4 Instrumental analysis for the quantification of BPA
A variety of analytical methods have been reported for the determination of BPA.
Chromatographic techniques including liquid chromatography (LC) and gas
chromatography (GC) are commonly used. Immunochemical techniques have also been
developed for the determination of BPA in recent years. Instrumental analysis for BPA
usually consists of three steps: sample preparation, separation and detection. Different
techniques have different requirements for each step.

20
2.4.1 Chromatographic techniques: liquid chromatography
Liquid chromatography (LC), especially high performance liquid chromatography
(HPLC), is commonly applied in the separation, identification and quantification of BPA,
for it is relatively simple in use [80]. Sample preparation for instrumental analysis
involves complicated extraction procedures if the food was directly used in the migration
testing. Solvent extraction and solid extraction [25] are two commonly applied techniques
for BPA extraction from the food. When food simulating solutions are used, procedures
involved in the extraction from the food can be omitted and a portion of the extracting
solution can be directly injected into the LC system.
Isolation of BPA from other compounds in the solvent is mainly carried out in
reverse-phase C18 columns, while other types of columns can also be used such as a
shield RP-18 column [81, 82]. The column is usually kept at room temperature during the
analysis to extend the life-time of the column. A higher temperature [83, 84] can also be
adopted to accelerate the analytical process while maintain a good resolution. The elution
conditions depend on the composition of the sample and the detector coupled to the LC
[85]. The elution can be either isocratic or gradient. The mobile phase is usually a binary
solution of water and an organic solvent such as methanol [86, 87] or acetonitrile [88, 89].
The mobile phase is sometimes adjusted to a lower PH value with the addition of acetic
acid [84] or trifluoroacetic acid [90] or formic acid [91] to achieve a better resolution.
Other than the mobile phase mentioned above, Szymanski et al. [82] adopted a special
mobile phase called micellar mobile phase (an aqueous solution with the anionic

21
surfactant sodium dodecyl sulphate) to improve the detection limit.
Various detection techniques are applied for the determination of BPA. Among these
techniques, ultra violet (UV) detection, fluorescence (FL) detection and mass
spectrometry (MS) detection are frequently applied, while electrochemical detection (ED)
is utilized in a lesser extent.
UV and FL detection
BPA has a positive absorption of UV light at the wavelength of 275 nm and 225 nm.
The wavelength of 225 nm is commonly used since the absorption is more intensive so a
better sensitivity can be reached [92]. Other wavelengths used [82, 88, 89] are usually
closed to the two wavelength designated above. BPA also shows negative fluorescence
with the excitation wavelength of around 275 nm and emission wavelength of around 305
nm. The characteristic wavelengths of BPA for both UV and FL detection are stable in
solvents typically used as the LC mobile phase: water, acetonitrile and methanol. The
sensitivity depends on the sample preparation and the mobile phase composition. A better
sensitivity is usually obtained in a mobile phase with higher organic composition [85].
The detection limits of BPA are usually in the range of 0.2 - 20 μg L-1
for UV detection
[93] and can go as low as 0.01μg L-1
[94]. The typical detection limits of BPA using FL
detection range from 0.1 to 5 μg L-1
[85] and can reach ppt (ng L-1
) level [95].

22
MS detection
MS Detection is carried out by using electrospray ionization (ESI) in negative mode
[86, 96] and atmospheric pressure chemical ionization (APCI) in negative mode [97, 98].
ESI is more frequently applied since it provides better sensitivity [85]. Chromatographic
conditions for MS detection are identical to those used in UV and FL detection. The
response of BPA is highly dependent on the mobile phase composition [99]. Mobile
phases made up of water-methanol are preferred than those consist of water-acetonitrile
to achieve a better response. The response can be modified by adding the modifier such
as 0.5% ammonia [100] and 0.01% acetic acid [86]. The most abundant ion in BPA mass
spectrum used for quantitative analysis is m/z 227, which corresponds to the loss of H+
during ionization. Other fragments used are m/z 211 and m/z and m/z 212, corresponding
to the loss of a hydroxyl group and a methyl radical, respectively. The detection limits are
ranged from ppt (ng L-1
) level to ppb level (μg L-1
) [93]. Compared to UV and FL
detectors, MS detector applies more reliable identification of BPA, and thus can be
conjunct with those two detectors for the qualitative analysis [97].
Electrochemical detection
Electrochemical detection (ECD) is mainly used for the determination of BPA in
biological fluid [101-103] and environmental water [16, 104]. It also has similar
chromatographic conditions to those applied in UV and FL detection. Isocratic elution is
recommended than gradient elution to avoid the large equilibrium time during the

23
analysis [105]. The mobile phase is usually modified with some electrolyte content and
adjusted to a proper PH to achieve a better sensitivity [85]. For example, Rezzano et al.
[106] used a mobile phase of methanol/water containing 10mM KNO3 and 0.25mM
H2SO4 as supporting electrolyte and the method detection limit was lowered to 0.2 ppb
(μg L-1
). A better sensitivity can also be obtained by using a chemically modified
electrode prepared by coating a glassy carbon electrode with a Ni-Protoporphyrin IX
dimethyl ester film [107]. Compare to UV and FL detection, ECD is highlighted for its
good sensitivity [108]. The detection limit for BPA can be below ppt level (ng L-1
) [16].
2.4.2 Chromatographic techniques: gas chromatography
Gas chromatography (GC) is more sensitive and better in resolution than liquid
chromatography (LC), because of the absence of chromatographic effect that happens in
LC [80]. Other than the sample preparation procedures for LC, a derivatization step on
BPA is usually adopted in GC such as silylation [109, 110] and acetylation [111, 112].
The derivatization step leads to an easy volatilization of BPA and consequently, better
separation from other analytes and a higher sensitivity [113]. However, a drawback is the
time consuming work and the probable contamination of the sample involved in these
steps.
The compounds are separated at their gas state in either a packed column or a
capillary column. A capillary column is preferred since it provides much higher
separation efficiency, while the amount of sample injected at one time is limited [114].

24
The programmed temperature is applied to the column to achieve better separation of the
compounds. The mobile phase is made of chemically inert gas, so there will be no
interaction between the compounds and the mobile phase during the analysis. Helium is
usually used as the mobile phase or carrier gas. Other types of carrier gases are nitrogen,
argon and hydrogen.
A mass spectrometry (MS) detector is usually coupled with GC for the determination
of BPA. MS detection is operated with electron impact (EI) ionization in selected ion
monitoring (SIM) mode [115-118]. The fragments selected for quantitative analysis are
similar to those selected in LC-MS. The commonly used fragments for GC-MS method
are m/z 213, m/z 228 and m/z 119. The detection limits of BPA are usually in the ranges
of 0.5 to 6 ng L-1
and 0.04 to 0.6 μg L-1
[93].
2.4.3 Immunochemical techniques
The determination of BPA in foods (mainly in liquid foods) by immunochemical
techniques is very recent [119, 120]. Immunoassays provide good sensitivity and
specificity, though they are easy to perform and low in cost [85]. The analysis is carried
out by using polyclonal mammalian [121] and chicken [122] antibodies in enzyme linked
immunosorbent assays (ELISA). BPA is conjugated with a protein to form a complete
antigen, and then to initiate an immune response [119, 123]. The detection limits are in a
range of 0.05 to 500 μg L-1
and mainly affected by the immunogen and the type of
antibody produced [85].

25
CHAPTER 3
Materials and Methods
This chapter mainly sets up the methodology for the migration of BPA from
plastic packaging materials into food simulants. A HPLC-UV method was adopted for the
quantitative analysis of BPA. The film samples used for migration testing were prepared
through melt-mixing followed by compression molding. Migration testing was performed
according to ASTM D 4754-98 under finely controlled laboratory conditions. Migration
modelling was carried out using MATLAB to fit the migration curves to the experimental
data. Statistical analysis was conducted by SAS. Methods used in this study can be
described by a flow chart (Figure 3.1) below.
Figure 3.1 Schematic diagram of the study on BPA migration from LDPE
into food simulants.
26
3.1 Materials
The main chemicals used were: BPA (99%+ pure, Sigma-Aldrich, Milwaukee, USA);
water (HPLC grade, Mallinckrodt Baker Inc., NJ, USA), acetonitrile (HPLC grade, EMD
Chemicals Inc., NJ, USA), ethanol (200 proof, Decon Labs Inc., PA, USA) and acetic
acid (ACS grade, EMD Chemicals Inc., NJ, USA). LDPE resin (Petrothene NA960000)
was obtained from Lyondell Chemical Company, TX, USA. Apparatus for migration
testing included: 40-ml pre-cleaned amber vials with slide valve caps with PTFE-silicon
septa (Cole-Parmer, USA), stainless steel wire, and glass beads (McMaster-Carr, USA).
3.2 Instrumental method for the quantification of BPA
High performance liquid chromatography (HPLC) analysis was performed using an
Alliance 2695 HPLC (Waters Co., MA, USA) equipped with an automatic
sampler/injector. An XBridge C18 3.5𝜇𝑚, 3.0 x 150 mm column with an XBridge guard
column (Waters Co., MA, USA) was kept at the temperature of 25ºC. The isocratic
elution was carried out using acetonitrile/water (40:60, v/v) as the mobile phase at a flow
rate of 0.5 ml/min. BPA was detected by an Alliance 2487 UV detector (Waters Co., MA,
USA) set at 225nm. The injection volume was 10 μl. All samples were tested in triplicate.
A stock solution of 1 mg/ml was prepared by weighting 100 mg BPA and dissolving
in acetonitrile in a 100 ml volumetric flask. The stock solution was stored in the
refrigerator at -4ºC. Standard solutions were prepared by diluting the stock solution with

27
the mobile phase. The calibration curve was established by measuring standard solutions
at six concentration levels ranging from 5 to 120 μg L-1
with triplicate per concentration.
Linear regression was applied using the analyte peak area vs. analyte concentration.
The limit of detection (LOD) was estimated by running successive dilutions of the
stock solutions until the height of the BPA peak was about three times of the background
noise level at the retention time. The limit of quantification (LOQ) was defined as 10
times of the background noise level.
Within-run precision was expressed as the relative standard deviation of ten
replicate measurements of a standard solution at three different concentrations (20, 40
and 80 μg L-1
). Between-run precision was expressed as the relative standard deviation of
eight independent replicate analyses (preparation and measurement) of a standard
solution of 20 μg L-1
.
3.3 Sample preparation for migration testing
3.3.1 Preparation of LDPE + BPA masterbatch
Masterbatches consisting of LDPE and BPA were obtained by melt mixing with three
different BPA concentration levels: 0.10, 0.25 and 0.50 wt%. A control (without BPA)
was also prepared. LDPE resin was ground in a Laboratory Mill with 1 mm mesh (Arthur
H. Thomas Company, PA., USA), and then pre-mixed with BPA at a specific
concentration in a blender. The mixture (40 g) with each BPA concentration was placed in
an electrically heated three-piece mixer with two roller style mixing blades (C.W.

28
Brabender Instruments Inc., NJ, USA) (Figure 3.2). The temperature was set at 150ºC in
order to achieve proper viscosity for mixing. The mixer was set at a rotation speed of 50
rpm and ran for 5 min per batch. The mixture was then kept in a refrigerator at -4ºC for 1
hr and ground again.
Figure 3.2 Electrically heated three-piece mixer with two roller style mixing blades.
Note: For interpretation of the references to color in this and all other figures, the reader
is referred to the electronic version of this dissertation
3.3.2 Film sample formation for migration testing
Masterbatch at each BPA concentration level was used for film formation.
Unoriented film samples for migration testing with a thickness of 117±4 μm (N=24) were

29
made by compression molding using a Carver Laboratory Press (Carver Inc., IN, USA)
(Figure 3.3). The temperature of both upper and lower plates of the compression molder
was set at 120ºC. Masterbatch sample of about 1 g was placed on the lower plate and
melted under atmospheric pressure. Then, the pressure was increased to 10,000 pounds
gradually and kept for 5 min. The film was cooled with a flow of cooling water to room
temperature. The pressure was then released, and disks (1 cm in diameter) were cut from
the film and used for the migration testing. A control film (without BPA) was also made
by the same procedures.
Figure 3.3 Carver Laboratory Press used for compression molding.

30
3.4 Characterization of LDPE film
3.4.1 Determination of initial BPA content in LDPE film
Initial BPA concentrations in LDPE film were determined by reflux extraction [124]
before the samples were used for the migration testing. Film disks at each BPA
concentration level as well as the control film weighting approximately 0.3 g were placed
in a 250 ml round-bottom flask, and reflux-extracted by 100 ml ethanol for 60 min. A
small portion of the extracting solvent was diluted, transferred to an auto-sampler vial,
and analyzed by HPLC-UV. To ensure that all BPA was extracted, the reflux extraction
was repeated. The first extraction was considered complete if <2 wt% BPA was found in
the second one. The extraction was conducted in triplicate.
3.4.2 Determination of BPA distribution in LDPE film
Infrared spectrometry was performed on a Shimadzu IRPrestige-21 FTIR apparatus
(Shimadzu Co., Japan) equipped with a Pike Technologies horizontal attenuated total
reflectance (HATR) accessory. The system was operated by Shimadzu IRsolutioin
software. In order to obtain a higher absorbance for the analysis, LDPE film samples with
the initial BPA concentration of 0.5 wt% (nominal) were selected and tested in triplicate.
Each film sample was scanned by transmission spectroscopy at five different places and
HATR spectroscopy of both sides with fifteen different places on each side within the
range 4000-400 cm-1
. Absorbance (peak intensity) at 827 cm-1
was recorded for each scan
and correlated to the BPA concentration in LDPE film. Those absorbance values were

31
considered an indication of BPA distribution in LDPE film.
3.4.3 Thermal analysis
The melting temperature (𝑇𝑚) and percent crystallinity (𝑋𝑐) of LDPE films without
and with BPA (0.5 wt% in nominal) were determined using a differential scanning
calorimeter (DSC Q-100, TA Instruments Inc., DE, USA). Transition temperatures were
obtained in accordance with ASTM D3418-03. The percent crystallinity was calculated
with the equation below:
𝑋𝑐 =∆𝐻𝑚
∆𝐻𝑚0 (3.1)
where ∆𝐻𝑚 is the enthalpy of fusion of the sample, and ∆𝐻𝑚0 is the heat of fusion of 100%
cystalline LDPE (290 J g-1
) [125]. 𝑇𝑚 and 𝑋𝑐 values were determined from the first
heating cycle from 20ºC to 180ºC with a ramp rate of 10ºC min-1
. All tests were done in
triplicate and the data were analyzed by TA Universal Analysis software (TA Instruments
Inc., DE, USA).
3.5 Migration experiment
Migration testing was carried out according to ASTM D 4754-98, at three different
temperatures (40, 60 and 80ºC), three different initial BPA concentrations (determined
after the film was produced), and three different food simulants (water, 3% (w/v) acetic
acid and 95% ethanol). Two-sided liquid extraction (Figure 3.4) was performed by
placing 10 film disks (around 0.35 g) of each BPA concentration in a 40-ml amber glass

32
vial, and 30 ml food simulant of each type was added. The disks were placed on the
stainless steel wire and separated by glass beads. The vials were kept in a water bath
(±1ºC) at each temperature. An extra experiment was conducted at room temperature
(22ºC) to simulate food storage conditions. At this situation, two-sided extraction of film
disks with the initial BPA concentration of 0.25 wt% (nominal) was conducted in each
food simulant. A small portion of solvent was taken with an injection syringe at variable
time intervals until the equilibrium of migration was achieved. The solvent sample was
properly diluted, transferred to an auto-sampler vial, and analyzed by HPLC-UV.
Figure 3.4 Apparatus for two-sided contact migration testing.

33
3.6 Estimation of 𝑫𝒑 and 𝑲𝑷,𝑭
Diffusion coefficients (𝐷𝑃 ) and partition coefficients (𝐾𝑃,𝐹 ) were derived from
equations 2.6 and 2.8. Non-linear regression was performed by the curve fitting tool of
MATLAB (version 7.0, The MathWorks, Inc., MA, USA). The migration curve was
manually fitted until the best fit was achieved. The fit of the applied equation to the
experimental data can be expressed by the root mean square error (RMSE) [126]:
𝑅𝑀𝑆𝐸 =1
𝑀𝑃,0√1
𝑁∑[(𝑀𝐹,𝑡)𝑒𝑥𝑝𝑒𝑟𝑖𝑚𝑒𝑛𝑡𝑎𝑙,𝑖 − (𝑀𝐹,𝑡)𝑝𝑟𝑒𝑑𝑖𝑐𝑡𝑒𝑑,𝑖]
2𝑁
𝑖=1
(3.2)
where 𝑁 is the number of experimental points per migration curve; 𝑖 is the number of
observations; 𝑀𝐹,𝑡 is the amount of migrant in the food simulant at time t; and 𝑀𝑃,0 is the
initial amount of migrant in the polymer.
Some assumptions were made to enable the application of the two models [127]:
(1) The film disks should be even in thickness;
(2) Migrant initially is homogeneously distributed through the plastic film;
(3) There is no migrant in food simulants at the beginning of the migration;
(4) 𝐷𝑃 is a constant at dilute migrant concentrations (<1%);
(5) There is no swelling effect caused by food simulants.
3.7 Statistical analysis
A 33 full factorial design was adopted for the migration testing, with three factors:
temperature, initial BPA concentration and food simulant type, each at three levels. Food

34
simulant type was an incontinuous variable and taken as the category. Temperature and
initial BPA concentration were taken as continuous variables under each category. The
diffusion coefficient, 𝐷𝑃, as an indicator of the migration rate, was the response variable.
To investigate the effect of the three factors and their interactions on the diffusion
coefficient, a general linear model [128] was introduced:
𝑌 = 𝛽0 + 𝛽1𝑋1 + 𝛽2𝑋2 + 𝛽3𝑋3 +
𝛽12𝑋1 ∗ 𝑋2 + 𝛽23𝑋2 ∗ 𝑋3 + 𝛽13𝑋1 ∗ 𝑋3 +
𝛽123𝑋1 ∗ 𝑋2 ∗ 𝑋3 (3.3)
There were seven effects involved, including three main effects (effect of temperature,
initial BPA concentration and food simulant type), three two-way interactions and one
three-way interaction. A normal distribution of the response variable was assumed for the
use of the model. To meet this assumption, natural log transformation on 𝐷𝑃 values was
carried out without changing the nature of the interaction term. Three-way analysis of
variance (ANOVA) was conducted by SAS (version 9.2, SAS Institute Inc., NC, USA) to
determine whether each of the effects was significant (𝑃𝑟 < 0.05) on the diffusion
coefficient. Based on the analysis, an empirical model was developed to express the
diffusion coefficient as a function of temperature and initial BPA concentration for each
food simulant. Parameter estimation was carried out by SAS as well.
3.8 Modelling of BPA concentration profiles in LDPE film
The concentration profile in the polymer film can be expressed by Fick’s second law
in one dimension:

35
𝜕𝐶(𝑥, 𝑡)
𝜕𝑡= 𝐷𝑃
𝜕2𝐶(𝑥, 𝑡)
𝜕𝑥2 (3.4)
𝐷𝑃 values were generated from the experimental data. 𝐶(𝑥, 𝑡) was solved by using the
following initial and boundary conditions.
Initial conditions:
𝐶𝑃(𝑥, 0) = 𝐶𝑃,0
𝐶𝐹(0) = 0
Boundary conditions:
𝐶𝑃(0, 𝑡) = 𝐶𝑃(𝐿, 𝑡) = 𝐶𝐹(𝑡)
where 𝐶𝑃,0 is the initial migrant concentration in the polymer; L is the polymer thickness;
x is the position in the polymer ranges from 0 to L. 𝐶𝐹(𝑡) is the migrant concentration in
the food simulant.
To solve 𝐶(𝑥, 𝑡) based on the initial and boundary conditions, the following
assumptions are made.
(1) Initially, the migrant is evenly distributed throughout the polymer and there is no
migrant in the solvent.
(2) There is no swelling effect caused by the solvent. Migration behavior in the polymer
is Fickian, and the diffusion coefficient is constant during the migration.
(3) The migrant concentrations at both sides of the interface between the polymer and the
solvent should be equal.
(4) The migrant has a good solubility in the solvent. Finally, most of the migrant migrate
into the solvent.

36
(5) The migrant concentration at the interface of the polymer is assumed to be equal to
that in the solvent.
The BPA concentration profiles in LDPE film was plotted by MATLAB using a “pde”
(partial differential equation) function. Diffusion coefficients, initial and boundary
conditions were manually input to generate the concentration profiles.

37
CHAPTER 4
Results and Discussion
4.1 Performance of HPLC-UV method
BPA was eluted out around 6.5 min and fully separated from other chemicals (Figure
4.1). The calibration curve is generated from standard solutions (5-120 μg L-1
), and
plotted based on the average response of three replicates. A linear relationship was
obtained with the correlation coefficient of 0.9990. The limit of detection (LOD) and
limit of quantification (LOQ) were determined to be 1 μg L-1
and 3 μg L-1
, respectively.
Within-run precision, expressed as relative standard deviation (RSD) (N=10), at 20, 40
and 80 μg L-1
of the mobile phase, was 1.62%, 0.98% and 0.56%, respectively. Between-
run precision, expressed as RSD (N=8) at 20 μg L-1
of the mobile phase, was 3.31%.
These values indicate a good method performance.
Figure 4.1 HPLC-UV chromatogram of a standard solution containing 10 μg L-1
BPA.

38
4.2 Properties of LDPE film
Initial BPA concentrations in LDPE film were determined to be 0.41±0.01, 1.42
±0.08 and 2.66±0.14 mg g-1
. No BPA was detected in the control sample. A 50% decrease
was found between the amount of BPA when it was initially added into the polymer and
after the film was produced and ready to be tested for migration. This was mainly due to
the heat and high pressure during the manufacture.
Homogeneous distribution of BPA throughout the film samples was essential for the
application of diffusion models. FTIR analysis on the film samples demonstrate that BPA
was approximately even distributed throughout the film as shown in Table 4.1. For each
film sample, similar absorbance values were obtained for both sides and the whole
sample. The variability (relative standard deviation) for each absorbance value was below
4% in most cases and no more than 5%. The absorbance values were also close to each
other between different film samples.
Thermal properties of LDPE films without and with BPA (0.5 wt% in nominal) were
determined by DSC. The melting temperatures were 110.2±0.2ºC and 110.8±0.8ºC,
respectively. The percent crystallinity was 37.3±0.6% and 36.7±0.2%, respectively. It can
be seen that the addition of BPA did not significantly change the morphology of the film.

39
Table 4.1 Absorbance of BPA (0.5 wt% in nominal) in LDPE film obtained by HATR
spectroscopy and transmission spectroscopy.
Sample name Absorbance x 10
-2
Top side SD Bottom side SD Whole sample SD
Sample 1 6.16 0.24 6.01 0.29 6.12 0.29
Sample 2 6.03 0.27 5.89 0.23 5.92 0.19
Sample 3 5.95 0.18 6.08 0.24 6.04 0.21
Note: Absorbance values (15 replicates) for top and bottom sides were obtained by
HATR spectroscopy; absorbance values (5 replicates) for the whole sample were obtained
by transmission spectroscopy.
4.3 𝑫𝒑 and 𝑲𝑷,𝑭 determination
LDPE is selected because it is very commonly used as food packaging materials.
Also, as mentioned previously (section 3.6), the use of diffusion models requires some
assumptions. LDPE was selected as a simple system to better meet these assumptions and
examine the applicability of these models. A weak interaction was expected between
polar BPA and non-polar LDPE. A weak interaction was also expected between the polar
food simulants and non-polar LDPE, so the food simulant would not have a significant
effect on the morphology of the polymer. Therefore, diffusion models can be more easily
applied to describe the migration process.
Experimental data were applied for the determination of diffusion parameters by
equations 2.6 and 2.8. Equation 2.6 was used for the parameter estimation of both 𝐷𝑃 and
𝐾𝑃,𝐹, while equation 2.8 was only used for the calculation of DP. Diffusion coefficients
40
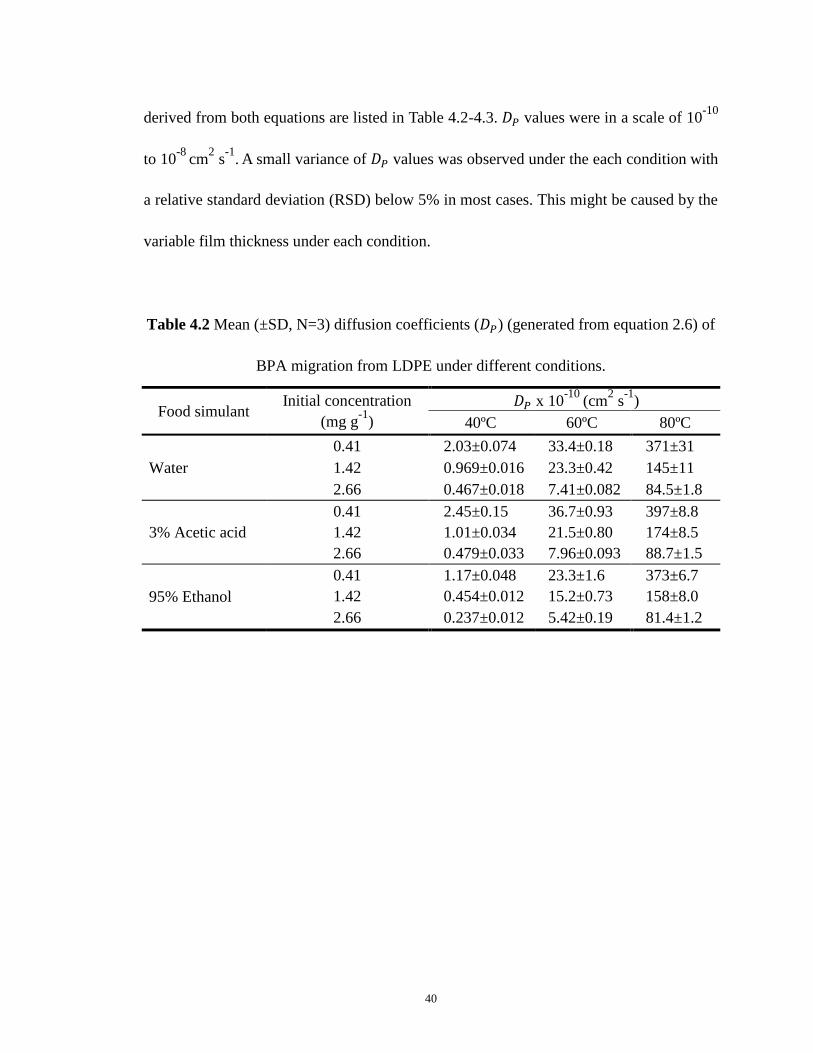
derived from both equations are listed in Table 4.2-4.3. 𝐷𝑃 values were in a scale of 10-10
to 10-8
cm2 s
-1. A small variance of 𝐷𝑃 values was observed under the each condition with
a relative standard deviation (RSD) below 5% in most cases. This might be caused by the
variable film thickness under each condition.
Table 4.2 Mean (±SD, N=3) diffusion coefficients (𝐷𝑃) (generated from equation 2.6) of
BPA migration from LDPE under different conditions.
Food simulant Initial concentration
(mg g-1
)
𝐷𝑃 x 10-10
(cm2 s
-1)
40ºC 60ºC 80ºC
Water
0.41 2.03±0.074 33.4±0.18 371±31
1.42 0.969±0.016 23.3±0.42 145±11
2.66 0.467±0.018 7.41±0.082 84.5±1.8
3% Acetic acid
0.41 2.45±0.15 36.7±0.93 397±8.8
1.42 1.01±0.034 21.5±0.80 174±8.5
2.66 0.479±0.033 7.96±0.093 88.7±1.5
95% Ethanol
0.41 1.17±0.048 23.3±1.6 373±6.7
1.42 0.454±0.012 15.2±0.73 158±8.0
2.66 0.237±0.012 5.42±0.19 81.4±1.2

41
Table 4.3 Mean (±SD, N=3) diffusion coefficients (𝐷𝑃) (generated from equation 2.8) of
BPA migration from LDPE under different conditions.
Food simulant Initial concentration
(mg g-1
)
𝐷𝑃 x 10-10
(cm2 s
-1)
40ºC 60ºC 80ºC
Water
0.41 2.06±0.061 33.4±0.36 372±31
1.42 1.00±0.028 23.5±0.43 147±11
2.66 0.498±0.018 7.62±0.079 85.2±1.8
3% Acetic acid
0.41 2.48±0.14 36.8±1.0 398±9.6
1.42 1.04±0.038 21.7±0.81 175±7.9
2.66 0.507±0.034 8.14±0.092 89.4±1.5
95% Ethanol
0.41 1.17±0.048 23.3±1.6 373±6.7
1.42 0.471±0.013 15.3±0.86 159±8.0
2.66 0.254±0.065 5.51±0.19 82.0±1.3
DP values obtained from equations 2.6 and 2.8 were compared. Student’s T-test
(α=0.05) was applied for statistical analysis and no statistical difference was found
between the DP values from each equation under the same condition. However, equation
2.6 is preferred since it provides both parameters DP and KP, F, while equation 2.8 is a
further simplified model based on many assumptions, which limits its application.
Partition coefficients derived from equation 2.6 are listed in Table 4.4. 𝐾𝑃,𝐹
represents the partition of the migrant between the two phases: polymer and food
simulant. The small 𝐾𝑃,𝐹 values indicate that BPA is more likely to migrate into the food
simulant rather than stay in the polymer during the migration testing. BPA is insoluble in
LDPE due to its polar nature and the non-polar nature of the polymer. But it was very
soluble in ethanol and a little soluble in water with a solubility of 300 mg L-1
at room
temperature [93]. It was found that the maximum BPA concentration in each food

42
simulant was about 30 mg L-1
(calculated according to an initial BPA concentration of
2.66mg g-1
) which was far below the solubility limit in each food simulant. Due to the
large solvent (food simulant) to polymer volume ratio (about 80 in this study), there
would be a huge concentration gradient causing most of BPA migrate from the polymer
into the food simulant to try to equilibrate this gradient. A BPA migration level of >90%
was mostly found in the experiment, which has an agreement with the small 𝐾𝑃,𝐹 values
presented in Table 4.4.
Table 4.4 Mean (N=3) partition coefficients (𝐾𝑃,𝐹) (generated from equation 2.6) of BPA
between LDPE and food simulants under different conditions.
Food simulant Initial concentration
(mg g-1
)
𝐾𝑃,𝐹
40ºC 60ºC 80ºC
Water
0.41 1 1 0.3
1.42 3 1 1
2.66 8 3 1
3% Acetic acid
0.41 1 0.3 0.3
1.42 2 1 0.8
2.66 8 3 1
95% Ethanol
0.41 1 1 0.2
1.42 2 1 1
2.66 3 2 0.5
The fit of equation 2.6 to the experimental data was evaluated by RMSE in
equation 3.2 (Table 4.5). The small RMSE values indicate a good fit of the applied
equation to the experimental data. An example of the experimental data with the fitted

43
graph (generated from equation 2.6) is shown in Figure 4.2. The migration curve fits the
experimental data well within a wide range. A larger deviation is usually observed at a
higher migration level (>50%). As mentioned in section 4.2, there was a slightly uneven
distribution of BPA in LDPE film, which should be responsible to the deviation of
experimental data from the migration curve. Another source of the deviation could be the
experimental error.
Table 4.5 Mean (N=3) RMSE values as a measure of fit between the experimental data
and the applied diffusion equation.
Food simulant Initial concentration
(mg g-1
)
RMSE
40ºC 60ºC 80ºC
Water
0.41 0.046 0.052 0.055
1.42 0.068 0.053 0.054
2.66 0.055 0.043 0.056
3% Acetic acid
0.41 0.037 0.068 0.050
1.42 0.038 0.077 0.025
2.66 0.034 0.049 0.039
95% Ethanol
0.41 0.047 0.024 0.042
1.42 0.055 0.018 0.050
2.66 0.033 0.045 0.024

44
Figure 4.2 Amount of BPA migrated from LDPE into 95% ethanol at (a) 40ºC, (b) 60ºC
and (c) 80ºC relative to the initial amount in the polymer (1.42 mg g-1
).

45
4.4 Effects of various factors on the diffusion coefficient
Diffusion coefficient can be taken as an indicator for the migration rate, or how fast
the migrant moves through the polymer. It is also important to evaluate the effects of
various factors and their interactions on the diffusion coefficient in order to predict how
the diffusion coefficient behaves under different conditions. The evaluation was
conducted by SAS software using equation 3.3 and the results are listed in Table 4.6. The
effects of all the factors (temperature, initial BPA concentration and food simulant type)
are significant on the diffusion coefficient. The interaction between temperature and food
simulant type was also significant on the diffusion coefficient, but not for the other two-
way and three-way interaction of the factors.
Table 4.6 Effect of temperature, initial BPA concentration, food simulant type and their
interactions on the migration rate at 𝛼 = 0.05.
Effect Df F value Pra > F Power
Temperature 1 2767.81 <.0001 0.999
Concentration 1 63.85 <.0001 0.999
Simulant 2 8.54 0.0005 0.961
Temp*Conc 1 0.24 0.6285 0.077
Temp*Simulant 2 4.85 0.0107 0.784
Conc*Simulant 2 0.19 0.8300 0.078
Temp*Conc*Simulant 2 0.11 0.8934 0.067
Note: a. Pr value ≤0.05 indicates a significant effect on the diffusion coefficient.

46
Effect of temperature
In rubbery polymers, the relationship between the diffusion coefficient and
temperature (above the polymer glass transition temperature, Tg) can be described using
an Arrhenius type of equation [129]:
𝐷 = 𝐷0 exp (−𝐸𝑎𝑅𝑇) (4.1)
where 𝐸𝑎 represents the activation energy of diffusion; 𝑅 is the gas constant; and 𝑇 is the
absolute temperature. A linear relationship was obtained by plotting ln (𝐷𝑝) as a function
of inverse temperature ( 𝑅2 > 0.99 ). Activation energies of BPA migration were
calculated to be 118±2.6 kJ mol-1
in water, 118±1.9 kJ mol-1
in 3% acetic acid and
134±1.4 kJ mol-1
in 95% ethanol. Similar 𝐸𝑎 values were obtained for each food simulant
regardless of the initial BPA concentrations. The reason could be the very small amount
of BPA (< 0.5 wt% in nominal) added to LDPE, which has nearly no effect on the
polymer morphology according to the DSC results. This behavior coincides with the non-
significant interaction effect between temperature and initial BPA concentration from the
statistical analysis.
𝐷𝑃 values obtained at 22ºC were compared with the ones predicted by the Arrhenius
equation (Figure 4.3). The difference between the experimental and predicted values
were within the range of 6 , indicating a reliable application of the Arrhenius
equation.

47
Figure 4.3 Mean (±SD, N=3) experimental and predicted diffusion coefficients of BPA
in LDPE contacting with three different food simulants.
Note: The experiment was conducted at room temperature with an initial BPA
concentration of 1.42 mg g-1
.
Effect of initial BPA concentration
As initial BPA concentration increased, the diffusion coefficient decreased. The
transport of BPA in the polymer was restricted by the mobility of polymer chains and the
free volume in the polymer [4, 61]. Since the addition of BPA was too little in amount to
cause an effect the polymer matrix, there should be nearly no modification on the
mobility of polymer chains by BPA. A longer time for the equilibrium of migration was
required at a higher initial BPA concentration. The initial concentration dependence of
diffusion coefficients can be expressed in an exponential form, as an approximately linear
relationship (𝑅2 > 0.95) was obtained after natural log transformation on 𝐷𝑝 values. An

48
example is shown in Figure 4.4.
Figure 4.4 Diffusion coefficient of BPA in LDPE in contact with water as a function of
initial BPA concentration at different temperatures.
Note: Each data point represents the mean values of triplicate analysis. The parallel lines
indicate that the interaction between temperature and initial BPA concentration is not
significant.
Effect of food simulant type and its interaction with temperature
The transport property of the polymer phase varies with different types of food
simulants [130]. Table 4.2 shows that the diffusion coefficients were higher in water and
3% acetic acid than in 95% ethanol at 40 and 60ºC. This phenomenon may be attributed
to the affinity between LDPE and the solvent (food simulant). According to regular
solution theory (RST), the affinity between the polymer and the solvent can be quantified
-25
-23
-21
-19
-17
-15
0 0.5 1 1.5 2 2.5 3
Ln(D
P)
CP,0 (mg g-1)

49
by solubility parameter distance, Ra, expressed as [59]:
𝑅𝑎 = √4(𝛿𝐷𝑝 − 𝛿𝐷𝑠)2 + (𝛿𝑃𝑝 − 𝛿𝑃𝑠)2 + (𝛿𝐻𝑝 − 𝛿𝐻𝑠)2 (4.2)
where 𝛿𝐷, 𝛿𝑃 and 𝛿𝐻 are dispersion, polar and hydrogen bonding parameters, respectively.
The second subscript 𝑝 and 𝑠 represent the polymer and the solvent, respectively. The
smaller 𝑅𝑎, the higher the affinity between the polymer and the solvent. The solubility
parameters for LDPE and each food simulant at room temperature, and the calculated 𝑅𝑎
values are listed in Table 4.7. Water was used to represent 3% acetic acid since similar
diffusion coefficients were obtained for the two simulants.
Table 4.7 Dispersion (𝛿𝐷), polar (𝛿𝑃) and hydrogen bonding (𝛿𝐻) solubility parameters
for LDPE and different food simulants.
Material 𝛿𝐷 𝛿𝑃 𝛿𝐻 𝑅𝑎 from LDPE
Ref. MPa
1/2 MPa
1/2 MPa
1/2 MPa
1/2
LDPE 17.9 0 0 0 [131]
Water 15.5 16 42.3 45.5 [132]
Ethanol 7.7 4.3 9.5 22.9 [132]
The affinity between LDPE and ethanol was higher than that between LDPE and
water. During the migration, the solvent penetrated the polymer matrix and a higher
affinity between polymer and the solvent would slow the movement of BPA. Therefore,
there was a delay in the diffusion of BPA in LDPE when exposed to ethanol and BPA
migrated faster into water and 3% acetic acid. At 80ºC, the diffusion coefficients of BPA
for all food simulants were higher than the other temperatures, but there was no much

50
difference among different food simulants. It was expected that the whole system got
very high mobility at high temperatures; therefore affinity did not play an important role
on the migration. The effect of food simulant type on the diffusion coefficient at lower
temperature tended to disappear at higher temperatures. The influence of food simulant
type on the diffusion coefficient with the change of temperature showed an interaction
effect indicated by the statistical analysis.
4.5 Empirical model for BPA migration from LDPE film
A relationship can be established to express the diffusion coefficient as a function of
temperature and initial BPA concentration for each food simulant. Again, a general linear
model was introduced:
ln(𝐷𝑃) = a0 + a1 ∗ T + a2 ∗ C + a3 ∗ T ∗ C (4.3)
Parameters estimation was carried out by running “glm” function of SAS software, and
the significance of each parameter was evaluated by comparing with 0 (non-significant).
The results are shown in Table 4.8. 𝑅2 values showed a good fit of the model to the
experimental data. The positive a1 values indicated that diffusion coefficient increased
with the increase of temperature and the effect of temperature on the diffusion coefficient
is stronger in 95% ethanol than in the other simulants. The negative a2 values showed an
inverse relationship between the diffusion coefficient and the initial BPA concentration,
and the effect of initial BPA concentration on the diffusion coefficient was stronger in 3%
acetic acid. It also can be seen that the interaction between temperature and initial BPA

51
concentration did not have a significant effect on the diffusion coefficient since a3 values
were very close to 0 with 𝑃𝑟 > 0.05.
Table 4.8 Parameter estimation of the empirical equation 4.3 for BPA migration from
LDPE into different food simulants.
Food simulant a0 a1 a2 a3a 𝑅2
Water -27.1006 0.1285 -0.6446 0.0002 0.9914
3% Acetic acid -26.8664 0.1266 -0.7779 0.0015 0.9950
95% Ethanol -28.3486 0.1442 -0.7246 0.0008 0.9947
Note: a. Parameter for a3 was not significant (𝑃𝑟 > 0.05).
4.6 BPA concentration profiles in LDPE film
With the diffusion coefficients obtained from the kinetic study, one can model the
concentration profiles of BPA in LDPE film during the migration. Concentration profiles
were generated by solving Fick’s second law with initial and boundary conditions. An
example of BPA concentration profiles in LDPE film are shown in Figure 4.5. Both 2-D
and 3-D concentration profiles are generated by MATLAB. The migrant concentration in
the solvent can be considered to be 0 due to the large volume of the solvent compared to
that of the polymer, as well as the extremely low initial migrant concentration in the
polymer. Therefore, a concentration of 0 can be applied to the boundary condition that
made the modeling of concentration profile easier.

52
Figure 4.5 Concentration profiles (2D and 3D) of BPA in LDPE contact with water at
60ºC with an initial BPA concentration of 1.42 mg g-1
.

53
CHAPTER 5
Conclusion
5.1 Outcomes from the study
Due to the potential adverse heath effect of additives such as BPA in food
packaging materials, migration testing on these low molecular weight components is
required. Migration level is determined from the experiment and used for estimating the
daily intake, in order to protect human health. In this study, A HPLC-UV method was
successfully built for BPA analysis. The detection limit was found to be 1μg L-1
which is
quite capable to determine the trace amount of BPA in the food simulant. The small
variance and excellent repeatability of the instrumental method enables the requisition of
accurate data, which is essential when dealing with the migration modelling.
Migration of BPA from LDPE was diffusion controlled and followed the Fickian
diffusion behavior. The migration process was affected by chemical properties of the
migrant, the food simulant and the polymer. Parameters related to migration process such
as diffusion coefficients and partition coefficients can be determined by Fick’s diffusion
equations through a kinetic study under finely controlled laboratory conditions. 𝐷𝑃 values
obtained under different conditions ranged from 10-10
to 10-8
cm2 s
-1. These equations
could also be applied to other migrant-polymer systems with weak interaction between
the migrant and the polymer.
The statistical analysis showed that temperature, initial BPA concentration, and food

54
simulant type, all significantly affected the diffusion coefficient. However, the interaction
effects of the factors on the diffusion coefficient were not significant, except for the
interaction of temperature and food simulant type. Among these factors, temperature
dependence of diffusion coefficients can be described using an Arrhenius type of
equation. Activation energies obtained were independent from the initial BPA
concentration, indicating that there was no obvious effect on polymer morphology caused
by the addition of BPA at very low concentration levels. The relationship between
diffusion coefficients and initial BPA concentration followed an exponential form. Based
on the statistical analysis, a general linear model can be applied to correlate the diffusion
coefficient to temperature and initial BPA concentration. This model may also be applied
to other polymer-migrant systems.
5.2 Prospects for the future work
The future work may concentrate on the following areas:
(1) Apply other instrumental methods for BPA analysis such as UV-Fl and GC-MS, and
make comparison between different methods;
(2) Perform one-sided migration testing using either film samples or containers, and
compare with the results of two-sided migration testing;
(3) Perform migration testing of BPA and its derivatives from other polymers such as PP
and PC, apply mathematical models to the migration process and validate these
models, and investigate the effect of various factors on the migration rate.

55
APPENDICES

56
APPENDIX A
Graphs for IR and thermal analysis of LDPE+BPA

57
Figure A1 FTIR graph of (a) BPA, (b) LDPE + BPA (0.5 wt%) and (c) LDPE.
Note: The absorbance at 827 cm-1
was used as an indicator for BPA distribution in LDPE.

58
Figure A2 DSC graph for (a) LDPE and (b) LDPE + BPA (0.5 wt%).
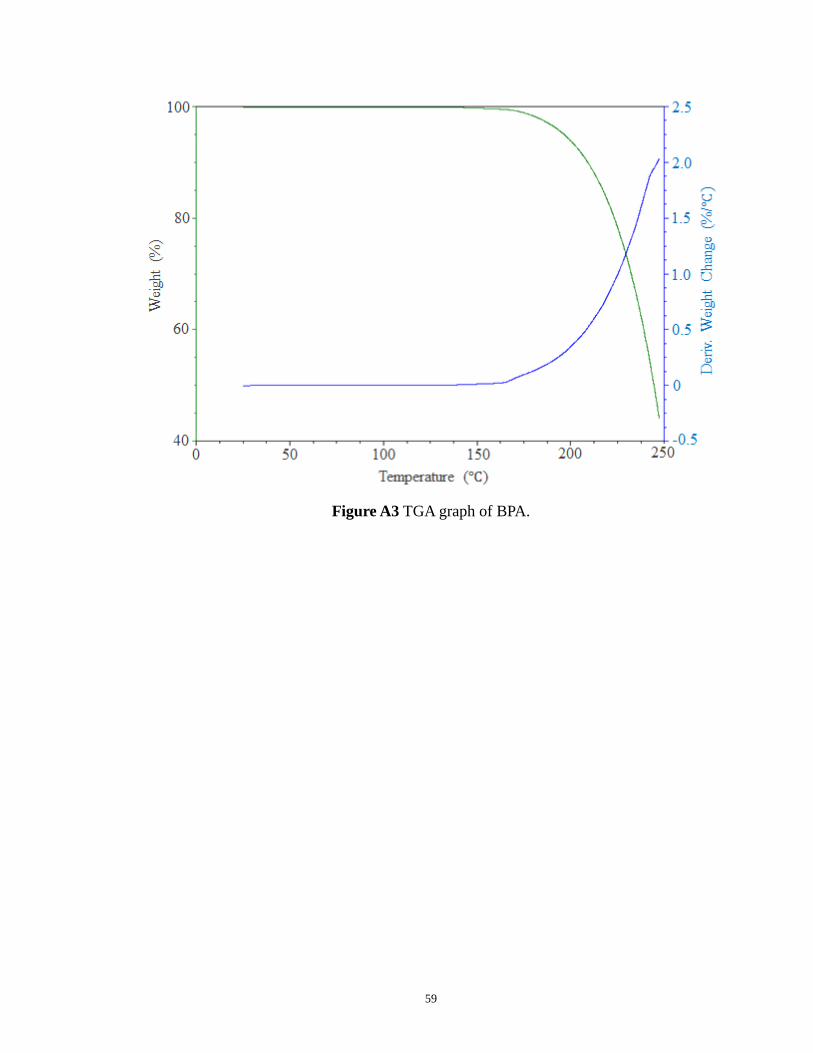
59
Figure A3 TGA graph of BPA.

60
APPENDIX B
Migration graphs obtained under different conditions

61
Figure B1 Amount of BPA migrated from LDPE into water at (a) 40ºC, (b) 60ºC and (c)
80ºC relative to the initial amount in the polymer (1.42 mg g-1
).

62
Figure B2 Amount of BPA migrated from LDPE into 3% acetic acid at (a) 40ºC, (b) 60ºC
and (c) 80ºC relative to the initial amount in the polymer (1.42 mg g-1
).
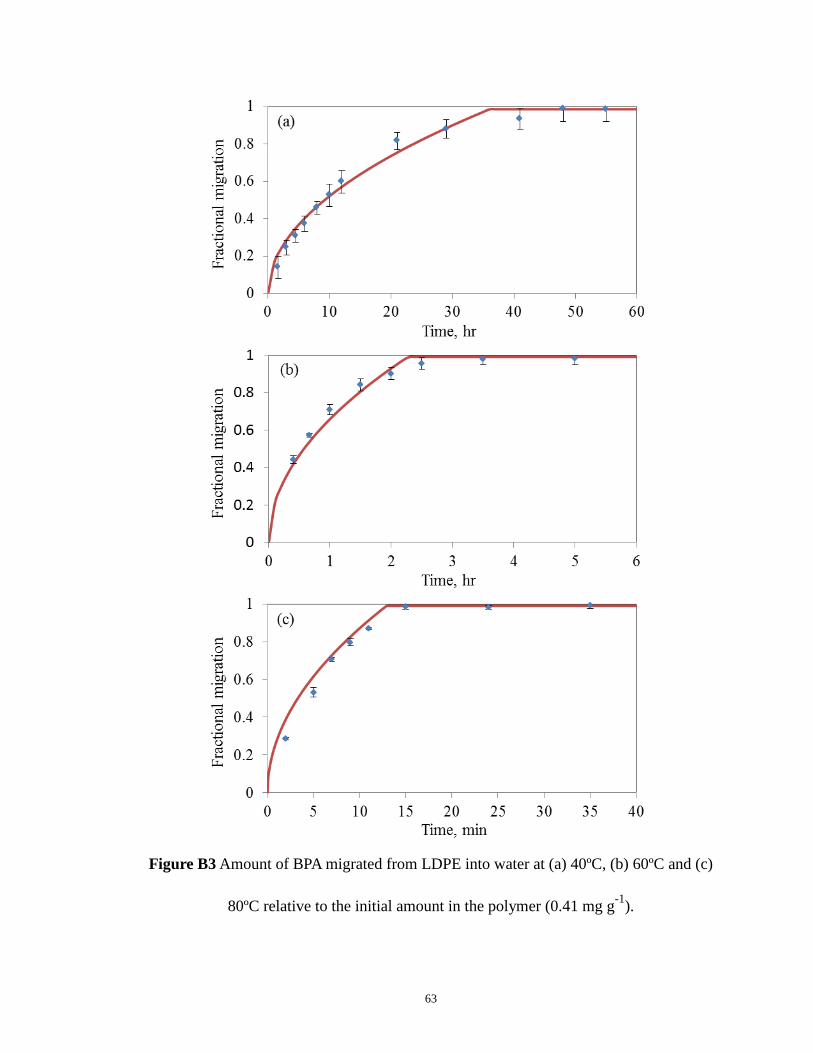
63
Figure B3 Amount of BPA migrated from LDPE into water at (a) 40ºC, (b) 60ºC and (c)
80ºC relative to the initial amount in the polymer (0.41 mg g-1
).

64
Figure B4 Amount of BPA migrated from LDPE into 3% acetic acid at (a) 40ºC, (b) 60ºC
and (c) 80ºC relative to the initial amount in the polymer (0.41 mg g-1
).

65
Figure B5 Amount of BPA migrated from LDPE into 95% ethanol at (a) 40ºC, (b) 60ºC
and (c) 80ºC relative to the initial amount in the polymer (0.41 mg g-1
).
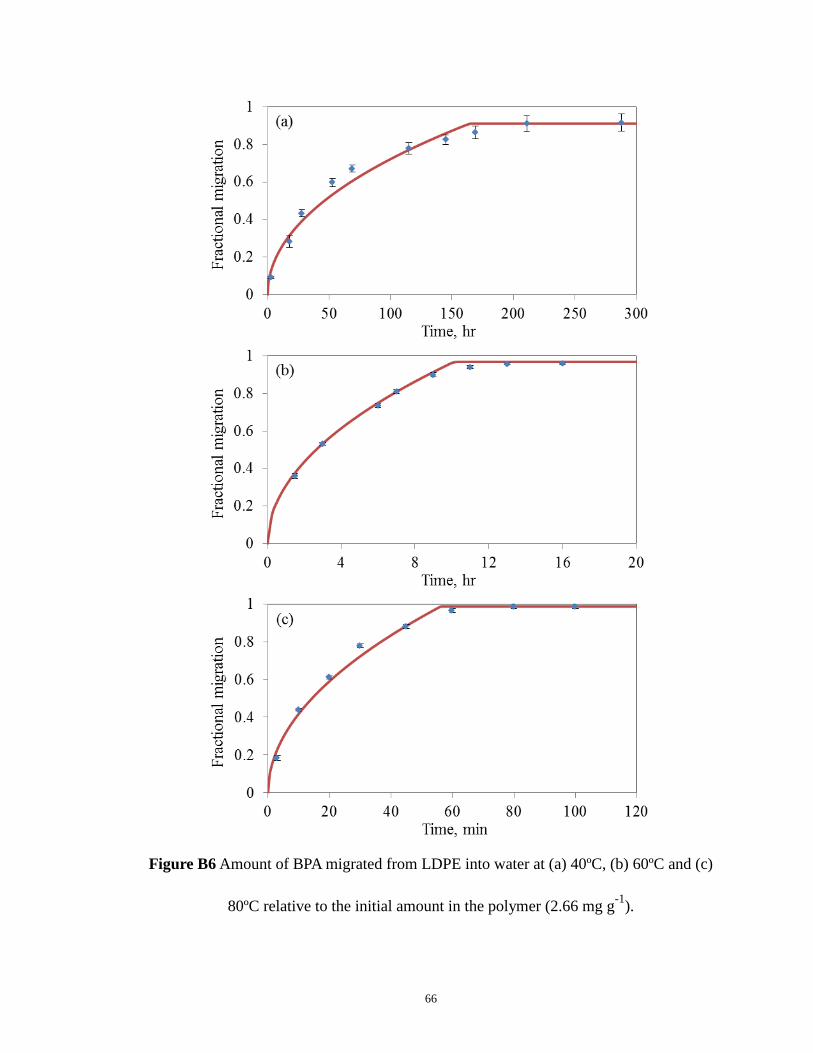
66
Figure B6 Amount of BPA migrated from LDPE into water at (a) 40ºC, (b) 60ºC and (c)
80ºC relative to the initial amount in the polymer (2.66 mg g-1
).
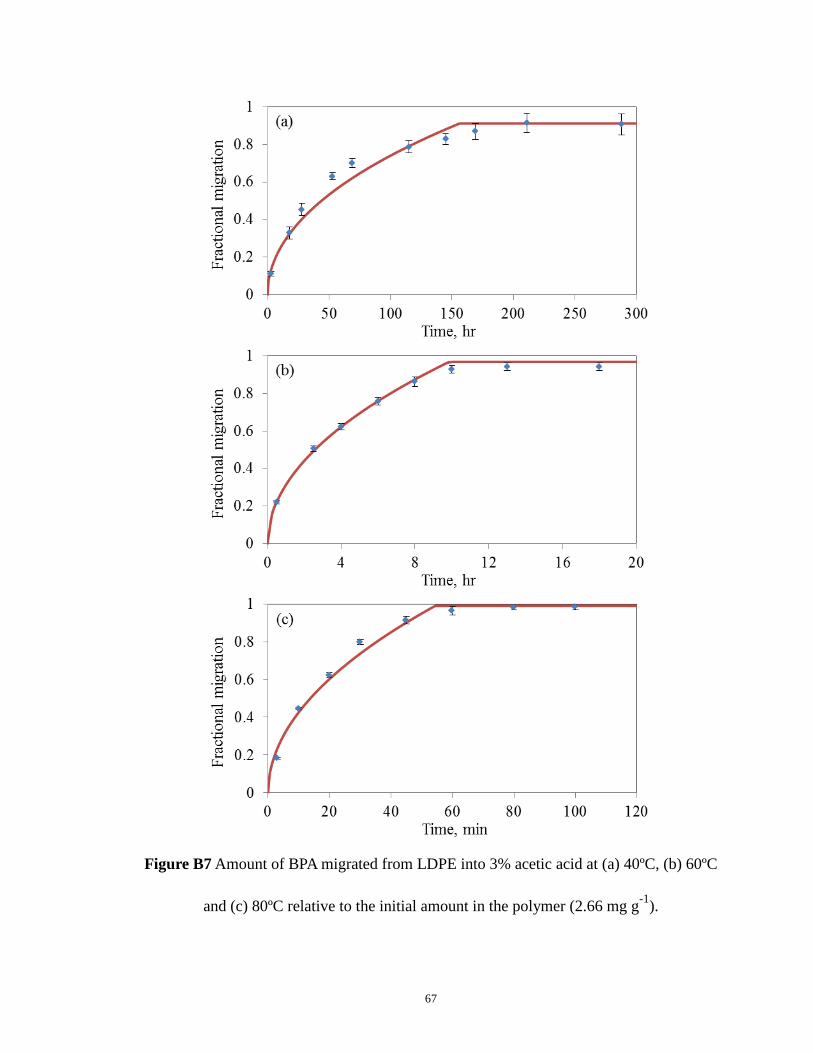
67
Figure B7 Amount of BPA migrated from LDPE into 3% acetic acid at (a) 40ºC, (b) 60ºC
and (c) 80ºC relative to the initial amount in the polymer (2.66 mg g-1
).

68
Figure B8 Amount of BPA migrated from LDPE into 95% ethanol at (a) 40ºC, (b) 60ºC
and (c) 80ºC relative to the initial amount in the polymer (2.66 mg g-1
).

69
REFERENCES

70
REFERENCES
1. Selke, S.; Culter, J. and Hernandez, R. 2004. Plastic packaging: Properties,
processing, applications, and regulations. Hanser Pub., Munich, Germany.
2. Baekeland, L.H. 1909. Method of making insoluble products of phenol and
formaldehyde. United States Patent Office, Patented Dec. 7, 1909.
3. Coles, R.; McDowell, D. and Kirwan, M. 2003. Food Packaging Technology.
CRC Press, Boca Raton, FL.
4. Piringer, O.G. and Baner, A.L. 2000. Plastic Packaging Materials for Food:
Barrier Function, Mass Transport, Quality Assurance, and Legislation.
WILEY-VCH Verlag GmBH.
5. Hernandez, R.J. and Gavara, R. 1999. Plastic Packaging: Methods for Studying
Mass Transfer Interactions. Pira International, Leatherhead, UK, pp 53.
6. Dermer, O.C.; McKelta, J.J. and Weismantel, G.E. 1999. Encyclopedia of
Chemical Processing and Design. Marcel Dekker Inc., New York.
7. European Commission 2002. Opinion of the Scientific Committee on Food on
Bisphenol A. expressed on 17 April 2002, SCF/CS/PM/3936 final, Brussels.
8. ChemSystems 2008. Report abstract of Bisphenol A. ChemSystems Process
Evaluation/Research Planning (PERP) program, released on Aug. 2008.
9. Yoshida, T.; Horie, M.; Hoshino, Y. and Nakazawa, H. 2001. Determination of
bisphenol A in canned vegetables and fruit by high performance liquid
chromatography. Food Addi. and Cont. 18: 69-75.
10. Paseiro-Losada, P.; Lopez-Cervantes, J.; Sanchez-Machado, D.I. and Simal-
Lozano, J. 2003. Effects of compression, stacking, vacuum packing and
temperature on the migration of bisphenol a from polyvinyl chloride packaging
sheeting into food simulants. Chromatographia 58: 327-330.
11. Szymanski, A.; Rykowska, I. and Wasiak, W. 2006. New ketoimine sorbents in
solid phase extraction for HPLC analysis of bisphenol A and other “endocrine
disrupting” residues in drinking water. Polish J. of Environ. Stud. 15: 479-483.
12. Cao, X.L.; Dufresne, G.; Belisle, S.; Clement, G.; Falicki, M.; Beraldin, F. and
Rulibikiye, A. 2008. Levels of bisphenol A in canned liquid infant formula

71
products in Canada and dietary intake estimates. J. Agric. Food Chem. 56:
7919-7924.
13. Maragou, N.C.; Makri, A.; Lampi, E.N.; Thomaidis, N.S. and Koupparis, M.A.
2008. Migration of bisphenol A from polycarbonate baby bottles under real use
conditions. Food Addi. and Cont. 25: 373-383.
14. Cao, X.L.; Corriveau, J.; Popovic, S.; Clement, G.; Beraldin, F. and Dufresne,
G. 2009. Bisphenol A in baby food products in glass jars with metal lids from
Canadian markets. J. Agric. Food Chem. 57: 5345-5351.
15. Fromme, H.; Küchler, T.; Otto, T.; Pilz, K. and Müller, J. 2002. Occurrence of
phthalates and bisphenol A and F in the environment. Water Res. 36: 1429-
1438.
16. Watabe, Y.; Kondo, T.K.; Imai, H.; Marita, M. and Tanaka, N. 2004. Reducing
Bisphenol A Contamination from Analytical Procedures To Determine Ultralow
Levels in Environmental Samples Using Automated HPLC Microanalysis. Anal.
Chem. 76: 105-109.
17. Sanchez, B.C.; Miguel, E. and Tadeo, J.L. 2009. Determination of
tetrabromobisphenol-A, tetrachlorobisphenol-A and bisphenol-A in soil by
ultrasonic assisted extraction and gas chromatography–mass spectrometry. J.
Chromatogr. A 1216: 5497-5503.
18. Kang, J.H.; Kondo, F. and Katayama, Y. 2006. Human exposure to bisphenol A.
Toxicology 226: 79-89.
19. Krishnan, A.; Stathis, P.; Permuth, S.; Tokes, L. and Feldman, D. 1993.
Bisphenol-A: An Estrogennic substance is released from polycarbonate flasks
during autoclaving. Endocrinology 132: 2279-2286.
20. Hammarling, L.; Gustavsson, H.; Svensson, K. and Oskarsson, A. 2000.
Migration of bisphenol-A diglycidyl ether (BADGE) and its reaction products in
canned foods. Food Addi. and Cont. 17: 937-943.
21. Vandenberg, L.N.; Hauser, R.; Marcus, M.; Olea, N. and Welshons, W.V. 2007.
Human exposure to bisphenol A (BPA). Reprod. Toxicol. 24: 139-177.
22. Begley, T.H. 1997. Methods and Approaches Used by FDA to Evaluate the
Safety of Food Packaging Materials. Food Additives and Contaminants, 14:
545-553.
23. Helmroth, I.E.; Rijk, R.; Dekker, M. and Jongen, W. 2002. Predictive modelling
of migration from packaging materials into food products for regulatory
purposes. Trends in Food Science & Technology 13: 102-109.

72
24. Zincke, T. 1905. Mittheilungen aus dem chemischen Laboratorium der
Universitat Marburg. Justus Leibigs Annals Chemie 343: 75-99.
25. Paseiro-Losada, P.; Sendon-Garcia, R.; Sanches-Silva, A.; Cooper, I. and Franz,
R. 2006. Revision of analytical strategier to evacuate different migrants from
food packaging materials. Trends Food Sci. Technol. 17: 354-366.
26. Kelland, K. 2010. Experts demand European action on plastics chemical.
Thomson Reuters, released on Jun. 2010.
27. EWG 2007. A Survey of Bisphenol A in U.S. Canned Foods. Environmental
Working Group, released on Mar. 5, 2007, available at:
http://www.ewg.org/reports/bisphenola.
28. NTP 2007. NTP-CERHR Expert Panel Report on the Reproductive and
Developmental Toxicity of Bisphenol A, National Toxicology Program, US
Department of Health and Human Services, released on November 26, 2007.
29. EPA 2010. Bisphenol A Action Plan. US Environmental Protection Agency,
released on March 29, 2010.
30. Colborn, T.; Dumanoski, D. and Myers, J.P. 1996. Our Stolen Future. Dutton,
Peguin Books, New York.
31. Rehmann, K.; Schramm, K.W. and Kettrup, A.A. 1999. Applicability of a yeast
oestrogen screen for the detection of oestrogen-like activities in environmental
samples. Chemosphere 38: 3303-3312.
32. Dodds, E.C. and Lawson, W. 1936. Synthetic estrogenic agents without the
phenanthrene nucleus. Nature, 137: 996.
33. Sekizawa, J. 2008. Low-dose effects of bisphenol A: a serious threat to human
health? J. Toxicol. Sci. 33: 389-403.
34. Howdeshell, K.L.; Hotchkiss, A.K.; Thayer, K.A.; Vandenbergh, J.G. and Saal,
F.S. 1999. Exposure to bisphenol A advances puberty. Nature 401: 763–764.
35. Honma, S.; Suzuki, A.; Buchanan, D.L.; Katsu, Y.; Watanabe, H. and Iguchi, T.
2002. Low dose effect of in utero exposure to bisphenol A and diethylstilbestrol
on female mouse reproduction. Reprod. Toxicol. 16: 117–122.
36. Nikaido, Y.; Yoshizawa, K.; Danbara, N.; Tsujita-Kyutoku, M.; Yuri, T. and
Uehara, N. 2004. Effects of maternal xenoestrogen exposure on development of
the reproductive tract and mammary gland in female CD-1 mouse offspring.
Reprod. Toxicol. 18: 803–811.
73
37. Yoshino, S.; Yamaki, K.; Yanagisawa, R.; Takano, H.; Hayashi, H. and Mori, Y.
2003. Effects of bisphenol A on antigen-specific antibody production,
proliferative responses of lymphoid cells, and TH1 and TH2 immune responses
in mice. Br J. Pharmacol. 138: 1271–1276.
38. Ishido, M.; Masuo, Y.; Kunimoto, M.; Oka, S. and Morita, M. 2004. Bisphenol
A causes hyperactivity in the rat concomitantly with impairment of tyrosine
hydroxylase immunoreactivity. J. Neurosci. Res. 76: 423–433.
39. Farabollini, F.; Porrini, S.; Della Seta, D.; Bianchi, F. and Dessi-Fulgheri, F.
2002. Effects of perinatal exposure to bisphenol A on socio-sexual behavior of
female and male rats. Environ. Health Perspect. 110 (suppl. 3): 409–414.
40. Keri, R.A.; Ho, S.M.; Patricia, A.; Gail, S.; Hunt, P.A.; Knudsen, K.E. and Soto,
M. 2007. An evaluation of evidence for the carcinogenic activity of bisphenol A.
Reprod. toxicol. 24: 240-252.
41. Yang, M.; Ryu, J.H.; Jeon, R.; Kang, D. and Yoo, K.Y. 2009. Effects of
bisphenol A on breast cancer and its risk factors. Arch. Toxicol. 83: 281-285.
42. Murray, T.J.; Maffini, M.V.; Ucci, A.A.; Sonnenschein, C. and Soto, A.M. 2006.
Induction of mammary gland ductal hyperplasias and carcinoma in situ
following fetal bisphenol A exposure. Reprod. Toxicol. 23: 383-390.
43. Meeuwen, J.A.; Burg, W.; Piersma, A.H.; Berg, M. and Sanderson, J.T. 2007.
Mixture effects of estrogenic compounds on proliferation and pS2 expression of
MCF-7 human breast cancer cells. Food and Chemical Toxicology 45: 2319-
2330.
44. Erickson, E. and Britt, E. 2008. Bisphenol A under scrutiny. Chemical and
Engineering News (American Chemical Society) 86: 36-39.
45. Saal, F.S. and Hughes, C. 2005. An extensive new literature concerning low-
dose effects of bisphenol A shows the need for a new risk assessment. Environ.
Health Persp. 113: 926-933.
46. Butterworth T. 2009. Science Suppressed: How America became obsessed with
BP. A STATS investigation, released on Jun. 12, 2009, available at:
http://stats.org/stories/2009/science_suppressed_BPA_intro_jun12_09.html
47. FDA 2008. Draft Assessment of Bisphenol A for Use in Food Contact
Applications. The Food and Drug Administration, released on Aug. 2008.
48. Health Canada 2008. Draft Screening Assessment for The Challenge Phenol, 4,
4'-(1-methylethylidene) bis- (Bisphenol A). Chemical Abstracts Service Registry
Number 80-05-7.

74
49. Health Canada 2008. Government of Canada Takes Action on Another Chemical
of Concern: Bisphenol A.
50. Bodach, J. 2009. Connecticut first state to ban BPA. The Hour Publishing Co.,
Sep., 2009, available at: http://www.thehour.com/story/470418.
51. Reppert-Bismarck, J. 2010. EU to ban Bisphenol A in baby bottles in 2011.
Thomson Reuters, released on Nov. 2010.
52. Willige, R.W.G. 2002. Effects of flavour absorption on foods and their
packaging materials, PhD thesis of Wageningen University, Netherland.
53. Reineccius, G. 1991. Off-flavors in foods. Crit. Rev. Food Sci. Nutr. 29: 381-
402.
54. Gilbert, S.G.; Miltz, J. and Giacin, J.R. 1980. Transport considerations of
potential migrants from food packaging materials. J. Food Process. Preserv. 4:
27-49.
55. Karayanni, S.T.; Demertzis, P.G. and Kontominas, M.G. 1987. Adsorption of
vinylchloride onto plasticized polyvinylchloride by classical partition in the
presence of various food simulating solvents: migration aspects, Lebensm.-
Wiss. u.-Technol. 20: 202-206.
56. Koszinowski, J. and Piringer, O. 1987. Food/package compatibility and
migration. J. Plast. Film Sheet 3: 96-111.
57. Crank, J. 1975. The Mathematics of Diffusion. Oxford University Press,
England.
58. Scott, R.L. and Hilderbrand, J. 1962. Regular Solutions. Prentice-Hall,
Englewood Cliffs, NJ.
59. Hansen, C.M. 1999. Hansen Solubility Parameters, A User’s Handbook. CRC
Press, Boca Raton, FL.
60. Hernandez, R.J. and Giacin, J.R. 1997. Factors affecting permeation, sorption,
and migration processes in package-product systems. Food storage stability,
CRC press online, Chapter 10.
61. Duda, J.L. 1996. Free-Volume Theory in: Neogi, P., Diffusion in Polymers,
Marcel Dekker Inc., New York.
62. Crank, J. and Park, G.S. 1968. Diffusion in Polymers. Academic Press, London.
75
63. Stannett, V.T.; Koros, W.J.; Paul, D.R.; Lonsdale, H.K. and Baker, R.W. 1979.
Recent advances in membrane science and technology. Adv. Polymer Sci. 32:
71-121.
64. Frisch, H.L. and Stern, S.A. 1983. Diffusion of Small Molecules in Polymers.
Crit. Rev. Solid State and Mater. Sci. 11: 123-187.
65. Vieth, W.R. 1991. Diffusion in and through Polymers, Hanser, Munich.
66. Frisch, H.L. 1962. Anomalous Polymer‐Penetrant Permeation. J. Chem. Phys.
37: 2408-2413.
67. Frisch, H.L. 1980. Sorption and transport in glassy polymers–a review.
Polymer Eng. Sci. 20: 2-13.
68. Alfrey, T.; Gurnee, E.F. and Lloyd, W.G. 1966. Diffusion in glassy polymers. J.
Polymer Sci. 12: 249-261.
69. Brandsch, J.; Mercea, P.; Ruter, M.; Tosa, V. and Piringer, O.G. 2002. Migration
modelling as a tool for quality assurance of food packaging. Food Addi. and
Cont. 19: 29-41.
70. Chung, D.; Papadakis, S.E. and Yam, K.L. 2002. Simple models for assessing
migration from food-packaging films. Food Addi. and Cont. 19: 611-617.
71. Feigenbaum, A.; Laoubi, S and Vergnaud, J.M. 1997. Kinetics of diffusion of a
pollutant from a recycled polymer through a gunctional barrier: recycling
plastics for food packaging. J. Applied Polymer Sci. 55: 597-607.
72. Franz, R.; Huber, M. and Piringer, O.G. 1997. Presentation and experimental
verification of a physico-mathematical model describing the migration across
functional barrier layers into foodstuffs. Food Addi. and Cont. 14: 627-640.
73. Lickly, T.D.; Rainey, M.L.; Burgert, L.C.; Breder, C.V. and Borodinsky, L.
1997. Using a simple diffusion model to predict residual monomer migration-
considerations and limitations. Food Addi. and Cont. 14: 65-74.
74. Perou, A.L.; Laoubi, S. and Vergnaud, J.M. 1999. Model for transfer of
contaminant during the coextrusion of three layer food package with a recyled
polymer: effect of the time of protection of the food of the relative thickness of
the layers. J. Applied Polymer Sci. 73: 1939-1948.
75. FDA 2007. Guidance for Industry: Preparation of Food Contact Notifications
and Food Additive Petitions for Food Contact Substances: Chemistry
Recommendations. Center for Food Safety and Applied Nutrition, The Food and

76
Drug Administration, released on Apr. 2007.
76. Snyder, R.C. and Breder, C.V. 1985. New FDA migration cell used to study
migration of styrene from polystyrene into various solvents. Analytical
Chemistry 68: 770–775.
77. Limm, W. and Holifield, H.C. 1995. Effects of temperature and mixing on
polymer adjuvant migration to corn oil and water. Food Addit. and Cont. 12:
609-624.
78. Simon, P. and Joner, E. 2008. Conceivable interactions of biopersistent
nanoparticles with food matrix and living systems following from their
physicochemical properties. Journal of Food and Nutrition Research, 47: 51-59.
79. Piringer, O.G.; Bieber, W.; Figge, K., Baner, A.L. and Franz, R. 1992.
Alternative fatty food simulants for migration testing of polymeric food contact
materials. Food Addi. and Cont. 9: 137-148.
80. Scott, R.P.W. 1995. Techniques and Practice of Chromatography, Marcel
Dekker Inc., New York.
81. Kondo, F.; Kang, J.H. and Kito, K. 2003. Factors influencing the migration of
bisphenol A from cans. J. Food Prot. 66: 1444-1447.
82. Szymanski, A.; Rykowska, I. et al. 2006. Determination of Bisphenol A in water
and milk by micellar liquid chromatography. ACTA Chroma. 17: 161-172.
83. Biles, J.E.; McNeal, T.P. et al. 1997. Determination of bisphenol A in Resusable
Polycarbonate Food-Contact Plastics and Migration to Food-Simulating
Liquids. J. Agric. Food Chem. 45: 3541-3544.
84. Howe, S.R. and Borodinsky, L. 1998. Potential exposure to bisphenol A from
food-contact use of polycarbonate resins. Food Addi. and Cont. 15: 370-375.
85. Rubio, S.; Ballesteros-Gomez, A. and Perez-Bendio, D. 2009. Analytical
methods for the determination of bisphenol A in food. J. Chromato. A 1216:
449-469.
86. Maragou, N.C.; Lampi, E.N.; Thomaidis, M.A. and Koupparis, M.A. 2006.
Determination of bisphenol A in milk by solid phase extraction and liquid
chromatography – mass spectrometry. J. Chromatogr. A 1129: 165.
87. Gallart-Ayala, H.; Moyano, E. and Galceran, M.T. 2007. Liquid
chromatography/multi-state mass spectrometry of bisphenol A and its
halogenated derivatives. Rapid Commun Mass Spectrom 21: 4039-4048.

77
88. Pulgar, R.; Olea-Serrano, M.F.; Novillo-Fertrell, A.; Rivas, A.; Pazos, P.;
Pedraza, V.; Navajas, J. and Olea, N. 2000. Determination of bisphenol A and
related aromatic compounds released from bis-GMA-based composites and
sealants by high performance liquid chromatography. Environmental Health
Perspectives 108: 21-27.
89. Grumetto, L.; Barbato, F. et al. 2008. Determination of Bisphenol A and
Bisphenol B Residues in Canned Peeled Tomatoes by Reversed-Phase Liquid
Chromatography. J. Agric. Food Chem. 56: 10633-10637.
90. Ehlert, K.A.; Beumer, C.W. and Groot, M.C. 2008. Migration of bisphenol A
into water from polycarbonate baby bottles during microwave heating. Food
Addi. and Cont. 25: 904-910.
91. Carabias-Martinez, R.; Rodriguez-Gonzalo, E. and Revilla-Ruiz, P. 2006.
Determination of endocrine-disrupting compounds in cereals by pressurized
liquid extraction and liquid chromatography-mass spectrometry: Study of
background contamination. J. Chromatogr. A 1137: 207-215.
92. Paseiro-Losada, P. and Lopez-Cervantes, J. 2003. Determination of bisphenol A
in, and its migration from, PVC stretch film used for food packaging. Food
Addi. and Cont. 20: 596-606.
93. Rykowska, I. and Wasiak, W. 2006. Properties, threats, and methods of analysis
of bisphenol A and its derivatives. ACTA Chromatographica 16: 7-27.
94. Brossa, L.; Pocurull, E.; Borull, F. and Marce, R.M. 2002. A rapid method for
determining phenolic endorine disrupters in water samples. Chromatographia
56: 573-576.
95. Matsuya, T.; Ohtake, K.; Hoshino, N.; Ogasawara, M.; Harita, T.; Arao, S. and
Matsumoto, K. 2002. Highly Sensitive Time-Resolved Fluorometric
Determination for Alkylphenols by High Performance Liquid Chromatography
Using β-Diketonate Europium Chelate, Chromatograph 23: 73-78.
96. Lagana, A., Bacaloni, A., et al. 2004. Analytical methodologies for determining
the occurrence of endocrine disrupting chemicals in sewage treatment plants
and natural waters. Anal. Chim. Acta 501: 79-88.
97. Shintani, H.; Suzuki, E. and Sakurai, M. 2003. Determination of compounds
inhibiting bacterial growth in sterilized medical devices. Chromatographia 58:
193-199.
98. Mendiola, J.A.; Herrero, A.; Clfuentes, E. and Lbanez, J. 2007. Use of
compressed fluids for sample preparation: Food applications. J. Chromatogr.
A, 1152: 234-246.

78
99. Shao, B.; Han, H.; Hu, J.; Zhao, J.; Wu, G.; Xue, Y.; Ma, Y. and Zhang, S. 2005.
Determination of alkylphenol and bisphenol A in beverages using liquid
chromatography/electrospray ionization tandem mass spectrometry. Anal.
Chim. Acta. 530: 245.
100. Motoyama, A.; Suzuki, A.; Shirota, O. and Namba, R.; Direct determination of
bisphenol A and nonyphenol in river water by column-switching semi-
microcolumn liquid chromatography/electrospray mass spectrometry. Rapid
Commun. Mass Spectrom 13: 2204-2208.
101. Lintschinger, J. and Rauter, W. 2000. Simultaneous determination of bisphenol
A-diglycidyl ether, bisphenol F-diglycidyl ether and their hydrolysis and
chlorohydroxy derivatives in canned foods. Eur. Food Res. Technol. 211: 211-
217.
102. Sajiki, J. 2001. Determination of bisphenol A in blood using high-performance
liquid chromatography-electrochemical detection with solid-phase extraction. J.
Chromatogr. B 755: 9-15.
103. Sajiki, J. 2003. Simple and accurate determination of bisphenol A in red bloods
cells prepared with basic glycine buffer using liquid chromatography-
electrochemical detection. J. Chromatogr. B 783: 367-375.
104. Puig, D. and Barcelo, D. 1995. Comparative study of on-line solid phase
extraction followed by UV and electrochemical detection in liquid
chromatography for the determination of priority phenols in river water
samples. Anal. Chim. Acta 311: 63-69.
105. Sun, C.; Leong, L.P.; Barlow, P.J.; Chan, S.H. and Bloodworth, B.C. 2006.
Single laboratory validation of a method for the determination of bisphenol A,
bisphenol A diglycidyl ether and its derivatives in canned foods by reversed-
phase liquid chromatography. J. Chromatogr. A 1129: 145-148.
106. Rezzano, I.; D’Antuono, A. et al. 2001. Determination of bisphenol A in food-
simulating liquids using LCED with a chemically modified electrode. J. Agric.
Food Chem. 49: 1098-1101.
107. Rezzano, I.; Dall’Orto, C. et al. 1996. Liquid chromatography/electrochemical
detection of phenols at a Poly[Ni-(Protoporphyrin IX)] chemically modified
electrode. Anal. Chim. Acta 336: 195-199.
108. Inoue, K.; Kato, K.; Yoshimura, Y.; Makino, T. and Nakazawa, H. 2000.
Determination of bisphenol A in human serum by high-performance liquid
chromatography with multi-electrode electrochemical detection. J. Chromatogr.
B 749: 17-23.

79
109. Kuo, H.W. and Ding, W.H. 2004. Trace Determination of Bisphenol A and
Phytoestrogens in Milk Powders by Gas Chromatography-Mass Spectrometry.
J. Chromatogr. A 1027: 67-74.
110. Gyong, Y.; Shin, J.H.; Kim, H.Y.; Kim, J.; Lee, M.K. and Hong, J. 2007.
Application of solid-phase extraction coupled with freezing-lipid filtration
clean-up for the determination of endocrine-disrupting phenols in fish. Anal.
Chim. ACTA 603: 67-75.
111. Varelis, P. and Balafas, D. 2000. Preparation of 4,4’-(1-
[2H6]methylethylidene)bis-[2,3,5,6-
2H4]phenol and its application to the
measurement of bisphenol A in beverages by stable isotope dilution mass
spectrometry. J. Chromatogr. A 883: 163-170.
112. Goodson, A.; Summerfield, W. and Cooper, I. 2002. Survey of bisphenol A and
bisphenol F in canned foods. Food Addi. and Cont. 19: 796-802.
113. Wingender, R.J.; Niketas, P. and Switala, C.K. 1998. Development of methods
for the determination of bisphenol A in food simulants. J. Coat. Technol. 70: 75-
82.
114. Barry, E.F. and Grob, R.L. 2007. Columns for Gas Chromatography:
Performance and Selection. John Wiley & Sons, Inc., Hoboken, New Jersey.
115. Field, J.A. and Reed, R.L. 1996. Nonylphenol polyethoxy carboxylate
metabolites of nonionic surfactants in U.S. paper mill effluents, municipal
sewage treatment plant effluents, and river waters. Environ. Sci. Techno. 30:
3544-3550.
116. Ding, W.H. and Tzing, S.H. 1998. Analysis of nonylphenol polyethoxylates and
their degradation products in river water and sewage effluent by gas
chromatography-ino trap (tradem) mass spectrometry with electron impact and
chemical ionization. J. Chromatogr. A 824: 79-90.
117. Latorre, A.; Lacorte, S. and Barcelo, D. 2003. Presence of nonylphenol,
octyphenol and bisphenol a in two aquifers close to agricultural, industrial and
urban areas. Chromatographi 57: 111-116.
118. Cao, X.L. and Corriveau, J. 2008. Migration of bisphenol A from polycarbonate
baby and water bottles into water under severe conditions. J. Agric. Food
Chem. 56: 6378-6381.
119. Kim, A.; Li, C.H.; Jin, C.F.; Lee, K.W.; Lee, S.H.; Shon, K.J.; Park, N.G.; Kim,
D.K.; Kang, S.W.; Shim, Y.B. and Park, J.S. 2007. A sensitive and reliable
quantification method for Bisphenol A based on modified competitive ELISA
method. Chemosphere 68: 1204.

80
120. Kuruto-Niwa, R.; Tateoka, Y.; Usuki, Y. and Nozawa, R. 2007. Measurement of
bisphenol A concentrations in human colostrums. Chemosphere 66: 1160-1164.
121. Ohkuma, H.; Abe, K.; Ito, M.; Kokado, A.; Kambegawa, A. and Maeda, M.
2002. Development of a highly sensitive enzyme-linked immunosorbent assay
for bisphenol A in serum. Analyst 127: 93-97.
122. De Meulenaer, B.; Baert, K.; Lanckriet, H.; Van Hoed, V. and Huyghebaert, J.
2002. Development of an enzyme-linked immunosorbent assay for bisphenol a
using chicken immunoglobulins. J. Agric. Food Chem. 50: 5273-5282.
123. Zhao, M.P.; Li, Y.Z.; Guo, Z.Q.; Zhang, X.X. and Chang, W.B. 2002. A new
competitive enzyme-linked immunosorbent assay (ELISA) for determination of
estrogenic bisphenols. Talanta 57: 1205-1210.
124. Arias, M.; Penichet, I.; Ysambertt, F.; Bauza, R.; Zougagh, M. and Rios, A.
2009. Fast supercritical fluid extraction of low- and high-density polyethylene
additives: Comparison with conventional reflux and automatic Soxhlet
extraction. J. of Supercritical Fluids 50: 22-28.
125. Brandrup, J. and Immergut, E. H. 1975. Polymer Handbook. Wiley Interscience,
New York, USA.
126. Helmroth, I.E.; Dekker, M. and Hankemerier, T. 2002. Influence of solvent
absortion on the migration of Irganox 1076 from LDPE. Food Addi. And Cont.
19: 176-183.
127. Helmroth, I.E.; Bekhuis, H.A.M.; Linssen, J.P.H. and Dekker, M. 2002. Direct
measurement of additive migration from low-density polyethylene as a function
of space and time. Journal of Applied Polymer Science 86: 3185-3190.
128. Quinn, G.P. and Keough, M.J. 2002. Experimental design and data analysis for
biologists. Cambridge University Press, New York, pp 221-259.
129. Booth, C. and Price, C. 1989. Comprehensive Polymer Science. Pergamon
Press, Oxford, England.
130. Torres, A.; Galotto, M.J.; Guarda, A.; Noraga, N. and Romero, J. 2010.
Experimental and theoretical study on specific migration in plastic films: effect
of the food simulant and the temperature. International Conference on Food
Innovation, Oct. 25-29.
131. Rafael, A.; Bruce, H. and Selke, S. 2006. Sorption of ethyl acetate and d-
limonene in poly(lactide) polymers. J Sci. Food and Agric. 86: 648-656.
132. Heberto, O.V.; Joongmin, S.; Herlinda, S.V. and Rafael, A. 2011. Release of

81
butylated hydroxytoluene (BHT) from Poly(lactic acid) films. Polymer Testing
30: 463-471.