modelling economically optimal heat supply to low energy building areas – the importance of scales
TRANSCRIPT

MODELLING ECONOMICALLY OPTIMAL HEAT SUPPLY TO LOW
ENERGY BUILDING AREAS –THE IMPORTANCE OF SCALES
Akram Sandvall Fakhri, Erik O Ahlgren, Tomas Ekvall*Chalmers Univ Tech
* IVL
ETSAP, Cork, May 30-31, 2016
Bioenergy and transport –modelling of Swedish energy
futures• Börjesson Hagberg M, Pettersson K, Ahlgren EO (2016). Bioenergyfutures in Sweden – Modeling integration scenarios for biofuel production. Energy, in press.
• BörjessonM, AthanassiadisD, Lundmark R, Ahlgren EO (2015). Bioenergy futures in Sweden – System effects of CO2 reduction and fossil fuel phase-out policies. GCB Bioenergy 7: 1118-1135.
• BörjessonM, Ahlgren EO, Lundmark R, Athanassiadis D (2014). Biofuel futures in road transport – A modeling analysis for Sweden. Transportation Research Part D: Transport and Environment 32: 239–252.

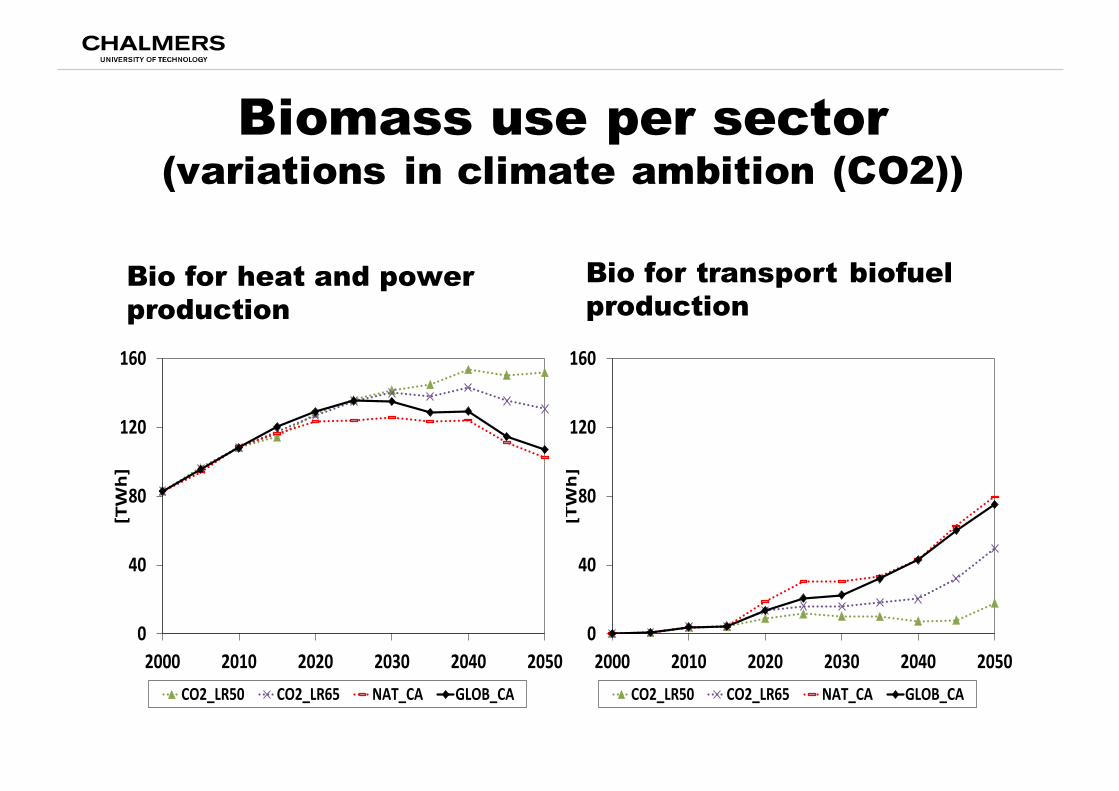
Biomass use per sector(variations in climate ambition (CO2))
Bio for heat and powerproduction
Bio for transport biofuelproduction
0
40
80
120
160
2000 2010 2020 2030 2040 2050
[TWh]
CO2_LR50 CO2_LR65 NAT_CA GLOB_CA
0
40
80
120
160
2000 2010 2020 2030 2040 2050
[TWh]
CO2_LR50 CO2_LR65 NAT_CA GLOB_CA

Buildings heat supply
Why ?

Buildings heat supply
Strategic interest !

Three heat supply options-to NEW buidlings
q IndividualEach building has its own heat production device
q On-siteHeat supply by a small local district heating (DH) system
within the LEB area
q Large heat networkHeat is produced in the DH system of nearby urban area
and is transmitted to the LEB area by a transmission pipeline.

Questions
• Which is the most cost-efficient heat supply option toNEW buildings from a societal point of view?
• How do the various cost components of the long-termsystem cost compare between the three heatingoptions?
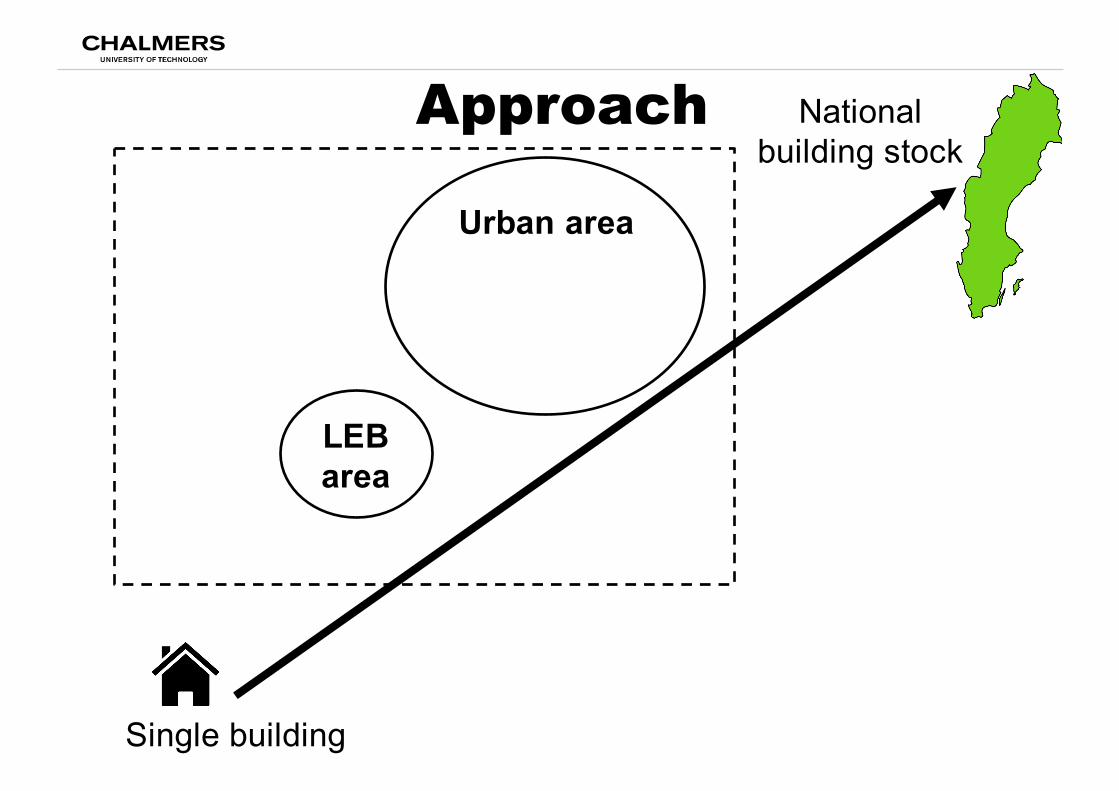
Urban area
Approach
Single building
National building stock
LEB area
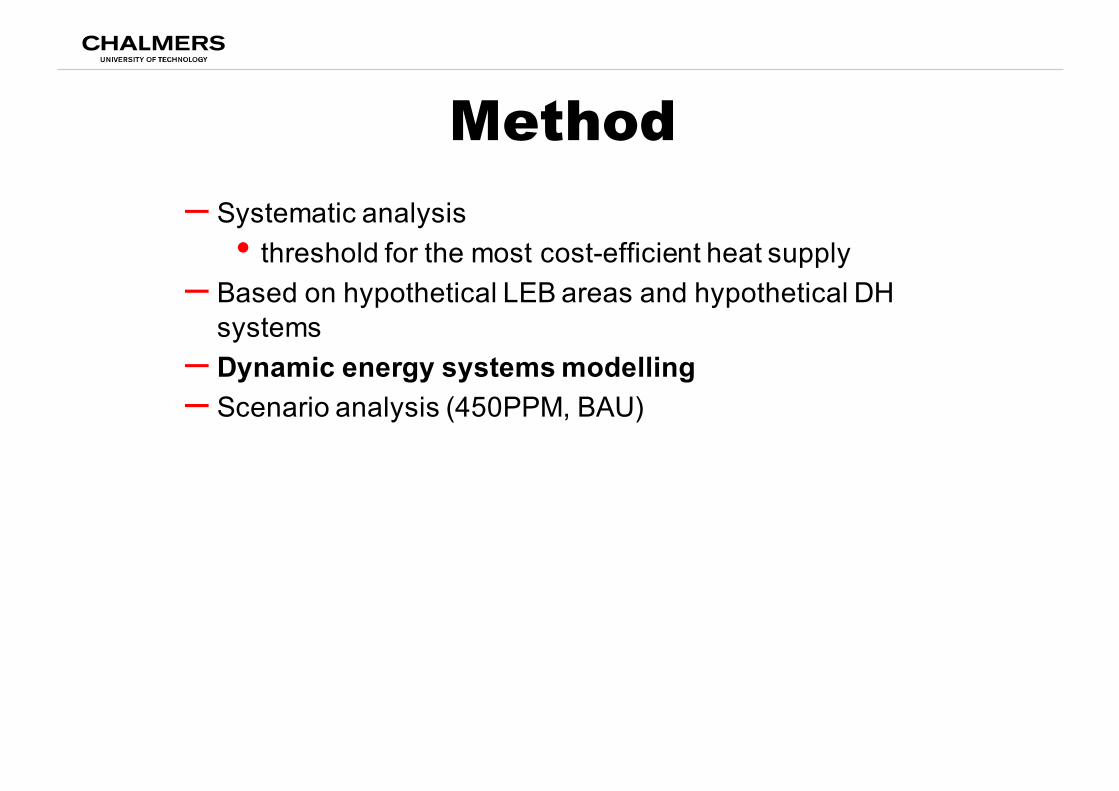
Method– Systematic analysis• threshold for the most cost-efficient heat supply
– Based on hypothetical LEB areas and hypothetical DH systems– Dynamic energy systems modelling– Scenario analysis (450PPM, BAU)
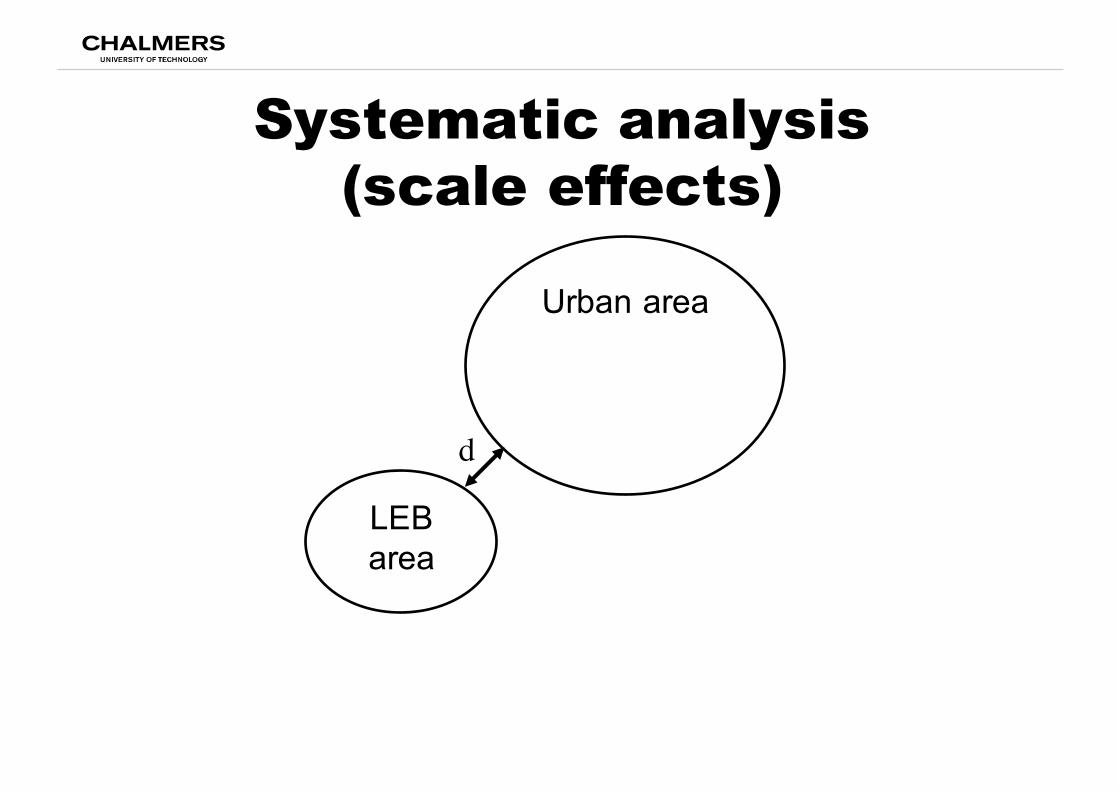
Systematic analysis(scale effects)
Urban area
LEB area
d
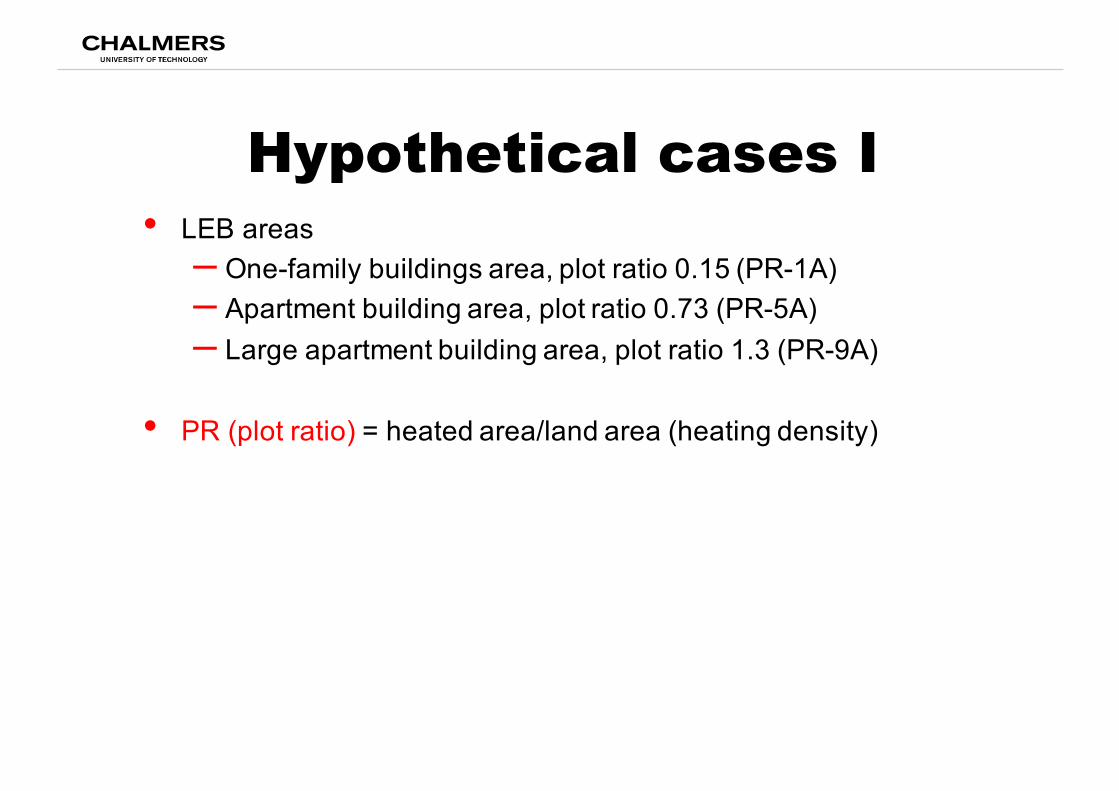
Hypothetical cases I• LEB areas– One-family buildings area, plot ratio 0.15 (PR-1A)– Apartment building area, plot ratio 0.73 (PR-5A)– Large apartment building area, plot ratio 1.3 (PR-9A)
• PR (plot ratio) = heated area/land area (heating density)
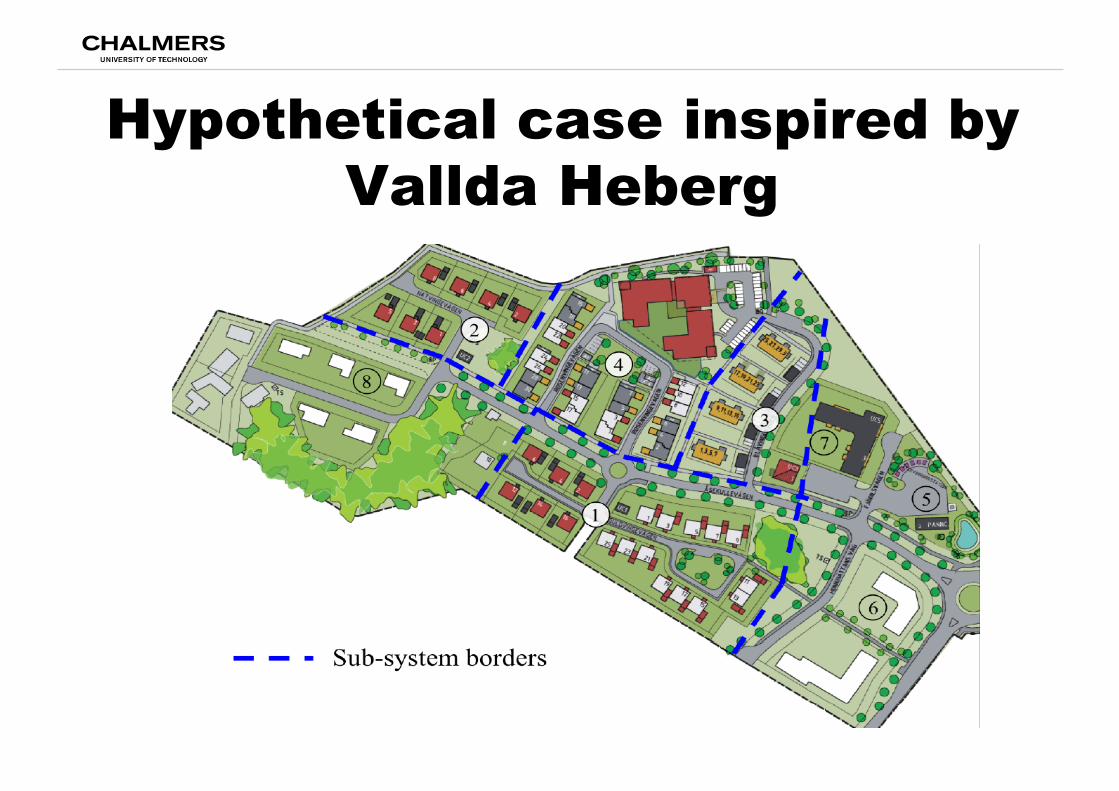
Hypothetical case inspired by Vallda Heberg

Area
Single family building
TerracebuildingsApartment building
(1)
(2)
(3)
(4)
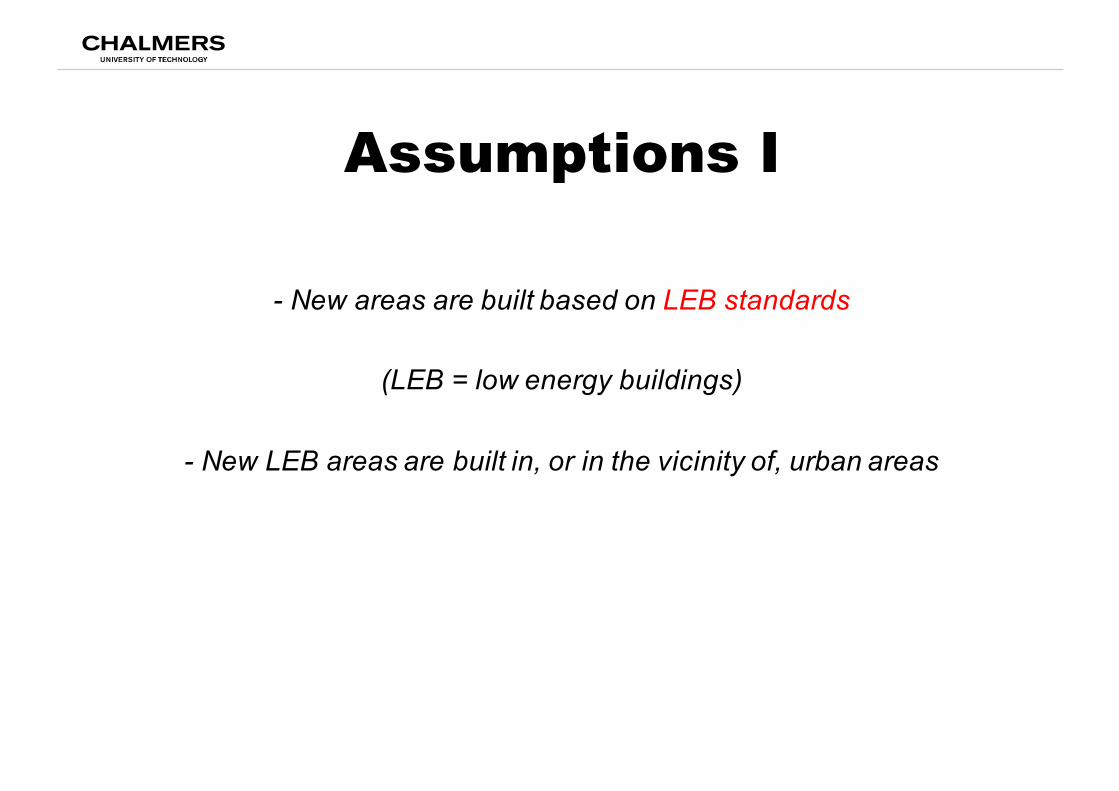
Assumptions I
- New areas are built based on LEB standards
(LEB = low energy buildings)
- New LEB areas are built in, or in the vicinity of, urban areas
Hypothetical cases II
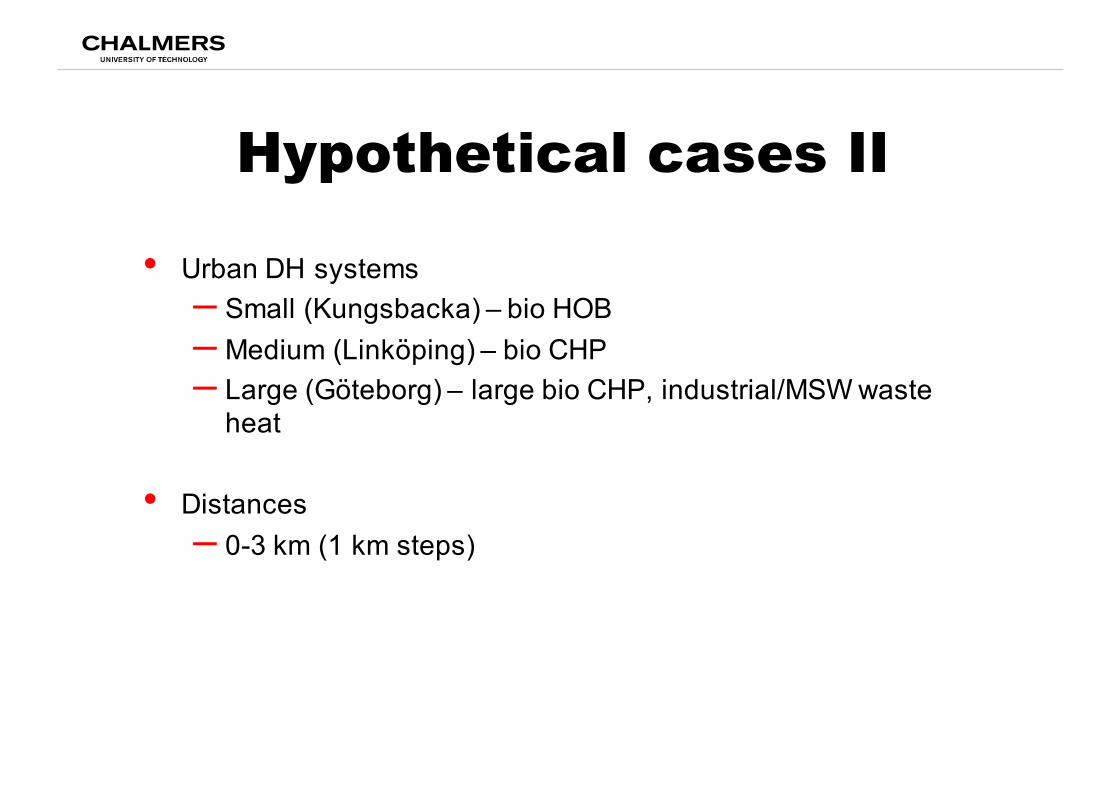
• Urban DH systems – Small (Kungsbacka) – bio HOB– Medium (Linköping) – bio CHP– Large (Göteborg) – large bio CHP, industrial/MSW wasteheat
• Distances– 0-3 km (1 km steps)
Modelling
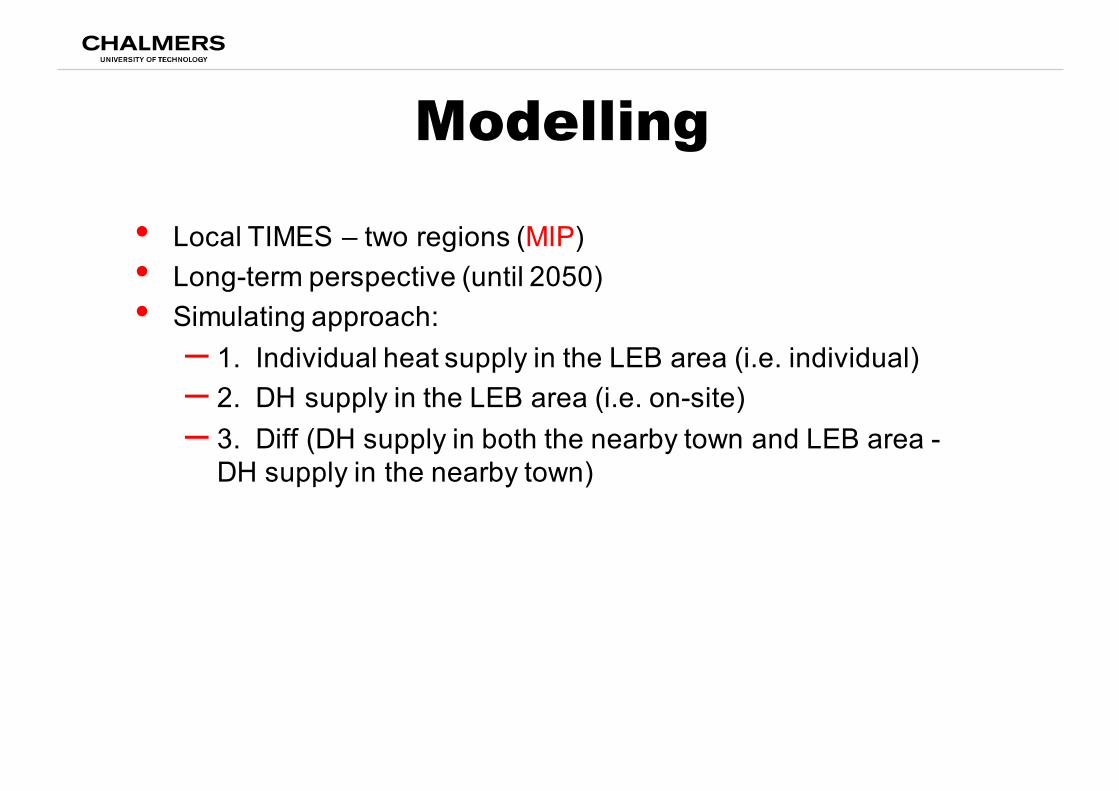
• Local TIMES – two regions (MIP) • Long-term perspective (until 2050)• Simulating approach:– 1. Individual heat supply in the LEB area (i.e. individual)– 2. DH supply in the LEB area (i.e. on-site)– 3. Diff (DH supply in both the nearby town and LEB area -DH supply in the nearby town)

Assumptions II
• Heat supply represented in detail– Existing DH production capacity in the DH systems– New investment options in the DH systems and the LEB area (discrete investments)
– Individual devices: bio pellets boiler, geothermal heat pump, electric boiler
– Low temperature DH (55/25 C) in the LEB areas.
• Electricity system, energy markets, biomass cost/price, climatepolicies and heat demand are included exogenously.
• Time resolution: Seasonal, Day-Night• Inelastic heat demand
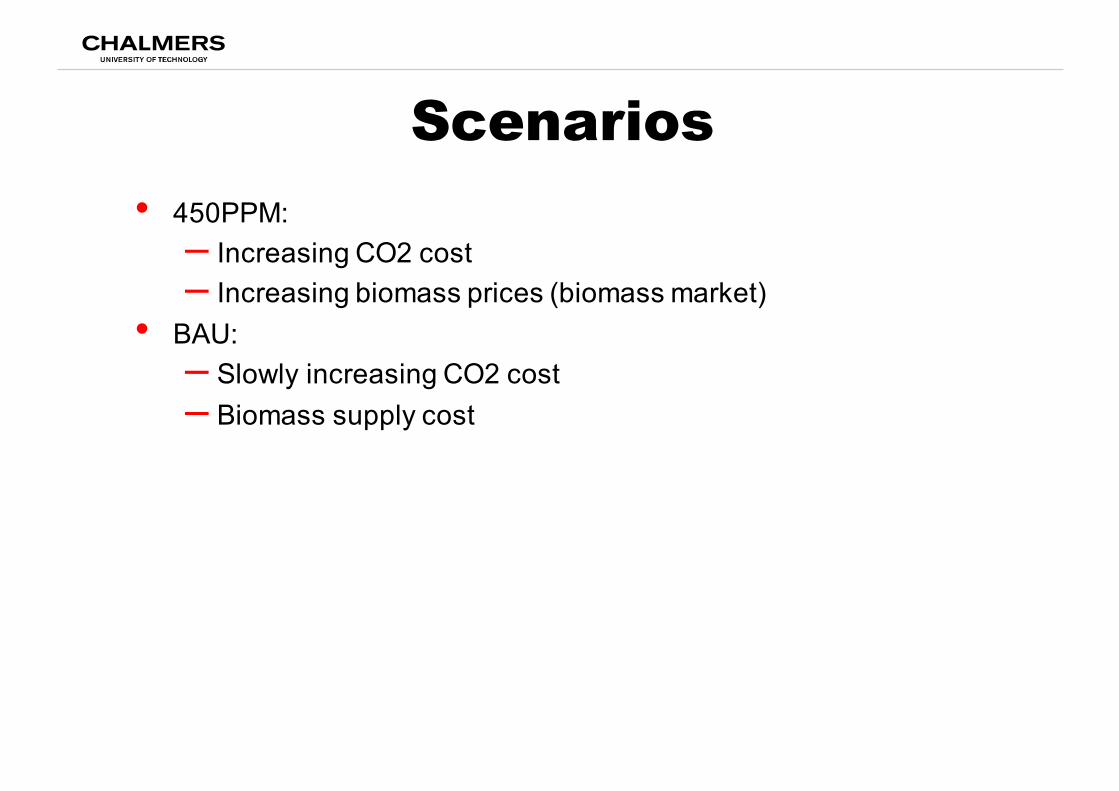
Scenarios• 450PPM: – Increasing CO2 cost– Increasing biomass prices (biomass market)
• BAU:– Slowly increasing CO2 cost– Biomass supply cost

Results
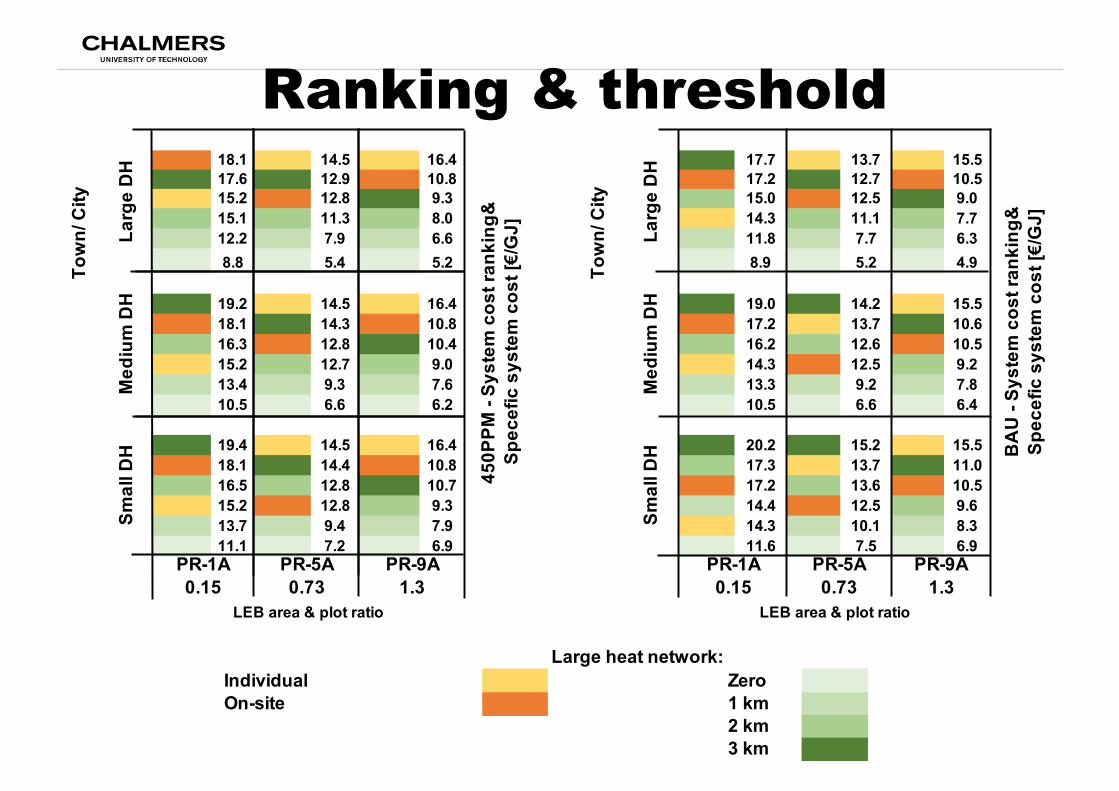
18.1 14.5 16.4 17.7 13.7 15.517.6 12.9 10.8 17.2 12.7 10.515.2 12.8 9.3 15.0 12.5 9.015.1 11.3 8.0 14.3 11.1 7.712.2 7.9 6.6 11.8 7.7 6.38.8 5.4 5.2 8.9 5.2 4.9
19.2 14.5 16.4 19.0 14.2 15.518.1 14.3 10.8 17.2 13.7 10.616.3 12.8 10.4 16.2 12.6 10.515.2 12.7 9.0 14.3 12.5 9.213.4 9.3 7.6 13.3 9.2 7.810.5 6.6 6.2 10.5 6.6 6.4
19.4 14.5 16.4 20.2 15.2 15.518.1 14.4 10.8 17.3 13.7 11.016.5 12.8 10.7 17.2 13.6 10.515.2 12.8 9.3 14.4 12.5 9.613.7 9.4 7.9 14.3 10.1 8.311.1 7.2 6.9 11.6 7.5 6.9
BAU - System cost ranking&
Specefic system cost [€/GJ]
450PPM
- System cost ranking&
Specefic system cost [€/GJ]
Town/ City
Town/ City
Medium DH
Medium DH
Small DH
Small DH
Large DH
Large DH
1.3LEB area & plot ratio LEB area & plot ratio
0.15 0.73 1.3 0.15 0.73PR-9APR-1A PR-5A PR-9A PR-1A PR-5A
Large heat network:Individual ZeroOn-site 1 km
2 km3 km
Ranking & threshold

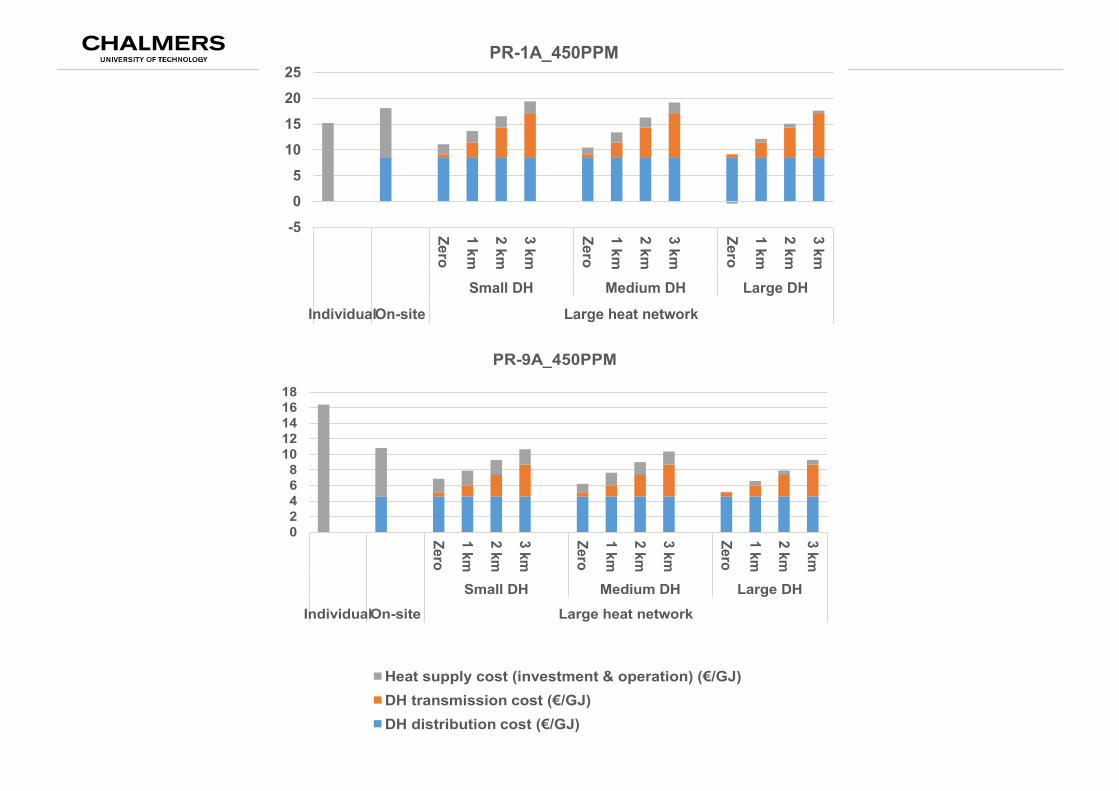
Breakdown of costcomponents
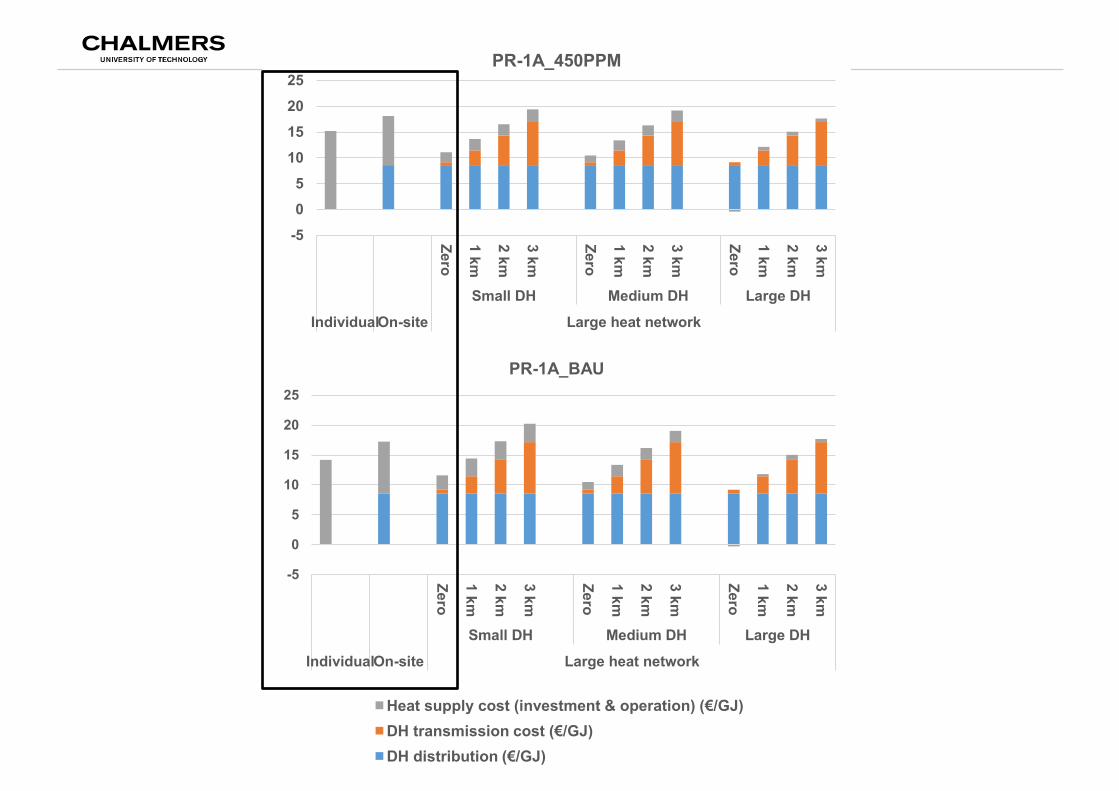
-50510152025
Zero
1 km
2 km
3 km
Zero
1 km
2 km
3 km
Zero
1 km
2 km
3 kmSmall DH Medium DH Large DH
IndividualOn-site Large heat network
PR-1A_450PPM
-5
0
5
10
15
20
25
Zero
1 km
2 km
3 km
Zero
1 km
2 km
3 km
Zero
1 km
2 km
3 km
Small DH Medium DH Large DHIndividualOn-site Large heat network
PR-1A_BAU
Heat supply cost (investment & operation) (€/GJ)DH transmission cost (€/GJ)DH distribution (€/GJ)

-50510152025
Zero
1 km
2 km
3 km
Zero
1 km
2 km
3 km
Zero
1 km
2 km
3 kmSmall DH Medium DH Large DH
IndividualOn-site Large heat network
PR-1A_450PPM
-20246810121416
Zero
1 km
2 km
3 km
Zero
1 km
2 km
3 km
Zero
1 km
2 km
3 km
Small DH Medium DH Large DHIndividualOn-site Large heat network
PR-5A_450PPM
Heat supply cost (investment & operation) (€/GJ)DH transmission cost (€/GJ)DH distribution cost (€/GJ)
-50510152025
Zero
1 km
2 km
3 km
Zero
1 km
2 km
3 km
Zero
1 km
2 km
3 kmSmall DH Medium DH Large DH
IndividualOn-site Large heat network
PR-1A_450PPM
024681012141618
Zero
1 km
2 km
3 km
Zero
1 km
2 km
3 km
Zero
1 km
2 km
3 km
Small DH Medium DH Large DHIndividualOn-site Large heat network
PR-9A_450PPM
Heat supply cost (investment & operation) (€/GJ)DH transmission cost (€/GJ)DH distribution cost (€/GJ)

Findings
• Large heat network option economically optimal– DH distribution and transmission costs account for large cost share
• Scales important• Results rather robust with respect to climate policies

Next step
Climate impactsUrban model

Thanks!
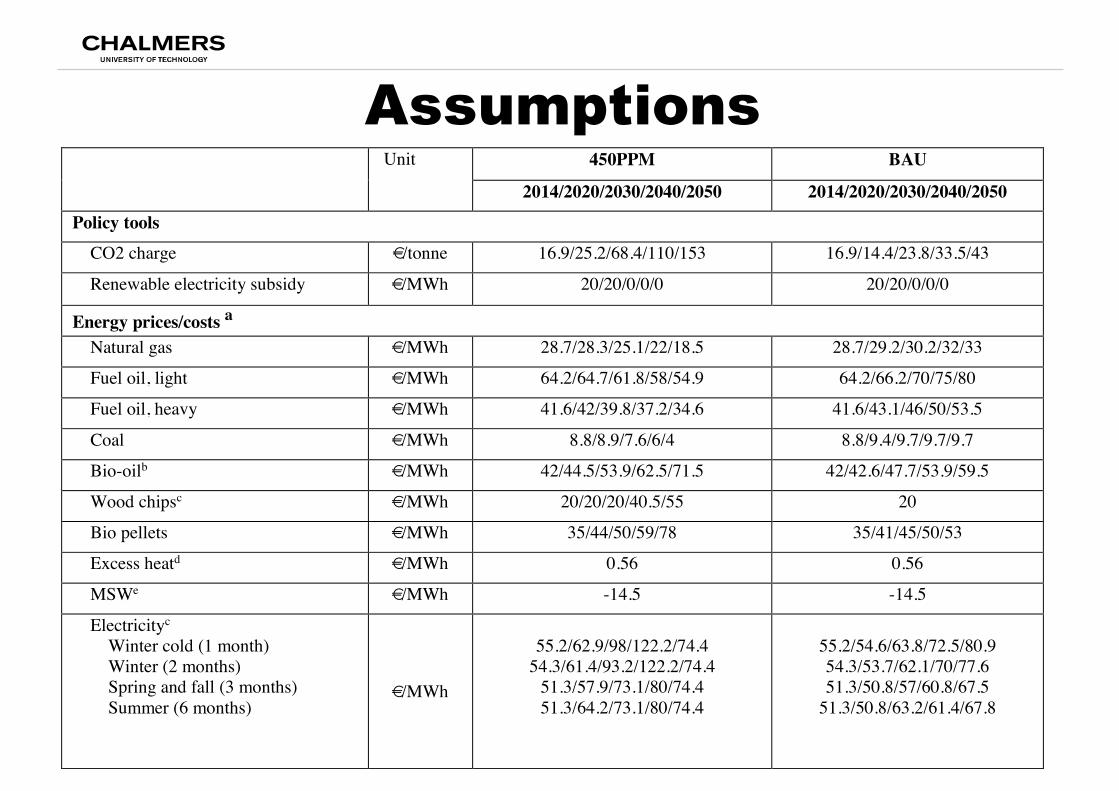
Assumptions Unit 450PPM BAU
2014/2020/2030/2040/2050 2014/2020/2030/2040/2050 Policy tools
CO2 charge €/tonne 16.9/25.2/68.4/110/153 16.9/14.4/23.8/33.5/43
Renewable electricity subsidy €/MWh 20/20/0/0/0 20/20/0/0/0
Energy prices/costs a Natural gas €/MWh 28.7/28.3/25.1/22/18.5 28.7/29.2/30.2/32/33
Fuel oil, light €/MWh 64.2/64.7/61.8/58/54.9 64.2/66.2/70/75/80
Fuel oil, heavy €/MWh 41.6/42/39.8/37.2/34.6 41.6/43.1/46/50/53.5
Coal €/MWh 8.8/8.9/7.6/6/4 8.8/9.4/9.7/9.7/9.7
Bio-oilb €/MWh 42/44.5/53.9/62.5/71.5 42/42.6/47.7/53.9/59.5
Wood chipsc €/MWh 20/20/20/40.5/55 20
Bio pellets €/MWh 35/44/50/59/78 35/41/45/50/53
Excess heatd €/MWh 0.56 0.56
MSWe €/MWh -14.5 -14.5
Electricityc Winter cold (1 month) Winter (2 months) Spring and fall (3 months) Summer (6 months)
€/MWh
55.2/62.9/98/122.2/74.4
54.3/61.4/93.2/122.2/74.4 51.3/57.9/73.1/80/74.4 51.3/64.2/73.1/80/74.4
55.2/54.6/63.8/72.5/80.9 54.3/53.7/62.1/70/77.6 51.3/50.8/57/60.8/67.5
51.3/50.8/63.2/61.4/67.8

Background• EU Directives (2010 &2012)• National goal by 2050• In 2015 the Boverket forecasted that 700,000 newhomes are needed in ten years.
• Boverket has set standards and rules for the heatdemand of new buildings.
• Construction of buildings with very low energy use issupported by the Swedish Energy Agency
àNew areas are built based on LEB standards