modelling car trip generation in the developing world - the tale of two cities
TRANSCRIPT

School of somethingFACULTY OF OTHER
Institute for Transport StudiesFACULTY OF ENVIRONMENT
Modelling Car Trip Generation in the
Developing World: The Tale of Two Cities
Mr. Andrew Bwambale, ITS
Dr. Charisma F. Choudhury, ITS
Dr. Nobuhiro Sanko, Kobe University

• Motivation
• Study Objectives
• Study Area
• Data
• Modelling Framework
• Results
• Conclusions
Outline

Data sourcesMotivation
• Models are key to understanding and solving complex
transport problems; however, there are limitations imposed by
data collection budget constraints in developing countries.
• Could transferable models be a possible solution?
• Besides transferability, what are the limitation of current trip
generation models?
• Data shortages in the application context
• Possible Endogeneity between car ownership
and trip generation (Simultaneity)

Study Objectives
(1) How does the household car ownership affect the
household car trip rate in the context of developing
countries?
(2) How can we account for the potential endogeneity in car
trip generation models?
(3) How can we account for data limitations associated with
modelling car trip generation? and
(4) How transferable are the models between two cities that
have similarity in socio-demographics?

Data sourcesStudy Area
Focus will be on spatial
transferability between
Nairobi and Dar-es-Salaam.
These areas are thought to
have largely similar socio-
demographics.
Household travel survey data
collected by JICA from both
cities has been used in this
study.

Data sourcesData
Survey period
Population (million)
Survey area (km2)
Population density (persons/km2)
Total number of households in the survey area ('000)
Number of households surveyed
Number of traffic analysis zones (TAZ)
Survey region
Survey lead
House ownership (%)
Yes
No
Household car ownership (%)
0
1
2
3+
Mean S.D Mean S.D
Household income in USD 385.80 377.20 110.87 194.85
Household size 3.33 1.65 4.40 1.83
Number of workers per household 1.51 0.79 1.24 0.80
Driving licence holders per household 0.60 0.84 0.43 1.04
Number of children per household 0.70 0.87 0.93 0.94
Number of students per household 0.61 0.86 1.02 1.07
650 (in 2004)
Dar-es-Salaam (Tanzania)
2007
3.0 (in 2007)
1687
1796 (in 2007)
708 (in 2007)
Nairobi (Kenya)
2004
2.7 (in 2004)
696
3817 (in 2004)
7676
164
Dar-es-salaam city
Japan International
Cooperation
Agency (JICA)
8588
104
Nairobi city
Japan International
Cooperation
Agency (JICA)
8.80 52.80
91.20 47.20
79.19 94.12
4.40 0.33
1.69 0.04
14.72 5.51

Mobile phone CDRData
Nairobi Dar-es-Salaam

Mobile phone CDRData
Nairobi Dar-es-Salaam

Mobile phone CDRData
Nairobi Dar-es-Salaam

Mobile phone CDRData
Nairobi Dar-es-Salaam

Data sourcesModelling Framework
Four ordered response probit car trip generation models have
been estimated for each city.
• Model 1 (Car trip generation models with car ownership as an
explanatory variable);
nnn Xy '*
)1(
𝑗 =
0, 𝑖𝑓 𝑦𝑛∗ ≤ 𝜇0
1, 𝑖𝑓 𝜇0 <𝑦𝑛
∗ ≤ 𝜇1
2, 𝑖𝑓 𝜇1 <𝑦𝑛
∗ ≤ 𝜇2
3+, 𝑖𝑓 𝑦𝑛
∗ > 𝜇2
Household socio-economic variables
Including # of cars
yn*
# of car trips
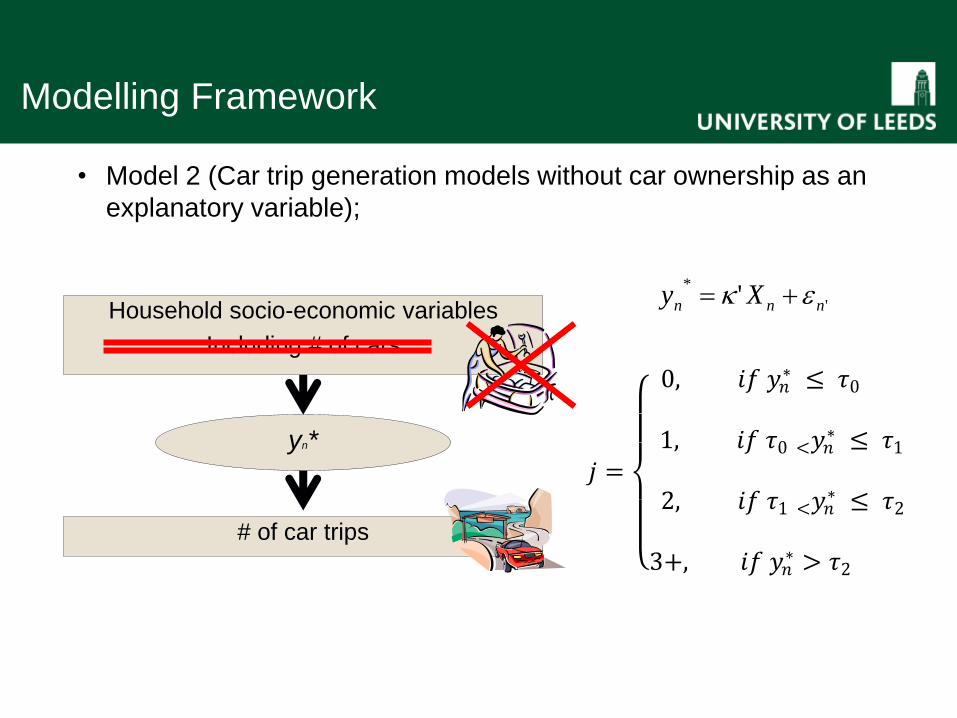
Data sourcesModelling Framework
• Model 2 (Car trip generation models without car ownership as an
explanatory variable);
'
*' nnn Xy
)4(
𝑗 =
0, 𝑖𝑓 𝑦𝑛∗ ≤ 𝜏0
1, 𝑖𝑓 𝜏0 <𝑦𝑛
∗ ≤ 𝜏1
2, 𝑖𝑓 𝜏1 <𝑦𝑛∗ ≤ 𝜏2
3+, 𝑖𝑓 𝑦𝑛
∗ > 𝜏2
Household socio-economic variables
Including # of cars
yn*
# of car trips

Data sourcesModelling Framework
• Model 3 (Two stage models estimated sequentially; first stage - car
ownership model and second stage - car trip generation model);
ntnnn
ncnn
zXyStage
XzStage
''
**
''
*
.':2
':1
)5( a
)5( b
𝑖 =
0, 𝑖𝑓 𝑧𝑛∗ ≤ 𝜎0
1, 𝑖𝑓 𝜎0 <𝑧𝑛
∗ ≤ 𝜎1
2, 𝑖𝑓 𝜎1 <𝑧𝑛∗ ≤ 𝜎2
3+, 𝑖𝑓 𝑧𝑛
∗ > 𝜎2
𝑗 =
0, 𝑖𝑓 𝑦𝑛∗ ≤ 𝛿0
1, 𝑖𝑓 𝛿0 <𝑦𝑛
∗ ≤ 𝛿1
2, 𝑖𝑓 𝛿1 <𝑦𝑛∗ ≤ 𝛿2
3+, 𝑖𝑓 𝑦𝑛
∗ > 𝛿2
# of carsyn*
# of car trips
zn*
Household socio-economic variables
Including # of cars
Stage 1
Stage 1
Stage 2
Stage 2
Stage 2

Data sourcesModelling Framework
• Model 4 (Joint car trip generation and car ownership models –
Simultaneous BOP models);
tnnnn
cnnn
zXy
Xz
**
*
.'
'
)6(
𝑖 =
0, 𝑖𝑓 𝑧𝑛∗ ≤ ∝0
1, 𝑖𝑓 ∝0 < 𝑧𝑛
∗ ≤ ∝1
2, 𝑖𝑓 ∝1 < 𝑧𝑛∗ ≤ ∝2
3+, 𝑖𝑓 𝑧𝑛
∗ >∝2
𝑗 =
0, 𝑖𝑓 𝑦𝑛∗ ≤ 𝜃0
1, 𝑖𝑓 𝜃0 <𝑦𝑛
∗ ≤ 𝜃1
2, 𝑖𝑓 𝜃1 <𝑦𝑛∗ ≤ 𝜃2
3+, 𝑖𝑓 𝑦𝑛
∗ > 𝜃2
# of cars # of car trips
zn*
Household socio-economic variables
Including # of cars
yn*The BOP model
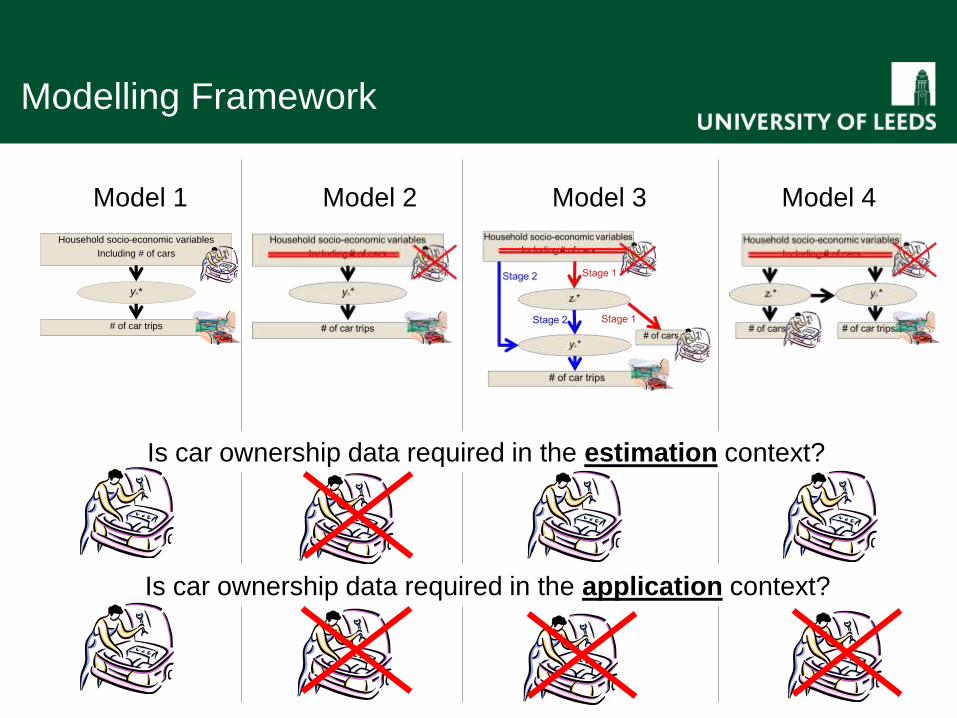
Data sourcesModelling Framework
Household socio-economic variables
Including # of cars
yn*
# of car trips
Model 1 Model 2 Model 3 Model 4
Is car ownership data required in the estimation context?
Is car ownership data required in the application context?
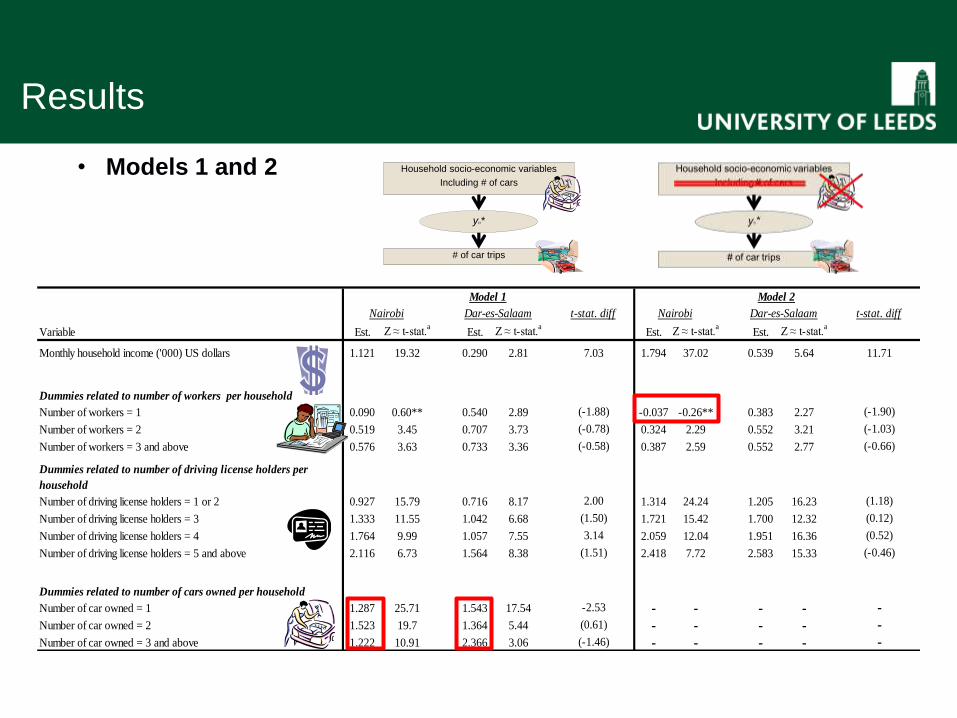
Data sourcesResults
• Models 1 and 2
Variable Est. Z ≈ t-stat.a
Est. Z ≈ t-stat.a
Est. Z ≈ t-stat.a
Est. Z ≈ t-stat.a
Monthly household income ('000) US dollars 1.121 19.32 0.290 2.81 1.794 37.02 0.539 5.64
Dummies related to number of workers per household
Number of workers = 1 0.090 0.60** 0.540 2.89 -0.037 -0.26** 0.383 2.27
Number of workers = 2 0.519 3.45 0.707 3.73 0.324 2.29 0.552 3.21
Number of workers = 3 and above 0.576 3.63 0.733 3.36 0.387 2.59 0.552 2.77
Dummies related to number of driving license holders per
household
Number of driving license holders = 1 or 2 0.927 15.79 0.716 8.17 1.314 24.24 1.205 16.23
Number of driving license holders = 3 1.333 11.55 1.042 6.68 1.721 15.42 1.700 12.32
Number of driving license holders = 4 1.764 9.99 1.057 7.55 2.059 12.04 1.951 16.36
Number of driving license holders = 5 and above 2.116 6.73 1.564 8.38 2.418 7.72 2.583 15.33
Dummies related to number of cars owned per household
Number of car owned = 1 1.287 25.71 1.543 17.54 - - - -
Number of car owned = 2 1.523 19.7 1.364 5.44 - - - -
Number of car owned = 3 and above 1.222 10.91 2.366 3.06 - - - -
-
-
-
Model 1 Model 2
(-0.46)
(-1.03)
(-0.66)
(1.18)
(0.12)
(0.52)
(-1.46)
(1.50)
3.14
Nairobi Dar-es-Salaam t-stat. diff
11.71
(-1.90)
2.00
Nairobi Dar-es-Salaam t-stat. diff
7.03
(1.51)
-2.53
(0.61)
(-1.88)
(-0.78)
(-0.58)
Household socio-economic variables
Including # of cars
yn*
# of car trips

Data sourcesResults
• Models 3 and 4
Variable Est. Z ≈ t-stat.a
Est. Z ≈ t-stat.a
Est. Z ≈ t-stat.a
Est. Z ≈ t-stat.a
Household car ownership model:
Monthly household income ('000) US dollars 1.942 37.47 0.719 8.24 1.956 37.73 0.709 8.17
House ownership 0.490 9.39 0.234 3.54 0.480 9.17 0.240 3.66
Dummies related to number of workers per household
Number of workers = 1 -0.335 -2.96 -0.355 -3.64 -0.364 -3.27 -0.362 -3.79
Number of workers = 2 -0.402 -3.52 -0.296 -2.83 -0.458 -4.07 -0.316 -3.07
Number of workers = 3 and above -0.299 -2.41 -0.280 -1.99 -0.354 -2.88 -0.292 -2.10
Dummies related to number of driving license holders per
household
Number of driving license holders = 1 or 2 1.249 24.51 1.468 21.44 1.229 23.94 1.441 21.20
Number of driving license holders = 3 1.525 14.11 1.913 14.55 1.487 13.77 1.885 14.33
Number of driving license holders = 4 1.718 10.54 2.392 20.83 1.659 10.25 2.354 20.58
Number of driving license holders = 5 and above 1.861 6.95 2.751 16.61 1.740 6.65 2.726 16.57
Dummies related to household size
Household size = 2 or 3 0.096 1.30** 0.384 1.10** 0.070 0.96** 0.322 0.99**
Household size = 4 0.246 3.21 0.470 1.34** 0.226 2.98 0.400 1.23**
Household size = 5+ 0.306 3.97 0.484 1.39** 0.298 3.92 0.431 1.34**
12.06
3.04
(0.13)
(-0.69)
(-0.10)
-2.57
-2.28
-3.38
-2.83
(-0.81)
(-0.62)
(-0.50)
Nairobi Dar-es-Salaam t-stat. diff
Model 3
Nairobi Dar-es-Salaam
(-0.01)
(-0.93)
(-0.33)
-2.48
-2.34
-3.50
-3.19
(-0.76)
(-0.52)
(-0.40)
Model 4
t-stat. diff
12.34
2.87

Data sourcesResults
• Models 3 and 4 cont’d
Household car trip generation model:
Monthly household income ('000) US dollars 0.846 4.31 0.256 1.25** 0.954 4.53 0.345 1.66*
Dummies related to number of workers per household
Number of workers = 1 0.126 0.86** 0.524 2.74 0.173 1.07** 0.637 2.54
Number of workers = 2 0.494 3.39 0.655 3.55 0.618 3.80 0.797 3.23
Number of workers = 3 and above 0.510 3.36 0.635 3.08 0.641 3.81 0.823 3.14
Dummies related to number of driving license holders per
household
Number of driving license holders = 1 or 2 0.727 5.63 0.645 1.77* 0.821 5.95 0.674 1.84*
Number of driving license holders = 3 0.958 5.07 0.967 1.98 1.078 5.43 1.065 2.23
Number of driving license holders = 4 1.177 4.78 1.031 1.72* 1.362 5.28 1.128 1.88*
Number of driving license holders = 5 and above 1.414 3.80 1.525 2.19 1.500 4.02 1.669 2.48
0.463 4.99 0.376 1.56** 0.553 5.32 0.535 1.63**
Correlation coefficient ( ) - - - - 0.043 0.414** 0.295 1.128**
(-0.22)
2.06
(-1.55)
(-0.60)
(-0.58)
(0.38)
(0.03)
(0.36)
(0.05)
(-0.90)
(-1.65)
(-0.69)
(-0.49)
(0.21)
(-0.02)
(0.22)
(-0.14)
(0.34)
2.08
corr
,

Data sourcesResults
• Overall goodness of fit measures
Summary statistics
,
,
Chi-square stat. (14,0.05), (11,0.05)
Adjusted ρ2
Nairobi Dar-es-SalaamNairobiDar-es-Salaam
Model 1 Model 2
0.378 0.276
-3741.25 -1107.14
-6030.70 -1543.36
4578.91 872.43
19.68 19.68
0.439 0.378
5322.22 1193.90
23.68 23.68
-3369.59 -946.41
-6030.70 -1543.36
)ˆ(LL
)0(LL
)ˆ()0(2 LLLL
)ˆ(LL
)ˆ()0(2 LLLL
Summary statistics
Household car ownership model:
- - - -
- - - -
- - - -Chi-square stat. (15,0.05) - - - -
Adjusted ρ2 - - - -
Household car trip generation model:
,
,
Chi-square stat. (12,0.05), (28,0.05)
Adjusted ρ2
,
Nairobi Dar-es-Salaam
Model 3
4603.60
21.03
0.380
Nairobi Dar-es-Salaam
Model 4
0.035 0.020
-7069.91 -2180.09
544.20 143.20
41.34 41.34
-6797.81 -2108.49
-3356.55
-5780.96
4848.81
25.00
0.417
-1140.11
-1830.26
1380.29
25.00
0.369
-3728.90
-6030.70
-1105.90
-1543.36
874.92
21.03
0.276
00 ,11, 22 , ,
)0(LL
)0(LL
)ˆ()0(2 LLLL
)ˆ(LL
)ˆ,ˆ( LL
)ˆ,ˆ()0(2 LLLL )ˆ,ˆ,ˆ()0(2 LLLL
>
>
0.37 0.20Trip generation component
>
>

Data sourcesResults
• Overall model spatial transferability (individual parameters are
relatively transferable)
Description Nairobi to Dar-es-Salaam Dar-es-Salaam to Nairobi
Model 1 525.66 2079.72
Model 2 630.54 2776.196
Model 3
(car owenership sub-model)443.85 2833.88
Model 3
(car trip generation sub-model)655.69 2957.16
Model 4 951.82 4689.43
Transferability Test Statistic
Better transferability in this direction
Nairobi models are better.
(434.10)
(733.38)
(2655.00)
(3474.48)
(car ownership component)
(trip generation component)

Data sourcesConclusions
• In both cities, car ownership has been found to have a
statistically significant positive influence on car trip
generation.
• Models 1, 3 and 4.
• The problem associated with potential endogeneity in
modelling trip generation and car ownership can be
addressed using Model structures 3 and 4.
• Model 3: Endogeneity due to variable omission.
• Model 4: Endogeneity due to variable omission and simultaneity.

Data sourcesConclusions
• Possible ways of addressing the lack of car ownership
data for car trip generation modelling in the application
context can be addressed using Model structures 2, 3
and 4, though Model structure 4 is a better option.
• Though all the four models have most of their parameters
individually transferrable between the two cities, none of
the models is wholly transferrable between the two cities.

• Improvement of transferability scores
• Treatment of missing data as a latent variable
Further research

Questions?