modelling assessment to determine sdl adjustment … modelling... · modelling assessment to...
TRANSCRIPT

Modelling assessment to determine SDL Adjustment Volume
October 2017
TECHNICAL REPORT - The Modelling Assessment report describes the implementation of the supply
measures package in the modelling framework. The report explains how the model represents and
assesses the supply measures to achieve maximum supply contribution. The report lists the results of
three equivalence tests (ecological elements score tests, limits of change in environmental outcomes,
and reliability of supply targets) to compare environmental outcomes and reliability of the Sustainable
Diversion Limit Adjustment scenario to the Sustainable Diversion Limit Benchmark scenario.

Modelling assessment to determine SDL Adjustment Volume
2
Published by the Murray–Darling Basin Authority
MDBA publication no: 35/17
ISBN (online): 978-1-925599-41-1
© Murray–Darling Basin Authority 2017
With the exception of the Commonwealth Coat of Arms, the MDBA logo, trademarks and any other
exempt photographs and graphics (these are identified), this publication is provided under a
Creative Commons Attribution 4.0 licence.
GPO Box 1801, Canberra ACT 2601
02 6279 0100
mdba.gov.au
https://creativecommons.org/licenses/by/4.0
The Murray-Darling Basin Authority’s preference is that you attribute this publication (and any
Murray-Darling Basin Authority material sourced from it) using the following wording within your
work:
Title: Modelling Assessment to Determine SDL Adjustment Volume Source: Licensed from the Murray-Darling Basin Authority under a Creative Commons Attribution 4.0 Australia Licence
Accessibility
The Murray‒Darling Basin Authority makes its documents and information available in accessible
formats as far as possible. Some content is highly technical in nature which may mean that we
cannot make it fully accessible. If you encounter accessibility problems or the document is in a
format that you cannot access, please contact us.
Acknowledgement of the Traditional Owners of the Murray–Darling Basin
The Murray−Darling Basin Authority pays respect to the Traditional Owners and their
Nations of the Murray−Darling Basin. We acknowledge their deep cultural, social,
environmental, spiritual and economic connection to their lands and waters.
The guidance and support received from the Murray Lower Darling Rivers Indigenous Nations, the
Northern Basin Aboriginal Nations and our many Traditional Owner friends and colleagues is very
much valued and appreciated.

Modelling assessment to determine SDL adjustment volume
i
Executive summary
In 2012, the Commonwealth Government adopted the Basin Plan, providing the first integrated
framework for water planning in the Murray–Darling Basin. The Basin Plan aims to restore healthy
river systems for the benefit of the environment, communities and agriculture. At the Basin-scale,
sustainable diversion limits (SDLs) restrict the consumption of surface water resources to a long
term average volume of 10,873 GL per year, requiring the basin-wide recovery of 2,750 GL of
water for the environment. The SDLs will take effect in 2019 when Basin Plan-compliant water
resource plans are passed into legislation in each Basin state.
One of the main assumptions underlying the setting of the SDLs was that most existing
management policies and infrastructure would remain in place. This assumption was reflected in
the Basin Plan modelling, with only a limited number of changes proposed to these settings to
enable the vision of a healthy working basin to be achieved. However, Basin Water Ministers
recognised that by expanding on these changes and investing in new infrastructure, there was an
opportunity to build further on the anticipated outcomes of the Basin Plan so that equivalent
environmental outcomes can be achieved without needing to reduce consumptive use as much as
originally anticipated in the Basin Plan. Governments can also propose projects that provide more
water for the environment by making consumptive water use more effective and efficient, providing
those water savings to the environment (referred to as efficiency measures). Efficiency measures
are not considered in this report.
To enable these opportunities to be pursued, Water Act amendments and the Basin Plan 2012
provided for a Sustainable Diversion Limit Adjustment Mechanism (Adjustment Mechanism). The
Adjustment Mechanism, described in Chapter 7 and Schedule 6 of the Basin Plan, allows the
Commonwealth minister responsible for water to adjust the SDLs in response to a set of measures
that enhance the outcomes of the Basin Plan.
The respective roles and responsibilities of the MDBA and Basin governments in the Adjustment
Mechanism are outlined in the Basin Plan and the Intergovernmental Agreement on Implementing
Water Reform in the Murray–Darling Basin (the IGA). In summary, Basin governments are
responsible for developing supply and efficiency measures, and selecting the final package of
measures which are to be considered for an SDL adjustment. The role of the MDBA is to provide
advice on SDL adjustment proposals as they are developed, and to determine the size of the SDL
adjustments from the chosen package of supply and efficiency measures.
In June 2017, the Basin Officials Committee endorsed a package of 36 measures to be included
for modelling assessment of SDL adjustment contribution. This recommendation was made after
the measures had been reviewed over a four year period through a series of inter-governmental
technical and policy forums. The review process investigated the specific on-ground changes
proposed by each measure. This ensured that the appropriate modelling information was included
to robustly represent each measure in the MDBA modelling framework. All the components of the
36 Adjustment Mechanism projects have received sign-off from the Sustainable Diversion Limit
Adjustment Assessment Committee (SDLAAC) and have been endorsed by Basin Officials
Committee and the Authority prior to their inclusion to the modelling framework.

Modelling assessment to determine SDL adjustment volume
ii
Chapter 7 of the Basin Plan outlines the method by which the supply contribution is to be
calculated. Central to the method is a comparison between two model scenarios: one representing
the Basin Plan with 2,750 GL of water recovered for the environment (i.e. the benchmark scenario);
and a second scenario representing a Basin Plan modified to include all agreed supply measures
and less water for the environment (the adjustment scenario).
The purpose of this comparison is to ensure that equivalent environmental outcomes desired by
the Basin Plan are achieved. In effect, the reduced environmental outcomes that will result from
less water recovery must be counter-balanced by improved environmental outcomes achieved by
the supply measures.
Chapter 7 of the Basin Plan provides a number of elements that must be included in this
determination. It specifies that the method of calculation must be based on:
a. a repeat of the historical climate conditions; and
b. the benchmark conditions of development modified by:
I. the addition of the notified supply measures; and
II. the removal of any unimplemented policy measures;
Such that the adjustment scenario achieves the following as compared with the benchmark
scenario:
c. there are equivalent environmental outcomes; and
d. there are no detrimental impacts on reliability of supply of water to the holders of water
access rights that are not offset or negated.
These are relatively broad requirements, and there is a wide range of methods that could be
applied that meet these criteria. Chapter 7 therefore provided two options for the applicable
method: it could be the default method set out in Schedule 6 of the Basin Plan, or it could be
another method agreed to by the Authority and Basin Officials Committee. With the endorsement
of Basin governments (through Basin Officials Committee), MDBA have followed the first of these
options, applying the default method to determine the supply contribution.
The default method was developed in collaboration with Basin governments towards the end of the
Basin Plan development process (i.e. in 2011–12). A foundation component is the modelling
framework (Yang, 2010) that assisted in the development of the Basin Plan, but extended to ensure
that it is consistent with the requirements of Chapter 7.
The default method is based on an iterative process. The supply contribution is progressively
adjusted, while ensuring equivalent environmental outcomes and no detrimental impacts on
reliability of supply (as shown in Figure 1 below). The first step in this iterative process is to
calculate the environmental outcomes and reliability that would occur under benchmark conditions
(MDBA, 2017a). The supply measures are then added to the benchmark model. The supply
measures package model is then used to determine the maximum achievable supply contribution,
while ensuring equivalent environmental outcomes and no detrimental impacts on reliability result.
There are three tests for comparing environmental outcomes and reliability to the benchmark
model, including:
ecological element scores (S6.05)
limits of change in environmental outcomes (S6.07)
reliability of supply target (s7.15).

Modelling assessment to determine SDL adjustment volume
iii
Figure 1: Application of the default method
In order to assess the notified measures by Basin Officials Committee, MDBA has extended the
modelling framework that was used to develop the Basin Plan in a way that allows Chapter 7 and
Schedule 6 of the Basin Plan to be followed consistently and systematically. Inclusion of the
measures into the modelling framework has been extensively reviewed by the states through the
SDL Adjustment Technical Working Group (SDLA TWG), and SDLAAC. Approaches used to
model the measures with additional modelling information required to represent the measures are
based on endorsement by Basin Officials Committee in June 2017. Therefore it is concluded that:
the modelling framework has been established and operated in accordance with the
Default Method set out in Schedule 6 of the Basin Plan to identify the maximum supply
contribution possible
all SDL supply measures are incorporated into the modelling framework following the
final notifications and endorsement by Basin Officials Committee.
MDBA has used an existing sub-revision system so that copies of all relevant data files for the
benchmark and adjustment models, together with all components of the modelling framework, are
to be preserved to allow the models to be operated in the future by the MDBA or the jurisdictions
as the need arises.
Final determination of SDL adjustment volume with model outcomes is presented in MDBA (2017b,
in prep).

Modelling assessment to determine SDL adjustment volume
Contents
Executive summary ....................................................................................................................... i
Introduction ........................................................................................................................... 1
Model scenarios .................................................................................................................... 3
The default method ............................................................................................................... 4
Equivalence test for environmental outcomes ....................................................................... 5
4.1 Calculation of environmental outcomes scores (S6.07(a)).............................................. 5
4.2 Limits of change ............................................................................................................. 6
4.3 Reliability of water supply ............................................................................................. 13
Notified measures ............................................................................................................... 15
Model representation of notified supply measures............................................................... 26
Modelling assessment ......................................................................................................... 27
7.1 Benchmark conditions .................................................................................................. 27
7.2 Target diversions and adjust entitlements .................................................................... 27
7.3 Set environmental demand .......................................................................................... 29
Conclusion .......................................................................................................................... 31
References.......................................................................................................................... 32
Appendix A– Operational rule changes and system enhancements ........................................... 33
Context and Status of Modelling Assumptions ........................................................................ 33
Appendix B– Environmental works ............................................................................................. 50
Appendix C - Modelled results (measure-by-measure) ............................................................. 102

Modelling assessment to determine SDL adjustment volume
1
Introduction
In 2012, the Commonwealth Government adopted the Basin Plan, providing the first integrated
framework for water planning in the Murray–Darling Basin. The Basin Plan aims to restore healthy
river systems for the benefit of the environment, communities and agriculture.
A central component of the Basin Plan is the establishment of sustainable diversion limits (SDLs)
that specify the maximum amount of water that can be taken from surface and ground water
resources. At the Basin-scale, SDLs restrict the consumption of surface water resources to a long
term average volume of 10,873 GL per year, requiring the basin-wide recovery of 2,750 GL of
water for the environment. The SDLs will take effect in 2019 when Basin Plan-compliant water
resource plans are passed into legislation in each Basin state and the ACT.
SDLs were determined using a number of information streams, including an assessment of
historical environmental flows, socio-economic outcomes, and a census of constraints in the river
system. Underlying this information was the MDBA hydrologic modelling program that commenced
in 2009 and was reviewed and refined through to 2012. The purpose of the hydrological modelling
work program was to inform the decision on the SDLs by illustrating the ecological outcomes that
could be achieved with water recovery under the Basin Plan.
One of the main assumptions underlying the setting of the SDLs was that most existing
management policies and infrastructure would remain in place. This assumption was reflected in
the Basin Plan modelling, with only a limited number of changes proposed to these settings to
enable the vision of a healthy working basin to be achieved. However, Basin Water Ministers
recognised that by expanding on these changes and investing in new infrastructure, there was an
opportunity to build further on the anticipated outcomes of the Basin Plan.
To enable these opportunities to be pursued, Water Act amendments and the Basin Plan 2012
provided for a Sustainable Diversion Limit Adjustment Mechanism (Adjustment Mechanism). The
mechanism, described in Chapter 7 of the Basin Plan, allows the Commonwealth minister
responsible for water, on the advice of the MDBA, to adjust the SDLs in response to a set of
measures that enhance the outcomes of the Basin Plan.
As part of the agreed arrangements, the SDLs in the Basin Plan can be increased if projects are
developed to make environmental watering more efficient. Referred to as supply measures, these
are projects which can deliver environmental outcomes that are equivalent to those achievable
with 2,750 GL of water recovery, but with less environmental water. Examples of such projects
include the reconfiguration of storages to reduce evaporation, or the construction of environmental
works at key environmental sites along the river. The supply measures will increase the volume of
water available for consumptive use. The contribution of these projects to an SDL adjustment is
referred to as a supply contribution.
The adjustment mechanism also allows for more water to be provided for the environment if
efficiencies can be found in irrigation water use. These projects are referred to as efficiency
measures, and their contribution to an SDL adjustment is called the efficiency contribution. The
efficiency program is run through a separate process and is not the subject of this report. Instead,
this report will focus on the method to calculate the supply contribution.

Modelling assessment to determine SDL adjustment volume
2
The respective roles and responsibilities of the MDBA and Basin governments in the Adjustment
Mechanism are outlined in the Basin Plan and the Intergovernmental Agreement on Implementing
Water Reform in the Murray−Darling Basin (IGA, 2003). In summary, Basin governments are
responsible for developing supply and efficiency measures, and selecting the final package of
measures which are to be considered for an SDL adjustment. The role of the MDBA is to provide
advice on SDL adjustment proposals as they are developed, and to determine the size of the SDL
adjustments from the chosen package of supply and efficiency measures.
Chapter 7 of the Basin Plan outlines the method by which the supply contribution is to be
calculated. Central to the method is a comparison between two model scenarios: one representing
the Basin Plan with 2,750 GL of water recovered for the environment (i.e. the benchmark scenario);
and a second scenario representing a Basin Plan modified to include all notified supply measures
and less water for the environment (the adjustment scenario).
The purpose of this comparison is to ensure that the environmental outcomes desired by the Basin
Plan are maintained. In effect, the reduced environmental outcomes that will result from less water
recovery must be counter-balanced by improved environmental outcomes achieved by the supply
measures. The variable to be isolated through this determination is the volume of water to be
returned to the consumptive pool — the supply contribution.
Chapter 7 provides a number of elements that must be included in this determination. It specifies
that the method of calculation must be based on:
a. a repeat of the historical climate conditions; and
b. the benchmark conditions of development modified by:
III. the addition of the notified supply measures; and
IV. the removal of any unimplemented policy measures;
Such that the adjustment scenario achieves the following as compared with the benchmark
scenario:
c. there are equivalent environmental outcomes; and
d. there are no detrimental impacts on reliability of supply of water to the holders of water
access rights that are not offset or negated.
Basin governments agreed on a default method by which these determination requirements could
be satisfied. This method, described in Schedule 6 of the Basin Plan, is based upon the Basin Plan
hydrological modelling platform which was used to inform the SDLs. The default method requires
extensions to this platform to make it fit-for-purpose for calculating a supply contribution.
Basin Governments have notified the Authority of projects to take into account in the adjustment
mechanism process. The first notification of supply measures and efficiency measures was made
by the Basin Officials Committee to the Authority on 5 May 2016. In 2016, the Basin Plan was
amended to provide for a second notification by 30 June 2017 to maximise the benefits of the SDL
adjustment mechanism and meet stakeholder expectations. The full package of projects notified
by Basin Governments is listed at Chapter 5.
This report describes implementation of the notified measures in the modelling framework and the
application of the default method to assess the supply contribution from the agreed package of
measures.

Modelling assessment to determine SDL adjustment volume
3
Model scenarios
Two key model scenarios are referenced in this report, namely the SDL benchmark model (SDLBM)
and the SDL adjustment model (SDLA) which includes the supply measures package. An overview
of modelling scenarios is provided in Table 1.
The primary purpose of the benchmark scenario is to represent water sharing arrangements under
a fully implemented Basin Plan, including the recovery of 2,750 GL of water for the environment.
The scenario is more fully described in the benchmark conditions of development report (MDBA
2017a). To summarise, this scenario is based on model run 847 that was completed in 2011 as
part of Basin Plan development, but modified to make it fit for the purposes of assessing SDL
contribution by the notified supply measures.
MDBA (2012b) details model assumptions used in developing model run 847. The modifications
to this model run include the mandated changes recommended in Schedule 6 of the Basin Plan,
plus a number of non-mandated changes that jurisdictions have agreed to be included in the
benchmark model. These changes were developed in collaboration with Basin governments
through the SDL Adjustment Technical Working Group (SDLA TWG), and have been endorsed by
the SDL Adjustment Advisory Committee (SDLAAC) and Basin Officials Committee in June 2017.
Details of the model changes and modelled outcomes can be found in MDBA (2017a) and therefore
only relevant results for assessing SDL supply contribution are presented in this report.
Table 1: Overview of modelling scenarios
Name Run
number Description Reference
SDLBM 1132 SDL Benchmark scenario MDBA (2017a)
SDLA 1138 SDL Adjustment scenario Current report
MDBA (2017b)

Modelling assessment to determine SDL adjustment volume
4
The default method
Section 7.15 of the Basin Plan sets out the process that the Authority must take to determine the
total supply contribution. In general terms, the process involves determining the maximum supply
contribution that can be achieved as a result of implementing the supply measures, while ensuring:
there are equivalent environmental outcomes
there are no detrimental impacts on reliability of supply of water to the holders of water
access rights that are not offset or negated.
In calculating adjustments to SDLs, the applicable approach set out in Schedule 6 is the default
method. The default method is based on an iterative process. The supply contribution is
progressively adjusted, while ensuring equivalent environmental outcomes and no detrimental
impacts on reliability of supply (Figure 1). The first step in this iterative process is to calculate the
environmental outcomes and reliability that would occur under benchmark conditions.
The supply measures are then added to the benchmark model. The supply measures package
model (SDLA) is then used to determine the maximum achievable supply contribution, while
ensuring equivalent environmental outcomes and no detrimental impacts on reliability result. There
are three tests for comparing environmental outcomes and reliability to the benchmark model,
including:
ecological element scores (S6.05)
limits of change in environmental outcomes (S6.07)
reliability of supply target (s7.15).
The MDBA has developed a modelling assessment framework to implement the default method by
extending the modelling framework (Yang, 2010) that had been used to set SDLs for the Basin
Plan after quality assurance (Hughes, 2010) and fitness for purpose assessment (Podger et. al.,
2010). This framework links hydrologic models in the Basin and supports comparison between
scenarios. It is independently reviewed by Bewsher (2016) and found to be fit-for-purpose of
determining SDL adjustment volume. This allows the outcome from implementing the supply
measures to be compared to the benchmark conditions, including impacts on hydrology, reliability
and environmental outcomes.

Modelling assessment to determine SDL adjustment volume
5
Equivalence test for environmental outcomes
4.1 Calculation of environmental outcomes scores (S6.07(a))
As per S6.06 in Schedule 6 of the Basin Plan, an ecological element scoring method is used to
determine whether the overall environmental scores are equivalent to ones achieved under the
benchmark conditions. The Authority commissioned CSIRO to develop a science-based and fit-
for- purpose method for calculating ecological element scores (Overton, et. al., 2015). The method
was independently reviewed and found to be compliant to S6.05 of the Basin Plan (Brookes et. al.,
2014).
The ecological element scoring method is focussed on key river reaches and associated
floodplains that have significant environmental assets and have detailed assessments of
environmental water requirements (MDBA 2012a and 2012b). An indicator site is used to represent
the overall ecological outcome for a reach (Figure 2). There are nine reaches identified within the
Southern Basin (Table 2). The method reports on any change in ecological outcome compared to
that achieved under SDLBM. The ecological score is derived from preference curves that relate the
frequency of flow events and the length of dry spells to ecological health conditions (Overton, et.
al., 2015).
There are three starting conditions (minimum−poor, medium−average and maximum−good);
leading to three different overall scores. The different starting conditions are developed to deal with
the uncertainty of initial ecological conditions in 1895. The equivalent test is applicable for all three
cases. The method requires that there is no reduction in the overall environmental outcome scores.
However, it does allow some reductions in individual elements and/or reaches if they are offset by
increases in other elements and/or reaches. Table 2 presents ecological outcome scores for all
three starting conditions.

Modelling assessment to determine SDL adjustment volume
6
Table 2: Ecological outcome scores for the reaches achieved under the benchmark conditions, based on three different starting conditions
Reach Minimum starting
conditions Medium starting
conditions Maximum starting
conditions
Upper Murray (Barmah−Millewa Forest)
4933 5100 5188
Upper Mid Murray (Gunbower−Koondrook−Pericoota Forest)
5408 5567 5685
Lower Mid Murray (Hattah Lakes)
3278 3387 3505
Lower Murray (Riverland−Chowilla Floodplain)
3860 3970 4067
Edward Wakool river system 4009 4169 4246
Lower Goulburn Floodplain 8077 8219 8219
Lower Darling Floodplain 2685 2791 2874
Mid- Murrumbidgee wetlands 4487 4646 4864
Lower Murrumbidgee Floodplain 6345 6502 6582
Southern Basin region score 4787 4928 5026
4.2 Limits of change
Inherent to the default method described in Schedule 6 of the Basin Plan is the concept of trade-
off between environmental outcomes. That is, lower environmental outcomes in one part of the
river-dependent ecosystem can be offset by improvements in other parts.
To ensure that these trade-offs were not unduly excessive, Schedule 6 (S6.07) describes a set of
limits of change (LoC). The purpose of these limits is to allow the trade-off mechanism to operate
as intended while ensuring that the whole-of-ecosystem outcomes desired by the Basin Plan are
maintained. The limits of change are associated with four sets of outcomes: bankfull and overbank
flow events; the Coorong, Lower Lakes, and Murray Mouth (CLLMM); and fresh and base flow
requirements.
Figure 2 outlines the environmental assets that were used to determine the bankfull and overbank
requirements of the southern Basin, and it also outlines the CLLMM system.

Modelling assessment to determine SDL adjustment volume
7
Figure 2: Environmental assets (outlined in grey) used to determine many of the environmental water requirements throughout the southern Basin.

Modelling assessment to determine SDL adjustment volume
8
4.2.1 Overbank flow indicators
In MDBA (2012b), there are nine sites reporting overbank flow outcomes. At each site, there are a
number of Specific Flow Indicators (SFIs) to cover environmental water requirements for a range
of ecological habitats. Detailed explanation of the selected sites and flow indication is available in
MDBA (2012a).
The limits on the overbank flow indicators are applied differently depending on benchmark
outcomes achievement against the target frequencies as described at Table 3.
Table 3: Limits of changes applied for overbank flow indicators
Benchmark achievement Limits of changes
(i) > target frequency Minimum of 10% below the benchmark result and target frequency
(ii) < target frequency
Allowed to be varied by 10% of the benchmark result
(iii) Less than 50% progress to the target frequency from the baseline result
Minimum of 15% below the benchmark result and the baseline result
For all overbank indicators at every reach, the benchmark outcomes with sub-clauses applied are
presented at Table 4.
Table 4: Benchmark conditions – achievement of flow indicators and limits of change
Achievement of flow indicators under the benchmark conditions and their limits of change
Upper Murray (measured at Yarrawonga DS) SDLBM LoC Section
12,500 ML/d for a total duration of 70 days (with min duration of 7 consecutive days) between Jun & Nov
76% 70% S6.07(b)(i)
16,000 ML/d for a total duration of 98 days (with min duration of 7 consecutive days) between Jun & Nov
53% 48% S6.07(b)(i)
25,000 ML/d for a total duration of 42 days (with min duration of 7 consecutive days) between Jun & Nov
50% 45% S6.07(b)(i)
35,000 ML/d for a total duration of 30 days (with min duration of 7 consecutive days) between Jun & May
36% 33% S6.07(b)(i)
50,000 ML/d for a total duration of 21 days (with min duration of 7 consecutive days) between Jun & May
17% 17% S6.07(b)(ii), S6.07(b)(iii)
60,000 ML/d for a total duration of 14 days (with min duration of 7 consecutive days) between Jun & May
14% 14% S6.07(b)(ii), S6.07(b)(iii)
15,000 ML/d for a total duration of 150 days (with min duration of 7 consecutive days) between Jun & Dec
35% 32% S6.07(b)(i)
Upper Mid Murray (measured at Torrumbarry DS) SDLBM LoC Section

Modelling assessment to determine SDL adjustment volume
9
Achievement of flow indicators under the benchmark conditions and their limits of change
16,000 ML/d for a total duration of 90 days (with min duration of 7 consecutive days) between Jun & Nov
68% 61% S6.07(b)(ii)
20,000 ML/d for a total duration of 60 days (with min duration of 7 consecutive days) between Jun & Nov
64% 60% S6.07(b)(i)
30,000 ML/d for a total duration of 60 days (with min duration of 7 consecutive days) between Jun & May
40% 36% S6.07(b)(i)
40,000 ML/d for a total duration of 60 days (with min duration of 7 consecutive days) between Jun & May
24% 22% S6.07(b)(ii)
20,000 ML/d for a total duration of 150 days (with min duration of 7 consecutive days) between Jun & Dec
26% 23% S6.07(b)(ii)
Lower Mid Murray (measured at Euston DS) SDLBM LoC Section
40,000 ML/d for a total duration of 60 days (with min duration of 7 consecutive days) between Jun & Dec
46% 41% S6.07(b)(i)
50,000 ML/d for a total duration of 60 days (with min duration of 7 consecutive days) between Jun & Dec
30% 30% S6.07(b)(i)
70,000 ML/d for a total duration of 42 days (with min duration of 7 consecutive days) between Jun & Dec
18% 16% S6.07(b)(ii)
85,000 ML/d for a total duration of 30 days (with min duration of 7 consecutive days) between Jun & May
11% 10% S6.07(b)(ii), S6.07(b)(iii)
120,000 ML/d for a total duration of 14 days (with min duration of 7 consecutive days) between Jun & May
8% 8% S6.07(b)(ii), S6.07(b)(iii)
150,000 ML/d for a total duration of 7 days (with min duration of 7 consecutive days) between Jun & May
6% 5% S6.07(b)(ii), S6.07(b)(iii)
Lower Murray (measured with flow to SA) SDLBM LoC Section
40,000 ML/d for a total duration of 30 days (with min duration of 7 consecutive days) between Jun & Dec
55% 50% S6.07 (d)
40,000 ML/d for a total duration of 90 days (with min duration of 7 consecutive days) between Jun & Dec
38% 34% S6.07(b)(i)
60,000 ML/d for a total duration of 60 days (with min duration of 7 consecutive days) between Jun & Dec
27% 25% S6.07(b)(i)
80,000 ML/d for a total duration of 30 days (with min duration of 7 consecutive days) between Jun & May
15% 14% S6.07(b)(ii), S6.07(b)(iii)
100,000 ML/d for a total duration of 21 days (with min duration of 1 day) between Jun & May
7% 6% S6.07(b)(ii), S6.07(b)(iii)
125,000 ML/d for a total duration of 7 days (with min duration of 1 day) between Jun & May
5% 4% S6.07(b)(ii), S6.07(b)(iii)

Modelling assessment to determine SDL adjustment volume
10
Achievement of flow indicators under the benchmark conditions and their limits of change
Edward-Wakool Reach (measured at Deniliquin)
SDLBM LoC Section
5,000 ML/d for a total duration of 60 days (with min duration of 7 consecutive days) between Jun & Dec
66% 60% S6.07(b)(i)
5,000 ML/d for a total duration of 120 days (with min duration of 7 consecutive days) between Jun & Dec
36% 35% S6.07(b)(i)
18,000 ML/d for a total duration of 28 days (with min duration of 5 consecutive days) between Jun & Dec
16% 15% S6.07(b)(ii), S6.07(b)(iii)
30,000 ML/d for a total duration of 21 days (with min duration of 6 consecutive days) between Jun & Dec
13% 12% S6.07(b)(ii), S6.07(b)(iii)
Lower Darling Reach (measured at Weir 32) SDLBM LoC Section
17,000 ML/d for 18 consecutive days between Jun & May 21% 20% S6.07(b)(i)
20,000 ML/d for 30 consecutive days between Jun & May 11% 10% S6.07(b)(ii),
S6.07(b)(iii)
25,000 ML/d for 45 consecutive days between Jun & May 8% 8% S6.07(b)(i)
45,000 ML/d for 2 consecutive days between Jun & May 7% 7% S6.07(b)(i)
Mid-Murrumbidgee Reach (measured at Narrandera)
SDLBM LoC Section
26,850 ML/d for a total duration of 45 days (with min duration of 1 day) between Jul & Nov
11% 11% S6.07(b)(ii), S6.07(b)(iii)
26,850 ML/d for 5 consecutive days between Jun & Nov 60% 54% S6.07(b)(i)
34,650 ML/d for 5 consecutive days between Jun & Nov 41% 37% S6.07(b)(i)
44,000 ML/d for 3 consecutive days between Jun & Nov 23% 22% S6.07(b)(ii),
S6.07(b)(iii)
63,250 ML/d for 3 consecutive days between Jun & Nov 10% 10% S6.07(b)(ii),
S6.07(b)(iii)
Lower Murrumbidgee Reach (measured at Maude Weir)
SDLBM LoC Section
Total volume of 175 GL (flow > 5,000 ML/d) between Jul & Sep
94% 85% S6.07(b)(i)
Total volume of 270 GL (flow > 5,000 ML/d) between Jul & Sep
86% 77% S6.07(b)(i)
Total volume of 400 GL (flow > 5,000 ML/d) between Jul & Oct 83% 75% S6.07(b)(i)
Total volume of 800 GL (flow > 5,000 ML/d) between Jul & Oct 60% 54% S6.07(b)(i)

Modelling assessment to determine SDL adjustment volume
11
Achievement of flow indicators under the benchmark conditions and their limits of change
Total volume of 1,700 GL (flow > 5,000 ML/d) between Jul & Nov
30% 27% S6.07(b)(i)
Total volume of 2,700 GL (flow > 5,000 ML/d) between May & Feb
18% 16% S6.07(b)(i)
Lower Goulburn Floodplain (measured at Shepparton)
SDLBM LoC Section
25,000 ML/d for a median duration of 5 days between Jun & Nov
82% 74% S6.07(b)(i)
40,000 ML/d for a median duration of 4 days between Jun & Nov
61% 55% S6.07(b)(i)
4.2.2 Outcomes for the CLLMM (S6.07(c))
Unlike the overbank flow indicators, the limits for the CLLMM indicators are not relative to
benchmark outcomes, instead absolute limits are applied. There are five limits to be maintained or
improved under a SDL adjustment scenario. These includes:
(i) Lake Alexandrina salinity: less than 1500 EC for 100 % of the time and less than 1000
EC for 95 % of days where the salinity at the lake is measured at Milang in the model;
(ii) Barrage flows: greater than 2000 GL/yr on a three year rolling average with a minimum
of 650 GL in any year, to be achieved for 95 % of years;
(iii) Barrage flows: greater than 600 GL over any two year period, to be achieved for 100 %
of the time;
(iv) Coorong salinity: South Lagoon average daily salinity less than 100 grams per litre for
96 % of years, where the salinity is calculated from the Coorong hydrodynamic model
(MDBA, 2009) and an averaged value in the southern lagoon; and
(v) Mouth openness: Mouth open to an average annual depth of 1 m (-1 m AHD) or more
for at least 90 % of years and 0.7 m (-0.7 m AHD) for 95 % of years where the depth is
measured as Mouth bed height from the Coorong hydrodynamic model (MDBA, 2009).
The benchmark outcomes for the CLLMM and their LoCs are summarised at Table 5.
Table 5: Outcomes achieved at CLLMM under the benchmark conditions and their limits of changes
CLLMM indicators LoC Section SDLBM
% of time salinity in Lake Alexandrina < 1500 EC 100% S6.07(c)(i) 100%
% of time salinity in Lake Alexandrina < 1000 EC 95% S6.07(c)(i) 99%
% of years with 3yr rolling average barrage flow > 2,000 GL/y, with a minimum of 650 GL/y
95% S6.07(c)(ii) 97%
% of years with 2yr rolling Barrage flow > 600 GL 100% S6.07(c)(iii) 100%
% of time when salinity in south Coorong < 100 g/L 96% S6.07(c)(iv) 100%
% of years with average annual depth at Murray Mouth > 1 m 90% S6.07(c)(v) 93%
% of years with average annual depth at Murray Mouth > 0.7 m 95% S6.07(c)(v) 96%

Modelling assessment to determine SDL adjustment volume
12
4.2.3 Fresh and base flows requirements (S6.07(d))
For base flows and fresh requirements, no reduction in outcomes relative to the Benchmark run is
allowed. The benchmark outcomes of freshes are presented at Table 6. The baseflow outcomes
are presented in Table 7 at the sites agreed by the SDLA TWG at meeting 9.
Table 6: Proportion of years with a successful event for fresh flow indicators in the southern connected basin
Lower Murray (measured with flow to SA) SDLBM
20,000 ML/d for 60 consecutive days between Aug & Dec 69%
Edward-Wakool (measured at Deniliquin) SDLBM
1,500 ML/d for a total duration of 180 days (with min duration of 1 day) between Jun & Mar 94%
Lower Darling (measured at Weir 32) SDLBM
7,000 ML/d for 10 consecutive days between Jun & May 54%
Lower Murrumbidgee (measured at Maude) SDLBM
1,100 ML/d for 25 consecutive days between Dec & May 47%
4,500 ML/d for 20 consecutive days between Oct & Dec 53%
Lower Goulburn floodplain (measured at Shepparton) SDLBM
Two events annually of 2,500 ML/d for 4 consecutive days (with min duration of 30 days between events) between Dec & Apr
56%
5,000 ML/d for 14 consecutive days between Oct & Nov 59%

Modelling assessment to determine SDL adjustment volume
13
Table 7: Annual average baseflow requirement and baseflow shortfalls for SDLBM (GL/y).
Site description Baseflow requirement SDLBM
Murrumbidgee @ Darlington Point 645 1
Murrumbidgee @ Balranald 597 21
Goulburn @ U/S Goulburn Weir 757 0
Goulburn @ McCoys Bridge 746 0
Campaspe @ U/S Campaspe Weir 19 0
Campaspe @ Rochester 36 0
Loddon @ U/S Serpentine Weir 12 0
Loddon @ Appin South 12 0
Murray @ D/S Yarrawonga Weir 1469 2
Murray River @ D/S Torrumbarry 2002 4
Murray River @ D/S Euston 2999 9
Murray River @ Flow to SA 3220 9
Darling @ Burtundy 151 1
4.3 Reliability of water supply
In addition to the ecological criteria described above, the default method also requires the package
of supply measures to have no detrimental impact on the reliability of other water users (section
7.15).
Ensuring water users have a clear and predictable long-term reliability of supply has required
decades of effort from Basin governments and MDBA. The Murray–Darling Basin Agreement
describes the agreed process by which River Murray water is shared between NSW, Victoria and
SA users on a year-to-year basis. Water flowing into the Murray originates in multiple catchments
across the Basin, hence the allocation process is complex. Its development required many years
of analysis and discussion, for which modelling was an important line of evidence. The experience
of river operators and water users was also a vital contributor to achieving a successful agreement.
Similarly, water allocation processes in the other southern catchments are described by the
relevant states water sharing instruments. State water authorities engaged with water users over
many years during the development of these plans.
This decades-long process to define water sharing arrangements has resulted in a robust process
by which States and the MDBA examine potential reliability impacts when a modification is
proposed for the river system (such as the package of supply measures). This process includes
State examination of model outputs, but it also includes an aspect of their expert judgement to
intelligently interpret available information and evidence. Including expert judgement

Modelling assessment to determine SDL adjustment volume
14
acknowledges that the models cannot capture all the detailed components of the on-ground
implementation of the supply package. It also acknowledges that some of the supply measures
may require refinement as they are implemented over coming years – for example, new knowledge
about an environmental works site may lead to a change in the shape of a levee bank, or operating
regimes of proposed structures.
The states, as managers of water entitlements, developed a range of indicators for each valley to
assess impacts on supply reliability. These indicators are used by state government experts to
ensure changes to SDLs have no detrimental impacts on the reliability of water supply that are not
offset or negated.
Basin Officials Committee discussed the approach on the assessment of reliability of water supply
to users and agreed to the following statement (which is in the advice to the Authority –
27 September 2017).
The Basin Officials Committee recognises that s.7.15 of the Basin Plan requires the Authority to
ensure there are no detrimental impacts on reliability of supply of water to the holders of water
access rights that are not offset or negated. If the operation of the SDL adjustment mechanism has
the potential to result in reduction of reliability for entitlement holders, jurisdictions will work together
to find real world solutions to address those reliability concerns, consistent with the requirements
of the Basin Plan.

Modelling assessment to determine SDL adjustment volume
15
Notified measures
The States were responsible for the development of the notified measures. As per Schedule 1 of
an intergovernmental Agreement (IGA, 2003), a phased approach was used to review and
progress supply measures proposed by the States (Figure 3). The approach has been designed
to progressively improve supply measures after taking into account comments and feedbacks from
the other state and Commonwealth governments and resulting in notification amendment if
needed. This consultative process led to the Basin Officials endorsing the modelling assessment
of 36 supply measures as a package (Figure 4 shows the geographic distribution of projects). The
measures agreed are listed in Table 8.
Figure 3: Phased approach of supply measure submission for Basin Officials Committee endorsement
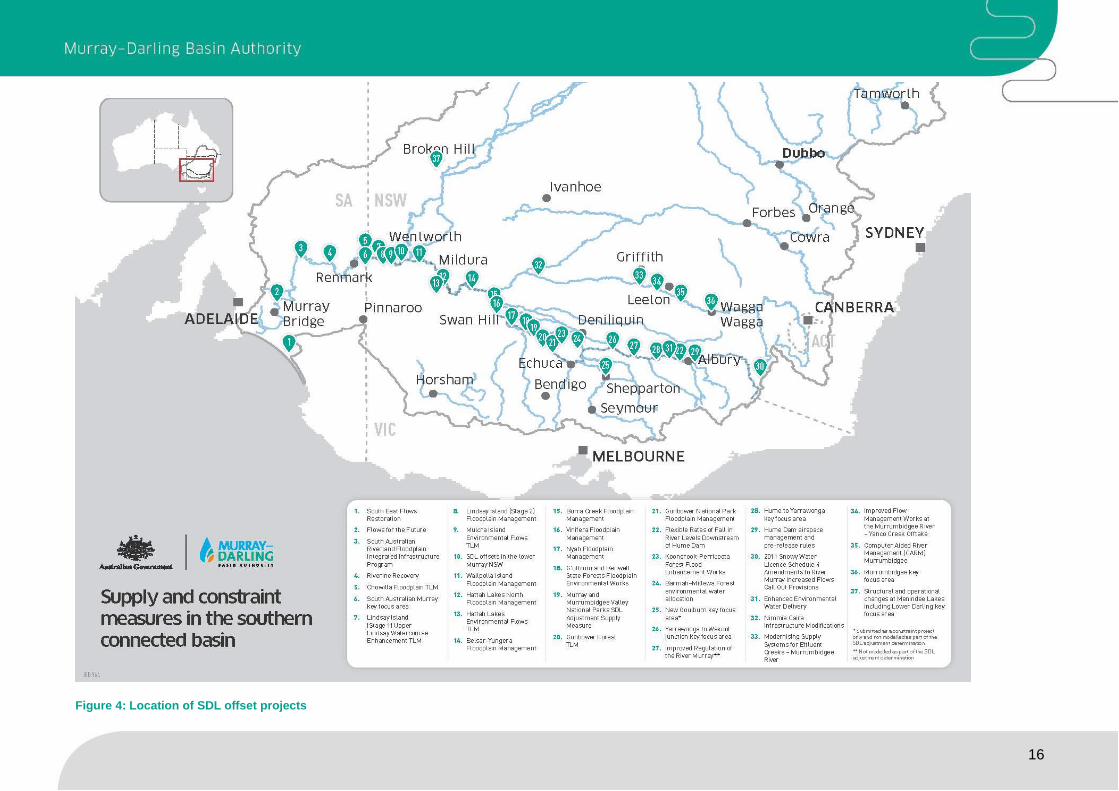
16
Figure 4: Location of SDL offset projects

17
Table 8: Notified supply measures, as endorsed by Ministerial Council (17th June 2017)
Operational rules changes and system enhancements
Location in map*
Project title Proponent Notification submitted
BOC endorse-ment
Project description
30
2011 Snowy Water Licence Schedule 4 Amendments to River Murray Increased Flows Call Out Provisions
NSW / Vic May 2016 June 2017
Amendments to Snowy Hydro licence in 2011 allow the water recovered by the River Murray Increased Flows (RMIF) to be held and called out. Previously the release of the water was at the discretion of Snowy Hydro and was generally at times suited to Snowy Hydro’s commercial outcomes. The proposal intends to provide a means to control the timing of RMIF water releases from the Snowy Scheme, allowing more flexibility to achieve environmental outcomes targeted in the Murray River below Hume Dam.
24 Barmah−Millewa Forest Environmental Water Allocation
Vic / NSW May 2016 June 2017
Rule change to vary the rules associated with the water set aside by Victoria and New South Wales in an environmental account (the Barmah-Millewa Forest Environmental Watering Account or BMFEWA) to water the Barmah-Millewa Forest proposed to allow the use of other environmental entitlements to target the environmental requirements specified in the Basin Plan. This measure proposes to not initiate or continue release from BMFEWA if a four monthly flood has already occurred.
35
Computer Aided River Management (CARM) Murrumbidgee
NSW May 2016 June 2017
The CARM project aims to use better information in the form of metering, inundation models and more accurate loss estimates to allow operators to more accurately make releases to meet downstream orders. The saved operational loss may then be calculated and set aside to achieve environmental outcomes. A callable entitlement as a result of the envisaged saving will allow delivery of previous losses (which were also contributing to environmental outcomes) in a more managed way.
31
Enhanced environmental water delivery (Hydro Cues)
NSW / Vic / SA
June 2017 September 2017
This project will achieve enhanced environmental outcomes by increasing environmental water holders’ ability to time releases of environmental water from dams with increases in natural flows caused by rainfall. Proponents and environmental water holders will work together to explore opportunities to better mimic natural conditions without impacting long and short term reliability. The environmental benefits, in part, will be dependent on the extent to which constraints projects are implemented. Any changes will be tested progressively and monitored in an adaptive management process consistent with agreed constraints outcomes. Proponents acknowledge the need for focussed engagement and consultation with communities on this project.
Note no. 25 Submitted as a constraint project only and not modelled as part of the SDL adjustment determination

18
Operational rules changes and system enhancements
22
Flexible Rates of Fall in River Levels Downstream of Hume Dam
Vic / NSW May 2016 June 2017
Rule change to allow Hume releases to be reduced more quickly when flows have not been elevated for an extended period beforehand, with the water saved released at a different point in time or in a different flow pattern that would provide additional environmental benefits. The additional flexibility improves Hume Dam operational efficiency.
29
Hume Dam airspace management and pre-release rules
Vic / NSW May 2016 June 2017 Rule change to allow future environmental water releases in airspace management.
27 Improved Regulation of the River Murray
Vic / NSW May 2016 June 2017 The proposal focused on recent observed improvements in reducing river operational losses. While notified as a supply measure, there was no agreement by all jurisdiction for the project to be modelled as part of the SDL adjustment determination in September 2017.
10
SDL offsets in the Lower Murray NSW
NSW May 2016 June 2017
The project aims to improve environmental water delivery and achieve better environmental and operational outcomes than achieved under the SDL benchmark model. This is to be done through the manipulation of weir pools, construction of a replacement pump station for Lake Cullulleraine (in Victoria), and works in the Carrs, Capitts and Bunberoo Creek systems to provide evaporative and seepage water savings. Weir pools can create unnatural inundation of connected wetlands when the river is held artificially high. Lowering the weir pool can be used to return wetlands to a more natural wetting/drying regime, while raising it can allow water to reach areas that would be difficult to water under most conditions. The strategy of raising and lowering the weirs should provide an environmental benefit compared to an artificially constant weir pool level.

19
Operational rules changes and system enhancements
37
Structural and operational changes at Menindee Lakes
NSW May 2016 June 2017
This project is a package of operational changes and infrastructure works designed to improve the efficiency of the Menindee Lakes system. The enhanced Menindee project introduces some new works and measures to incorporate a wider range of infrastructure, operations, regulatory and adjustment options which in combination will deliver greater water efficiency savings. The proponent acknowledges the need for consultation with communities and the need to set out transparent governance arrangements.
BOC – Basin Officials Committee
Environmental works
Location in map*
Project title Proponent Notification submitted
BOC endorse-ment
Project description
14 Belsar−Yungera Floodplain Management Project
Vic May 2016 May 2017
This proposed supply measure will maintain and improve flora and fauna habitat values and provide periodic breeding opportunities for wetland species, such as fish, frogs and waterbirds. Managed flows will be able to be delivered to 2,370 hectares of highly valued floodplain, representing one third of the total area. The works can be operated flexibly to meet the water requirements of different vegetation communities, mimicking a broad range of River Murray flows up to 170,000 megalitres per day. Through the construction of three large regulators, a series of smaller supporting regulators, track raising (levees) and a pipeline (to allow use of temporary pumps), this project will connect extensive areas of floodplain through tiered watering events. These works will make use of natural flow paths to increase the extent, frequency and duration of inundation from either Basin Plan flows or pumping during low flow events.
15
Burra Creek Floodplain Management Proposal
Vic May 2016 May 2017
The proposed works will enable inundation of an area of 407 hectares. This represents 33 percent of the total forest area and almost all of the flood dependent communities found within the forest, and provides a greater extent of watering than is possible under Basin Plan flows. The works involve the construction of three large regulators, raising tracks to form levees, and the removal of barriers to flow on the floodplain.
5
Chowilla Floodplain TLM Project
SA / NSW / Vic
May 2016 May 2017
The Chowilla Floodplain works is part of a program of The Living Murray (TLM) works at icon sites along the River Murray to ensure that environmental water recovered as part of TLM is used efficiently and ecological elements are maintained. The Chowilla Floodplain project involves a major environmental regulator on the Chowilla Creek and a range of complementary works. The environmental regulator will allow flows to be managed to enable flooding across the floodplain under relatively low river flow conditions.

20
Environmental works
2 Flows for the Future
SA May 2016 June 2017
The project proposes activities that reduce the interception of low flows and result in additional flows to riverine environments in the Eastern Mount Lofty Ranges (EMLR) and to the Murray River including the Coorong, Lower Lakes and Murray Mouth in South Australia. The project will help restore the natural low flow patterns within the EMLR through measures that will improve the passage of low flows and freshes to improve ecological habitat conditions.
20 Gunbower Forest TLM Project
Vic / NSW / SA
May 2016 June 2017
A suite of engineering works have been built through TLM to deliver environmental water to the Gunbower Forest Icon Site, watering up to 4,800 hectares. These works and associated operating regime have been designed to achieve the ecological objectives that have been set for the forest. The works include two main components: • Lower Landscape Works — target the forest wetlands and use relatively small volumes of water. Works included refurbishing existing regulators within the forest, constructing new regulators and decommissioning of a single regulator. These regulators deliver water from either Gunbower Creek or the River Murray (when flows exceed 14,000 megalitres per day). • Hipwell Road Channel — targets large areas of river red gums and can create the conditions required for large colonial waterbird breeding events. Works include construction of a channel to deliver water from Gunbower Creek to the forest, a new weir in Gunbower Creek and associated works.
21
Gunbower National Park Floodplain Management Project
Vic May 2016 June 2017
The project has been developed to enable the delivery of environmental water to the wetlands and forest of the Gunbower National Park. It will mimic a natural flood event of up to 50,000 megalitres per day across 500 hectares. This includes almost half of the permanent and temporary wetlands in the project area and 20 percent (250 hectares) of river red gum with flood dependent understorey. The package of works include regulator and creek enhancement works. The mid forest works will consist of a 100 megalitres per day pump station location on the Murray River and a number of regulators. This will enable the provision of water to approximately 500 hectares of Gunbower National Park, currently unable to be watered by any other infrastructure.

21
Environmental works
18
Guttrum and Benwell State Forests Floodplain Environmental Works Project
Vic May 2016 June 2017
The project will reinstate a more natural flooding regime for the Guttrum and Benwell Forests, addressing, in particular, the reduced frequency and duration of floods. The proposed works will water 1,200 hectares via pump stations, including semi-permanent wetlands and 82 percent of the river red gum forest with flood dependent understorey. The works will include two separate pump stations to deliver environmental water into Guttrum Forest, one pump station in Benwell Forest and containment works (regulators and levees) in both forests to contain water on the floodplain. The works have been designed to meet the environmental watering requirements of the ecological values by mimicking a 26,000 megalitres per day flood event in the River Murray for Guttrum Forest and a 24,000 megalitres per day flood event for Benwell Forest.
13
Hattah Lakes Environmental Flows TLM Project
Vic / NSW / SA
May 2016 Feb 2017
The project aims to deliver a watering regime that will achieve the ecological objectives for the Hattah Lakes Living Murray Icon Site. The on-ground works have been designed to increase the frequency, duration and extent of flooding across the lakes and surrounding floodplain. The package of works enables watering of 6,000 hectares and includes: • A new pumping station at Messenger’s Crossing • Sill lowering in Chalka Creek South • Four new regulators (Messenger’s, Oatey’s, Cantala, Kramen) and associated works • Refurbishment of an existing regulator (Little Hattah) • Three new stop banks or levees.
12
Hattah Lakes North Floodplain Management Project
Vic May 2016 May 2017
This project will complement TLM works at the Hattah Lakes Icon Site by enhancing flooding across higher floodplain terraces. The project will also increase the flexibility for environmental water management across the lakes. The proposed works will water an additional 1,130 hectares of floodplain through the construction of two new regulators, a causeway across an existing track and 1.7 kilometres of levees along track alignments.
34
Improved Flow Management Works at the Murrumbidgee River - Yanco Creek Offtake
NSW May 2016 June 2017
This proposal aims to return the Yanco Creek system closer to a pre-development wetting/drying regime, while improving infrastructure that supplies irrigation and stock and domestic water. Upgrades to Yanco Weir on the Murrumbidgee River would result in more control over flows through the proposed Yanco Creek regulator. This may provide the Commonwealth Environmental Water Holder and the Office of Environment and Heritage with more flexibility in managing flows within the Murrumbidgee River system.
22
Environmental works
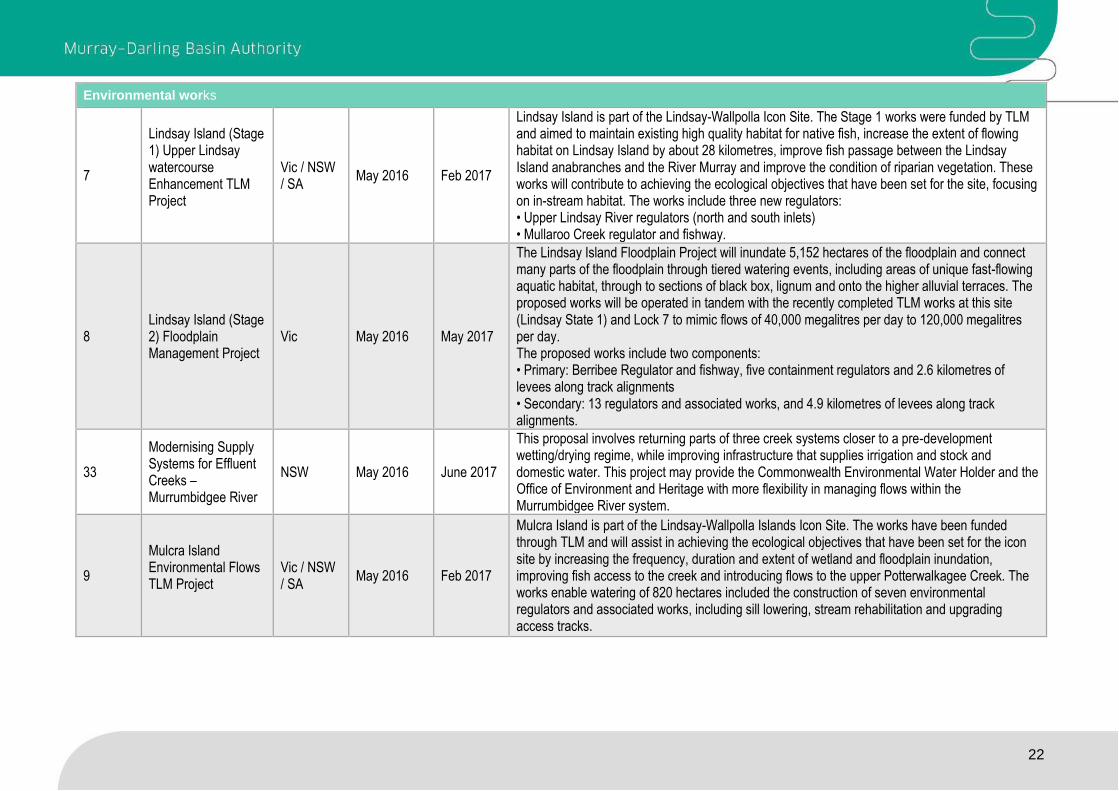
7
Lindsay Island (Stage 1) Upper Lindsay watercourse Enhancement TLM Project
Vic / NSW / SA
May 2016 Feb 2017
Lindsay Island is part of the Lindsay-Wallpolla Icon Site. The Stage 1 works were funded by TLM and aimed to maintain existing high quality habitat for native fish, increase the extent of flowing habitat on Lindsay Island by about 28 kilometres, improve fish passage between the Lindsay Island anabranches and the River Murray and improve the condition of riparian vegetation. These works will contribute to achieving the ecological objectives that have been set for the site, focusing on in-stream habitat. The works include three new regulators: • Upper Lindsay River regulators (north and south inlets) • Mullaroo Creek regulator and fishway.
8 Lindsay Island (Stage 2) Floodplain Management Project
Vic May 2016 May 2017
The Lindsay Island Floodplain Project will inundate 5,152 hectares of the floodplain and connect many parts of the floodplain through tiered watering events, including areas of unique fast-flowing aquatic habitat, through to sections of black box, lignum and onto the higher alluvial terraces. The proposed works will be operated in tandem with the recently completed TLM works at this site (Lindsay State 1) and Lock 7 to mimic flows of 40,000 megalitres per day to 120,000 megalitres per day. The proposed works include two components: • Primary: Berribee Regulator and fishway, five containment regulators and 2.6 kilometres of levees along track alignments • Secondary: 13 regulators and associated works, and 4.9 kilometres of levees along track alignments.
33
Modernising Supply Systems for Effluent Creeks – Murrumbidgee River
NSW May 2016 June 2017
This proposal involves returning parts of three creek systems closer to a pre-development wetting/drying regime, while improving infrastructure that supplies irrigation and stock and domestic water. This project may provide the Commonwealth Environmental Water Holder and the Office of Environment and Heritage with more flexibility in managing flows within the Murrumbidgee River system.
9
Mulcra Island Environmental Flows TLM Project
Vic / NSW / SA
May 2016 Feb 2017
Mulcra Island is part of the Lindsay-Wallpolla Islands Icon Site. The works have been funded through TLM and will assist in achieving the ecological objectives that have been set for the icon site by increasing the frequency, duration and extent of wetland and floodplain inundation, improving fish access to the creek and introducing flows to the upper Potterwalkagee Creek. The works enable watering of 820 hectares included the construction of seven environmental regulators and associated works, including sill lowering, stream rehabilitation and upgrading access tracks.

23
Environmental works
19
Murray and Murrumbidgee Valley National Parks SDL Adjustment Supply Measure
NSW May 2016 June 2017 and Aug 2017
The proposal is for a suite of works across the national park estate in the Murray and Murrumbidgee valley. It aims to deliver more targeted environmental watering than achieved under benchmark conditions of development and benefit public land areas exceeding 70,000 hectares .Benefits identified include improved native fish outcomes and a reduction in the frequency and level of flooding on private land holdings and blackwater events. For its modelling assessment, the project is amended to model the Murrumbidgee component only and endorsed by Basin Officials Committee endorsement on Aug 2017.
32
Nimmie Caira Infrastructure Modifications Proposal
NSW May 2016 June 2017
Reconfigure water delivery infrastructure to more effectively deliver environmental flows to the Nimmie-Caira floodplain and other parts of the Lowbidgee. This project, along with the Murray and Murrumbidgee Valley National Parks SDL adjustment supply measure, has the potential to supply significant additional environmental benefit to the area.
17 Nyah Floodplain Management Project
Vic May 2016 May 2017
The proposed works will water almost 500 hectares of floodplain within Nyah Forest, replicating River Murray flows of up to 25,000 megalitres per day. The works will influence over 53 percent of the total forest area and almost all of the flood dependent communities. The works consist of four regulators, three on the downstream end of Parnee Malloo Creek and one on the upstream end. Additional works to contain water within the forest include 1.7 kilometres of low level track raising, forming a levee at the downstream end of the forest.
4 Riverine Recovery Project
SA May 2016 June 2017
This project aims to return a number of wetlands to a more natural wetting/drying regime which results in evaporative savings. These savings are assigned to the Commonwealth Government as a South Australian Class 9 water access entitlement. This entitlement can be used for environmental purposes either within or upstream of the South Australian/Victorian border.
3
South Australian Riverland Floodplain Integrated Infrastructure Program (SARFIIP)
SA May 2016 June 2017
The project aims to create an integrated and resilient floodplain along the South Australian River Murray, between the border and Lock 1, through a package of works and measures that enable floodplain inundation and freshening of groundwater lenses with particular focus on the Pike and Katarapko floodplains. Environmental works on the Pike and Katarapko floodplains will optimise the frequency, duration and extent of inundation events to protect and restore these floodplain ecosystems and contribute to Basin Plan environmental outcomes. Salinity management measures will complement the floodplain inundation works to manage ecological risk, enhance
24
Environmental works
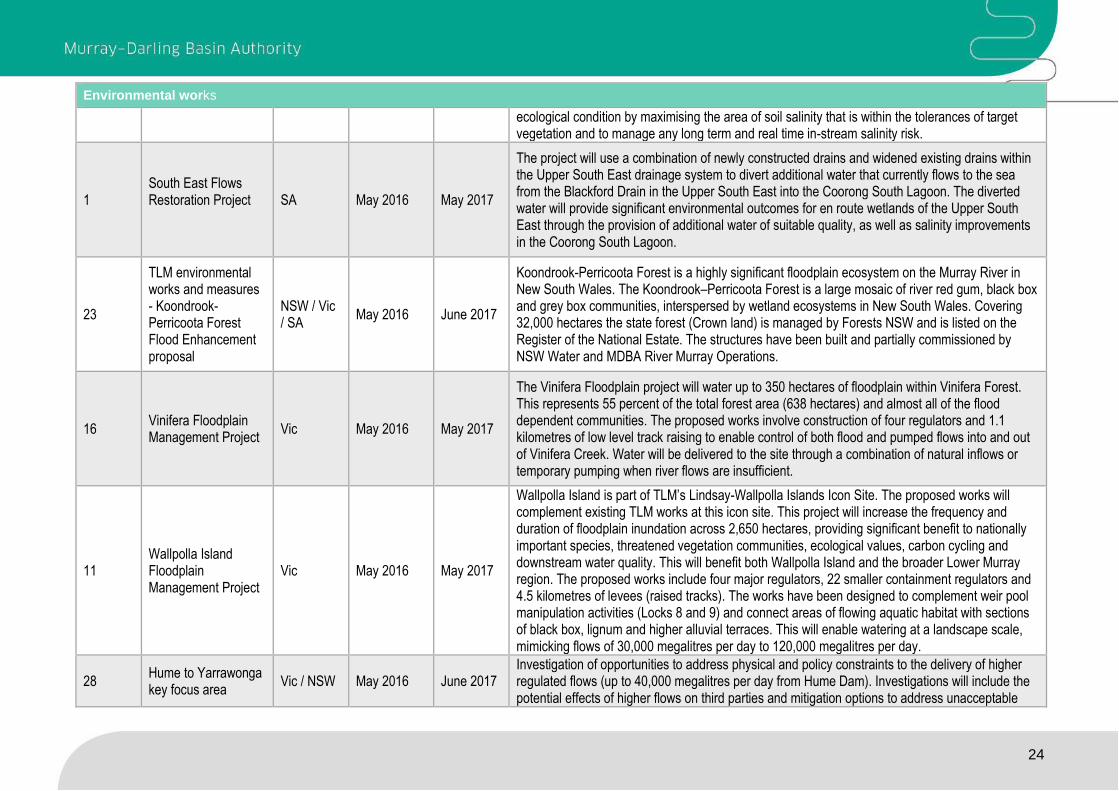
ecological condition by maximising the area of soil salinity that is within the tolerances of target vegetation and to manage any long term and real time in-stream salinity risk.
1 South East Flows Restoration Project
SA May 2016 May 2017
The project will use a combination of newly constructed drains and widened existing drains within the Upper South East drainage system to divert additional water that currently flows to the sea from the Blackford Drain in the Upper South East into the Coorong South Lagoon. The diverted water will provide significant environmental outcomes for en route wetlands of the Upper South East through the provision of additional water of suitable quality, as well as salinity improvements in the Coorong South Lagoon.
23
TLM environmental works and measures - Koondrook-Perricoota Forest Flood Enhancement proposal
NSW / Vic / SA
May 2016 June 2017
Koondrook-Perricoota Forest is a highly significant floodplain ecosystem on the Murray River in New South Wales. The Koondrook–Perricoota Forest is a large mosaic of river red gum, black box and grey box communities, interspersed by wetland ecosystems in New South Wales. Covering 32,000 hectares the state forest (Crown land) is managed by Forests NSW and is listed on the Register of the National Estate. The structures have been built and partially commissioned by NSW Water and MDBA River Murray Operations.
16 Vinifera Floodplain Management Project
Vic May 2016 May 2017
The Vinifera Floodplain project will water up to 350 hectares of floodplain within Vinifera Forest. This represents 55 percent of the total forest area (638 hectares) and almost all of the flood dependent communities. The proposed works involve construction of four regulators and 1.1 kilometres of low level track raising to enable control of both flood and pumped flows into and out of Vinifera Creek. Water will be delivered to the site through a combination of natural inflows or temporary pumping when river flows are insufficient.
11 Wallpolla Island Floodplain Management Project
Vic May 2016 May 2017
Wallpolla Island is part of TLM’s Lindsay-Wallpolla Islands Icon Site. The proposed works will complement existing TLM works at this icon site. This project will increase the frequency and duration of floodplain inundation across 2,650 hectares, providing significant benefit to nationally important species, threatened vegetation communities, ecological values, carbon cycling and downstream water quality. This will benefit both Wallpolla Island and the broader Lower Murray region. The proposed works include four major regulators, 22 smaller containment regulators and 4.5 kilometres of levees (raised tracks). The works have been designed to complement weir pool manipulation activities (Locks 8 and 9) and connect areas of flowing aquatic habitat with sections of black box, lignum and higher alluvial terraces. This will enable watering at a landscape scale, mimicking flows of 30,000 megalitres per day to 120,000 megalitres per day.
28 Hume to Yarrawonga key focus area
Vic / NSW May 2016 June 2017 Investigation of opportunities to address physical and policy constraints to the delivery of higher regulated flows (up to 40,000 megalitres per day from Hume Dam). Investigations will include the potential effects of higher flows on third parties and mitigation options to address unacceptable
25
Environmental works
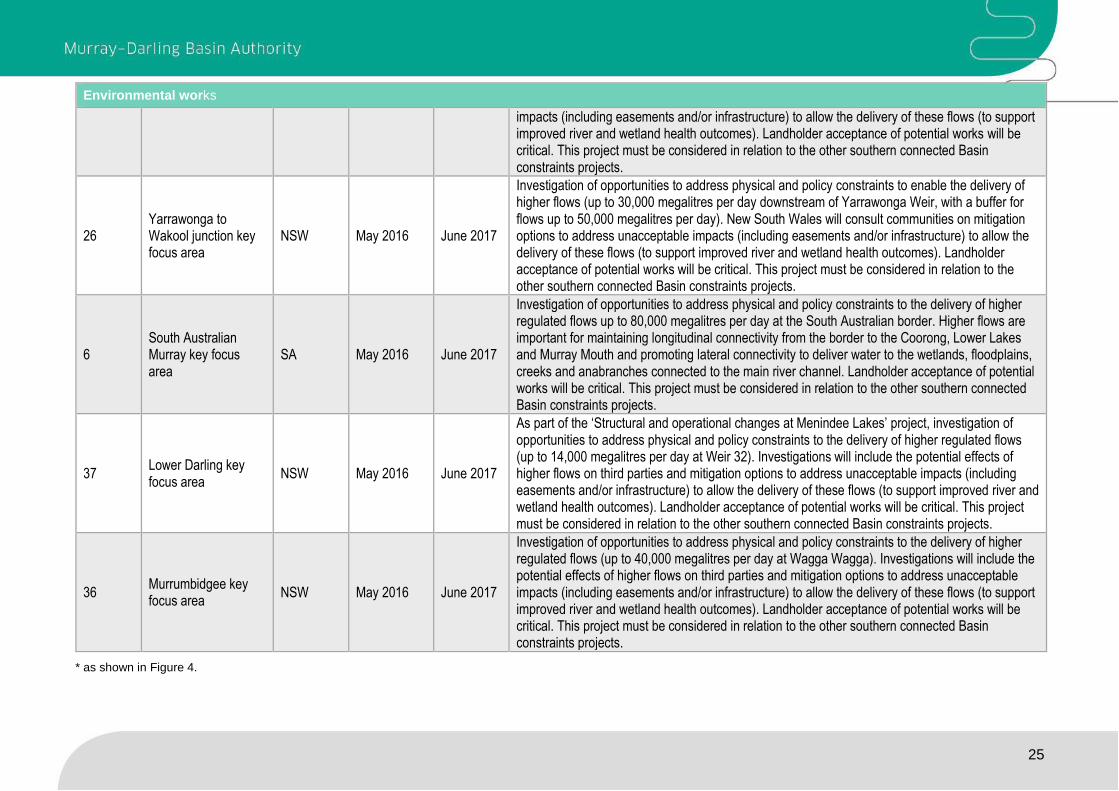
impacts (including easements and/or infrastructure) to allow the delivery of these flows (to support improved river and wetland health outcomes). Landholder acceptance of potential works will be critical. This project must be considered in relation to the other southern connected Basin constraints projects.
26 Yarrawonga to Wakool junction key focus area
NSW May 2016 June 2017
Investigation of opportunities to address physical and policy constraints to enable the delivery of higher flows (up to 30,000 megalitres per day downstream of Yarrawonga Weir, with a buffer for flows up to 50,000 megalitres per day). New South Wales will consult communities on mitigation options to address unacceptable impacts (including easements and/or infrastructure) to allow the delivery of these flows (to support improved river and wetland health outcomes). Landholder acceptance of potential works will be critical. This project must be considered in relation to the other southern connected Basin constraints projects.
6 South Australian Murray key focus area
SA May 2016 June 2017
Investigation of opportunities to address physical and policy constraints to the delivery of higher regulated flows up to 80,000 megalitres per day at the South Australian border. Higher flows are important for maintaining longitudinal connectivity from the border to the Coorong, Lower Lakes and Murray Mouth and promoting lateral connectivity to deliver water to the wetlands, floodplains, creeks and anabranches connected to the main river channel. Landholder acceptance of potential works will be critical. This project must be considered in relation to the other southern connected Basin constraints projects.
37 Lower Darling key focus area
NSW May 2016 June 2017
As part of the ‘Structural and operational changes at Menindee Lakes’ project, investigation of opportunities to address physical and policy constraints to the delivery of higher regulated flows (up to 14,000 megalitres per day at Weir 32). Investigations will include the potential effects of higher flows on third parties and mitigation options to address unacceptable impacts (including easements and/or infrastructure) to allow the delivery of these flows (to support improved river and wetland health outcomes). Landholder acceptance of potential works will be critical. This project must be considered in relation to the other southern connected Basin constraints projects.
36 Murrumbidgee key focus area
NSW May 2016 June 2017
Investigation of opportunities to address physical and policy constraints to the delivery of higher regulated flows (up to 40,000 megalitres per day at Wagga Wagga). Investigations will include the potential effects of higher flows on third parties and mitigation options to address unacceptable impacts (including easements and/or infrastructure) to allow the delivery of these flows (to support improved river and wetland health outcomes). Landholder acceptance of potential works will be critical. This project must be considered in relation to the other southern connected Basin constraints projects.
* as shown in Figure 4.

Page 26
Model representation of notified supply measures
During the submission of supply measures, the MDBA in consultation with proponents has
developed further information required to sufficiently represent the measures in the modelling
framework to make the model assessment fit for purpose. The additional modelling information has
been included in the notifications that were endorsed by Basin Officials Committee.
For the Murrumbidgee projects, NSW has updated the Murrumbidgee IQQM model in consultation
with the MDBA to represent the supply measures. The other supply measure projects are directly
linked to the Murray region. The MDBA has worked with the proponents to implement these supply
measures in the model of the Murray and Lower Darling system. There are no supply measures
identified in the Goulburn system. Therefore no changes to the Goulburn model is required except
reducing environmental entitlements to reflect SDL adjustment contribution.
In general, the changes to the models required to represent the supply measures were presented
to the SDLA TWG and extensively reviewed prior to inclusion into the MDBA’s modelling framework
for assessing their SDL contribution. Details of the model changes have been documented and
recorded on the Notification Imperfection Registers (NIR). All of the changes to models were
endorsed by Basin Officials Committee (June 2017). The agreed approach and changes to
implement each measure are presented at 0 and Appendix B.
For quality assurance, each measure included in the Murray and Lower Darling systems is turned
on in isolation, and the model results compared to the benchmark results. This process ensures
that the model performs as expected when a specific measure is included, and provides a level of
quality assurance and fitness to assess SDL adjustment contribution.

Page 27
Modelling assessment
As discussed at Chapter 2, modelling assessment of supply contribution is derived by comparison
of the impacts relative to the benchmark outcomes. An iterative approach is used to find the
maximum supply contribution that passes the ecological, hydrological and reliability metrics. An
initial supply contribution is trialled. This supply contribution is apportioned between the SDL units
and entitlements are adjusted accordingly. The environmental demand is then derived and the
hydrological models of the Murrumbidgee, Murray and Goulburn rivers are run. Diversions are
compared to target levels and any impacts on reliability of water supply and ecological outcomes
are assessed relative to the benchmark conditions. If all of the ecological, hydrological and reliability
metrics pass, then a larger supply contribution is tested. This process is repeated until the maximum
supply contribution is found, while equivalent environmental outcomes, limits of change and no
detrimental impacts on reliability are achieved (Figure 5).
7.1 Benchmark conditions
The benchmark model is documented separately (MDBA, 2017a).
It is available at www.mdba.gov.au/sdlam-reports.
7.2 Target diversions and adjust entitlements
As the SDL supply contribution is increased, the amount of held environmental water is decreased
and the amount of irrigation entitlement is increased. To reflect this, the 2750 GL/yr environmental
water under the benchmark model is reduced by the SDL supply contribution, and the irrigation
entitlement is increased by an equivalent amount. The apportionment of the SDL supply
contribution between SDL units is based on the following principles which were noted at
Basin Officials Committee 48:
apportion the supply contribution in a way that aims to meet the residual water recovery
gap in each state, and minimises under or over recovery outcomes at the resource unit
and state levels
if additional offset is available above the total southern connected Basin water recovery
gap, apportion the remaining amount in a way that optimises the SDL adjustment
outcome.

Page 28
Figure 5. Iterative approach for calculation supply contribution

Page 29
7.3 Set environmental demand
The environmental demand time series for each SFI site are derived programmatically as a pre-
processing step and as a way of representing the Enhanced Environmental Water Delivery (EEWD)
method. The full logic for how the demand is derived is provided in Appendix A.4. As part of model
iteration to maximise the supply contribution, parameters describing the frequency of delivering a
SFI are adjusted to ensure that the limits of change are passed. A top-down approach is taken to
adjust the frequency that SFI’s are targeted where the most upstream site is dealt with before
moving on to a downstream site. The top-down approach is consistent to a concept of following
natural cues where environmental watering is initiated to boost or extend a natural flow event. Then
additional environmental demands are added at downstream sites only when necessary to meet
the LoC requirements. This approach has been adopted to closely reflect the multi-site watering
that has been trialled on ground.
Figure 6 Overall modelling approach to find maximum SDL contribution
As identified in Figure 6, there are cases that require some adjustments to delivering managed
events to achieve the LoC frequency target at each SFI. Figure 7 presents the principles of
increasing or decreasing attempts to deliver environmental events. In this figure, it is assumed that
there are two SFIs at a site and SFI2 has a higher flow threshold to deliver.

Page 30
Figure 7 Algorithm to increase/decrease environmental demands to meet SFIs
7.3.1 CLLMM demand
Once all of the LoC have been met at the SFI sites, an additional demand is added at the SA border
and at Balranald on the Murrumbidgee to meet any outstanding CLLMM indicators. These demands
are only targeted during very dry conditions (Appendix A.4).

Page 31
Conclusion
In order to assess the notified measures by Basin Officials Committee, MDBA has extended the
modelling framework that was used to develop the Basin Plan in a way that Chapter 7 and Schedule
6 of the Basin Plan can be followed consistently and systematically. Inclusion of the measures into
the modelling framework has been extensively reviewed by the states. Approaches used to model
the measures with additional modelling information required to represent the measures are based
on endorsement by Basin Officials Committee in June 2017. Therefore it is concluded that:
The modelling framework has been established and operated in accordance with
the Default Method set out in Schedule 6 of the Basin Plan to identify the
maximum supply contribution possible and
All SDL supply measures are incorporated into the modelling framework following
the final notifications and endorsement by Basin Officials Committee.
MDBA has used an existing sub-revision system so that copies of all relevant data files for the benchmark and adjustment models, together with all components of the modelling framework, are preserved to allow the models to be operated in the future by the MDBA or the jurisdictions as the need arises.
Final determination of SDL adjustment volume with model outcomes is presented in MDBA (2017b,
in prep).

Page 32
References
Bewsher (2016) Review of the Hydrological Modelling Frameworks used to inform Potential Basin
Plan Amendments, Murray-Darling Basin Authority, Canberra, November 2016.
Brookes J, Hillman T, Jones G, Stewardson M (2014) SDL Adjustment Ecological Elements
Method Development Report Review of Final Project Report by the Independent Review Panel.
Murray-Darling Basin Authority, Canberra, March 2014.
https://www.mdba.gov.au/publications/independent-reports/sdl-adjustment-ecological-
elements-method-development-report-review
Hughes D. (2010) Quality assurance of the integrated river system modelling framework. Report
prepared by CSIRO to Murray-Darling Basin Authority
MDBA (2012a) Assessing environmental water requirements for the Basin’s rivers, Murray-
Darling Basin Authority website, https://www.mdba.gov.au/publications/mdba-
reports/assessing-environmental-water-requirements-basins-rivers
MDBA (2012b) Hydrologic modelling to inform the proposed Basin Plan - methods and results,
MDBA publication No: 17/12, Murray-Darling Basin Authority, Canberra, February 2012.
https://www.mdba.gov.au/publications/mdba-reports/hydrologic-modelling-inform-
proposed-basin-plan-methods-results
MDBA (2017a) Benchmark conditions of development for assessment of the SDL supply
contribution, MDBA publication No: 36/17, Murray-Darling Basin Authority, Canberra, October
2017.
MDBA (2017b) Sustainable Diversion Limit Adjustment Mechanism: Determination Report. MDBA
publication No: 37/17, Murray-Darling Basin Authority, Canberra, October 2017.
Overton IC, Grigg N, Freebairn A, Roberts J, Reid JRW, Bond NR, Barma D, Pollino CA and
Stanford D. (2015) SDL adjustment Ecological Elements Method Trial Implementation Review.
Report prepared by CSIRO for the Murray-Darling Basin Authority
Podger, GM, Barma, D, Neal, B, Austin, K and Murrihy, E. (2010) River system modelling for the
Basin Plan assessment of fitness for purpose. Report prepared by CSIRO to Murray-Darling
Basin Authority
Yang A. (2010) The integrated river system modelling framework. Report prepared by CSIRO to
Murray-Darling Basin Authority.

Page 33
Appendix A– Operational rule changes and system enhancements
Context and Status of Modelling Assumptions
This appendix sets out the key assumptions used by the MDBA to evaluate the supply projects
nominated by Basin state governments.
These assumptions have been used by the MDBA to identify the volume of water that can be
delivered more efficiently through the projects meaning that volume of water could be made
available for other uses.
The projects are assessed as a package. The assessment framework includes components such
as computer (hydrological) models, hydrological indicator sites, ecological elements and ecological
equivalence. The assessment framework is a decision support tool to check whether equivalent
environmental outcomes can be achieved based on the package of nominated projects.
The assumptions used for modelling do not represent a commitment to a particular project design
or operating rule. The next step is for Basin state governments to further design the projects
involving a wide range of people including communities, industries and experts.
The assumptions establish some parameters to guide further design and implementation
approaches. It is anticipated that some projects and their scope will be significantly further shaped
whilst others will adopt the assumptions outlined in the appendix. The following will help to further
inform project design:
ongoing community and stakeholder consultation on the objectives, detailed design and
operation of the project
further technical advice and assessment
compliance with regulations including environmental impact assessment and cultural and
heritage legislation
advice and refinement in consultation with river operators and governments including
negotiation of changes to river operating rules.
To address the need to balance an upfront assessment of the contribution of notified projects to
the SDL Adjustment Mechanism with the need to respond to changes during project
implementation, Governments have agreed to take an adaptive approach to project implementation
including ongoing community consultation on key projects. Where projects are significantly altered
States will amend the project notifications. The potential impacts on the SDL offset will be carefully
considered. Across the full portfolio of projects governments will seek to ensure an equivalent SDL
outcome is delivered.
This approach provides governments and communities’ flexibility to strengthen the SDL
Adjustment Mechanism supply projects. The MDBA expects that most projects will change in some
way during implementation. However, as a package environmental outcomes equivalent to 605 GL
must be achieved. The MDBA’s assessment provides Basin governments confidence that the
package as a whole is achievable and practical.

Page 34
The MDBA will monitor the integrity of the SDL Adjustment Mechanism in delivering the Basin
Plan’s environmental outcomes by regularly assessing and reporting progress during
implementation from 2018 to 2024.
A.1 2011 Snowy Water Licence Schedule 4 amendments to River Murray Increased
Flows (RMIF) call out provisions
Background information
Following corporatisation of the Snowy Scheme in 2002 it was recognised that flow regulation and consumption has contributed to environmental degradation in the Snowy River. The three Snowy Scheme shareholder governments (NSW, Victoria and the Commonwealth) agreed to address environmental issues in the Snowy and Murray Rivers through the establishment and funding of the Joint Government Enterprise (trading as Water for Rivers) to recover water through water efficiency projects and water entitlement purchases, and through the commissioning of water savings projects in the Murrumbidgee River system, the Goulburn River system and diversions from the River Murray system. The Licence requires the nominal or base RAR (1,062 GL/year) to be adjusted each year to account for water recovery in the western rivers, with approximately two thirds of the reduction amount to be released instead to the Snowy River for environmental purposes, known as Snowy River Increased Flows (SRIF). The remaining one third of water recovery (up to 70 GL each year) is to be provided to the River Murray for environmental purposes, known as River Murray Increased Flows (RMIF).
Proponent NSW and Victoria
Resource units affected by the measure All surface water resource units in the southern Basin
Benchmark conditions
The Licence provided for RMIF to be released at the discretion of Snowy Hydro Limited, as above target water. When discretionary releases of Above Target Water were made by Snowy Hydro Ltd, states provided an opportunity to environmental water managers for the released above target water to then be accounted as RMIF.
Proposed changes
After the extended drought, variations to the Snowy Water Licence were negotiated in 2010 with Snowy Hydro Limited by NSW, on behalf of the shareholder governments. The variations to the Licence that were formalised in October 2011 cover five key areas:
1. The removal of the requirement to release, as soon as the inflows to the Snowy Scheme allow, any accumulated Dry Inflow Sequence Volume (DISV).
2. The establishment of a “Drought Account” of 225 GL for the Murray Valley. The water in these accounts can be used if inflows again reach critically low levels. The accounts are credited with water when a recovery occurs following a period when a dry inflow sequence volume is triggered (and at other times at the discretion of the NSW DPI Water).
3. An option each year to call out RMIF kept within the Snowy Scheme for environmental flows into the Murray Valley.
4. An option each year for Snowy Hydro Limited to release water in excess of the Required Annual Release (also known as “Flexibility Release” or “Flex”) and have the additional release treated as an early delivery of the next year’s required annual release.
5. A requirement for Snowy Hydro Limited to release some above target water if any flexibility release results in additional release or spill of water from downstream storages in the following water year and does not contribute to consumptive use. This is also known as “wet sequence protection”.
Modelled representation of the proposed changes

Page 35
In consultation with the Basin states, the Murray model has been revised for the SDL assessment in order to reflect the licence changes (MDBA, 2016a). In addition, there was a separate modelling study (MDBA, 2016b) to review the timing and volume of RMIF callouts from the Snowy scheme. The RMIF callout strategy agreed for the final package of measures is based on a forecast of when RMIF is best used if called out which is determined as minimum of total RMIF callable from Snowy and a threshold – (Account balance – environmental water need) where:
threshold is 500 GL
Murray account balance is environmental account balance at the beginning of October
environmental water need is forecast water required for environment based on a serial correlation built in the Monthly Simulation Model.
References:
MDBA (2016a). Modelling changes to Snowy Water Licence in the Monthly Simulation Model,
Murray–Darling Basin Authority Technical Report 2016/04.
MDBA (2016b). RMIF callout from Snowy, Murray–Darling Basin Authority Technical Report
2016/24.

Page 36
A.2 Operating rule change to the use of the Barmah–Millewa Forest Environmental
Water Allocation (BMF EWA)
Background information
The Barmah–Millewa Forest environmental water account (BMF EWA) is available in the Murray and the rules are designed to achieve flow targets by piggy-backing on natural events and regulated releases for irrigation. Recent strong growth in the volume of environmental water entitlements means that there are now larger, more frequent water allocations and flows down the Murray to meet environmental watering needs, and that many of these flows now occur earlier in the season. This rule change, varying the existing rules associated with the environmental account to water the Barmah–Millewa Forest, is proposed to allow the use of other environmental entitlements to achieve equivalent environmental outcomes with less environmental water use.
Proponent Victoria and NSW
Resource units affected by the measure All surface water resource units in the southern Basin
Benchmark conditions
The Benchmark triggers the BMF EWA releases depending on conditions below:
1. Releases are triggered in October, if four years have passed with no release or without a flow downstream of Yarrawonga of at least 500 GL/month from September to November and 400 GL/month in December.
2. Releases are triggered in October if the September flow is > 500 GL/month and the usable component of the account is ≥ 400 GL.
3. Releases are triggered in November if the October flow is > 500 GL/month and the usable component of the account is ≥ 400 GL.
4. Releases are triggered in December if the flow is > 500 GL/month for both October and November.
Proposed changes
The proposed changes altering the release triggers are:
1. Do not initiate or continue release from BMF EWA if a continuous four monthly flood has already occurred
2. Trigger the December releases when the October and November triggers are met and a four month flood has not occurred.
Modelled representation of the proposed changes
In developing the business case, the Victorian government has modified the Murray benchmark model to incorporate the proposed changes. These model changes have been incorporated into the MDBA’s modelling framework for assessing the measure.

Page 37
A.3 Computer Aided River Management (CARM) system for the Murrumbidgee River
Background information
The Computer Aided River Management (CARM) is an expert decision support system (DSS) specifically created for river operations. Its primary role is to integrate both real time and expert modelled flow scenarios information using a computer based hydrodynamic modelling system, to enhance the tools available to river operators, to make better informed decisions on daily releases from dams and weirs. CARM will improve:
tributary forecasting and utilisation
rainfall rejection forecasting
management of Yanco Creek off-take Inflows.
Proponent NSW
Benchmark conditions
In order to be able to simulate a number of Sustainable Diversion Limit adjustment (SDLA) proposals it was necessary to increase the model resolution at various points in the Murrumbidgee. It was agreed with MDBA that NSW would build a single common SDLA benchmark model for the Murrumbidgee so that the proposals can be assessed from a common starting point (DHI, 2015a). Currently river operators use a spreadsheet-based system (CAIRO), into which they add anticipated demands (water orders), forecast river transmission losses, forecast tributary inflows and flow targets. The complexity of river operations often results in excess water being released from major dams (Burrinjuck and Blowering) which is surplus to the actual water demands in the Murrumbidgee catchment and end of system targets. NSW has adjusted the Murrumbidgee benchmark to reflect the current river operation practices (DHI, 2015a).
Proposed changes
The proposed changes are documented well by NSW (DHI, 2015b). In summary, the changes are:
The tributary utilisation factors in the model are revised to reflect greater (though not perfect) forecasting accuracy, particularly on the rising limb of hydrographs.
A pair of nodes (node type 9.0 and 9.4) are added in the model on the river just upstream of the Murrumbidgee Irrigation (MI) district offtake, to reduce future orders coming from MI, based on the forecast rainfall for the coming four days.
Yanco orders from November to January are scaled by 20% instead of 25% to reflect reduced uncertainty in the system.
Modelled representation of the proposed changes
All Murrumbidgee measures were incorporated into the adjusted benchmark model (DHI, 2015b and DHI, 2016) in consultation with MDBA. MDBA has included the updated Murrumbidgee model to the modelling framework for assessing SDL adjustment contribution as a part of the final package. MDBA has assessed benefits from the CARM and effluent creek modernisation projects to determine the volume of environmental entitlements and IVT account (MDBA, 2017).
References:
DHI (2015a). Murrumbidgee SDLA – update of Benchmark model.
DHI (2015b). Murrumbidgee CARM Sustainable Diversion Limit Adjustment Modelling.
DHI (2016). Murrumbidgee SDLA – Project models.
MDBA (2017). Assessment of the CARM and modernisation projects for entitlement creation.

Page 38
A.4 Enhanced Environmental Water Delivery (EEWD) project
Background information
This project is intended to achieve enhanced environmental water delivery by allowing regulated environmental water to be released from storages to coincide with unregulated flows caused by rainfall. This is a structured approach for initiating managed environmental water releases from storages to increase the peak and/or duration of a flow event, and so reinstate some of the freshes, inner-floodplain flows, connectivity and end of system flows that have been intercepted and stored by dams. This type of managed watering would mainly occur in moderate to wet years to achieve environmental objectives, but could occur in any year if the hydrological conditions exist. This will enhance the range of environmental outcomes possible for environmental water holders from use of their portfolio.
Proponent NSW, Victoria and SA
Benchmark conditions
In the Benchmark model, environmental watering behaviours are simulated using the environmental event selection tool (EEST). The EEST is designed to reinstate environmental flow events that were developed as part of the Basin Plan through the Environmentally Sustainable Level of Take (ESLT) process (MDBA, 2011). The EEST method develops environmental demands at sites to meet the frequency targets developed by the ESLT process.
Proposed changes
The proposal seeks equivalent or better environmental outcomes with less water through seeking policy and operational improvements in environmental water delivery in three key areas:
Aligning the release of held environmental water with unregulated flows to shape the peak and/or duration of a flow event, in order to create a stronger biological stimulus in synch with natural climate signals.
Making efficient use of channel capacity through the implementation of the constraints management strategy to allow increased managed flows up to higher regulated limits in order to improve in-channel, floodplain and wetland outcomes, and end-of-system outcomes.
Coordinating environmental water releases across tributaries of the southern Basin to maximise downstream and system-wide connectivity outcomes.
The project, including strategies to manage risk, will be implemented through co-ordinated collaborative actions across all relevant jurisdictions in South Australia, New South Wales and Victoria, and at a Commonwealth level. Any change to regulated flow limits, as a result of constraints projects must first require extensive consultation with all potentially affected landholders, industry and communities. The circumstances and the triggers under which constraints may be operated are yet to be fully negotiated. Proponents acknowledge the need for consultation with communities and the need to set out transparent governance arrangements.
Modelled representation of the proposed changes
In order to implement the proposed changes in the Murray and Murrumbidgee models, a pre-processing step has been developed to replace the EEST method. The new method generates environmental demands in a way to align regulated environmental release to piggy back or extend unregulated flow events with a strong coordinated water delivery between Murray and Murrumbidgee to maximise system-wide environmental outcomes. More detailed descriptions of the method are described below.
Reference:
MDBA (2011). The Proposed “environmentally sustainable level of take” for surface water of
Murray-Darling Basin: Method and outcomes, MDBA Publications no: 226/11.
Model representation of the enhanced environmental water delivery
Page 39
While the environmental demands for the Goulburn are modelled in the same way as the
benchmark, using the EEST, environmental flow demand for specific flow indicator sites on the
Murray and Murrumbidgee are developed using the new approach. The logic for calculating the
environmental demand is summarised in Figure 8. Each site has a pre-defined start and end date,
orders are prevented outside of these dates. If a site is active, each rule at the site is then checked
to see if they are active. If the rule is in progress, then it is continued until it is completed. If a rule
is active but not in progress, the antecedent conditions are checked to see if a new event should
be triggered (Figure 9). This involves the following checks:
The rule has not been yet delivered in current season.
The rule is in the target season.
There is sufficient time left in the target season to deliver the rule.
Storage inflows are in the target range for an event.
The specific parameters for each of the specific flow indicator sites implemented in the model are
listed in Table 9. The start and end date for each site define the target window for generating
environmental demands at the site. No demands are generated outside this target window. The
inflows to the storage are used to characterise how wet the season is based on an exceedance
probability. Wetter conditions (lower exceedance probability) will target higher flow rules, while drier
conditions (as indicated by high exceedance probability) will only trigger the low flow rules. The
gauge represents the reference site, or gauge, where without development flows are referenced
to trigger environmental demands. A constant value for the coefficient of efficiency is adopted for
each site (Table 9). A forecast window of seven days is adopted for the Murray and five days
adopted for the Murrumbidgee. The forecast represents how far into the future without
development flows can be analysed to determine if it is appropriate to trigger an environmental
demand.

Page 40
Figure 8: Method for calculating if a demand is generated at a site

Page 41
The Coorong, Lower Lakes and Murray Mouth demands are only targeted during very dry periods
on the Murray. Demands from both the Murrumbidgee and Murray will be attempted, based on
exceedance probability of inflows to Hume. As the indicators include a three-yearly rolling total
annual barrage flow, the exceedance probability of Hume inflows are assessed for the July to
December period at the end of December. If the inflows are drier than a threshold exceedance
probability, an additional order is generated over the summer and autumn period of the current
water year and the next to achieve three-yearly rolling total barrage flow target (Table 10). The
88% exceedance probability of Hume inflows is used as a threshold for Murrumbidgee to generate
an additional order at Balranald. No additional order is generated for the Murray during extremely
dry years (exceedance probability > 92%) so as to avoid triggering of special accounting and
potential impact on South Australian reliability.
Table 9 Parameters for each site
Barmah Gunbower Hattah Chowilla Narran Maude Balranald
Start Date 6.01 6.15 7.01 8.01 7.01 7.01 12.01
End Date 11.30 11.30 12.31 12.31 11.30 2.28 5.31
Storage Hume Hume Hume Hume Burrinjuck Burrinjuck Burrinjuck
Gauge Yarrawonga Torrumbarry Euston SA Flow Narrandera Maude Balranald
Max order 50,000 40,000 85,000 80,000 34,650 8,000 9,000
Coefficient of efficiency
0.7 0.7 0.7 0.7 1.1 0.8 1.0
Forecast days 7 7 7 7 5 5 5
Table 10: Parameters for Coorong, Lower Lakes and Murray Mouth demand
Balranald Chowilla
Start Date 1.01 1.01
End Date 6.30 6.30
Storage Hume Hume
Gauge Balranald SA flow
Max order 9,000 20,000
Coefficient of efficiency 0.75 1.0
Forecast days 0 0

Page 42
Figure 9: Logic for triggering a new flow event
At each site, there are a number of rules defining target flow rates. These rules are summarised in
the tables below for each of the sites. For each rule, a minimum and maximum exceedance
probably is defined. The minimum exceedance probability (xPPmin) sets the lower bound, or
wettest conditions, that this rule will be targeted under. The maximum exceedance probability
(xPPmax) defines the driest conditions the rule will be targeted under.

Page 43
Site - Barmah–Millewa Forest
Rule Description xPP min
xPP max
1 12,500 ML/d for a total duration of 70 days (with min duration of 7 consecutive days) between Jun & Nov
0% 5%
2 16,000 ML/d for a total duration of 98 days (with min duration of 7 consecutive days) between Jun & Nov
0% 17%
3 25,000 ML/d for a total duration of 42 days (with min duration of 7 consecutive days) between Jun & Nov
0% 15%
4 35,000 ML/d for a total duration of 30 days (with min duration of 7 consecutive days) between Jun & May
0% 23%
5 50,000 ML/d for a total duration of 21 days (with min duration of 7 consecutive days) between Jun & May
0% 2%
6 60,000 ML/d for a total duration of 14 days (with min duration of 7 consecutive days) between Jun & May
0% 0%
7 15,000 ML/d for a total duration of 150 days (with min duration of 7 consecutive days) between Jun & Dec
0% 23%
Site - Gunbower–Koondrook–Perricoota
Rule Description xPP min
xPP max
1 16,000 ML/d for a total duration of 90 days (with min duration of 7 consecutive days) between Jun & Nov
0% 54%
2 20,000 ML/d for a total duration of 60 days (with min duration of 7 consecutive days) between Jun & Nov
37% 63%
3 30,000 ML/d for a total duration of 60 days (with min duration of 7 consecutive days) between Jun & May
25% 37%
4 40,000 ML/d for a total duration of 60 days (with min duration of 7 consecutive days) between Jun & May
0% 25%
5 20,000 ML/d for a total duration of 150 days (with min duration of 7 consecutive days) between Jun & Dec
11% 33%
Site -Hattah–Kulkyne Lakes
Rule Description xPP min
xPP max
1 40,000 ML/d for a total duration of 60 days (with min duration of 7 consecutive days) between Jun & Dec
0% 26%
2 50,000 ML/d for a total duration of 60 days (with a min duration of 7 consecutive days) between Jun & Dec
0% 21%
3 70,000 ML/d for a total duration of 42 days (with min duration of 7 consecutive days) between Jun & Dec
0% 9%
4 85,000 ML/d for a total duration of 30 days (with min duration of 7 consecutive days) between Jun & May
0% 0%
5 120,000 ML/d for a total duration of 14 days (with min duration of 7 consecutive days) between Jun & May
0% 0%

Page 44
Site - Riverland Chowilla Floodplain
Rule Description xPP
min
xPP max
1 20,000 ML/d for 60 consecutive days between Aug & Dec 0% 72%
2 40,000 ML/d for a total duration of 30 days (with min duration of 7 consecutive days) between Jun & Dec
0% 33%
3 40,000 ML/d for a total duration of 90 days (with min duration of 7 consecutive days) between Jun & Dec
0% 5%
4 60,000 ML/d for a total duration of 60 days (with min duration of 7 consecutive days) between Jun & Dec
0% 21%
5 80,000 ML/d for a total duration of 30 days (with min duration of 7 consecutive days) between Jun & May
0% 20%
6 100,000 ML/d for a total duration of 21 days between Jun & May 0% 0%
7 125,000 ML/d for a total duration of 7 days between Jun & May 0% 0%
Site -Mid-Bidgee
Rule Description xPP
min
xPP max
1 26,850 ML/d for a total duration of 45 days (with min duration of 1 day) between Jul & Nov
0% 0%
2 26,850 ML/d for 5 consecutive days between Jun & Nov 0% 0%
3 34,650 ML/d for 5 consecutive days between Jun & Nov 0% 61%
4 44,000 ML/d for 3 consecutive days between Jun & Nov 0% 0%
5 63,250 ML/d for 3 consecutive days between Jun & Nov 0% 0%
Site – Low-Bidgee
Rule Description xPP
min
xPP max
1 Total volume of 175 GL (flow > 5,000 ML/d) between Jul & Sep 78% 84%
2 Total volume of 270 GL (flow > 5,000 ML/d) between Jul & Sep 75% 77%
3 Total volume of 400 GL (flow > 5,000 ML/d) between Jul & Oct 56% 75%
4 Total volume of 800 GL (flow > 5,000 ML/d) between Jul & Oct 29% 55%
5 Total volume of 1,700 GL (flow > 5,000 ML/d) between Jul & Nov 25% 28%
6 Total volume of 2,700 GL (flow > 5,000 ML/d) between May & Feb 13% 16%

Page 45
Freshes - Balranald
Rule Description xPP min xPP max
1 1,100 ML/d for 25 consecutive days between Dec & May 0% 95%
2 4,500 ML/d for 20 consecutive days between Oct & Dec 0% 53%
3 3,100 ML/d for 30 consecutive days between Oct & Mar 0% 42%
Coorong, Lower Lakes and Murray demand
Rule Description xPP min xPP max
1 Additional demand at SA border on Murray (minimum of 20,000 ML/d and without development flow) between January and June (current water year and next year)
89% 92%
2 Additional demand at Balranald on Murrumbidgee (minimum of 9,000 ML/d and without development flow) between January and June (current water year and next year)
88% 100%

Page 46
A.5 Flexible rates of fall in river levels downstream of Hume Dam – ‘the six inch rule’
Background information
Rule change to allow Hume releases to be reduced more quickly during the period of January to May. The additional flexibility improves Hume Dam operational efficiency.
Proponent Victoria and NSW
Resource units affected by the measure All surface water resource units in the southern Basin
Benchmark conditions
The current operating rule of maximum allowable fall in water level along the River Murray below Hume Dam. The rule is defined at two locations as stated below:
1. maximum eight inch (200 mm) per day at Heywoods 2. maximum six inch (150 mm) per day at Doctors Point.
Proposed changes
From January to May:
1. maximum rate of fall allowed is nine inch (225 mm) per day at Heywoods and Doctors Point
2. average rate of fall over four days retained at existing limit, as eight inch (200 mm) per day at Heywoods and six inch (150 mm) at Doctors Point.
The change would not apply to:
1. June to December and 2. during low flows when flow at Doctors Point is less than 12,000 ML/d.
Modelled representation of the proposed changes
In developing the business case, the Victoria government has modified the Murray benchmark model to incorporate the proposed changes. The model changes have been incorporated into the MDBA’s modelling framework for assessing SDL adjustment contribution as a part of the final package.

Page 47
A.6 Operating rule change to Hume Dam airspace management and pre-releases
Background information
The primary purpose of managing Hume Dam is to harvest and store water to meet users’ needs, however in recognition of the significant flood mitigation benefits that they can also offer, the objectives and outcomes for river operations in the River Murray System call for floods to be managed to achieve the following outcomes:
1. Firstly, protection of the security of River Murray operational assets 2. Secondly, maximising the water available at the end of the relevant flooding episode 3. Thirdly, subject to achieving the first two outcomes, limiting flood damage to downstream
communities and increasing benefits to the environment and public amenity by using unregulated water, for example, by prolonging wetland inundation or by supporting recreational activities.
Flood mitigation benefits to downstream communities are enhanced through a controlled filling process that ensures there is a high probability of just filling the storage before releases are required to meet downstream demands. This controlled filling process enables some airspace in the storage to be maintained to help mitigate flood flows that may occur during the filling process. With the growth in environmental watering, the proposed change to the operating rules is for consideration of forecast environmental demands to be included in the planning of target storage volumes and pre-releases.
Proponent Victoria and NSW
Resource units affected by the measure All surface water resource units in the southern Basin
Benchmark conditions
In determining air space target, the benchmark takes into account irrigation demands as required releases as below: Target storage volume = full supply storage volume – (forecast inflow – forecast irrigation releases)
Proposed changes
The change proposed takes in to account environmental requirements as below: Target storage volume = full supply storage volume – (forecast inflow – forecast irrigation releases – forecast environmental releases)
Modelled representation of the proposed changes
For implementing the proposed changes, environmental water requirements are estimated. MDBA (2017) describes this estimation in more detail. In summary, it uses a relationship between cumulative unregulated inflow to upper Murray and environmental water requirements to forecast average environmental release. The relationship may need to be revisited in consultation with the project proponents to reflect environmental watering behaviours assumed for the final package assessment.
Reference:
MDBA (2017). Hume Air Space Management due to future demand conditions: For assessing final
package of SDL supply measures, Murray–Darling Basin Authority Technical Report 24/2014,
Ver.2.

Page 48
A.7 Lower Murray NSW: Locks 8 and 9 weir pool manipulation
Description of works
The purpose of the proposed operational measure and package of works is to deliver benefits for native fish on a regional broader lower Murray scale. Weir pools can create unnatural inundation of connected wetlands when the river is held artificially high. Lowering the weir pool can be used to return wetlands to a more natural wetting/drying regime, while raising it can allow water to reach areas that would be difficult to water under most conditions. The strategy of raising and lowering the weirs should provide an environmental benefit compared to an artificially constant weir pool level. There are three components to the proposal:
Locks 8 and 9 weir pool manipulation: this component is an operating rule change to increase the variability of the weir pool height at both locks 8 and 9 within and between
seasons with the objective to promote a range of environmental outcomes and potentially make a small evaporative water saving.
Carrs, Capitts and Bunberoo Creeks system connectivity: this component involves environmental works to restoring high flows and hydro-dynamic diversity to creeks isolated by earlier works at lock 9, by providing regulators and fishways at existing fixed
weirs.
Frenchmans Creek fish passage: this component involves construction of a fish passage around the inlet regulator between Frenchmans Creek and Lake Victoria.
Proponent NSW
Resource units affected by the measure All surface water resource units in the southern Basin
Representation of the project in the MDBA modelling framework
The area of inundation associated with the operation of the lock 8 raising, lock 9 raising and Carrs, Capitts and Bunberoo Creeks works have been added to other necessarily concurrently
operated works measures (Mulcra and Wallpolla Island works) for scoring in the ecological elements method. As such the ecological elements scoring for these projects has been accounted for through the Mulcra and Wallpolla Island scores. The lock 8 & 9 raising areas were generated by hydrodynamic modelling undertaken by NSW and the Carrs, Capitts and Bunberoo Creeks area was generating by digitising a figure in the appendix of the phase two business case
provided by NSW.

Page 49
A.8 Structural and operational changes at Menindee Lakes
Description of works
This proposal includes several components – infrastructure works, reform of water management in the lower Darling River, changes to operating rules and increased regulated capacity along the lower Darling river. It aims to achieve significant evaporative water savings by:
allowing operation of Lake Menindee independently of Lake Cawndilla, and decommissioning Lake Cawndilla for the purposes of water storage in all but the wettest years
reducing high security irrigation and town water supply demands from the lakes through a combination of infrastructure works and reform of water management in the lower Darling River mechanisms
allowing faster drawdown of water in Lake Menindee, including access to residual water
by enlarging the outlet structure and constructing a drainage feeder channel in the bed of the lake
accommodating higher managed flows in the lower Darling through works which aim to: o limit breakouts onto the floodplain and into dry lakes and anabranches o protect private infrastructure from being impacted by higher flows, including
changed operational rules to complement the structural works.
Proponent NSW
Resource units affected by the measure All surface water resource units in the southern Basin
Representation of the project in the MDBA modelling framework
The Menindee system is already represented in the benchmark model. For sufficiently representing the proposal, some changes are implemented in the model including:
- representation of Morton–Boolka regulator to operate Lake Menindee independently to Lake Cawndilla
- enlarged release capacity up to 14,000 ML/d and drainage channel to outlet regulator - operation of anabranch offtake regulator to supply regulated flow when needed up to
14,000 ML/d and reduced high flow loss relationship when the regulator is closed - suppling Broken Hill township water need directly from Murray upstream of Lake Victoria - changes to shared management thresholds to allow for efficient use of storage
The volume of environmental entitlements that can be created without affecting other water users are assessed separately.

Page 50
Appendix B– Environmental works
B.1 Belsar–Yungera Floodplain management project
Description of works
The Belsar–Yungera Floodplain is located approximately 30 km upstream of the Euston weir, near Robinvale in north west Victoria (Figure 10). Through the construction of three main regulators with a series of smaller supporting regulators, track raising and a pipeline, this project is intended to deliver environmental outcomes up to 2,370 ha covering one third of the total site area. The proposed works can be operated flexibly to meet the water requirements of different vegetation communities, mimicking a broad range of River Murray flows up to 170,000 ML/d.
Proponent Victoria
Resource units affected by the measure All surface water resource units in the southern Basin
Representation of the project in the MDBA modelling framework
In preparing the business case for this project, Victoria has developed various supporting materials including a hydrodynamic model to assist designs of the proposed structures and their operating regimes. Based on the information provided by Victoria, MDBA has updated the Murray model and incorporated hydrologic characteristics of the project site including intended operations of the works. Key model data that is agreed and endorsed is presented below.
Figure 10: Proposed works and inundation extent of the Belsar-Yungera Floodplain project
There are four discrete wetlands modelled in the Murray model in order to adequately represent
the current and proposed hydrological regimes of the site due to operations of the works. The
modelled representation is depicted in Figure 11.
Area 1
Area 2
Area 3
Area 4

Page 51
Figure 11: Representation of the Belsar–Yungera Floodplain in the Murray model
Key information used in the Murray model is level-volume-area relationship for each wetland (Table
11) and flows to the site depending on river flow heights (Table 12).
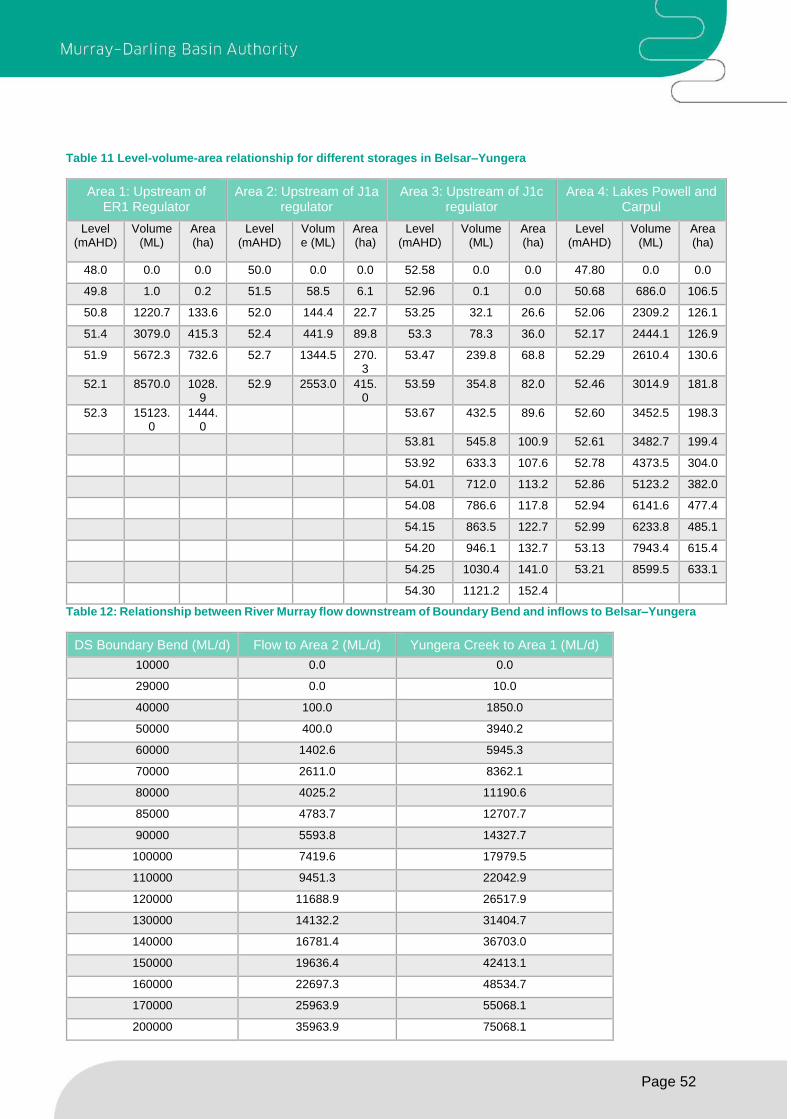
Page 52
Table 11 Level-volume-area relationship for different storages in Belsar–Yungera
Area 1: Upstream of ER1 Regulator
Area 2: Upstream of J1a regulator
Area 3: Upstream of J1c regulator
Area 4: Lakes Powell and Carpul
Level (mAHD)
Volume (ML)
Area (ha)
Level (mAHD)
Volume (ML)
Area (ha)
Level (mAHD)
Volume (ML)
Area (ha)
Level (mAHD)
Volume (ML)
Area (ha)
48.0 0.0 0.0 50.0 0.0 0.0 52.58 0.0 0.0 47.80 0.0 0.0
49.8 1.0 0.2 51.5 58.5 6.1 52.96 0.1 0.0 50.68 686.0 106.5
50.8 1220.7 133.6 52.0 144.4 22.7 53.25 32.1 26.6 52.06 2309.2 126.1
51.4 3079.0 415.3 52.4 441.9 89.8 53.3 78.3 36.0 52.17 2444.1 126.9
51.9 5672.3 732.6 52.7 1344.5 270.3
53.47 239.8 68.8 52.29 2610.4 130.6
52.1 8570.0 1028.9
52.9 2553.0 415.0
53.59 354.8 82.0 52.46 3014.9 181.8
52.3 15123.0
1444.0
53.67 432.5 89.6 52.60 3452.5 198.3
53.81 545.8 100.9 52.61 3482.7 199.4
53.92 633.3 107.6 52.78 4373.5 304.0
54.01 712.0 113.2 52.86 5123.2 382.0
54.08 786.6 117.8 52.94 6141.6 477.4
54.15 863.5 122.7 52.99 6233.8 485.1
54.20 946.1 132.7 53.13 7943.4 615.4
54.25 1030.4 141.0 53.21 8599.5 633.1
54.30 1121.2 152.4
Table 12: Relationship between River Murray flow downstream of Boundary Bend and inflows to Belsar–Yungera
DS Boundary Bend (ML/d) Flow to Area 2 (ML/d) Yungera Creek to Area 1 (ML/d)
10000 0.0 0.0
29000 0.0 10.0
40000 100.0 1850.0
50000 400.0 3940.2
60000 1402.6 5945.3
70000 2611.0 8362.1
80000 4025.2 11190.6
85000 4783.7 12707.7
90000 5593.8 14327.7
100000 7419.6 17979.5
110000 9451.3 22042.9
120000 11688.9 26517.9
130000 14132.2 31404.7
140000 16781.4 36703.0
150000 19636.4 42413.1
160000 22697.3 48534.7
170000 25963.9 55068.1
200000 35963.9 75068.1

Page 53
There are four operation regimes proposed as per Table 13. However, the fresh operation has not
been included in the model due to no additional benefit from the benchmark conditions.
Table 13: Operating strategies used for Belsar–Yungera floodplain
Operating Strategy
Flow to start
operation (ML/d)
Regulator status
Frequency Resilience period
Duration Natural equivalent flow (ML/d)
Through flow/pump rate (ML/d)
Fresh* 10,000 All open Annually 2 3 months 30,000 -
Intermediate 30,000 Open ER3 , maintain ER1 and S7 at 48.35 mAHD
8 in 10 yrs 3 3 months 50,000 500
Maximum 50,000 Open ER3 , maintain ER1 and S7 at 52.3 mAHD
5 in 10 yrs 5 2 months 90,000 500
Max + Lakes 90,000 52mAHD@ Lake Powell and 53mAHD@ lake Carpul
1 in 4 yrs 6 1 month 170,000 150
*Not modelled as it doesn’t provide any additional benefit to the current regimes
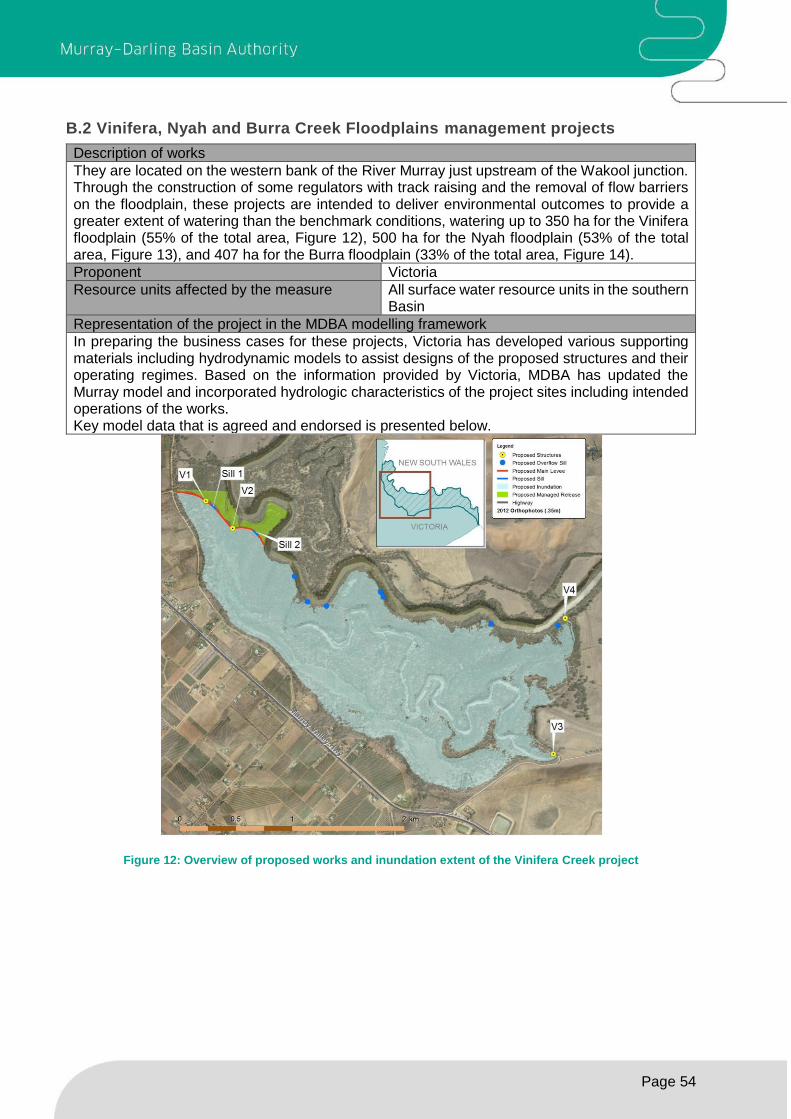
Page 54
B.2 Vinifera, Nyah and Burra Creek Floodplains management projects
Description of works
They are located on the western bank of the River Murray just upstream of the Wakool junction. Through the construction of some regulators with track raising and the removal of flow barriers on the floodplain, these projects are intended to deliver environmental outcomes to provide a greater extent of watering than the benchmark conditions, watering up to 350 ha for the Vinifera floodplain (55% of the total area, Figure 12), 500 ha for the Nyah floodplain (53% of the total area, Figure 13), and 407 ha for the Burra floodplain (33% of the total area, Figure 14).
Proponent Victoria
Resource units affected by the measure All surface water resource units in the southern Basin
Representation of the project in the MDBA modelling framework
In preparing the business cases for these projects, Victoria has developed various supporting materials including hydrodynamic models to assist designs of the proposed structures and their operating regimes. Based on the information provided by Victoria, MDBA has updated the Murray model and incorporated hydrologic characteristics of the project sites including intended operations of the works. Key model data that is agreed and endorsed is presented below.
Figure 12: Overview of proposed works and inundation extent of the Vinifera Creek project

Page 55
Figure 13: Overview of proposed works and inundation extent of the Nyah Creek project
Figure 14: Overview of proposed works and inundation extent of the Burra Creek project
N5
N1a N1b
N2
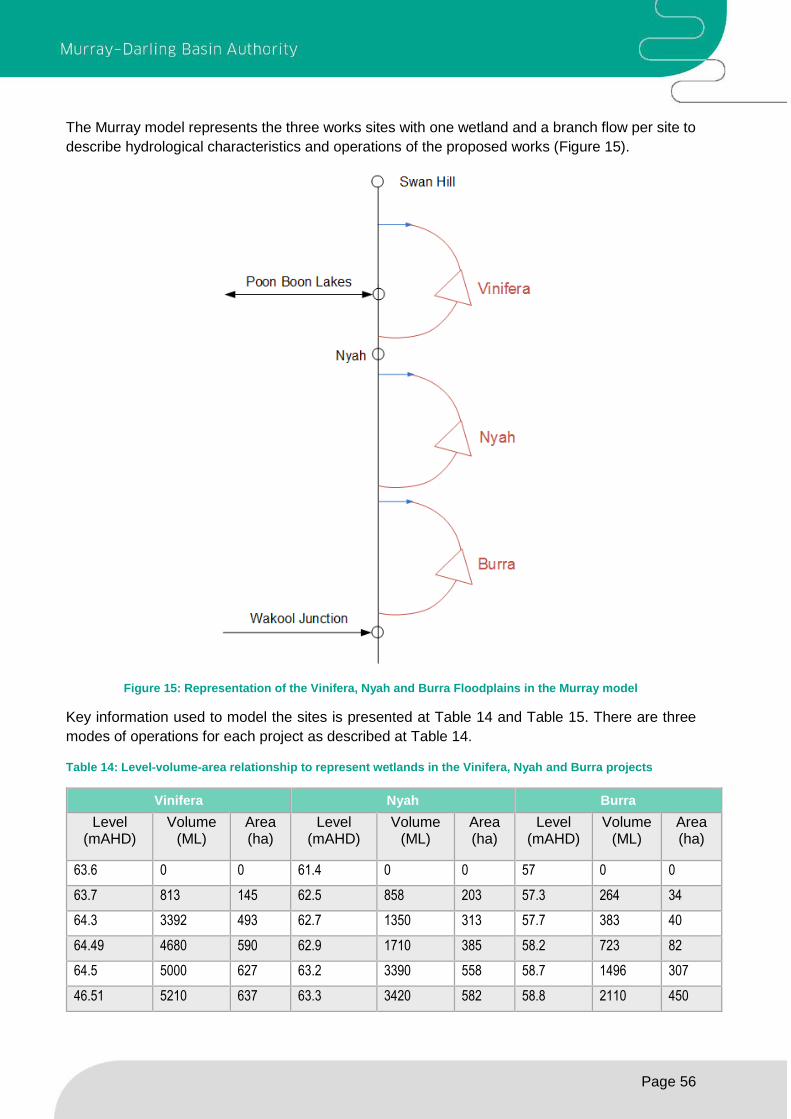
Page 56
The Murray model represents the three works sites with one wetland and a branch flow per site to
describe hydrological characteristics and operations of the proposed works (Figure 15).
Figure 15: Representation of the Vinifera, Nyah and Burra Floodplains in the Murray model
Key information used to model the sites is presented at Table 14 and Table 15. There are three
modes of operations for each project as described at Table 14.
Table 14: Level-volume-area relationship to represent wetlands in the Vinifera, Nyah and Burra projects
Vinifera Nyah Burra
Level (mAHD)
Volume (ML)
Area (ha)
Level (mAHD)
Volume (ML)
Area (ha)
Level (mAHD)
Volume (ML)
Area (ha)
63.6 0 0 61.4 0 0 57 0 0
63.7 813 145 62.5 858 203 57.3 264 34
64.3 3392 493 62.7 1350 313 57.7 383 40
64.49 4680 590 62.9 1710 385 58.2 723 82
64.5 5000 627 63.2 3390 558 58.7 1496 307
46.51 5210 637 63.3 3420 582 58.8 2110 450

Page 57
Table 15: Relationship between river Murray flow downstream of Swan Hill and inflows to the Vinifera, Nyah and Burra floodplains
Vinifera Nyah Burra
DS Swan Hill (ML/d)
Flow to Site (ML/d)
DS Swan Hill (ML/d)
Flow to Site (ML/d)
DS Swan Hill (ML/d)
Flow to Site (ML/d)
15000 91 10000 0 17500 0
17500 544 12500 1 19500 0
20000 2091 15000 163 20000 111
22500 5350 17500 191 22500 243
25000 6902 20000 294 25000 444
27500 8455 22500 1445 27500 824
30000 9616 25000 2450 30000 1500
32500 10568 27500 3456 32500 1997
35000 11714 30000 5387 35000 2388
32500 6507
35000 7000
There are nine operation regimes in total proposed as per Table 16. However, the fresh operation
has not been included in the model due to no additional benefit from the benchmark conditions.

Page 58
Table 16: Operating strategies adopted in the Murray model for the Vinifera, Nyah and Burra projects
Site Operating strategy
Flow to start
operation
(ML/d)
Regulator status
Duration Optimal frequency
Resilience period
(yr)
Equivalent Natural
flow (ML/d)
Vinifera Fresh1 - All open - - - -
Intermediate2 15,000 Maintain at 64.4 mAHD
4 months 8 in 10 yrs 3 17,500
Maximum2 17,500 Maintain at 64.4 mAHD
2 months 1 in 3 yrs 4 20,000
Nyah Fresh1 15,000 Fully open - - - -
Intermediate2 17,500 Maintain at 63.2 mAHD
4 months 8 in 10 3 20,000
Maximum2 20,000 Maintain at 63.2 mAHD
2 months 1 in 3 4 25,000
Burra Fresh1 - All open - - - -
Intermediate2 20,000 Maintain at 58.5 mAHD
1 month 2 in 10 yrs 8 30,000
Maximum3 30,000 Maintain at 58.7 mAHD
2 weeks At every opportunity of flow > 30,000 ML/d
35,000
1. Not included in the model as there is no additional benefit from current regimes. 2. Its operation is always piggybacking on natural overbank events and close regulators at their recession
to manage inundation duration. Therefore only one operational mode (advantageous watering) has been modelled so that the works are operated always at the back of overbank flow events.
3. Not included in the model due to its rare operations expected.

Page 59
B.3 Chowilla Floodplain – The Living Murray project
Description of works
The Chowilla Floodplain works is part of The Living Murray works at icon sites. It involves a major environmental regulator on the Chowilla Creek with a range of complementary works. The works allow regulated flows to be managed to achieve a higher inundation extent and mimicking higher flow regime up to a natural flow event of 90,000 ML/d.
Proponent SA, NSW and Victoria
Resource units affected by the measure All surface water resource units in the southern Basin
Representation of the project in the MDBA modelling framework
Initial modelling of the site has been undertaken as part of modelling support to The Living Murray investigation decisions. For assessing its SDL adjustment potential, MDBA updated the model in consultation with the South Australian government in order to reflect the latest hydrodynamic model calibration against the latest environmental watering (Figure 16).Key modelling data such as level-volume-area relationship that is used to represent the site is included in Table 17 and Table 18 with the proposed operating regimes (Table 19).
Figure 16: Representation of the Chowilla Floodplain site in the Murray model

Page 60
Table 17: Level-volume-area relationship to represent wetlands in the Chowilla Floodplain site
Lake Littra Lake Gumflat Lake Limbra Lake Coombool
Level (mADH)
Volume (ML)
Area (ha)
Level (mAD
H)
Volume (ML)
Area (ha)
Level (mADH)
Volume (ML)
Area (ha)
Level (mADH)
Volume (ML)
Area (ha)
18.9 0 0 18.5 0 0 17.6 0 0 18.2 0 0
19 68 58.5 19 77.1 26.4 18.29 418 215 18.3 121.2 148.2
19.1 130.7 64.7 19.1 263.6 141 18.83 2006 354 18.4 327.8 228.5
19.2 196.6 66.7 19.2 451.1 208.4 19.36 4556 512 18.5 580.3 263.7
19.3 264.2 68.3 19.3 719.4 263.5 19.9 7821 627 18.6 857.2 284.4
19.4 336.8 72.3 19.4 1037 300.1 20.1 8252 672 18.7 1151.9 300.5
19.5 411.4 76 19.5 1368.4 331.8 20.36 10611 711 18.8 1459 311.3
19.6 489.8 80.1 19.6 1713 352.4 20.92 15105 870 18.9 1775.1 319.4
19.7 572.1 83.9 19.7 2083.2 371 21.51 20604 979 19 2099 327.1
19.8 657.9 87 19.8 2463.5 386.6 22.31 29483 1033 19.1 2435.4 338.8
19.9 746.1 89.3 19.9 2858.5 400.7 22.5 31417 1033 19.2 2781.1 350.3
20 836.6 91.3 20 3285.7 414.4 23 36583 1033 19.3 3137.9 361
20.1 928.8 93 20.1 3705.5 424 Lake Werta Wert 19.4 3587.8 389.2
20.2 1022.7 94.7 20.2 4152.2 436.5 Level (mADH)
Volume (ML)
Area (ha)
19.5 3985.3 403.4
20.3 1118.3 96.4 20.3 4593.7 444.8 19.6 4398.2 419.5
20.4 1215.7 98.2 20.4 5048.2 456.8 16.5 0 0 19.7 4828.8 437.6
20.5 1316.1 100.5 20.5 5509.3 464.4 17 0.2 0.1 19.8 5280.7 459.4
20.6 1417.6 102.3 20.6 5977.7 471.5 17.5 23.8 14.9 19.9 5765.1 482.7
20.7 1520.7 103.9 20.7 6453.3 478.4 18 150.6 35.8 20 6261.5 505.6
20.8 1625.4 105.4 20.8 6934.7 483.8 18.4 295.6 46.5 20.1 6922.6 587.9
20.9 1731.6 107 20.9 7422 489.8 18.5 357.7 51 20.2 7529.4 619.4
21 1839.9 109.1 21 7915.2 495.8 18.6 438.1 61.8 20.3 8164.9 645.8
21.1 1950 111.1 21.1 8414.3 501.7 18.6 446.2 62.9 20.4 8823.2 666.7
21.2 2062.2 113.1 21.2 8919.5 508.1 18.6 454.2 64 20.5 9502.1 687
21.3 2176.4 115 21.3 9431.7 515.1 18.6 462.3 65.1 20.6 10199.3 704.3
21.4 2293.9 118.1 21.4 9950.6 521.6 18.6 470.3 66.2 20.8 11644.8 739.3
21.5 2413.8 121.2 21.6 11004.6
531.1 18.7 478.4 67.3 21 13207.7 810
21.7 2673.2 132.9 21.7 11537.6
534.4 19 759.9 90 21.4 16617 884.6
21.8 2809.1 137.8 21.8 12073.7
537.4 19.5 1393.9 140 21.6 18421.3 914.3

Page 61
Lake Littra Lake Gumflat Lake Limbra Lake Coombool
21.9 2949.5 142.2 22 13154.4
542.9 20 2327.3 212.7 22 22166.8 953.1
22 3093.2 144.7
20.5 3494.7 267.4
21 4971.9 311
21.5 6550.8 318
22 8149 321.2
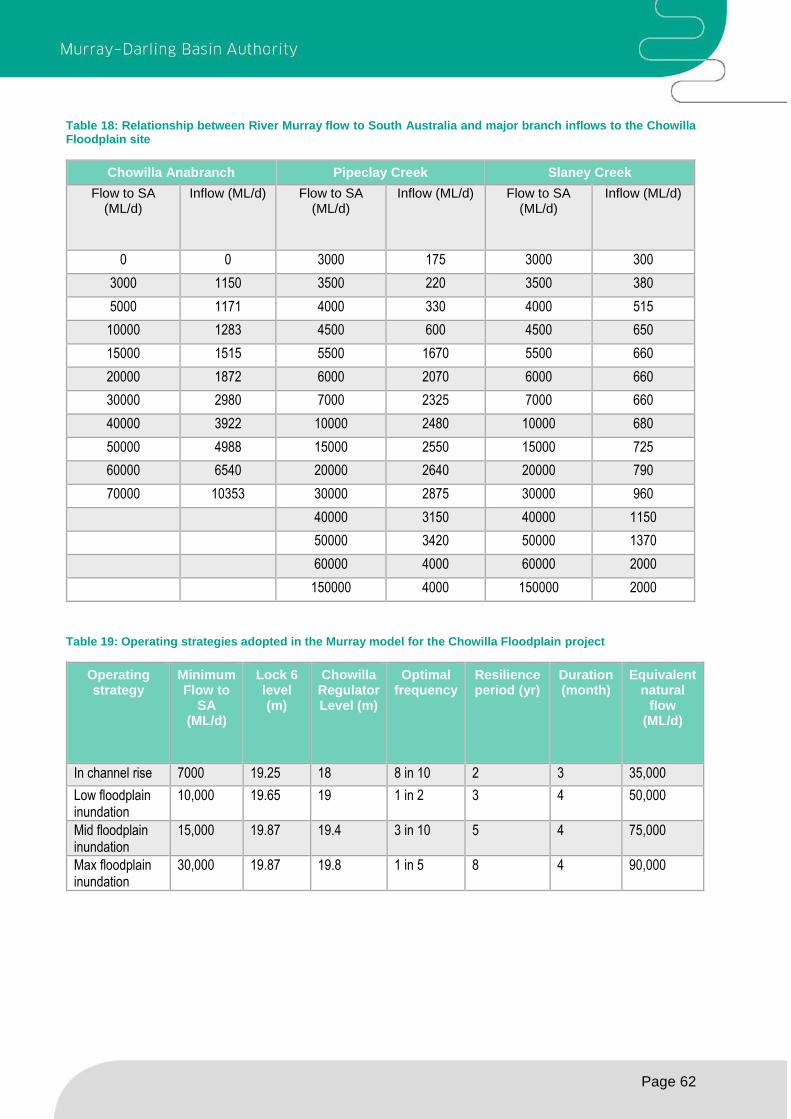
Page 62
Table 18: Relationship between River Murray flow to South Australia and major branch inflows to the Chowilla Floodplain site
Chowilla Anabranch Pipeclay Creek Slaney Creek
Flow to SA (ML/d)
Inflow (ML/d) Flow to SA (ML/d)
Inflow (ML/d) Flow to SA (ML/d)
Inflow (ML/d)
0 0 3000 175 3000 300
3000 1150 3500 220 3500 380
5000 1171 4000 330 4000 515
10000 1283 4500 600 4500 650
15000 1515 5500 1670 5500 660
20000 1872 6000 2070 6000 660
30000 2980 7000 2325 7000 660
40000 3922 10000 2480 10000 680
50000 4988 15000 2550 15000 725
60000 6540 20000 2640 20000 790
70000 10353 30000 2875 30000 960
40000 3150 40000 1150
50000 3420 50000 1370
60000 4000 60000 2000
150000 4000 150000 2000
Table 19: Operating strategies adopted in the Murray model for the Chowilla Floodplain project
Operating strategy
Minimum Flow to
SA (ML/d)
Lock 6 level (m)
Chowilla Regulator Level (m)
Optimal frequency
Resilience period (yr)
Duration (month)
Equivalent natural
flow (ML/d)
In channel rise 7000 19.25 18 8 in 10 2 3 35,000
Low floodplain inundation
10,000 19.65 19 1 in 2 3 4 50,000
Mid floodplain inundation
15,000 19.87 19.4 3 in 10 5 4 75,000
Max floodplain inundation
30,000 19.87 19.8 1 in 5 8 4 90,000
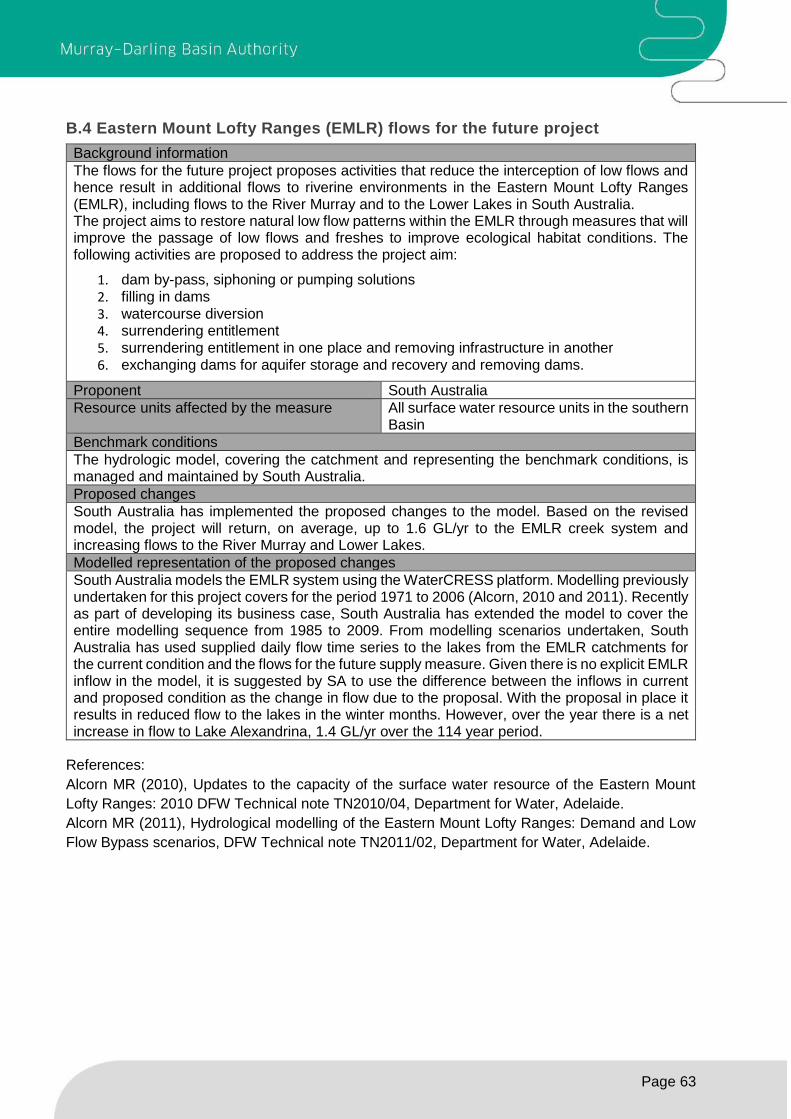
Page 63
B.4 Eastern Mount Lofty Ranges (EMLR) flows for the future project
Background information
The flows for the future project proposes activities that reduce the interception of low flows and hence result in additional flows to riverine environments in the Eastern Mount Lofty Ranges (EMLR), including flows to the River Murray and to the Lower Lakes in South Australia. The project aims to restore natural low flow patterns within the EMLR through measures that will improve the passage of low flows and freshes to improve ecological habitat conditions. The following activities are proposed to address the project aim:
1. dam by-pass, siphoning or pumping solutions 2. filling in dams 3. watercourse diversion 4. surrendering entitlement 5. surrendering entitlement in one place and removing infrastructure in another 6. exchanging dams for aquifer storage and recovery and removing dams.
Proponent South Australia
Resource units affected by the measure All surface water resource units in the southern Basin
Benchmark conditions
The hydrologic model, covering the catchment and representing the benchmark conditions, is managed and maintained by South Australia.
Proposed changes
South Australia has implemented the proposed changes to the model. Based on the revised model, the project will return, on average, up to 1.6 GL/yr to the EMLR creek system and increasing flows to the River Murray and Lower Lakes.
Modelled representation of the proposed changes
South Australia models the EMLR system using the WaterCRESS platform. Modelling previously undertaken for this project covers for the period 1971 to 2006 (Alcorn, 2010 and 2011). Recently as part of developing its business case, South Australia has extended the model to cover the entire modelling sequence from 1985 to 2009. From modelling scenarios undertaken, South Australia has used supplied daily flow time series to the lakes from the EMLR catchments for the current condition and the flows for the future supply measure. Given there is no explicit EMLR inflow in the model, it is suggested by SA to use the difference between the inflows in current and proposed condition as the change in flow due to the proposal. With the proposal in place it results in reduced flow to the lakes in the winter months. However, over the year there is a net increase in flow to Lake Alexandrina, 1.4 GL/yr over the 114 year period.
References:
Alcorn MR (2010), Updates to the capacity of the surface water resource of the Eastern Mount
Lofty Ranges: 2010 DFW Technical note TN2010/04, Department for Water, Adelaide.
Alcorn MR (2011), Hydrological modelling of the Eastern Mount Lofty Ranges: Demand and Low
Flow Bypass scenarios, DFW Technical note TN2011/02, Department for Water, Adelaide.

Page 64
B.5 Gunbower The Living Murray project
Description of works
A suite of engineering works have been built through The Living Murray program to deliver environmental water to the Gunbower Forest icon site, watering up to 4800 ha. These works and associated operating regime have been designed to achieve the ecological objectives that have been set for the forest. The works include two main components:
Lower Landscape Works — target the forest wetlands and use relatively small volumes of water. Works included refurbishing existing regulators within the forest, constructing new regulators and decommissioning of a single regulator. These regulators deliver water from either Gunbower Creek or the River Murray (when flows exceed 14,000 ML/d).
Hipwell Road Channel — targets large areas of river red gums and can create the conditions required for large colonial waterbird breeding events. Works include construction of a channel to deliver water from Gunbower Creek to the forest, a new weir in Gunbower Creek and associated works.
Proponent Victoria, NSW and SA
Resource units affected by the measure All surface water resource units in the southern Basin
Representation of the project in the MDBA modelling framework
The modelling of the site has been undertaken as part of modelling support to The Living Murray investigation decisions. This modelling work has been used for assessing SDL adjustment potential from the project. Therefore only a site schematic (17) used in the model and the operating regimes (Table 20) are presented.

Page 65
Figure 17: Representation of the Gunbower The Living Murray site in the Murray model
Table 20 Operating strategies adopted in the Murray model for the Gunbower The Living M project
Operating strategy
Optimal frequency
Resilience period
Min river flow to operate
Equivalent natural flow
Comment
Wetland watering
(GBL)
8 in 10 yrs 2 yrs N/A 25,000 ML/d for 2 months at
Torrumbarry D/S
Red Gum watering (GBF)
7 in 10 yrs 3 yrs N/A 35,000 ML/d for 2 months at
Torrumbarry D/S
Bird breeding
(GBB)
3 in 10 yrs 4 yrs N/A 35,000 ML/d for 3 months at
Torrumbarry D/S
1,600 ML/d for 60 days, ramping down to 300 ML/d
over 90 days and maintaining 300 ML/d for 90 days
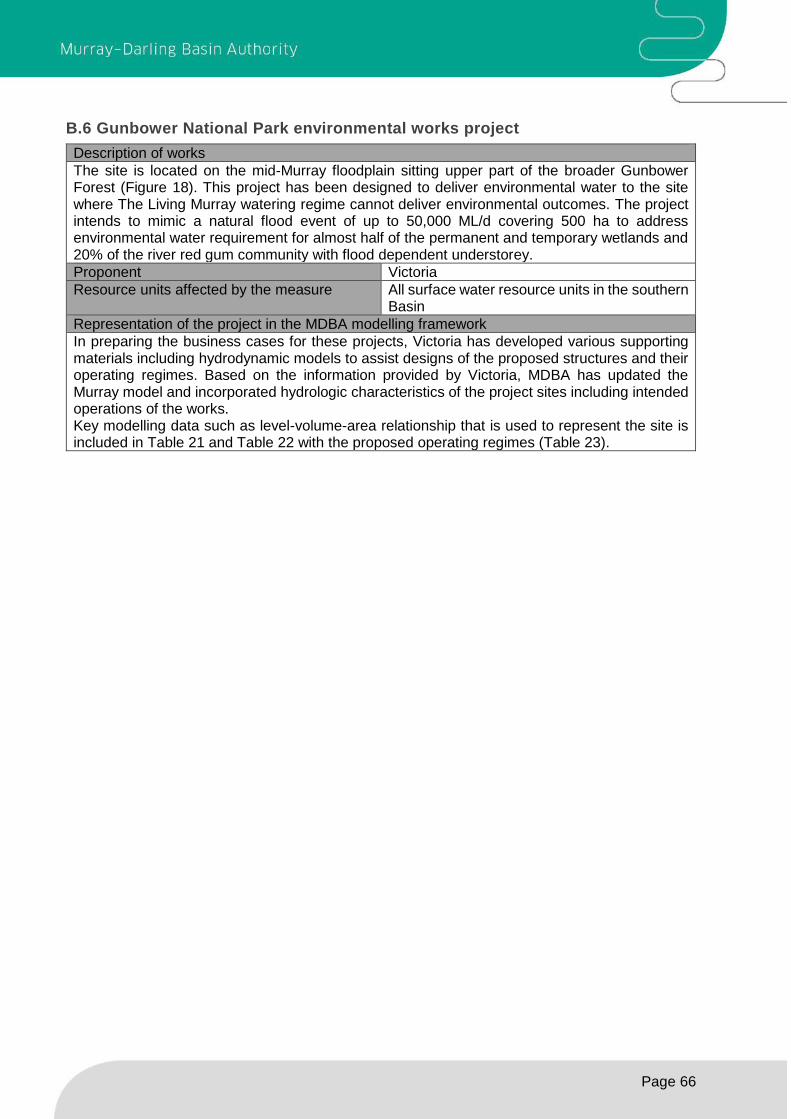
Page 66
B.6 Gunbower National Park environmental works project
Description of works
The site is located on the mid-Murray floodplain sitting upper part of the broader Gunbower Forest (Figure 18). This project has been designed to deliver environmental water to the site where The Living Murray watering regime cannot deliver environmental outcomes. The project intends to mimic a natural flood event of up to 50,000 ML/d covering 500 ha to address environmental water requirement for almost half of the permanent and temporary wetlands and 20% of the river red gum community with flood dependent understorey.
Proponent Victoria
Resource units affected by the measure All surface water resource units in the southern Basin
Representation of the project in the MDBA modelling framework
In preparing the business cases for these projects, Victoria has developed various supporting materials including hydrodynamic models to assist designs of the proposed structures and their operating regimes. Based on the information provided by Victoria, MDBA has updated the Murray model and incorporated hydrologic characteristics of the project sites including intended operations of the works. Key modelling data such as level-volume-area relationship that is used to represent the site is included in Table 21 and Table 22 with the proposed operating regimes (Table 23).

Page 67
Figure 18: Overview of proposed works in the Gunbower National Park project

Page 68
Figure 19: Representation of the Gunbower National Park site in the Murray model
Table 21: Level-volume-area relationship to represent wetlands in the Gunbower National Park project
Black Charlie Lagoon Baggots Creek area Old Cohuna Wetland
Level (mAHD)
Volume (ML)
Area (ha) Level (mAHD)
Volume (ML)
Area (ha)
Level (mAHD)
Volume (ML)
Area (ha)
85.060 0.0 0.0 84.610 0.0 0.0 83.560 0.0 0.0
85.068 20.0 19.5 84.648 21.8 34.5 83.571 34.0 128.9
85.076 40.0 39.1 84.662 38.8 68.9 83.593 62.2 141.2
85.084 60.0 55.0 84.664 56.5 93.1 83.611 89.6 151.6
85.120 80.0 74.5 84.672 75.4 105.5 83.627 116.3 163.2
85.144 92.7 86.5 84.684 95.0 119.4 83.640 141.9 172.1
85.150 98.2 89.9 84.696 114.7 131.3 83.652 166.2 181.3
85.151 101.2 92.4 84.705 134.3 139.0 83.664 188.7 189.8
85.152 103.5 93.8 84.713 154.1 147.4 83.676 208.6 196.0
85.153 104.6 94.1 84.721 173.7 153.1 83.685 225.6 202.2
85.154 106.6 94.6 84.730 186.1 157.1 83.692 240.3 207.9
84.738 200.4 160.8 83.699 252.9 209.1
84.746 211.4 164.6 83.704 263.4 214.4

Page 69
Black Charlie Lagoon Baggots Creek area Old Cohuna Wetland
84.753 222.7 168.2 83.709 272.3 215.4
83.725 326.3 225.9
83.746 373.9 238.1
83.762 413.5 249.0
83.773 446.8 256.4
83.785 474.8 262.4
83.794 496.8 268.1
83.801 513.6 269.3
83.805 526.1 274.3
83.809 535.3 274.8
83.812 542.0 278.9
83.814 546.9 279.4
83.815 550.5 279.6
83.816 553.2 279.7
83.817 555.1 279.8
Table 22: Relationship between flow downstream of Torrumbarry weir and inflows to the Gunbower National Park site
Flow at DS Torrumbarry
(ML/d)
Existing flow to the forest
(ML/d)
Revised flow to the forest
(ML/d)
Flow to Cameron’s Creek
(ML/d)
Flow to Old Cohuna
(ML/d)
0.0 0.0 0.0 0.0 0.0
13700.0 0.0 0.0 0.0 0.0
14000.0 2.4 2.4 0.0 0.0
17500.0 32.6 32.6 0.0 0.0
21000.0 60.0 60.0 0.0 0.0
25000.0 250.0 250.0 0.0 0.0
34000.0 1000.0 1000.0 0.0 0.0
37000.0 1700.0 1700.0 0.0 0.0
40000.0 2350.0 2350.0 0.0 0.0
45000.0 3500.0 3450.0 0.0 50.0
50000.0 5200.0 5105.7 20.0 74.3
55000.0 7000.0 6873.1 26.9 100.0
60000.0 8700.0 8542.2 33.5 124.3
70000.0 10000.0 9818.6 38.5 142.9

Page 70
Table 23: Operating strategies adopted in the Murray model for the Gunbower National Park project
Operating strategy
Frequency Duration Target Water used Inundation extent
Strategy 1 (GBW) - Permanent Wetland Watering
every year
Until evaporated from the target level
Black Charlie Lagoon @ 85.154m AHD
Maintenance of a continuous trickle flow to maintain the inundation extent of Cameron’s Creek and keep the lagoon above half full, with a top up flow in Winter/Spring to bring the lagoon to FSL
Black Charlie Lagoon – 16 ha at FSL U/s of Black Charlie Lagoon at 85.2 m AHD – 91 ha.
Strategy 2 (GBP) - Baggots Creek area Floodplain Watering
1 in 3 yr. Baggots @ 84.753m AHD
Divert water at 20 ML/d for a further 14 days in addition to OP1
Baggots area downstream of Black Charlie Lagoon 170 Ha (20 ML/d)
Strategy 3 (GBC) - Central Forest Floodplain Watering
1 in 3 yr. Old Cohuna @ 83.725m AHD
Filling occurs for 14 days at 50ML/d to fill from dry followed by 31 days of maintenance flows.
Upstream of Deep Creek, 175 ha at 50 ML/d. Downstream of Deep Creek, 80 ha at 50 ML/d

Page 71
B.7 Guttrum and Benwell Forests environmental works project
Description of works
They are located on the mid-Murray floodplain, downstream of Koondrook (Figure 20). This project has been designed to reinstate a more natural flooding regime especially addressing reduced frequency and duration of events. The project with the proposed works intend to mimic a natural flow event of 26,000 ML/d for Guttrum Forest and 24,000 ML/d for Benwell Forest which covers inundation area of 1,200 ha including semi-permanent wetlands and 82% of red gum community with flood dependent understorey in the site.
Proponent Victoria
Resource units affected by the measure All surface water resource units in the southern Basin
Representation of the project in the MDBA modelling framework
In preparing the business cases for these projects, Victoria has developed various supporting materials including hydrodynamic models to assist designs of the proposed structures and their operating regimes. Based on the information provided by Victoria, MDBA has updated the Murray model and incorporated hydrologic characteristics of the project sites including intended operations of the works. Figure 21 shows the site representation in the model. Key modelling data such as level-volume-area relationship that is used to represent the site is included in Table 24 and Table 25 with the proposed operating regimes (Table 26).
Figure 20: Overview of proposed works in the Guttrum–Benwell Forest project

Page 72
Figure 21: Representation of the Guttrum–Benwell Forest site in the Murray model
Table 24: Level-volume-area relationship to represent wetlands in the Guttrum–Benwell Forest site
Guttrum Forest
(sill level @ 74.2 mAHD)
Benwell Forest
(sill level @ 73.8 mAHD)
Level (mAHD)
Volume (ML)
Area (ha)
Inlet Capacity
Level (mAHD)
Volume (ML)
Area (ha)
Inlet Capacity
74 0 0 0 73.6 0 0 0
74.4 14 2 15 73.8 3 2 50
74.6 20 4 20 74 23 18 80
74.8 52 28 50 74.2 112 72 100
75 175 95 80 74.4 374 191 150
75.2 447 176 150 74.6 885 320 250
75.4 894 271 400 74.8 1634 429 1200
75.6 1410 445 600 75 2562 500 1500
75.8 2737 681 750 75.2 3599 537 1800
76 4307 889 800 75.4 4701 565 2000
76.2 6227 1031 900
76.4 8364 1106 1000
76.6 10619 1149 1000
80 11619 1249 1000
For a lake storage both the inflow and return flow are governed by the level difference at the point
of connection to the river and the inlet capacity as in Table 24, using the following relationship:

Page 73
𝑄 = 𝐶√∆ℎ ;
Where, 𝑄 = flow, ∆ℎ = level difference between offtake point and lake, and 𝐶 = inlet capacity.
While water level in the lakes is calculated from the relationship described at Table 24, river level
at offtake point is obtained from the relationship of river flow and level at Table 25.
Table 25: Rating relationship at the offtake locations to Guttrum and Benwell Forests
D/S of Guttrum Forest D/S of Benwell Forest
Flow (ML/d) Level (mAHD) Flow (ML/d) Level (mAHD)
0 67.48 0 69.28
5000 72.05 3460 70.54
7700 73.66 9500 73.20
8850 73.97 10900 73.59
10100 74.28 13000 73.97
12000 74.62 15130 74.26
14000 74.88 16430 74.42
15000 75.01 19000 74.74
17000 75.29 21000 74.93
20000 75.60 25000 75.10
25000 75.85 30000 75.30
30000 76.40
Table 26: Operating strategies adopted in the Murray model for the Guttrum–Benwell Forest project
Operating strategy
Frequency Duration Target Water used
Guttrum red gum watering
1 in 2 years 2 months Sill at 75.8 mAHD on the first month then fully opened
250 mL/d in the first month then replenishing flow of 50 ML/d
Guttrum Wetland watering
Opportunistic after 2 years
2 months Sill at 75.5 mAHD on the first month then fully opened
70 mL/d in the first month then replenishing flow of 15 ML/d
Benwell red gum watering
1 in 2 years 2 months Sill at 75.0 mAHD on the first month then fully opened
250 mL/d in the first month then replenishing flow of 50 ML/d
Benwell Wetland watering
Opportunistic after 2 years
2 months Sill at 74.4 mAHD on the first month then fully opened
125 mL/d in the first month then replenishing flow of 20 ML/d
Hybrid events: The Murray model automatically reduces environmental diversions to the sites when piggybacking natural events.

Page 74
B.8 Hattah Lakes The Living Murray project
Description of works
The project aims to deliver a watering regime that will achieve the ecological objectives for the Hattah Lakes The Living Murray icon site. The on-ground works have been designed to increase the frequency, duration and extent of flooding across the lakes and surrounding floodplain. The package of works enables watering of 6,000 ha and includes:
a new pumping station at Messenger’s Crossing
sill lowering in Chalka Creek South
four new regulators (Messenger’s, Oatey’s, Cantala, Kramen) and associated works
refurbishment of an existing regulator (Little Hattah)
three new stop banks or levees.
Proponent Victoria, NSW and SA
Resource units affected by the measure All surface water resource units in the southern Basin
Representation of the project in the MDBA modelling framework
The modelling of the site has been undertaken as part of modelling support to The Living Murray investigation decisions. This modelling work has been used for assessing SDL adjustment potential from the project. Therefore only a site schematic (Figure 22) used in the model and the operating regimes (Table 27) are presented.

Page 75
Figure 22: Representation of the Hattah The Living Murray site in the Murray model
Table 27 Operating strategies adopted in the Murray model for the Hattah The Living Murray project
Operating strategy
Optimal frequency
Resilience period
Min river flow to operate
Equivalent natural flow
Comment
Central Lakes: Filling
1 in 2 yrs 2 yrs N/A 43.5 mAHD for 3 month at Lake
Mournpall
~ 45,000 ML/d at Euston D/S
Central Lakes: Top-up
1 in 5 yrs 10 yrs 43.5 mAHD at Lake
Mournpall
45.0 mAHD for 1 month at Lake
Mournpall
~ 75,000 ML/d at Euston D/S
Lake Kramen pumping
1 in 8 yrs 10 yrs N/A 43.5 mAHD for 1 month at Lake
Kramen
~ 120,000 ML/d at Euston D/S

Page 76
B.9 Hattah Lakes North Floodplain management project
Description of works
This site is located in north-western Victoria on the western bank of the River Murray. This project is intended to complement The Living Murray works at the Hattah Lakes icon site by enhancing flooding across higher floodplain terraces. The project will also increase the flexibility for environmental water management across the lakes. The works are designed to water an additional 1,130 ha of floodplain through the construction of two new regulators, a causeway across an existing track and 1.7 km of levees along track alignments.
Proponent Victoria
Resource units affected by the measure All surface water resource units in the southern Basin
Representation of the project in the MDBA modelling framework
Initial modelling of the site has been undertaken as part of modelling support to The Living Murray investigation decisions. For assessing its SDL adjustment potential, MDBA extended the existing model based on information that Victoria supplied as a part of developing the business case so that the proposed works can be assessed in the modelling framework (Figure 23). There is only one additional wetland representation required to the existing model to simulate K10 regulator (Table 28) with the proposed and modelled operating regimes (Table 29).
Figure 23: Representation of the Hattah north site in the Murray model

Page 77
Table 28: Level-volume-area relationship to represent pooled area by K10 regulator in the Hattah north site
Level (mAHD) Volume (ML) Area (ha)
40.7 106 24
41.4 473 83
42.0 1090 133
42.4 1740 166
42.7 2290 188
42.8 2490 196
43.0 2910 235
-43.3 3570 293
43.4 3960 314
43.5 4560 350
43.7 4980 380
43.8 5620 430
43.9 5870 443
43.9 5930 447
Table 29: Operating strategies adopted in the Murray model for the Hattah north project
Operating strategy
Timing / frequency Duration Natural equivalent flow (ML/d)
Release constraint
River red gum To capture natural flow events or when
the Hattah The Living Murray works are
operative.
Maintain K10 regulator at 43.5mAHD for 120 days.
80,000 750 ML/d
Black box When Bitterang level is at 45mAHD or
higher
Open regulator to initiate flow to Lake Boolca until levels are
equalised and pump at a rate of 300 ML/d to achieve inundation
area of 710 ha.
12,000 N/A

Page 78
B.10 Lindsay Island Floodplain management project including The Living Murray
and stage 2 works
Description of works
The project is located on the River Murray floodplain in north west Victoria, 100 km west of Mildura. Lindsay Island is downstream of the junction of the Murray and Darling Rivers and lies within the Murray-Sunset National Park (Figure 24). The Lindsay Island Floodplain Project is envisaged to inundate 5,152 ha of the floodplain and connect many parts of the floodplain through tiered watering events, including areas of unique fast-flowing aquatic habitat, through to sections of black box, lignum and onto the higher alluvial terraces. The proposed works are designed to be operated in tandem with the recently completed The Living Murray works at this site (Lindsay Stage 1) and Lock 7 to mimic flows of 40,000 ML/day to 120,000 ML/day. The proposed works include two components:
Primary: Berribee Regulator and fishway, five containment regulators and 2.6 km of levees along track alignments
Secondary: 13 regulators and associated works, and 4.9 km of levees along track alignments.
Proponent Victoria
Resource units affected by the measure All surface water resource units in the southern Basin
Representation of the project in the MDBA modelling framework
In preparing the business cases for this project, Victoria has developed various supporting materials including hydrodynamic models to assist designs of the proposed structures and their operating regimes. Based on the information provided by Victoria, MDBA has updated the Murray model (Figure 25) and incorporated hydrologic characteristics of the project sites (Table 30) including intended operations of the works (Table 31).

Page 79
Figure 24: Overview of the proposed and existing works and inundation extents in the Lindsay Island site

Page 80
Figure 25: Representation of the Lindsay Island site in the Murray model
To enable the storage sites to be represented in the Murray model, the following relationships have
been incorporated.
Table 30: Level-volume-area relationship used to represent wetlands in the Lindsay Island site
Lindsay South Wallawalla East Lake Wallawalla Wallawalla West
Level (mAHD)
Volume (ML)
Area (ha)
Level (mAHD)
Volume (ML)
Area (ha)
Level (mAHD)
Volume (ML)
Area (ha)
Level (mAHD)
Volume (ML)
Area (ha)
22.4 0 0 24.2 0 0 20.1 0 0 21.9 0 0
22.8 0.2 0.2 24.3 0.1 0.5 20.3 0.7 4.4 22 0 0
23.2 3.1 1.5 24.4 2.1 4.6 20.6 373 227 22.2 0 0
23.6 19 8 24.5 11 13 20.9 1284 378 22.4 0 0
24 78 27 24.6 29 24 21.2 2609 501 22.6 1 0
24.4 327 116 24.7 58 34 21.5 4254 588 22.8 1 0
24.6 650 218 24.8 97 44 21.8 6108 649 23 1 0
24.7 898 277 24.9 147 58 22.1 8186 726 23.2 2 1
24.8 1208 340 25 216 83 22.4 10434 770 23.4 7 4
24.9 1571 381 25.1 317 122 22.7 12801 806 23.6 24 14
25 1976 422 25.2 468 185 23 15264 835 23.8 70 34
25.1 2413 449 25.3 696 278 23.3 17804 857 24 177 80
25.2 2840 449 25.4 930 278 23.6 20406 879 24.1 279 133

Page 81
Lindsay South Wallawalla East Lake Wallawalla Wallawalla West
23.9 23093 913 24.2 453 224
24.2 25885 947 24.3 730 329
24.5 28769 977 24.4 1108 426
24.6 29753 991 24.5 1577 509
24.7 30800 991 24.6 2123 580
24.8 3435 744
25 5132 952
25.2 6830 952
Berribee Weir Crankhandle Crankhandle West
Level (mAHD)
Volume (ML)
Area (ha)
Level (mAHD)
Volume (ML)
Area (ha)
Level (mAHD)
Volume (ML)
Area (ha)
19.7 0 0 21.87 0 0 20.53 0 0
21.4 173 22 21.88 24 7 20.535 40 6
21.6 243 61 21.9 243 24 20.54 262 31
21.8 422 116 22.28 1484 227 21.66 327 49
22 683 198 22.63 2110 374 22.2 1330 205
22.2 983 292 22.72 2930 495 22.65 2718 353
22.4 1600 477 22.82 3911 696 22.97 3927 460
22.6 2597 769 23.11 6254 984 23.24 5509 612
22.8 3913 1139 23.34 8935 1223 23.4 6703 700
23 7276 1950 23.49 10935 1366 23.49 7226 726
23.2 11226 2662 23.56 12004 1409 23.58 7756 749
23.64 13111 1440 23.6 7875 753
23.66 13447 1449 23.65 8291 768
23.71 14218 1471 23.72 8727 798
23.81 15525 1503 23.78 9256 815
23.87 16524 1523 23.82 9502 815
23.91 17179 1523

Page 82
Table 31 Operating strategies adopted in the Murray model for the Lindsay Island project
Operating strategy
Frequency Duration Target Operation
Seasonal
fresh Every year -
Raise Lock 7 to 22.6 mAHD
All structures are open.
Berribee
intermediate 1 in 2 yr 4 month
Raise Lock 7 to 23.2 mAHD
Lindsay South, Wallawalla East and Wallawalla West regulators are open. Berribee weir at 22.8 mAHD. Crankhandle and Crankhandle West regulators are closed.
Berribee
maximum 1 in 3 yr 3 month
Raise Lock 7 to 23.2 mAHD
Lindsay South, Wallawalla East and Wallawalla West regulators are open. Berribee Weir, Crankhandle and Crankhandle West regulators are closed.
Berribee
maximum
and pumping
1 in 7 yr 3 month Raise Lock 7 to 23.2 mAHD
All regulators are closed. Pumping to Lindsay South, Wallawalla East and Wallawalla West at 150 ML/d
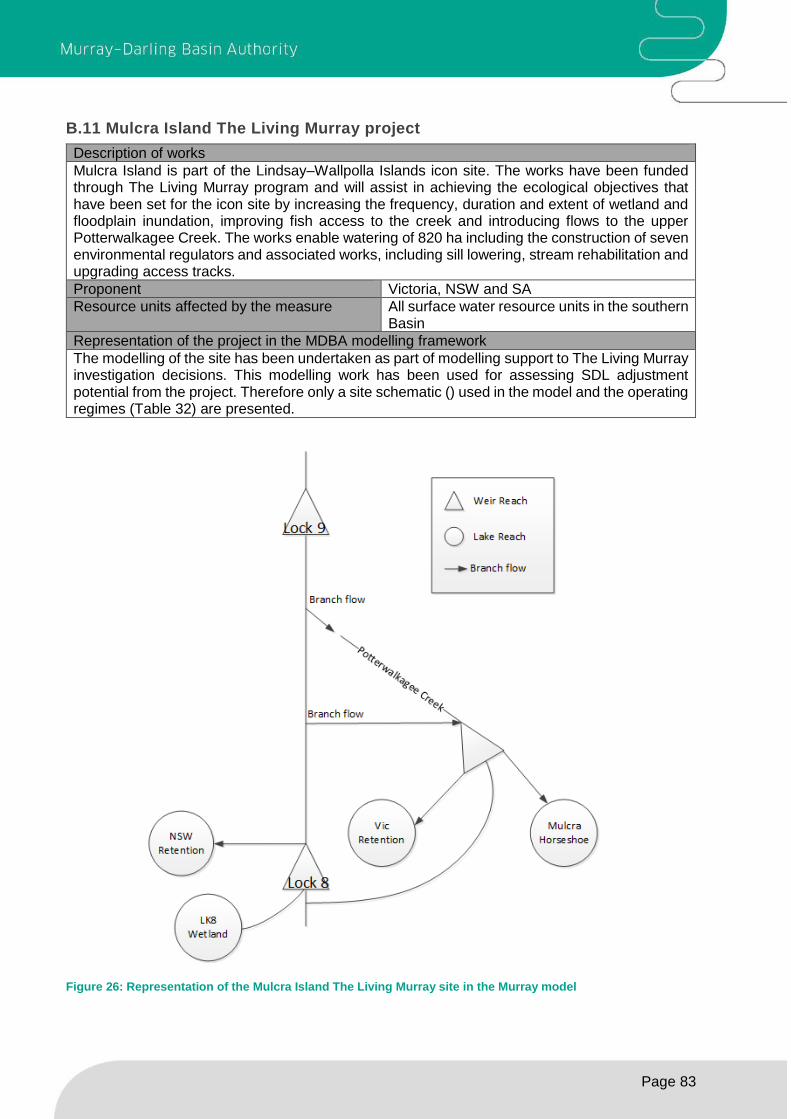
Page 83
B.11 Mulcra Island The Living Murray project
Description of works
Mulcra Island is part of the Lindsay–Wallpolla Islands icon site. The works have been funded through The Living Murray program and will assist in achieving the ecological objectives that have been set for the icon site by increasing the frequency, duration and extent of wetland and floodplain inundation, improving fish access to the creek and introducing flows to the upper Potterwalkagee Creek. The works enable watering of 820 ha including the construction of seven environmental regulators and associated works, including sill lowering, stream rehabilitation and upgrading access tracks.
Proponent Victoria, NSW and SA
Resource units affected by the measure All surface water resource units in the southern Basin
Representation of the project in the MDBA modelling framework
The modelling of the site has been undertaken as part of modelling support to The Living Murray investigation decisions. This modelling work has been used for assessing SDL adjustment potential from the project. Therefore only a site schematic () used in the model and the operating regimes (Table 32) are presented.
Figure 26: Representation of the Mulcra Island The Living Murray site in the Murray model

Page 84
Table 32 Operating strategies adopted in the Murray model for the Mulcra Island The Living Murray project
Operating strategy Frequency Resilience period
Raising lock 8 Equivalent natural flow
Spring Freshes1 Every one to two years
1 yr By 20 to 60 cm -
Floodplain inundation
1 in 2 yrs 4 yrs To the top of piers (25.7 mAHD)
50,000 ML/d
1Not modelled given no increased inundation area

Page 85
B.12 Riverine Recovery Project
Description of works
The Riverine Recovery Project envisaged to provide a South Australian Class 9 water access entitlement to the Commonwealth Government. The entitlement can be used for environmental purposes either within or upstream of the South Australian/Victorian border. The entitlement is generated from evaporative savings by returning a number of wetlands in the South Australian Murray to a more natural wetting/drying regimes.
Proponent South Australia
Resource units affected by the measure All surface water resource units in the southern Basin
Benchmark conditions
Due to a series of locks within the South Australian Murray section, a number of wetlands along the river channel are constantly inundated. The continuously pooled water not only gets evaporated and refilled from the river but also degrades ecological habitat conditions.
Proposed changes
These project elements involve investigations and installation of infrastructure to re-introduce more natural wetting and drying cycles for wetlands. The reduced evaporation associated with more natural cycles is the source of water savings.
Representation of the project in the MDBA modelling framework
The South Australian Government developed an evapotranspiration daily time-series (SWET) model to calculate water balance for each managed wetland so that net evaporative savings can be calculated from the intended wetting and drying regimes. Water savings in the form of class 9 entitlements totalling 5.2248 gigalitres (GL), have been transferred to the Commonwealth Government. Additional water savings from finalising Phase 1 and completing Phase 2 wetlands element are anticipated to be around 2.02 GL. It is proposed to model its evaporative savings by reducing losses in the model by 7.2 GL which is equal to the savings determined by the SWET model.

Page 86
B.13 South Australian Riverland Floodplain Integrated Infrastructure Program
(SARFIIP)
Description of works
The South Australian Riverland Floodplain Integrated Infrastructure Programme (SARFIIP) aims to create an integrated and resilient floodplain along the South Australian River Murray, between the border and Lock 1, through a package of works and measures that enable floodplain inundation and freshening of groundwater lenses with particular focus on the Pike and Katarapko floodplains. Environmental works on the Pike and Katarapko Floodplains (Figure 27 and Figure 28) are intended to optimise the frequency, duration and extent of inundation events to protect and restore these floodplain ecosystems and contribute to Basin Plan environmental outcomes.
Proponent South Australia
Resource units affected by the measure All surface water resource units in the southern Basin
Representation of the project in the MDBA modelling framework
In preparing the business case for this project, South Australia has developed various supporting materials including hydrodynamic models to assist designs of the proposed structures and their operating regimes. Based on the information provided by South Australia, MDBA has updated the Murray model (Figure 29) and incorporated hydrologic characteristics of the project sites (Table 33) including intended operations of the works (Table 34).
Figure 27: Overview of the proposed works in the Pike Floodplain

Page 87
Figure 28: Overview of the proposed works in the Katarapko Floodplain

Page 88
Lock 4
Pike
Natural flow path
Managed flow
Lock 5
Katarapko
Figure 29: Representation of the Pike and Katarapko Floodplain sites in the Murray model
Table 33: Level-volume-area relationship used to represent wetlands in the Pike and Katarapko Floodplain site
Pike Katarapko
Level (mAHD) Volume (ML) Area (ha) Level (mAHD) Volume (ML) Area (ha)
12 0 0 10.4 5.8 4.3
12.05 3.1 1.6 10.55 13.8 8.7
12.3 13.8 8.9 10.6 23.9 24.3
12.6 80.3 38.4 11 177.4 56.4
12.9 272.7 92.9 11.4 458.4 87.1
13.2 626.4 143.7 11.6 655.3 113.8
13.5 1145.8 214.7 11.9 1047.9 153.9
13.8 1907.1 285.1 12.2 1575.8 204.6
14.1 2825.8 328.2 12.5 2269.2 270.4
14.4 3859.4 364.5 12.8 3223.6 387.8
14.7 5099.7 471.1 12.95 3853.9 466.8
15 6829.7 688.8 13.15 4910.2 606.2
15.3 9264.9 940.3 13.35 6298.6 792.7

Page 89
Pike Katarapko
15.5 11323.2 1124.5 13.5 7602.5 937.4
15.6 12505.5 1240.3 13.65 9119.1 1058.2
15.9 16722.3 1567.5 13.85 11396.7 1158.8
16 18343.7 1674.7 14.15 14905.5 1166.7
16.2 21906.3 1883.5 14.5 18995 1168.4
16.4 25854.9 2046
16.5 27916.3 2071.4
17 34000 2400
Table 34: Operating strategies adopted in the Murray model for the Pike and Katarapko Floodplain project
Operating Strategy
Minimum flow required to SA
(ML/d)
Frequency Duration (month)
Target Minimum through flow
(ML/d)
Natural equivalent flow (ML/d)
Pike 35,000 1 in 3 yr 3 16.4 mAHD at Pike regulator
400 80,000
Katarapko 20,000 1 in 2 yr 3
13.5 mAHD at Katarapko regulator
N/A 70,000

Page 90
B.14 South East Flows Restoration Project (SEFRP)
Description of works
The South East Flows Restoration Project (SEFRP) commenced construction in March 2017 and will use a combination of newly constructed drains and widened existing drains within the upper south east drainage system to divert additional water from the Blackford Drain in the upper south east into the Coorong South Lagoon. Augmentation of the SEFRP to include additional drain catchments would increase the volume of water to the Coorong South Lagoon. The diverted water will provide environmental water en route wetlands of the upper south east, as well as salinity improvements in the Coorong South Lagoon by reducing the frequency of periods where salinity exceeds 100 grams per litre (g/L).
Proponent South Australia
Resource units affected by the measure All surface water resource units in the southern Basin
Benchmark conditions
As per Schedule 6 (S6.02) of the Basin Plan, the MDBA’s benchmark has been revised (MDBA, 2013) to incorporate upper south east inflows as of June 2009 to reflect the new drains by that time and their operations based on the modelling conducted by South Australia (Gibbs, 2013).
Proposed changes
There are a number of proposed structures as part of this project that will be operated depending on the water requirements of the Coorong South Lagoon. These are:
ancillary structures to deliver flow from the proposed channel to local en route wetlands (Taratap wetlands and Tilley Swamp Conservation Park)
the weir on the Blackford Drain to divert flow into the proposed drain
releases made from Morella Basin to the Coorong South Lagoon at the end of the system.
Representation of the project in the MDBA modelling framework
Flow to the Coorong South Lagoon (CSL) via Salt Creek is represented by a time series in benchmark condition. To reflect the constructions of new drains, the operation of the weir on the Blackford Drain and the release made from Morella Basin, the inflow to CSL has been augmented. The Coorong model has been modified by MDBA in consultation with South Australia to consider the augmented inflow to CSL whenever the maximum salinity of CSL in previous year is more than or equal to 60 g/L. Thus it considers that the drain and the structures will be operational if the salinity in previous year reaches 60 g/L.
References:
MDBA (2013). Updating Upper South East Inflow and Revising Salinity Estimates, Murray–Darling
Basin Authority Technical Report 2013/26.
M. Gibbs (2013). Changes to SEFLOWS modelling to represent 30 June 2009 conditions.
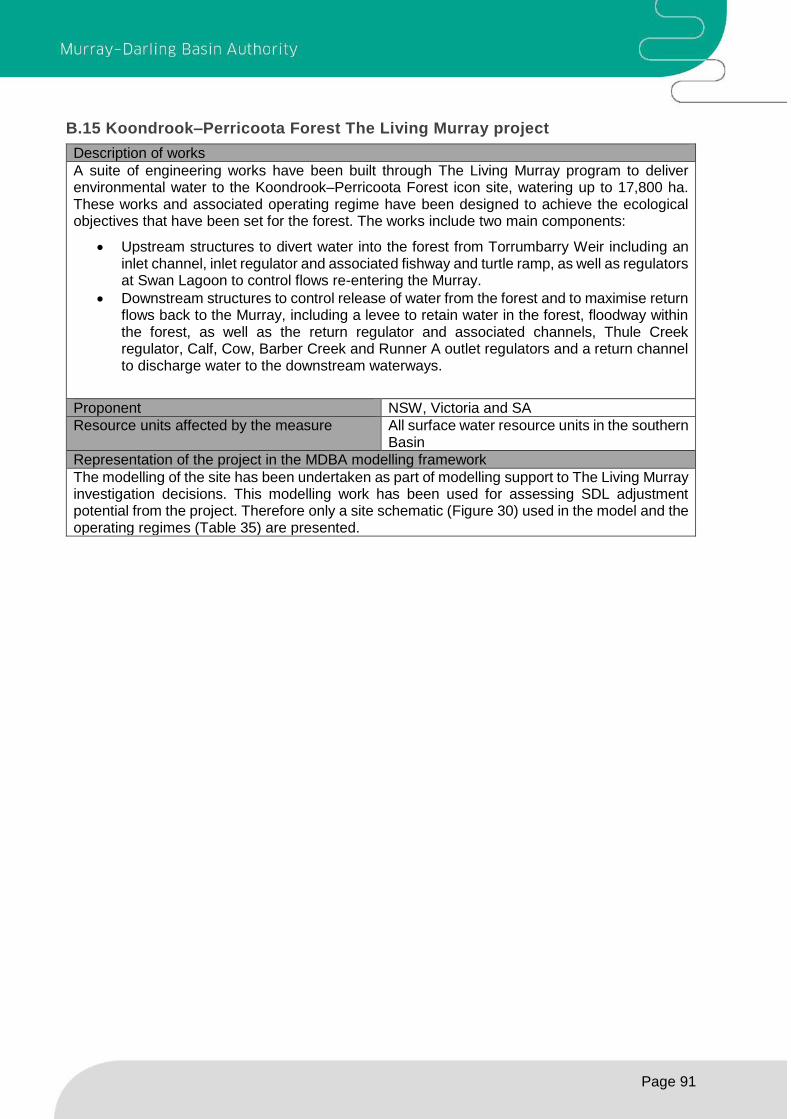
Page 91
B.15 Koondrook–Perricoota Forest The Living Murray project
Description of works
A suite of engineering works have been built through The Living Murray program to deliver environmental water to the Koondrook–Perricoota Forest icon site, watering up to 17,800 ha. These works and associated operating regime have been designed to achieve the ecological objectives that have been set for the forest. The works include two main components:
Upstream structures to divert water into the forest from Torrumbarry Weir including an inlet channel, inlet regulator and associated fishway and turtle ramp, as well as regulators at Swan Lagoon to control flows re-entering the Murray.
Downstream structures to control release of water from the forest and to maximise return flows back to the Murray, including a levee to retain water in the forest, floodway within the forest, as well as the return regulator and associated channels, Thule Creek regulator, Calf, Cow, Barber Creek and Runner A outlet regulators and a return channel to discharge water to the downstream waterways.
Proponent NSW, Victoria and SA
Resource units affected by the measure All surface water resource units in the southern Basin
Representation of the project in the MDBA modelling framework
The modelling of the site has been undertaken as part of modelling support to The Living Murray investigation decisions. This modelling work has been used for assessing SDL adjustment potential from the project. Therefore only a site schematic (Figure 30) used in the model and the operating regimes (Table 35) are presented.

Page 92
Figure 30: Representation of the Koondrook–Perricoota The Living Murray site in the Murray model
Table 35 Operating strategies adopted in the Murray model for the Koondrook–Perricoota The Living Murray project
Operating strategy
Optimal frequency
Resilience period
Min river flow to operate
Equivalent natural flow Comment
Wetland watering
6 in 10 yrs 2 yrs N/A 35,000 ML/d for 2 months at Torrumbarry D/S
Red gum watering
3 in 10 yrs 4 yrs N/A 35,000 ML/d for 3 months at Torrumbarry D/S
Bird breeding 4 in 10 yrs 3 yrs N/A 25,000 ML/d for 3 months at Torrumbarry D/S
2,000 ML/d for 30 days, ramping down to 500 ML/d over 10 days and maintaining 500 ML/d for 60 days

Page 93
B.16 Wallpolla Island Floodplain management project
Description of works
The Wallpolla Island Project is located in Victoria on the River Murray floodplain, downstream of the junction of the Murray and Darling Rivers and approximately 40 km west of Mildura. The site is part of the Murray–Sunset National Park. This project includes four major regulators with a number of small containment regulators and raised tracks (Figure 31), aiming to increase the frequency and duration of floodplain inundation across 2,650 ha and providing significant benefit to nationally important species, threatened vegetation communities, ecological values, carbon cycling and downstream water quality. This will benefit both Wallpolla Island and the broader lower Murray region. Proponent Victoria
Resource units affected by the measure All surface water resource units in the southern Basin
Representation of the project in the MDBA modelling framework
In preparing the business cases for the project, Victoria has developed various supporting materials including hydrodynamic models to assist designs of the proposed structures and their operating regimes. Based on the information provided by Victoria, MDBA has updated the Murray model (Figure 32) and incorporated hydrologic characteristics of the project site (Table 36 and Table 37) including intended operations of the works (Table 38).
Figure 31: Overview of the proposed works in the Wallpolla Island site

Page 94
Figure 32: Representation of the Wallpolla Island site in the Murray model
Table 36: Level-volume-area relationship used to represent wetlands in the Wallpolla Island site
Upper Wallpolla Middle Wallpolla South Wallpolla
Level (mAHD)
Volume (ML)
Area (ha)
Level (mAHD)
Volume (ML)
Area (ha)
Level (mAHD)
Volume (ML)
Area (ha)
29.5 0 0 27.1 0 0 30.8 0 0
29.6 2 0 27.4 0 0 30.9 44 7
29.8 18 3 27.6 21 9 30.9 341 62
30.0 49 8 27.8 99 22 31.0 466 111
30.2 85 14 28.0 223 39 31.1 723 241
30.4 131 21 28.2 396 62 31.3 854 715
30.6 187 29 28.4 620 92 32.0 900 715
30.8 258 41 28.6 828 124
31.0 356 58 28.8 1054 162
31.2 492 81 29.0 1306 204
31.4 731 125 29.2 1583 250
31.6 1321 206 29.4 2214 372
31.8 2766 420 29.6 3005 496
32.0 3747 672 29.8 3905 702
30.0 4912 893

Page 95
Table 37: Inflow to the Wallpolla Island site depending river flow
Flow at Wentworth (ML/d)
Flows into Upper Wallpolla (ML/d)
Flow in Murray d/s of Upper Wallpolla offtake
(ML/d)
Flows into Middle Wallpolla (ML/d)
0 0 0 0
50000 0 5000 216
60000 3 10000 441
70000 208 20000 878
80000 413 30000 2592
90000 632 40000 4320
100000 851 50000 6912
110000 1179 59997 9933
120000 1508 69792 12750
125000 1779 79587 15566
130000 2050 89368 19454
140000 2592 99149 23341
150000 3456 108821 30357
160000 5184 118492 37372
200000 12096 123221 39244
127950 41116
137408 49680
146544 55296
154816 63072
187904 94176
Table 38: Operating strategies adopted in the Murray model for the Wallpolla Island project
Operating strategy
Frequency Duration Target Water used
Seasonal fresh Every year 4 months This operation is
covered by lock 9
manipulation
Lock 9 is raised gradually and
then lowered again over the
year.
Mid Wallpolla
maximum
1 in 2 years 3 months Operation of the
works will achieve a
maximum
inundation level of
30 m AHD.
Lock 9 is raised and Middle
Wallpolla is closed, while
Upper Wallpolla remains
open.
Mid and Upper
Wallpolla
maximum
1 in 3 years 2 months Operation of the
works will achieve a
maximum
inundation level of
32 m AHD.
Lock 9 is raised and both
Upper and Middle Wallpolla is
closed.
Mid and Upper
Wallpolla
Maximum, South
Wallpolla
pumping
1 in 7 years 1 month Water delivered to
South Wallpolla via
temporary pumps.
South Wallpolla regulator is closed. Pumping to South Wallpolla with a capacity of 100 ML/d till South Wallpolla is full.

Page 96
B.17 Improved flow management works at the Murrumbidgee river – Yanco Creek
offtake
Description of works
The site of the proposed works is at the Yanco Creek off-take from the Murrumbidgee River, approximately 20 km to the west of the town of Narrandera. The proposed works include:
Yanco Creek Regulator and Fishway – a new regulator to be installed in Yanco Creek to allow regulation of flows between the Murrumbidgee River and Yanco Creek. Operation of the regulator during targeted environmental watering events for the mid-Murrumbidgee improves watering efficiency of the environmental assets.
Increased weir pool level at Yanco Weir – the weir pool will be raised at Yanco weir so that environmental flows can be provided to Yanco Creek without having to provide large flows downstream in the Murrumbidgee River.
New Murrumbidgee Regulator at Yanco Weir – an investigation of the structural and mechanical capacity of the existing gated regulator at Yanco Weir indicates that it is not suitable for upgrading for the increased water level associated with the new weir pool design level. It is proposed to install a new regulator in the meander reach that currently has the older Yanco fixed crest weir.
Fishway at new Murrumbidgee Regulator - the project will provide for both upstream and downstream fish passage in the Murrumbidgee River and Yanco Weir
Proponent NSW
Resource units affected by the measure All surface water resource units in the southern Basin
Benchmark conditions
In order to be able to simulate a number of Sustainable Diversion Limit adjustment (SDLA) proposals it was necessary to increase the model resolution at various points in the Murrumbidgee. It was agreed with MDBA that NSW would build a single common SDLA benchmark model for the Murrumbidgee so that the proposals can be assessed from a common starting point (DHI, 2015a).
Modelled representation of the proposed changes
All NSW Murrumbidgee measures were incorporated into the adjusted benchmark model by NSW (DHI, 2016) in consultation with MDBA and accepted by TWG. The Yanco Creek system is not included in the ecological scoring assessment in the MDBA’s modelling framework. For modelling assessment, therefore, operating regimes are included in the model to achieve environmental flow targets developed by Alluvium (2013) which has been described in DHI (2017).
References:
Alluvium (2013). Yanco Creek system environmental flow study (final report)
DHI (2015a). Murrumbidgee SDLA – update of Benchmark model.
DHI (2016). Murrumbidgee SDLA – Project models.
DHI (2017). Memo: Yanco Offtake and Effluents modelling

Page 97
B.18 Modernising supply systems for effluent creeks – Murrumbidgee River
Description of works
The Yanco Creek system is an effluent creek within the lowland reaches of the Murrumbidgee River between Narrandera and the confluence of the Billabong Creek with the Edward River at Moulamein. The project will improve operational efficiency and generate water savings within the Yanco Creek system via:
Monitoring: provision of additional monitoring capability to provide enhanced information in real-time to the system operator and water users on flows and levels throughout the creek system.
Controls (new works): a new weir and upgrades to existing weirs to allow re-regulation and tighter flow control and management along the length of the creek system.
Alternative supplies: provision of alternative supply points into the creek system from the neighbouring irrigation corporations, at locations far closer to the end user, to better align demand and supply.
Operating rules: codification and documentation of the revised operational protocols to optimise use of the new controls and improve diversion efficiency as well as social and environmental outcomes.
Water savings will be converted into a callable general security entitlement. A rules based account will also be created to mitigate third party impacts in the NSW Murray arising from captured operational surplus flows.
Proponent NSW
Resource units affected by the measure All surface water resource units in the southern Basin
Benchmark conditions
In order to be able to simulate a number of Sustainable Diversion Limit adjustment (SDLA) proposals it was necessary to increase the model resolution at various points in the Murrumbidgee. It was agreed with MDBA that NSW would build a single common SDLA benchmark model for the Murrumbidgee so that the proposals can be assessed from a common starting point (DHI, 2015a).
Modelled representation of the proposed changes
All NSW Murrumbidgee measures were incorporated into the adjusted benchmark model by NSW (DHI, 2016). The specific operating regime for each of the works will be subject to optimisation as described in NSW DPI (2015). For modelling assessment, however, operating regimes are included in the model to achieve environmental flow targets developed by Alluvium (2013) which has been described in DHI (2017). The Murrumbidgee model with the supply measures has been supplied by NSW, and MDBA has incorporated into the modelling framework for assessing the package of the agreed measures. MDBA has also assessed benefits from the CARM and effluent creek modernisation projects to determine the volume of environmental entitlements and Inter Valley Trade account (MDBA, 2017).
References:
Alluvium (2013), Yanco Creek system environmental flows study
DHI (2015a), Murrumbidgee SDLA – update of Benchmark model
DHI (2016), Murrumbidgee SDLA – Project models
DHI (2017), Memo: Yanco Offtake and Effluents modelling
MDBA (2017), Assessment of the CARM and modernisation projects for entitlement creation.
NSW DPI (2015). Business Case: Modernising supply systems for effluent creeks – Murrumbidgee
River.

Page 98
B.19 Nimmie−Caira infrastructure modifications proposal
Description of works
The Nimmie-Caira forms part of the lower Murrumbidgee River system located north west of Balranald in southern NSW. This measure involves the conversion of the existing floodway-wetland-channel operations into a low maintenance, low operational requirements, fill and spill arrangement. Under this proposed arrangement, water will be delivered to ecological assets via the natural flow paths (creeks and floodways) that occupy the lowest elevations across the landscape, rather than the extensive channel system developed for agricultural purposes. The proposed arrangement provides for the effective and efficient watering of ecological assets and values by:
retaining levees that constrain the lateral extent of the floodways and wetlands, where appropriate
re-engineering existing embankments that have been built to store water in the floodways, which have resulted in the formation of the major wetlands at the site, including:
(i) lowering of the embankments (ii) the installation of overtopping spillways that are engaged as a component of a fill
and spill operation of the wetlands.
Proponent NSW
Resource units affected by the measure All surface water resource units in the southern Basin
Benchmark conditions
In order to be able to simulate a number of Sustainable Diversion Limit adjustment (SDLA) proposals it was necessary to increase the model resolution at various points in the Murrumbidgee. It was agreed with MDBA that NSW would build a single common SDLA benchmark model for the Murrumbidgee so that the proposals can be assessed from a common starting point (DHI, 2015a).
Modelled representation of the proposed changes
All NSW Murrumbidgee measures were incorporated into the adjusted benchmark model by NSW (DHI, 2016) in consultation with MDBA and accepted by the Technical Working Group. The updated model has been included into the MDBA’s modelling framework for assessing the package of the agreed measures. Modelling of this measure is based on the operation of the regulators described in NSW DPI (2015).
References:
DHI (2015a). Murrumbidgee SDLA – update of Benchmark model.
DHI (2016). Murrumbidgee SDLA – Project models.
NSW DPI (2015). Business Case: Nimmie-Caira infrastructure modification proposal.

Page 99
B.20 Murray and Murrumbidgee valley national parks SDL adjustment supply
measures
Description of works
This supply measure proposal consists of two elements, involving a package of works and other measures at point locations across two areas:
Yanga (Murrumbidgee Valley National Park) near Balranald on the lower Murrumbidgee River. This element consists of replacement and installation of regulators and culverts.
Millewa forest (Murray Valley National Park) near Deniliquin on the River Murray. This element consists of excavation of offtake and installation of regulator, culverts, spillways and causeways.
Proponent NSW
Resource units affected by the measure All surface water resource units in the southern Basin
Benchmark conditions
In order to be able to simulate a number of Sustainable Diversion Limit adjustment (SDLA) proposals it was necessary to increase the model resolution at various points in the Murrumbidgee. It was agreed with MDBA that NSW would build a single common SDLA benchmark model for the Murrumbidgee so that the proposals can be assessed from a common starting point (DHI, 2015a).
Modelled representation of the proposed changes
All NSW Murrumbidgee measures were incorporated into the adjusted benchmark model by NSW (DHI, 2016). For the Yanga component of this measure, the operating regime in NSW DPI (2015) has been used to develop the modelling of this measure in consultation with MDBA and accepted by the Technical Working Group. The Murray component was decided by Basin Officials Committee to not be included in the model. The updated Murrumbidgee model has been included into the MDBA’s framework for modelling assessment of the package of the agreed measures.
References:
DHI (2015a). Murrumbidgee SDLA – update of Benchmark model.
DHI (2016). Murrumbidgee SDLA – Project models.
NSW DPI (2015). Business Case: Murray and Murrumbidgee valley national parks SDL adjustment
supply measure.
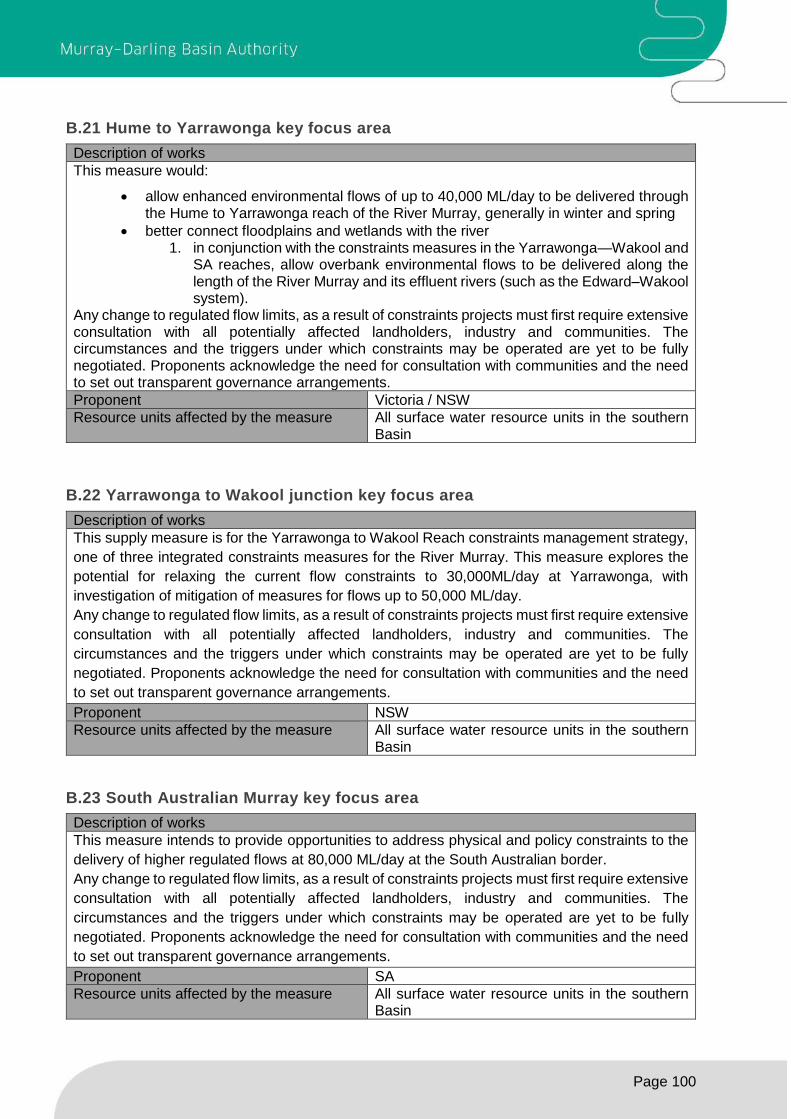
Page 100
B.21 Hume to Yarrawonga key focus area
Description of works
This measure would:
allow enhanced environmental flows of up to 40,000 ML/day to be delivered through the Hume to Yarrawonga reach of the River Murray, generally in winter and spring
better connect floodplains and wetlands with the river 1. in conjunction with the constraints measures in the Yarrawonga—Wakool and
SA reaches, allow overbank environmental flows to be delivered along the length of the River Murray and its effluent rivers (such as the Edward–Wakool system).
Any change to regulated flow limits, as a result of constraints projects must first require extensive consultation with all potentially affected landholders, industry and communities. The circumstances and the triggers under which constraints may be operated are yet to be fully negotiated. Proponents acknowledge the need for consultation with communities and the need to set out transparent governance arrangements.
Proponent Victoria / NSW
Resource units affected by the measure All surface water resource units in the southern Basin
B.22 Yarrawonga to Wakool junction key focus area
Description of works
This supply measure is for the Yarrawonga to Wakool Reach constraints management strategy,
one of three integrated constraints measures for the River Murray. This measure explores the
potential for relaxing the current flow constraints to 30,000ML/day at Yarrawonga, with
investigation of mitigation of measures for flows up to 50,000 ML/day.
Any change to regulated flow limits, as a result of constraints projects must first require extensive
consultation with all potentially affected landholders, industry and communities. The
circumstances and the triggers under which constraints may be operated are yet to be fully
negotiated. Proponents acknowledge the need for consultation with communities and the need
to set out transparent governance arrangements.
Proponent NSW
Resource units affected by the measure All surface water resource units in the southern Basin
B.23 South Australian Murray key focus area
Description of works
This measure intends to provide opportunities to address physical and policy constraints to the
delivery of higher regulated flows at 80,000 ML/day at the South Australian border.
Any change to regulated flow limits, as a result of constraints projects must first require extensive
consultation with all potentially affected landholders, industry and communities. The
circumstances and the triggers under which constraints may be operated are yet to be fully
negotiated. Proponents acknowledge the need for consultation with communities and the need
to set out transparent governance arrangements.
Proponent SA
Resource units affected by the measure All surface water resource units in the southern Basin

Page 101
B.24 Lower Darling key focus area
Description of works
This measure will complement the three Murray constraints proposals. This measure increases
outflows from Lake Menindee up to 14,000 ML/day to meet peak demands in the River Murray.
Any change to regulated flow limits, as a result of constraints projects must first require extensive
consultation with all potentially affected landholders, industry and communities. The
circumstances and the triggers under which constraints may be operated are yet to be fully
negotiated. Proponents acknowledge the need for consultation with communities and the need
to set out transparent governance arrangements.
Proponent NSW
Resource units affected by the measure All surface water resource units in the southern Basin
B.25 Murrumbidgee key focus area
Description of works
This supply measure is for the Murrumbidgee constraints management strategy and will improve
the ability to release water from storages to create higher flows along the Murrumbidgee River.
This measure explores the potential for relaxing the current flow constraints to 40,000ML/day at
Wagga Wagga.
Any change to regulated flow limits, as a result of constraints projects must first require extensive
consultation with all potentially affected landholders, industry and communities. The
circumstances and the triggers under which constraints may be operated are yet to be fully
negotiated. Proponents acknowledge the need for consultation with communities and the need
to set out transparent governance arrangements.
Proponent NSW
Resource units affected by the measure All surface water resource units in the southern Basin

Page 102
Appendix C - Modelled results (measure-by-measure)
Table 39 Key water balance results for the Murray and Lower Darling Valley
Water balance (GL/yr)
Benchmark Koondrook Perricoota
TLM
Gunbower TLM and
Gunbower National park
Hattah lakes
TLM and Hattah lakes North
Lindsay Island: Stage 1
and Stage 2
Chowilla TLM
Mulcra island and
Lock 8
Guttrum-Benwell
Vinifera- Nyah and
Burra Ck
Belsar-Yungera
Wallpolla and Lock
9 manipulati
on
SARFIP Rule change to Hume
dam airspace and pre-release
Flexible rate of
fall
Amendment to RMIF
callout
Rule change
for BMFEW
A
Menindee Lakes water saving project
Riverine Recovery project
Flow for Future
South East flow
restoration project
Inflow 13369 13369 13370 13369 13,369 13,370 13,369 13369 13369 13369 13369 13369 13370 13369 13378 13368 13371 13369 13369 13369
Diversion 2944 2950 2948 2952 2,941 2,932 2,938 2947 2944 2943 2943 2949 2944 2944 2943 2950 2934 2949 2943 2944
NSW Murray 1226 1233 1230 1235 1,226 1,218 1,222 1231 1227 1226 1226 1233 1227 1228 1220 1237 1245 1225 1226 1226
Victoria Murray 1196 1194 1197 1195 1,193 1,192 1,194 1195 1196 1195 1195 1195 1196 1195 1203 1191 1198 1196 1196 1196
SA Murray 481 482 481 481 481 481 481 481 481 481 481 481 481 481 479 482 482 488 481 481
Lower Darling 40 40 40 40 41 41 41 40 40 40 40 40 40 40 40 40 10 40 40 40
Loss 3403 3415 3406 3412 3,439 3,425 3,416 3401 3404 3398 3400 3401 3402 3403 3404 3399 3361 3397 3404 3403
Outflow 7090 7071 7083 7072 7,056 7,081 7,083 7088 7088 7095 7093 7087 7090 7089 7098 7086 7144 7090 7091 7090

Page 103
Table 40: Reach wise ecological score (Results are shown for minimum starting condition)
Assessment reach Bench- mark
Koond-rook
Perricoota TLM
Gunbower TLM
and Gunbow
er National
park
Hattah lakes
TLM and Hattah lakes North
Lindsay Island: Stage 1
and Stage 2
Chowilla TLM
Mulcra island
and Lock 8
Guttrum-Benwell
Vinifera- Nyah and
Burra Ck
Belsar-Yungera
Wallpolla and Lock
9 manipula
tion
SARFIP
Rule change to Hume
dam airspace and pre-release
Flexible rate of
fall
Amendment to RMIF callout
Rule change
for BMFEW
A
Menindee Lakes water saving project
Riverine Recovery
project
Flow for Future
South East flow
restoration project
Upper Murray 4980 4915 4996 4984 4980 4990 4921 5038 5000 5005 5005 5060 5034 4983 4993 5100 5065 5000 4980 4980
Upper Central Murray 5342 5657 5755 5361 5363 5379 5398 5434 5377 5346 5369 5361 5335 5365 5399 5348 5396 5346 5342 5342
Lower Central Murray 3308 3280 3289 3869 3308 3278 3278 3294 3308 3368 3294 3294 3298 3308 3297 3319 3308 3308 3308 3308
Lower Murray 3764 3742 3764 3716 3901 3933 3858 3781 3737 3781 3886 3895 3766 3737 3726 3764 3848 3726 3764 3764
Edward Wakool river system
4047 3959 4079 4070 4048 3971 3957 4033 4047 4047 4047 4033 4151 4047 4005 4014 4105 4047 4047 4047
Goulburn River 8077 8077 8077 8077 8077 8077 8077 8077 8077 8077 8077 8077 8077 8077 8077 8077 8077 8077 8077 8077
Lower Darling River 2685 2685 2685 2685 2685 2685 2685 2685 2685 2685 2685 2685 2685 2685 2685 2685 2695 2685 2685 2685
Mid- Murrumbidgee River
4487 4487 4487 4487 4487 4487 4487 4487 4487 4487 4487 4487 4487 4487 4487 4487 4487 4487 4487 4487
Lower Murrumbidgee River
6345 6345 6345 6345 6345 6345 6345 6345 6345 6345 6345 6345 6345 6345 6345 6345 6345 6345 6345 6345
Southern basin region score
4782 4794 4831 4844 4799 4794 4779 4797 4785 4793 4800 4804 4797 4782 4779 4793 4814 4780 4782 4782

Page 104
Table 41: Reach wise ecological score (Results are shown for medium starting condition)
Assessment reach Bench- mark
Koondrook Perricoota
TLM
Gunbower TLM and
Gunbower National
park
Hattah lakes
TLM and Hattah lakes North
Lindsay Island: Stage 1
and Stage 2
Chowilla TLM
Mulcra island and
Lock 8
Guttrum-Benwell
Vinifera- Nyah and
Burra Ck
Belsar-Yungera
Wallpolla and Lock 9 manipul
ation
SARFIP
Rule change to Hume
dam airspace and pre-release
Flexible rate of
fall
Amendment to RMIF callout
Rule change
for BMFEW
A
Menindee Lakes water saving project
Riverine Recovery
project
Flow for Future
South East flow
restoration
project
Upper Murray 5144 5055 5160 5123 5144 5155 5087 5177 5165 5170 5170 5212 5198 5147 5158 5240 5229 5165 5144 5144
Upper Central Murray 5496 5831 5913 5500 5503 5515 5538 5574 5533 5500 5506 5500 5489 5502 5557 5487 5546 5500 5496 5496
Lower Central Murray 3417 3389 3397 3982 3417 3387 3387 3403 3417 3478 3403 3403 3407 3417 3406 3428 3417 3417 3417 3417
Lower Murray 3874 3852 3874 3826 4017 4050 3971 3891 3847 3891 4003 4009 3876 3847 3835 3874 3958 3837 3874 3874
Edward Wakool river system 4207 4119 4239 4230 4208 4132 4091 4194 4207 4207 4207 4194 4311 4207 4165 4177 4249 4207 4207 4207
Goulburn River 8219 8219 8219 8219 8219 8219 8219 8219 8219 8219 8219 8219 8219 8219 8219 8219 8219 8219 8219 8219
Lower Darling River 2791 2791 2791 2791 2791 2791 2791 2791 2791 2791 2791 2791 2791 2791 2791 2791 2801 2791 2791 2791
Mid- Murrumbidgee River 4646 4646 4646 4646 4646 4646 4646 4646 4646 4646 4646 4646 4646 4646 4646 4646 4646 4646 4646 4646
Lower Murrumbidgee River 6502 6502 6502 6502 6502 6502 6502 6502 6502 6502 6502 6502 6502 6502 6502 6502 6502 6502 6502 6502
Southern basin region score 4922 4934 4971 4980 4938 4933 4915 4933 4925 4934 4938 4942 4938 4920 4920 4929 4952 4920 4922 4922

Page 105
Table 42 Reach wise ecological score (Results are shown for maximum starting condition)
Assessment reach Bench- mark
Koondrook Perricoota
TLM
Gunbower TLM and
Gunbower National
park
Hattah lakes
TLM and Hattah lakes North
Lindsay Island: Stage 1
and Stage 2
Chowilla TLM
Mulcra island and
Lock 8
Guttrum-Benwell
Vinifera- Nyah and
Burra Ck
Belsar-Yungera
Wallpolla and Lock
9 manipula
tion
SARFIP
Rule change to Hume
dam airspace and pre-release
Flexible rate of
fall
Amendment to RMIF callout
Rule change
for BMFEW
A
Menindee Lakes water saving project
Riverine Recovery
project
Flow for Future
South East flow
restoration project
Upper Murray 5231 5141 5246 5209 5230 5242 5174 5263 5251 5256 5256 5298 5284 5233 5245 5326 5315 5251 5231 5231
Upper Central Murray 5611 5980 6025 5616 5618 5631 5653 5687 5648 5615 5621 5616 5604 5617 5675 5603 5661 5615 5611 5611
Lower Central Murray 3535 3507 3516 4099 3535 3505 3505 3521 3535 3597 3521 3521 3525 3535 3524 3546 3535 3535 3535 3535
Lower Murray 3970 3949 3970 3922 4121 4146 4068 3987 3943 3987 4098 4108 3972 3943 3934 3970 4056 3933 3970 3970
Edward Wakool river system 4285 4197 4317 4308 4285 4208 4167 4271 4285 4285 4285 4271 4389 4285 4243 4255 4326 4285 4285 4285
Goulburn River 8219 8219 8219 8219 8219 8219 8219 8219 8219 8219 8219 8219 8219 8219 8219 8219 8219 8219 8219 8219
Lower Darling River 2874 2874 2874 2874 2874 2874 2874 2874 2874 2874 2874 2874 2874 2874 2874 2874 2884 2874 2874 2874
Mid- Murrumbidgee River 4864 4864 4864 4864 4864 4864 4864 4864 4864 4864 4864 4864 4864 4864 4864 4864 4864 4864 4864 4864
Lower Murrumbidgee River 6582 6582 6582 6582 6582 6582 6582 6582 6582 6582 6582 6582 6582 6582 6582 6582 6582 6582 6582 6582
Southern basin region score 5019 5035 5068 5077 5036 5030 5012 5030 5022 5031 5036 5039 5035 5017 5018 5027 5049 5017 5019 5019

Page 106
Table 43: River salinity
Average Salinity (EC) Bench-mark
Koondrook
Perricoota TLM
Gunbower TLM
and Gunbow
er National
park
Hattah lakes
TLM and Hattah lakes North
Lindsay Island: Stage 1
and Stage 2
Chowilla TLM
Mulcra island
and Lock 8
Guttrum-Benwell
Vinifera- Nyah and
Burra Ck
Belsar-Yungera
Wallpolla and Lock
9 manipula
tion
SARFIP
Rule change to Hume
dam airspace and pre-release
Flexible rate of
fall
Amendment to RMIF callout
Rule change
for BMFEW
A
Menindee Lakes water saving project
Riverine Recovery project
Flow for Future
South East flow restorati
on project
Yarrawonga 64 64 64 64 64 64 64 64 64 64 64 64 64 64 64 64 64 64 64 64
Torrumbarry 133 134 134 133 133 133 133 134 133 134 133 134 133 133 134 133 134 133 133 133
Swan Hill 267 270 269 268 268 269 269 268 267 268 267 268 268 268 268 270 270 267 267 267
Stevens Weir 84 84 84 84 84 84 84 84 84 84 84 84 84 84 84 84 84 84 84 84
Kyalite 318 312 316 316 319 318 318 317 318 316 317 315 319 318 319 321 321 316 318 318
Wakool Junction 278 278 278 277 278 279 278 278 277 278 277 277 278 278 278 280 281 277 278 278
Red Cliffs 298 298 298 298 298 299 298 297 297 297 297 297 298 298 298 300 302 297 298 298
Merbein 314 314 314 314 314 315 315 313 314 313 313 314 314 314 314 318 319 313 314 314
Lock 9 340 342 341 340 341 341 341 340 340 340 340 340 340 341 341 343 344 339 340 340
Renmark 373 374 373 372 379 381 374 373 373 373 373 373 372 373 372 374 378 372 373 373
Berri 397 398 398 396 404 406 399 397 397 397 397 397 396 397 395 398 403 396 397 397
Morgan 443 443 443 441 449 451 444 442 442 442 442 442 441 443 440 444 448 440 443 443
Morgan 95th percentile 719 723 718 713 732 739 727 724 719 724 717 718 717 719 719 718 740 715 719 719
Murray Bridge 459 460 459 457 466 468 462 459 458 459 459 459 458 459 458 463 461 457 459 459
Milang 530 531 530 530 534 535 531 529 530 529 529 530 530 530 529 530 529 529 529 530
Weir 32 486 489 490 480 514 514 514 486 487 486 485 485 487 485 487 499 476 483 486 486
Burtundy 481 483 486 478 505 506 505 481 482 481 482 480 481 482 484 495 474 481 481 481
Anabranch Outflow 494 494 493 497 514 520 520 493 496 493 497 491 501 495 500 514 506 491 494 494

Page 107
Table 44: Coorong, lower lakes and Murray mouth indicators
CLLMM indicators Bench- mark
Koondrook
Perricoota TLM
Gunbower TLM
and Gunbow
er National
park
Hattah lakes TLM and
Hattah lakes North
Lindsay Island: Stage 1
and Stage 2
Chowilla TLM
Mulcra island and
Lock 8
Guttrum-Benwell
Vinifera- Nyah and
Burra Ck
Belsar-Yunger
a
Wallpolla and Lock 9 manipul
ation
SARFIP
Rule change
to Hume dam
airspace and pre-
release
Flexible rate of
fall
Amendment to RMIF callout
Rule change
for BMFEW
A
Menindee
Lakes water saving project
Riverine Recovery project
Flow for Future
South East flow
restoration
project
Maximum salinity in south Coorong (g/L) 118 124 116 117 115 120 124 105 118 112 117 121 115 116 107 120 98 115 118 109
Percentage of years maximum salinity in south Coorong < 100 g/L
99 97 98 99 98 98 98 99 99 99 99 97 99 99 98 97 100 99 99 99
Maximum period south Coorong salinity > 130 g/L (days)
0 0 0 0 0 0 0 0 0 - - 0 0 0 0 0 0 0 0 0
Average salinity in south Coorong (g/L) 43 43 43 43 43 43 43 43 43 43 43 43 43 43 43 43 43 43 43 41
Maximum salinity in north Coorong (g/L) 67 70 63 66 64 70 67 55 66 65 67 63 66 66 54 67 49 66 67 64
Maximum period north Coorong salinity > 50 g/L (days) 121 126 121 134 113 142 146 59 118 113 122 141 144 128 71 126 0 146 122 114
Average salinity in north Coorong (g/L) 22 22 22 22 22 22 22 22 22 22 22 22 22 22 22 22 22 22 22 22
Percentage of days when Salinity in Lake Albert > 2000 EC
0 0 - 0 0 1 0 0 0 0 0 0 0 0 0 0 0 0 0 0
Percentage of days when Salinity in Lake Alexandrina > 1000 EC
1 2 1 1 1 2 2 1 1 1 1 1 1 1 1 1 1 1 1 1
Percentage of time when Lake Alexandrina level < 0.4 m
6 7 6 6 6 6 6 6 6 6 6 6 6 6 7 7 6 7 6 6
Percentage of years 3yr rolling average Barrage flow > 1,000 GL/y
99 99 99 99 99 99 99 99 99 99 99 99 99 99 99 99 99 99 99 99
Percentage of years 3yr rolling average Barrage flow > 2,000 GL/y
98 97 98 98 97 97 97 98 98 98 98 97 98 98 98 98 98 98 98 98
Percentage of years 10yr rolling average Barrage flow > 3,200 GL/y
99 99 99 99 99 99 99 99 99 99 99 99 99 99 99 99 99 99 99 99
Percentage of years annual Barrage flow > 2,000 GL/y 86 86 86 86 84 84 84 86 86 86 86 86 86 86 86 87 86 85 86 86

Page 108
Table 45: Site specific environmental water use
Accounted water use
(GL/yr)
Benchmark Koondrook Perricoota TLM
Gunbower TLM and Gunbower National park
Hattah lakes TLM and Hattah
lakes North
Lindsay Island: Stage 1 and
Stage 2
Chowilla TLM Mulcra island and Lock 8
Guttrum-Benwell
Vinifera- Nyah and Burra Ck
Belsar-Yungera Wallpolla and Lock 9
manipulation
SARFIP
Koondrook-Perricoota
0.0 38.3 0.1 0.0 0.0 0.0 0.0 0.0 0.0 0.0 0.0 0.0
Gunbower National Park
0.0 0.0 0.2 0.0 0.0 0.0 0.0 0.0 0.0 0.0 0.0 0.0
Gunbower Forest 0.0 0.0 19.7 0.0 0.0 0.0 0.0 0.0 0.0 0.0 0.0 0.0
Gutturm-Benwell Forest
0.0 0.0 0.0 0.0 0.0 0.0 0.0 2.8 0.0 0.0 0.0 0.0
Vinifera Forest 0.0 0.0 0.0 0.0 0.0 0.0 0.0 0.0 0.4 0.0 0.0 0.0
Nyah Forest 0.0 0.0 0.0 0.0 0.0 0.0 0.0 0.0 0.8 0.0 0.0 0.0
Burra Creek 0.0 0.0 0.0 0.0 0.0 0.0 0.0 0.0 0.2 0.0 0.0 0.0
Belsar-Yungera Forest
0.0 0.0 0.0 0.0 0.0 0.0 0.0 0.0 0.0 0.2 0.0 0.0
Hattah Lakes 0.0 0.0 0.0 20.7 0.0 0.0 0.0 0.0 0.0 0.0 0.0 0.0
Lindsay Island: Stage 1 and Stage 2
0.0 0.0 0.0 0.0 38.0 0.0 0.0 0.0 0.0 0.0 0.0 0.0
Mulcra Island including Lock 8 raising
0.0 0.0 0.0 0.0 0.0 0.0 2.8 0.0 0.0 0.0 0.0 0.0
Wallpolla Island including Lock 9 raising
0.0 0.0 0.0 0.0 0.0 0.0 0.0 0.0 0.0 0.0 9.9 0.0
Chowilla Floodplain
0.0 0.0 0.0 0.0 0.0 20.7 0.0 0.0 0.0 0.0 0.0 0.0
Pike-Katarapko Floodplain
0.0 0.0 0.0 0.0 0.0 0.0 0.0 0.0 0.0 0.0 0.0 55.6
CLLMM 94.6 89.2 93.5 93.5 93.3 81.9 94.3 94.8 93.9 95.7 95.1 82.4
Total 94.6 127.5 113.5 114.2 131.2 102.6 97.0 97.6 95.3 95.9 105.0 138.0

Page 109
Table 46: Percentage of years works is operated
Site Works operation Benchmark Koondrook Perricoota
TLM
Gunbower TLM and Gunbower National park
Hattah lakes TLM and Hattah
lakes North
Lindsay Island: Stage 1
and Stage 2
Chowilla TLM
Mulcra island and Lock 8
Guttrum-Benwell
Vinifera- Nyah and Burra Ck
Belsar-Yungera
Wallpolla and Lock 9
manipulation
SARFIP
Koondrook-Perricoota Forest
Wetland watering 32 57 32 32 32 32 32 32 32 32 32 32
Red-Gum watering 25 32 25 25 25 25 25 25 25 25 25 25
Bird breeding watering 25 41 25 25 25 25 25 25 25 25 25 25
Gunbower Forest Wetland watering 68 68 92 68 68 68 68 68 68 68 68 68
Red-Gum watering 32 32 60 32 32 32 32 32 32 32 32 32
Bird breeding watering 54 54 33 54 54 54 54 54 54 54 54 54
Gunbower National Park
Wetland watering 17 17 86 17 16 15 16 17 17 17 17 15
Baggot creek option 17 17 39 17 16 15 16 17 17 17 17 15
Old Cohuna option 25 25 42 25 25 25 25 25 25 25 25 25
Guttrum-Benwell Forest
Guttrum: wetland watering 64 64 64 64 64 63 64 74 64 64 64 64
Guttrum: Red-Gum watering
48 47 48 47 48 48 48 56 47 47 47 47
Benwell: wetland watering 70 69 70 70 70 69 70 76 70 70 70 70
Benwell: Red-Gum watering
56 56 57 56 56 57 57 65 56 57 57 56
Vinifera Forest
Intermediate inundation 46 45 47 46 47 47 46 45 65 46 46 46
Maximum inundation 59 58 59 59 59 57 58 59 62 59 59 59
Nyah Forest
Intermediate inundation 36 35 34 36 38 38 38 36 70 37 36 36
Maximum inundation 34 34 35 34 36 36 36 35 52 35 35 34
Burra Creek
Intermediate inundation 4 4 4 4 4 4 4 4 11 4 4 4
Maximum inundation 0 0 0 0 0 0 0 0 0 0 0 0
Belsar-Yungera Forest
Intermediate inundation 43 42 43 43 43 43 43 42 43 61 43 43
Maximum inundation 11 11 11 11 11 11 11 11 11 27 11 11
Maximum+Pump to lakes inundation
4 4 4 4 4 4 4 4 4 18 4 4
Hattah Lakes Central lakes: intermediate inundation
25 25 25 86 24 24 24 24 25 24 24 24
Central lakes: top-up to maximum inundation
24 24 24 68 22 22 22 23 24 23 23 23
Lake Kramen watering 14 14 14 23 14 14 14 14 14 14 14 14
Chalka North watering 15 14 15 16 15 14 15 15 16 15 15 15

Page 110
Site Works operation Benchmark Koondrook Perricoota
TLM
Gunbower TLM and Gunbower National park
Hattah lakes TLM and Hattah
lakes North
Lindsay Island: Stage 1
and Stage 2
Chowilla TLM
Mulcra island and Lock 8
Guttrum-Benwell
Vinifera- Nyah and Burra Ck
Belsar-Yungera
Wallpolla and Lock 9
manipulation
SARFIP
Bitterang North to Dry Lakes 4 4 4 11 4 4 4 4 4 4 4 4
Lindsay Island: Stage 1 and stage 2
Fresh 15 15 16 15 89 17 17 16 15 16 16 16
Berribee intermediate 34 33 32 33 50 35 36 34 33 34 34 34
Berribee Maximum 11 11 11 11 32 11 11 11 11 11 11 11
Berribee Maximum + Pumping
3 3 3 3 13 3 3 3 3 3 3 3
Mulcra Island Potterwalkagee Creek 25 25 25 24 25 25 52 25 25 25 25 25
Wallpolla Island Mid Forest inundation 27 26 27 26 25 27 25 27 27 27 33 27
Mid+Upper Forest inundation
12 12 12 12 12 12 12 12 12 12 14 12
Mid+Upper Forest inundation+Pump to lakes
10 10 10 10 10 10 10 10 10 10 14 10
Chowilla Floodplain
Fresh 37 37 36 36 37 56 37 37 37 38 37 36
Low inundation 37 37 36 36 37 48 37 37 37 38 37 36
Intermediate inundation 37 37 36 36 37 35 37 37 37 38 37 36
Maximum inundation 0 11 11 11 11 19 11 11 11 11 11 11
SARFIP
Pike operation 10 10 10 10 12 12 10 12 10 12 12 28
Katarapko operation 11 11 11 11 11 11 11 11 11 11 11 31