modelling and simulation of gold ore leaching - saimm · modelling and simulation of gold ore...
TRANSCRIPT
MODELLING AND SIMULATION OF GOLD ORE LEACHING 51
NomenclatureAA: Anodic surface areaAC: Cathodic surface area: Ore gold concentration : Ore gold concentration before cyanidation begins: Cyanide concentration in solution: Ore copper concentration.dg: Length of cubic gold grain sidesdp: Length of cubic ore particle sides: Cyanide diffusivity: Oxygen diffusivityK: Constant factor used to approximate hindered
transport through pores: Kinetic rate constant associated to copper-bearing
mineralsKinetic rate constant associated with sulphur-bearing minerals Kinetic rate constant associated with cyanide diffusion
: Gold molecular weight: Mass of partially liberated gold : Mass of totally liberated gold : Mass of gold in the liquid phase : Mass of gold accessible through ore porosity: Mass of gold cyanide added to the leaching thank: Total mass of liquid in the leaching thankN: Number of totally liberated gold grains: Oxygen concentration: Proportion of inaccessible gold grains: Proportion of totally liberated gold grains: Proportion of gold grains accessible through ore
porosity: Proportion of gold grains accessible at the ore
surface
R: Oxygen efficiency
: Ore sulphur concentration.: Surface of gold particle available for chemical
reaction: Surface of partially exposed gold grains: Surface of totally liberated gold grains: Molar rate of gold dissolution per unit of gold
surface available to reaction: Molar rate of partially exposed gold dissolution
per unit of gold surface available to reaction: Molar rate of dissolution for gold accessible
through ore porosity expressed per unit of gold surface available to reaction
: Percentage of ore in class of average diameter dpμg: Mean of gold size distribution : Cyanide consumption per unit of time and mass of
liquid : Molar diffusion rate of cyanide: Molar diffusion rate of oxygen: Mass dissolution rate of partially liberated gold: Mass dissolution rate of totally liberated gold: Mass dissolution rate of gold accessible through
ore porosityσ0: Thickness of the boundary layerσ1: Distance between gold surface and bulk solutionσg: Standard deviation of gold size distributionσp: Threshold distance from the ore surface above
which gold grains are not accessible to chemical attack by cyanide.
: Gold density
IntroductionLeaching by cyanide solution is widely used as a separationmethod to recover gold from ores. Different processes canbe used to perform this chemical separation. Some rely on
Bellec S., Hodouin D., Bazin C., Khalesi M. R. and Duchesne C. Modelling and simulation of gold ore leaching. World Gold Conference 2009, The SouthernAfrican Institute of Mining and Metallurgy, 2009.
Modelling and simulation of gold ore leaching
S. BELLEC*, D. HODOUIN*, C. BAZIN*, M.R. KHALESI*, C. DUCHESNE†
*Department of mining, metallurgical and material engineering†Department of chemical engineering
Laval University, Quebec, QC, Canada
A leaching model for gold ore that takes into account the impact of cyanide and oxygenconcentrations as well as gold surface exposure on leaching performance is developed. Cyanideconsumption is estimated by an empirical model that is a function of ore particles size distributionas well as cyanide, copper and sulphur concentrations. The proposed model has been validated bydata from laboratory leaching tests on the Sleeping Giant gold mine ore.
Keywords: gold leaching, modelling, exposure surface.
Paper 8:Paper 8 10/15/09 4:26 PM Page 51

WORLD GOLD CONFERENCE 200952
the exposure of gold surfaces to enhance dissolutionkinetic. In this type of process, the ore is crushed andground to expose the surface of gold grains to a chemicalattack by cyanide in presence of oxygen. This chemicalreaction produces a soluble complex of gold cyanide whichis subsequently recovered by adsorption or cementation.Others use an approach, called heap leaching, whichconsists of spraying a cyanide solution on a roughlycrushed ore pile. In this approach, cyanide and oxygendiffuse slowly through the pores and fractures of the ore toreach gold surfaces.
Several authors studied gold dissolution kinetics. Someconsidered pore diffusion transport in heap leaching(Prosser1, Bouffard and Dixon2) while others addressed theleaching problem by the concept of gold surface liberation.In those conditions, experimental results showed areduction of leaching kinetics as the chemical reactionadvances. To model that behaviour, many authors (Brittan3,Nicol et al.4, Hodouin et al.5, Ling et al.6) proposedmathematical equations based on the evolution of leachablegold concentration. When it decreases, the chemicalreactions rates slow down. Changes in the kineticmechanisms are also proposed to explain the slowing downeffect. The initial reaction may be governed by diffusionthrough boundary layers if pulp agitation is not sufficientlyvigorous (Brittan7) while it is controlled by diffusionthrough ore porosity in the later stages. Habashi8 presenteda gold dissolution model based on an electrochemicalmechanism as well as cyanide and oxygen diffusivitiesthrough a boundary layer. Rubisov et al.9 applied thatdiffusion model to pure gold by adding a stoichiometricfactor representing the number of leached gold moles permole of consumed oxygen. Crundwell and Godorr10
proposed a model that considers the formation of apassivation layer of materials on the surface of goldparticles as they dissolved. De Andrade Lima andHodouin11 went one step further by including the effect ofparticle size in the kinetic model. This indirectly takes intoaccount the liberation effect on leaching behaviour.
This paper proposes a kinetic model that takes intoaccount the fast rate of dissolution of exposed gold surfacesand slower one of gold accessible through ore porosity. Thereduction of leaching kinetic is explained by thedisappearance of exposed gold surfaces as the reactionevolves. This approach first requires a geometrical model todescribe the surface liberation phenomena. This model ispresented and explained in Section 2. Section 3 introducesthe leaching model, while Section 4 proposes an empiricalcyanide consumption model. Finally, the model iscalibrated and validated on batch leaching tests.
Gold grain surface accessibility to reagentsDepending on their degree of accessibility, gold grains havedifferent leaching kinetics. When gold is directly exposedto the surrounding phase it has a fast leaching kinetic. Onthe other hand, gold attacked through ore porosity, like inheap leaching, exhibits slow dissolution kinetics. Figure 1shows four different classes of gold, each one having adifferent leaching behaviour. One can see that gold can betotally liberated, accessible at the ore surface or throughpores. The fourth class contains inaccessible gold whichcannot be leached. The differences in leaching behaviour oftotally liberated gold and exposed gold at the ore surface isdue to the fact that the first one offers more accessiblesurface to cyanide. The slow kinetics of gold accessible
through ore porosity is related to the hindered transport ofcyanide to the reaction site.
Gold liberation (or accessibility) has an important impacton leaching kinetics; therefore, it is interesting to be able tocharacterize it. Many authors have developed mathematicalmodels for the liberation of minerals such as those proposedby Wiegel and Li12, King13, 14, Barbery15, Gay16,Stamboliadis17. Unfortunately the applicability of thosemodels for estimation of gold exposure properties islimited, since most of them were developed for mineralconcentrations significantly larger than those observed forgold ores and with a non-preferential breakage assumptionwhich is not applicable due to gold grains ductility. Becauseof such particularities, only a few studies on the liberationof gold are available. Lorenzen and Deventer18 modifiedKing’s14 model by adding an empirical term that accountsfor the fraction of leachable gold that is not directlyexposed to cyanide. Wen et al.19 developed a cubicexposure model to predict the proportion of exposedinclusive gold. This section proposes a simple geometricmodel to characterize the proportions of free gold grain,exposed inclusive gold as well as inclusive leachable goldthrough ore fractures or porosity.
Based on simple geometrical assumptions for gold grainsand ore particle shape size and distribution, it is possible toapproximate the gold surface degree of exposure and itsaccessibility through ore porosity. Those assumptions are:
• Ore particle shape is approximated by cube of sidedp
• Gold grains are approximated by cubes of side dg• Gold grain orientation is the same as the ore particle
orientation; therefore the cubes edges are parallel• The space distribution of gold grain centres inside
ore particles is uniform• Gold is unbreakable, therefore fragmentation is
intergranular • Total liberation of gold grains occurs when at least
50% of the volume of gold is out of an ore particle • Gold grains positioned farther than a threshold
distance (�p) from the ore surface are not accessibleto chemical attack by cyanide.
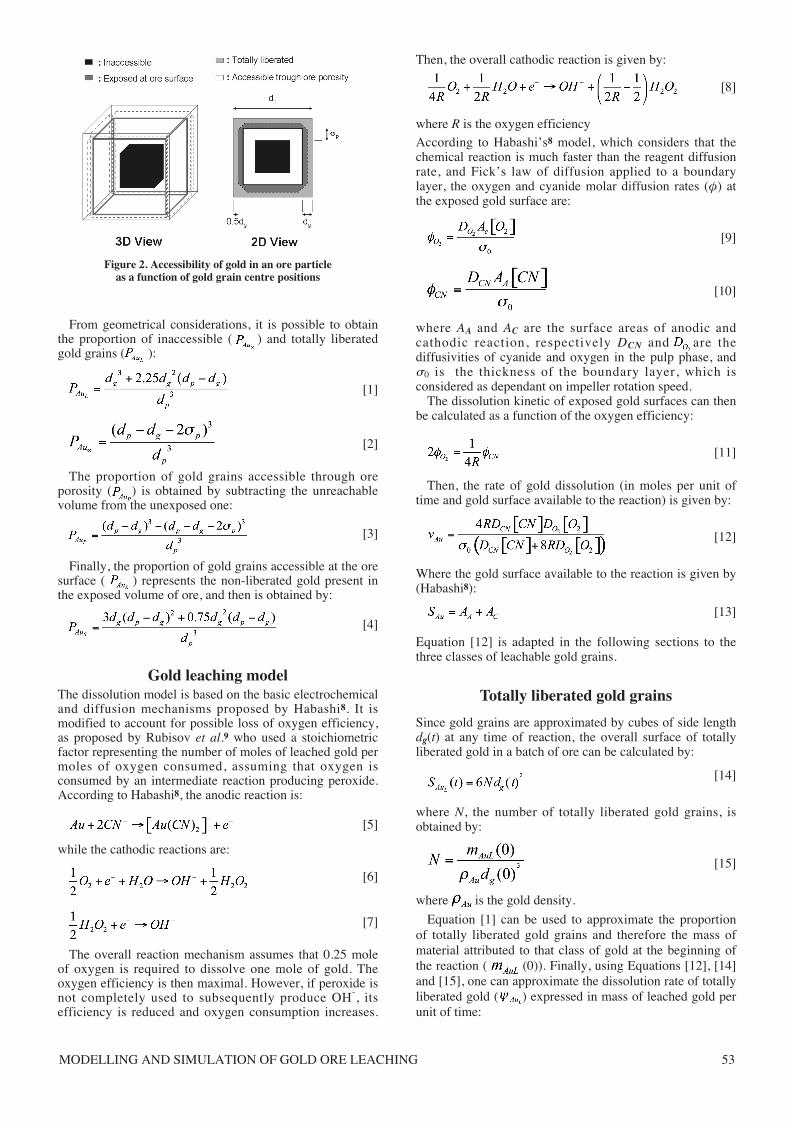
According to those assumptions, Figure 2 shows thedifferent zones where gold grains centres can be positioned.The centre position influences the degree of goldleachability, a property related to gold surface accessibilityto reagents.
Figure 1. Classes of gold according to their degree of accessibilityfor leaching
Paper 8:Paper 8 10/15/09 4:26 PM Page 52
MODELLING AND SIMULATION OF GOLD ORE LEACHING 53
From geometrical considerations, it is possible to obtainthe proportion of inaccessible ( ) and totally liberatedgold grains ( ):
[1]
[2]
The proportion of gold grains accessible through oreporosity ( ) is obtained by subtracting the unreachablevolume from the unexposed one:
[3]
Finally, the proportion of gold grains accessible at the oresurface ( ) represents the non-liberated gold present inthe exposed volume of ore, and then is obtained by:
[4]
Gold leaching modelThe dissolution model is based on the basic electrochemicaland diffusion mechanisms proposed by Habashi8. It ismodified to account for possible loss of oxygen efficiency,as proposed by Rubisov et al.9 who used a stoichiometricfactor representing the number of moles of leached gold permoles of oxygen consumed, assuming that oxygen isconsumed by an intermediate reaction producing peroxide.According to Habashi8, the anodic reaction is:
[5]
while the cathodic reactions are:
[6]
[7]
The overall reaction mechanism assumes that 0.25 moleof oxygen is required to dissolve one mole of gold. Theoxygen efficiency is then maximal. However, if peroxide isnot completely used to subsequently produce OH-, itsefficiency is reduced and oxygen consumption increases.
Then, the overall cathodic reaction is given by:
[8]
where R is the oxygen efficiencyAccording to Habashi’s8 model, which considers that thechemical reaction is much faster than the reagent diffusionrate, and Fick’s law of diffusion applied to a boundarylayer, the oxygen and cyanide molar diffusion rates (φ) atthe exposed gold surface are:
[9]
[10]
where AA and AC are the surface areas of anodic andcathodic reaction, respectively DCN and are thediffusivities of cyanide and oxygen in the pulp phase, and�0 is the thickness of the boundary layer, which isconsidered as dependant on impeller rotation speed.
The dissolution kinetic of exposed gold surfaces can thenbe calculated as a function of the oxygen efficiency:
[11]
Then, the rate of gold dissolution (in moles per unit oftime and gold surface available to the reaction) is given by:
[12]
Where the gold surface available to the reaction is given by(Habashi8):
[13]
Equation [12] is adapted in the following sections to thethree classes of leachable gold grains.
Totally liberated gold grains
Since gold grains are approximated by cubes of side lengthdg(t) at any time of reaction, the overall surface of totallyliberated gold in a batch of ore can be calculated by:
[14]
where N, the number of totally liberated gold grains, isobtained by:
[15]
where is the gold density.
Equation [1] can be used to approximate the proportionof totally liberated gold grains and therefore the mass ofmaterial attributed to that class of gold at the beginning ofthe reaction ( (0)). Finally, using Equations [12], [14]and [15], one can approximate the dissolution rate of totallyliberated gold ( ) expressed in mass of leached gold perunit of time:
Figure 2. Accessibility of gold in an ore particle as a function of gold grain centre positions
Paper 8:Paper 8 10/15/09 4:26 PM Page 53
WORLD GOLD CONFERENCE 200954
[16]
where is the molecular weight of gold.
Exposed gold at the ore surfaceThe kinetic behaviour of gold exposed on the ore surface issimilar to the one of completely liberated gold grains. Themajor difference between the two classes of gold, is that theaccessible surface of partially liberated gold is muchsmaller. The area of these surfaces follows a distributiondependent on the position of gold grain centers in the oreparticle. However, to simplify modelling equations andsimulations algorithms, this surface is approximated by:
[17]
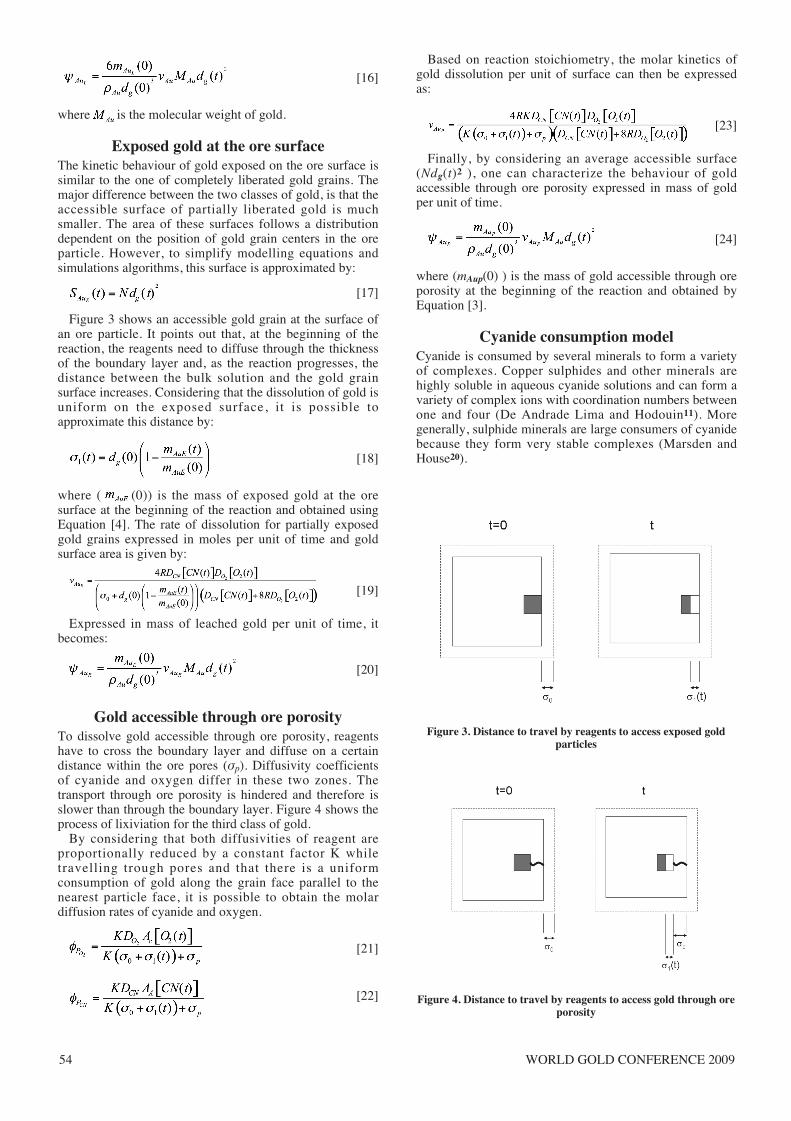
Figure 3 shows an accessible gold grain at the surface ofan ore particle. It points out that, at the beginning of thereaction, the reagents need to diffuse through the thicknessof the boundary layer and, as the reaction progresses, thedistance between the bulk solution and the gold grainsurface increases. Considering that the dissolution of gold isuniform on the exposed surface, it is possible toapproximate this distance by:
[18]
where ( (0)) is the mass of exposed gold at the oresurface at the beginning of the reaction and obtained usingEquation [4]. The rate of dissolution for partially exposedgold grains expressed in moles per unit of time and goldsurface area is given by:
[19]
Expressed in mass of leached gold per unit of time, itbecomes:
[20]
Gold accessible through ore porosityTo dissolve gold accessible through ore porosity, reagentshave to cross the boundary layer and diffuse on a certaindistance within the ore pores (σp). Diffusivity coefficientsof cyanide and oxygen differ in these two zones. Thetransport through ore porosity is hindered and therefore isslower than through the boundary layer. Figure 4 shows theprocess of lixiviation for the third class of gold.
By considering that both diffusivities of reagent areproportionally reduced by a constant factor K whiletravelling trough pores and that there is a uniformconsumption of gold along the grain face parallel to thenearest particle face, it is possible to obtain the molardiffusion rates of cyanide and oxygen.
[21]
[22]
Based on reaction stoichiometry, the molar kinetics ofgold dissolution per unit of surface can then be expressedas:
[23]
Finally, by considering an average accessible surface(Ndg(t)2 ), one can characterize the behaviour of goldaccessible through ore porosity expressed in mass of goldper unit of time.
[24]
where (mAup(0) ) is the mass of gold accessible through oreporosity at the beginning of the reaction and obtained byEquation [3].
Cyanide consumption modelCyanide is consumed by several minerals to form a varietyof complexes. Copper sulphides and other minerals arehighly soluble in aqueous cyanide solutions and can form avariety of complex ions with coordination numbers betweenone and four (De Andrade Lima and Hodouin11). Moregenerally, sulphide minerals are large consumers of cyanidebecause they form very stable complexes (Marsden andHouse20).
Figure 3. Distance to travel by reagents to access exposed goldparticles
Figure 4. Distance to travel by reagents to access gold through oreporosity
Paper 8:Paper 8 10/15/09 4:26 PM Page 54

MODELLING AND SIMULATION OF GOLD ORE LEACHING 55
It is difficult to develop a rigorous cyanide consumptionmodel due to the impressive variety of complexes that canbe formed with cyanide. De Andrade Lima and Hodouin11
proposed a pseudo-homogenous empirical model todescribe the cyanide consumption process. Their modeltakes into account cyanide concentration and ore particlesize. This section introduces a model which takes intoaccount these two variables as well as the copper ( ) andsulphur ( ) concentrat ions in the ore. Cyanideconsumption ( ) per unit of time and mass of liquid forore particles of size dp is given by:
[25]
The first term roughly corresponds to the dissolution ofcopper-bearing minerals (mainly chalcopyrite in the studiedexample), the second one to the sulphur-bearing mineralswhich produces sulphur-cyanide complexes, and the thirdone to all other cyanide consumption assumed to bediffusion controlled and particle size sensitive. Cyanideconsumption by copper and sulphide is also related to theextent of surface accessibility and therefore are particle sizesensitive. This is considered in the following relationshipsfor estimating dissolution rate constants:
[26]
[27]
These equations also contain a slowing down effect thatmodels the reduced leaching rate related to disappearanceof easily accessible cyanicide surfaces. As this effect isdifficult to quantify, it is empirically correlated to golddissolution extent, where [Au]s is the ore gold concentrationand [Au0]s is the gold concentration prevailing beforecyanidation begins. The coefficients Kc1, Kc2, Kc11, Kc22,α1, α2, β1, β2, λ1, λ2, θ1, θ2 and θ3 are parameters to beestimated from experimental data.
Application to batch leachingBatch leaching tests were performed with the SleepingGiant gold mine ore. Twelve tests were performed on a pre-aerated and ground ore (50% passing 38 micrometers).Leaching was carried out at pH 11, at 50% solid, with a 600ppm initial cyanide concentration and a saturated oxygenconcentration maintained by constant injection of O2.Liquid samples were regularly collected to dose cyanideand gold concentrations. After each liquid sampling,cyanide was added to the leaching tank for maintainingcyanide concentration near its initial value. Figure 5summarizes the twelve tests performed at four differentagitation speeds, and their initial conditions.
The equations presented in earlier sections are written fora unique dimension of gold grain size (dg). If the gold grainsize distribution is known, these equations can be extendedto a multigrain distribution. The mineralogical properties ofthe Sleeping Giant ore used for the leaching tests werecharacterized and 307 gold grains were identified. Figure 6shows the density distribution in numbers of gold grainsaccording to their diameter as well as an approximation ofit by a gamma distribution. This distribution coupled withthe liberation and leaching equations is used to calibrate themodel parameters.
Batch leaching simulation equations are obtained bywriting species mass balance equations. Using the kineticexpressions for the three classes of gold (liberated, exposedand accessible through pores) in the solid phase, oneobtains:
[28]
[29]
[30]
Gold mass balance in the liquid phase is therefore obtainedby:
[31]
where (t) is the mass of gold in the liquid phase at timet. Cyanide balance equation is obtained using theconsumption model for five ore sizes (dp) (<38 μm, 38–45 μm, 45–75 μm, 75–150 μm and >150 μm):
[32]
Figure 5. Leaching tests initial conditions
Figure 6. Density distribution gold grains for the Sleeping Giantgold mine ore
Paper 8:Paper 8 10/15/09 4:26 PM Page 55

WORLD GOLD CONFERENCE 200956
where xdp is the mass fraction of ore in class of averagediameter dp, mCN(t) is the mass of cyanide added to thereactor at time t and mliq is the mass of liquid in theleaching tank.
Model calibrationThe model parameters were estimated using the dataobtained for batch tests as well as the above simulation andliberation equations. The results of only nine tests wereused, keeping the others for validation: the two leachingtests at 1500 rpm as well as the 1-hour and 4-hour tests atthe three other agitation speeds. The twenty-fourparameters characterizing the equations are estimated by anon-linear least square regression method minimizing thesum of squared differences between the gold and cyanideconcentrations obtained experimentally and by simulation.In total, 164 measurements are used to approximate theparameters. Figure 7 summarizes the methodology used tocalibrate the model. The model parameter estimates arepresented in Table I. D is the product of two parameters (Rand DO2). As it can be seen in the leaching kineticequations, those two parameters cannot be estimatedindependently. μg and σg are respectively the mean andstandard deviation of the beta distribution used toapproximate the gold size distribution. The variation ofsigma zero with the impeller rotation speed confirms thatexternal diffusion is a dominant kinetic mechanism.
Figures 8 and 9 respectively compare the gold andcyanide concentrations in the liquid phase obtained bysimulation to the experimental data for the tests at 1200,1350, 1500 and 1650 rpm. One can see that simulatedbehaviours are reasonably fitting the measured values. Thesaw tooth behaviour of the cyanide consumption model iscaused by punctual addition of cyanide in the leachingthank.
Model validationTo validate the proposed model, the three 2-hour lengthcyanidation tests at 1200, 1350 and 1650 rpm are simulatedwith the calibrated parameters. Since those three tests werenot used to calibrate the model, the simulations results are
considered as predictions. Figures 10 and 11 respectivelycompare the results predicted by the model with themeasured liquid concentrations of gold and cyanide. Theagitation speed of the stirrer influences the dissolution rateof gold but not the overall gold leachability. The largedifference in final gold liquid concentration at 1600 rpmand other agitation speeds is due to the different initialconcentrations of gold (see Figure 5) and their respectiveproportion of inaccessible gold grains.
From those results, one can see that the calibrated modelcan be use to predict the leaching behaviour of a gold orebased on its gold grain size distribution and a geometricliberation model.
ConclusionsThis paper proposed a leaching model based on gold surfacesaccessibilities and controlled by reagent diffusivities to thereaction site. The model allows an adequate prediction ofgold dissolution and cyanide consumption for the studied ore.The integration of the model in a steady state simulator
Table INumerical values of estimated parameters
Figure 7. Methodology used to approximate models parameters
μmθ1
μmσp
μg
σg
μm
μm
μm2/min
μm2/min
μm
μm
μm
μm
σ0.1200
σ0.1350
σ0.1500
σ0.1650
μmθ2
μmθ3+1/min
θ1
θ2
θ3
β1
β2
λ1
λ2
Paper 8:Paper 8 10/15/09 4:26 PM Page 56

MODELLING AND SIMULATION OF GOLD ORE LEACHING 57
Figure 9. Comparison between simulated and experimental cyanide concentrations (a) Results at 1200 RPM, (b) Results at 1350 RPM(c) Results at 1500 RPM, (d) Results at 1650 RPM
Figure 8. Comparison between simulated and experimental gold liquid concentrations(a) Results at 1200 RPM, (b) Results at 1350 RPM(c) Results at 1500 RPM, (d) Results at 1650 RPM
Paper 8:Paper 8 10/15/09 4:26 PM Page 57

WORLD GOLD CONFERENCE 200958
would allow studying the effectiveness of differentcyanidation flowsheets in order to minimize cyanideconsumption and maximize gold dissolution. This study willbe presented in a subsequent paper.
AcknowledementThe authors would like to thank Mintek Lab formineralogical characterization of gold ore samples;COREM for batch leaching tests. NSERC, COREM,IAMGOLD and AGNICO-EAGLE are also acknowledgedfor their financial support and authorization to publish.
References1. PROSSER, A.P. A general model for the reaction of
several minerals and several reagents in heap leachingand dump leaching. Hydrometallurgy. 1986, vol. 6,pp. 77–92.
2. BOUFFARD, S.C. and DIXON, D.G. Evaluation ofkinetic and diffusion phenomena in cyanide leachingof crushed and run-of-mine gold ores.Hydrometallurgy. 2007, vol. 86, pp. 63–71.
3. BRITTAN, M.I. Variable activation energy model forleaching kinetics. International Journal of MineralProcessing. vol. 2, pp. 321–331.
4. NICOL, M.J., FLEMING, C.A., and CROMBERGE,G. The adsorption of gold cyanide into activatedcarbon: II—Applications of the kinetic model tomultistage absorption circuits. Journal of the SouthAfrican Institute of Mining and Metallurgy. 1984, vol.2, pp. 50–54.
5. HODOUIN, D., BISSONNETTE, B., and KANE, M.An instrumented laboratory cell for gold cyanidationmodelling. Proceedings of the 22th annual meeting ofthe Canadian Mineral Processors. Ed. CIM, 1990,pp. 562–574.
6. LING P., PAPANGELAKIS V.G.,ARGYROPOULOS, S.A., and KONDOS, P.D. Animproved rate equation for cyanidation of a gold ore.Canadian Metallurgical Quarterly. 1996, vol. 35, pp. 225–234.
7. BRITTAN M.I. Kinetic and equilibrium effects ingold ore cyanidation. Minerals & MetallurgicalProcessing. 2008, vol. 25, pp. 117–122.
8. HABASHI, F. Kinetics and mechanism of gold andsilver dissolution in cyanide solution. Bulletin of theBureau of Mines and Geology. 1967, Bul. 59.
9. RUBISOV, D. PAPANGELAKIS, V.G., andKONDOS, P.D. Fundamental kinetic models for goldore cyanide leaching. Canadian MetallurgicalQuarterly. 1996, vol. 35, pp. 353–361.
10. CRUNDWELL, F.K. and GODDORR, S.A. Amathematical model of the leaching of gold in cyanidesolutions. Hydrometallurgy . 1997, vol. 44, pp. 147–162.
11. DE ANDRADE LIMA, L.R.P and HODOUIN D. Alumped kinetic model for gold ore cyanidation.Hydrometallurgy. 2005, vol. 79, pp. 121–137.
12. WIEGEL, R.L. and LI, K. A random model formineral liberation by size reduction. Society ofMining Engineers. 1967, pp. 179–189.
13. KING, R.P. A model for the Quantitative Estimationof Mineral Liberation by Grinding. InternationalJournal of Mineral Processing. 1979, vol. 6, pp. 207–220.
14. KING, R.P. The Prediction of Mineral Liberationfrom Mineralogical Texture. XIV InternationalMineral processing Congress. CIM, 1982, vol. 8, pp. 1–18.
15. BARBERY, G. Mineral Liberation: Measurement,Simulation and Practical Use in Mineral Processing.Éditions GB. 1991.
Figure 11. Comparison between predicted and experimentalcyanide concentrations
Figure 10. Comparison between predicted and experimental goldliquid concentrations
Paper 8:Paper 8 10/15/09 4:26 PM Page 58

MODELLING AND SIMULATION OF GOLD ORE LEACHING 59
16. GAY, S.L. A liberation model for comminution basedon probability theory. Minerals Engineering. 2004,vol. 17, pp. 525–534.
17. STAMBOLIADIS, E.T. The evolution of a mineralliberation model by the repetition of a simple randombreakage pattern. Minerals Engineering. 2008, vol.21, pp. 213–223.
18. LORENZEN, L. and VAN DEVENTER, J.S.J. Theinterrelationship between mineral liberation and
leaching behaviour. International Journal of MineralProcessing. 1994, vol. 41, pp. 1–15.
19. WEN, S.B., HSIH, C.S., and KUAN, C.C. Theapplication of a mineral exposure model in a goldleaching operation. International Journal of MineralProcessing. 1996, vol. 46, pp. 215–230.
20. MARSDEN, J. and HOUSE, I. The chemistry of goldextraction. Ellis Horwood, 1992.
Steve Bellec PhD Student, Laval University
• MSc from École Polytechnique de Montréal in chemical eng.: Online data reconciliation
• PhD student at Laval University in Metallurgical eng.: thesis on optimisation of gold cyanidationprocess.
Paper 8:Paper 8 10/15/09 4:26 PM Page 59

WORLD GOLD CONFERENCE 200960
Paper 8:Paper 8 10/15/09 4:26 PM Page 60