modeling the impacts of municipal consumption rates ... · modeling the impacts of municipal...
TRANSCRIPT
Modeling the Impacts of Municipal Consumption Rates, Outflow Regulations, and Climate Change on a Small Water Supply in North-Central VermontMichael Winchell1, Dave Braun1, Raghavan Srinivasan2
4th International SWAT Conference, Delft NetherlandsJuly 4th, 2007
1. Stone Environmental, Montpelier, Vermont; 2. Texas A&M University, College Station, Texas

2
Contents
1 Background
2 Data
3 Model Development
4 Pond Management Scenarios
5 Evaluation of Results

3
■ Berlin Pond, located in North-Central Vermont, is a 103 hectare pond draining an area of approximately 26.8 km2.
■ The pond and its adjacent wetlands support abundant wildlife and provides recreational opportunities for local residents.
Background: Berlin Pond … a Natural Resource

4
Background: Berlin Pond … a Municipal Resource
■ Berlin Pond is the primary water supply for the City of Montpelier, serving approximately 2,600 customers including 327 businesses and a local fire district.
■Current water demand requires approximately 5,413 m3/d from the Pond. The City Water Department would like to increase its customers, requiring greater withdrawals from the Pond.

5
■ The Challenge:
By court order, the City is required to “minimize potential negative impacts on Berlin Pond” by implementing water restrictions when the Pond falls below critical ecological levels.
Environmental regulators may require Montpelier to regulate outflow from the pond to support stream ecology (conservation flows).
Climate change may impact water balance of the pond.
■ The Approach:
Develop a model to simulate a range of scenarios describing possible municipal use increases, conservation flows, and climate conditions.
Determine probability of pond levels dropping below critical levels under different scenarios.
Background: The Challenge and the Approach
6
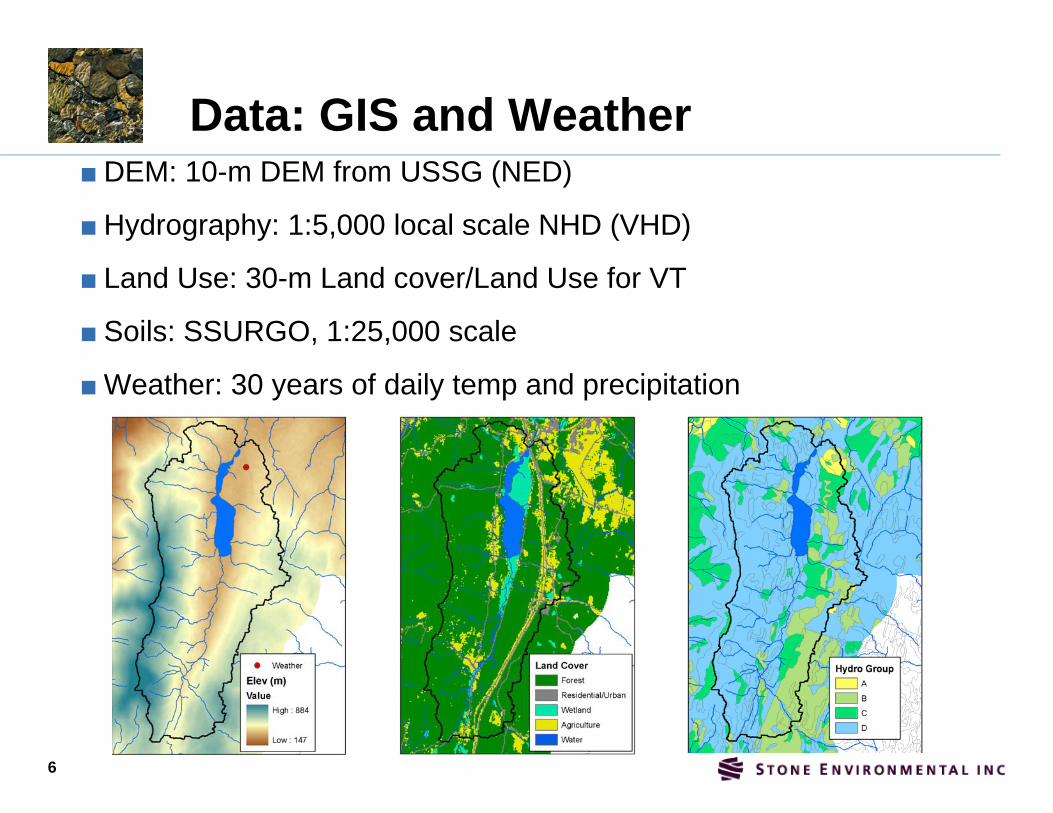
■DEM: 10-m DEM from USSG (NED)
■Hydrography: 1:5,000 local scale NHD (VHD)
■ Land Use: 30-m Land cover/Land Use for VT
■ Soils: SSURGO, 1:25,000 scale
■Weather: 30 years of daily temp and precipitation
Data: GIS and Weather

7
Data: Pond Characteristics■ Pond bathymetry: Elevation/storage curves developed
■ Pond regulation/outflow characteristics:
Pond is regulated by several culverts and an uncontrolled dam.
A rating curve was developed to determine the relationship between
pond stage and outflow.
0
50,000
100,000
150,000
200,000
250,000
300,000
350,000
298.0 298.1 298.2 298.3 298.4 298.5 298.6 298.7 298.8 298.9 299.0
Stage (m.)
Flow
(m3
/ d)
LowRatingHigh RatingObserved

8
■ Flow: Observed streamflow data for the stream feeding Berlin Pond was not available. Daily streamflow for the adjacent 197 km2 Dog River watershed was available and used for initial estimation of Berlin Pond parameters.
■ Pond Levels: Observed pond level data was available from May 1993 through December 2004. These data were taken nearly daily, with some periods of missing data, particularly during winter.
Data: Calibration Data

9
■Calibration Period: 1982-1991 with a 1-year warm up.
■ Biggest Challenge: Too little baseflow in the winter and early spring. Unable to parameterize to obtain observed streamflow behavior.
■ Solution: Small changes to model for winter conditions
Modified snowmelt model to contain ground melt and a snowfall adjustment factor, similar to the U.S NWS SNOW-17 model.
Modified percolation from soil to shallow groundwater with temperatures below 0 Celsius.
Justified this change based on the deep, early snow packs that can occur in this basin resulting in shallower penetration of frozen soil
Model Development: Dog River Model

10
0
10
20
30
40
50
60
70
80
90
1/1/
1982
3/1/
1982
5/1/
1982
7/1/
1982
9/1/
1982
11/1
/198
2
1/1/
1983
3/1/
1983
5/1/
1983
7/1/
1983
9/1/
1983
11/1
/198
3
1/1/
1984
3/1/
1984
5/1/
1984
7/1/
1984
9/1/
1984
11/1
/198
4
1/1/
1985
3/1/
1985
5/1/
1985
7/1/
1985
9/1/
1985
11/1
/198
5
1/1/
1986
3/1/
1986
5/1/
1986
7/1/
1986
9/1/
1986
11/1
/198
6
Date
ObsFinal Sim
Calibration Period, Years Shown (1982 – 1986)
Flow
(m3 /s
)
Model Development: Dog River Calibration
Statistic Cold Run, Calibration Period (1982 – 1991)
Final Run, Calibration Period (1982-1991)
R-squared 0.22 0.63
Nash-Sutcliffe -2.26 0.61
Correlation 0.46 0.79
Water Balance Bias +18% +1%

11
Model Development: Berlin Pond Model
■Calibration Period: 1999-2004 with a multi-year warm up.
■Model Notes:
Utilized same model modifications as for Dog River (snow model, frozen soil)
Implemented custom reservoir regulation model
■Reservoir Model Components:
Outflow as a function of pond stage (low and high end rating curves)
Seasonal low end rating curve adjustment (account for ice and vegetation)
Municipal withdrawal reductions when pond falls below action levels
Adjustment of outflows to account for conservation flow requirements

12
Model Development: Berlin Pond Model Calibration■ Emphasis on matching dry periods
Berlin Pond Calibration Period Simulation (1999 - 2004)
1/1/
1999
4/1/
1999
7/1/
1999
10/1
/199
9
1/1/
2000
4/1/
2000
7/1/
2000
10/1
/200
0
1/1/
2001
4/1/
2001
7/1/
2001
10/1
/200
1
1/1/
2002
4/1/
2002
7/1/
2002
10/1
/200
2
1/1/
2003
4/1/
2003
7/1/
2003
10/1
/200
3
1/1/
2004
4/1/
2004
7/1/
2004
10/1
/200
4
Date
ObsFinal Sim
Max. staff gage elevation of 298.7 m.
Pond
Ele
vatio
n (m
)
297.5
297.8
298.1
298.4
298.7
299.0

13
Model Development: Berlin Pond Model Calibration
■ Predicted water levels within 6 cm. of observed from 5th
through 99th percentiles.
R2 = 0.98 for ranked flows
Pond Level Frequency Distribution: Calibration Period (1999-2004)
0
0.1
0.2
0.3
0.4
0.5
0.6
0.7
0.8
0.9
1
Perc
entil
e
ObservedSimulated
Pond Elevation (m)
297.8 298.1 298.4 298.7297.95 297.15 297.55 298.85297.65
14
Pond Management Scenarios: Water Use and Outflow Regulation
■Water Use: Evaluated 5 municipal withdrawal rates: 3785, 5413, 6435, 7570 and 9463 m3/day
■Outflow Regulation: Evaluated unregulated outflow and a conservation flow requirement scenario.
■Conservation Flow Scenario:
For Jun 1 – Sep 30, minimum flow = 0.0367 m2/sec-km2
For Oct 1 – May 31, minimum flow = 0.0734 m2/sec-km2
If pond inflow < conservation flow, pond outflow = pond inflow

15
Pond Management Scenarios: Climate Change
■Current Climate: represented by 30 years of observed climate records (1975 – 2004)
■ 2050 Climate Scenario: Based on Hadley model output (HADCM2)
Extracted GCM grid cells for Berlin Pond climate region (7 grid cells) and
created average values for region
Averaged monthly t-min, t-max, and precip. for 2045 – 2055
Calculate seasonal departures from current conditions (1975-2004)
Applied adjustments to historical 30-yr time series
Season Precip Change (%) TMax Change (C) TMin Change (C)
Winter 4.81 1.34 1.97
Spring -7.79 1.07 1.47
Summer 22.82 0.30 1.25
Fall 22.67 0.48 1.3

16
Evaluation of Results: Current Climate, Unregulated Outflow
■ Probability of experiencing mandatory restrictions in any year increases from 10% (current use) to 40% under highest potential use.
Yearly Minimum Pond Level Frequency Distribution 30-yr Simulation
0.00
0.10
0.20
0.30
0.40
0.50
0.60
0.70
0.80
0.90
1.00
Perc
entil
e
1 MGD1.43 MGD1.7 MGD2 MGD2.5 MGD
Voluntary Water Restrictions
Mandatory Water Restrictions
297.8 298.1 298.4297.35 297.95 297.15297.5297.2 297.65
Pond Elevation (m)
3,785 m3/d5,413 m3/d6,435 m3/d7,570 m3/d9,463 m3/d

17
Evaluation of Results: 2050 Climate, Unregulated Outflow
■ Probability of mandatory restrictions at highest use rate decreases to 23% under the projected 2050 climate (hooray … more water!).
Yearly Minimum Pond Level Frequency Distribution 30-yr Simulation
0.00
0.10
0.20
0.30
0.40
0.50
0.60
0.70
0.80
0.90
1.00
Perc
entil
e
1 MGD1.43 MGD1.7 MGD2 MGD2.5 MGD
Voluntary Water Restrictions
Mandatory Water Restrictions
297.8 298.1 298.4297.35 297.95 297.15297.5297.2 297.65
Pond Elevation (m)
3,785 m3/d5,413 m3/d6,435 m3/d7,570 m3/d9,463 m3/d

18
Evaluation of Results: Current Climate, Conservation Flows
■ Probability of mandatory water restrictions increases significantly with conservation flow requirements (good for fish, not for the Water Dept.)
Yearly Minimum Pond Level Frequency Distribution 30-yr Simulation
0.00
0.10
0.20
0.30
0.40
0.50
0.60
0.70
0.80
0.90
1.00
Perc
entil
e
1 MGD1.43 MGD1.7 MGD2 MGD2.5 MGD
Voluntary Water Restrictions
Mandatory Water Restrictions
297.8 298.1 298.4297.35 297.95 297.15297.5297.2 297.65
Pond Elevation (m)
3,785 m3/d5,413 m3/d6,435 m3/d7,570 m3/d9,463 m3/d

19
Summary and Conclusions
■ SWAT was applied to a evaluate the impacts of water use, environmental regulation, and climate change on a small water supply reservoir.
■ The modeling incorporated modifications to the SWAT model code to account for winter season runoff and a customized reservoir management scheme.
■Modeling of 20 different scenarios was performed to predict the probability of reaching ecologically critical water levels in Berlin Pond.
■ Future climate conditions, with higher summer precipitation, resulted in greater water availability.
■ Imposing conservation flow requirements to support downstream aquatic habitat resulted in considerably less water availability for municipal use.

20
Thank you!