assessing the environmental impacts of consumption and ... · this report investigates the...
TRANSCRIPT
International Panelfor Sustainable Resource Management
Assessing the Environmental Impacts of Consumption and Production:
Priority Products and materials
Editor: International Panel for Sustainable Resource Management, Working Group on the Environmental Impacts of Products and Materials: Prioritization and Improvement Options
Lead Author: Edgar Hertwich
Contributors: Working Group on the Environmental Impacts of Products and Materials: Prioritization and Improvement Options: Ester van der Voet, Mark Huijbregts, Sangwon Suh, Pawel Kazmierczyk, Manfred Lenzen, Jeff McNeely, Yuichi Moriguchi
Arnold Tukker, TNO and NTNU, edited the full report and summary brochure.
Janet Salem and Guido Sonnemann, UNEP, together with Frans Vollenbroek provided valuable input and comments; the Resource Panel’s Secretariat coordinated the preparation of this report.
Thanks go to Ernst Ulrich von Weizsäcker and Ashok Khosla as co-chairs of the Resource Panel, the members of the Resource Panel and the Steering Committee for fruitful discussions. Additional comments of a technical nature were received from some governments participating in the Steering Committee.
Helpful comments were received from several anonymous reviewers in a peer review process coordinated in an efficient and constructive way by Patricia Romero Lankao together with the Resource Panel Secretariat. The preparation of this report also benefitted from discussions with many colleagues at various meetings, although the main responsibility for errors will remain with the authors.
ISBN number of the full report: 978-92-807-3084-5 Job Number: DTI/1262/PA
Copyright © United Nations Environment Programme, 2010
This publication may be reproduced in whole or in part and in any form foreducational or nonprofit purposes without special permission from the copyright holder, provided acknowledgement of the source is made. UNEP would appreciate receiving a copy of any publication that uses this publication as a source.
No use of this publication may be made for resale or for any other commercial purpose whatsoever without prior permission in writing from the United Nations Environment Programme.
Photos: Pawel Kazmierczyk (cover, title page, p.12, p. 16, p.25, p.26); Frédéric Boyer (p. 32, p. 35)
Design/Layout: Thad Mermer
Disclaimer The designations employed and the presentation of the material in this publication do not imply the expression of any opinion whatsoever on the part of the United Nations Environment Programme concerning the legal status of any country, territory,city or area or of its authorities, or concerning delimitation of its frontiers or boundaries. Moreover, the views expressed do not necessarily represent the decisionor the stated policy of the United Nations Environment Programme, nor does citing of trade names or commercial processes constitute endorsement.
UNEP promotes environmentally sound practices globally and in its own activities. This publication is printed on PEFC-certified ECF paper, using vegetable-based inks and other eco-friendly practices. Our distribution policy aims to reduce UNEP’s carbon footprint.
acknowledgements
The full report should be referenced as follows: UNEP (2010) Assessing the Environmental Impacts of Consumption and Production: Priority Products and Materials, A Report of the Working Group on the Environmental Impacts of Products and Materials to the International Panel for Sustainable Resource Management. Hertwich, E., van der Voet, E., Suh, S., Tukker, A, Huijbregts M., Kazmierczyk, P., Lenzen, M., McNeely, J., Moriguchi, Y.
priority products and materialsproduced by the International Panel for Sustainable Resource Management.
This summary report highlights key findings from the report, and should be read in conjunction with the full report. References to research and reviews on which this report is based are listed in the full report.
The full report can also be downloaded at: www.unep.fr
It can be ordered on a CD-ROM via email: [email protected], or via post: United Nations Environment Programme Division of Technology Industry and Economics 15 rue de Milan, 75441 Paris CEDEX 09, France
The following is an excerpt of the report
Assessing the Environmental Impacts of Consumption and Production:
International Panelfor Sustainable Resource Management
acknowledgements
The International Panel for Sustainable Resource 1. Management aims to provide independent, coherent and authoritative scientific assessments of policy relevance on the sustainable use of natural resources and in particular their environmental impacts over the full life cycle.
A fundamental question the Panel needs to 2. answer is how different economic activities currently influence the use of natural resources and the generation of pollution.
This Panel report answers this question via a 3. broad review of existing studies for countries, country groups, or the world as a whole.
The report looks at the economy via three 4. perspectives:
Productiona. . What sectors have the highest impacts? This perspective helps identifying where clean and efficient technologies are most needed.
Consumptionb. . What products and consumption clusters have the highest life cycle impacts? This perspective helps indicating where shifts to low impact products and sustainable life styles can most reduce impacts.
Resourcesc. . What materials have the highest impacts? This perspective is relevant for material choices and sustainability policies on resources.
The different studies, and different perspectives 5. points, paint a consistent overall picture:
Agriculture and food consumptiona. are identified as one of the most important drivers of environmental pressures, especially habitat change, climate change, fish depletion, water use and toxic emissions.
The use of fossil fuelsb. for heating, transportation, materials production and the production and use of electrical appliances is of comparable importance, causing the depletion of fossil energy resources, climate change, and a wide range of emissions-related impacts.
The study shows further that per capita impacts 6. rise with higher wealth. Population and economic growth will hence lead to higher impacts, unless patterns of production and consumption can be changed.
Impacts and resources embodied in trade are 7. already significant compared to national impacts and resource use, and rising.
There is a need for analysis to evaluate trends, 8. develop scenarios and identify sometimes complicated trade-offs and ‘linkages’ (e.g., between clean energy technologies and material consumption).
Improved insights could be highly facilitated 9. by aligning and harmonizing ongoing data gathering efforts and institutionalizing a monitoring and comparative analysis of the data. Intergovernmental Organizations are recommended to explore the potential of practical collaborative actions in this field.
2
findings at a glance

findings at a glance preface
3
Today’s environmental debate highlights many priority issues. In the climate change discussions, energy production and mobility are in the spotlight, but when it comes to growing concerns about biodiversity, agriculture and urban development are the focus. Decision-makers could be forgiven for not knowing where to begin.
The solution to this dilemma begins with a scientific assessment of which environmental problems present the biggest challenges at the global level in the 21st century, and a scientific, systematic perspective that weighs up the impacts of various economic activities – not only looking at different industrial sectors, but also thinking in terms of consumer demand. The purpose of this report, the latest from the International Panel for Sustainable Resource Management, a group of internationally recognized experts on sustainable resource management convened by UNEP, is to assess the best-available science from a global perspective to identify priorities among industry sectors, consumption categories and materials. For the first time, this assessment was done at the global level, identifying priorities for developed and developing countries. It supports international, national and sectoral efforts on sustainable consumption and production by highlighting where attention is really needed. We now know that food, mobility and housing must - as a priority - be made more sustainable if we are serious about tackling biodiversity loss and climate change. In most countries, household consumption, over the life cycle of the products and services, accounts for more than 60% of impacts of all consumption. We must start looking into our everyday activities if we truly want a green economy – for developed and developing countries. I congratulate the Resource Panel for taking on this difficult task and providing us with the scientific insights we all need to help us move towards a Green Economy.
Achim Steiner, UN Under-Secretary General and Executive Director UNEP
Environmental impacts are the unwanted byproduct of economic activities. Inadvertently, humans alter environmental conditions such as the acidity of soils, the nutrient content of surface water, the radiation balance of the atmosphere, and the concentrations of trace materials in food chains. Humans convert forest to pastureland and grassland to cropland or parking lots intentionally, but the resulting habitat change and biodiversity loss is still undesired. What are the most important industries that cause climate change? How much energy do different consumption activities require when the production of the products is taken into account? What are the materials that contribute most to environmental problems? This report investigates the causes of environmental pressure. Economic activities pursued to satisfy consumption require the extraction and transformation of materials and energy, or the occupation of land. This report investigates the production- consumption–materials nexus. Maybe not surprisingly, we identify fossil fuels use and agricultural production as major problem areas. The relative importance of industries, consumption categories and materials varies across the world – partly in a predictable fashion, as our assessment shows. This assessment offers a detailed problem description and analysis of the causation of environmental pressures and hence provides knowledge required for reducing environmental impacts. It tells you where improvements are necessary.
Edgar Hertwich, Chair of the Working Group on the Environmental Impacts of Products and Materials

Objective and scope
5
Ob
jec
tiv
e
an
d
sc
op
e
About
The objectives of the UNEP International Panel for Sustainable Resource Manage-ment (Resource Panel) are to:
provide independent, coherent and •authoritative scientific assessments of policy relevance on the sustainable use of natural resources and in particular their environmental impacts over the full life cycle;
contribute to a better understanding of •how to decouple economic growth from environmental degradation.
This report on environmental impacts of consumption and production is part of the first series of reports of the Panel, covering amongst others biofuels, decoupling, and other topics.
Objective and scope
All economic activities related to production and consumption occur in the natural, physical world. Most activities require resources such as energy, materials, and land. They also invariably generate material residuals, which enter the environment as waste or polluting emissions. The Earth is a finite planet, and therefore has a limited capability to supply resources and to absorb
pollution. A fundamental question the Resource Panel hence has to answer is how different economic activities influence the use of natural resources and the generation of pollution.
To answer this basic question, the report assesses economic activities and identifies priorities according to their environmental impact and resource demands. The assessment was based on a broad review and comparison of existing studies and literature that analyzes impacts of production, consumption, or resource use of countries, country groups, or the world as a whole. For this report no primary research was done.
Conceptually, the report takes the so-called DPSIR (Driving force – Pressure – State – Impact – Response) framework as a starting point. This framework was developed by organizations such as the European Environment Agency (EEA), the Organization for Economic Co-operation and Development (OECD) and the UN Commission for Sustainable Development. The concept provides a step-wise description of the causal chain between economic activity (the Driver) and Impacts such as ecosystem losses, human health losses, and contribution
aboutthe International Panel for Sustainable Resource Management& objective and scope of the report.
Contribute to a better
understanding of how to decouple
economic growth from
environmental degradation.
Provide insight into
the economic activities
that cause the highest
environmental pressures.
6
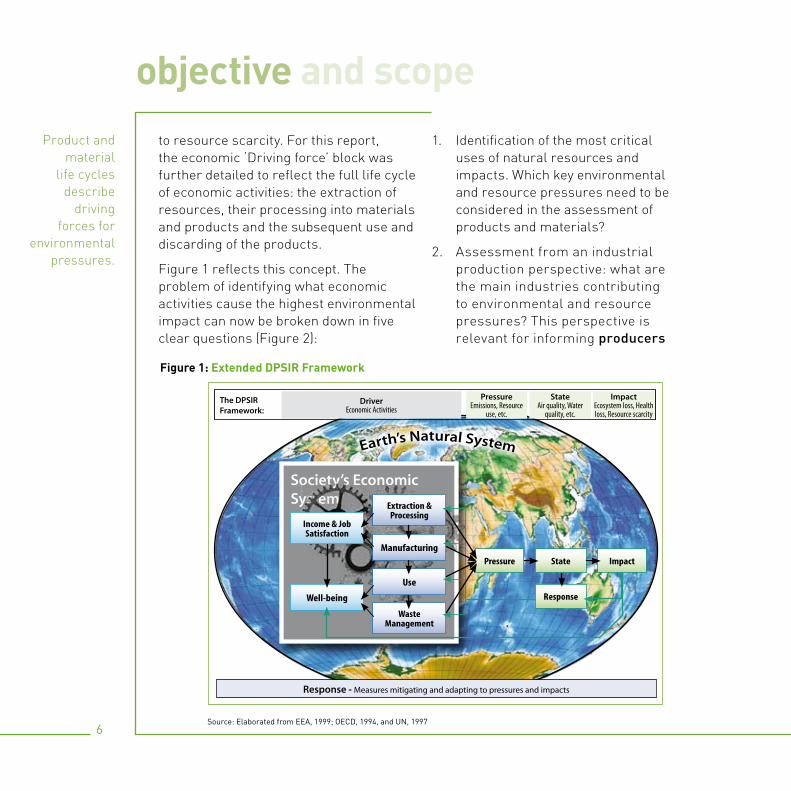
to resource scarcity. For this report, the economic ‘Driving force’ block was further detailed to reflect the full life cycle of economic activities: the extraction of resources, their processing into materials and products and the subsequent use and discarding of the products.
Figure 1 reflects this concept. The problem of identifying what economic activities cause the highest environmental impact can now be broken down in five clear questions (Figure 2):
Identification of the most critical 1. uses of natural resources and impacts. Which key environmental and resource pressures need to be considered in the assessment of products and materials?
Assessment from an industrial 2. production perspective: what are the main industries contributing to environmental and resource pressures? This perspective is relevant for informing producers
Figure 1: Extended DPSIR Framework
Society’s Economic System
Income & Job Satisfaction
Extraction & Processing
State
Response
Impact
Use
Well-being
Manufacturing
Waste Management
Earth’s Natural System
Pressure
The DPSIR Framework:
DriverEconomic Activities
Response - Measures mitigating and adapting to pressures and impacts
Pressure Emissions, Resource
use, etc.
State Air quality, Water
quality, etc.
Impact Ecosystem loss, Health loss, Resource scarcity
objective and scope
Source: Elaborated from EEA, 1999; OECD, 1994, and UN, 1997
Product and material
life cycles describe
driving forces for
environmental pressures.
7
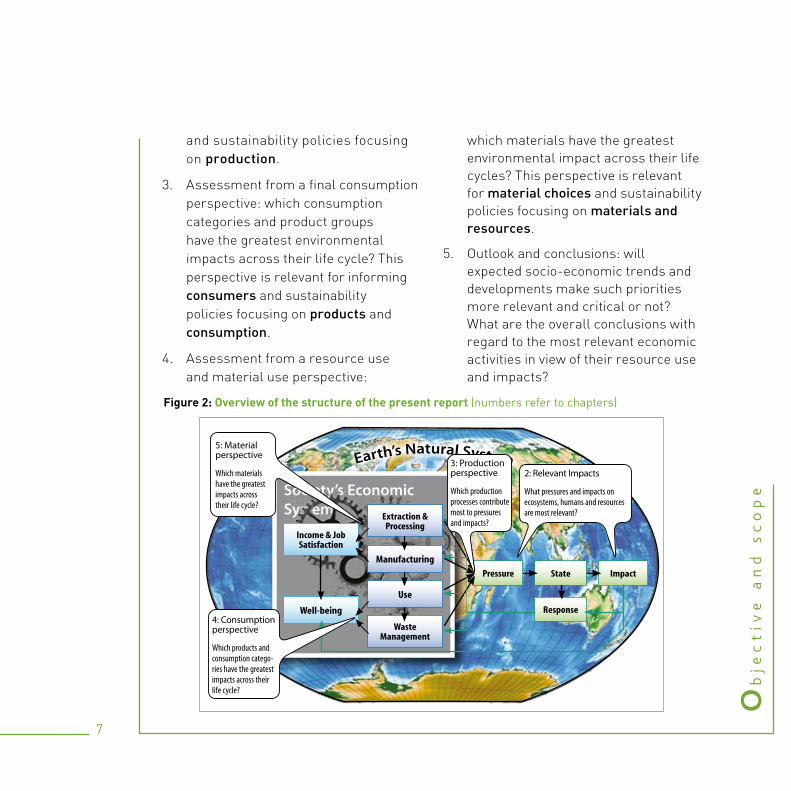
and sustainability policies focusing on production.
Assessment from a final consumption 3. perspective: which consumption categories and product groups have the greatest environmental impacts across their life cycle? This perspective is relevant for informing consumers and sustainability policies focusing on products and consumption.
Assessment from a resource use 4. and material use perspective:
which materials have the greatest environmental impact across their life cycles? This perspective is relevant for material choices and sustainability policies focusing on materials and resources.
Outlook and conclusions: will 5. expected socio-economic trends and developments make such priorities more relevant and critical or not? What are the overall conclusions with regard to the most relevant economic activities in view of their resource use and impacts?
Ob
jec
tiv
e
an
d
sc
op
e
Figure 2: Overview of the structure of the present report (numbers refer to chapters)
Society’s Economic System
Income & Job Satisfaction
Extraction & Processing
Use
Well-being
Manufacturing
Waste Management
Earth’s Natural System5: Material perspective
Which materials have the greatest impacts across their life cycle?
State
Response
ImpactPressure
3: Production perspective
Which production processes contribute most to pressures and impacts?
2: Relevant Impacts
What pressures and impacts on ecosystems, humans and resources are most relevant?
4: Consumption perspective
Which products and consumption catego-ries have the greatest impacts across their life cycle?
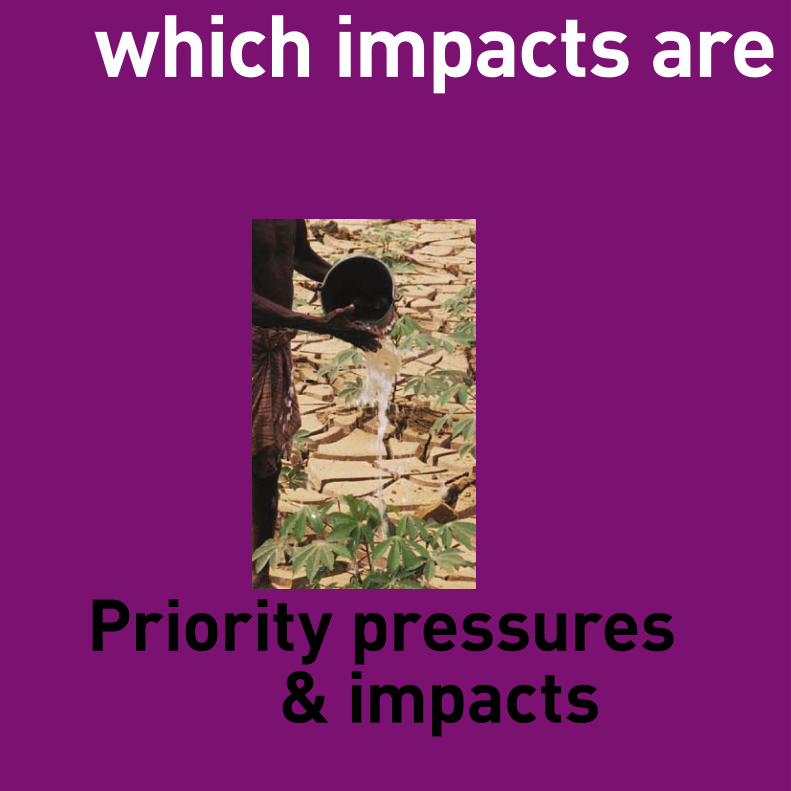
Priority pressures & impacts
which impacts are most relevant?
9
Ecosystem health: Insights from the Millennium Ecosystem Assessment
The 2005 Millennium Ecosystem Assessment (MA) is largely regarded as the most authoritative analysis with regard to the status of global ecosystems. Over 1,300 scientists from all parts of the world contributed to the MA. The MA found that over the past 50 years humans have changed ecosystems more rapidly and extensively than in any comparable period of time in human history, largely to meet rapidly growing demand for food, fresh water, timber, fibre and fuel. This has resulted in a substantial and largely irreversible loss in the diversity of life on Earth. The MA identified five main factors that significantly degrade ecosystems:
Habitat change •Pollution (with particularly Nitrogen and •Phosphorus)Overexploitation of biotic resources such •as fisheries and forests
Invasive species •Climate change •
Human health: insights from the WHO Burden of Disease analysis
The connection between environmental issues and human health is complex and sometimes difficult to measure. Our understanding, however, has evolved substantially in recent decades due to scientific progress in linking the burden of disease to individual risk factors. The Global Burden of Disease analysis of the World Health Organisation (WHO) provides an authoritative comprehensive and comparable assessment of mortality and loss of health due to diseases, injuries and risk factors for all regions of the world.
The Burden of Disease review shows that many factors are related to environmental impacts. The single most important factor explaining 16% of the disease burden is a development issue: malnutrition (childhood
which impacts are most relevant?The most critical pressures and impacts caused by economic activities are related to ecosystem health, human health and resource depletion. Of these, human health and environmental health impacts are best researched. Habitat change is the most important cause for ecosystem degradation, while air pollution and climate change impact human health.
Human health is
most affected by poverty:
malnutrition, unsafe drinking
water, and indoor air pollution
Pr
ior
ity
p
re
ss
ur
es
&
Im
pa
ct
s
10
which impacts are most relevant?
The collapse of several
fish resource stocks is a clear sign
that humans can over-
exploit the Earth’s natural resource base
and maternal underweight and the deficiency of iron, zinc and vitamin A). Behavioural factors such as unsafe sex, smoking and alcohol use explain another 12%.
Environmental factors are still significant, but are mainly caused by unsafe drinking water, sanitation and hygiene (3.7%), and indoor air pollution from solid fuels used in households (2.7%). These environmental factors are mainly relevant in developing countries with high mortality rates. Environmental factors in strictest sense are lead exposure (0.9%), urban air pollution (0.4%), climate change (0.4%) and occupational exposure to particulates (0.3%) and carcinogens (0.06%).
Resource depletion: an underexplored territory
Authoritative global assessments in the area of resource depletion are lacking. The academic literature disagrees on whether resource scarcity, or competition for scarce resources, presents a fundamental problem or is easily solved by the market. Demand projections indicate, however, that the consumption of some metals and oil and gas will outstrip supply and may exhaust available reserves within the current century. A specific but not yet fully
researched problem may be ‘linkages’ between issues such as declining ore grades, resulting in higher energy needs for mining and refining, whereas these same depleting resources are needed in much higher amount in future for sustainable energy production and storage systems (e.g. PV cells and batteries): For biotic resources, the Millennium Ecosystem Assessment showed that overexploitation has lead to the collapse of resource stocks especially in the case of fisheries. In addition, competition over land and availability of fresh water is a serious concern. There is an urgent need for better data and analysis on the availability and quality of resources and the economic effects of scarcity.
Conclusions: most relevant pressures and impacts
These findings suggest strongly that the following pressures and/or impacts should be considered in the remainder of this report, since they affect one or more of the protection areas ecosystem health, human health and resources:
Impacts caused by emissions:•
Climate change (caused by »Greenhouse gas (GHG) emissions)
which impacts are most relevant?
11
Pr
ior
ity
p
re
ss
ur
es
&
Im
pa
ct
s
Eutrophication (overfertilization »caused by pollution with nitrogen and phosphorus)Human and ecotoxic effects caused »by urban and regional air pollution, indoor air pollution and other toxic emissions.
Impacts related to resource use:•
Depletion of abiotic resources (fossil »energy carriers and metals)
Depletion of biotic resources (most »notably fish and wood)Habitat change and resource »competition due to water and land use.
Ideally, issues like threats of invasive species should also be addressed, but for such topics there is little quantitative insight in the relation between drivers, pressures and impacts.
not all processes cause equal impacts
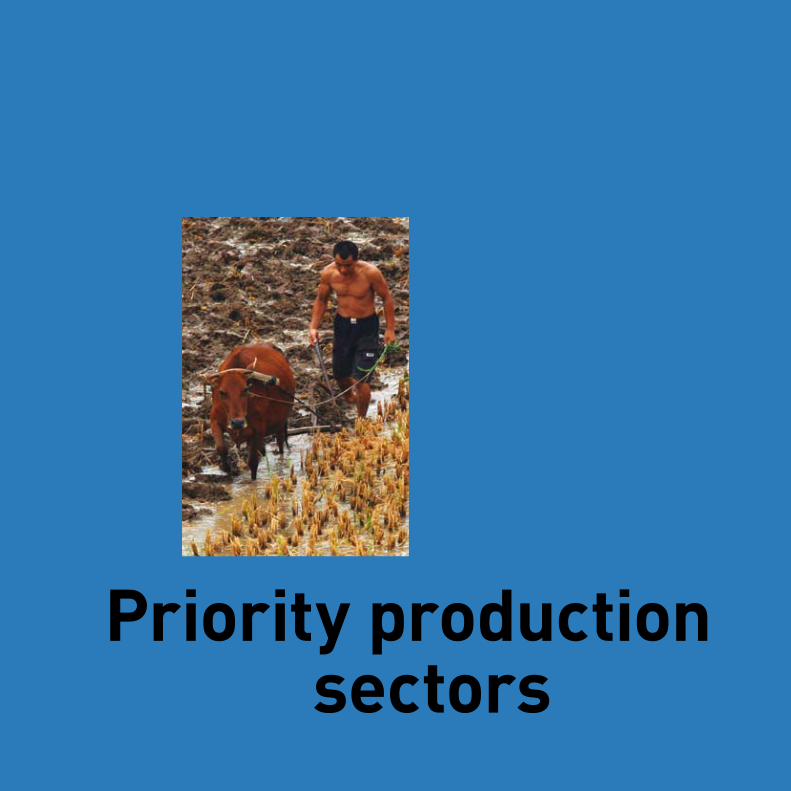
Priority production sectors
1313
How the assessment was doneHaving identified the most important impacts, it is now possible to identify production processes or industry sectors that have the highest contributions. This perspective helps companies and policy makers to develop sustainability policies for production processes. Like all work in this report, this analysis was based on a comparative review of existing studies. Ideally, one would be able to use a harmonized data set for the total emissions and primary resource uses by industry sector at a global level. Harmonized data at global level is only available for greenhouse gases and some resources such as water.
For some environmental problems analyses at country level were used.
The number of substances emitted and to a lesser extent the number of types of resources used can be large. In order to reduce this complexity, emitted substances are usually grouped together according to impact mechanism, and expressed in a single indicator. A well known indicator in this respect is the Global Warming Potential (GWP). The GWP adds up the emissions of greenhouse gases such as CO2, CH4, and N2O according to their relative contributions to the global warming problem per kg of emission.
The next section discusses the contribution of industry sectors to the impacts selected in Chapter 2. The analysis excludes invasive
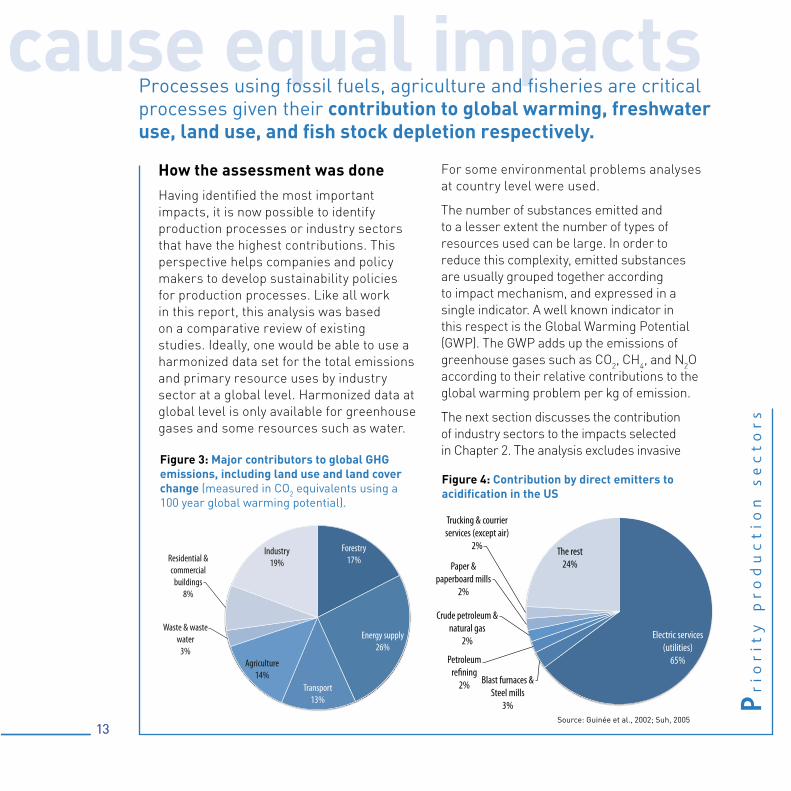
not all processes cause equal impactsProcesses using fossil fuels, agriculture and fisheries are critical processes given their contribution to global warming, freshwater use, land use, and fish stock depletion respectively.
Pr
ior
ity
p
ro
du
ct
ion
s
ec
to
rs
Figure 3: Major contributors to global GHG emissions, including land use and land cover change (measured in CO2 equivalents using a 100 year global warming potential).
Figure 4: Contribution by direct emitters to acidification in the US
Forestry 17%
Energy supply 26%
Transport 13%
Agriculture 14%
Waste & waste water
3%
Residential & commercial
buildings 8%
Industry 19%
Electric services (utilities)
65%
Blast furnaces & Steel mills
3%
Petroleum re�ning
2%
Crude petroleum & natural gas
2%
Paper & paperboard mills
2%
Trucking & courrier services (except air)
2% The rest 24%
Priority production sectors
Source: Guinée et al., 2002; Suh, 2005
14
not all processes cause equal impacts
Fossil fuel-using processes
are most important
for climate change
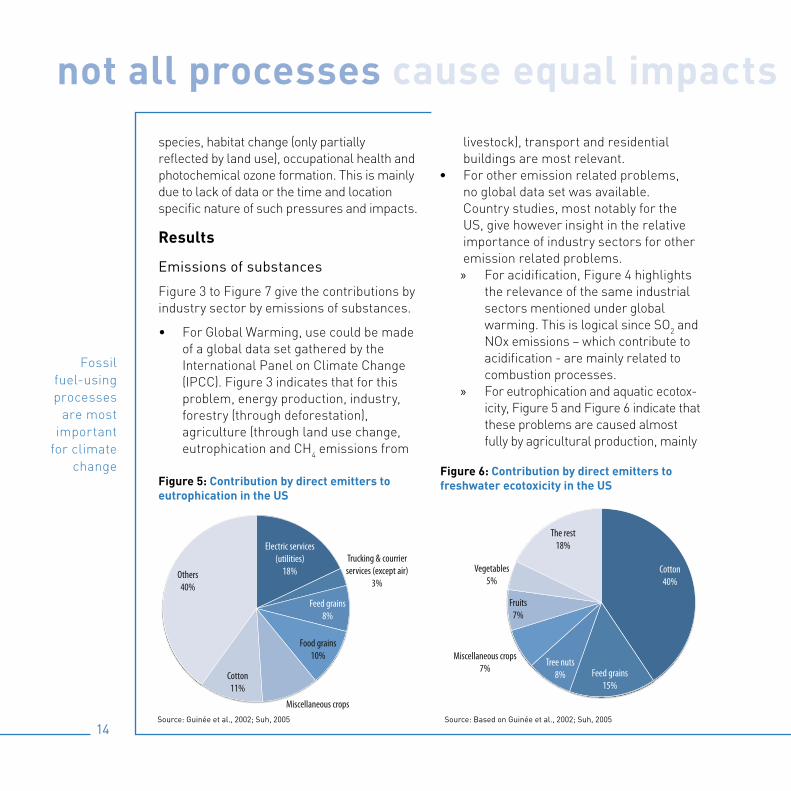
Figure 5: Contribution by direct emitters to eutrophication in the US
Electric services (utilities)
18% Trucking & courrier services (except air)
3%
Feed grains 8%
Food grains 10%
Miscellaneous crops 10%
Cotton 11%
Others 40%
Cotton 40%
Feed grains 15%
Tree nuts 8%
Miscellaneous crops 7%
Fruits 7%
Vegetables 5%
The rest 18%
Figure 6: Contribution by direct emitters to freshwater ecotoxicity in the US
species, habitat change (only partially reflected by land use), occupational health and photochemical ozone formation. This is mainly due to lack of data or the time and location specific nature of such pressures and impacts.
Results
Emissions of substances
Figure 3 to Figure 7 give the contributions by industry sector by emissions of substances.
For Global Warming, use could be made •of a global data set gathered by the International Panel on Climate Change (IPCC). Figure 3 indicates that for this problem, energy production, industry, forestry (through deforestation), agriculture (through land use change, eutrophication and CH4 emissions from
livestock), transport and residential buildings are most relevant. For other emission related problems, •no global data set was available. Country studies, most notably for the US, give however insight in the relative importance of industry sectors for other emission related problems.
For acidification, Figure 4 highlights »the relevance of the same industrial sectors mentioned under global warming. This is logical since SO2 and NOx emissions – which contribute to acidification - are mainly related to combustion processes. For eutrophication and aquatic ecotox- »icity, Figure 5 and Figure 6 indicate that these problems are caused almost fully by agricultural production, mainly
Source: Guinée et al., 2002; Suh, 2005 Source: Based on Guinée et al., 2002; Suh, 2005
not all processes cause equal impacts
15
Agriculture is responsible
for 50% of land use and 70% of water
use
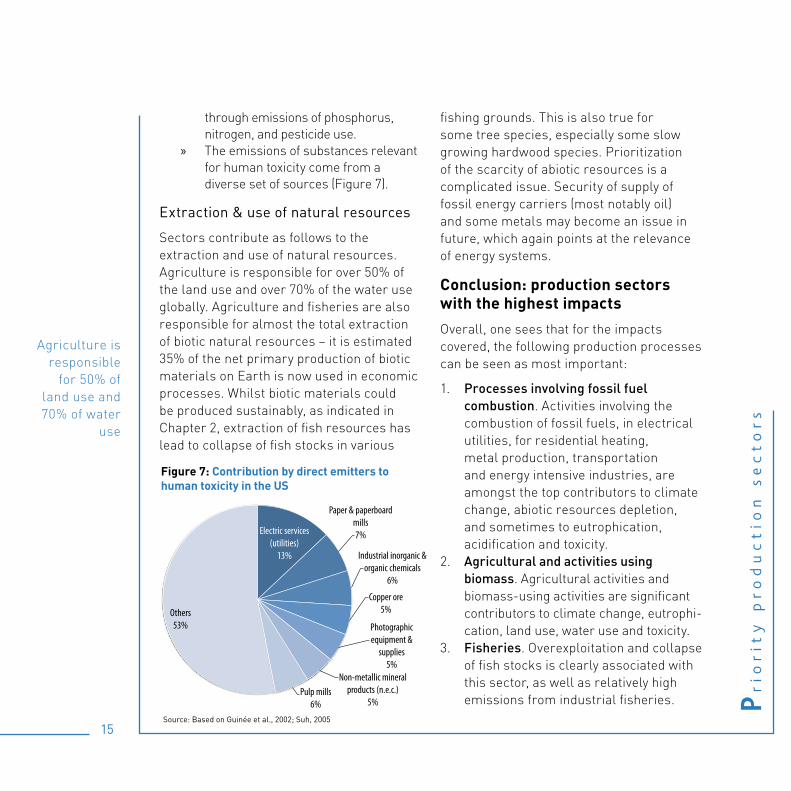
through emissions of phosphorus, nitrogen, and pesticide use. The emissions of substances relevant »for human toxicity come from a diverse set of sources (Figure 7).
Extraction & use of natural resources
Sectors contribute as follows to the extraction and use of natural resources. Agriculture is responsible for over 50% of the land use and over 70% of the water use globally. Agriculture and fisheries are also responsible for almost the total extraction of biotic natural resources – it is estimated 35% of the net primary production of biotic materials on Earth is now used in economic processes. Whilst biotic materials could be produced sustainably, as indicated in Chapter 2, extraction of fish resources has lead to collapse of fish stocks in various
fishing grounds. This is also true for some tree species, especially some slow growing hardwood species. Prioritization of the scarcity of abiotic resources is a complicated issue. Security of supply of fossil energy carriers (most notably oil) and some metals may become an issue in future, which again points at the relevance of energy systems.
Conclusion: production sectors with the highest impacts
Overall, one sees that for the impacts covered, the following production processes can be seen as most important:
Processes involving fossil fuel 1. combustion. Activities involving the combustion of fossil fuels, in electrical utilities, for residential heating, metal production, transportation and energy intensive industries, are amongst the top contributors to climate change, abiotic resources depletion, and sometimes to eutrophication, acidification and toxicity. Agricultural and activities using 2. biomass. Agricultural activities and biomass-using activities are significant contributors to climate change, eutrophi-cation, land use, water use and toxicity. Fisheries3. . Overexploitation and collapse of fish stocks is clearly associated with this sector, as well as relatively high emissions from industrial fisheries.
Electric services (utilities)
13%
Paper & paperboard mills 7%
Industrial inorganic & organic chemicals
6%
Copper ore 5%
Photographic equipment &
supplies 5%
Non-metallic mineral products (n.e.c.)
5% Pulp mills
6%
Others 53%
Figure 7: Contribution by direct emitters to human toxicity in the US
Pr
ior
ity
p
ro
du
ct
ion
s
ec
to
rs
Source: Based on Guinée et al., 2002; Suh, 2005
consumption drives the impacts of production
Priority consumption clusters
17
Pr
ior
ity
c
on
su
mp
tio
n
clu
st
er
s
How the assessment was done
While understanding which industry sectors cause the highest environmental pressures is important, ultimately all production serves final consumption. Consumption of goods and services contributes to well-being and quality of life, and it is hence interesting to analyse which products and services used for final consumption cause important impacts across their life cycles. This perspective helps consumers and policy makers to understand how changes of consumption patterns can reduce impacts, for instance by using cleaner products, or spending less on activities with high life cycle impacts.
There are two basic approaches to a consumption-oriented analysis. The first is product life cycle assessment (LCA). For a specific product, all emissions of processes along the life cycle are inventoried, and then aggregated to impact indicators such as Global Warming Potential. The advantage is that a very specific emission inventory for a specific product can de developed. For
assessments at generic level, however, this is a disadvantage. There are hundreds of thousands of products on the market, and it is impossible to do LCAs for all of them. Even using existing LCAs is problematic, since usually they are not fully consistent in data sources and system boundaries.
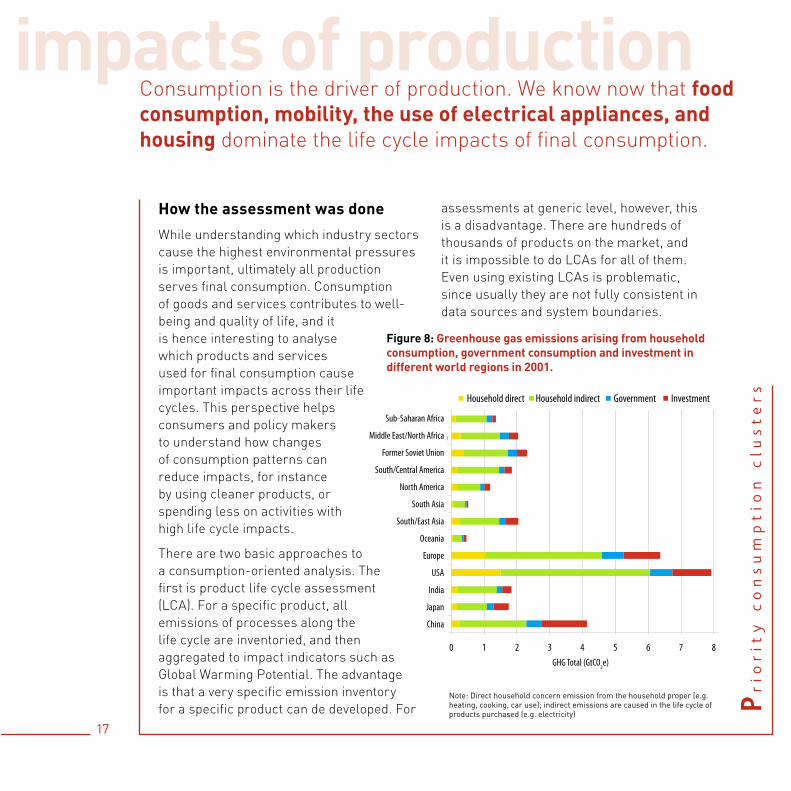
consumption drives the impacts of productionConsumption is the driver of production. We know now that food consumption, mobility, the use of electrical appliances, and housing dominate the life cycle impacts of final consumption.
Figure 8: Greenhouse gas emissions arising from household consumption, government consumption and investment in different world regions in 2001.
0 1 2 3 4 5 6 7 8
China
Japan
India
USA
Europe
Oceania
South/East Asia
South Asia
North America
South/Central America
Former Soviet Union
Middle East/North Africa
Sub-Saharan Africa
Household direct Household indirect Government Investment
Sub-Saharan Africa
Middle East/North Africa
Former Soviet Union
South/Central America
North America
South Asia
South/East Asia
Oceania
Europe
USA
India
Japan
China
GHG Total (GtCO2e)
Note: Direct household concern emission from the household proper (e.g. heating, cooking, car use); indirect emissions are caused in the life cycle of products purchased (e.g. electricity)
18
consumption drives
The production of goods and services for
household consumption
is the most important cause for
greenhouse gas emissions
Therefore, a second approach has been developed, called Environmentally Extended Input Output Analysis (EE IOA). This approach uses economic input-output tables (IOTs) from National Statistical offices, and complements it with data on emissions and resource extraction by sector. Such data allow the calculation of the primary resource use and emissions per Dollar or Euro turnover in a sector. The IOT further indicates the amount of goods and services one industry sector buys from another industry sector in order to produce its output. This allows us to calculate
how much different industry sectors have contributed to the added value of a product sold for final household or government consumption. When the emissions and resource use (ie ‘Pressure’) per unit of added value per sector known, we can estimate the impacts per final consumption category. Although it is less specific about individual products, this approach has the advantage that the majority of emissions and resource uses in a country are fully allocated to final consumption categories – the accounting system is inherently consistent and complete.
0%
10%
20%
30%
40%
50%
60%
70%
80%
90%
100%
Annu
al en
ergy
use
[kW
/c]
Other
Transport
Housing
Food
Australia 1993
Austria 2000
Beijing 2007
Brazil 1995
Denmark 1992
Germany 1988
India 1993
Japan 1995
Nederlands 1996
New Zealand 1980
Norway 1997
Sweden 2002
UK 1996
USA 2002
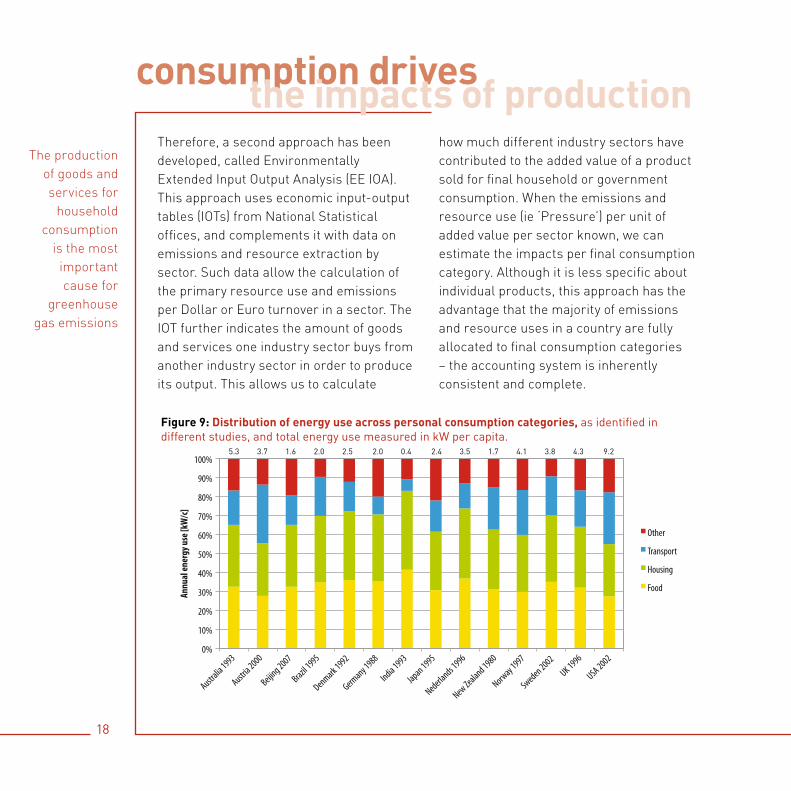
Figure 9: Distribution of energy use across personal consumption categories, as identified in different studies, and total energy use measured in kW per capita.
the impacts of production
5.3 3.7 1.6 2.0 2.5 2.0 0.4 2.4 3.5 1.7 4.1 3.8 4.3 9.2
19
consumption drives An important limitation of consumption-based analysis is that studies mostly have been done for CO2 and energy use only. Most studies also have been done at country rather than global level, since consistent EE IO datasets at global level, and that are harmonized across countries, are still lacking.
Results
Not only households consume
Often, final consumption is understood as consumption by households. Indeed, in virtually all countries in the world household consumption forms the main part of the
Gross Domestic Product (GDP). There are however two other final consumption categories that are also relevant. First, governments are responsible for final consumption as well. Second, a part of the production in a country is (re)invested as capital goods or infrastructure.
Figure 8 provides insight in the CO2 emissions from household consumption, government consumption and investment in various parts of the world. In line with its dominant share in GDP, household consumption is responsible for the majority of CO2 emissions. Government consumption and investment is less relevant, with the exception of China. China’s massive
Pr
ior
ity
c
on
su
mp
tio
n
clu
st
er
s
0%
10%
20%
30%
40%
50%
60%
70%
80%
90%
100%
Gree
nhou
se g
as em
issio
ns [t
/c/y]
Other Transport Housing Food
Australia 1993-94
Austria 2000
Beijing 2007
Denmark 2000
Germany 2000
EU25
France 1990
Hungary 2000
Italy 2000
Japan 1995
Nederlands 2000
Norway 2000
Slovakia 2000
Spain 2000
Sweden 2000
Switzerland 2002-2005
UK 2004
USA 2004
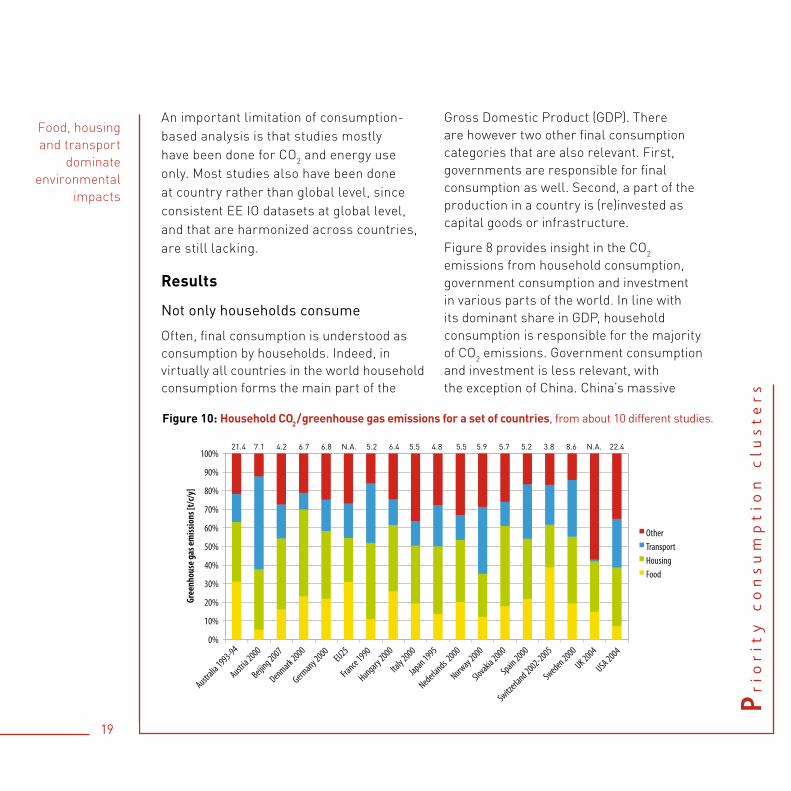
Figure 10: Household CO2/greenhouse gas emissions for a set of countries, from about 10 different studies.
21.4 7.1 4.2 6.7 6.8 N.A. 5.2 6.4 5.5 4.8 5.5 5.9 5.7 5.2 3.8 8.6 N.A. 22.4
Food, housing and transport
dominate environmental
impacts
20
investment in infrastructure and production capacity is reflected by a high share of investment to its CO2 emissions.
Impacts of household consumption
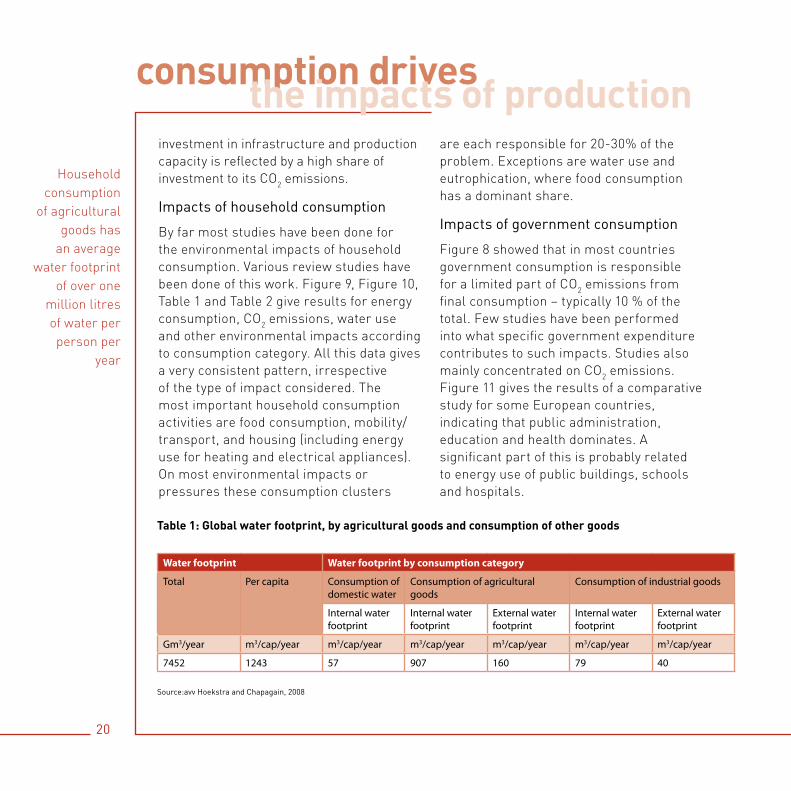
By far most studies have been done for the environmental impacts of household consumption. Various review studies have been done of this work. Figure 9, Figure 10, Table 1 and Table 2 give results for energy consumption, CO2 emissions, water use and other environmental impacts according to consumption category. All this data gives a very consistent pattern, irrespective of the type of impact considered. The most important household consumption activities are food consumption, mobility/transport, and housing (including energy use for heating and electrical appliances). On most environmental impacts or pressures these consumption clusters
are each responsible for 20-30% of the problem. Exceptions are water use and eutrophication, where food consumption has a dominant share.
Impacts of government consumption
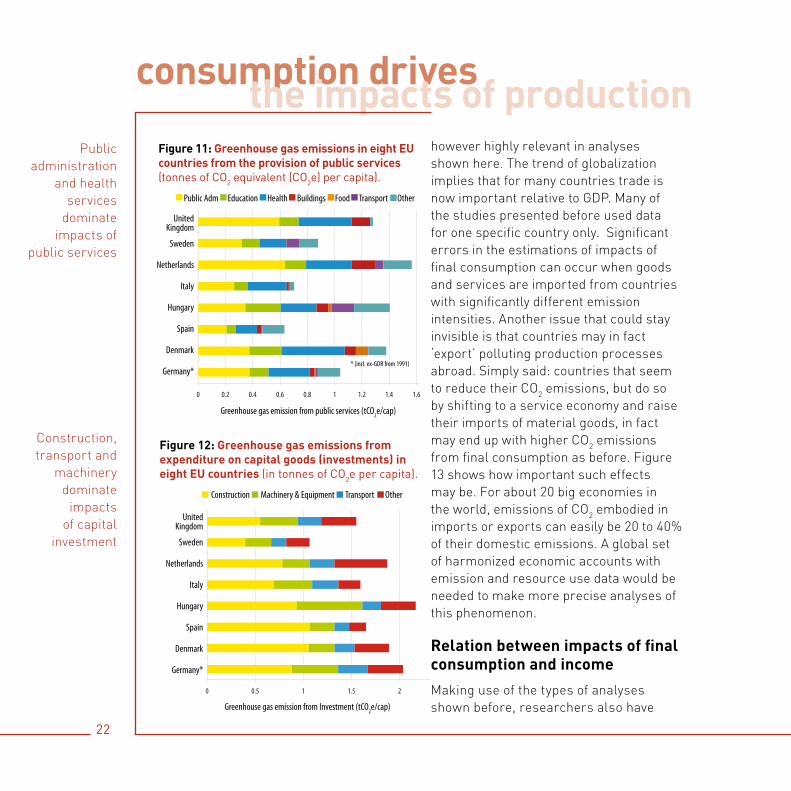
Figure 8 showed that in most countries government consumption is responsible for a limited part of CO2 emissions from final consumption – typically 10 % of the total. Few studies have been performed into what specific government expenditure contributes to such impacts. Studies also mainly concentrated on CO2 emissions. Figure 11 gives the results of a comparative study for some European countries, indicating that public administration, education and health dominates. A significant part of this is probably related to energy use of public buildings, schools and hospitals.
Water footprint Water footprint by consumption category
Total Per capita Consumption of domestic water
Consumption of agricultural goods
Consumption of industrial goods
Internal water footprint
Internal water footprint
External water footprint
Internal water footprint
External water footprint
Gm3/year m3/cap/year m3/cap/year m3/cap/year m3/cap/year m3/cap/year m3/cap/year
7452 1243 57 907 160 79 40
Table 1: Global water footprint, by agricultural goods and consumption of other goods
consumption drives the impacts of production
Source:avv Hoekstra and Chapagain, 2008
Household consumption
of agricultural goods has
an average water footprint
of over one million litres of water per person per
year

21
Table 2: Contribution of different consumption categories to the impacts assessed in the EIPRO study
COICOP Category
Abiotic depletion
Global warm-
ing
Photo-chemical oxidation
Acidifi-cation
Eutrophi-cation
Human Toxicity
Potential
Eco- toxicity
Expendi-ture
CP01+CP02 Food and bever-ages, tobacco and narcotics
22% 31% 27% 31% 60% 26% 34% 19%
CP03 Clothing and footwear
2% 2% 3% 2% 5% 3% 6% 3%
CP04+CP05: Housing, furni-ture, equipment and utility use
35% 24% 22% 26% 10% 21% 20% 25%
CP06 Health 2% 2% 2% 2% 1% 2% 1% 4%
CP07 Transport 20% 19% 20% 14% 6% 25% 15% 14%
CP08 Communi-cations
2% 2% 2% 2% 1% 2% 2% 4%
CP09 Recreation and culture
5% 6% 7% 7% 4% 7% 7% 9%
CP10 Education 0% 1% 1% 1% 0% 1% 1% 1%
CP11 Restau-rants and hotels
7% 9% 9% 10% 13% 8% 9% 10%
CP12 Miscel-laneous goods and services
5% 5% 7% 6% 2% 6% 6% 10%
Impacts of capital investment
Also for capital investment, few studies have been performed into what specific investment expenditures contribute to impacts. Figure 12 gives the results of a comparative study for some European
countries, indicating that construction, transport and machinery dominate.
Relevance of imports and exports
Imports and exports do not form a final consumption category. They are
consumption drives
Pr
ior
ity
c
on
su
mp
tio
n
clu
st
er
s
Source: Huppes et al., 2006
22
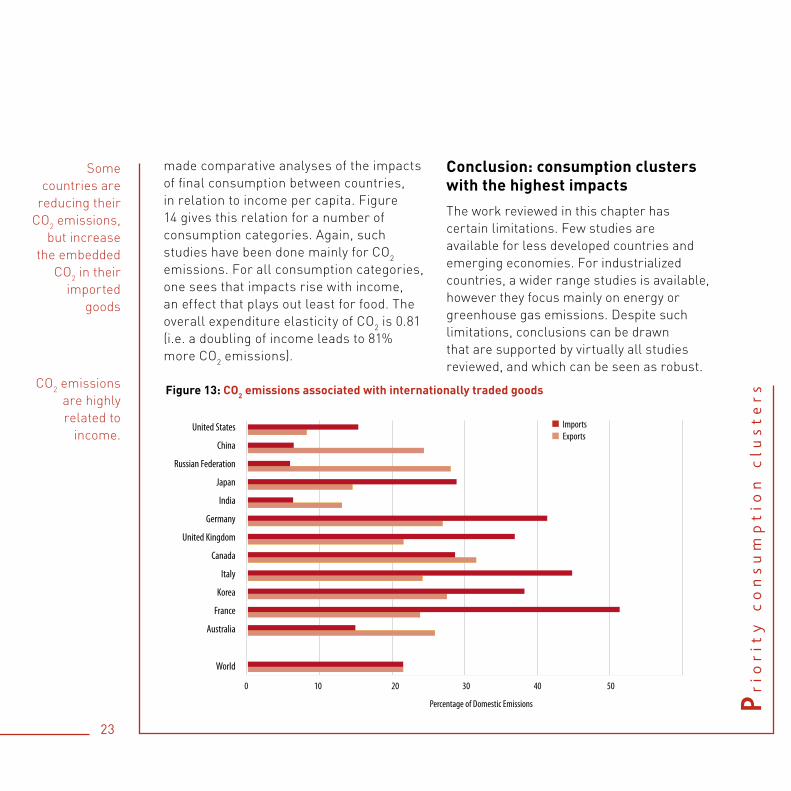
however highly relevant in analyses shown here. The trend of globalization implies that for many countries trade is now important relative to GDP. Many of the studies presented before used data for one specific country only. Significant errors in the estimations of impacts of final consumption can occur when goods and services are imported from countries with significantly different emission intensities. Another issue that could stay invisible is that countries may in fact ‘export’ polluting production processes abroad. Simply said: countries that seem to reduce their CO2 emissions, but do so by shifting to a service economy and raise their imports of material goods, in fact may end up with higher CO2 emissions from final consumption as before. Figure 13 shows how important such effects may be. For about 20 big economies in the world, emissions of CO2 embodied in imports or exports can easily be 20 to 40% of their domestic emissions. A global set of harmonized economic accounts with emission and resource use data would be needed to make more precise analyses of this phenomenon.
Relation between impacts of final consumption and income
Making use of the types of analyses shown before, researchers also have
consumption drives the impacts of productionFigure 11: Greenhouse gas emissions in eight EU countries from the provision of public services (tonnes of CO2 equivalent (CO2e) per capita).
* (incl. ex-GDR from 1991)
Figure 12: Greenhouse gas emissions from expenditure on capital goods (investments) in eight EU countries (in tonnes of CO2e per capita).
0 0.5 1 1.5 2 2.5
Germany*
Denmark
Spain
Hungary
Italy
Netherlands
Sweden
United Kingdom
Construction Machinery & Equipment Transport Other
Greenhouse gas emission from Investment (tCO2e/cap)
United Kingdom
Sweden
Netherlands
Italy
Hungary
Spain
Denmark
Germany*
Construction Machinery & Equipment Transport Other
0 0.2 0.4 0.6 0.8 1 1.2 1.4 1.6
Germany*
Denmark
Spain
Hungary
Italy
Netherlands
Sweden
United Kingdom
Public Adm Education Health Buildings Food Transport Other
* (incl. ex-GDR from 1991)
Greenhouse gas emission from public services (tCO2e/cap)
United Kingdom
Sweden
Netherlands
Italy
Hungary
Spain
Denmark
Germany*
Public Adm Education Health Buildings Food Transport Other
Public administration
and health services
dominate impacts of
public services
Construction, transport and
machinery dominate
impacts of capital
investment
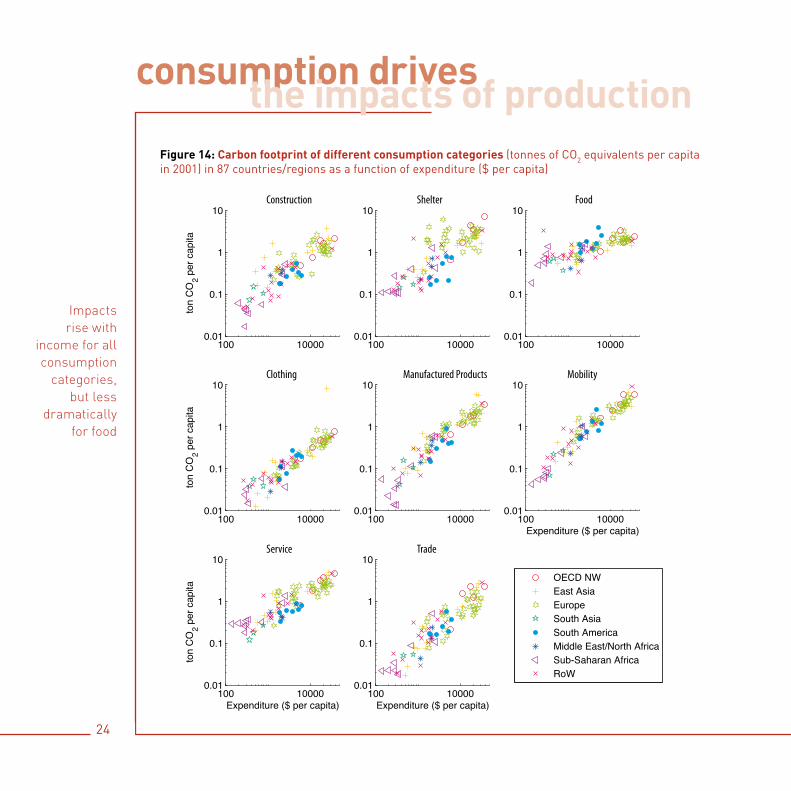
made comparative analyses of the impacts of final consumption between countries, in relation to income per capita. Figure 14 gives this relation for a number of consumption categories. Again, such studies have been done mainly for CO2 emissions. For all consumption categories, one sees that impacts rise with income, an effect that plays out least for food. The overall expenditure elasticity of CO2 is 0.81 (i.e. a doubling of income leads to 81% more CO2 emissions).
Conclusion: consumption clusters with the highest impacts
The work reviewed in this chapter has certain limitations. Few studies are available for less developed countries and emerging economies. For industrialized countries, a wider range studies is available, however they focus mainly on energy or greenhouse gas emissions. Despite such limitations, conclusions can be drawn that are supported by virtually all studies reviewed, and which can be seen as robust.
23
CO2 emissions are highly related to
income.
Some countries are
reducing their CO2 emissions,
but increase the embedded
CO2 in their imported
goods
Pr
ior
ity
c
on
su
mp
tio
n
clu
st
er
s
Federation
Figure 13: CO2 emissions associated with internationally traded goods
Percentage of Domestic Emissions
0 10 20 30 40 50
ImportsExports
United States
China
Russian Federation
Japan
India
Germany
United Kingdom
Canada
Italy
Korea
France
Australia
World
24
100 100000.01
0.1
1
10
ton
CO
2 per
cap
ita
100 100000.01
0.1
1
10
100 100000.01
0.1
1
10
100 100000.01
0.1
1
10
ton
CO
2 per
cap
ita
100 100000.01
0.1
1
10
100 100000.01
0.1
1
10
Expenditure ($ per capita)
100 100000.01
0.1
1
10
Expenditure ($ per capita)
ton
CO
2 per
cap
ita
100 100000.01
0.1
1
10
Expenditure ($ per capita)
OECD NWEast AsiaEuropeSouth AsiaSouth AmericaMiddle East/North AfricaSub-Saharan AfricaRoW
Construction Shelter Food
Clothing Manufactured Products
Service Trade
Mobility
Figure 14: Carbon footprint of different consumption categories (tonnes of CO2 equivalents per capita in 2001) in 87 countries/regions as a function of expenditure ($ per capita)
consumption drives the impacts of production
Impacts rise with
income for all consumption
categories, but less
dramatically for food
Priority product groups and final 1. consumption categories
In most countries household a. consumption determines 60% or more of the life cycle impacts of final consumption. Within household consumption:
In 1. developing and emerging countries, food and housing dominate greenhouse gas emissions. For 2. industrialized countries, all studies indicate that housing, mobility, food and electrical appliances typically determine over 70% of the impacts of household consumption.
Government consumption and b. investment in infrastructure and capital goods is less relevant than household consumption. Yet, for non-Asian developing countries the public sector is often a relatively large part of the economy and hence also in terms of environmental pressure. Many emerging economies in Asia currently make large investments in building up their infrastructure, which makes this final expenditure category influential.
The role of imports and exports. 2. Emerging economies (particularly in Asia) have developed themselves as exporters of large amounts of products to developed countries. As a consequence, impacts driven by consumption in developed countries are in part translocated to countries where production takes place.
We see further in general a rise of energy use and greenhouse gas emissions from final consumption with rising wealth. This is evident both from cross-country compari-sons and from cross-sectional studies of households within individual countries.
25
consumption drives
Pr
ior
ity
c
on
su
mp
tio
n
clu
st
er
s

Priority Materials
different materials have different impacts
Pr
ior
ity
m
at
er
ial
s
How the assessment was done
Materials are used as fundamental inputs to production and manufacturing. A material can be defined at different stages in the life cycle: unprocessed raw materials, intermediates and finished materials. The materials perspective helps companies and policy makers to understand which shifts in the materials base of production and consumption could help to reduce impacts. Like all work in this report, this analysis was based on a comparative review of existing studies.
Materials can be assessed on impacts individually. Yet, in order to be able to define priorities, an approach is needed that brings the different materials together in one framework. Several integrative approaches exist that include materials of different types in a single framework.
A first approach is Material Flow Accounting (MFA). MFA offers a complete overview of all inputs and outputs of national economies in terms of material, or rather, mass flows. Inputs are imports and extractions from the domestic environment. Exports are outputs. The difference (import + extraction – exports)
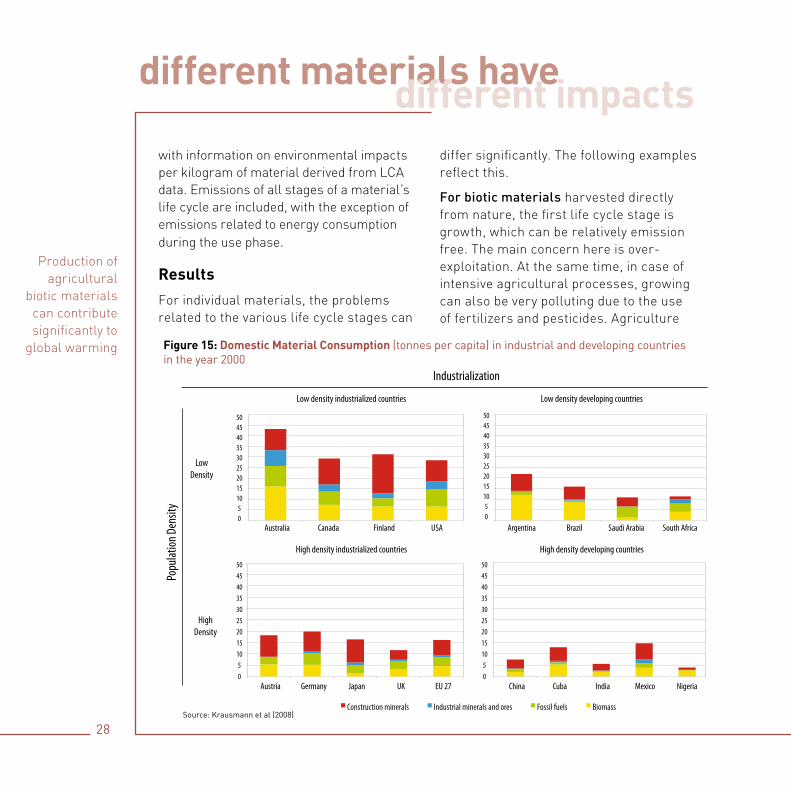
is the total accumulation within the economy and the domestic generation of waste and emissions. Indicators derived from MFA, such as Domestic Material Consumption (DMC) represent total material inputs or consumption. These accounts and indicators, all expressed in kg material use, can be broken down into different material categories (Figure 15).
Such mass-based indicators give useful and general insights into historical developments, especially when distinguished according to material classes. However, a priority setting based on such indicators would imply that the weight of the flows is the only relevant criterion. Yet, it is also known that both the flows and the impacts per kg appear to vary between materials by about 12 orders of magnitude. This suggests that both mass and impact per kg is relevant.
Therefore, a second approach has been developed to compare different materials in terms of their environmental impacts. It is called Environmentally weighted Material Consumption (EMC). This approach combines the information on flows of specific materials derived from e.g. MFA accounts,
27
different materials have different impactsThe use of biotic materials and fossil fuels are most critical. Metals have high impacts per kilogram but often are small mass flows. Building materials are high mass flows but have low impacts per kilogram.
Two main assessment routes exist:
counting kg of material use, or weighting material use according to
impact per kg
28
with information on environmental impacts per kilogram of material derived from LCA data. Emissions of all stages of a material’s life cycle are included, with the exception of emissions related to energy consumption during the use phase.
Results
For individual materials, the problems related to the various life cycle stages can
differ significantly. The following examples reflect this.
For biotic materials harvested directly from nature, the first life cycle stage is growth, which can be relatively emission free. The main concern here is over-exploitation. At the same time, in case of intensive agricultural processes, growing can also be very polluting due to the use of fertilizers and pesticides. Agriculture
Figure 15: Domestic Material Consumption (tonnes per capita) in industrial and developing countries in the year 2000
different materials have different impacts
Production of agricultural
biotic materials can contribute significantly to
global warming
-
5.0
10.0
15.0
20.0
25.0
30.0
35.0
40.0
45.0
50.0
Australia Canada Finland USA
Low density industrialized countries
-
5.0
10.0
15.0
20.0
25.0
30.0
35.0
40.0
45.0
50.0
Argentina Brazil Saudi Arabia South Africa
Low density developing countries
-
5.0
10.0
15.0
20.0
25.0
30.0
35.0
40.0
45.0
50.0
Austria Germany Japan UK EU 27
High density industrialized countries
-
5.0
10.0
15.0
20.0
25.0
30.0
35.0
40.0
45.0
50.0
China Cuba India Mexico Nigeria
High density developing countries
Low Density
Low density industrialized countries
Australia Canada Finland USA Argentina Brazil Saudi Arabia South Africa
NigeriaMexicoIndiaCubaChinaEU 27UKJapanGermanyAustria
50454035302520151050
50454035302520151050
50454035302520151050
50454035302520151050
High density industrialized countries
Low density developing countries
High density developing countries
High Density
Popu
lation
Den
sity
Industrialization
Construction minerals Industrial minerals and ores Fossil fuels Biomass Source: Krausmann et al (2008)
29
Pr
ior
ity
m
at
er
ial
s
also puts a high pressure on land and water use, as well as energy use (in case of production in greenhouses).
For fossil materials (fuels and chemicals) the extraction and refinery and to a lesser extent the production stages are relatively less important. The main impact of fossil fuels is related to their use in combustion processes. Chemicals can have large environmental impacts, depending on their composition, the nature of their use and their end-of-life management.
For metals, the mining and refinery stage is often very energy intensive, causing fossil-fuel-related emissions. Some metals like cadmium and lead have toxic properties, and hence can cause problems when emitted along their life cycle.
Construction minerals (sand, gravel, clay) are used in very large quantities. Yet they are seldom associated with scarcity problems or large environmental impacts. An exception is cement production, which causes high CO2 emissions due to calcination and fossil fuel use.
Animal products and
fossil fuels dominate
contributions to global
environmental problems
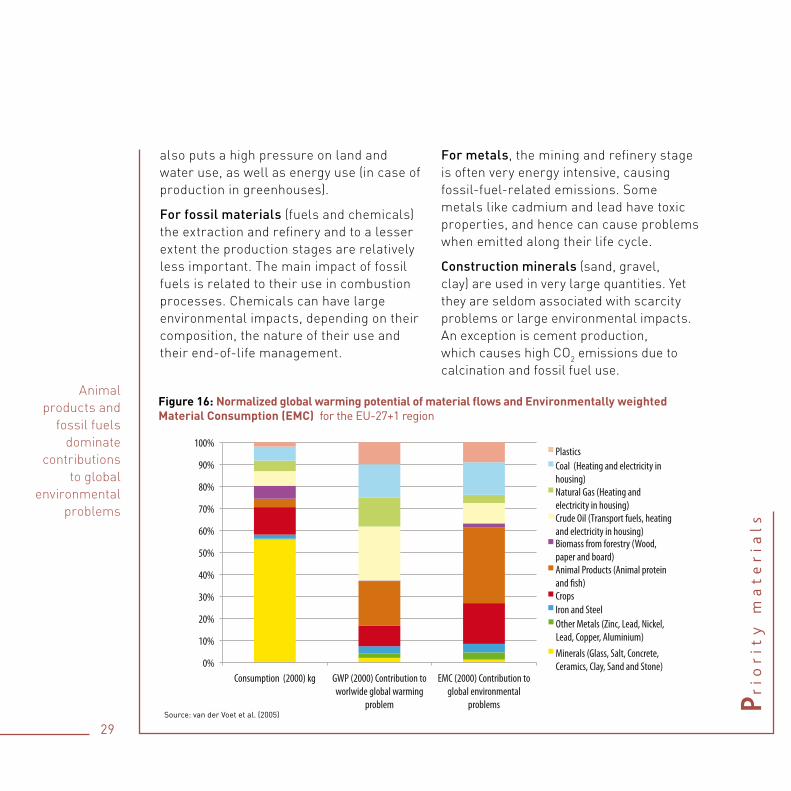
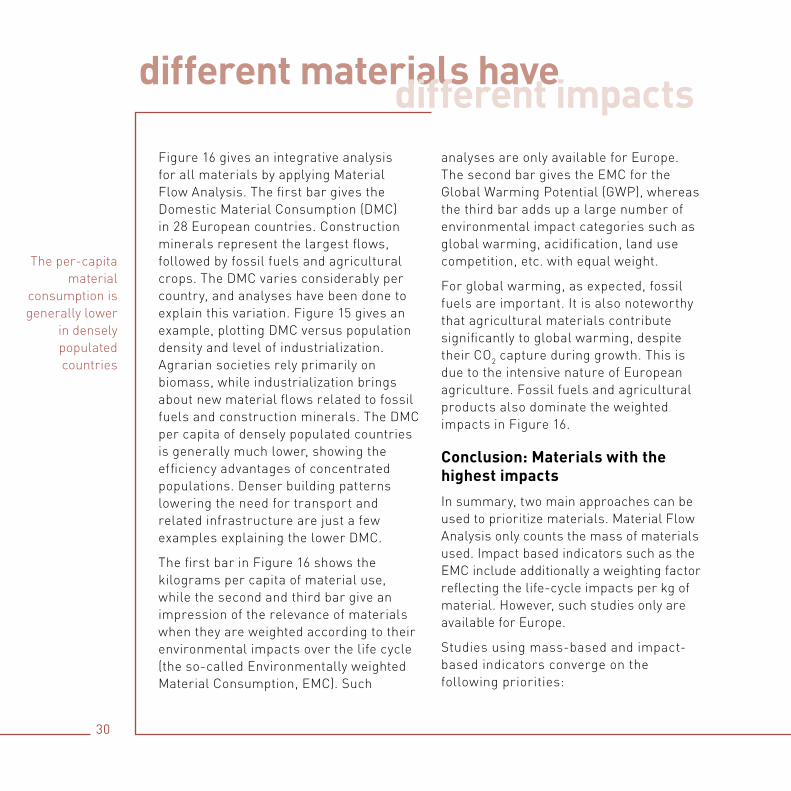
Figure 16: Normalized global warming potential of material flows and Environmentally weighted Material Consumption (EMC) for the EU-27+1 region
0%
10%
20%
30%
40%
50%
60%
70%
80%
90%
100%
Consumption (2000) kg GWP (2000) Contribution to worlwide global warming
problem
EMC (2000) Contribution to global environmental
problems
Plastics Coal (Heating and electricity in housing) Natural Gas (Heating and electricity in housing) Crude Oil (Transport fuels, heating and electricity in housing) Biomass from forestry (Wood, paper and board) Animal Products (Animal protein and sh) Crops Iron and Steel Other Metals (Zinc, Lead, Nickel, Lead, Copper, Aluminium) Minerals (Glass, Salt, Concrete, Ceramics, Clay, Sand and Stone)
different materials have
Source: van der Voet et al. (2005)
30
Figure 16 gives an integrative analysis for all materials by applying Material Flow Analysis. The first bar gives the Domestic Material Consumption (DMC) in 28 European countries. Construction minerals represent the largest flows, followed by fossil fuels and agricultural crops. The DMC varies considerably per country, and analyses have been done to explain this variation. Figure 15 gives an example, plotting DMC versus population density and level of industrialization. Agrarian societies rely primarily on biomass, while industrialization brings about new material flows related to fossil fuels and construction minerals. The DMC per capita of densely populated countries is generally much lower, showing the efficiency advantages of concentrated populations. Denser building patterns lowering the need for transport and related infrastructure are just a few examples explaining the lower DMC.
The first bar in Figure 16 shows the kilograms per capita of material use, while the second and third bar give an impression of the relevance of materials when they are weighted according to their environmental impacts over the life cycle (the so-called Environmentally weighted Material Consumption, EMC). Such
analyses are only available for Europe. The second bar gives the EMC for the Global Warming Potential (GWP), whereas the third bar adds up a large number of environmental impact categories such as global warming, acidification, land use competition, etc. with equal weight.
For global warming, as expected, fossil fuels are important. It is also noteworthy that agricultural materials contribute significantly to global warming, despite their CO2 capture during growth. This is due to the intensive nature of European agriculture. Fossil fuels and agricultural products also dominate the weighted impacts in Figure 16.
Conclusion: Materials with the highest impacts
In summary, two main approaches can be used to prioritize materials. Material Flow Analysis only counts the mass of materials used. Impact based indicators such as the EMC include additionally a weighting factor reflecting the life-cycle impacts per kg of material. However, such studies only are available for Europe.
Studies using mass-based and impact-based indicators converge on the following priorities:
different materials have different impacts
The per-capita material
consumption is generally lower
in densely populated countries
31
Agricultural goods and biotic 1. materials. Studies converge on their importance. Particularly impact based studies further highlight the relative importance of animal products, due to their indirect consumption of a large proportion of the world’s crops, resulting in high land use as a consequence.
Fossil fuels and materials2. . Studies converge on their importance. Fossil fuel combustion is the most important source of most emissions-related impact categories. Plastics are
important in terms of impacts among materials.
Metals3. . Although many metals have high impacts per kg compared to other materials, in view of the comparative size of their flows, only iron, steel and aluminium enter the priority lists.
The studies do not agree on the importance of construction materials. They show up as important in studies using mass based indicators such as the Domestic Material Consumption (DMC), but not in all studies that also include a measure for impact per kilogram of material.
Pr
ior
ity
m
at
er
ial
s
different materials have

Conclusions & Outlook
robust, science- based results
33
Key priorities: fossil fuels and agriculture
A wealth of studies is available that helped to the most important causes of environmental impacts from a production, consumption and materials perspective. These different studies, and different perspectives points, paint a consistent overall picture.
Agriculture and food consumption• are identified as one of the most important drivers of environmental pressures, especially habitat change, climate change, water use and toxic emissions. The use of• fossil energy carriers for heating, transportation and the production of manufactured goods is of comparable importance, causing the depletion of fossil energy resources, climate change, and a wide range of emissions-related impacts.
Outlook: growth as usual will enhance pressures
The impacts related to these activities are unlikely to be reduced, but rather enhanced, in a business-as-usual scenario. By looking at the consumption perspective, the assessment showed that CO2 emissions are highly correlated with
income. Population and economic growth will hence lead to higher impacts, unless patterns of production and consumption can be changed. Impact reduction strategies may include the shift to clean and efficient technologies (production perspective), shifts to less material-based, more sustainable life styles as well as the use of low impact products (consumption perspective), and the use of low impact materials (materials perspective). We further see that pollution embodied in international trade is of growing importance, and for many countries already significant compared to national impacts.
Developing impact reduction strategies has its complications. There are certain interlinkages between problems that may further aggravate them in future. For example, many proposed sustainable technologies for energy supply and mobility rely for a large part on the use of metals. Examples are batteries in electric cars, and components of solar cells and fuel cells. Metal refining usually is energy intensive. The production of such novel ‘clean-tech’ infrastructure may hence be energy-intensive, and create scarcity of certain materials, issues not yet investigated sufficiently. There is hence a need for analysis to evaluate trends, develop scenarios and identify sometimes C
on
clu
sio
ns
&
O
ut
loo
k
New technical infrastructure
may cause new problems.
robust, science- based resultsThe studies and perspectives reviewed in this assessment come to converging conclusions. Agriculture and food consumption, and processes using energy and fossil fuels cause the highest impacts.
34
Harmonizing existing data
gathering efforts internationally will help policy
making.
Box 1: Improving data situation and the basis for analytical capacity
An experience that occurred often in writing this report is that harmonized data across countries on emissions, resource extraction and economic activities are not available. This lack of harmonization is present across countries, but also for emission data, resource extraction data, and economic data within countries, that often are not given in the same sector classification. As a result, much of the analysis in Chapter 3 had to based on US data, and the most extensive analyses in Chapter 4 could only be done for Greenhouse Gases. Yet, the wealth of country studies that was reviewed shows there is a clear international interest into the type of analyses presented in this report, and indeed, that countries make resources available for such work. Furthermore, there are various international, harmonized databases providing pieces of the overall picture, such as the IEA energy database, the FAO databases on land use, water use and agricultural production, the UNFCCC greenhouse gas emission inventories, and others. Next to this, there are various large research projects ongoing into data harmonization, but these lack a formal status. Overall there seems a clear window of opportunity to improve harmonized environmental and economic data sets, and the Resource Panel recommends UNEP and other Intergovernmental Organizations to explore practical collaborative efforts across countries on this.
robust, science-based results
complicated trade-offs between one type of environmental impacts and another.
Harmonized data: essential for science-based improvement policies and monitoring
Most studies reviewed were done for individual countries or country blocks. They often applied somewhat different approaches and data classification systems. The fact that there is clear convergence in results despite such differences, indicates that the conclusions of the review in this
report are likely to be robust. It should be noted that in all areas (industrial production, consumption, materials) there is a significant opportunity to improve insights by regularly providing more analysis and better data in an internationally consistent format. This makes it much easier to monitor progress, to make cross-country and cross-sector analyses, and to identify in more detail the economic drivers that determine impacts, the factors that determine the success of policies, etc. A vision on improving this situation is provided in Box 1.

Abbreviations and acronyms
COICOP Classification of Individual Consumption According to Purpose
DMC Domestic Material ConsumptionDPSIR Driving force – Pressure – State –
Impact – ResponseEE IOA Environmentally Extended Input
Output analysisEEA European Environment AgencyEMC Environmentally weighted Material
ConsumptionEU European UnionFAO Food and Agriculture Organisation
of the United NationsGDP Gross Domestic ProductGHG Greenhouse GasGWP Global Warming PotentialIEA International Energy AgencyIOT input-output tablesIPCC Intergovernmental Panel on
Climate ChangeLCA Life Cycle AssessmentMA Millennium Ecosystem AssessmentMFA Material Flow AccountingOECD Organisation for Economic Co-
operation and DevelopmentPV cells Photovoltaic cellsUNEP United Nations Environment
Programme
Units
CO2eq carbon dioxide equivalentskW kilowattm3/cap/year cubic meter per capita per yearp.a. per annumt tonne
Chemical abbreviations
CO2 carbon dioxideCH4 methaneN2O nitrous oxideNOx nitrogen oxideSO2 sulphur dioxide
abbreviations, acronyms and units


www.unep.orgUnited Nations Environment Programme
P.O. Box 30552 Nairobi, KenyaTel.: ++254 (0) 20 762 1234Fax: ++254 (0) 20 762 3927Email: [email protected]
This report prepared by the International Panel for Sustainable Resource Management assesses best available science on the environmental and resource impacts of production and consumption. The assessment report identifies priorities amongst global consumption activities, industrial sectors and materials from primary industries in terms of their environmental impacts and their resource use. This can play a role in directing environmental and resource policy to those areas that really matter. Environmental impacts occur at all stages in the life cycles of products and materials. They are often connected to land use, combustion of fuels, industrial processes, the dispersive use of materials (e.g., fertilizers), or resource extraction (including biomass and minerals). The report regards also the rapidly increasing international trade and economic activities leading to the translocation of environmental impacts of consumption to other countries. There is a significant opportunity to improve the basis for decision-making by assessing best available scientific information from a global perspective in order to direct attention of decision-makers to the big problems first, while avoiding burden shifting in time, space and between environmental impacts.
The work programme of the Working Group on the Environmental Impacts of Products and Materials complements other work in the Resource Panel on decoupling, biofuels, metals flows, and water efficiency.
For more information, contact:UNEP DTIESustainable Consumption and Production Branch15 Rue de Milan75441 Paris CEDEX 09FranceTel: +33 1 4437 1450Fax: +33 1 4437 1474E-mail: [email protected]