modeling sea level rise and its impacts - fpdl - florida state
TRANSCRIPT

And the Waters Will Rise…
But Where?
Dr. Tim Chapin
Department of Urban & Regional Planning
Florida State University
Presentation to the Project Technical Advisory Committee (PTAC)
Charlotte County, Florida
June 11, 2009

Modeling SLR and Its Impacts • As a key element of our larger project, we are assessing
the vulnerability of existing transportation infrastructure and development to sea level rise.
• To do this we have forecast where inundation will occur given a half meter and one meter rise in sea levels.
• This information will then be used:
– To complete a vulnerability assessment of the county’s transportation infrastructure (to be discussed later today),
– To help inform and shape several land use scenarios that the project team will be analyzing, and
– As a means of thinking about a range of policies and mitigation strategies in response to this issue.

SLR Hazard Profile • We are using two sea level rise scenarios:
– (1) 0.5 meter SLR (~1.6 ft) by the year 2050 and
– (2) 1.0 meter SLR (~3.3 ft) by the year 2100
• We also are assessing the impacts of a Category 2 storm surge upon existing transportation infrastructure and development.
• This Hazard Profile was reviewed and approved by the PTAC at a project meeting in December 2008.
Modeling Sea Level Rise • We modeled SLR using a simple “bathtub model”, in
which water is raised to a certain height (as in filling a bathtub).
• Under this approach, those areas that are contiguous to the coast and below a certain elevation are assumed to be vulnerable to sea level rise.
• Note that this approach does not take into account other natural changes that occur with SLR, such as erosion and sedimentation.
• However, this approach provides information on those areas and infrastructure elements likely vulnerable to SLR.
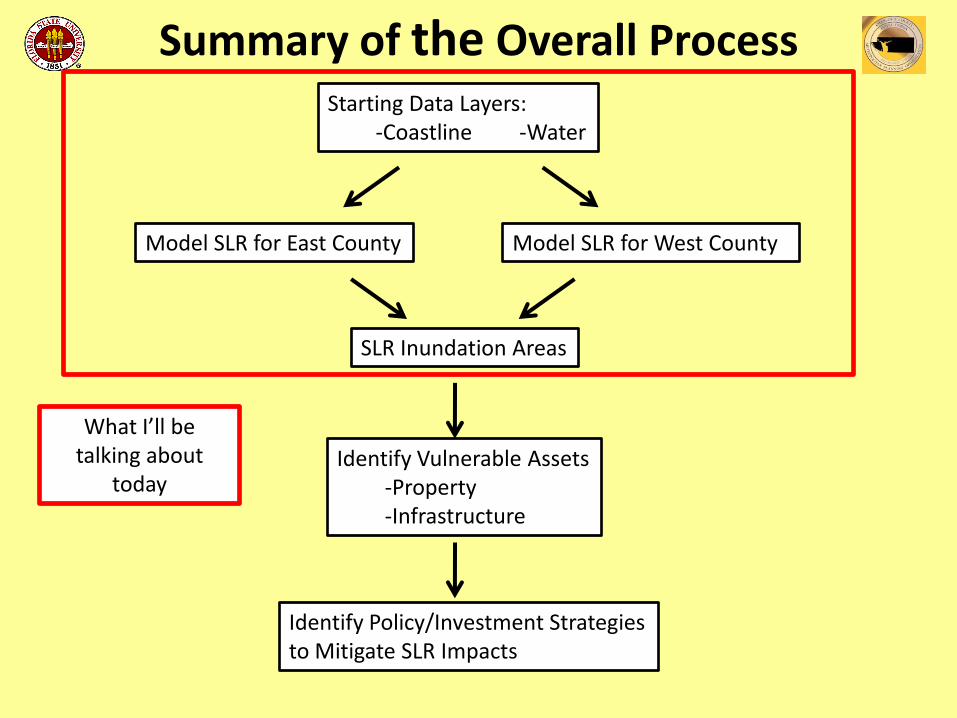
Summary of the Overall Process Starting Data Layers:
-Coastline -Water
Model SLR for East County Model SLR for West County
SLR Inundation Areas
Identify Vulnerable Assets -Property -Infrastructure
Identify Policy/Investment Strategies to Mitigate SLR Impacts
What I’ll be talking about
today

Detailed Coastline and Water Layers
Based upon the Florida Land Use and Cover Classification System (FLUCCS)

East vs. West County • Because of the types of GIS data available, the county was
broken into two pieces – East County and West County.
• Eastern Charlotte County was based upon a digital elevation models (DEMs) obtained from the SWFWMD.
• Western Charlotte County was based upon LIDAR (LIght Detection And Ranging) data that are being generated for coastal areas throughout Florida. These data were ultimately turned into DEMs as well.
• DEM Attributes:
– Cell size: 5 feet X 5 feet
– Maximum Horizontal Resolution: 3.8 feet
– Maximum Vertical Resolution: 0.6 feet

Example DEM for East County

Example LIDAR Data

Summary of SLR Model Methodology
• Those areas of the county that are 0.5 meter or 1.0 meter and lower in elevation and that are contiguous with the Charlotte County coastline were identified as areas likely to be inundated due to rising sea levels.
• In selecting only areas contiguous to the coast, this ensures that only those locations actually exposed to the Gulf, Charlotte Harbor and its tributaries were included in the inundation polygons.
• Low lying areas not adjacent to coastal waters were not identified as areas vulnerable to SLR.

The SLR Model Results

Current Conditions

Half Meter Sea Level Rise (ca. 2050)

One Meter Sea Level Rise (ca. 2100)

Cape Haze Peninsula

Upper Barrier Islands

Mid-Charlotte County

Punta Gorda and Environs

Adjusted Storm Surge Zones • A second GIS analysis modified the Category 2 storm
surge zone to account for increases in sea level rise
• The Cat 2 storm surge zone is roughly equivalent to a temporary 8 foot rise in water levels.
• We modeled an expanded Cat 2 storm surge boundary in much the same way as the inundation polygons were created.
– We took the existing Cat 2 Storm Surge Boundary and expanded this boundary by raising the water a half meter and one meter, respectively.
• These new boundaries reflect a reasonable estimate of the Cat 2 storm surge zones under the two SLR scenarios (0.5 meter and 1.0 meter).

Existing Cat 2 Storm Surge Boundary

Cat 2 Storm Surge Plus ½ Meter SLR
Zoom 1
Zoom 2

Cat 2 Storm Surge Plus ½ Meter SLR

Cat 2 Storm Surge Plus ½ Meter SLR

Cat 2 Storm Surge Plus 1 Meter SLR
Zoom 1
Zoom 2

Cat 2 Storm Surge Plus 1 Meter SLR

Cat 2 Storm Surge Plus 1 Meter SLR

Important Caveats • Ultimately the results of the GIS analyses reflect our
forecast of where inundation will occur given a half meter and one meter rise in sea levels.
• Data Quality: We have used the best available data for these models, but these data are not without their problems (e.g. resolution is very good but not perfect).
• No Mitigation Assumption: We have assumed no further investments in hardening the coast or other attempts at mitigating SLR by the county, by the state, or by the federal government.
• Conclusion: Overall, these data are useful for planning purposes on the county level, but they should not be used to determine which individual parcels will be under water in 50 or 100 years.