modeling regional coral reef responses to global … › content › pdf › 10.1007 ›...
TRANSCRIPT

Climatic Change (2011) 109:375–397DOI 10.1007/s10584-011-0022-z
Modeling regional coral reef responses to globalwarming and changes in ocean chemistry:Caribbean case study
R. W. Buddemeier · Diana R. Lane · J. A. Martinich
Received: 11 May 2009 / Accepted: 3 December 2010 / Published online: 11 February 2011© The Author(s) 2011. This article is published with open access at Springerlink.com
Abstract Climatic change threatens the future of coral reefs in the Caribbean andthe important ecosystem services they provide. We used a simulation model [Combo(“COral Mortality and Bleaching Output”)] to estimate future coral cover in thepart of the eastern Caribbean impacted by a massive coral bleaching event in 2005.Combo calculates impacts of future climate change on coral reefs by combiningimpacts from long-term changes in average sea surface temperature (SST) and oceanacidification with impacts from episodic high temperature mortality (bleaching)events. We used mortality and heat dose data from the 2005 bleaching event to selecthistoric temperature datasets, to use as a baseline for running Combo under differentfuture climate scenarios and sets of assumptions. Results suggest a bleak future forcoral reefs in the eastern Caribbean. For three different emissions scenarios fromthe Intergovernmental Panel on Climate Change (IPCC; B1, A1B, and A1FI), coralcover on most Caribbean reefs is projected to drop below 5% by the year 2035, iffuture mortality rates are equivalent to some of those observed in the 2005 event(50%). For a scenario where corals gain an additional 1–1.5◦C of heat tolerancethrough a shift in the algae that live in the coral tissue, coral cover above 5% isprolonged until 2065. Additional impacts such as storms or anthropogenic damagecould result in declines in coral cover even faster than those projected here. Theseresults suggest the need to identify and preserve the locations that are likely to havea higher resiliency to bleaching to save as many remnant populations of corals aspossible in the face of projected wide-spread coral loss.
R. W. BuddemeierKansas Geological Survey, 1930 Constant Avenue, Lawrence, KS 66047, USA
D. R. Lane (B)Stratus Consulting Inc., P.O. Box 4059, Boulder, CO 80306-4059, USAe-mail: [email protected]
J. A. MartinichClimate Change Division (6207-J), U.S. Environmental Protection Agency,1200 Pennsylvania Avenue, NW, Washington, DC 20460, USA

376 Climatic Change (2011) 109:375–397
1 Introduction
The Caribbean is home to approximately 21,000–26,000 km2 of coral reefs (Burkeand Maidens 2004; Spalding and Grenfell 1997). These coral reefs are ecologicallydiverse and complex ecosystems, providing a variety of ecosystem services [definedas the benefits that humans derive from these ecosystems (see Costanza et al.1997)]. These ecosystem services, such as the provisioning of habitat for fish rearing,have ecological, cultural, and economic values (Millennium Ecosystem Assessment2005). In the Caribbean, coral reefs provide an estimated $3.1–4.6 billion annually(USD in 2000) in fishing, tourism, and shoreline protection services (Burke andMaidens 2004). Inclusion of ecosystem service values associated with biodiversity,bioprospecting, and other existence values could substantially increase these esti-mates (Burke and Maidens 2004; Llewellyn 1998).
The ecosystem services provided by coral reefs in the Caribbean are at risk fromshort-term and long-term threats to the structure and productivity of reefs (Burkeand Maidens 2004). These risks are especially grave in the Caribbean, althoughsimilar risks exist for reefs worldwide (Knowlton 2001a). In late 2005, a massivecoral bleaching event impacted reefs across the Eastern Caribbean. This event ledto immediate mortality for some corals and additional mortality over the next fewyears, as corals made more vulnerable by bleaching succumbed to disease (Jeffreyet al. 2006; Rogers 2008; Rogers et al. 2008). Bleaching describes the process whereinreef-building corals lose their symbiotic, intracellular algae—these algae give coralstheir characteristic colors, but more importantly, also supply much of the hostinvertebrate’s nutritional requirements through photosynthesis. Bleaching can occurwhen there are unusually high ocean temperatures combined with high light intensityand calm water conditions. Corals can recover from mild or moderate bleachingepisodes by regaining their symbioses with intracellular algae, but prolonged, intenseor repeated bleaching can prove fatal to the host coral.
Donner et al. (2007) analyzed and modeled the 2005 bleaching event and con-cluded not only that levels of thermal stress from SST were the highest ever recordedin the Caribbean in a satellite record extending from 1984–2005, but also thatanthropogenic climate change played a clear role in causing this bleaching event.That is, the event would have been highly improbable in the absence of human-influenced ocean warming over the past several decades.
Given the importance of coral reefs to the economy and ecology of the Caribbean,there is a clear need to evaluate future risks to corals in this region from continuedclimate change impacts. In the long-term, climate change threatens reefs for tworeasons: (1) increased acidification of the surface layer of the ocean, due to increasingatmospheric concentrations of carbon dioxide (CO2), which makes it more difficultfor corals to form their calcium carbonate skeletons (Kleypas et al. 1999; Langdonet al. 2000), and (2) rising ocean temperatures that increase the risk of coralbleaching, as already discussed (e.g., Donner et al. 2005; Hoegh-Guldberg 1999;Knowlton 2001a). The objectives of this manuscript are to provide a reasonableprediction of the effects of both actors on future coral cover, and especially of therisk of future bleaching-induced mortality in the part of the eastern Caribbean thatexperienced significant heat stress during the 2005 bleaching event (Fig. 1).
To conduct our analyses, we used the Combo model, which integrates the impactsof future climate change (thermal and ocean chemistry effects) on coral growth and

Climatic Change (2011) 109:375–397 377
Fig. 1 Map of maximum 2005 heat dose (DHW) from the NOAA data archives, with the VirginIslands area indicated. Dark triangles represent sites for which bleaching or mortality reports wereavailable (see Table 1). Heat dose data were not available for the boxed and stippled cells because ofthe land-masses present in those cell; estimates for these cells and for all specific reef locations weregenerated by optimal interpolation (see text)
378 Climatic Change (2011) 109:375–397
mortality to estimate changes in coral cover over time (see Buddemeier et al. 2008). Itincorporates impacts of high temperature events (bleaching-induced mortality) in thecontext of stresses to coral reefs caused by long-term changes in ocean temperatureand chemistry. Combo is designed to support “bottom-up” reef response modelingthat considers the characteristics and histories of local reef communities. The modelallows for different climate scenarios and coral reef sensitivities and explicitly pro-vides a framework for incorporating potential coral acclimatization or adaptation tohigher temperatures. This focus on actual coral mortality, as well as its user-friendly,flexible design, distinguishes Combo from the “top-down” climate models that applyto large regional scales and are typically limited to predicting the recurrence ofbleaching based on exceedences of a specified temperature condition (e.g., Donneret al. 2007; Hoegh-Guldberg 1999; Sheppard 2003). Combo also is distinct from highlysite-specific models that look at climate impacts on the survival of individual coraltaxonomic groups (e.g., Riegl and Purkis 2009; Wooldridge and Done 2004) becauseit does not require specialized software or large taxonomic datasets and is designedfor wide-spread use and application by field scientists or coral reef managers.
To calibrate selection of the historic temperature records that Combo requires asinputs, we used heat-dose and coral mortality data from the 2005 bleaching event,primarily in the Virgin Islands and secondarily in the general eastern Caribbean.We then applied various scenarios and assumptions about future climate to examinethe effect of future bleaching events on reefs with a range of coral cover valuescorresponding to values reported following the 2005 bleaching event. The results areused to discuss the likely future trajectory for coral reefs in the Virgin Islands andmore generally in the eastern Caribbean. These results are of general interest as anillustration of future climate change impacts on a sensitive and important ecosystemthat is already at risk from the ongoing climate change of the past few decades.
2 Overview of model
Combo is a model that provides a probabilistic assessment of the effects of differentfuture global climate scenarios on individual corals and on coral reef communi-ties that have the extensive calcium carbonate structures typically associated withreefs. The model is configured to be most relevant to time scales of decades andspatial scales of hundreds of kilometers.The Combo model is presented in detail inBuddemeier et al. (2008). The description that follows provides a brief overview ofCombo as context for the modeling results presented here.
The Combo model provides estimates of changes in coral cover from 2000–2100 atmonthly time-steps with results generally summarized and presented on an annualbasis. Coral cover is considered a key index of the ability of coral communities tomaintain or build coral reefs; a coral cover value of 50%, for example, means that50% of the ocean bottom at the specified ocean depth is covered with living coral.Changes in coral cover are indicative of the health of corals and coral communitiesand are calculated as the net difference between the rates of growth (including bothgrowth of individuals and recruitment of new corals) and the rates of mortality fromall causes.
The model consists of two interacting modules: a long-term change module andan episodic event module. The long-term change module calculates changes in the
Climatic Change (2011) 109:375–397 379
growth and mortality of corals over time in response to long-term changes in oceanchemistry and average SST. Superimposed on these long-term changes, the episodicevent module calculates the impacts on coral cover of episodic mortality events suchas those caused by severe coral bleaching.
2.1 Long-term change module
The long-term change module includes a growth function, a mortality function, anda function that accounts for the impacts of ocean acidification. The growth functionis a cubic growth-temperature response curve, with the optimal temperature forgrowth adjusted to the long-term average (mean) monthly temperature value for thelocation being modeled. The mortality function is a linear equation that estimatesdirect high-temperature mortality not directly associated with episodic bleachingevents (see Buddemeier et al. 2008 for details and derivation of both equations).In addition, the long-term change module calculates the effect on coral growth ofchanges in the ocean’s carbonate saturation state with respect to aragonite, a calciumcarbonate mineral that is the material from which coral skeletons are constructed.The aragonite saturation state is represented by the symbol �a and is estimatedfrom temperature and surface ocean water CO2 concentration in equilibrium withthe known or assumed atmospheric concentration [see Buddemeier et al. (2008) fordetails of the calculation]. In general, as CO2 increases in the atmosphere and theocean, �a decreases and coral growth is impeded. The sensitivity of corals to changesin �a is defined in Combo as a percentage decrease in growth per unit decrease in �a,relative to an assumed maximum growth rate at �a = 4.6 (C. Langdon, U. Miami,personal communication). Sensitivities to changes in saturation state vary amongtaxa, and saturation state at the reef scale is variable and difficult to determine; themodel therefore allows the user to select sensitivity levels to reflect local conditions(up to a maximum of a 40% decrease in growth per unit decrease in �a). Since thisstudy takes a regional rather than a reef-specific view, we use scenarios to illustratethe possible range of effects.
2.2 Episodic event module
The episodic event module calculates coral mortality caused by up to three1 succes-sive high-temperature bleaching events (identified as a, b, and c). The threshold dosefor event a is lower than for event b, which in turn is lower than for event c. Thisincrease in threshold dose over time reflects the fact that the most heat-sensitivecorals are successively lost from the community after each bleaching mortality event,resulting in a community-level “adaptation” to higher SSTs. The threshold doses forbleaching events a, b, and c correspond to specified heat-doses in units of degree-heating weeks (DHW). A dose of one DHW is defined as a SST that is 1◦C abovethe local average bleaching threshold temperature for 1 week. A dose of three DHWcould result from a summer SST that is 1◦C above the threshold for 3 weeks or froma summer SST that is 3◦C above the threshold for 1 week (or any other equivalent
1Combo was designed with three events per model run to keep the model calculations simple;additional events can be added by running the model multiple times.
380 Climatic Change (2011) 109:375–397
combination of temperature and time). As a reference point, a dose of 10–12 DHWis a typical threshold for possible onset of bleaching mortality (Liu et al. 2003; Stronget al. 1997). When temperature data are available only at monthly time resolution,heat doses can be calculated in units of degree-heating months (DHM) and thenconverted to DHW, where one DHM is ∼4.3 DHW and three DHM is ∼13.1 DHW.
The module calculates the cumulative probability that the summer heat doseexperienced by corals will exceed the threshold doses set for bleaching events a, b,and c. When the cumulative probability of an event exceeds a specified level, thena “high-temperature” event is imposed. Calculation of the cumulative probability ofbleaching is based on a procedure that involves sampling a long-term distributionof historic summertime temperature variations around the mean of the maximumannual summertime temperature (based on a 3-month average). The distribution isdeveloped from historic SST records for the location being modeled. Details of thecalculation method for cumulative probability are given in Buddemeier et al. (2008).
Combo is designed with a high degree of user flexibility to allow for modelingdifferent coral reef conditions and considering a variety of “what-if” scenarios. Thefollowing parameters in the episodic event module are defined by the user:
1. The cumulative probability level that triggers a bleaching event. For example,the user could select a highly likely event (the 90th percentile), an unlikely event(the 5th percentile), or an event with reasonable likelihood (the 50th percentile).
2. The fraction of high-temperature events that actually results in bleaching withcoral mortality.
3. The mortality fraction associated with a bleaching event. A 50% mortalityfraction (also referred to as a mortality rate) means that 50% of the currentcover of corals would be lost after a bleaching event. For example, a reef with20% cover would be reduced to 10% cover.
Parameter selections used for the modeling are discussed in Section 4.2.
2.3 Integration of results
Combo calculates its results over time as changes in the percent of initial coralcover. During years when no episodic mortality event occurs, coral cover increases ordecreases based on the difference between estimated growth and estimated mortalitycalculated in the long-term change module. When a bleaching-induced mortalityevent occurs, coral cover is reduced by the specified mortality fraction associatedwith that event. The model then continues the simulation with annual growth andmortality calculated by the long-term change module until another event occurs.Combo provides a variety of outputs to the user, including plots and tables of changesin coral cover over time and of the cumulative probability of bleaching over time.
3 Dataset selection—methods and results
Combo can be used with a variety of different long-term SST datasets; these datasetsare needed in Combo to estimate long-term monthly temperature patterns and togenerate inter-annual distributions of summertime maximum temperature varia-tions. We evaluated several long-term SST datasets with the goal of selecting datasets
Climatic Change (2011) 109:375–397 381
for use in future predictions based on how well they matched the heat-doses thatwere calculated in the Caribbean in 2005 by the near-real-time National Oceanic andAtmospheric Administration (NOAA) bleaching alert and warning system (NOAA2008). The NOAA bleaching alert and warning system is regarded by the coral reefmanagement community as the most easily accessible and widely-used source ofbleaching and heat-dose data for corals world-wide. We wanted to select historicaltemperature datasets and parameters that would make our results from Combofor the predictive modeling through 2100 as consistent as possible with the widelyapplied and understood NOAA-hotspot terminology and values for coral bleaching.
3.1 Heat-dose and mortality data for 2005
We compiled data on the original estimates of heat dose for the 2005 bleachingevent from the NOAA data archives (http://coralreefwatch.noaa.gov/satellite/hdf/index.html; Fig. 1; Table 1). The near-real-time bleaching alerts from NOAA do notprovide dose estimates for any of the 0.5 × 0.5◦ grid cells that contain significantland, so heat doses for specific reef locations and for cell centers near land wereinterpolated from the nearest NOAA values using the Inverse Distance Weightingroutine of the Geostatistical Analysis software extension of ArcInfo 9.3. We alsoobtained data on the prompt and long-term coral mortality following bleaching fromWilkinson and Souter (2008), Reefbase (www.reefbase.org), Bouchon et al. (2008),Oxenford et al. (2008), Woody et al. (2008), and other references cited in the text.
3.2 Dataset selection methods
We used a variety of different long-term SST datasets to calculate heat dose for 2005for the average of the two Virgin Islands 1◦ grid cells (17–19◦ N, 164–165◦ W) wherewe had extensive mortality data (see Table 1). We compared the calculated resultsfrom these datasets with the NOAA calculated heat dose of 12.49 DHW for theaverage of the seven reef locations identified within the Virgin Islands (British VirginIslands plus United States Virgin Islands). The long-term datasets we evaluateduse a variety of sources and methods for conducting data reconstructions into thepast, based on available SST observations. Details on the algorithms used in thedifferent datasets for blending, smoothing, and adjusting the data are available fromthe references listed in Table 2.
Calculations of heat dose require: (1) an estimate of the bleaching thresholdtemperature for a reef (commonly some statistic related to the mean maximummonthly temperature), and (2) an estimate of the amount and duration by whichthe threshold is exceeded by the summertime maximum temperatures. For thedata-set comparison, we compared the results from using different time periods forestablishing the threshold temperature (e.g., 1982–1999 or 1900–1999) and from usingtwo different methods for calculating heat dose: (1) by summing individual monthlydoses for all consecutive months with positive DHW values; and (2) by calculatingthe 3-month dose. The 3-month dose is calculated using the hottest 3-month averageSST as the estimate of maximum temperature, and the long-term average 3-monthmaximum SST as the threshold value. The default heat-dose calculation in Combouses the 3-month dose method, which produces a result similar but not identical tothe 12-week running mean dose calculated by NOAA. Because the datasets prior to

382 Climatic Change (2011) 109:375–397
Tab
le1
Com
pari
sona
ofhe
atdo
ses
(in
DH
W),
prom
ptm
orta
lity,
and
long
-ter
mm
orta
lity
for
the
2005
blea
chin
gev
ent
inth
eE
aste
rnC
arib
bean
for
spec
ific
reef
loca
tion
s
Cou
ntry
/isla
ndR
eefl
ocat
ion
Est
imat
edP
rom
ptL
ong
term
Lat
em
orta
lity
(spe
cifi
clo
cati
on)
(fro
mre
efba
se.o
rg)
DH
Wm
orta
lityb
mor
talit
ycm
ostl
ydi
seas
e?%
%
BV
I(N
orth
Shor
e)18
.45,
−64.
6312
.15
BV
I(G
inge
rIs
land
)18
.38,
−64.
4813
.610
BV
I(P
eter
Isla
nd)
18.3
5,−6
4.58
11.8
5B
VI
sum
mar
yA
GG
RA
11to
13U
SVI
(St.
John
)18
.31,
−64.
7210
.35
to15
≥51
.5Y
esU
SVI
(St.
Cro
ix,B
uck
Isla
nd)
17.7
9,−6
4.63
13.1
5to
15≥
53Y
esU
SVI
(St.
Cro
ix,N
orth
Shor
e)17
.764
,−64
.66
13.1
5to
15≥
51.5
Yes
USV
I(S
t.C
roix
,nor
thea
stsh
ore)
17.7
56,−
64.5
713
.35
to15
≥51
.5Y
esF
WI
(St.
Bar
thel
emy)
17.9
0,−6
2.83
11.8
536
Yes
St.E
usta
tius
17.5
0,−6
2.98
16.2
∼45
FW
I(G
uada
lupe
)16
.27,
−61.
5514
.611
40N
oF
WI
(Mar
tini
que)
14.6
0,−6
1.00
12.2
1137
Mar
tini
que
sum
mar
yA
GG
RA
11to
13∼3
0Y
esSt
.Luc
ia13
.51,
−61.
412
.810
to15
Bar
bado
ssu
mm
ary
13.2
8,−5
9.65
11.2
3.8
18.7
13.0
6,−5
9.48
11.2
Bar
bado
ssu
mm
ary
AG
GR
A7
∼20
Tob
ago
(Car
ibbe
anC
oast
)11
.18,
−60.
889.
8≥
15–2
0Y
esa B
ecau
seof
betw
een-
site
diff
eren
ces
inth
eti
mes
ofm
easu
rem
enta
ndth
esu
rvey
tech
niqu
esem
ploy
ed,t
here
port
ednu
mbe
rssh
ould
beco
mpa
red
ases
tim
ates
ofap
prox
imat
em
agni
tude
rath
erth
anas
equi
vale
ntqu
anti
tati
veob
serv
atio
nsbP
rom
ptm
orta
lity
isth
efr
acti
onof
the
cora
lcov
erex
isti
ngbe
fore
the
2005
blea
chin
gev
entt
hatw
asde
adw
hen
surv
eyed
inla
te20
05,n
ear
orsh
ortl
yaf
ter
the
end
ofth
ebl
each
ing
even
tc L
ong
term
mor
talit
yis
the
frac
tion
ofth
eco
ralc
over
exis
ting
befo
reth
e20
05bl
each
ing
even
ttha
twas
dead
whe
nre
surv
eyed
duri
ng20
06or
2007
(var
ious
date
s)
Climatic Change (2011) 109:375–397 383
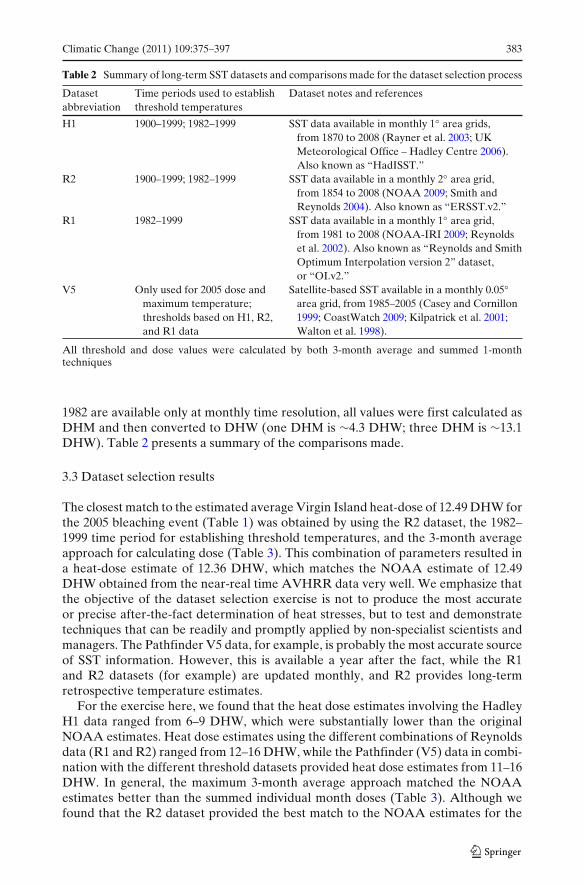
Table 2 Summary of long-term SST datasets and comparisons made for the dataset selection process
Dataset Time periods used to establish Dataset notes and referencesabbreviation threshold temperatures
H1 1900–1999; 1982–1999 SST data available in monthly 1◦ area grids,from 1870 to 2008 (Rayner et al. 2003; UKMeteorological Office – Hadley Centre 2006).Also known as “HadISST.”
R2 1900–1999; 1982–1999 SST data available in a monthly 2◦ area grid,from 1854 to 2008 (NOAA 2009; Smith andReynolds 2004). Also known as “ERSST.v2.”
R1 1982–1999 SST data available in a monthly 1◦ area grid,from 1981 to 2008 (NOAA-IRI 2009; Reynoldset al. 2002). Also known as “Reynolds and SmithOptimum Interpolation version 2” dataset,or “OI.v2.”
V5 Only used for 2005 dose and Satellite-based SST available in a monthly 0.05◦maximum temperature; area grid, from 1985–2005 (Casey and Cornillonthresholds based on H1, R2, 1999; CoastWatch 2009; Kilpatrick et al. 2001;and R1 data Walton et al. 1998).
All threshold and dose values were calculated by both 3-month average and summed 1-monthtechniques
1982 are available only at monthly time resolution, all values were first calculated asDHM and then converted to DHW (one DHM is ∼4.3 DHW; three DHM is ∼13.1DHW). Table 2 presents a summary of the comparisons made.
3.3 Dataset selection results
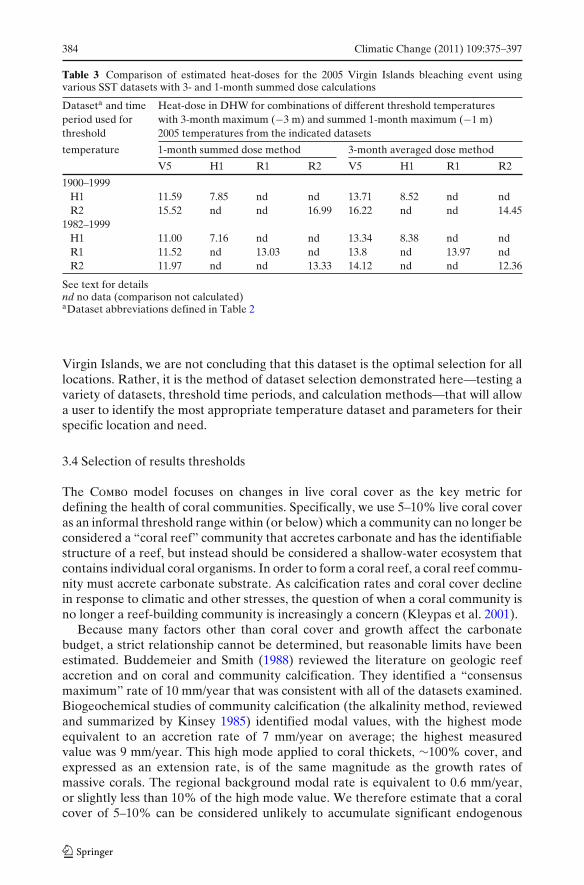
The closest match to the estimated average Virgin Island heat-dose of 12.49 DHW forthe 2005 bleaching event (Table 1) was obtained by using the R2 dataset, the 1982–1999 time period for establishing threshold temperatures, and the 3-month averageapproach for calculating dose (Table 3). This combination of parameters resulted ina heat-dose estimate of 12.36 DHW, which matches the NOAA estimate of 12.49DHW obtained from the near-real time AVHRR data very well. We emphasize thatthe objective of the dataset selection exercise is not to produce the most accurateor precise after-the-fact determination of heat stresses, but to test and demonstratetechniques that can be readily and promptly applied by non-specialist scientists andmanagers. The Pathfinder V5 data, for example, is probably the most accurate sourceof SST information. However, this is available a year after the fact, while the R1and R2 datasets (for example) are updated monthly, and R2 provides long-termretrospective temperature estimates.
For the exercise here, we found that the heat dose estimates involving the HadleyH1 data ranged from 6–9 DHW, which were substantially lower than the originalNOAA estimates. Heat dose estimates using the different combinations of Reynoldsdata (R1 and R2) ranged from 12–16 DHW, while the Pathfinder (V5) data in combi-nation with the different threshold datasets provided heat dose estimates from 11–16DHW. In general, the maximum 3-month average approach matched the NOAAestimates better than the summed individual month doses (Table 3). Although wefound that the R2 dataset provided the best match to the NOAA estimates for the
384 Climatic Change (2011) 109:375–397
Table 3 Comparison of estimated heat-doses for the 2005 Virgin Islands bleaching event usingvarious SST datasets with 3- and 1-month summed dose calculations
Dataseta and time Heat-dose in DHW for combinations of different threshold temperaturesperiod used for with 3-month maximum (−3 m) and summed 1-month maximum (−1 m)threshold 2005 temperatures from the indicated datasets
temperature 1-month summed dose method 3-month averaged dose method
V5 H1 R1 R2 V5 H1 R1 R2
1900–1999H1 11.59 7.85 nd nd 13.71 8.52 nd ndR2 15.52 nd nd 16.99 16.22 nd nd 14.45
1982–1999H1 11.00 7.16 nd nd 13.34 8.38 nd ndR1 11.52 nd 13.03 nd 13.8 nd 13.97 ndR2 11.97 nd nd 13.33 14.12 nd nd 12.36
See text for detailsnd no data (comparison not calculated)aDataset abbreviations defined in Table 2
Virgin Islands, we are not concluding that this dataset is the optimal selection for alllocations. Rather, it is the method of dataset selection demonstrated here—testing avariety of datasets, threshold time periods, and calculation methods—that will allowa user to identify the most appropriate temperature dataset and parameters for theirspecific location and need.
3.4 Selection of results thresholds
The Combo model focuses on changes in live coral cover as the key metric fordefining the health of coral communities. Specifically, we use 5–10% live coral coveras an informal threshold range within (or below) which a community can no longer beconsidered a “coral reef” community that accretes carbonate and has the identifiablestructure of a reef, but instead should be considered a shallow-water ecosystem thatcontains individual coral organisms. In order to form a coral reef, a coral reef commu-nity must accrete carbonate substrate. As calcification rates and coral cover declinein response to climatic and other stresses, the question of when a coral community isno longer a reef-building community is increasingly a concern (Kleypas et al. 2001).
Because many factors other than coral cover and growth affect the carbonatebudget, a strict relationship cannot be determined, but reasonable limits have beenestimated. Buddemeier and Smith (1988) reviewed the literature on geologic reefaccretion and on coral and community calcification. They identified a “consensusmaximum” rate of 10 mm/year that was consistent with all of the datasets examined.Biogeochemical studies of community calcification (the alkalinity method, reviewedand summarized by Kinsey 1985) identified modal values, with the highest modeequivalent to an accretion rate of 7 mm/year on average; the highest measuredvalue was 9 mm/year. This high mode applied to coral thickets, ∼100% cover, andexpressed as an extension rate, is of the same magnitude as the growth rates ofmassive corals. The regional background modal rate is equivalent to 0.6 mm/year,or slightly less than 10% of the high mode value. We therefore estimate that a coralcover of 5–10% can be considered unlikely to accumulate significant endogenous
Climatic Change (2011) 109:375–397 385
carbonate, although depending on growth rate and environmental factors, even covervalues considerably higher may not be associated with any net reef development(e.g., Harriott and Banks 2002).
4 Future climate effects: methods and results
This section describes the methods used and the results obtained from modeling coralreef responses to different scenarios of expected increases in ocean temperature andCO2 concentration over the next century.
4.1 Future climate scenarios
Future CO2 and temperature scenarios were obtained from the MAGICC/SCENGEN (v. 4.1) global climate model (Wigley 2004). MAGICC is the “Modelfor the Assessment of Greenhouse-gas Induced Climate Change” and is a coupledgas-cycle/climate model used by the IPCC to project future increases in global meantemperature and sea level rise for the Third Assessment Report, or TAR (IPCC2001). SCENGEN, which is a “Global and Regional Climate SCENario GENerator,”combines results from MAGICC with regional climate change patterns to createspatially explicit patterns of temperature change for a common 5◦ latitude/longitudegrid (Wigley 2004). Temperatures are lower atmosphere temperatures because SSTsare not available from the MAGICC/SCENGEN model. However, tests of thesepredictions against modeled future SST values have shown differences <0.2◦C forthe locations of interest (Buddemeier et al. 2008).
For the modeling results presented here, results for the 5◦ cell centered at 17.5◦N, 62.5◦W were obtained from MAGICC/SCENGEN for three emissions scenariosused in the IPCC AR4 (IPCC 2007). The emissions scenarios and their predictedatmospheric CO2 concentrations in 2100 are: B1 (540 ppm), A1B (703 ppm), andA1FI (958 ppm). Each scenario was run assuming a 3◦C climate sensitivity to dou-bling of the preindustrial CO2 concentration of 280 ppm, which was the “most likelysensitivity” reported in AR4 (IPCC 2007). For each scenario, CO2 concentrationswere obtained at 5-year intervals, and predicted temperatures were provided as ◦Cabove the temperature in the year 2000. We obtained predicted temperatures for theyears 2000, 2020, 2030, 2050, 2075, and 2100. Linear interpolation was used betweenthese values to estimate predicted annual values of temperature and CO2; the effectsof both were calculated concurrently and combined (see Section 4.3).
4.2 Modeling procedures
Historic climate data are used to estimate several parameters used as input to Combo.The R2 dataset for the years 1982–1999 was found (see Section 3.3) to providethe estimate of bleaching threshold (average 3-month maximum SST) that bestreproduced the Virgin Islands heat dose data. For consistency, the R2 dataset wasalso used for the other inputs: (1) Average monthly temperatures, calculated fromthe 1990–1999 data subset in recognition of changing monthly temperature patternsin recent decades with higher summer-time maximum temperatures; (2) The long-term distribution of temperature variations around the mean of the maximum annual

386 Climatic Change (2011) 109:375–397
average 3-month temperature, which is used to calculate the probability that thebleaching threshold temperature will be exceeded in a given year (see Section 2.2);and (3) long term temperature maximum, minimum and variability statistics usedas input to the equations relating coral growth and non-bleaching mortality totemperature. For the latter two applications, the 1900–1999 data subset was usedto provide a stronger statistical basis for these parameter values, which represent theresults of long-term biological adaptation and/or acclimatization.
We assumed for the baseline year of 2000 that baseline growth and mortality rateswere equal and were set at 0.33%/month, for total steady-state initial growth andmortality rates of 4% for the year. Because we did not have specific information onthe saturation state sensitivity of corals in the eastern Caribbean, in the modelingruns we compared rates of �a saturation state sensitivity of 0, 20%, and 40% (verylow, moderate, and high sensitivities).
For the episodic event module, the threshold temperatures for three successivemodeled bleaching events (“a, b, and c”) were set as follows. The initial thresholdtemperature (event a) was set at 29.5◦C—this represents a heat dose of 12.31 DHWfor 3 months, given the baseline mean maximum 3-month temperature value of28.56◦C, calculated using the R2 temperature dataset for 1982–1999. This heat dose isin the central range estimated for the 2005 bleaching event in the Eastern Caribbeanin general, and the Virgin Islands in particular. The first modeled bleaching eventwould thus be approximately the same as the 2005 event in terms of dose. Forsubsequent bleaching events, the threshold temperatures for events b and c wereset progressively 0.2◦ higher than the preceding threshold (∼2.6 additional DHW),based on the assumption that this is the approximate dose increment required toinflict comparable damage on a community from which the most vulnerable coralshave already been removed and where only the more tolerant corals remain.
For this modeling exercise, the probability of a bleaching event calculated byCombo on the basis of the predicted temperature and the historic distribution ofvariation was multiplied by a bleaching factor of 50%, representing the fraction ofthe specified high-temperature that were assumed to result in the indicated mortality.When the modified occurrence probability reached 50%, cover was reduced by theselected Mortality Factor, which was modeled as either 15% (the typical short-termaverage mortality estimate from the 2005 event), or 50%, which approximates theupper-end of the reported mortality estimates from the 2005 event after diseasecompounded the effects of bleaching (see Table 1).
We conducted a specific set of model simulations to address the question ofadaptive responses by individual organisms or taxa. Under thermal stress, somecorals may undergo a shift in the dominant symbiotic alga (e.g., from C to D clade)(Baker et al. 2008; Jones et al. 2008; Thornhill et al. 2006), which can confer anadditional 1–1.5◦ of heat tolerance on the coral-algal combination (the “holobiont”).However, the new symbiosis is subject to reversion (with an apparent time constantof a few years) to dominance by the more sensitive alga if the high temperaturestress is removed. These special simulations represented the effects of the followingassumptions:
� The heat-resistant algal symbiosis becomes stabilized when an 8 DHW dose has a50% probability (i.e., substantial bleaching but only minor mortality about everyother year).
Climatic Change (2011) 109:375–397 387
� For the part of the population affected, the bleaching threshold becomes onedegree higher after the new algal symbiosis is stabilized.
4.3 Modeling results
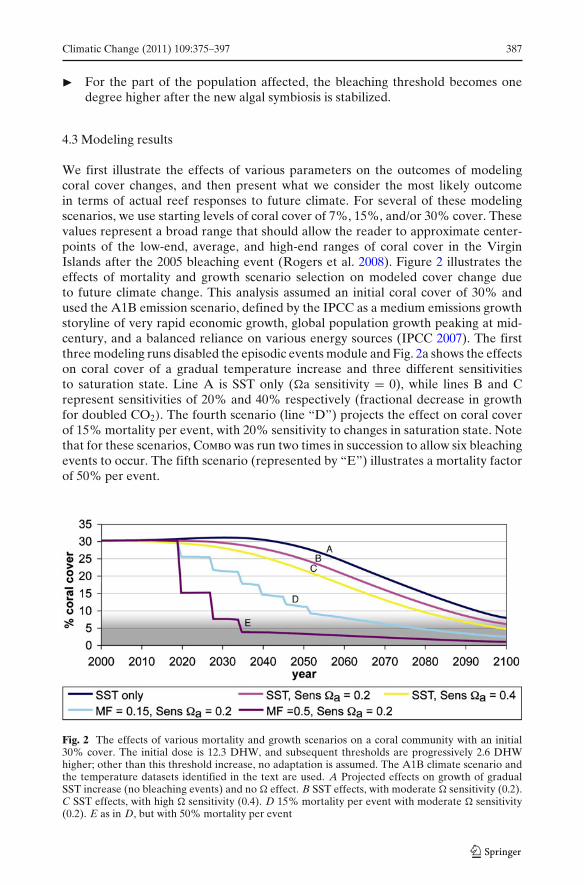
We first illustrate the effects of various parameters on the outcomes of modelingcoral cover changes, and then present what we consider the most likely outcomein terms of actual reef responses to future climate. For several of these modelingscenarios, we use starting levels of coral cover of 7%, 15%, and/or 30% cover. Thesevalues represent a broad range that should allow the reader to approximate center-points of the low-end, average, and high-end ranges of coral cover in the VirginIslands after the 2005 bleaching event (Rogers et al. 2008). Figure 2 illustrates theeffects of mortality and growth scenario selection on modeled cover change dueto future climate change. This analysis assumed an initial coral cover of 30% andused the A1B emission scenario, defined by the IPCC as a medium emissions growthstoryline of very rapid economic growth, global population growth peaking at mid-century, and a balanced reliance on various energy sources (IPCC 2007). The firstthree modeling runs disabled the episodic events module and Fig. 2a shows the effectson coral cover of a gradual temperature increase and three different sensitivitiesto saturation state. Line A is SST only (�a sensitivity = 0), while lines B and Crepresent sensitivities of 20% and 40% respectively (fractional decrease in growthfor doubled CO2). The fourth scenario (line “D”) projects the effect on coral coverof 15% mortality per event, with 20% sensitivity to changes in saturation state. Notethat for these scenarios, Combo was run two times in succession to allow six bleachingevents to occur. The fifth scenario (represented by “E”) illustrates a mortality factorof 50% per event.
Fig. 2 The effects of various mortality and growth scenarios on a coral community with an initial30% cover. The initial dose is 12.3 DHW, and subsequent thresholds are progressively 2.6 DHWhigher; other than this threshold increase, no adaptation is assumed. The A1B climate scenario andthe temperature datasets identified in the text are used. A Projected effects on growth of gradualSST increase (no bleaching events) and no � effect. B SST effects, with moderate � sensitivity (0.2).C SST effects, with high � sensitivity (0.4). D 15% mortality per event with moderate � sensitivity(0.2). E as in D, but with 50% mortality per event

388 Climatic Change (2011) 109:375–397
Even without high-temperature bleaching and mortality events, this scenariodepicts a decline in coral cover below 10% (our proposed informal threshold forreefs considered unlikely to accumulate significant endogenous carbonate) by theyear 2085. As can be seen in Fig. 2, the direct effects on corals of changes in saturationstate sensitivity (from a minimum of zero to a maximum of 40%) are minor comparedto the effects of high temperature—both mortality events and growth decline. For amodeling scenario where a reef began with 30% initial cover and a mortality factorof 15%, coral cover falls below 10% by 2055. When the mortality factor is set to 50%,coral cover falls below 10% by 2035. An initial cover of 30% is a relatively high valuefor the post-2005 Virgin Islands, suggesting that some reefs will experience a fall incoral cover below 10% at even earlier dates. The goal of using these parameters isnot to make firm quantitative predictions but instead to allow the reader to makesemi-quantitative relative comparisons to their reefs of interest, based on local initialcover and sensitivity.
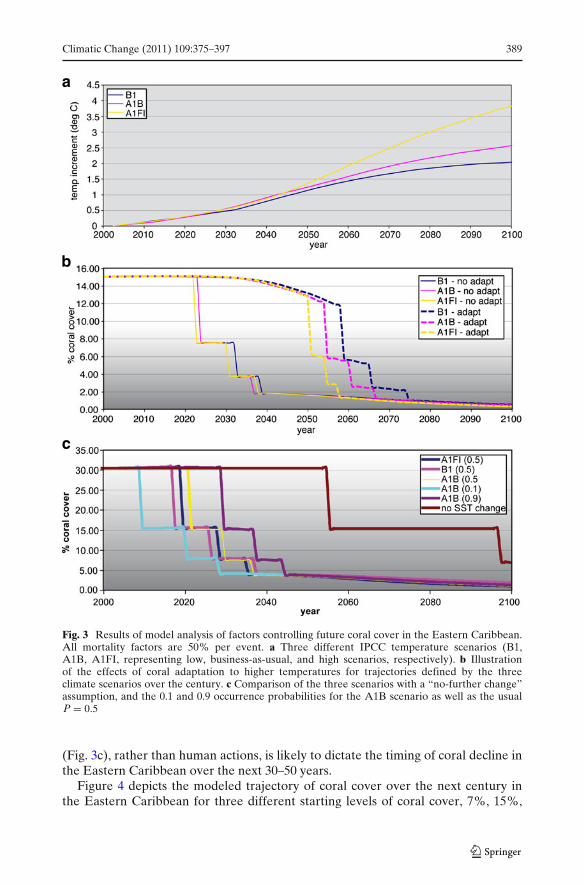
Figure 3 compares the effects on coral cover of the temperature and CO2 changesassociated with the different emissions scenarios shown in Fig. 3a, both with andwithout adaptive responses by individual coral organisms or taxa (Fig. 3b) and usingdifferent event probabilities (Fig. 3c). The model runs with no adaptation (solidlines, Fig. 3b), make it clear that there is little difference in outcomes betweenthe three different IPCC emissions scenarios (B1, A1B, and A1FI). For all threeclimate scenarios, if 50% mortality events are assumed, cover drops below 5%by the year 2035. If corals are able to gain an additional 1◦ of heat tolerance(dashed lines, Fig. 3b—see Section 4.2 for details of model simulations), then survivalof corals above the 5% level is prolonged until approximately 2065. There is anotable difference across the three emissions scenarios starting approximately in2050 (Fig. 3a), with the lowest emissions and highest coral cover associated with theB1 scenario, and the highest emissions and lowest coral cover associated with theA1FI scenario (compare 3b with 3a).
In Fig. 3c, a hypothetical “no climate change after the year 2000” is added forcomparison, where the temperature and saturation state are constant at the 2000values. The occurrence of a bleaching event in this “no further change” scenarioindicates that the heat dose in 2000 had already entered the probability distributionfor bleaching, and eventually the accumulating probability brought it to the P = 0.5level. In other words, even if climate change had stopped in 2000 and there were nofurther human-induced increases in temperature or CO2, there would still be a 50%probability of a major mortality event in the Eastern Caribbean by approximatelythe year 2055.
Another comparison in Fig. 3c illustrates the effect of statistical variation or“outlier” events on the timing of bleaching occurrences. Plots show the A1B scenariotrajectory for 10%, 50% and 90% cumulative bleaching event probability; forcomparison, Combo calculates the 2005 probability of the actual event as having been∼7.9%. The two extreme probability values span a range of about 20 years for thetime of a given event.
The results depicted in Fig. 3b and c show very small differences in coral outcomebetween the three climate scenarios that represent different levels of greenhouse gas(GHG) emissions. These results suggest that it matters little to the fate of corals inthe Eastern Caribbean in the next 30–50 years whether humans are able to reduceemissions to the level predicted in the “optimistic” B1 scenario. The role of chance
Climatic Change (2011) 109:375–397 389
a
b
c
Fig. 3 Results of model analysis of factors controlling future coral cover in the Eastern Caribbean.All mortality factors are 50% per event. a Three different IPCC temperature scenarios (B1,A1B, A1FI, representing low, business-as-usual, and high scenarios, respectively). b Illustrationof the effects of coral adaptation to higher temperatures for trajectories defined by the threeclimate scenarios over the century. c Comparison of the three scenarios with a “no-further change”assumption, and the 0.1 and 0.9 occurrence probabilities for the A1B scenario as well as the usualP = 0.5
(Fig. 3c), rather than human actions, is likely to dictate the timing of coral decline inthe Eastern Caribbean over the next 30–50 years.
Figure 4 depicts the modeled trajectory of coral cover over the next century inthe Eastern Caribbean for three different starting levels of coral cover, 7%, 15%,
390 Climatic Change (2011) 109:375–397
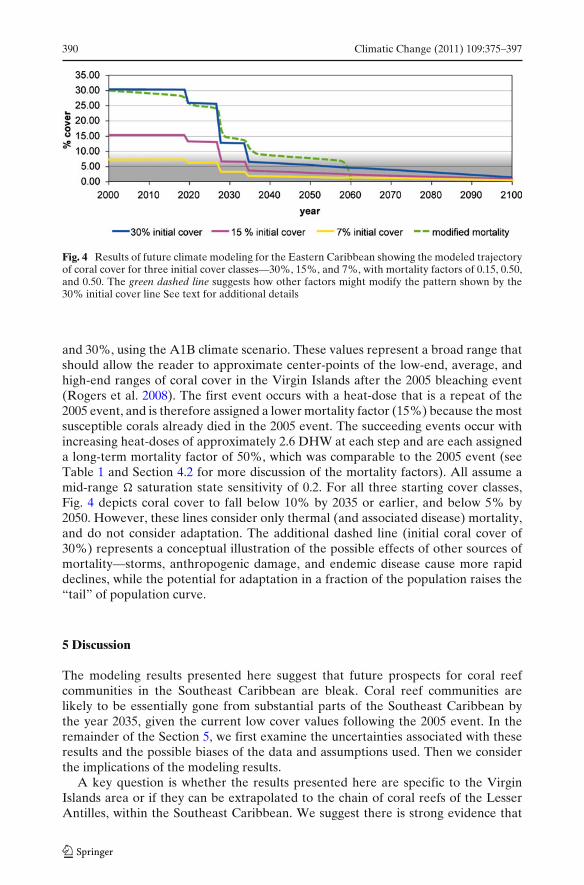
Fig. 4 Results of future climate modeling for the Eastern Caribbean showing the modeled trajectoryof coral cover for three initial cover classes—30%, 15%, and 7%, with mortality factors of 0.15, 0.50,and 0.50. The green dashed line suggests how other factors might modify the pattern shown by the30% initial cover line See text for additional details
and 30%, using the A1B climate scenario. These values represent a broad range thatshould allow the reader to approximate center-points of the low-end, average, andhigh-end ranges of coral cover in the Virgin Islands after the 2005 bleaching event(Rogers et al. 2008). The first event occurs with a heat-dose that is a repeat of the2005 event, and is therefore assigned a lower mortality factor (15%) because the mostsusceptible corals already died in the 2005 event. The succeeding events occur withincreasing heat-doses of approximately 2.6 DHW at each step and are each assigneda long-term mortality factor of 50%, which was comparable to the 2005 event (seeTable 1 and Section 4.2 for more discussion of the mortality factors). All assume amid-range � saturation state sensitivity of 0.2. For all three starting cover classes,Fig. 4 depicts coral cover to fall below 10% by 2035 or earlier, and below 5% by2050. However, these lines consider only thermal (and associated disease) mortality,and do not consider adaptation. The additional dashed line (initial coral cover of30%) represents a conceptual illustration of the possible effects of other sources ofmortality—storms, anthropogenic damage, and endemic disease cause more rapiddeclines, while the potential for adaptation in a fraction of the population raises the“tail” of population curve.
5 Discussion
The modeling results presented here suggest that future prospects for coral reefcommunities in the Southeast Caribbean are bleak. Coral reef communities arelikely to be essentially gone from substantial parts of the Southeast Caribbean bythe year 2035, given the current low cover values following the 2005 event. In theremainder of the Section 5, we first examine the uncertainties associated with theseresults and the possible biases of the data and assumptions used. Then we considerthe implications of the modeling results.
A key question is whether the results presented here are specific to the VirginIslands area or if they can be extrapolated to the chain of coral reefs of the LesserAntilles, within the Southeast Caribbean. We suggest there is strong evidence that

Climatic Change (2011) 109:375–397 391
the modeling results can be reasonably extrapolated to the Southeast Caribbean,with caveats noted below. For the 2005 bleaching event, there was remarkablesimilarity in the independent reports of the timing, depth profiles, and magnitudeof coral bleaching and mortality over the entire island arc of the Lesser Antilles.Although there were local variations, we feel that the broad regional similarities inheat doses and mortality responses justify extrapolations from the Virgin Islands tothe Southeast Caribbean region. The Virgin Islands area was used to calibrate dose-response relationships, both because it is a particularly well-documented area andbecause the heat doses were generally similar to most of the islands. To model otherlocations in the Southeast Caribbean, initial coral cover values appropriate to thoseareas would need to be used, but the cover trajectories can be reasonably estimatedas proportional to the values plotted here (Fig. 1, Table 1).
The caveat to this extrapolation is that the Combo model was used here as itwas designed to be used—applied to a discrete region with dimensions of no morethan a few hundred kilometers. Although we believe that the high-level predictionsmade by the model will apply across the Southeast Caribbean, modeling results forother specific reef locations shown in Fig. 1 would not be identical to the VirginIslands because of differences in the site-specific thermal histories that provide thetemperature patterns and distributions used in the model.
5.1 Uncertainties
With respect to the specific predictions made by the model as presented in Fig. 4,there are uncertainties that could cause the model to be unduly pessimistic or undulyoptimistic with respect to the timing of bleaching events and the magnitude ofmortality. These factors are summarized below.
Factors that would contribute to greater rates of coral survival compared to modelpredictions:
� Adaptation. The model-generated predictions of Fig. 4 (solid lines) did not factorin possible adaptation of corals to higher temperatures. If adaptation does occur,it would likely be limited to a modest subset of the corals, but adaptation couldraise the cover estimates by a few percent and extend the survival curves for afew additional decades (see Fig. 4 dashed line for a conceptual illustration of theeffect).
� Survival of deep reefs. We did not model climate change impacts on deep reefs(>30 m below the ocean surface), some of which survived the 2005 bleachingevent with substantial cover (Rogers et al. 2008).
� Lower mortality rates. The Virgin Islands long-term mortality figures after the2005 bleaching event (>50%) were at the high end of the regional estimates—other sites were mostly between 30% and 50% (Table 1), and those withlower doses (Barbados, Tobago), were even lower. Therefore, our use of 50%mortality for future bleaching events may be unduly pessimistic.
Factors that would contribute to lower rates of coral survival compared to modelpredictions:
� Additional sources of mortality. Only bleaching mortality and bleaching-enhanced disease mortality were considered. The histories presented inWilkinson and Souter (2008) and by Rogers et al. (2008) indicate substantial

392 Climatic Change (2011) 109:375–397
recent past losses of coral cover due to hurricanes, human activities, and “back-ground” diseases. Baker et al. (2008) point out the recent history of corals inthe Caribbean has been one of consistent decline unrelieved by episodes ofrecovery such as have been observed elsewhere. We see no reason to think thesetrends will not continue (see regional assessment by Smith and Buddemeier 1992,p. 110).
� Additional impacts from ocean acidif ication. With regard to ocean acidification,only growth inhibition of the corals was considered. Large-scale ecosystemeffects of acidification were not considered and could easily contribute tocommunity deterioration with feedback to the corals. These potential ecosys-tem impacts include the potential rapid loss of an important group of oceanorganisms (e.g., the coralline algae, which construct skeletons with highly solublehigh-magnesium calcite), or interference from acidification on functions such asreproduction or maturation in a wide range of ocean organisms (see Vezina andHoegh-Guldberg 2008).
� Increased temperature variability over the next century. Combo uses the distri-bution of high temperatures over the past century to model high temperaturevariations into the future. Under conditions of climate change, an increase invariability is plausible; this would increase the likelihood of bleaching events andcause the events, on average, to happen earlier.
� Additional high temperature event stress. Combo is structured so that eachsuccessive mortality event represents an increase in dose intensity. Therefore,the potential impacts on corals from high temperature events that are belowthe next threshold value are not considered—these are likely to be a sourceof significant stress, and probably some mortality, especially if they are closelyspaced in time.
� Pattern and starting temperature biases. 1991 and 1992 may have been cooler thanwould otherwise be expected because of volcanic eruptions; these years havebeen omitted from the threshold baseline used by NOAA (http://www.osdpd.noaa.gov/PSB/EPS/SST/methodology.html#dhw). Either a higher average or ahigher maximum value in the monthly pattern used would accelerate the impacts.
� Changes in baseline growth and mortality. The “baseline” growth and mortalityvalues in Combo are held constant across the modeling time period, which isdefinitely optimistic in a deteriorating environment. Note also that there issignificant uncertainty in their assigned initial values.
� Direct effects of climate change on reproduction and recruitment. Combo modelsthe impacts of climate change on coral mortality, but does not consider thepotential impacts of climate change on coral reproduction and recruitment.Declines in reproduction and recruitment would make recovery after bleachingevents slower than the model predicts.
Factors that add uncertainty to model predictions, but the direction of the potentialbias is not clear:
� Long-term growth and mortality functions. The long-term growth and mortal-ity functions in Combo (see Section 2.1) were developed from experimentalresults on coral taxa native to Hawai’i, and modified with local Caribbeanparameter values. The direct effects of increased temperature on the growthand mortality of coral taxa in the Caribbean (independent of bleaching) are not

Climatic Change (2011) 109:375–397 393
explicitly known. Uncertainty in these parameters, however, has little leverageon model outcomes because the bleaching events are the overwhelming source ofmortality.
� Threshold temperatures for additional bleaching events. Selection of thresholdtemperatures for successive bleaching events is based on our best estimates ofcoral tolerance. The 2005 data show that there were some hardy corals thatdid not bleach in 2005—the dose at which these corals will be susceptible tobleaching is unknown. Our estimates may either over-predict or under-predictthe heat tolerance of these corals.
� Selection of temperature datasets for model use. The dataset selection exercise isdescribed in detail in Section 3. Selection of a temperature dataset different fromthe R2 dataset actually adopted would have changed the timing of predictedbleaching events by 20 to 30 years (either earlier or later, depending on thedataset selected).
In general, given the uncertainties listed above, it is more likely the model predictionsare unduly optimistic with respect to the overall rates and patterns of coral and reefloss.
5.2 Implications
The United Nations Framework Convention on Climate Change calls on parties tolimit GHG concentrations to a level that avoids dangerous climate change, includingthe crossing of critical ecosystem thresholds (UNFCCC 2009). When the coverof coral on a reef is just 5% to 10%, there are many reasons to believe that acritical threshold has indeed been crossed. On an a priori basis, it seems clear thatcommunities with <10% cover are extremely unlikely to be accreting carbonate, andwhether one would call them reef communities at all would depend on the overallcomposition. Decreasing coral cover is often accompanied by increases in the coverof macroalgae, suggesting that a qualitative shift in the coral community occurs withdecreasing coral cover (Rogers et al. 2008). Monitored sites in the Caribbean thatcurrently have <10% live scleractinian coral cover (e.g., Causey 2008; Rogers et al.2008), appear to still be categorized as “reef” or “reef communities” for historicalreasons—in the 1970s and before they had several times that proportion of coralcover. Using an analogy to terrestrial ecosystems, it is clear that we would not callland cover with less than 5% or 10% tree cover a “forest,” even if the land had beenforested at some point in the past.
Our modeling results suggest that coral ecosystems in the Caribbean will crosscritical thresholds within the next several decades, if not before. For example, themodeling results in Fig. 4 show coral cover for the Eastern Caribbean decliningbelow 5% by approximately 2035, using moderate assumptions for climate change(e.g., A1B scenario, mid-range sensitivity to saturation state) and the mortalityresponses already observed after the 2005 event. Furthermore, the results presentedin Section 4.3 suggest that future actions to reduce GHG emissions may have littleinfluence on coral bleaching mortality in the Caribbean, which has already beenidentified as an area especially vulnerable relative to the Indo-Pacific because ofits setting and evolutionary history (Smith and Buddemeier 1992) and its failure todemonstrate recovery from previous coral cover losses (Baker et al. 2008). Climatechange impacts to date, along with impacts yet to be realized due to past and current
394 Climatic Change (2011) 109:375–397
emissions (IPCC 2007), are already projected to lead to large amounts of coral lossfor this area. We are not suggesting that coral communities with less than 10%coral cover should be “abandoned” or excluded from coral reef conservation andmanagement plans. Indeed, these areas could contain important refugia for resilientcorals that could be used in coral restoration efforts. We point out this potentialthreshold because of its implications for community structure and the provision ofecosystem services (discussed further below).
A further point worth noting is that as the reefs are further stressed, communitycomposition and structure will continue to change, often dramatically. All of thereports of the 2005 events noted that mortality was high (sometimes nearly total)for certain taxa, such as Millepora, Agaricia, Diploria, P. porites, and Montastrea(Wilkinson and Souter 2008) while other taxa either never bleached or recoveredfrom bleaching. Given the value of coral reefs as ecosystems with high biodiversity(Knowlton 2001b), the loss of this diversity is itself an important consequence ofbleaching. It is certainly possible that a few percent of corals will show successfuladaptation or survive in particularly favorable microhabitats. Thus, we are notpredicting the complete loss of corals when considered at the organism or taxon level,but highly diverse, viable reef communities in the Eastern Caribbean seem likely todisappear within the lifetime of a single human generation.
The conversion of coral reefs to fundamentally different systems will have largeimplications for the provision of ecosystem services (Moberg and Folke 1999; Burkeand Maidens 2004). These changes could result in significant economic losses, par-ticularly for island and coastal populations whose livelihoods are closely dependentupon coral reefs and the ecosystem services they provide. For example, a study priorto the 2005 bleaching event suggested that continued coral reef degradation in theCaribbean could reduce the benefits derived from these ecosystems by $350–850million per year (Burke and Maidens 2004). A recent study by the World Bankused Combo runs and economic analysis to suggest that a 90% loss of coral in theCaribbean would lead to direct economic losses of $8.7–12 billion dollars in 2008dollars (Vergara et al. 2009).
Given the likely future impacts of climate change on Caribbean coral reefs, itis clear that urgent action is needed to mitigate these impacts as much as possible.Recognizing this need worldwide, the International Union for Conservation ofNature (IUCN) established a Marine Working Group on Climate Change and CoralReefs (CCCR), with the specific purpose of addressing the issue of resilience, coralreefs, and climate change. The idea of the working group is to provide the conserva-tion and management community with tools to help identify and measure resiliencefor coral reefs and to promote the development of conservation and managementplans that enhance resilience to climate change (IUCN 2009). For example, sitescould be prioritized for conservation if they exhibit the physical features that increaseresistance to bleaching (such as exposed ocean locations instead of enclosed reefs;Buddemeier et al. 2008), and if they have good local environmental conditions, suchas a lack of pollution or disease. A recent report has looked extensively at resiliencyfor Indian Ocean coral reefs (Obura et al. 2008). Given the modeling results pre-sented here, urgent efforts are needed to identify and protect what appear to be themost resilient coral reefs in the Caribbean. Although the extent to which these effortscould reduce wide-spread bleaching impacts is unknown, any actions that couldincrease the cover or extent of remnant populations will benefit science and posterity.

Climatic Change (2011) 109:375–397 395
Acknowledgements We gratefully acknowledge the financial support of the U.S. EnvironmentalProtection Agency’s Office of Atmospheric Programs (Contract # GS10F0299K) and Office ofResearch and Development (STAR Grant #R832224 to P.L. Jokiel). Technical contributions and/orproject support were provided by Shawn Saving and Carolyn Wagner; Mark Schoneweis preparedthe illustrations. We thank Caroline Rogers for helpful comments on an earlier version of themanuscript.
Open Access This article is distributed under the terms of the Creative Commons AttributionNoncommercial License which permits any noncommercial use, distribution, and reproduction inany medium, provided the original author(s) and source are credited.
References
Baker AC, Glynn PW, Riegl B (2008) Climate change and coral reef bleaching: an ecologicalassessment of long-term impacts, recovery trends, and future outlook. Estuar Coast Shelf Sci80:435–471
Bouchon C, Portillo P, Bouchon-Navaro Y, Max L, Hoetjes P, Brathwaite A, Roach R, Oxenford H,O’Farrell S, Day O (2008) Status of coral reefs of the Lesser Antilles after the 2005 coral beachingevent. In: Wilkinson C, Souter D (eds) Status of Caribbean coral reefs after bleaching andhurricanes in 2005. Global Coral Reef Monitoring Network, and Reef and Rainforest ResearchCentre, Townsville, pp 85–103
Buddemeier RW, Smith SV (1988) Coral reef growth in an era of rapidly rising sea level: predictionsand suggestions for long-term research. Coral Reefs 7:51–56
Buddemeier RW, Jokiel PL, Zimmerman KM, Lane DR, Carey JM, Bohling GC, Martinich JA(2008) A modeling tool to evaluate regional coral reef responses to changes in climate and oceanchemistry. Limnol Oceanogr Methods 6:395–411
Burke L, Maidens J (2004) Reefs at risk in the Caribbean. World Resources Institute, Washington,DC
Casey KS, Cornillon P (1999) A comparison of satellite and in situ based sea surface temperatureclimatologies. J Climate 12:1848–1863
Causey B (2008) Coral reefs of the U.S. Caribbean—the history of massive coral bleaching and otherperturbations. In: Wilkinson C, Souter D (eds) Status of Caribbean coral reefs after bleachingand hurricanes in 2005. Global Coral Reef Monitoring Network, and Reef and RainforestResearch Centre, Townsville, pp 61–67
CoastWatch (2009) Pathfinder version 5.0 sea surface temperature: dataset summary. Availablehttp://coastwatch.pfeg.noaa.gov/infog/PH_ssta_las.html. Accessed 5 Jan 2009
Costanza R, d’Arge R, de Groot R, Farber S, Grasso M, Hannon B, Limburg K, Naeem S, O’NeillRV, Paruelo J, Raskin RG, Sutton P, van den Belt M (1997) The value of the world’s ecosystemservices and natural capital. Nature 387:253–260
Donner SD, Skirving WJ, Little CM, Oppenheimer M, Hoegh-Guldberg O (2005) Global assessmentof coral bleaching and required rates of adaptation under climate change. Glob Chang Biol11:2251–2265
Donner SD, Knutson TR, Oppenheimer M (2007) Model-based assessment of the role of human-induced climate change in the 2005 Caribbean coral bleaching event. Proc Nat Acad Sci104:5483–5488
Harriott VJ, Banks SA (2002) Latitudinal variation in coral communities in eastern Australia: aqualitative biophysical model of factors regulating coral reefs. Coral Reefs 21:83–94
Hoegh-Guldberg O (1999) Climate change, coral bleaching and the future of the world’s coral reefs.Mar Freshw Res 50:839–866
IPCC (2001) Climate change 2001: the scientific basis. In: Houghton JT, Ding Y, Griggs DJ, NoguerM, van der Linden PJ, Dai X, Maskell K, Johnson CA (eds) Contribution of working group Ito the third assessment report of the intergovernmental panel on climate change. CambridgeUniversity Press, Cambridge, UK and New York, NY, USA, 881 pp
IPCC (2007) Climate change 2007: the physical science basis. In: Solomon S, Qin D, Manning M,Chen Z, Marquis M, Averyt KB, Tignor M, Miller HL (eds) Contribution of working group Ito the fourth assessment report of the intergovernmental panel on climate change. CambridgeUniversity Press, Cambridge and New York, 996 pp
396 Climatic Change (2011) 109:375–397
IUCN (2009) Climate change and coral reefs marine working group (CCCR). Available http://www.iucn.org/cccr/. Accessed 17 Mar 2009
Jeffrey C, Clark R, Woody K, Menza C, Caldow C, Kendall M, Monaco M (2006) Coral bleachingand recovery observed at Buck Island, St. Croix, US Virgin Islands, October and December,2005. Center for Coastal Monitoring and Assessment, NOAA. Available http://ccma.nos.noaa.gov/products/biogeography/coral_bleaching/welcome.html. Accessed 15 Feb 2009
Jones AM, Berkelmans R, van Oppen MJH, Mieog JC, Sinclair W (2008) A community change in thealgal endosymbionts of a scleractinian coral following a natural bleaching event: field evidenceof acclimatization. Proc R Soc B-Biol Sci 275:1359–165
Kilpatrick KA, Podesta GP, Evans R (2001) Overview of the NOAA/NASA advanced very highresolution radiometer pathfinder algorithm for sea surface temperature and associated matchupdatabase. J Geophys Res Oceans 106:9179–9197
Kinsey DW (1985) Metabolism, calcification, and carbon production: I. Systems level studies. In:Proceedings, fifth international coral reef congress (Tahiti), vol 4, pp 505–526
Kleypas JA, Buddemeier RW, Archer D, Gattuso JP, Langdon C, Opdyke BN (1999) Geochemicalconsequences of increased atmospheric carbon dioxide on coral reefs. Science 284:118–120
Kleypas JA, Buddemeier RW, Gattuso JP (2001) The future of coral reefs in an age of global change.Int J Earth Sci (Geol Rundsch) 90:426–437
Knowlton N (2001a) The future of coral reefs. Proc Nat Acad Sci 98:5419–5425Knowlton N (2001b) Coral reef biodiversity: habitat size matters. Science 292:1493–1495Langdon C, Takahashi T, Sweeney C, Chipman D, Goddard J, Marubini F, Aceves H, Barnett H,
Atkinson MJ (2000) Effect of calcium carbonate saturation state on the calcification rate of anexperimental coral reef. Glob Biogeochem Cycles 14:639–654
Liu G, Strong AE, Skirving W (2003) Remote sensing of sea surface temperatures during 2002Barrier Reef coral bleaching. Eos Trans AGU 84:137–144
Llewellyn G (1998) Why preserve biodiversity? Building an economic case for preserving coral reefs.J Coast Dev 2:319–328
Millennium Ecosystem Assessment (2005) Ecosystems and human well-being: synthesis. IslandPress, Washington, DC
Moberg F, Folke C (1999) Ecological goods and services of coral reef ecosystems. Ecol Econ 29:215–233
NOAA (2008) Satellite coral bleaching monitoring datasets. Coral Reef Watch – NOAA Satelliteand Information Service, National Environmental Satellite, Data, and Information Service.Available http://coralreefwatch.noaa.gov/satellite/hdf/index.html. Accessed 1 Nov 2008
NOAA (2009) Extended reconstructed sea surface temperature (ERSSTV2). NOAA Satellite andInformation Service, National Environmental Satellite, Data, and Information Service. Avail-able http://www.ncdc.noaa.gov/oa/climate/research/sst/ersstv2.php. Accessed 5 Jan 2009
NOAA-IRI (2009) NOAA NCEP EMC CMB GLOBAL Reyn_SmithOIv2 monthly (dataset ac-cess page). NOAA – International Research Institute. Available http://iridl.ldeo.columbia.edu/SOURCES/.NOAA/.NCEP/.EMC/.CMB/.GLOBAL/.Reyn_SmithOIv2/.monthly/. Accessed 5Jan 2009
Obura DO, Tamelander J, Linden O (eds) (2008) Ten years after bleaching – facing the consequencesof climate change in the Indian Ocean. CORDIO Status Report 2008. CORDIO (Coastal OceansResearch and Development in the Indian Ocean)/Sida-SAREC. Mombasa. 489 pp. Availablehttp://www.cordioea.org. Accessed 15 Feb 2009
Oxenford HA, Roach R, Brathwaite A, Nurse L, Goodridge R, Hinds F, Baldwin K, Finney C(2008) Quantitative observations of a major coral bleaching event in Barbados, SoutheasternCaribbean. Clim Change 87:435–449
Rayner NA, Parker DE, Horton EB, Folland CK, Alexander LV, Rowell DP, Kent EC, Kaplan A(2003) Global analyses of sea surface temperature, sea ice and night marine air temperature sincethe late nineteenth century. J Geophys Res 108:4407. doi:10.1029/2002JD002670
Reynolds RW, Rayner NA, Smith TM, Stokes DC, Wang W (2002) An improved in situ and satelliteSST analysis for climate. J Clim 15:1609–1625
Riegl BM, Purkis SJ (2009) Model of coral population response to accelerated bleaching and massmortality in a changing climate. Ecol Model 220:192–2008
Rogers CS (2008) Coral diseases following massive bleaching in 2005 cause 60 percent decline incoral cover and mortality of the threatened species, Acropora Palmata, on reefs in the U.S.Virgin Islands. US Geological Survey Fact sheet 2008-3058 (2). Available http://pubs.usgs.gov/fs/2008/3058/. Accessed 15 Feb 2009

Climatic Change (2011) 109:375–397 397
Rogers CS, Miller J, Muller EM, Edmunds P, Nemeth RS, Beets JP, Friedlander AM, Smith TB,Boulon R, Jeffrey CFG, Menza C, Caldow C, Idrisi N, Kojis B, Monaco ME, Sptizack A,Gladfelter EH, Ogden JC, Hillis-Starr Z, Lundgren I, Schill WB, Kuffner IB, Richardson LL,Devine BE, Voss JD (2008) Ecology of coral reefs in the US Virgin Islands. In: Riegl BM, DodgeRE (eds) Coral reefs of the USA. Springer Science+Business Media B.V., pp 303–373
Sheppard CRC (2003) Predicted recurrences of mass coral mortality in the Indian Ocean. Nature425:294–297
Smith SV, Buddemeier RW (1992) Global change and coral reef ecosystems. Ann Rev Ecol Sys23:89–118
Smith TM, Reynolds RW (2004) Improved extended reconstruction of SST (1854–1997). J Clim17:2466–2477
Spalding MD, Grenfell AM (1997) New estimates of global and regional coral reef areas. Coral Reefs16:225–230
Strong AE, Barrientos CS, Duda C, Sapper J (1997) Improved satellite techniques for monitoringcoral reef bleaching. In: Proc 8th Int’l Coral Reef Sym, vol 2, pp 1495–1498
Thornhill D, LaJeunesse T, Kemp D, Fitt W, Schmidt G (2006) Multi-year, seasonal genotypicsurveys of coral-algal symbioses reveal prevalent stability or post-bleaching reversion. Mar Biol148:711–722. doi:10.1007/s00227-005-0114-2
UK Meteorological Office – Hadley Centre (2006) HadISST 1.1 – Global sea-ice coverage and SST(1870–present). British Atmospheric Data Centre. Available http://badc.nerc.ac.uk/data/hadisst/.Accessed 30 Nov 2008
UNFCCC (2009) The United Nations Framework Convention on Climate Change. Available:http://unfccc.int/essential_background/convention/background/items/1349.php. Accessed 1 Apr2009
Vergara W, Toba N, Mira-Salama D, Deeb A (2009) The potential consequences of climate-inducedcoral loss in the Caribbean by 2050–2080. In: Vergara W (ed) Assessing the potential conse-quences of climate destabilization in Latin America, vol 32. World Bank, Washington, DC
Vezina A, Hoegh-Guldberg O (2008) Theme section: effects of ocean acidification on marine ecosys-tems. Mar Ecol Prog Ser 373:199–309
Walton CC, Pichel WG, Sapper JF, May DC (1998) The development and operational application ofnonlinear algorithms for the measurement of sea surface temperatures with the NOAA polar-orbiting environmental satellites. J Geophys Res C12(103):27999–28012
Wigley TM (2004) MAGICC/SCENGEN 4.1: technical manual. Available http://www.cgd.ucar.edu/cas/wigley/magicc/installation.html. Accessed 30 Nov 2008
Wilkinson C, Souter D (eds) (2008) Status of Caribbean coral reefs after bleaching and hurricanesin 2005. Global Coral Reef Monitoring Network, and Reef and Rainforest Research Centre,Townsville, 152 pp
Woody K, Atkinson A, Clark R, Jeffrey C, Lundgren I, Miller I, Monaco M, Muller E, Patterson M,Rogers C, Smith T, Spitzak T, Waara R, Whelan K, Witcher B, Wright A (2008) Coral reefs ofthe U.S. Caribbean – coral bleaching in the U.S. Virgin Islands in 2005 and 2006. In: WilkinsonC, Souter D (eds) Status of Caribbean coral reefs after bleaching and hurricanes in 2005.Global Coral Reef Monitoring Network, and Reef and Rainforest Research Centre, Townsville,pp 68–84
Wooldridge SA, Done T (2004) Learning to predict large-scale coral bleaching from past events: aBayesian approach using remotely sensed data, in-situ data, and environmental proxies. CoralReefs 23:96–108