modeling driver work-zone speed on 4 lane divided highways
TRANSCRIPT

Modeling driver work-zone speed on 4 lane divided highways
Amrita Goswamy (PhD Candidate),
Shauna Hallmark (Professor),
Omar Smadi (Associate Professor)
Institute of Transportation, Iowa State
University
Sue Chrysler, Human Factors Consultant.
Civil, Construction and Environmental Engineering
7thInternational Symposium on Naturalistic Driving Research
Problem Statement
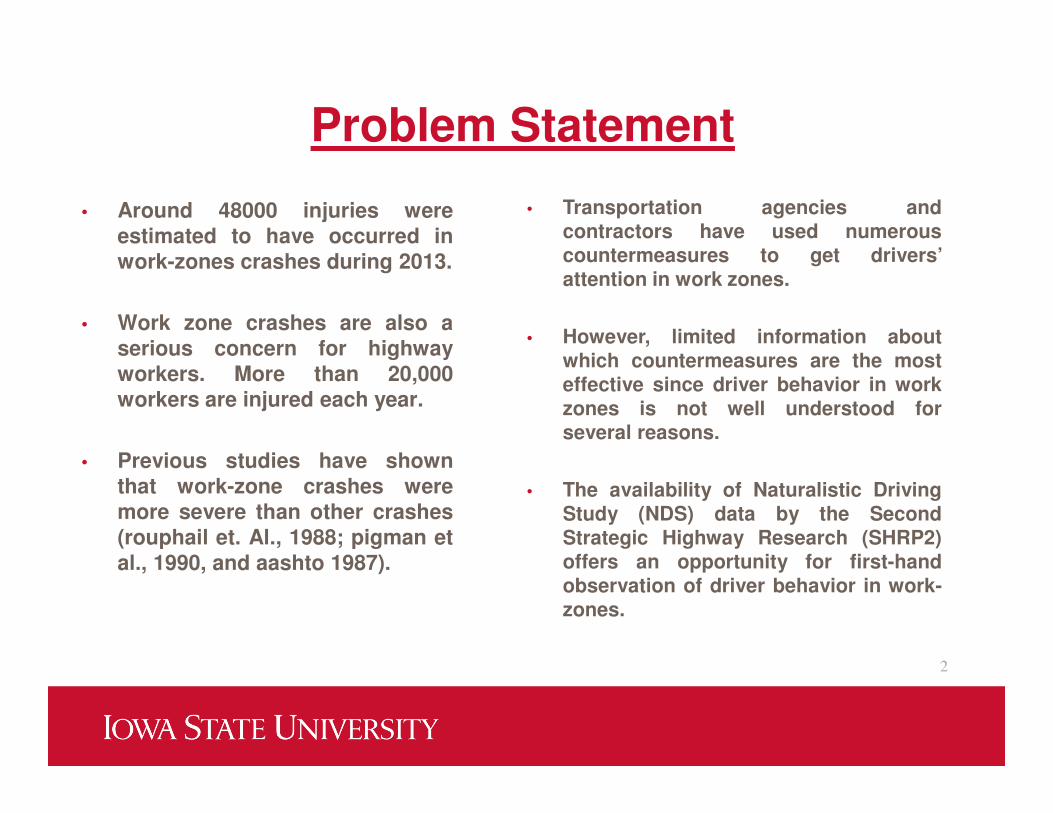
• Around 48000 injuries were
estimated to have occurred in
work-zones crashes during 2013.
• Work zone crashes are also a
serious concern for highway
workers. More than 20,000
workers are injured each year.
• Previous studies have shown
that work-zone crashes were
more severe than other crashes
(rouphail et. Al., 1988; pigman et
al., 1990, and aashto 1987).
2
• Transportation agencies andcontractors have used numerouscountermeasures to get drivers’attention in work zones.
• However, limited information aboutwhich countermeasures are the mosteffective since driver behavior in workzones is not well understood forseveral reasons.
• The availability of Naturalistic DrivingStudy (NDS) data by the SecondStrategic Highway Research (SHRP2)offers an opportunity for first-handobservation of driver behavior in work-zones.

Data Sources
• The second Strategic Highway Research Program (SHRP2)
Naturalistic Driving Study (NDS) data.
• Roadway Information Database (RID) Supplemental 5-1-1 data.
• 5-1-1 is a transportation and traffic information telephone hotline
to inform drivers regarding road conditions and traffic. Currently
35 states participates in the 511 system.
• The 5-1-1 data served as the main source of data for finding out
construction and maintenance events for this study.
3
Some Identities
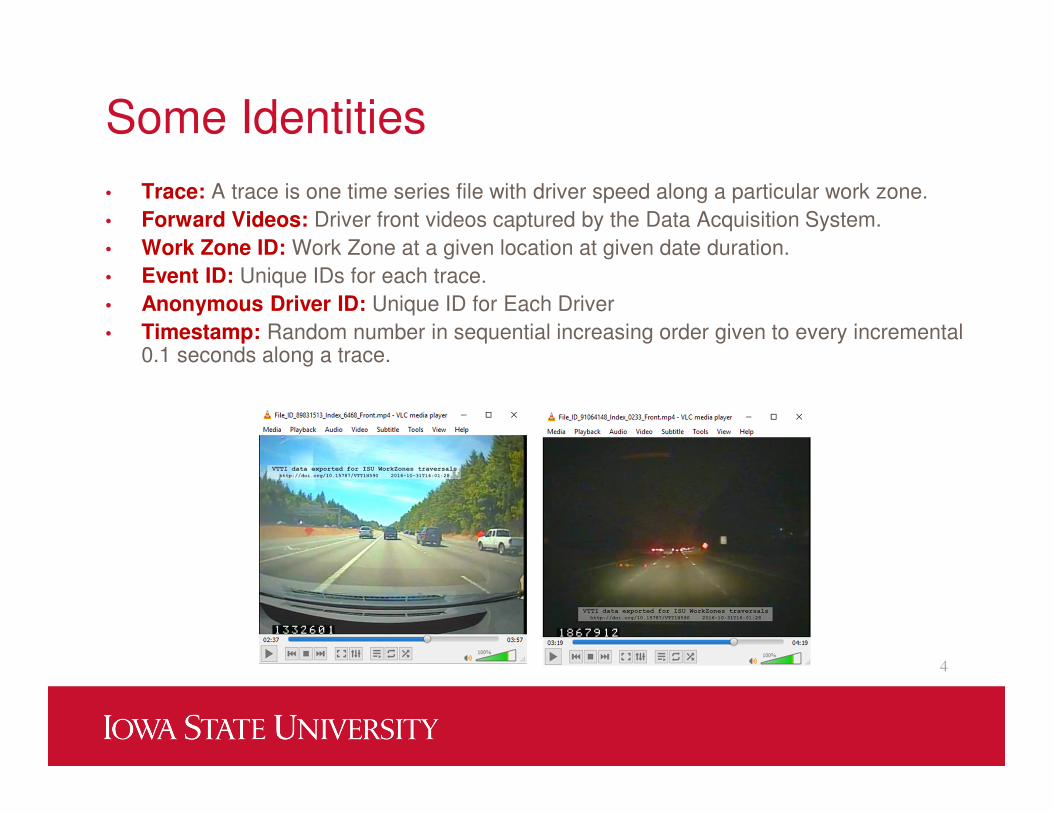
• Trace: A trace is one time series file with driver speed along a particular work zone.
• Forward Videos: Driver front videos captured by the Data Acquisition System.
• Work Zone ID: Work Zone at a given location at given date duration.
• Event ID: Unique IDs for each trace.
• Anonymous Driver ID: Unique ID for Each Driver
• Timestamp: Random number in sequential increasing order given to every incremental 0.1 seconds along a trace.
4

Data Collection
VttI provided trip density
Work zones with > 15 trips selected: 1680
Longer duration work zones selected for NDS study period
9290 Work Zones
511 data (mined for construction and maintenance)
2 million records
5
6
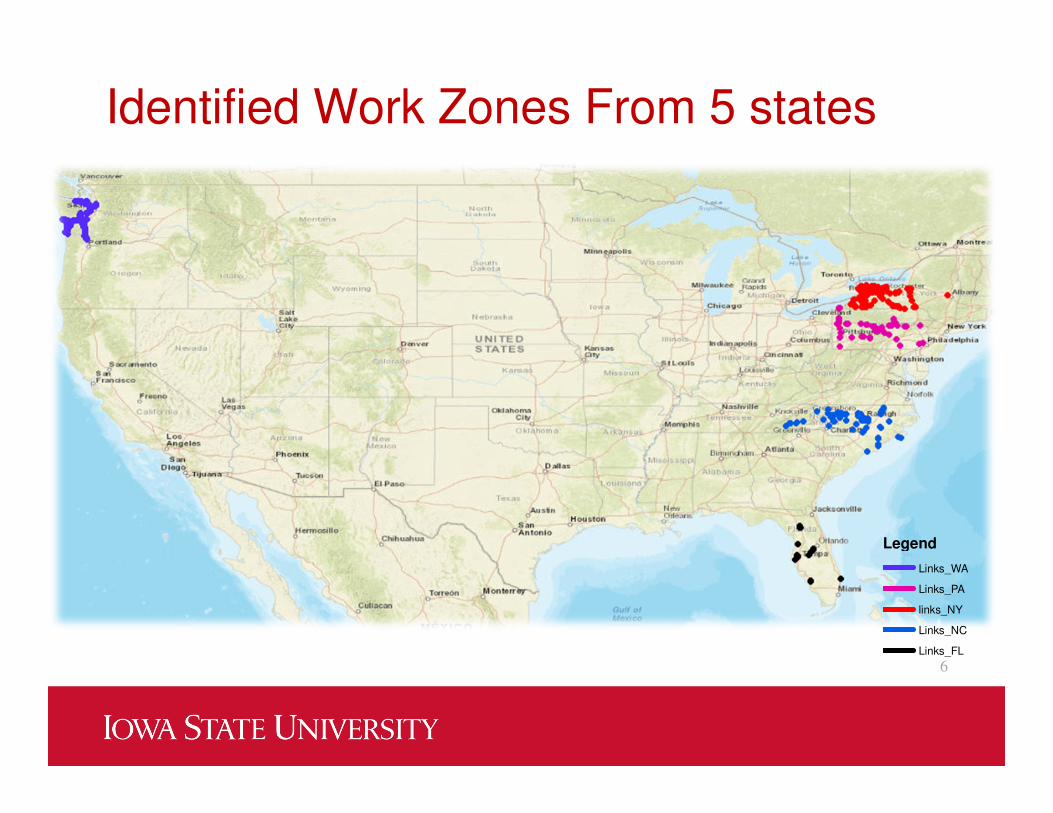
Legend
Links_WA
Links_PA
links_NY
Links_NC
Links_FL
Identified Work Zones From 5 states

Data Collection
7
Previously determined Extents of work zones adjusted based on videos
Using spatial location from time series data
VTTI provided 2 to 3 time series traces from each work zone
Forward videos manually checked: only active work zones were selected: 118 work zone
Dynamic segmentation method in ArcGIS
Work Zone Extents were detected

Data Collection
8
Driver face video reduced at the enclave
Reduced glance and distraction of driver
Traces were filtered
90% more speed data available, distribution of driver demographics, day/night , etc.
VTTI provided 50-100 traces for each work zone
4800 time series traces were obtained

Data Reduction
• Even though multiple time series traces were available
for each work zone, characteristics within a work zone
can change from day to day.
• Information starting from First Work Zone Sign to the
End of Work Zone Using time stamps from the front
video was coded for each individual time series files.
• Work Zone Signs: Static, VMS, Speed limit, lane merge ,
enforcement, etc. were coded manually.
9

Data ReductionList of variables reduced from each
traces:
• Road Configuration prior to Work
Zone
• Median Type
• Type of Barrier
• Presence of glare screen
• Work Zone Configuration
• Number of lane closed
• Channelizing device (cones,
barrels, or concrete barrier, vertical
panels)
• Location of Channelization
• Presence of equipment and type of
exposure
• Presence of barrier
• Presence of Workers and type of
exposure 10
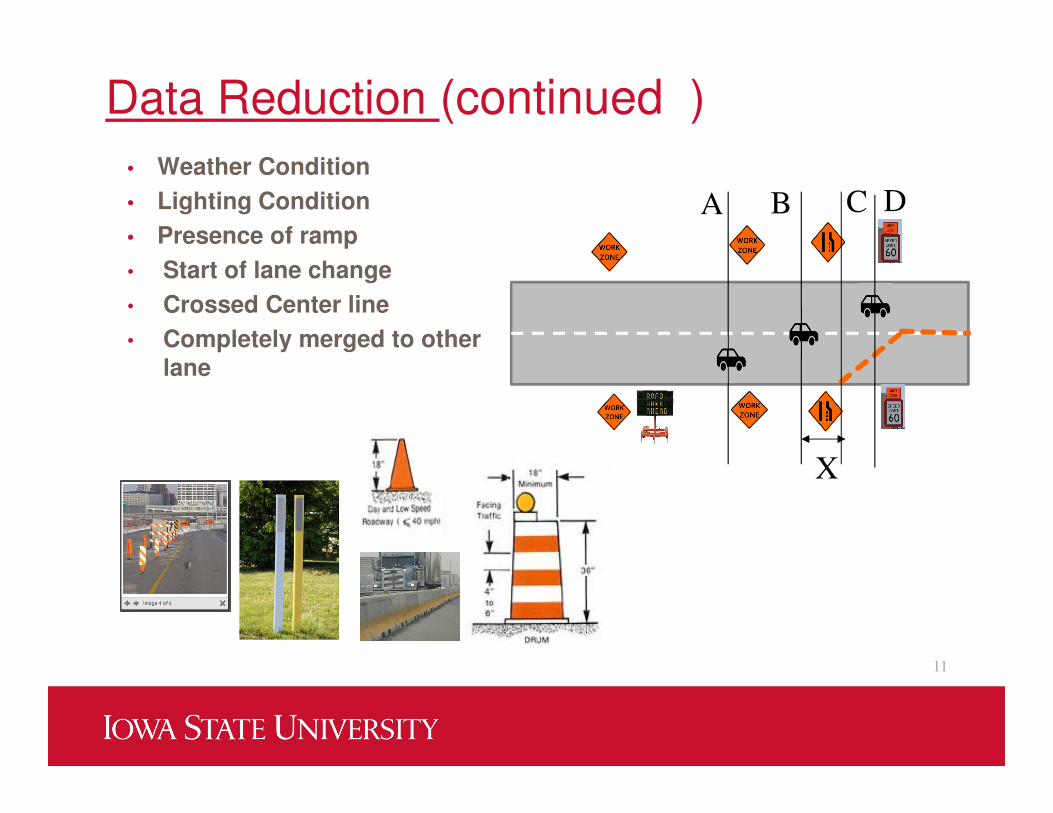
Data Reduction (continued )
11
• Weather Condition
• Lighting Condition
• Presence of ramp
• Start of lane change
• Crossed Center line
• Completely merged to other
lane
A B C D
X

12
Speed prediction model- Preliminary
model• Various factors affect the speed of vehicles passing through a work zone.
• The main purpose was to model drivers’ speed along a work zone as well as to
identify Infrastructure and operational elements intended to control speed and their
effect on driver behavior. This information can be used by agencies to decide work
zone strategies to maintain desired speeds within a work zone.
• The model uses estimates at a point to assess driver speed. The model only
included time series traces where the driver was in free-flow conditions. The dataset
represents Speed in m/s as dependent variable.
• The dense time series data (0.1 secs apart) for 82 traces of work-zones on 4 lane
divided roadways were stacked together and the dataset represented a combined file
of multiple time series files with other variables associated to the time stamps.
• The position points were treated as indicators of the locations 100 m apart along a
trace.

13
Speed Profile along Work Zone
The distance coded was 2.0 miles upstream of the
start of work zone through 1.0 miles inside the work
zone (downstream). This allowed driver behavior
before they entered the work zone to be captured.

Legibility distances
14
Static Work Zone Warning Signs:
General guidance: 1 inch of letter height per 30 feet
legibility distance.
Thus assuming 6 inch letter height the legibility distance
is 180ft.
Source: MUTCD 2009

Work Zone Speed Limit Sign : Assuming the
letter height of speed limit letters to be 15 inches
for 36’’ by 36’’ plaque size of speed reduction
sign to be on the conservative side, the legibility
distance was calculated as: 30X15= 450ft.
15
Legibility distances
Changeable message sign and Lane Merge
Sign: used on roadways with speed limits of 55
mph or higher should be visible from ½ mile under
both day and night conditions. The message
should be designed to be legible from a minimum
of 600 ft. for nighttime conditions and 800ft. for
normal daylight conditions. Source: MUTCD 2009.
Lane Merge Sign was close to letter

4 lane divided work zones
Variables NumberTotal number of traces 82
Total Number of Observations in dataset 230866
Average number of observation in each trace 2827
Number of WorkZones 14
Number of drivers 60
Driver ageMin 19
Max 86
Total number of traces VMS Sign was present 65
Total number of traces among 65 where VMS was Active 53
Total number of traces with Head To Head Traffic 29
Left Lane Closure 45
Right Lane Closure 22
Total number of traces where equipment presence were noted 29
Total number of traces where cell phone usage were noted 11
16

Glance and Distraction
Forward
Right
Left
Down
Rear view Mirror
Steering Wheel
Center Console
Passenger
Missing
Over the shoulder
Up
17
Passenger
Cell Phone
In vehicle Controls
Other Task
Drinking/Eating
Moving/Dropped Object
Personal Hygiene
Glance Distraction
Glance
Eyes Forward If Eye glance remained Forward
Distraction Base: Not Distracted
Cell Phone Cell Phone
In Vehicle DistractionIn Vehicle controls or moving or dropped object
Distraction
DrinkEatSmokeOtherTaskPersonalHygieneDrinking, Eating, Smoking, performing Other
Tasks and Personal Hygiene
Passenger Passenger

18
Variables Mean Standard Deviation
Speed in meter per second 24.39 6.42
Age of Driver When Driving 48 17.75
Female Driver 0.554 0.50
First Sign within Legibility distance of 180ft 0.008 0.09
Lane Merge Sign within Legibility Influence 0.007 0.08
Work-zone Speed Limit Sign Along Legibility distance of 450 feet 0.028 0.16
Changeable message sign Along Legibility of 600 feet 0.034 0.18
Static Work-zone Sign Along Legibility of 180 feet 0.018 0.13
Concrete Median 0.279 0.45
Depressed Median 0.171 0.38
Raised Median 0.005 0.07
Guard Rail 0.008 0.09
Head to Head Traffic Work-zone Configuration 0.037 0.19
Right Shoulder Closure 0.008 0.09
Both Shoulder Closure 0.024 0.15
Left Lane Closure 0.097 0.30
Left Shoulder Closure 0.014 0.12
Right Lane Closure 0.133 0.34
Channelizing Guardrail 0.006 0.08
Cones 0.004 0.06
Concrete And Cones 0.001 0.03
Guardrail And Concrete 0.005 0.07
Barrels 0.116 0.32
Vertical Panels 0.052 0.22
Concrete And Vertical Panels 0.001 0.03
Channelizing Concrete Barrier 0.130 0.34
Concrete Barrier And Barrels 0.013 0.11
Equipment 0.005 0.07
If Eye glance remained Forward 0.621 0.49
Cell Phone 0.009 0.09
In Vehicle controls or moving or dropped object Distraction 0.003 0.05
Drinking, Eating, Smoking, performing Other Tasks and Personal Hygiene 0.006 0.07
Passenger 0.004 0.07

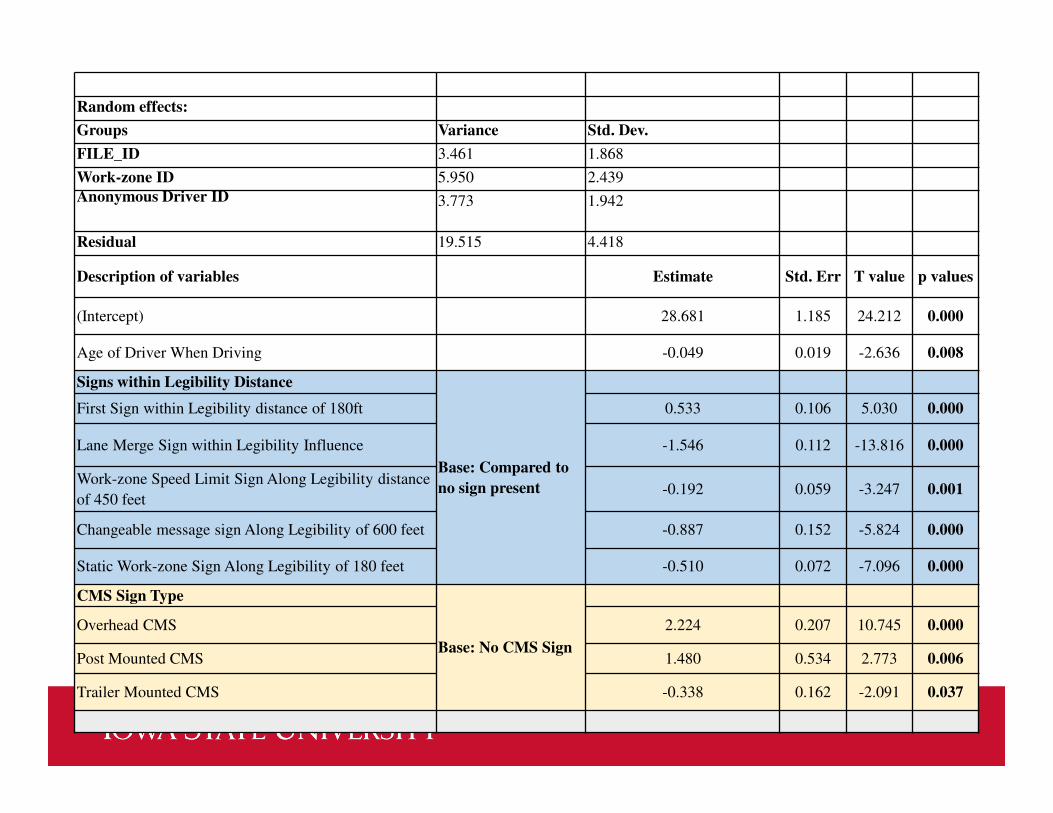
Linear mixed effects models: • This study involved multiple observations from a same subject driver.
• Positive estimate value indicates drivers speed was higher than average due to the presence of that variable and vice versa.
• The speed prediction model can be written as: ����� � �� ��
���� � � ⋯……… �� , ��~��������, ���������
Where,�� is the intercept term� !�, ��,… . are values of parameter estimates (or coefficients) of variables shown in Table-3.
�, ��, …. are the values of the fixed effects variables shown in Table-3 above for each observation.
####$$$$ = random effect terms
• The lme4 package in R was used to estimate the model. Models were fit including variables which were significant at the 95% confidence level. P-values for mixed models were calculated by normal approximation method.
19
20
Random effects:
Groups Variance Std. Dev.
FILE_ID 3.461 1.868
Work-zone ID 5.950 2.439
Anonymous Driver ID 3.773 1.942
Residual 19.515 4.418
Description of variables Estimate Std. Err T value p values
(Intercept) 28.681 1.185 24.212 0.000
Age of Driver When Driving -0.049 0.019 -2.636 0.008
Signs within Legibility Distance
Base: Compared to
no sign present
First Sign within Legibility distance of 180ft 0.533 0.106 5.030 0.000
Lane Merge Sign within Legibility Influence -1.546 0.112 -13.816 0.000
Work-zone Speed Limit Sign Along Legibility distance
of 450 feet-0.192 0.059 -3.247 0.001
Changeable message sign Along Legibility of 600 feet -0.887 0.152 -5.824 0.000
Static Work-zone Sign Along Legibility of 180 feet -0.510 0.072 -7.096 0.000
CMS Sign Type
Base: No CMS Sign
Overhead CMS 2.224 0.207 10.745 0.000
Post Mounted CMS 1.480 0.534 2.773 0.006
Trailer Mounted CMS -0.338 0.162 -2.091 0.037

Type of median Prior to
Work-zone
Base: Raised MedianConcrete Median 2.827 0.034 82.970 0.000
Depressed Median 0.106 0.033 3.199 0.001
Guard Rail -1.042 0.197 -5.278 0.000
Work-zone Configuration
Base: Non Work-zone
Area
Head to Head Traffic Work-
zone Configuration-2.072 0.081 -25.732 0.000
Right Shoulder Closure 2.121 0.117 18.121 0.000
Left Shoulder Closure 2.892 0.093 31.021 0.000
Right Lane Closure -3.063 0.069 -44.266 0.000
Left Lane Closure -0.151 0.059 -2.541 0.011
Work-zone Channelizing
Devices
Base: No channelizing
Devices used
Cones -3.284 0.168 -19.578 0.000
Concrete and Cones -4.609 0.320 -14.405 0.000
Guardrail and Concrete -7.629 0.153 -49.978 0.000
Barrels -3.591 0.050 -72.176 0.000
Vertical Panels -4.101 0.072 -56.918 0.000
Channelizing Concrete
Barrier-4.563 0.069 -66.272 0.000
Concrete Barrier and
Barrels-4.184 0.137 -30.495 0.000
21

22
Presence of Construction Equipment
Equipment -1.227 0.268 -4.572 0.000
If Eye glance remained Forward -0.263 0.025 -10.681 0.000
Distraction
Base: Not
Distracted
Cell Phone 0.307 0.120 2.554 0.011
In Vehicle controls or moving or dropped object Distraction -1.207 0.175 -6.897 0.000
Drinking, Eating, Smoking, performing Other Tasks and Personal Hygiene -4.193 0.130 -32.349 0.000
Passenger -0.552 0.142 -3.883 0.000
Position points 100 m apart before and inside work-zone
Base: Other
position Points
Position point at 500 m upstream of start of work-zone -0.915 0.517 -1.769 0.077
Position point at 400 m upstream of start of work-zone -1.167 0.516 -2.263 0.024
Position point at 300 m upstream of start of work-zone -1.555 0.517 -3.007 0.003
Position point at 200 m upstream of start of work-zone -1.955 0.517 -3.780 0.000
Position point at 100 m upstream of start of work-zone -2.191 0.517 -4.238 0.000
Position point at 100 m inside of start of work-zone -2.566 0.461 -5.572 0.000
Position point at 200 m inside of start of work-zone -3.369 0.516 -6.533 0.000
Position point at 300 m inside of start of work-zone -3.589 0.516 -6.961 0.000
Position point at 400 m inside of start of work-zone -3.833 0.516 -7.434 0.000
Position point at 500 m inside of start of work-zone -4.340 0.516 -8.416 0.000

Conclusion• For each one-year increase in age, speed was 0.05 meter per second(mps) or
0.11 miles per hour(mph) lower.
• Under the influence of a lane merge sign, speed was lower by
1.55mps(3.50mph). The presence of an active CMS sign showed that speed was
lower by 0.89mps(1.98mph).
• When median guardrails were present outside of the active work zone, speed
was 1.04mps(2.33mph) lower as compared to raised median type.
• Speed was lower by 3.06mps(6.85mph) when the work-zone had right lane
closures.
• The presence of channelizing devices lowered speed from more than
3.28mps(7.34mph) to 7.63mps(17.07mph).
• When work-zone equipment was present, speed was lower by more than 1.23
mps(2.75mph). 23

Speed was lower with these variables
24
0
1
2
3
4
5
6
7
8
9
Speed w
as low
er
by
Variables

Speed was higher with these variables
• Results also indicate that driver speeds were higher under the influence of the first work-zone sign they encountered when compared to sections where no sign was visible . This may be since first signs were placed about 2 miles upstream for majority of lane closure work-zones.
• When drivers were engaged in a cell-phone distraction, speed was higher by about 0.31mps(0.69mph) compared to no distraction.
• All of the above results are statistically significant at 0.10 alpha levels except for cell phone use.
25
0
0.5
1
1.5
2
2.5
3
3.5

Few Takeaways
26
The study demonstrated that work-zones can be successfully located in the
SHPR 2 RID data using the 511 data and then matched to work-zones
identified in the SHRP 2 NDS data.
Taken together, the study evaluated the impact of various temporary traffic
control signs along with presence of equipment on driver’s speed.
Lane merge sign, CMS, channelizing devices influenced the drivers to
choose lower speed in a work zone.
Drivers tends to choose lower speed consistently starting from 500m
upstream until 500m inside the work zones. But speed reductions become
somewhat static after that when drivers become familiar with the work zone.

Limitations and ongoing future work
• 260 more reduced work zone traces in 4 lane roads will be added in
future.
• This study investigated 4 lane divided roads only, in the future the
research team wishes to expand this method to other multilane roads.
• This study is based on only free flow condition, information on level of
service is being collected on non-free flow traces of the same work
zones to assess driver behavior before lane drop.
• This model uses estimates at a point to assess driver speed. The model
cannot indicate whether drivers slowed down for a particular work zone
feature. That will be addressed in another difference in speed model.
• Spatial correlation will be addressed.
27

Thank You.
Questions?
28