modeling dialup internet access: an examination of user-to
TRANSCRIPT

Available online at www.sciencedirect.com
Computers & Operations Research 30 (2003) 1959–1976www.elsevier.com/locate/dsw
Modeling dialup internet access: an examination ofuser-to-modem ratios, blocking probability, and capacity
planning in a modem pool
David C. Novaka ;∗, Daniel Rowlandb, Luiz DaSilvac
aDepartment of Operations and Information Management, School of Business, University of Connecticut,1200 Hillside Road, Unit 1041, Storrs, CT 06269, USA
bSpirent Communications Service Assurance - Broadband, Hardware Systems, 15200 Omega Drive,Rockville, MD 20850, USA
cBradley Department of Electrical and Computer Engineering, Virginia Polytechnic Institute and State University,206 N Washington St. Suite 400, Alexandria, VA 22314, USA
Received 1 April 2001; received in revised form 1 June 2002
Abstract
In the near future, dialup connections will remain as one of the most popular methods of remote accessto the Internet as well as to enterprise networks. The dimensioning of modem pools to support this typeof access is of particular importance to commercial Internet service providers as well as to universities thatmaintain their own modem pools to support access by faculty, sta7, and students. The primary contributionof this paper is to analyze how network administrators may decrease the probability of blocking for accessto the pool by imposing session limits restricting the maximum duration of the online session. Session limitsmay provide a viable alternative to improving network performance without necessarily adding capacity to thepool. Blocking probability is examined under a number of di7erent scenarios to assess potential improvementsin the quality of service by imposing session limitations during peak-period operations.
Scope and purpose
The dimensioning of modem pools to support dialup access by subscribers is an important problem facingboth Internet service providers (ISP) and academic institutions that support this type of access. This paperfocuses on the use of computer simulation to address modem pool performance using blocking probability asa proxy for level of service during peak periods of operation. The parameter estimates for network tra;c arebased on historical session log data from large university-based ISP. The paper begins with a brief discussionof tra;c variables and examines the underlying distributions associated with each variable. A simulationmodel is constructed using OPNET Technologies network modeling tool, OPNET ModelerTM. The results ofthe various simulations are presented and discussed in detail.
∗ Corresponding author. Tel.: +1-860-485-1241; fax: +1-860-486-4839.E-mail address: [email protected] (D.C. Novak).
0305-0548/03/$ - see front matter ? 2003 Elsevier Science Ltd. All rights reserved.PII: S0305-0548(02)00119-3
1960 D.C. Novak et al. / Computers & Operations Research 30 (2003) 1959–1976
Long-range capacity planning in dialup environments is critical despite the fact that network-related researchhas shifted away from dialup issues and focused on more cutting-edge issues. Although dialup network accessremains the most heavily utilized consumer-based access method in the world, few providers seem to beconsidering issues such as the level of service provided to customers and how they may be able to improveservice. We examine the issue of service quality in terms of the probability of blocking. Once a benchmarkblocking probability is calculated for the modem pool, we investigate how the implementation of innovativemanagement strategies, such as imposing session limits, may impact blocking vs. the traditional approach ofsimply adding capacity. The paper seeks to provide readers with some indication as to the level of serviceassociated with various user-to-modem ratios and how di7erent combinations of session limits and capacitymay improve service.? 2003 Elsevier Science Ltd. All rights reserved.
Keywords: Simulation; Modem pool; Performance analysis; M/M/m/m loss queue; Connection-based networks
1. Introduction
As Internet usage continues to grow, the demand for fast, reliable service also grows. In spite ofthe introduction of new network access technologies such as Asymmetric Digital Subscriber Line(ADSL), hybrid Cber coax (HFC) and broadband wireless, traditional analog modems remain apopular and viable alternative for online access. Most service providers support the vast majority oftheir customer base using analog modems [1,2]. The reliance on analog modems to service variouscustomers is not expected to decrease signiCcantly over the next several years and analog modemsmay continue to be widely utilized for years to come.
Administering a modem pool has become more di;cult as the number of Internet users hasgrown and customer usage patterns have changed over time. Rapidly increasing subscriber bases,data intensive applications (such as streaming audio and video), heavy Web browsing, and largeCle downloads require signiCcant resources and may tax existing network bandwidth. Reliabilityand quality of service are becoming signiCcant issues for service providers across the country.Long-range capacity planning has become an increasingly essential part of successfully managing amodem service, since pricing, reliability, and service quality issues are directly related to customerusage patterns. As the nature of providing reliable modem-based services changes, the need forlong-range planning increases.
While the need for increased planning is clear, given the lack of directly related literature, thereseems to be little indication that commercial ISPs or university service providers have taken thenecessary steps to adequately research tra;c patterns and quality of service issues related to dialupnetwork access. Based on several well-publicized service failures associated with large ISPs in theUnited States, the management of modem pools appears to be largely reactionary. Considering thedynamic nature of the Internet, it is reasonable to assume that additional service crises may beimminent in the future. This may be particularly true for smaller providers that cannot a7ord tosimply purchase additional modems when the quality of service begins to deteriorate.
The communications network service (CNS) of Virginia Tech is used as the basis for this study.All data and model parameter estimates were obtained through an analysis of CNS modem pool data.CNS currently operates and maintains a modem pool to service Virginia Tech a;liates. Although
D.C. Novak et al. / Computers & Operations Research 30 (2003) 1959–1976 1961
other Internet services are available through a myriad of private providers, the CNS modem poolhas traditionally provided reliable quality service for a reasonable price and therefore remains apopular service alternative. Over the past decade, modem pool activity has increased noticeably.During the 1998–1999 academic year, the Virginia Tech modem pool (VTMP) serviced roughly10,000 customers. Prior to the 1998/1999 school year, the customer base had been growing at anannual rate of somewhere between 10 to 20 percent [3]. CNS has experienced increased congestionwithin the pool during speciCc time periods, despite the fact that the customer base has remainedrelatively stable over the past 2 years. The peak period of activity runs roughly from 6:00 PM to11:00 PM. To continue to provide a quality service, CNS is considering several usage policies aimedat reducing modem pool congestion during peak periods. At the time of writing, no formal analysishad been conducted to determine how implementing various business rules might impact congestion.
To obtain a better idea of performance and tra;c issues, CNS conducted a study aimed at char-acterizing key metrics of user behavior during the summer of 1999. The study focused on Ctting aprobability distribution to service time and interarrival time data, performing several statistical testson the data, and examining summary statistics for the data sets. Due to software constraints, CNScollects only base data for successful modem pool connections. There are no records for unsuc-cessful connection attempts. The Celds for these data include begin-session timestamp, end-sessiontimestamp, type of session, user ID, line number, server IP, and date. CNS does not have access toinformation related to the number of blocked calls; such information is the property of Verizon [3].Although CNS can collect utilization statistics on any given day and has some historical informationon service times and interarrival times, it does not have detailed information relating to the level ofservice or the number of busy signals during a given time period.
To benchmark the performance of the modem pool with respect to blocking probability, a simu-lation model was created using OPNET Technologies network simulation tool, OPNET ModelerTM.Once the model was created a number of simulations were run to examine blocking probabilitieswhen di7erent business rules were implemented and when the number of modems in the pool wasvaried. Blocking probability is used as a proxy for the level of service. A high blocking probabilityis indicative of a relatively low level of service and vice versa. Innovative management strategies orbusiness rules are implemented in an attempt to reduce blocking probability to the pool and providegreater fairness to customers. In the context of this paper, business rules refer to static session limitswhere the duration of an individual session is limited to some predetermined time value. Once thetime limit is exceeded, the session is automatically terminated. Management may consider impos-ing business rules to discourage users from being connected for extended, uninterrupted periods oftime. The purpose of such rules is to prevent users from monopolizing resources and to reduce theblocking probability. An example of a session limit is to restrict the duration of individual sessionsto a maximum of 2 h during peak times. At the end of the designated time period, the user isdisconnected and must redial to establish a new connection to the pool.
The concept of a business rule is very generic; business rules include any type of pro-activemanagement strategy designed to achieve a speciCc management objective such as reducing blockingprobability or promoting equitable access to scarce resources. There are many possible types ofbusiness rules that could be employed. Examples might include dynamic sessions limits that aretriggered when some predeCned utilization threshold is exceeded. For example, limiting the sessionduration to 30 min when the pool reaches 90 percent of its capacity. Other examples might includerestricting the number of times a customer can log into the pool during a given time period, or even

1962 D.C. Novak et al. / Computers & Operations Research 30 (2003) 1959–1976
imposing some type of priority service based on di7erent subscription prices—customers choosefrom di7erent service levels and those who pay higher subscription fees are rewarded with priorityaccess. In this paper, we examine the impact of static session limits on blocking probability duringthe peak period of operation.
This paper describes a research project designed to simulate the performance of the VTMP dur-ing peak-period operation to evaluate possible upgrades. Three alternatives for reducing blockingprobability during the peak period are examined. The Crst alternative considers how implementingbusiness rules that limit the duration of a session may impact the blocking probability and subse-quently the overall performance of the pool. The second alternative considers how adding modemsto the pool may reduce the blocking probability. Finally, a hybrid solution is evaluated to investigatethe e7ectiveness of business rules in conjunction with adding capacity. The paper is structured asfollows.
A brief review of relevant literature is presented in Section 2. The data used in the study arediscussed in Section 3. Characterization of online tra;c is discussed in Section 4. Several statisti-cal techniques are employed to determine the form of both service and interarrival time variables. Theestimates for mean service and interarrival times are also presented. The simulation model isdescribed in Section 5. The assumptions associated with the model are discussed in detail alongwith potential shortcomings of the model. VeriCcation and validation of the model is then describedin Section 6. The results of the simulations are discussed in Section 7. The Cnal section addressesthe conclusions and provides some suggestions for further research.
2. Relevant literature
A literature review provided little insight into research directly related to modem pool or dialupperformance. It is hypothesized that if such research exists, it is largely proprietary. Although verylittle information was found that relates directly to performance analysis for dialup analog modempools, there is considerable literature related to teletra;c issues and network performance in general.Much of this literature is indirectly related to the issues discussed in this paper. A brief review ofsome of the relevant literature is provided in this section.
Rickard [2] discusses average dialup service fees in the United States and typical modem to userratios. CselLenyi et al. [4] present an experimental system to explore the telecommunication researchissues such as resource allocation and management. Chandra and Eckberg [5] present a statisticalcharacterization of online service tra;c. Law and Kelton [6] discuss how simulation can be usedto design and analyze communications networks. Iisaku and Urano [7] describe several capacityassignment strategies for integrated communications systems with heterogeneous tra;c and proposemethods to evaluate performance in terms of blocking probability. De Boer [8] discusses severalmethods for approximating the blocking probabilities of overNow tra;c components. Marshall andMorgan [9] analyze data tra;c on a virtual circuit-switched network at AT& T Bell Laboratories andreport on statistical Cndings related to interarrival times and call lengths for di7erent types of tra;c.Scavo and Miranda [10] focus on the role of customer behavior in devising strategies to improvenetwork performance. Pawlita [11] discusses the relevance of tra;c statistics for network modeling,performance analysis, and network tra;c control. He presents results of tra;c measurements in ateleprocessing system and discusses the implications of the results. Evers [12] provides results from

D.C. Novak et al. / Computers & Operations Research 30 (2003) 1959–1976 1963
a survey of subscriber behavior including repeated call attempts. Fuchs and Jackson [13] examinethe underlying distributions of random variables for certain computer communication models.
While there is a considerable literature that addresses network performance from a technical orengineering perspective, there is very little literature that focuses on relevant business issues. Forexample, the authors are not aware of any literature that focuses on deCning or meeting customers’dialup service expectations. Network performance is generally not examined in terms of providinghigh-quality services to the customer. For example, the probability of receiving a busy signal whenattempting to connect to a network via a dialup connection is not considered. The tradeo7s betweenblocking probability and the customers’ perception of the existing level of service are not examined.Many service providers advertise speciCc user-to-modem ratios, but do not provide details regardingwhat these ratios may mean in terms of service. Finally, there is a dearth of literature that addressescapacity planning from a cost minimization or a proCt maximization viewpoint.
Although dialup access is still the most prevalent consumer network access technology utilized inthe United States [1,2], there is very little published research that addresses modem pool performanceor capacity planning. In general, issues associated with modem pool performance and the potentialtradeo7s between blocking probability and capacity do not seem to be a priority concern. The focus ofthis analysis is on evaluating network performance through the blocking probability and investigatingwhether or not performance can be enhanced by implementing speciCc management practices suchas imposing static session limits to the modem pool. Improvements in blocking are also examinedusing more traditional techniques such as adding capacity. Finally, performance improvements areexamined in terms of various user-to-modem ratios.
3. Data
Between 1996 and 1999, CNS collected and stored data related to VTMP sessions using the Ter-minal Access Controller Access Control System (TACACS) access control protocol. 1 The protocolis used to collect session log data and to perform authorization/authentication of users. CNS storesmodem pool account information relating to the date of each transaction, terminal server ID, line ID,a unique client ID, and session start and end times. Data were collected 24 hours a day, 7 days aweek. The data were stored as formatted text Cles for individual days. For example, the session logdata Cle for October 1, 1998 begins at 12:00:00 AM and ends at 11:59:59 PM. There may be tensof thousands of records contained in any one individual daily Cle. The number of records dependson how busy the system is on any given day.
Session log records are stored on a workstation. Due to the large volume of data, only a coupleof weeks of records are stored on the server at any given time. Historical data are backed up andstored o7 site on tape. Neither service times nor interarrival times are explicitly deCned by theTACACS protocol. The fact that TACACS and TACACS+ are not explicitly designed as tra;canalysis tools greatly contributes to the di;culty and cost associated with this type of analysis.For the purpose of this study, both service time and interarrival time variables were obtained usingmathematical operations involving connection establishment and tear down timestamps for individual
1 In 1999, CNS deployed a new access control protocol called TACACS+. The format of the session records, the exactCelds of data stored, and some base functionality di7erences exist between TACACS and TACACS+.

1964 D.C. Novak et al. / Computers & Operations Research 30 (2003) 1959–1976
user ID values. The Crst step in the characterization process included retrieving and formatting thevarious data, building data sets to conduct various analyses, and creating speciCc variables withinthe given data sets.
The initial data set examined for this research consisted of all daily Cles for October 1998 (October1–31, 1998) and a number of days during the Crst two weeks of November. It was determinedthat October and the Crst several weeks of November were good months to analyze, since theyrepresent months in the middle of the fall academic semester where no unusual events typicallyoccur that might bias the analysis (such as exams or a fall break). A Tcl 2 script was written toconvert each user ID to a unique, but untraceable number. 3 Data Cles were further scrubbed of badrecords and transactions that were not needed in the analyses. Once the data Cles were devoid ofunwanted records, the Cles were examined for time concurrency. Several records were identiCed asbeing incomplete due to a recurring TACACS log server problem experienced during the month ofOctober; these records were discarded. Complete Cles were then exported to a PC via FTP as dataCles. The data Cles were converted to SAS data sets on the PC. There are 25 complete days includedin the analysis—four Sundays, four Mondays, three Tuesdays, three Wednesdays, four Thursdays,four Fridays, and three Saturdays. Data sets are constructed for each of the 24 hourly time intervalsin a day. For example, the time interval between 1:00:00 AM and 1:59:59 AM, the time intervalbetween 2:00:00 AM and 2:59:59 AM, and so on. Data sets are also constructed for each of thedays of the week. For example, every Monday, every Tuesday, and so on. Finally, an aggregate dataset including all 25 days and all time periods was also constructed.
4. Tra�c characterization
To accurately model the VTMP, appropriate parameter estimates for the number of servers, themean interarrival time, and the mean service time were obtained. Estimates for these parameterswere obtained through a statistical characterization of existing tra;c on the VTMP. The focus ofthis particular study is on the peak period. In this case, the peak period is deCned as the continuoustime interval between 6:00 PM and 11:00 PM. The peak period represents a time during whichthe pool is the busiest or essentially in equilibrium. The underlying assumption is that whenever acustomer departs the system during the peak period, a new customer immediately arrives into thesystem.
A critical Crst step in characterizing network tra;c was determining the underlying distribution ofboth the service time and interarrival time variables. It is relevant to note that blocking probabilityis free of the service time distribution in analytical queueing models. For example, the blockingprobability associated with M/M/m/m systems turns out to be the same as the blocking probability forM/G/m/m systems—delay depends only on the mean service time not the underlying distribution ofthe service time. This is also true for other systems where there is no queueing, such as M/M/inCnitysystems. However, traditional assumptions used to derive results in queueing theory may be violated
2 Tcl (tool command language) pronounced “tickle” is more like a scripting language than a programming language,so it shares a greater similarity to the C shell or Perl than it does to C++ or C.
3 Personal ID’s were converted to a numeric value to protect and honor the privacy of VTMP customers. There hasbeen no attempt to identify the behavior or usage patterns associated with any particular customer.

D.C. Novak et al. / Computers & Operations Research 30 (2003) 1959–1976 1965
when “business rules” such as those described above are adopted. In such cases, simulation providesa suitable solution methodology. Since simulation is used, it is necessary to verify the servicedistribution (equivalently, the probability distribution of the duration of a connection) to accuratelymodel the service process. A number of authors [14–16] identify the service time distribution as animportant element of a queueing system that must be known.
Several commonly used statistical procedures were employed in the analysis to determine theunderlying distributions for both tra;c variables. The analysis tool utilized in this research was SAS8.1. First, histograms were constructed for the various data sets. In general, the histograms revealeda basic exponential form for both variables over each of the hourly time intervals as well as for theaggregate data sets. Second, goodness-of-Ct tests were performed for all data sets. The underlyinghypothesis was that both variables would follow an exponential distribution over the hourly datasets. The aggregate data sets (days of the week and entire data set) were not expected to followan exponential distribution for either variable, as both the mean service time and mean interarrivaltime were expected to change over time. In all cases, the null hypothesis was rejected—neither theservice timer or the interarrival time variables followed an exponential or Weibull distribution withinthe hourly time intervals. It is important to note that in cases where the sample size is large, thegoodness-of-Ct test will almost always reject H0, since H0 is virtually never exactly true. Even aminute departure from the hypothesized distribution will be detected for a large n [15]. 4 This is anunfortunate property of the goodness-of-Ct test because it is usually su;cient to have a distributionthat is nearly correct.
It is important to note that the service times and interarrival times do not exactly follow an expo-nential distribution, although the basic form of both variables is exponential. The empirical data havea positive skew and have fatter tails than exponentially distributed data. The number of long sessionswill therefore be understated in the model. However, it is reasonable to approximate the data usingan exponential distribution for both variables based on previous research. It is a common teletra;cengineering practice to use the exponential distribution as an approximation for both service timesand interarrival times in cases where the data have an exponential form, but do not truly followan exponential distribution [17,14,18–21,16]. Exact characterization of network tra;c distributionsis an area of ongoing research, and can be a complex, time consuming undertaking that is likelyto be considered standalone research. It is often the case that teletra;c data follow uncharacterizedErlang-k, k-stage hyperexponential or other type of mixture distribution. The justiCcation for usingthe exponential distribution as a reasonable approximation for both service and interarrival times islargely based on the di;culty associated with accurately characterizing complex empirical mixturedistributions [22–25]. Although both arrivals and service times might not exactly follow an expo-nential distribution, the exponential assumption for both variables is considered to be a reasonableCrst-order approximation of network tra;c in the pool.
The second step in the characterization process involved the collection of summary statistics suchas the mean, median, and variance of the tra;c variables. The statistics of most interest werethe mean peak hour service times and interarrival times. The mean peak-period service time wasapproximately 1500 s (25 min). The mean peak-period interarrival time was 0:75 s. By taking theinverse of the interarrival time, we can estimate the interarrival rate—calls arrive at a rate of 1.33
4 The individual daily data sets used in this study contained tens of thousands of records.
1966 D.C. Novak et al. / Computers & Operations Research 30 (2003) 1959–1976
calls/s. For the purpose of this analysis, the number of modems contained in the pool is approximately1100, which constitutes a user-to-modem ration of about 9:1.
5. Simulation model
The primary beneCt of building a simulation model to analyze the operation of a modem pool isto provide some quantitative evidence in determining whether or not instituting static session limitsis an e7ective means of decreasing the blocking probability. Although it is possible to constructan M/M/m/m analytical queuing model to determine blocking probabilities for di7erent parametervalues, such as the number of modems, interarrival times, and service times, analyzing the impactof various business rules on blocking probability greatly complicates the analytical queuing model.It may also not be feasible for service providers to implement various session limits to observethe impact on blocking. This approach would cause a disruption in service that could criticallyimpact customer satisfaction. Simulation allows one to examine a number of hypothetical scenariosby imposing speciCc session limits and examining the impacts in terms of blocking probability. Inshort, a system that may be too complex to model analytically may be modeled using simulation[15]. Furthermore, once the base simulation model is constructed, a number of di7erent “what if”scenarios can be examined rather easily. Relationships between di7erent tra;c parameters, di7erentuser-to-modem ratios, and di7erent types of business rules can also be examined.
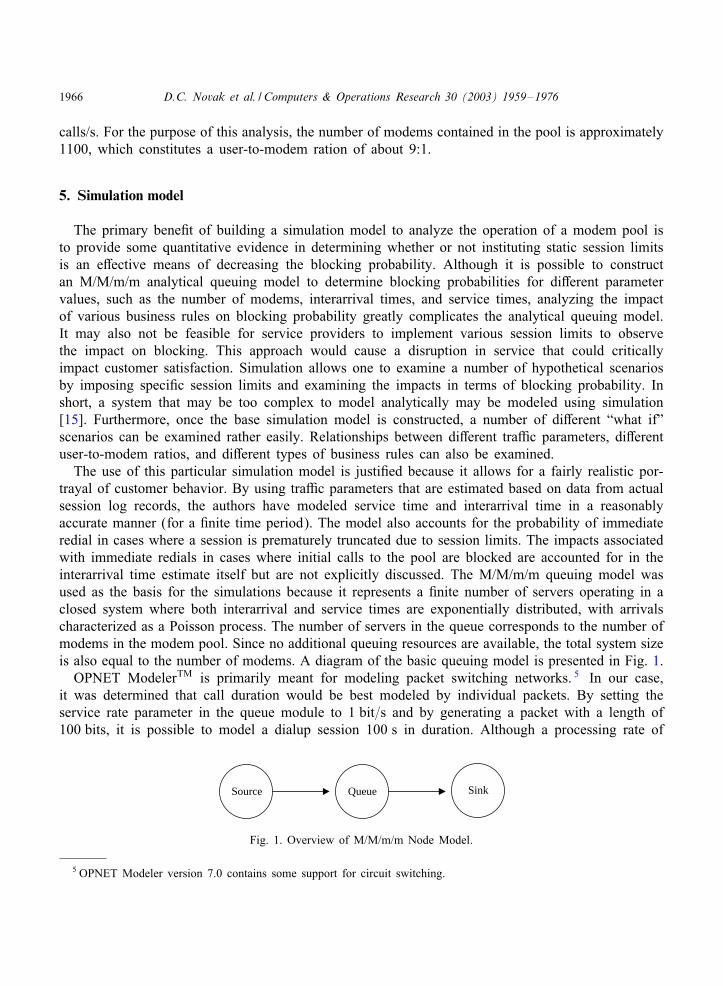
The use of this particular simulation model is justiCed because it allows for a fairly realistic por-trayal of customer behavior. By using tra;c parameters that are estimated based on data from actualsession log records, the authors have modeled service time and interarrival time in a reasonablyaccurate manner (for a Cnite time period). The model also accounts for the probability of immediateredial in cases where a session is prematurely truncated due to session limits. The impacts associatedwith immediate redials in cases where initial calls to the pool are blocked are accounted for in theinterarrival time estimate itself but are not explicitly discussed. The M/M/m/m queuing model wasused as the basis for the simulations because it represents a Cnite number of servers operating in aclosed system where both interarrival and service times are exponentially distributed, with arrivalscharacterized as a Poisson process. The number of servers in the queue corresponds to the number ofmodems in the modem pool. Since no additional queuing resources are available, the total system sizeis also equal to the number of modems. A diagram of the basic queuing model is presented in Fig. 1.
OPNET ModelerTM is primarily meant for modeling packet switching networks. 5 In our case,it was determined that call duration would be best modeled by individual packets. By setting theservice rate parameter in the queue module to 1 bit=s and by generating a packet with a length of100 bits, it is possible to model a dialup session 100 s in duration. Although a processing rate of
Source SinkQueue
Fig. 1. Overview of M/M/m/m Node Model.
5 OPNET Modeler version 7.0 contains some support for circuit switching.
D.C. Novak et al. / Computers & Operations Research 30 (2003) 1959–1976 1967
1 bit=s seems counter intuitive, it provided a straightforward technique to model call duration in apacket switched modeling environment. The service rate of the queue in combination with the packetsize represents the length of each connection as described above. The interarrival time is modeledusing the interarrival time parameter set within the packet generator of the source module.
Another challenge in modeling a modem pool was how to model the session limit business rules.This challenge was overcome by modifying the process-level code of the basic M/M/m/m queue.The modiCed queue included two extended attributes, a Boolean value indicating whether or not thebusiness rules should be used and an integer value corresponding to the maximum session durationin seconds. If the Boolean value is TRUE, the integer value representing the session duration is usedto terminate sessions when they exceed the speciCed limit. SpeciCcally, the truncation is performedimmediately upon the packet’s arrival in the queue module and prior to any servicing of the packet.This does not truly mimic the actual operation of the session limits, because there is no way toaccurately predict the intentions of an individual caller, but it yields accurate results and createse;cient simulations.
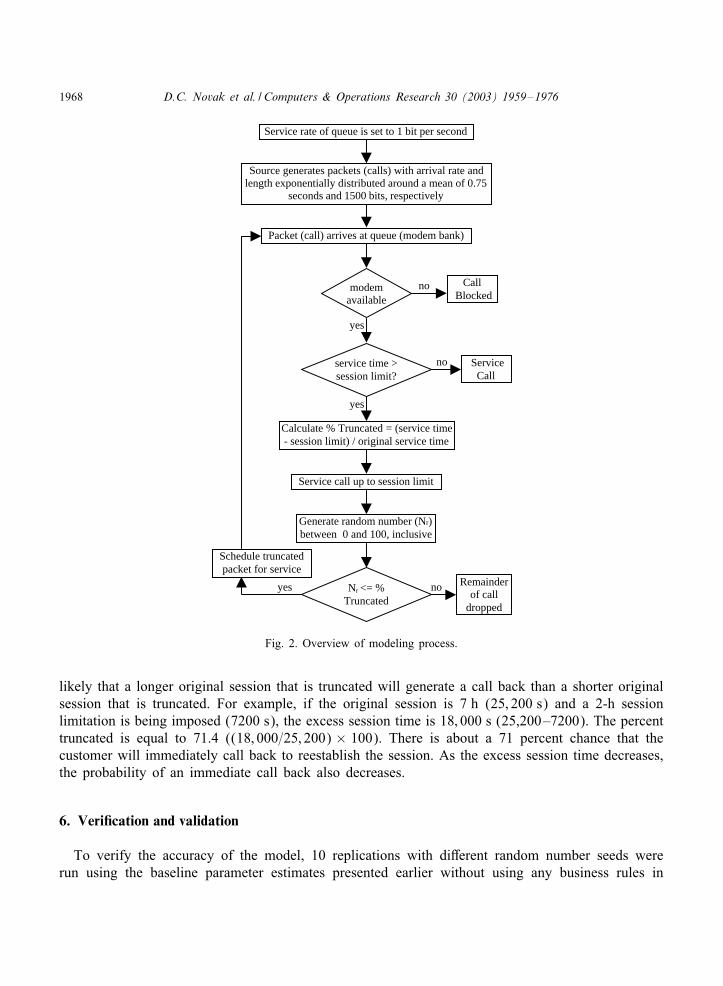
Additional modiCcations to the model include altering the process model code to reNect someprobability that users who are prematurely disconnected will immediately try to reconnect to thepool. Two commonly used tra;c engineering techniques are commonly employed to model networkswithout queuing—the Erlang B and Extended Erlang B (EEB) techniques [26]. Erlang B assumesthat blocked calls do not retry the system. The EEB, developed by Jewett and Shrago in 1975, isthe appropriate technique when some portion of blocked callers immediately retries to connect tothe system. Although our model does not consider redials if the initial call is blocked, the modeldoes incorporate a probability of redialing if the existing call is truncated. A Now chart describingthe general modeling process is presented in Fig. 2.As mentioned previously, immediate redials associated with blocked calls are not explicitly ac-
counted for in this model. The model described in this paper utilizes a modiCed Erlang B technique,but does not actually employ the EEB technique. That is, if a call is blocked it is not immediately re-tried based on some probability. However, it is commonly accepted among many telecommunicationsprofessionals that when calls are initially blocked, some unknown percentage of callers immediatelytries to reconnect [19,11]. Although this model does not directly account for potential redials withrespect to initially blocked calls, the interarrival estimate provided by CNS implicitly incorporatesthis behavior into the estimate [3]. Thus, the model provides a reasonable representation of userbehavior based on the information available to the authors.
The technique employed to generate redials in the case of a truncated session is a modiCed ErlangB technique. When the source node generates a random length session following an exponentialdistribution with a speciCed mean, the length of that session (the original session) is known bythe system. If the original session is truncated, the excess session time is recorded. Excess sessiontime is equal to the original session time minus the session limit imposed by a particular businessrule. The likelihood that a customer redials immediately after a given session is terminated wasassumed to be directly proportional to the excess session time. The new arrival is generated att=current time+15 s. If a customer redials, the new arrival is generated as a function of the initialarrival time, the session duration, the session limit, the service rate, and a static 15-s time intervaldesigned to capture the actual time required reconnecting to the network.
If the call back is successful, the new session duration is equal to the excess session time fromthe original session. This process is repeated if the session is truncated multiple times. It is more
1968 D.C. Novak et al. / Computers & Operations Research 30 (2003) 1959–1976
Source generates packets (calls) with arrival rate andlength exponentially distributed around a mean of 0.75
seconds and 1500 bits, respectively
Service rate of queue is set to 1 bit per second
Packet (call) arrives at queue (modem bank)
modemavailable
yes
no CallBlocked
service time >session limit?
yes
ServiceCall
yes
Calculate % Truncated = (service time- session limit) / original service time
no
Nr <= %Truncated
Service call up to session limit
Generate random number (Nr)between 0 and 100, inclusive
Remainderof call
dropped
no
Schedule truncatedpacket for service
Fig. 2. Overview of modeling process.
likely that a longer original session that is truncated will generate a call back than a shorter originalsession that is truncated. For example, if the original session is 7 h (25; 200 s) and a 2-h sessionlimitation is being imposed (7200 s), the excess session time is 18; 000 s (25,200–7200). The percenttruncated is equal to 71.4 ((18; 000=25; 200) × 100). There is about a 71 percent chance that thecustomer will immediately call back to reestablish the session. As the excess session time decreases,the probability of an immediate call back also decreases.
6. Veri"cation and validation
To verify the accuracy of the model, 10 replications with di7erent random number seeds wererun using the baseline parameter estimates presented earlier without using any business rules in
D.C. Novak et al. / Computers & Operations Research 30 (2003) 1959–1976 1969
e7ect. After analyzing the data, the blocking probability was determined to be 45.14 percent. Thisexperimental value was then compared to the analytical value obtained using the Erlang B formulafor the M/M/m/m queuing system presented as follows:
pm =(1=m!)
(
)m
1 +∑m
n=1(1=n!)(
)n : (1)
By letting m = 1100, = 0:000667 calls=s, and = 1:33 calls=s, a blocking probability of 45.06percent is obtained. This analytical value is very close to the experimental value of 45.14, thusverifying the accuracy of the model. Additional tests were performed comparing the simulationoutput to the analytical blocking probability considering eight separate values for m (the number ofmodems). In each case, there was less than a 0.15 percent di7erence between the average blockingprobability obtained from 10 simulation replications and the analytical blocking probability calculatedusing the Erlang B formula.
7. Results and discussion
The primary objective of this paper is to examine the impact of implementing session limits onmodem pool performance and compare these results with performance changes brought about byincreasing the number of modems to the pool. Three separate results are presented in this section.First, the impact of implementing various business rules on the existing system is examined. Second,the impact associated with changing the number of modems is evaluated. Finally, a hybrid solutionof implementing business rules and increasing the number of modems in the pool is looked at. Foreach simulation where business rules were enforced, 10 replications were run using di7erent seedsfor the random number generator. The results represent the average output obtained from thosereplications.
7.1. Business rules vs. blocking probability
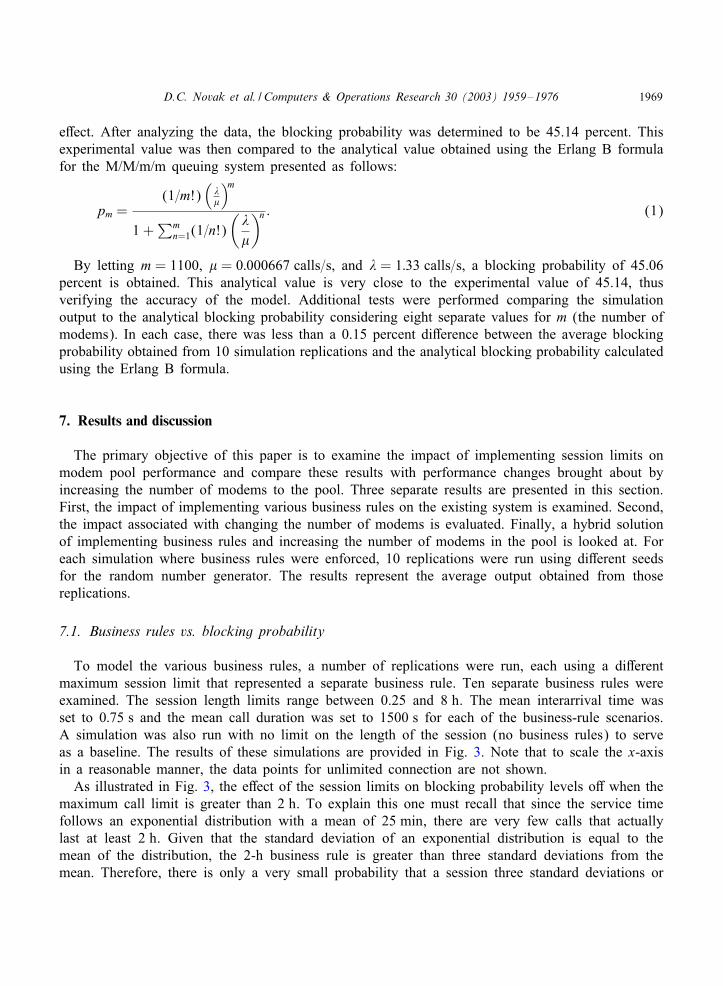
To model the various business rules, a number of replications were run, each using a di7erentmaximum session limit that represented a separate business rule. Ten separate business rules wereexamined. The session length limits range between 0.25 and 8 h. The mean interarrival time wasset to 0:75 s and the mean call duration was set to 1500 s for each of the business-rule scenarios.A simulation was also run with no limit on the length of the session (no business rules) to serveas a baseline. The results of these simulations are provided in Fig. 3. Note that to scale the x-axisin a reasonable manner, the data points for unlimited connection are not shown.
As illustrated in Fig. 3, the e7ect of the session limits on blocking probability levels o7 when themaximum call limit is greater than 2 h. To explain this one must recall that since the service timefollows an exponential distribution with a mean of 25 min, there are very few calls that actuallylast at least 2 h. Given that the standard deviation of an exponential distribution is equal to themean of the distribution, the 2-h business rule is greater than three standard deviations from themean. Therefore, there is only a very small probability that a session three standard deviations or
1970 D.C. Novak et al. / Computers & Operations Research 30 (2003) 1959–1976
0.25 1 2 3 4 5 6 7 8
0.0
5
10
15
20
25
30
35
40
45
50
Business Rule - Time Limit per session (Hours)
Blo
ckin
g P
roba
bilit
y (%
)
Impact of Business Rules on Blocking Probability
0.5
Fig. 3. Impact of call limits (1100 modems).
greater from the mean will occur at all. This is illustrated by integrating the density function for theexponential distribution as shown below:
P[X ¿X + 3�X ] =∫ ∞
X+3�X
e−x dx = e−(X+3�X );
X + 3�X =4⇒ P[X ¿X + 3�X ] ≈ 0:018: (2)
7.2. Number of modems vs. blocking probability
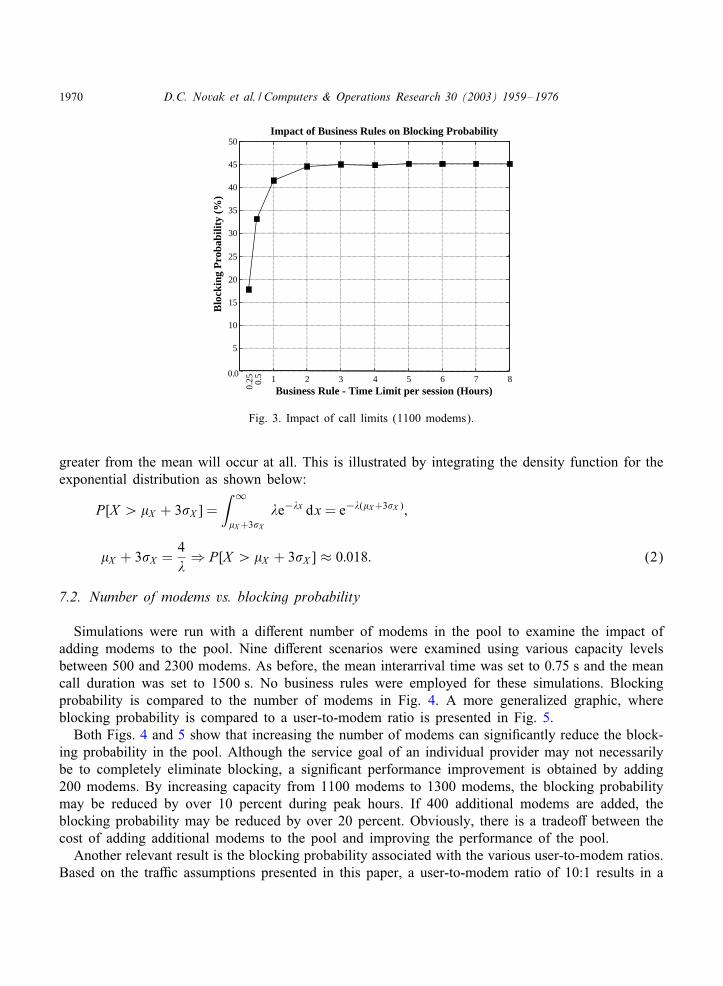
Simulations were run with a di7erent number of modems in the pool to examine the impact ofadding modems to the pool. Nine di7erent scenarios were examined using various capacity levelsbetween 500 and 2300 modems. As before, the mean interarrival time was set to 0:75 s and the meancall duration was set to 1500 s. No business rules were employed for these simulations. Blockingprobability is compared to the number of modems in Fig. 4. A more generalized graphic, whereblocking probability is compared to a user-to-modem ratio is presented in Fig. 5.
Both Figs. 4 and 5 show that increasing the number of modems can signiCcantly reduce the block-ing probability in the pool. Although the service goal of an individual provider may not necessarilybe to completely eliminate blocking, a signiCcant performance improvement is obtained by adding200 modems. By increasing capacity from 1100 modems to 1300 modems, the blocking probabilitymay be reduced by over 10 percent during peak hours. If 400 additional modems are added, theblocking probability may be reduced by over 20 percent. Obviously, there is a tradeo7 between thecost of adding additional modems to the pool and improving the performance of the pool.
Another relevant result is the blocking probability associated with the various user-to-modem ratios.Based on the tra;c assumptions presented in this paper, a user-to-modem ratio of 10:1 results in a

D.C. Novak et al. / Computers & Operations Research 30 (2003) 1959–1976 1971
500 1000 1500 2000 25000
10
20
30
40
50
60
70
80
Number of Modems
Blo
ckin
g P
roba
bilit
y (%
)
Impact of Number of Modems on Blocking Probability
Fig. 4. Impact of number of modems on blocking.
0 2 4 6 8 10 12 14 16 18 200
10
20
30
40
50
60
70
80
User to Modem Ratio (X:1)
Blo
ckin
g P
roba
bilit
y (%
)
Impact of User to Modem Ratio on Blocking Probability
Fig. 5. Impact of user-to-modem ratio on blocking.
blocking probability of around 50 percent during the peak period. Many ISPs advertise such a ratioin the context of promoting a high degree of customer service. However, providing a service witha 50 percent blocking probability is arguably not “good”. Approximately half of the customers whoattempt to connect to the network during the peak period can expect to receive a busy signal. Whilethe authors do not claim that the tra;c parameters presented in this paper are identical to the tra;cparameters observed in other dialup networks, it is possible that there are distinct similarities. These

1972 D.C. Novak et al. / Computers & Operations Research 30 (2003) 1959–1976
0.25 1 2 3 4 5 6 7 8
0.0
5
10
15
20
25
30
35
40
45
50
Business Rule - Time Limit per session (Hours)
Blo
ckin
g P
roba
bilit
y (%
)
Impact of Business Rules on Blocking Probability
1100 Modems
1300 Modems1500 Modems
0.5
Fig. 6. Impact of hybrid solution on blocking.
results emphasize the need for appropriate metrics to deCne acceptable service objectives; ISPs couldthen advertise their level of compliance with these objectives.
7.3. Hybrid solution vs. blocking probability
To complete the research, the authors examined the potential impacts associated with combiningdi7erent business rules with various numbers of modems in the pool. The purpose of this analysiswas to provide some insight into how the impact of the business rules might change if capacitywas also changed, and to compare how e7ective the business rules might be under di7erent con-ditions. This can also be interpreted as a hybrid solution to the problem. Three di7erent scenarioswere examined for each of the 10 business-rule options described previously. Each of the scenar-ios employed a di7erent number of modems. The Crst scenario was the baseline scenario of 1100modems (approximately 9:1 user-to-modem ratio). Next, a scenario utilizing 1300 modems was ex-amined (approximately 8:1 user-to-modem ratio). Finally, a scenario of 1500 modems was examined(approximately 7:1 user-to-modem ratio). The results are presented in Fig. 6.
The blocking probability curve for each of the three scenarios follows the same trend observedearlier. As was the case in the baseline scenario (Fig. 3), the e7ect of the business rules on blockingprobability levels o7 when the maximum call limit is greater than 2 h regardless of the number ofmodems used. Upon examining the results, it can be observed that, except for the Crst two cases(0.25 and 0:5 h), where most sessions are truncated to some degree, the e7ects of the businessrules across the three scenarios follow the same pattern. Adding around 200 modems seemed toreduce the blocking probability by about 10 percent across all three scenarios. This does not implythat a 10 percent reduction in blocking probability can be assumed every time 200 modems areadded to the pool—simply that the trend was observed in this particular case using the given tra;c
D.C. Novak et al. / Computers & Operations Research 30 (2003) 1959–1976 1973
parameter assumptions. Further research needs to be conducted to determine the degree to whichthe e7ectiveness of adding modems is inNuenced by changes in the interarrival time and sessionlength.
8. Conclusions
Fully characterizing the performance of a modem pool in terms of level of service and blockingprobability may not be an easy task, due to uncertainties associated with modeling the arrival processand call duration. By building a simulation model of the modem pool, the performance of the pool canbe examined under di7erent conditions. These simulation results give some insight into how blockingprobability may be impacted by implementing various session limits and by adding modems to thepool. The simulation results indicate that current performance of the modem pool during the peakperiod is relatively poor in terms of blocking probability. During the busiest times of the day, theblocking probability is approximately 50 percent assuming a user-to-modem ratio of 10:1. However,the authors were not able to compare the peak-period blocking probabilities estimated in this paperwith other university-a;liated modem pools or private ISPs, because the data were not availableto do so. It is entirely possible that many providers experience a similar or even higher blockingprobability during peak-hour operation than the pool modeled in this paper.
The results described in this paper illustrate that implementing static session limits does notsigniCcantly reduce blocking probability unless the session limit is very short (an hour or less).Implementing such a business rule might not be popular with users and may result in lost customers.It is also possible that the e7ectiveness of implementing short session limits may be reduced if userswho are disconnected immediately call back to reestablish the connection. When more reasonablelimits of 2 h or more are enforced, the data show that there is no signiCcant reduction in the blockingprobability given the particular interarrival time and service time assumptions presented in thispaper.
On the other hand, the data show that a signiCcant decrease in the blocking probability could beobtained by adding additional capacity to the modem pool. Although this approach is more expensive,the research suggests that it would prove to be much more e7ective in reducing blocking probabilitythan implementing business rules. Based on past experience at CNS, indicating that there is somelevel of induced demand associated with adding capacity, it is unclear how adding modems to thepool will impact blocking probability in the long term. In the past, users have quickly changed theirbehavior when capacity is added to the pool and consequently the reductions in blocking probabilityhave been very short lived [3].
In more general terms, implementing business rules that limit the duration of a given sessionseems to have a very limited impact in reducing blocking probability for longer session limits. Thisresult is intuitive when an exponential service time distribution is considered. The e7ectiveness ofvarious session limits may change if di7erent distributional assumptions or parameter estimates areconsidered. The 2-h limitation discussed in this paper is very much a function of the particularservice time data utilized in this study. If the mean service time were larger, we might expect longerbusiness rules to be more e7ective in reducing the probability of blocking. Session limits may ormay not be more e7ective if the empirical service time distribution were modeled more accurately.It is important to note that since campus modem pools service a fairly homogenous population,
1974 D.C. Novak et al. / Computers & Operations Research 30 (2003) 1959–1976
ISPs may Cnd business rules much more or less e7ective in reducing the probability of blockingacross a heterogeneous population. The Crst step in conducting any sort of analysis is to accuratelycharacterize user behavior within the pool with respect to interarrival times and service times.
Based on the simulation results, there is no reason to associate a user-to-modem ratio of 10:1or greater with a high level of customer service. Although there is no standard deCnition of whatconstitutes “good” customer service, obtaining a 50 percent blocking probability, where half of thecustomers receive a busy signal whenever they attempt to connect to the network during peak periods,cannot be considered acceptable to most customers. Individual service providers must weigh thepossible trade-o7 between providing poorer quality service during peak hours of operation and havingunused capacity during o7-peak hours when considering capacity upgrades. Since the probability ofblocking increases as the mean interarrival time decreases, blocking will tend to be lower duringo7-peak hours when the arrival rate decreases. The decision of whether or not to add capacity andhow much to add is very much a function of the duration of the peak period, the currently level ofblocking, and characteristics of the particular customer base being serviced.
The authors recognize that there is considerable work that should be done to further studythis problem. Using actual data to drive the source module would give a more accurate modelrather than simply using a Markovian assumption. Also, more sophisticated business rules asdescribed in Section 1 could be investigated if so desired. Additional modiCcations to the model canbe included to model the EEB technique. Finally, it should be expected that the users’ behaviorsuch as call duration and the interarrival rate might change over time, as the university com-munity becomes even more active with the Internet. CNS implemented a 2-h static session limitduring the fall 1999 academic semester and continues to utilize this business rule in an e7ort toreduce congestion within the pool. Although they have experienced a reduction in the number ofcomplaints attributed to high blocking, there is not a measurable beneCt attributed to the implementa-tion of this business rule since capacity has also been increased. Furthermore, it is hypothesized thatVTMP tra;c parameters have changed since this analysis was Crst conducted. It is accurate to statethat the decision to implement the 2-h session limit is at least partially attributed to the Cndingspresented in this paper as well as on the Cndings discovered during the initial modem pool tra;ccharacterization.
Acknowledgements
Portions of this research were presented at the Symposium for Performance Evaluation of Com-puters and Telecommunications Systems (SPECTS) July 2000, Vancouver, BC, Canada. The authorswould like to thank Mr. Clark Gaylord and Mr. Ray Stell from the Communications Network Ser-vices of Virginia Tech for their contributions to the research.
References
[1] Goodman B. Internet telephony and modem delay. IEEE Network 1999; May=June: 8–16.[2] Rickard J. Busting the busy signals in dialup access. Mecklermedia Corporation, 1998, http://www.boardwatch.com/
isp/summer99/dialup.html.
D.C. Novak et al. / Computers & Operations Research 30 (2003) 1959–1976 1975
[3] Gaylord C. Senior network engineer. Communications Network Service, Virginia Polytechnic Institute and StateUniversity, Informal conversation, August, 1999.
[4] CselLenyi I, SzabLo R, SzabLo I, Latour-Henner A, BjUorkman N. Experimental platform for telecommunication resourcemanagement. Computer Communication 1998;21:1624–40.
[5] Chandra K, Eckberg AE. Tra;c characteristics of on-line services. Proceedings of the Second IEEE Symposium onComputers and Communications, July 1–3, 1997, Alexandra, Egypt, 1997.
[6] Law AM, Kelton DW. Simulation of communications networks. Proceedings of the 1994 Winter SimulationConference, December 11–14. Orlando, FL, USA, 1994.
[7] Iisaku S, Urano Y. Performance analysis of integrated communication system with heterogeneous tra;c. Teletra;cissues in an advanced information society ITC-11, vol. 5, Part 1. Amsterdam: Elsevier Science Publishers B.V.,North-Holland, 1985. p. 72–7.
[8] De Boer J. Blocking of overNow tra;c components. Teletra;c issues in an advanced information society ITC-11,vol. 5, Part 1. Amsterdam: Elsevier Science Publishers B.V., North-Holland, 1985. p. 175–81.
[9] Marshall WT, Morgan SP. Statistics of mixed data tra;c on a local area network. Teletra;c issues in an advancedinformation society ITC-11, vol. 5, Part 2. Amsterdam: Elsevier Science Publishers B.V., North-Holland, 1985.p. 569–75.
[10] Scavo GG, Miranda G. Tra;c o7ered grade of service and call completion ratio in a toll network versus subscriberretrial behavior. Teletra;c issues in an advanced information society ITC-11, vol. 5, Part 2. Amsterdam: ElsevierScience Publishers B.V., North-Holland, 1985. p. 689–95.
[11] Pawlita PF. Tra;c measurements in data networks: recent measurement results, and some implications. IEEETransactions on Communications 1981;29(4):525–35.
[12] Evers R. Measurement of subscriber reaction to unsuccessful call attempts: result of measurements in Two PABX’s.Proceedings of the Sixth Human Factors Symposium, Stockholm, Sweden, 1972.
[13] Fuchs E, Jackson PE. Estimates of distributions of random variables for certain computer communications models.Communications of the ACM 1970;13(12):752–7.
[14] Allen AO. Probability, statistics, and queueing theory with computer science applications, 2nd ed. New York:Academic Press, 1990. ISBN: 0-12-051051-0.
[15] Law AM, Kelton DW. Simulation modeling and analysis. New York: McGraw Hill, 1991.[16] Robertazzi TG. Computer networks and systems. Berlin: Springer, 1994.[17] Akimaru H, Kawashima K. Teletra;c: theory and applications, 2nd ed. Berlin: Springer, 1999. ISBN: 1-85233-162-3.[18] Gross D, Harris CM. Fundamentals of queueing theory, 2nd ed. New York: Wiley, 1985. ISBN: 0-471-89067-7.[19] Guerineau JP, Labetoulle J. End to end blocking in telephone networks: a new algorithm. Teletra;c issues in an
advanced information society ITC-11, vol. 5, Part 1. Amsterdam: Elsevier Science Publishers B.V., North-Holland,1985. p. 263–9.
[20] Moyan PJ. The decoupling of estimation and control in teletra;c problems. Computer networks and ISDN systems,vol. 20. Amsterdam: Elsevier Science Publishers B.V., North-Holland, 1990. p. 203–7.
[21] Pearce CEM. On non-renewal telephone tra;c and its peakedness. Teletra;c Issues in an advanced informationsociety ITC-11, vol. 5, Part 1. Amsterdam: Elsevier Science Publishers B.V., North-Holland, 1985. p. 168–74.
[22] Botta RF, Harris CM, Marchal WG. Characterizations of generalized hyperexponential distribution functions.Commun. Statist. Stochastic Models 1987;3(1):115–48.
[23] Everitt BS, Hand DJ. Finite mixture distributions. London: Chapman & Hall, 1981.[24] Jayade VD, Prasad MS. Estimation of parameters of mixed failure time distribution. Commun. Statist. Theory Meth.
1990;19(12):4667–78.[25] Karlis D, Xekalaki E. On testing for the number of components in a mixed Poisson model. Ann. Inst. Statist. Math.
1999;51(1):149–62.[26] Jewett J, Shrago J, Yomtov B. Designing optimal voice networks for businesses, government, and telephone
companies. Telephony Publishing Corp.
David C. Novak is an Assistant Professor in the department of Operations and Information Management at the Universityof Connecticut. Dr. Novak’s interests include broadband network tra;c characterization and performance and stochasticoptimization. He can be reached by email at [email protected].

1976 D.C. Novak et al. / Computers & Operations Research 30 (2003) 1959–1976
Daniel Rowland received the M.S. in computer engineering from Virginia Tech. His work concentrated on computernetworking and network application development. He currently works as a design engineer for Spirent Communications—Hekimian Division in Rockville, MD. He can be reached by email at [email protected].
Luiz A. DaSilva is an Assistant Professor at the Bradley Department of Electrical and Computer Engineering at Vir-ginia Tech. His interests include quality of service (QoS) issues, wireless networks, and performance characterization ofbroadband access networks. He can be reached by email at [email protected].