modeling color properties of tiled displays
TRANSCRIPT

Volume xx (200y), Number z, pp. 1–17
Modeling Color Properties of Tiled Displays
Aditi Majumder†, M. Gopi‡
Abstract
The concept of tiled displays can be successful only if such displays are made to look like a single displayperceptually. The two issues that need to be solved to achieve this goal are geometric correction andcolor seamlessness of images spanning across tiles. Geometric correction algorithms borrow pin-holecamera models to model projector display geometry. In this paper, we introduce an abstract modelingfunction that describes the color seen by a viewer when displayed by a display device.Though this function can be used to model color displayed by any common display device, in this paper,we use it to model color in multi-projector display systems. We use the model to explain the reasonsfor different types of color variations in a multi-projector display, to compare different color correctionalgorithms, and to derive such algorithms directly from the model.
Categories and Subject Descriptors (according to ACM CCS): I.3.3 [Computer Graphics]: Picture/ImageGeneration[display algorithms] I.4.0 [Image Processing and Computer Vision]: General[image displays]I.4.8 [Image Processing and Computer Vision]: Scene Analysis[color and photometry] H.1.2 [Modelsand Principles]: User/Machine Systems[human factors]
Keywords: Projection-Based Displays, Tiled Displays, Color Model
1. Introduction
Traditional 21-inch desktop monitors have resolutionof 60 pixels per inch and 20− 30 degree field-of-view.But life-size displays used in scientific visualization re-quire display area in the order of hundreds of squarefeet, high resolution of hundreds of pixels per inch,and wide field-of-view of more than 120 degrees. Suchlarge displays can be used in defense training applica-tions, in life-size teleconferencing, and also to createhigh quality immersive virtual reality (VR) environ-ments.
A scalable approach to build large displays is totile multiple projectors to create a single large dis-play. There are three primary issues that need to beaddressed in building multi-projector display systems.
(a) Data management, data distribution and drivingarchitecture: This deals with handling large 2D or
† Department of Computer Science, University of Califor-
nia, Irvine. Email: [email protected] .‡ Department of Computer Science, University of Califor-
nia, Irvine. Email: [email protected].
3D data content, distributing them to individualmachines that drive the projectors, and the config-uration of the connectivity of these machines.
(b) Geometric seamlessness: The image displayed on amulti-projector display comes from several differ-ent physical devices and hence may not be alignedgeometrically along the projector boundaries. Fur-ther, the image within the same projector may beradially distorted.
(c) Color seamlessness: Multi-projector displays canbe arranged in abutting or overlapping configura-tions. In both these cases, colors and/or bright-ness varies within and across multiple projectors.In the overlapping configuration, higher brightnessin the overlap regions are also introduced. Thus,even with the same input value at every pixel of amulti-projector display, the output colors are notthe same for all pixels.
Solutions to the data management and driv-ing architecture problems in multi-projector sys-tems ([70, 33, 8, 34, 32]) use existing parallel andstreaming data models ([55, 57, 58, 60, 56]). Solu-
submitted to COMPUTER GRAPHICS Forum (4/2005).
2 Aditi Majumder, M. Gopi / Modeling Color Properties of Tiled Displays
tions to correct the geometric misalignment prob-lem ([79, 67, 65, 64, 78, 31, 66, 14, 11, 68, 28]) usethe pin-hole camera model ([22]) to model individualprojectors. However, there exists no model that de-scribes the color variation in multi-projector displaysthat can be used to address the color seamlessnessproblem. Hence, the solutions presented for this prob-lem in [45, 72, 73, 77, 59, 47, 65, 10, 37, 46, 79] pro-vide only partial solutions under restricting assump-tions and with varying degrees of success.
Solutions for other issues related to multi-projectorsystems were borrowed from existing models for othersystems and devices. For the color variation problem,we cannot borrow models developed for other dis-play devices due to many reasons. For example, thereexist models for colorimetry of single CRT monitors[6, 5, 7]. But these models assume that for a given in-put, color remains spatially constant over the entiredisplay. This assumption is not valid for projectors.Unlike CRTs, the physical space of a projector is de-coupled from its display space. This introduces severalphysical phenomena like distance attenuation of light,lens magnification and non-Lambertian reflection ofthe display screen that cause severe spatial variation.For the same reason, projectors are different from LCDpanels also. Further, there exists no model that de-scribes color variations in multi-device displays witheither CRT or LCD panels. Hence, to fill this gap, weneed a color model for multi-projector displays.
A color model for multi-projector displays can beuseful in many ways. First, this can help us repre-sent the color variation in such displays in a compactmanner using just a few parameters. Second, it willprovide us with a tool to compare and evaluate dif-ferent algorithms to solve the color variation. Finally,we can use the modeling function to systematicallydevelop new methods that address the problem in anorganized manner.
1.1. Main Contributions
In this paper, we introduce a function that models thecolor variation in multi-projector displays comprehen-sively, compactly, and accurately. The color proper-ties of such displays have been studied thoroughly in[42, 49] to identify a small set of parameters that causecolor variation and the relationships between them.With these parameters, we develop a function to rep-resent the color property of the display compactly. Weverify this function by comparing the color responsepredicted by it with the actual response of the display,for an image projected on the display.
We also show that this modeling function is moregeneral and can be used to model other image display
or capturing devices. Next, we demonstrate the differ-ent uses of this modeling function in explaining thedifferent color variations in multi-projector displays.In addition to its use in modeling, this function alsoprovides us with a framework to compare differentcolor correction algorithms by formally defining thecommon goals that these algorithms try to achieve.
Further, we demonstrate that this model can beused to design color correction algorithms by directlyderiving one of the existing solutions from it. Finally,we use this model to provide a few insights into thecolor correction problem to help us design new algo-rithms in the future.
1.2. Outline of the paper
In Section 2 we develop the function that models thecolor variation in multi-projector displays. In Section3, we demonstrate the generality of the model byshowing that existing models for other display devicesis a special case of the proposed function. In Section 4,we explain the various color varations using differentparameters of the model. In Section 5, we present theseveral ways in which this model can be used for analy-sis of various color correction methods, reconstructionof the different model parameters, and in derivationof an existing algorithms from this model. Finally weconclude by mentioning a few insights we get from thiswork that would help us design future color correctionalgorithms.
2. Modeling Color Variation
In this section, we first present some basic definitionsand then derive the function modeling the color vari-ation is a multi-projector display.
2.1. Color Operators
We define a color K at a point on the display by the tu-ple (L,C) where L is the total tristumulus value (TTV)defined by the sum of CIE tristimulus values of thecolor, X + Y + Z, and C is the chrominance definedby the chromaticity coordinates (x, y):
x =X
X + Y + Z; y =
Y
X + Y + Z.
The TTV L is the indicator of power/intensity andchrominance C, the hue and saturation of the color.We use the notation L = ttv(K) and C = chr(K).Note that L is different from the luminance Y of theCIE tristimulus values of the color.
We introduce two operators for colors: the additionoperator and the intensity scaling operator. The addi-tion operator is used when light from multiple sourcessuperimpose in the overlap region.
submitted to COMPUTER GRAPHICS Forum (4/2005).

Aditi Majumder, M. Gopi / Modeling Color Properties of Tiled Displays 3
Addition Operator: The addition of two colors K1 =(L1, C1) and K2 = (L2, C2) is defined as
K = (L, C) = K1 ⊕K2,
where
L =
2∑i=1
Li,
C =
∑2i=1 LiCi
L.
So, by adding two colors, the TTV of all the constitut-ing colors add up, and the chrominance of the differentcolors are weighted by the TTV proportion of each ofthem (given by Li/L). Note that ⊕ is both commuta-tive and associative.
We make an important observation here. If K1 =(L1, C1), K2 = (L2, C2), and C1 = C2 then thechrominance C of K = K1 ⊕K2 is C = C1 = C2.
Intensity Scaling: The intensity scaling of a color K1 =(L1, C1) by a scalar k is defined as
K = (L, C) = k ⊗K1,
where
L = kL1,
C = C1.
Note that ⊗ does not change the chrominance of acolor and distributes over ⊕.
2.2. Definitions
A multi-projector display is a display made of N pro-jectors, projecting on a planar or non-planar displayscreen. Each projector is denoted by Pj , 1 ≤ j ≤ N .The coordinates of the 2D display screen (not nec-essarily planar) are denoted by (u, v) and individualprojector’s display region within this display screenis parameterized by (s, t). The geometry of the dis-play screen S, and the positions of the projectors(px, py, pz) and the viewer e = (ex, ey, ez) are de-scribed in a 3D world coordinate system.
The display and projector coordinate pairs can berelated by a geometric warp, G,
(u, v) = G(s, t, p), (1)
where p = (px, py, pz, θ, φ, f, S). The parameters f and(θ, φ) are the focal length and orientation of P respec-tively, expressed in the world coordinate space. For allpractical systems, p does not change because projec-tors and screen do not move relative to each other.Hence,
(u, v) = G(s, t). (2)
Figure 1: Projector and display coordinate space.
Figure 1 shows a two-projector display wall. Theblue and red quadrilaterals show the areas of projec-tion of projectors P1 and P2 on the display screen.
A projector has three channels, {r, g, b}. A channelis denoted by l ∈ {r, g, b} and the corresponding inputby il ∈ {ir, ig, ib}, 0.0 ≤ il ≤ 1.0.
The Bidirectional Reflectance Distribution Function(for the front projection display) or the BidirectionalTransfer Distribution Function (for the back projec-tion display) of the screen is dependent on the displaycoordinates (u, v) and the viewer location e, and is de-noted by Λ(u, v, e). We assume that the BRDF/BTDFis independent of chrominance.
2.3. The Model
In this section we introduce the function to model dis-play devices in general, and multi-projector displaysystem in particular.
Definition: The function E(u, v, i, e) that models thecolor characteristics of a display is defined as thecolor reaching the viewer e from the display coordi-nate (u, v) when the input to the device coordinates ofall the display devices that contributes directly to thecolor at the display coordinate (u, v) is i = (ir, ig, ib).
Note that more than one projector can contribute tothe display coordinate (u, v) in the overlap region. Fur-ther, the function is defined only for devices with three
submitted to COMPUTER GRAPHICS Forum (4/2005).
4 Aditi Majumder, M. Gopi / Modeling Color Properties of Tiled Displays
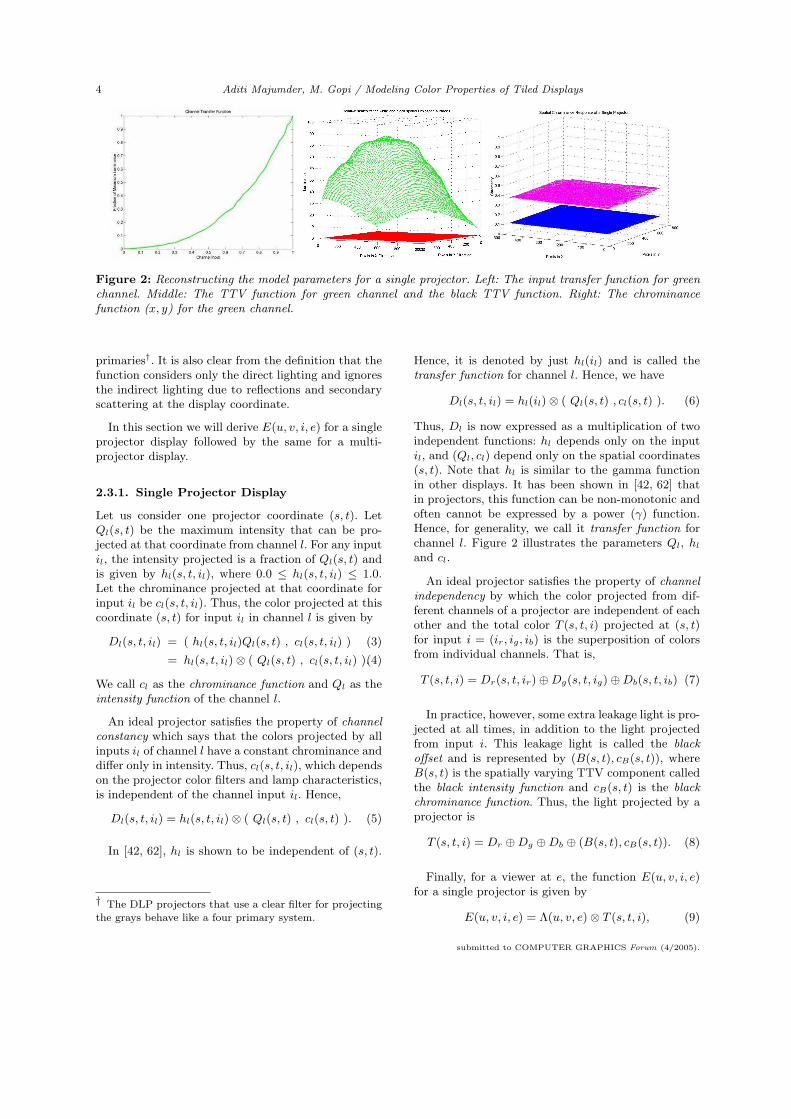
Figure 2: Reconstructing the model parameters for a single projector. Left: The input transfer function for greenchannel. Middle: The TTV function for green channel and the black TTV function. Right: The chrominancefunction (x, y) for the green channel.
primaries†. It is also clear from the definition that thefunction considers only the direct lighting and ignoresthe indirect lighting due to reflections and secondaryscattering at the display coordinate.
In this section we will derive E(u, v, i, e) for a singleprojector display followed by the same for a multi-projector display.
2.3.1. Single Projector Display
Let us consider one projector coordinate (s, t). LetQl(s, t) be the maximum intensity that can be pro-jected at that coordinate from channel l. For any inputil, the intensity projected is a fraction of Ql(s, t) andis given by hl(s, t, il), where 0.0 ≤ hl(s, t, il) ≤ 1.0.Let the chrominance projected at that coordinate forinput il be cl(s, t, il). Thus, the color projected at thiscoordinate (s, t) for input il in channel l is given by
Dl(s, t, il) = ( hl(s, t, il)Ql(s, t) , cl(s, t, il) ) (3)
= hl(s, t, il)⊗ ( Ql(s, t) , cl(s, t, il) ).(4)
We call cl as the chrominance function and Ql as theintensity function of the channel l.
An ideal projector satisfies the property of channelconstancy which says that the colors projected by allinputs il of channel l have a constant chrominance anddiffer only in intensity. Thus, cl(s, t, il), which dependson the projector color filters and lamp characteristics,is independent of the channel input il. Hence,
Dl(s, t, il) = hl(s, t, il)⊗ ( Ql(s, t) , cl(s, t) ). (5)
In [42, 62], hl is shown to be independent of (s, t).
† The DLP projectors that use a clear filter for projectingthe grays behave like a four primary system.
Hence, it is denoted by just hl(il) and is called thetransfer function for channel l. Hence, we have
Dl(s, t, il) = hl(il)⊗ ( Ql(s, t) , cl(s, t) ). (6)
Thus, Dl is now expressed as a multiplication of twoindependent functions: hl depends only on the inputil, and (Ql, cl) depend only on the spatial coordinates(s, t). Note that hl is similar to the gamma functionin other displays. It has been shown in [42, 62] thatin projectors, this function can be non-monotonic andoften cannot be expressed by a power (γ) function.Hence, for generality, we call it transfer function forchannel l. Figure 2 illustrates the parameters Ql, hl
and cl.
An ideal projector satisfies the property of channelindependency by which the color projected from dif-ferent channels of a projector are independent of eachother and the total color T (s, t, i) projected at (s, t)for input i = (ir, ig, ib) is the superposition of colorsfrom individual channels. That is,
T (s, t, i) = Dr(s, t, ir)⊕Dg(s, t, ig)⊕Db(s, t, ib) (7)
In practice, however, some extra leakage light is pro-jected at all times, in addition to the light projectedfrom input i. This leakage light is called the blackoffset and is represented by (B(s, t), cB(s, t)), whereB(s, t) is the spatially varying TTV component calledthe black intensity function and cB(s, t) is the blackchrominance function. Thus, the light projected by aprojector is
T (s, t, i) = Dr ⊕Dg ⊕Db ⊕ (B(s, t), cB(s, t)). (8)
Finally, for a viewer at e, the function E(u, v, i, e)for a single projector is given by
E(u, v, i, e) = Λ(u, v, e)⊗ T (s, t, i), (9)
submitted to COMPUTER GRAPHICS Forum (4/2005).

Aditi Majumder, M. Gopi / Modeling Color Properties of Tiled Displays 5
Figure 3: This shows the the function E at input (1, 1, 0) for an tiled display made of 2×2 array of four-projectors.The ttv(E), (left) and y component of chrominance, chr(E) (right) is reconstructed from a camera image. Thedetails of the reconstruction process is presented in Section 5.3.
where (u, v) = G(s, t).‡
2.3.2. Multi-projector Display
Using the function derived for a single projector dis-play, we now derive the function for a multi-projectordisplay. Let NP denote the set of projectors overlap-ping at (u, v). The function E(u, v, i, e) for a tiled dis-play is then given by the superposition of colors pro-jected for the same input i from all the projectorsoverlapping at the display coordinate (u, v).
E(u, v, i, e) = ⊕j∈NP Ej(u, v, i, e). (10)
For Lambertian screen, Equation 9 and hence 10become independent of e, and E is reduced to
E(u, v, i) = ⊕j∈NP Tj(sj , tj , i). (11)
Figure 3 shows the E for a four projector display forinput (1, 1, 0).
3. Modeling Other Devices
The function E, though designed for multi-projectordisplays, can be used to model any image-display de-vice (single or tiled) or any image-capture sensor (sin-gle). The parameters of the function, hl,Ql,cl, can bedifferent for different devices. In this section we showthat the existing models of different color devices area special case of our general model.
‡ When p used in Equation 1 is not assumed to be static,G, Ql, B, cl and cB are dependent on p also.
3.1. Non-Linear Device
Let us first consider single non-projection displays likeCRT monitors that do not involve screens. Existingmodels of such displays [6, 5, 7] make the followingassumptions.
1. There is no black offset, i.e. B(s, t) = 0.2. There is no spatial variation of intensity or chromi-
nance, i.e. Ql(s, t) and cl(s, t) are spatially con-stant. Let these constant values which are indepen-dent of (s, t) be Ml and Cl respectively.
3. hl(il) can be expressed by a power function, i.ehl(il) = (A il)
γ , where A and γ are constants.
When using our model for such displays, since weare dealing with a single display, we use Equation8. When the above assumptions are imposed on ourmodel, we find that the color generated for inputi = (ir, ig, ib) by a CRT monitor is
E(i) = ⊕l∈r,g,b ((A il)γl ⊗ (Ml, Cl)) (12)
= ⊕l∈r,g,b((A il)γlMl, Cl) (13)
This model of the CRT monitor arrived at from Ematches with the model presented in [6, 5, 7] and isachieved by substituting device-specific functions andassumptions for the parameters to our model.
3.2. Linear Device
Another popular model that has been used exten-sively in color matching and color profiling applica-tions for modeling various devices, like cameras, scan-ners, printers and monitors, assume linear devices (i.e.hl(il) = il) and hence use a matrix that relates the
submitted to COMPUTER GRAPHICS Forum (4/2005).

6 Aditi Majumder, M. Gopi / Modeling Color Properties of Tiled Displays
RGB space of a device with the standard CIE XYZspace [23, 24, 74]. Further, such models assume spatialconstancy in color properties and hence only one ma-trix is used to characterize the device. Thus, the XYZresponse of a color generated by input i = (ir, ig, ib)is given by Xi
Yi
Zi
=
Xr Xg Xb
Yr Yg Yb
Zr Zg Zb
irigib
(14)
where (Xl, Yl, Zl) denotes the CIE XYZ response ofthe maximum intensity input of channel l. Hence, Land C for input i is given by
(Li, Ci) =
(Xi + Yi + Zi,
(Xi
Li,Yi
Li
))(15)
Now, we predict the color of the input i for such lin-ear devices using our model. We use Equation 7 sinceblack offset is non-existent for such devices. Replacingh(il) = il to account for linearity, the color predictedby our model for input i is given by
(Li, Ci) =
(∑l
ilQl,
∑l ilQlcl∑l ilQl
)(16)
Ql and cl, being the TTV and chrominance of themaximum intensity color for channel l defined by(Xl, Yl, Zl), are given by
Ql = Xl + Yl + Zl; cl =
(Xl
Ql,
Yl
Ql
)(17)
Replacing Equation 17 in Equation 16 which predictsthe color of input i from our model gives us Equation15 which predicts the color from the color transforma-tion matrix.
This shows that our general model can accommo-date existing models, which becomes a special case ofour model. In essence, our model should be thought ofas an abstract color model for imaging devices whoseparameters should be evaluated using device-specificmethods.
4. Deriving Color Variation Properties
Our model defines the color seen by a viewer froma display coordinate for a particular input. However,this color varies across the display. In this section, weshow that this model can be used to explain all thesecolor variations and artifacts that are visible on thedisplay in practice.
In [49, 42] the color variation in multi-projector dis-plays is classified in three different categories: theintra-projector variation (variation within a single pro-jector), the inter-projector variation (variation across
different projectors), and the overlap variation (vari-ation in the overlap region). Here we explain thesedifferent kinds of variations using our model.
4.1. Intra-projector Variation
The intra-projector variation defines the color varia-tion within a single projector. [49, 42] show that thespatial variation in intensity within a single projector(commonly referred to as the hot-spot effect) is muchmore significant than the spatial variation in chromi-nance. However, some regions within a single projectorcan have chrominance variations in the form of visiblecolor blotches, as shown in Figure 4.
The intra-projector intensity variation is modeledby the spatially varying intensity function, Ql, for eachchannel l, as illustrated in Figure 2.
The intra-projector chrominance variation (thecolor blotches in Figure 4) are due to following reasons.The first obvious reason is the small spatial variationsin the chrominance function, cl, as shown in Figure2. However, sometimes these color blotches are visibleeven if there is no spatial variation of the chrominancefunction. We found that this is due to difference inthe shape of the channel intensity functions Ql acrossdifferent channels (Figure 3). (Note that the absolutevalues of the intensity functions, Qr, Qg and Qb, canbe different from each other, and this will not lead tochrominance variation.) This can be proved as follows.
Let the maximum intensity for each channel of aprojector be defined by Ml as
Ml = max∀s,t
(Ql(s, t)). (18)
Note that the parameter Ml is a constant and is notdependent on the spatial coordinates or input val-ues. Hence, the normalized intensity function for eachchannel, Q̄l, is such that
Ql(s, t) = MlQ̄l(s, t).
Clearly, Q̄l has the same shape of Ql. From the def-inition of color operators in Section 2.1, the chromi-nance ci for an input i = (ir, ig, ib), can be derivedfrom Equation 7 as,
ci(s, t) =
∑l∈{r,g,b} clMlQ̄l(s, t)hl(il)∑l∈{r,g,b} MlQ̄l(s, t)hl(il)
. (19)
Note that, even if cl is assumed to be spatially con-stant, ci can vary spatially due to the variation in Q̄l.But, if Q̄l is same for all the three channels, not nec-essarily spatially constant, then the above equationreduces to,
ci =
∑l∈{r,g,b} clMlhl(il)∑l∈{r,g,b} Mlhl(il)
. (20)
submitted to COMPUTER GRAPHICS Forum (4/2005).

Aditi Majumder, M. Gopi / Modeling Color Properties of Tiled Displays 7
Figure 4: Left: Color blotches on a single projector. Right: Corresponding percentage deviation in the shape of theblue and green channel intensity functions. Empirically, the maximum deviation in Q̄l across different channelswas 20% and the visible color blotches corresponded with the regions of large deviation.
This equation is independent of spatial coordinatesand hence ci is a spatially constant function. This il-lustrates that the difference in shape of the intensityfunctions across different channels also contributes tointra-projector chrominance variations.
We verified the above result derived from our model,in projectors that had spatially constant channelchrominance but different Q̄l across different channels(Figure 4).
4.2. Inter-projector Variation
Difference in the intra-projector color variations acrossdifferent projectors is called the inter-projector colorvariation. Let us analyze the possible reasons for suchvariations.
The inter-projector intensity variation is due to twofactors: the input transfer function hl that is not samefor all projectors; and the intensity function Ql thatis different for different projectors.
The inter-projector chrominance variation is due todifferences in cl (Equation 20) across different projec-tors. If two projectors differ in any of the parameterson the right hand side of the Equation 20, namely cl,Ml and hl, we will have inter-projector chrominancevariation. It may seem from this equation that if cl
and hl are identical, variation in absolute values of Ml
cause the chrominance variation. However, note thatsince Equation 20 is a rational polynomial, even withvariation in absolute values of Ml, the chrominance
will not vary if there is no variation in the normal-ized values of Ml across different projectors. To showthis, we divide the numerator and the denominator ofEquation 20 by
∑l∈{r,g,b} Ml and normalize the values
of Ml to
M̄l =Ml∑
l∈{r,g,b} Ml.
Note that these M̄ls describe the proportions of red,green and blue primaries used to generate colors indifferent projectors.
4.3. Overlap Region Variation
The overlap region variation defines the color differ-ence between the overlap and non-overlap regions. Thecolor in the overlap region is the superposition of thecolor from the individual projectors and is explicitlymodeled by the addition operator in Equation 10. Thecardinality of NP (|NP |) being different at every dis-play coordinate causes this variation.
All the different kinds of color variations discussedin this section and the parameters causing them aresummarized in Table 2. In addition, a quick referenceto all parameters and their descriptions are also pro-vided in Table 1.
5. Using the Model for Color Correction
We define a three step framework to design a colorcorrection method.
submitted to COMPUTER GRAPHICS Forum (4/2005).

8 Aditi Majumder, M. Gopi / Modeling Color Properties of Tiled Displays
Notation Parameter Description
l l ∈ {r, g, b} and denotes the red, green and blue channels.il Input for channel l.hl Spatially constant input transfer function of channel l, function of il.cl Spatially varying chrominance of channel l, function of (s, t).B Spatially varying black offset, function of (s, t).Ql Spatially varying maximum intensity function of channel l, function of (s, t).Ml max∀(s,t) Ql(s, t).
Q̄l Spatially varying normalized maximum intensity function of channel l, i.e. Ql(s,t)Ml
.
M̄l Ml normalized over all the three channels, i.e. Ml∑l∈{r,g,b} Ml
.
Np Number of projectors overlapping at any pixel, function of (u, v).
Table 1: Legend of the notations and their descriptions of the model parameters.
Type of Variation TTV/Chrominance Parameters Responsible
Intra Projector TTV 1) Spatial Variation in Ql
Chrominance 1) Spatial variation in cl
2) Difference in shapes of Q̄l across different channels
Inter Projector TTV 1) Difference in hl across projectors2) Difference in Ql across projectors
Chrominance 1) Difference in cl across projectors2) Difference in M̄l across projectors
Overlap TTV and 1) Difference in |Np| at different spatial locations.Chrominance
Table 2: Summary of the parameters responsible for different kinds of color variation in a multi-projector display.
1. Reconstruction: Our model defines the color thatis actually seen by a viewer from the display. So,the first step of any color correction algorithmshould be to reconstruct the function, E(u, v, i),accurately. The accuracy and speed of the recon-struction depend on the sensors being used.
2. Defining the Desired Function: The reconstructedfunction shows perceivable color variation. Hence,the next step is to define the desired response of thedisplay that the algorithm wants to achieve. We callthis response as the desired function, E′(u, v, i). E′
can be formally defined by a set of conditions itshould satisfy, called the goals of the color correc-tion method.
3. Modification: Finally, a method should be devisedthat takes these goals as input and modifies a fewparameters of E to generate the desired E′. Theinteractivity and the performance of the correctiondepend on the parameters that are chosen to bemodified to achieve E′.
In this section, we analyze different existing colorcorrection methods for multi-projector displays usingthe above framework. Finally, we demonstrate that asuccessful color correction algorithm can be designedand derived directly from our model by deriving anexisting method [49, 47] from our model.
5.1. Common Goals
Several methods have been proposed to correct thecolor variation problem. We define a few common goalsthese algorithms implicitly or explicitly try to achieve.
Strict Color Uniformity: The goal here is to make theresponse of two different projectors look alike. The de-sired function, E′, satisfies the property of strict coloruniformity if the color (intensity and chrominance) ofthe light reaching the viewer from any two displaycoordinates, for the same input is the same. Hence,∀i, (u1, v1), (u2, v2),
|E′(u1, v1, i)− E′(u2, v2, i)| = 0. (21)
submitted to COMPUTER GRAPHICS Forum (4/2005).

Aditi Majumder, M. Gopi / Modeling Color Properties of Tiled Displays 9
From Table 2, we note that the goal of strict color uni-formity makes the parameters cl, Ql and hl identicalat every display coordinate.
Strict Photometric Uniformity: The goal here is toachieve identical intensity at every display pixel. Inother words, E′ satisfies the property of strict photo-metric uniformity if the intensity of light reaching theviewer from any two display coordinates for the sameinput is the same. That is ttv(E′) is spatially constant.Hence, ∀i, (u1, v1), (u2, v2),
|ttv(E′(u1, v1, i))− ttv(E′(u2, v2, i))| = 0 (22)
From Table 2, we note that the goal of strict photomet-ric uniformity ignores the inter- and intra-projectorchrominance variation and makes Ql and hl identicalat every display coordinate.
Perceptual Color Uniformity: The goal here is toachieve a color variation that is imperceptible to thehuman eye. In other words, E′ satisfies the propertyof perceptual color uniformity if the color (intensityand chrominance) of light reaching the viewer fromany two display coordinates is within a threshold δ.Hence, ∀i, (u1, v1), (u2, v2),
|E′(u1, v1, i)− E′(u2, v2, i)| ≤ δ (23)
From Table 2, we note that the goal of perceptual coloruniformity makes the spatial variations in cl and Ql
imperceptible in order to remove the intra-projectorvariation. Since hl does not vary spatially within asingle projector [49] it can be ignored for this pur-pose. However, the variation in all three parameters,cl, Ql and hl, across different projectors must be im-perceptible to address the inter-projector variation.
Perceptual Photometric Uniformity: The goal here isto achieve an intensity variation that is impercepti-ble to the human eye, without addressing the chromi-nance. In other words, E′ satisfies the property of per-ceptual photometric uniformity if the intensity of lightreaching the viewer from any two display coordinatesis within a threshold δ. Hence, ∀i, (u1, v1), (u2, v2),
|ttv(E′(u1, v1, i))− ttv(E′(u2, v2, i))| ≤ δ (24)
From Table 2, we note that the goal of perceptual pho-tometric uniformity makes the spatial variations in Ql
imperceptible in order to remove the intra-projectorintensity variation. Also, as in the case of perceptualcolor uniformity, hl can be ignored, but the variationin the parameters, Ql and hl, across different pro-jectors must be imperceptible to address the inter-projector variation.
5.2. Explaining and Comparing Algorithms
In this section, we present an analysis of all the ex-isting methods using the framework provided by ourmodel.
5.2.1. Manual Manipulation of Controls
The most common method to correct the color varia-tion in multi-projector displays is to manually changethe projector control settings (like contrast, intensity,and white balance) and lessen the inter-projector mis-match. This method assumes that there is no intra-projector variation and overlap region.
This method does not make any effort to recon-struct the function E(u, v, i). The goal of this methodis to generate an E′ that satisfies the constraints ofperceptual color uniformity. In the modification step,changes in projector controls introduce changes in pro-jector parameters hl and Ml [49]. Since these projectorparameters are not the only reasons for color variation(Section 4), especially across the spatial domain, thedesired color correction is not successfully achieved.
5.2.2. Gamut Matching
The colors that a device can reproduce is repre-sented by a three dimensional volume (one dimen-sion for intensity and two dimensions for chrominance)called the color gamut. Gamut matching methods([72, 73, 77]) try to address only the inter-projectorvariation. They assume that the intra-projector vari-ation is negligible and there is no overlap region. Thecorrection is achieved in three steps.
1. An accurate light measuring sensor, like a photome-ter, is used to find the precise color gamut of eachprojector at one spatial location. This is equivalentto reconstructing the function E, but only at veryfew display coordinates (u, v), usually at the centerof each projector. The parameters cl, Ql and hl areestimated only at those sampled spatial locations.
2. Since the color gamuts are different for differentprojectors, there are colors that can be produced byone projector and not by another. Hence, a commoncolor gamut, defined by the intersection of the 3Dcolor gamuts of all the projectors, is found. This isthe gamut that can be reproduced by all projectors.Thus, the goal is to achieve a strict color uniformityby making the Ql and cl same for all projectors,but only at the display coordinates where E wassampled.
3. Finally, in the modification step, a linear transfor-mation is derived for each projector that maps thecolors from the original gamut to this common colorgamut. This linear transformation is applied to theinput i to achieve the correction.
submitted to COMPUTER GRAPHICS Forum (4/2005).

10 Aditi Majumder, M. Gopi / Modeling Color Properties of Tiled Displays
In Table 2, we found that Ql is responsible for intra-projector variation. Since Ql is not sampled accuratelyin the spatial domain, the goal of strict color unifor-mity cannot be achieved successfully by this method.
Further, the algorithm to find a common colorgamut for n projectors is a computational geometryproblem of complexity O(n6) [4], which makes thismethod unscalable for displays made of large numberof projectors. So, heuristics are often used to matchthe color gamuts which cannot guarantee an optimalsolution. To avoid this, another method [45] makes theassumption that chrominance across a display madeof same model projectors does not vary significantly.Thus, this method tries to match just the intensity re-sponse of the different projectors instead of the colorgamuts. The problem of identifying the common in-tensity response is simpler than identifying the com-mon gamut response. Formally, it tries to achieve strictphotometric uniformity, but only at the display coor-dinates where E was sampled.
5.2.3. Using the Same Bulb for All Projectors
Some other methods [59] explore a novel engineeringoption of using the same bulb for all projectors. Thismethod does not reconstruct E. The goal is strict coloruniformity, under the assumption that the bulb is thesole cause of all variations and hence having a commonbulb would achieve this goal. The modification of usinga common bulb, in effect, makes the parameters Ml
and cl identical for all projectors. However, since Ql isnot changed, the color uniformity cannot be achievedsuccessfully. Further, this method assumes that thereis no overlap region.
5.2.4. Blending
Blending, or feathering techniques, attempt to blendthe higher intensity in the overlap regions by weigh-ing the contribution from each pixel of each projectorin the overlap region by a spatially dependent factor.Thus, blending methods address only the overlap re-gion color variation assuming negligible intra and interprojector variation.
This method again does not reconstuct E. Eachoverlap region defines a zone of transition from oneprojector to another, and this method aims at makingthis transition perceptually smooth. Thus, the formalgoal is to generate perceptual color uniformity, butonly in the overlap region. However, since E is notestimated accurately, blending leads to softening ofthe seams due to overlaps, rather than removing themcompletely.
Blending can be achieved in three different ways– software, aperture mask, and optical mask. When
done in software [65], the blending function can becarefully designed to be a linear or cosine ramp. Thesecond method uses physical masks [37] on the opticalpath near the projector’s aperture boundaries. Thethird method modifies the optical and analog signalsto the projectors [10] near the boundaries to create avirtual mask for blending. Figure 5 shows some results.
In the modification step of software blending, theinput i is changed to i′ to achieve the desired response.i is modified to i′ such that
i′ = αj(u, v, sj , tj)× i,
where αj is a function of the relative positions of pro-jector and display coordinates such that
∑nj=1 αj =
1.0 and 0.0 ≤ αj ≤ 1.0. So, E′ is given by
E′(u, v, i) = ⊕j∈NP Tj(sj , tj , αj × i). (25)
In the modification step of aperture or optical maskblending, the correction is achieved by changing thefunction Tj at (u, v) itself and is given by
E′(u, v, i) = ⊕j∈NP αj × Tj(sj , tj , i). (26)
Ideally, αj ≤ 1.0 and∑n
j=1 αj = 1.0, though this can-not be guaranteed in aperture or optical blending dueto imprecise control of light.
5.2.5. Intensity Manipulation
A few recent methods [47, 49, 50, 44] tries to manipu-late the spatial intensity response of every pixel of thedisplay. These methods addresses the inter, intra, andoverlap intensity (not chrominance) variations by firstreconstructing the intensity of E in a rigorous mannerusing a digital camera.
The intensity matching method [47, 49] tries tomatch the intensity response of every pixel of the dis-play. Formally, the goal of this method is strict photo-metric uniformity. To achieve the desired function, aconstant maximum per channel intensity is assigned atevery display coordinate. This desired E′ is achievedin the modification step by manipulating the input iat every pixel (s, t) of every projector using a per-pixelattenuation factor. However, since the intensity at ev-ery pixel is matched to the pixel with the most limiteddynamic range, a shortcoming of this method is severecompression in the dynamic range of the display, as il-lustrated in Figure 6.
To overcome this shortcoming, the intensity smooth-ing method [50, 44] smooths the spatial intensity re-sponse in a manner so that it is imperceptible to thehuman eye. The desired E′ is seamless and also main-tains a high average dynamic range. This desired E′ isachieved by solving an optimization problem using dy-namic programming techniques. Thus, formally, this
submitted to COMPUTER GRAPHICS Forum (4/2005).

Aditi Majumder, M. Gopi / Modeling Color Properties of Tiled Displays 11
Figure 5: Fifteen projector tiled display at Argonne National Laboratory: before blending (left), after softwareblending (middle), and after optical blending using physical mask (right).
Figure 6: Digital photograph of a 5 × 3 array of 15 projectors. Left: Before correction. Middle: After intensitymatching. Right: After intensity smoothing.
method aims for perceptual photometric uniformity,instead of a strict photometric uniformity. The modi-fication step is still achieved by manipulating the inputi at every pixel by an attenuation factor. The resultsof these methods are shown in Figure 6.
5.3. Deriving Algorithms from the Model
A convincing way to assure the effectiveness of themodel lies in the success achieved by algorithms thatare derived from this model In this section, we showhow existing color correction methods, like the inten-sity matching methods [49, 47], can be derived fromour model. This demonstrates that our model can beused directly to design solutions for correcting thecolor variation problem.
However, to use our model to design methods ofcolor correction, we need to reconstruct the vari-ous model parameters. Reconstruction of the colorvariation of a multi-projector display requires recon-structing the color projected by individual projectorsT (s, t, i) (Equation 8). Reconstructing T for each pro-jector involves reconstructing the transfer (hl), the in-tensity (Ql), and the chrominance(cl) function for ev-ery channel and the black intensity (B) and chromi-nance (cB).
The parameter hl is spatially constant and a pho-tometer can be used to measure this parameter at thecenter of every projector. To reconstruct the spatiallyvarying components like Ql, cl, B and cB , one can usea digital camera. The required geometric correspon-dences between projector, display, and camera coordi-nates are available from any standard geometric cali-
bration method ([65, 64, 11, 31]). Readers are referredto [49, 48] for a more detailed discussion of this recon-struction process.
For a Lambertian screen, the parameters thus re-constructed are view-independent since Λ(u, v, e) =1 for all view points. For non-Lambertian screens,the channel and black chrominance, cl and cB re-spectively, being independent of the BRDF/BTDFand hl being a normalized function, can still bereconstructed using the above method. However,Ql and B are view dependent and are givenby Λ(s, t, e)Ql(s, t) and Λ(s, t, e)B(s, t) respectively(Equation 9). In such cases, BRTF/BTDF informa-tion can be generated using different existing meth-ods [2, 54, 13, 53, 17, 16, 26, 39, 80]. This informa-tion along with the geometric calibration informationproviding the position and orientation of the cam-era with respect to the screen [31] should be usedto take into account the effect of the view dependentBRDF/BTDF to generate the view-independent Ql
and B.
Figure 2 shows the different reconstructed parame-ters of the model for a single projector. Figure 3 showsthe reconstructed function for a 2×2 array of four pro-jectors when the input (1, 1, 0) is projected at everydisplay coordinate as seen from a single fixed posi-tion..
To verify the validity of this model, we compare tworesponses: the first is called the actual response andis the response of a ‘real’ camera capturing a multi-projector display when it projects a particular inputimage I. The second is called the ‘predicted response’,
submitted to COMPUTER GRAPHICS Forum (4/2005).

12 Aditi Majumder, M. Gopi / Modeling Color Properties of Tiled Displays
Figure 7: A 2× 2 array of four projectors. Left Column: Predicted response generated using our color variationmodel. Right Column: Actual response generated from a digital photograph.
where the projected image for the input image I is pre-dicted using the parameters of the multi-projector dis-play reconstructed using the methods given above. Fi-nally, the response of a ‘hypothetical camera that cap-tures this predicted image is generated. This is calledthe predicted response. If the ‘hypothetical’ camera isdesigned to have similar color properties as the ‘real’camera, then the actual and the predicted responsewill be similar.
We note here that the framework of the same func-tion, E, can be used to model an image capturingdevice, a camera, also and we use it to design our‘hypothetical’ camera. However, to make this camerasimilar to the ‘real’ camera, we make some simplifyingassumptions like spatially invariant channel intensity,chrominance and the transfer functions and no blackoffset. These lead to the difference between the actualand predicted responses in the results shown in Figure7. Nevertheless, the similarity between the responsesis the important feature to be noted. For example,the bottom left projector has more radial fall-off thanother projectors and this can be noticed in both theactual and predicted responses.
Now that we know how to reconstruct the differ-ent model parameters, next we show the derivation ofthe intensity matching algorithm from our model. Theintensity matching algorithm [47] makes four assump-tions that simplify Equation 10 as follows.
1. The screen is Lambertian.So, we can use Equation 11 instead of Equation 10.
2. The channel chrominance function is spatially con-stant and identical for all projectors.With this assumption, the chrominance part ofEquation 11 can be ignored and only the intensitygiven by ttv(E(u, v, i) is considered.
3. There is no black offset.This means that B(s, t) = 0.
4. The intensity response for each channel of each pro-jector is linear and monotonic.This means hl for all channels of every projectoris linear and monotonic. This, along with the factthat there is no black offset, indicates the h(l) isidentity function, i.e. hl(il) = il and hence samefor all projectors.
Using all the above assumptions, ttv(E(u, v, i) is de-
submitted to COMPUTER GRAPHICS Forum (4/2005).

Aditi Majumder, M. Gopi / Modeling Color Properties of Tiled Displays 13
Figure 8: The display intensity response surface 2 × 2 array of four projectors. Left: Before correction. Middle:After intensity matching. Right: After intensity smoothing.
rived from Equation 10 as
ttv(E(u, v, i)) =∑
l∈{r,g,b}
il∑
j∈NP
Qlj (sj , tj)
(27)
=∑
l∈{r,g,b}
(il Qdl(u, v)) (28)
where Qdl(u, v) =∑
j∈NPQlj (sj , tj) is the spatial
sum of intensity functions from all projectors for achannel and is called the display intensity surface in[49].
The algorithm consists of two steps: calibrationstep and the correction step. In the offline calibra-tion step, the display intensity surface is captured us-ing a digital camera. Since the goal of this methodis to achieve strict photometric uniformity, the de-sired function, E′ should have constant display in-tensity surface. This constant value is given by themin∀(u,v) Qdl(u, v). Thus, the intensity of the desiredfunction can be derived from Equation 28 as,
ttv(E′(u, v, i)) =∑
l∈{r,g,b}
(il
(min∀(u,v)
Qdl(u, v)
))(29)
Note that the intensity smoothing method achieves asmooth display intensity surface instead of a constantdisplay intensity surface by solving an optimizationproblem. The difference between the desired displayintensity surface for these methods are illustrated inFigure 8.
The online image correction step achieves the abovedesired function by modifying the input i to i′ as fol-lows:
i′l(u, v) = il(u, v)×min∀(u,v) Qdl(u, v)
Qdl(u, v)(30)
Projectors can realize only the original function(Equation 28). Since we have changed the input, wehave to substitute the value of new input given by
Equation 30 in Equation 28 to find the actual re-sponse. We can see that it is same as the desired func-tion given by Equation 29.
The scale factors to modify the given input in Equa-tion 30 define the per-pixel attenuation map in [49].To achieve an hl that is an identity function, a colorlook-up-table is used to linearize the response of everyprojector. Thus, the intensity correction is achieved.
Note that, this method would work for non-Lambertian screen with no modification. When con-sidering a non-Lambertian screen, the RHS of Equa-tion 28 and 29 will be scaled by the BRDF/BTDFΛ(u, v, e). And since the attenuation map is gener-ated by dividing the RHS of these two equations, theBRDF/BTDF would cancel out generating the samecorrect attenuation map. However, this attenuationmap will be view-dependent. Note that such insightsare realized with the aid of our model.
This is just an instance of how a method can bederived from our model of color variation in multi-projector displays. We believe that better algorithmscan be designed that can produce high quality colorcorrection, using our model and the insights presentedin the following Section 6.
6. Conclusion
Our model involves a five dimensional function (twodimensions for space and three for color). Thus,matching color gamuts at every display coordinate canbe practically impossible. This is the reason we haveonly seen algorithms that deal with three of the five di-mensions. Methods in Sections 5.2.1, 5.2.2 and 5.2.3,match the three dimensional color ignoring the spa-tial variation. On the other hand, methods in Sections5.2.4 and 5.2.5 address intensity and two spatial di-mensions, ignoring chrominance. However, we notedin Section 4 that a significant amount of the chromi-nance variation problem can be addressed by making
submitted to COMPUTER GRAPHICS Forum (4/2005).
14 Aditi Majumder, M. Gopi / Modeling Color Properties of Tiled Displays
the shape of the intensity functions similar across dif-ferent channels. This insight may help us to addressconsiderable part of the chrominance variation prob-lem, by staying within the three-dimensional domainand ignoring chrominance.
It is difficult to precisely and automatically controlparameters like cl, Ql, hl and Ml outside the projec-tor manufacturing pipeline. Hence solutions which tryto manipulate these parameters are not precise andare not scalable. On the other hand, methods thatchange the input i, are precise and scalable. Furthersuch methods have the potential to be implementedusing commodity graphics hardware and can be usedfor interactive rendering.
In conclusion, the color model presented in this pa-per provides a tool to study the color variation prob-lem in multi projector displays. Further, this functioncan be used directly to design sophisticated algorithmsthat would yield truly seamless high quality displays.It is general and hence need not be restricted onlyto projectors. In fact, this can be used to model otherdisplay devices like CRTs, LCD panels, and image sen-sors like camera. In essence, this function provides anabstract framework to model all color properties ofan image display/capture device. We believe that thismodel will be immensely useful in characterizing anddesigning color correction algorithms for small or largearea displays.
Acknowledgements
We thank Kodak for providing us with high resolutiontest images. This work was supported in part by theU.S. Department of Energy under Contract W-31-109-ENG-38.
References
[1] Mercury: Realtime anti-aliasing 3d graph-ics sub-system. Technical report,
http://www.quantum3D.com/products%20pages/mercury.html,
[cited 2000].
[2] M. Ashikhmin, S. Premoze, and P. Shirley. A
microfacet-based brdf generator. Proceedings of SIG-
GRAPH, pages 65–74, 2000.
[3] Rui Bastos. Superposition Rendering : Increased Re-
alism for Interactive Walkthroughs. PhD thesis, Uni-
versity of North Carolina at Chapel Hill, Departmentof Computer Science, 1999.
[4] M. Bern and D. Eppstein. Optimized color gamuts for
tiled displays. ACM Computing Research Repository,cs.CG/0212007, 19th ACM Symposium on Computa-
tional Geometry, 2003.
[5] R.S. Berns, M.E. Gorzynski, and R.J. Motta. Crt col-
orimetry, part ii: Metrology. Color Research and Ap-
plication, 18(5):315–325, 1992.
[6] R.S. Berns, R.J. Motta, and M.E. Gorzynski. Crt col-orimetry, part i: Theory and practice. Color Research
and Application, 18(5):299–314, 1992.
[7] David H. Brainard. Calibration of a computer con-
trolled color monitor. Color Research and Applica-tion, 14(1):23–34, 1989.
[8] Ian Buck, Greg Humphreys, and Pat Hanrahan.Tracking graphics state for networked rendering. Pro-
ceedings of Eurographics/SIGGRAPH Workshop onGraphics Hardware, 2000.
[9] Albert Cazes, Gordon Braudaway, Jim Christensen,Mike Cordes, Don DeCain, Alan Lien, Fred Mintzer,
and Steve L. Wright. On the color calibration of liquid
crystal displays. SPIE Conference on Display Metrol-ogy, pages 154–161, 1999.
[10] C. J. Chen and Mike Johnson. Fundamentals of scal-
able high resolution seamlessly tiled projection sys-
tem. Proceedings of SPIE Projection Displays VII,4294:67–74, 2001.
[11] Han Chen, Rahul Sukthankar, Grant Wallace, and Kai
Li. Scalable alignment of large-format multi-projector
displays using camera homography trees. Proceedingsof IEEE Visualization, 2002.
[12] R.A. Chorley and J. Laylock. Human factor consider-
ation for the interface between electro-optical display
and the human visual system. In Displays, volume 4,1981.
[13] R. L. Cook and K. E. Torrance. A reflectance modelfor computer graphics. Proceeding of SIGGRAPH,
pages 307–316, 1981.
[14] Carolina Cruz-Neira, Daniel J. Sandin, and Thomas
A.Defanti. Surround-screen projection-based virtualreality: The design and implementation of the CAVE.
In Proceedings of ACM Siggraph, 1993.
[15] Scott Daly. The visual differences predictor : An algo-
rithm for the assessment of image fidelity. Digital Im-ages and Human Vision, Editor: A.B.Watson, MIT
Press, pages 179–206, 1993.
[16] K. J. Dana, B. van Ginneken, S. K. Nayar, and J. J.
Koenderink. Reflectance and texture of real worldsurfaces. IEEE Transactions on Graphics, pages 1–
34, January 1999.
[17] Paul Debevec, Tim Hawkins, Chris Tchou, Haarm-Pieter Duiker, Westley Sarokin, and Mark Sagar. Ac-quiring the reflectance field of a human face. Proceed-
ings of SIGGRAPH, pages 145–156, 2000.
[18] Paul E. Debevec and Jitendra Malik. Recovering highdynamic range radiance maps from photographs. Pro-
ceedings of ACM Siggraph, pages 369–378, 1997.
[19] D.H.Brainard. Calibration of a computer controlledcolor monitor. Color Research and Applications,
14(1):23–34, 1989.
submitted to COMPUTER GRAPHICS Forum (4/2005).
Aditi Majumder, M. Gopi / Modeling Color Properties of Tiled Displays 15
[20] P. Diefenbach and N. Badler. Pipeline rendering : In-
teractive refractions, reflections and shadows. In Dis-plays(Special Issue on Interactive Computer Graph-
ics), 1994.
[21] D.L.MacAdam. Visual sensitivity to color differences
in daylight. Journal of Optical Society of America,
pages 247–274, 1942.
[22] O. Faugeras. Three-Dimensional Computer Vision: A
Geometric Viewpoint. MIT Press, Cambridge, Mas-sachusetts, 1993.
[23] J.D. Foley, A. Van Dam, S.K. Feiner, and J.F.Hughes.Computer Graphics Principles and Practice. Addison
Wesley, 1990.
[24] Edward J. Giorgianni and Thomas E. Madden. Digi-
tal Color Management : Encoding Solutions. AddisonWesley, 1998.
[25] E. Bruce Goldstein. Sensation and Perception.Wadsworth Publishing Company, 2001.
[26] M. Gsele and W. Heidrich et al. Building a photo stu-dio for measurement purposes. Proceedings of Vision,
Modeling, and Visualization, 2000.
[27] Paul E. Haeberli and Kurt Akeley. The accumulation
buffer: Hardware support for high-quality rendering.
Computer Graphics (Proceedings of SIGGRAPH 90),24(4):309–318, 1990.
[28] Mark Hereld. Local methods for measuring tiled dis-play alignment. Proceedings of IEEE International
Workshop on Projector-Camera Systems, 2003.
[29] Mark Hereld, Ivan Judson, and Rick Stevens. Intro-
duction to building projection-based tiled display sys-tems. IEEE Computer Graphics and Applications,
2000.
[30] Mark Hereld, Ivan R. Judson, Joseph Paris, and
Rick L. Stevens. Developing tiled projection display
systems. Proceedings of the Fourth International Im-mersive Projection Technology Workshop, 2000.
[31] Mark Hereld, Ivan R. Judson, and Rick Stevens. Dot-tytoto: A measurement engine for aligning multi-
projector display systems. Argonne National Labo-
ratory preprint ANL/MCS-P958-0502, 2002.
[32] G. Humphreys and P. Hanrahan. A distributed graph-
ics system for large tiled displays. In Proceedings ofIEEE Visualization, 1999.
[33] Greg Humphreys, Ian Buck, Matthew Eldridge, andPat Hanrahan. Distributed rendering for scalable dis-
plays. Proceedings of IEEE Supercomputing, 2000.
[34] Greg Humphreys, Matthew Eldridge, Ian Buck, Gor-don Stoll, Matthew Everett, and Pat Hanrahan.Wiregl: A scalable graphics system for clusters. Pro-ceedings of ACM SIGGRAPH, 2001.
[35] Greg Humphreys, Mike Houston, Ren Ng, Ran-
dall Frank, Sean Ahem, Peter Kirchner, and James
Klosowski. Chromium : A stream processing frame-
work for interactive rendering on clusters. ACM
Transactions of Graphics, 2002.
[36] Gregory Ward Larson. Overcoming gamut and dy-
namic range limitation in digital images. SiggraphCourse Notes, 2001.
[37] Kai Li, Han Chen, Yuqun Chen, Douglas W.
Clark, Perry Cook, Stefanos Damianakis, Georg Essl,
Adam Finkelstein, Thomas Funkhouser, Allison Klein,Zhiyan Liu, Emil Praun, Rudrajit Samanta, Ben
Shedd, Jaswinder Pal Singh, George Tzanetakis, and
Jiannan Zheng. Early experiences and challengesin building and using a scalable display wall sys-
tem. IEEE Computer Graphics and Applications,
20(4):671–680, 2000.
[38] M. J. Liaw and H.P.D. Shieh. Colorimetric calibration
of crt monitors using modified bern’s model. Optik,104(1):15–20, 1996.
[39] Xinguo Liu, Yizhou Yu, and Heung-Yeung Shum. Syn-thesizing bidirectional texture functions for real-world
surfaces. Proceedings of SIGGRAPH, pages 97 – 106,2001.
[40] Charles J. Lloyd. Quantifying edge blend quality: Cor-relation with observed judgements. Proceedings of Im-
age Conference, 2002.
[41] Jeffrey Lubin. A visual discrimination model for imag-
ing system design and evaluation. Vision Models for
Target Detection and Recognition, Editor: E. Peli,World Scientific, pages 245–283, 1995.
[42] Aditi Majumder. Properties of color variation acrossmulti-projector displays. Proceedings of SID Eurodis-
play, 2002.
[43] Aditi Majumder. A Practical Framework to Achieve
Perceptually Seamless Multi-Projector Displays. PhDthesis, University of North Carolina at Chapel Hill,
Department of Computer Science, 2003.
[44] Aditi Majumder. Contrast enhancement of multi-displays using human contrast sensitivity. Proceedings
of IEEE International Conference on Computer Vi-sion and Pattern Recognition (CVPR), 2005.
[45] Aditi Majumder, Zue He, Herman Towles, and GregWelch. Achieving color uniformity across multi-
projector displays. Proceedings of IEEE Visualization,
2000.
[46] Aditi Majumder, David Jones, Matthew McCrory,Michael E Papke, and Rick Stevens. Using a camera
to capture and correct spatial photometric variation
in multi-projector displays. Proceedings of IEEE In-ternational Workshop on Projector-Camera Systems,2003.
[47] Aditi Majumder and Rick Stevens. LAM: Luminance
attenuation map for photometric uniformity in pro-jection based displays. Proceedings of ACM VirtualReality and Software Technology, 2002.
submitted to COMPUTER GRAPHICS Forum (4/2005).

16 Aditi Majumder, M. Gopi / Modeling Color Properties of Tiled Displays
[48] Aditi Majumder and Rick Stevens. Identifying and
optimizing the emineoptic function for color seamless-ness in multi projector displays. Technical report,
#260, Argonne National Laboratory, 2003.
[49] Aditi Majumder and Rick Stevens. Color nonunifor-
mity in projection-based displays: Analysis and solu-tions. IEEE Transactions on Visualization and Com-
puter Graphics, 10(2), March/April 2004.
[50] Aditi Majumder and Rick Stevens. Perceptual photo-metric seamlessness in tiled projection-based displays.
ACM Transactions on Graphics, 24(1), January 2005.
[51] Aditi Majumder and Greg Welch. Computer graphicsoptique : Optical superposition of projected computer
graphics. Proceedings of Joint Eurographics Work-
shop on Virtual Environments and Immersive Pro-jection Technology, 2001.
[52] Thomas L. Martzall. Simultaneous raster and cal-
ligraphic crt projection system for flight simulation.In SPIE Proceedings,Electroluminescent Materials,
Devices, and Large-Screen Displays, volume 1910,
01/31/1993 - 02/05/1993.
[53] W. Matusik, H. Pfister, M. Brand, and L. McMillan.
A data driven reflectance model. ACM Transactions
on Graphics (TOG), 22(3):759–769, July 2003.
[54] David K. McAllister. A Generalized Surface Appear-
ance Representation for Computer Graphics. PhD
thesis, University of North Carolina at Chapel Hill,Department of Computer Science, 2002.
[55] Steve Molnar, Michael Cox, David Ellsworth, and
Henry Fuchs. A sorting classification of parallel ren-dering. IEEE Computer Graphics and Algorithms,
pages 23 – 32, 1994.
[56] J. Montrym, D. Baum, D. Dignam, and C. Migdal.Infinitereality: A real-time graphics systems. Proceed-
ings of SIGGRAPH, 1997.
[57] Liandan O’Callaghan, Nina Mishra, Adam Mayerson,
Sudipto Guha, and Rajeev Motwani. Streaming-dataalgorithms for high-quality clustering. IEEE Interna-
tional Conference on Data Engineering, 2002.
[58] John Owens, William Dally, Ujval Kapasi, ScottRixner, Peter Mattson, and Ben Mowery. Polygon
rendering on stream architecture. Proceedings of SIG-
GRAPH/Eurographics Workshop on Graphics Hard-ware, pages 23 – 32, 2000.
[59] B. Pailthorpe, N. Bordes, W.P. Bleha, S. Reinsch, and
J. Moreland. High-resolution display with uniform il-lumination. Proceedings Asia Display IDW, pages
1295–1298, 2001.
[60] Kenneth Perrine and Donald Jones. Parallel graphicsand interactivity with scalable graphics engine. IEEE
Supercomputing, 2001.
[61] Charles Poynton. A Techical Introduction to DigitalVideo. John Wiley and Sons, 1996.
[62] A. Raij, G. Gill, A. Majumder, H. Towles, and
H. Fuchs. PixelFlex2: A Comprehensive, Automatic,
Casually-Aligned Multi-Projector Display. IEEE In-
ternational Workshop on Projector-Camera Systems,2003.
[63] Mahesh Ramasubramanian, Sumanta N. Pattanaik,
and Donald P. Greenberg. A perceptually based phys-
ical error metric for realistic image synthesis. Proceed-ings of ACM SIGGRAPH, pages 73–82, 1999.
[64] R. Raskar, M.S. Brown, R. Yang, W. Chen, H. Towles,
B. Seales, and H. Fuchs. Multi projector displays us-ing camera based registration. Proceedings of IEEE
Visualization, 1999.
[65] R. Raskar, G. Welch, M. Cutts, A. Lake, L. Stesin, and
H. Fuchs. The office of the future: A unified approachto image based modeling and spatially immersive dis-
play. In Proceedings of ACM Siggraph, pages 168–176,
1998.
[66] Ramesh Raskar. Immersive planar displays usingroughly aligned projectors. In Proceedings of IEEE
Virtual Reality 2000, 1999.
[67] Ramesh Raskar. Projector based three dimensional
graphics. Technical Report TR02-046, University ofNorth Carolina at Chapel Hill, 2001.
[68] Ramesh Raskar, Jeroen van Baar, Paul Beardsley,
Thomas Willwacher, Srinivas Rao, and Clifton For-lines. ilamps: Geometrically aware and self-configuring
projectors. ACM Transactions on Graphics, 22(3),
2003.
[69] J. Rohlf and J. Helman. Iris performer: A high perfor-mance multiprocessing toolkit for real-time 3d graph-
ics. Preceedings of SIGGRAPH, 1994.
[70] Rudro Samanta, Jiannan Zheng, Thomas Funkhouser,
Kai Li, and Jaswinder Pal Singh. Load balanc-ing for multi-projector rendering systems. In SIG-
GRAPH/Eurographics Workshop on Graphics Hard-ware, 1999.
[71] S.Molnar, J. Eyles, and J. Poulton. Pixelflow : High-
speed rendering using image composition. In Proceed-
ings of SIGGPARH, pages 231–240, 1992.
[72] Maureen C. Stone. Color balancing experimental pro-jection displays. 9th IS&T/SID Color Imaging Con-
ference, 2001a.
[73] Maureen C. Stone. Color and brightness appearance
issues in tiled displays. IEEE Computer Graphics andApplications, 2001b.
[74] Maureen C. Stone. A Field Guide to Digital Color.
A.K. Peters, 2003.
[75] Russell L. De Valois and Karen K. De Valois. SpatialVision. Oxford University Press, 1988.
[76] Russell L. De Valois and Karen K. De Valois. Spatial
Vision. Oxford University Press, 1990.
[77] G. Wallace, H. Chen, and K. Li. Color gamut match-
ing for tiled display walls. Immersive Projection Tech-nology Workshop, 2003.
submitted to COMPUTER GRAPHICS Forum (4/2005).

Aditi Majumder, M. Gopi / Modeling Color Properties of Tiled Displays 17
[78] Ruigang Yang, David Gotz, Justin Hensley, Herman
Towles, and Michael S. Brown. Pixelflex: A reconfig-urable multi-projector display system. Proceedings of
IEEE Visualization, 2001.
[79] Ruigang Yang, Aditi Majumder, and Michael S.
Brown. Camera based calibration techniques for seam-less flexible multi-projector displays. Applications of
Computer Vision Workshop, Proceedings of European
Conference in Computer Vision (ECCV), 2004.
[80] Y. Yu, P. Debevec, J. Malik, and T. Hawkins. Inverseglobal illumination: Recovering reflectance models of
real scenes from photographs. Proceedings of SIG-
GRAPH, pages 215–224, 1999.
submitted to COMPUTER GRAPHICS Forum (4/2005).