evaluating color de ciency simulation and daltonization ... · evaluating color de ciency...
TRANSCRIPT
Evaluating color deficiency simulation and daltonizationmethods through visual search and sample-to-match:
SaMSEM and ViSDEM
Joschua Thomas Simon-Liedtkea and Ivar Farupa and Bruno Laengb
aThe Norwegian Colour and Visual Computing Laboratory, Gjøvik University College,Teknologivegen 22, 2815 Gjøvik, Norway
b Department of Psychology, University of Oslo, Forskningsveien 3A, 0373 Oslo, Norway
ABSTRACT
Color deficient people might be confronted with minor difficulties when navigating through daily life, for examplewhen reading websites or media, navigating with maps, retrieving information from public transport schedulesand others. Color deficiency simulation and daltonization methods have been proposed to better understandproblems of color deficient individuals and to improve color displays for their use. However, it remains unclearwhether these color “prosthetic” methods really work and how well they improve the performance of color-deficient individuals. We introduce here two methods to evaluate color deficiency simulation and daltonizationmethods based on behavioral experiments that are widely used in the field of psychology. Firstly, we propose aSample-to-Match Simulation Evaluation Method (SaMSEM); secondly, we propose a Visual Search Daltoniza-tion Evaluation Method (ViSDEM). Both methods can be used to validate and allow the generalization of thesimulation and daltonization methods related to color deficiency. We showed that both the response times (RT)and the accuracy of SaMSEM can be used as an indicator of the success of color deficiency simulation methodsand that performance in the ViSDEM can be used as an indicator for the efficacy of color deficiency daltonizationmethods. In future work, we will include comparison and analysis of different color deficiency simulation anddaltonization methods with the help of SaMSEM and ViSDEM.
Keywords: sample-to-match, visual search, daltonization, color deficiency simulation, color deficiency, colorimage quality, image enhancement, behavioral experiment, psychology
1. INTRODUCTION
Color vision in humans is based on photoreceptors in the retina called cones that are differentially sensitiveto wavelengths by pigments called opsins that filter different ranges of the visible electromagnetic spectrum;typically in the short, medium, and long range of the light spectrum through the S-cones, M-cones and L-conesrespectively.1 Ganglion cells in the latter parts of the human eye, i.e. middle part of the human visual sys-tem (HVS), combine the signals from the cones into pathways that roughly correspond to different perceptualattributes: A pathway for intensity, a pathway for red–green opponency, and a pathway for blue–yellow oppo-nency.2 Since all the colors that we can perceive are generated on the basis of signals from the three types ofcones, this type of color vision is called trichromatic vision. Trichromatic vision is the norm for the majorityof humans, but not for all species and for mammals it has only evolved in some primates.3,4 In anomaloustrichromats and dichromats, the sensitivity of at least one photopigment is shifted or the photopigment may bemissing all together.
Many studies indicate that color vision in general provides an evolutionary advantage reflected in behavioraladvantages when differentiating between edible or non-edible fruits and foliage.5 Moreover, there are some indi-cations that color assists attentional mechanisms,6 object recognition5 and possibly emotional states’ detection.7
Further author information: (Send correspondence to J.T.S.-L.)J.T.S.-L.: E-mail: [email protected], Telephone: +47 611 35 378I.F.: E-mail: [email protected], Telephone: +47 611 35 227B.L.: E-mail: [email protected], Telephone: +47 22 84 51 16
Most color deficient people do not report serious limitations in daily life and the practical consequences of colordeficiency have been little researched. However, researchers agree that color deficient people have an objectivelyreduced capacity to differentiating colors, since certain colors are “confused” with others.8 Since cone sensitivityis weakened or absent in comparison to normal sighted observers, the signals reaching the ganglion cells for thered–green opponency pathway can be severely reduced, resulting in a significantly weakened response along thispathway. Since color contrast is significantly reduced, the image quality is disrupted in both anomalous trichro-mats and dichromats, because color edges become less visible, and it may be more difficult to retrieve crucialinformation from an image. In these cases, changes in colors might only be distinguished along the yellow–bluecontrast, and/or lightness contrast.
For normal sighted people, in order to better understand difficulties of such color deficient observers, sim-ulation methods may be needed. Thus, color deficiency simulation methods have been proposed to simulatethe vision of color deficient observers for normal sighted observers. Most simulation methods are optimized fordichromatic color deficiency,9,10 whereas other can simulate anomalous trichromacy to some degree as well.11
Moreover, color-deficient individuals’ processing of visual information can be improved by image enhancementmethods specifically developed for color deficient observers. The so-called daltonization methods have been pro-posed to improve image quality for color deficient observers by increasing and/or reintroducing lost or decreasedcolor contrast in order to regain lost information.11–14 Most of these methods are in turn based on color defi-ciency simulation methods in order to determine which colors in the image are of difficulty for color deficientobservers.
Color deficiency simulation and daltonization methods still leave unresolved two main questions: 1. If andhow well do simulation methods actually visualize color-deficient vision? Brettel et al .9 reported that they testedtheir method on only one protan and one deutan dichromat observers, who indeed could not see any differencesbetween the original and the simulation. However, a broad survey conducted on several color deficient observershas not yet been thoroughly performed. 2. How well do daltonization methods work, i.e. do they really improvecolor images for color deficient observers? Some researchers have put to test their daltonization method on theso-called Ishihara plates,15 i.e. checking if color-deficient people were able to extract the correct informationafter daltonization. However, one should note that Ishihara plates do not correspond to natural images sincethe image dots do not overlap and are surrounded by a white background. However, this limitation might beavoided by updated Ishihara plates as proposed by Rizzi et al.,16 in which color dots actually overlap.
In this paper, we present two experiment methods allowing the analysis and comparison of multiple colordeficiency simulation and daltonization methods, using sample-to-match for simulation (SaMSEM) and visualsearch for daltonization (ViSDEM), based on the experiments of Bramao et al.5 and by Treisman et al.6
respectively. The present paper is divided into (i) an account of the general methodology, (ii) an analysis of thecurrent implementation, (iii) a presentation of the results with a discussion, and (iv) a final conclusion. Thepurpose of this paper is to test the evaluation methods, not yet to compare the simulation and daltonizationmethods. In other words, we want to show how our evaluation methods can be used to show that color deficiencysimulation and daltonization methods really work. In a previous study from 2013,17 we presented a task-basedaccessibility measurement of daltonization algorithms for information graphics, namely for public transportationmaps, using response time (RT) data that we tested on normal sighted observers using both color deficiencysimulation and daltonization methods. The new methods follow a more standardized protocol and involve colordeficient observers as well.
2. METHODOLOGY
2.1 Sample-to-match Simulation Evaluation Method (SaMSEM)
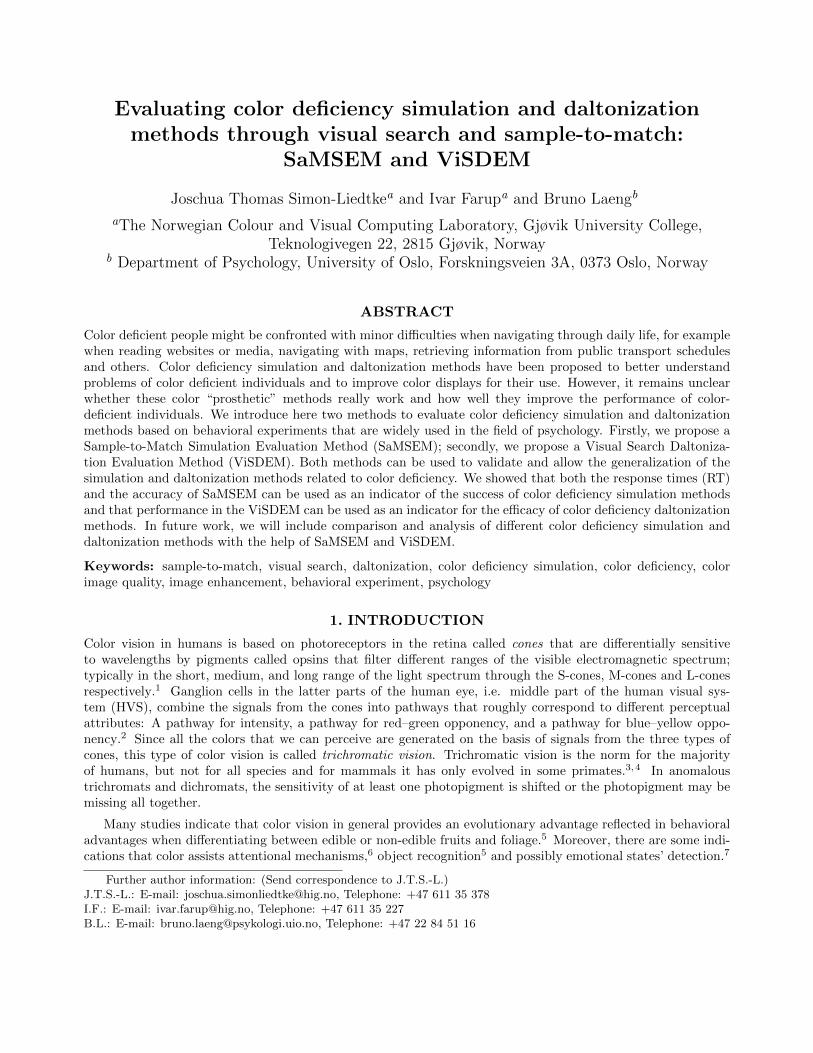
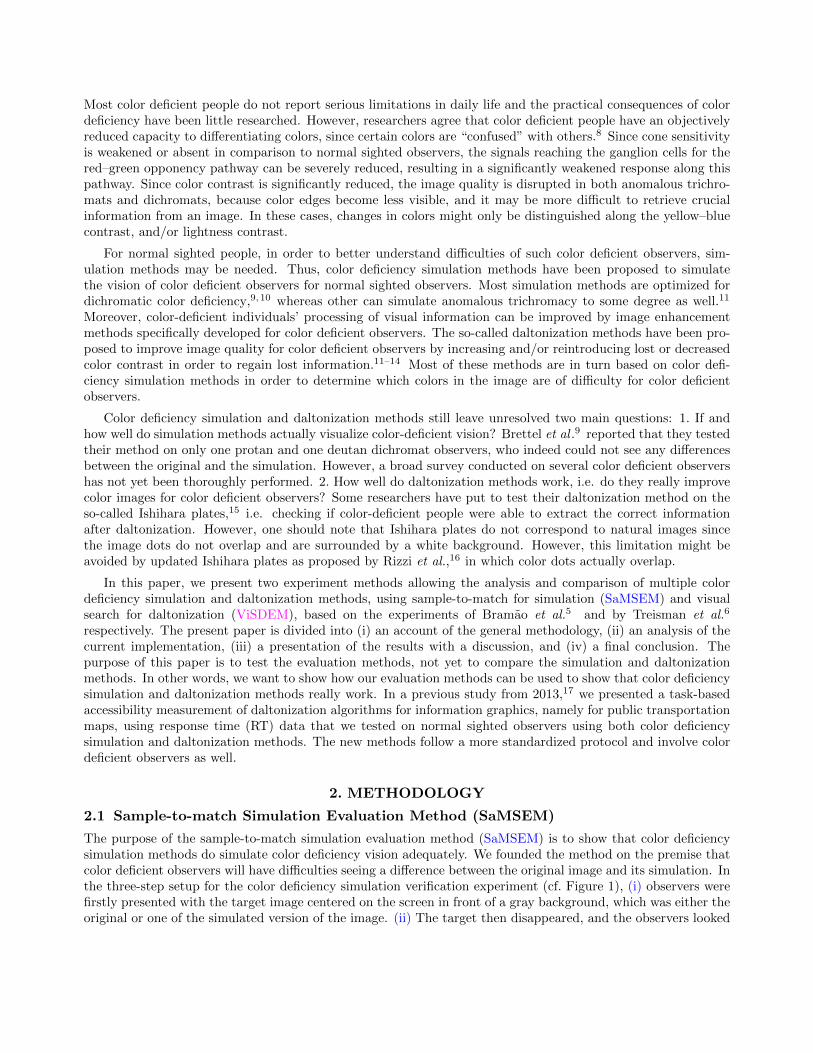
The purpose of the sample-to-match simulation evaluation method (SaMSEM) is to show that color deficiencysimulation methods do simulate color deficiency vision adequately. We founded the method on the premise thatcolor deficient observers will have difficulties seeing a difference between the original image and its simulation. Inthe three-step setup for the color deficiency simulation verification experiment (cf. Figure 1), (i) observers werefirstly presented with the target image centered on the screen in front of a gray background, which was either theoriginal or one of the simulated version of the image. (ii) The target then disappeared, and the observers looked
at a gray screen with a fixation cross in the center. (iii) Thirdly, the observers were presented with the originaland one simulated version next to each other in front of a gray background, of which one image was the targetversion that he/she had just seen before. The observer was asked to press either the left or right arrow key onthe keyboard according to whether the target image was now located on the right or the left. We recorded bothwhether or not the observer answered correctly, i.e. the accuracy, and how long it took to respond to the task,i.e. the response time (RT).
We hypothesized that color deficient observers would have problems spotting the difference between originaland simulated versions, i.e. they would react slower, resulting in higher RTs, and make more mistakes, resultingin lower accuracy, when detecting the correct image. On the other hand, normal sighted observers should havelittle problems spotting the difference between the original and its simulation, resulting in faster RTs and higheraccuracy. We analyzed the results by plotting the box plots of the RTs including the 95% confidence intervalof the average RT among all observer groups, i.e. normal sighted, deutan and protan color deficient observers.And we plotted the accuracy with 95% confidence interval for all observer groups. We defined RT and accuracyof one group to be significantly different from another group, if their confidence intervals did not overlap.
Figure 1: SaMSEM workflow: The observer is firstly presented with the target stimulus for 1250 ms before itdisappears. He/she sees secondly the same motive in two different versions, both the original and the simulatedversion of the motive, and he/she is asked to press either the right or the left arrow key on the keyboard accordingto whether the target is now located on the left or on the right. The program records both the response time(RT), in ms, and the correctness, as boolean, of the subject’s response.
2.2 Visual Search Daltonization Evaluation Method (ViSDEM)
The purpose of the visual search daltonization evaluation method (ViSDEM) is to show that color deficiencydaltonization methods really improve color image quality for color deficient observers. We have founded themethod on the assumption that color deficient observers can be enabled to retrieve relevant information quickerfrom the image than they could be before the image has been “daltonized”. As the previous experimentation,the color deficiency daltonization evaluation experiment consists of three steps (cf. Figure 2). (i) The observer isfirstly presented a statement addressing the colors of specific objects in the image like for example “The jerseysof the wrestlers have the same color hue” or “The feathers of the bird have a different color hue than the leavesin the background.” (ii) Secondly, the observers are presented with a gray screen with a cross for fixation inthe center of the screen. (iii) Thirdly, they see the target image in the center, the previously shown statementbelow the image. The observer is asked to press the left arrow key of the keyboard, labeled with “AGREE”,if he/she agrees that the statement is correct for the presented image, respectively press the right arrow key ofthe keyboard, labeled with “DISAGREE”, if he/she disagrees that the statement is correct for the image. Werecorded whether or not the observer answers correctly, i.e. the accuracy, and how long he/she takes to respondto the task, i.e. the RT.
For each set of questions we chose different motives like wrestler jerseys, fruits in front of foliage, etc. Foreach motive, we changed the colors in order to create different variants of the same motive such that the colorswould either become (i) difficult for nobody (DN), (ii) difficult for color deficient observers (DC), or (iii) difficultfor everybody (DE). We hypothesized that color deficient observers would have problems retrieving informationfrom both the DC and DE variants of the motives resulting in slower RTs and lower accuracy as compared tothe DN variant, whereas normal sighted people would not have problems for the DC variants of the motivesresulting in no significant different accuracy and/or RTs. We analyzed the results by plotting the box plots ofthe RTs including the 95% confidence interval of the average RT among all image variants, i.e. DN, DC and DE.And we plotted the accuracy with 95% confidence interval for all image variants.
3. IMPLEMENTATION
We setup the experiment on two computers in a closed room with D50 fluorescent lighting dimmed to 30 lux. Forthe calibration of the computer display, an i1Pro spectrophotometer and i1Match Software was used to determinethe display white point of 6500k, gamma of 2.2 and the brightness of 120 cd
m2 . All images were assigned withsRGB profiles. For showing images, we used the PsychoPy2 library, which measured RTs and accuracies. of theanalysis of the data was done with Python libraries, namely Pandas for organization and retrieving of the data,and Numpy, SciPy and Matplotlib for the analysis of the data.
For SaMSEM, we tested four different simulation methods on 44 different motives: The motives were chosenaccording to different attributes like predominant color hue/s, protan/deutan/normal color contrast, overalllightness and saturation, skin, sky and grass memory colors, large areas of the same color, color transitions, finedetails and busyness based on the classification proposed by Pedersen.18,19 The simulation algorithms were theones proposed by Vienot et al.,10 an improved method of the Vienot algorithm, an algorithm presented by Brettelet al.,9 and an algorithm presented by Kotera.11 In addition to these, we had a reference dummy simulationmethod that converted the color images into black-and-white images. For all these methods, we computed thesimulated versions for protanopia and deuteranopia, since we were able to recruit only color-deficient observersbelonging to either one of these categories.
For ViSDEM, we tested the method on 7 different image sets: The motives have been chosen according totheir color contrast with focus on red–green opponency, and preferably images have been chosen that could beassociated to a specific task. The chosen task was whether certain elements in the image have different colorhue (for group A), or if these elements have same color hue (for group B). Groups were assigned randomly inthe beginning of the experiment. The daltonization algorithms were the ones proposed by Anagnostopoulos etal.,12 Kotera,11 Kuhn et al.,13 and Huang et al.14 As before, we used a reference dummy daltonization methodthat convert color images into black-and-white images. For all methods, we computed the daltonized versionsfor protanopia and deuteranopia. In this paper, however, we do not consider the daltonized version, but only theDN, DC and DE variants of the original. Again, we hypothesize that the three variants will lead to no significant
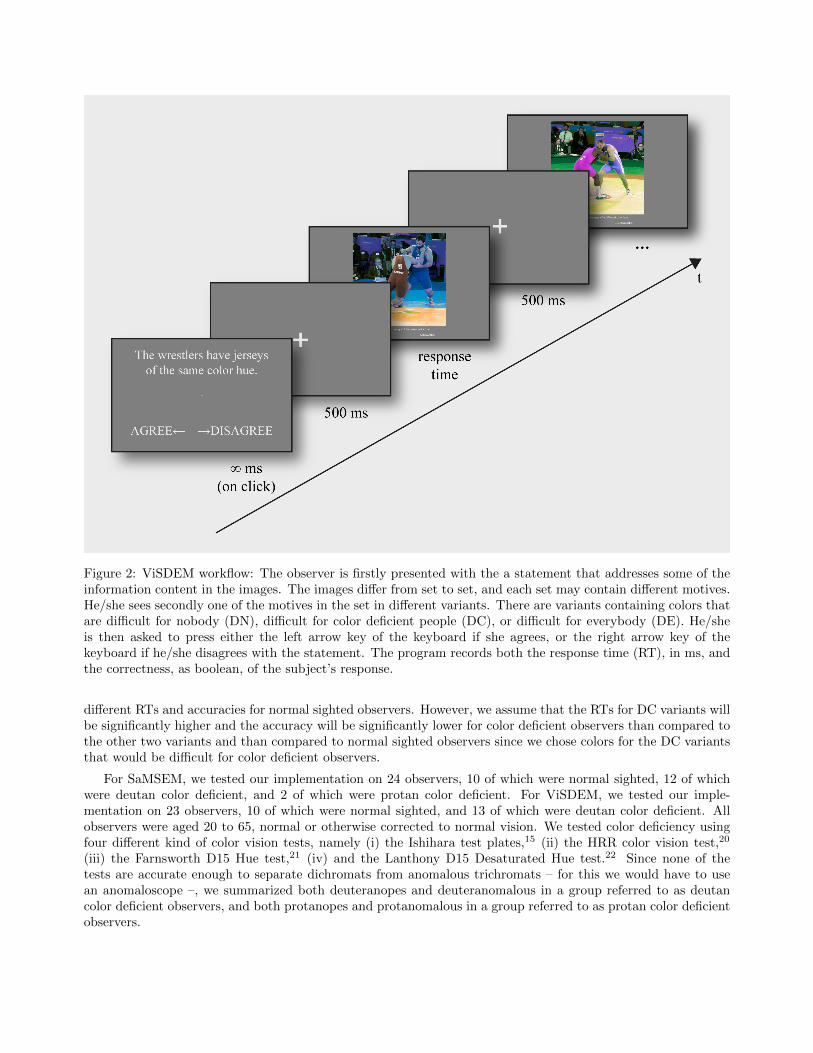
Figure 2: ViSDEM workflow: The observer is firstly presented with the a statement that addresses some of theinformation content in the images. The images differ from set to set, and each set may contain different motives.He/she sees secondly one of the motives in the set in different variants. There are variants containing colors thatare difficult for nobody (DN), difficult for color deficient people (DC), or difficult for everybody (DE). He/sheis then asked to press either the left arrow key of the keyboard if she agrees, or the right arrow key of thekeyboard if he/she disagrees with the statement. The program records both the response time (RT), in ms, andthe correctness, as boolean, of the subject’s response.
different RTs and accuracies for normal sighted observers. However, we assume that the RTs for DC variants willbe significantly higher and the accuracy will be significantly lower for color deficient observers than compared tothe other two variants and than compared to normal sighted observers since we chose colors for the DC variantsthat would be difficult for color deficient observers.
For SaMSEM, we tested our implementation on 24 observers, 10 of which were normal sighted, 12 of whichwere deutan color deficient, and 2 of which were protan color deficient. For ViSDEM, we tested our imple-mentation on 23 observers, 10 of which were normal sighted, and 13 of which were deutan color deficient. Allobservers were aged 20 to 65, normal or otherwise corrected to normal vision. We tested color deficiency usingfour different kind of color vision tests, namely (i) the Ishihara test plates,15 (ii) the HRR color vision test,20
(iii) the Farnsworth D15 Hue test,21 (iv) and the Lanthony D15 Desaturated Hue test.22 Since none of thetests are accurate enough to separate dichromats from anomalous trichromats – for this we would have to usean anomaloscope –, we summarized both deuteranopes and deuteranomalous in a group referred to as deutancolor deficient observers, and both protanopes and protanomalous in a group referred to as protan color deficientobservers.
4. RESULTS
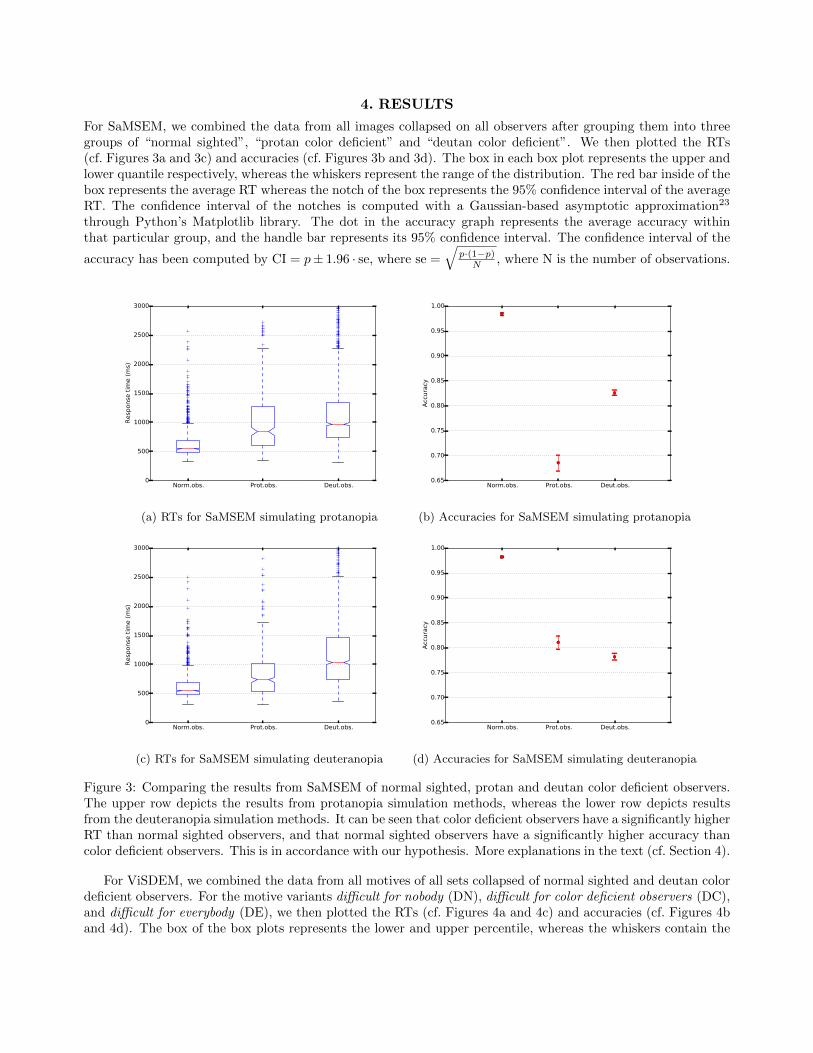
For SaMSEM, we combined the data from all images collapsed on all observers after grouping them into threegroups of “normal sighted”, “protan color deficient” and “deutan color deficient”. We then plotted the RTs(cf. Figures 3a and 3c) and accuracies (cf. Figures 3b and 3d). The box in each box plot represents the upper andlower quantile respectively, whereas the whiskers represent the range of the distribution. The red bar inside of thebox represents the average RT whereas the notch of the box represents the 95% confidence interval of the averageRT. The confidence interval of the notches is computed with a Gaussian-based asymptotic approximation23
through Python’s Matplotlib library. The dot in the accuracy graph represents the average accuracy withinthat particular group, and the handle bar represents its 95% confidence interval. The confidence interval of the
accuracy has been computed by CI = p± 1.96 · se, where se =√
p·(1−p)N , where N is the number of observations.
Norm.obs. Prot.obs. Deut.obs.0
500
1000
1500
2000
2500
3000
Resp
onse
tim
e (
ms)
(a) RTs for SaMSEM simulating protanopia
Norm.obs. Prot.obs. Deut.obs.0.65
0.70
0.75
0.80
0.85
0.90
0.95
1.00
Acc
ura
cy
(b) Accuracies for SaMSEM simulating protanopia
Norm.obs. Prot.obs. Deut.obs.0
500
1000
1500
2000
2500
3000
Resp
onse
tim
e (
ms)
(c) RTs for SaMSEM simulating deuteranopia
Norm.obs. Prot.obs. Deut.obs.0.65
0.70
0.75
0.80
0.85
0.90
0.95
1.00
Acc
ura
cy
(d) Accuracies for SaMSEM simulating deuteranopia
Figure 3: Comparing the results from SaMSEM of normal sighted, protan and deutan color deficient observers.The upper row depicts the results from protanopia simulation methods, whereas the lower row depicts resultsfrom the deuteranopia simulation methods. It can be seen that color deficient observers have a significantly higherRT than normal sighted observers, and that normal sighted observers have a significantly higher accuracy thancolor deficient observers. This is in accordance with our hypothesis. More explanations in the text (cf. Section 4).
For ViSDEM, we combined the data from all motives of all sets collapsed of normal sighted and deutan colordeficient observers. For the motive variants difficult for nobody (DN), difficult for color deficient observers (DC),and difficult for everybody (DE), we then plotted the RTs (cf. Figures 4a and 4c) and accuracies (cf. Figures 4band 4d). The box of the box plots represents the lower and upper percentile, whereas the whiskers contain the
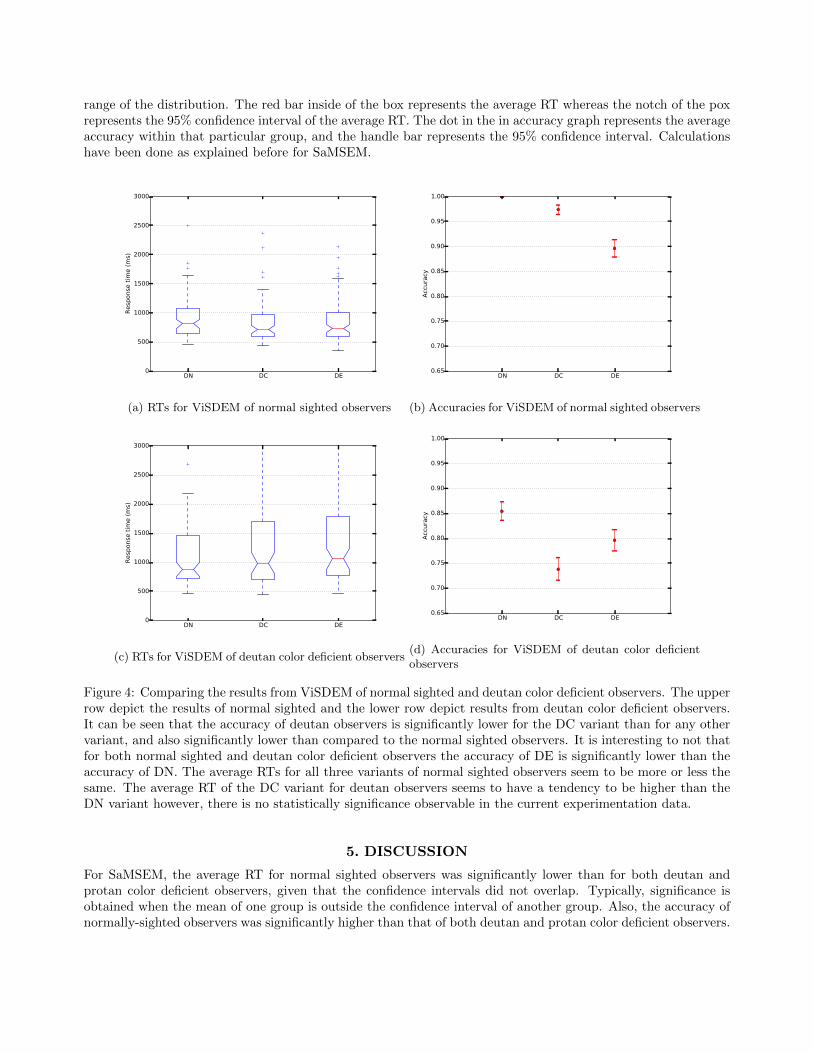
range of the distribution. The red bar inside of the box represents the average RT whereas the notch of the poxrepresents the 95% confidence interval of the average RT. The dot in the in accuracy graph represents the averageaccuracy within that particular group, and the handle bar represents the 95% confidence interval. Calculationshave been done as explained before for SaMSEM.
DN DC DE0
500
1000
1500
2000
2500
3000
Resp
onse
tim
e (
ms)
(a) RTs for ViSDEM of normal sighted observers
DN DC DE0.65
0.70
0.75
0.80
0.85
0.90
0.95
1.00
Acc
ura
cy
(b) Accuracies for ViSDEM of normal sighted observers
DN DC DE0
500
1000
1500
2000
2500
3000
Resp
onse
tim
e (
ms)
(c) RTs for ViSDEM of deutan color deficient observers
DN DC DE0.65
0.70
0.75
0.80
0.85
0.90
0.95
1.00
Acc
ura
cy
(d) Accuracies for ViSDEM of deutan color deficientobservers
Figure 4: Comparing the results from ViSDEM of normal sighted and deutan color deficient observers. The upperrow depict the results of normal sighted and the lower row depict results from deutan color deficient observers.It can be seen that the accuracy of deutan observers is significantly lower for the DC variant than for any othervariant, and also significantly lower than compared to the normal sighted observers. It is interesting to not thatfor both normal sighted and deutan color deficient observers the accuracy of DE is significantly lower than theaccuracy of DN. The average RTs for all three variants of normal sighted observers seem to be more or less thesame. The average RT of the DC variant for deutan observers seems to have a tendency to be higher than theDN variant however, there is no statistically significance observable in the current experimentation data.
5. DISCUSSION
For SaMSEM, the average RT for normal sighted observers was significantly lower than for both deutan andprotan color deficient observers, given that the confidence intervals did not overlap. Typically, significance isobtained when the mean of one group is outside the confidence interval of another group. Also, the accuracy ofnormally-sighted observers was significantly higher than that of both deutan and protan color deficient observers.
Both results indicate that color-deficient people have indeed difficulties separating the original from the simulatedversions since the confidence intervals do not overlap. Thus, the simulations do indeed illustrate the colordeficiencies adequately. Moreover, the accuracy of protan color deficient observers was significantly lower thanthat of deutan color-deficient observers for the protanopia simulations. Accuracy of deutan color deficientobservers was significantly lower than the accuracy for protan color-deficient observers for the deuteranopiasimulations. The RTs of deutan color deficient observers were significantly higher for both deuteranopia andprotanopia simulations. Since we could only test two protan color deficient observers, the present results forprotan color deficient observers should be taken with caution.
For ViSDEM, there were no significant variations in RTs of normal sighted observers when comparing theDN, DE and DC variants of the images. Also, the accuracy for DN and DC of normal sighted observers werenot significantly different. Both observations indicate that, for normal sighted observers, in both image variants,i.e. DN and DC, the confusing colors look sufficiently different. Moreover, the accuracy of the DE variant wassignificantly different from both the DN and DE variants. On the other hand, there was a tendency towards adifference between RTs and performance of deutan color deficient observers for DC variants as well as for DNand DE variants. That is, the DC has a significantly lower RT, and a significantly lower accuracy. Accuracyindicated that color deutan color deficient observers did indeed have more difficulties interpreting the correctcolors in the DC image. Moreover, the accuracy of the DE variants was significantly lower than the accuracy ofthe DN variant, as before for normal sighted observers. To summarize, we can conclude that for both groups,normal sighted and deutan color deficient observers, images that have been chosen to be “difficult for nobody” doindeed result in the highest accuracy within each group, whereas the image that have been chosen to be “difficultfor nobody” do indeed result in significantly lower accuracy than the DN varian images. The images that havebeen chosen to be “difficult for color deficient people” do indeed result in the lowest accuracy for deutan colordeficient observers, but result in comparable accuracies as the DN variant images for normal sighted observers.Thus, the accuracy results do support our hypothesis. RTs on the other hand did not give any statisticallysufficient answers to our hypothesis.
In future work, we will compare different simulation and daltonization methods, in order to analyze if and howone method performs better than another. More precisely, (i) if alternative simulation methods show significantdifferences in efficiency of response or accuracy we assume that such a simulation method performs better thananother. This method would result in slower RTs and lower accuracies. Also, (ii) if different daltonizationmethods show significant differences in RTs and accuracy we assume that one simulation method performsbetter than another.
6. CONCLUSION
We introduced two methods to evaluate color deficiency simulation and daltonization methods through sample-to-match (SaMSEM) and visual search (ViSDEM) tasks. We showed that both RTs and accuracy can be usedas indicators of whether a color deficiency simulation works, and that accuracy can be used as an indicator ofwhether a color deficiency daltonization works. In future work, we will expand our research to test whetherboth proposed methods can be used to compare and rank different color deficiency simulation and daltonizationmethods.
ACKNOWLEDGMENTS
We want to thank Carl Pilon for allowing us to use his images for this publication. His work is accessible under hisFlickr profile (Pilou@SF). We also want to thank Peter Nussbaum for supporting us during the experimentation.
REFERENCES
[1] Wyszecki, G. and Stiles, W., [Color Science ], John Wiley & Sons, Inc., 2nd ed. (2000).
[2] De Valois, R. L. and De Valois, K. K., “A multi-stage color model,” Vision research 33(8), 1053–1065(1993).
[3] Jacobs, G. H., “The distribution and nature of colour vision among the mammals,” Biological Reviews 68(3),413–471 (1993).
[4] Bowmaker, J. K., “Evolution of colour vision in vertebrates,” Eye 12, 541–547 (1998).
[5] Bramao, I., Faısca, L., Petersson, K. M., and Reis, A., “The contribution of color to object recognition,” in[Advances in Object Recognition Systems ], Kypraios, I., ed., InTech (2012).
[6] Treisman, A. M. and Gelade, G., “A feature-integration theory of attention,” Cognitive Psychology 12(1),97–136 (1980).
[7] Changizi, M. A., Zhang, Q., and Shimojo, S., “Bare skin, blood and the evolution of primate colour vision,”Biology letters 2(2), 217–221 (2006).
[8] Flatla, D. and Gutwin, C., “‘So That’s What You See!’ Building Understanding with Personalized Sim-ulations of Colour Vision Deficiency,” in [ASSETS ’12: The proceedings of the 14th international ACMSIGACCESS conference on Computers and accessibility ], (2012).
[9] Brettel, H., Vienot, F., and Mollon, J. D., “Computerized simulation of color appearance for dichromats,”Journal of the Optical Society of America A 14, 2647–2655 (October 1997).
[10] Vienot, F., Brettel, H., and Mollon, J. D., “Digital video colourmaps for checking the legibility of displaysby dichromats,” Color Research & Application 24(4), 243–252 (1999).
[11] Kotera, H., “Optimal daltonization by spectral shift for dichromatic vision,” in [20th IS&T Color andImaging Conference (CIC20) ], 302–308, Society for Imaging Science and Technology (IS&T) (November2012).
[12] Anagnostopoulos, C.-N., Tsekouras, G., Anagnostopoulos, I., and Kalloniatis, C., “Intelligent modificationfor the daltonization process of digitized paintings,” in [The 5th International Conference on ComputerVision Systems ], Universitat Bielefeld (March 2007).
[13] Kuhn, G. R., Oliveira, M. M., and Fernandes, L. A., “An efficient naturalness-preserving image-recoloringmethod for dichromats,” IEEE Transactions on Acoustics Speech and Signal ProcessingVisualization andComputer Graphics 14(6), 1747–1754 (2008).
[14] Huang, J.-B., Chen, C.-S., Jen, T.-C., and Wang, S.-J., “Image recolorization for the colorblind,” in [IEEEInternational Conference on Acoustics, Speech and Signal Processing, 2009 (ICASSP 2009) ], 1161–1164,IEEE (2009).
[15] Ishihara, S., [Tests for Colour-Blindness - 24 plates ], Kanehara Shuppan Co., Ltd. (1972).
[16] Rizzi, A., Eschbach, R., Quaranta, A., and Bonanomi, C., “Modified Ishihara test to study the role of edgesin color discrimination,” Italian Journal of Aerospace Medicine , 20–25 (2014).
[17] Simon-Liedtke, J. and Hardeberg, J. Y., “Task-based accessibility measurement of daltonization algorithmsfor information graphics,” in [AIC 2013 ], 108 (2013).
[18] Pedersen, M., Bonnier, N., Hardeberg, J. Y., and Albregtsen, F., “Attributes of image quality for colorprints,” Journal of Electronic Imaging 19(1), 011016–011016 (2010).
[19] Pedersen, M., Image quality metrics for the evaluation of printing workflows, PhD thesis, Gjøvik UniversityCollege (2011).
[20] Cole, B. L., Lian, K.-Y., and Lakkis, C., “The new Richmond HRR pseudoisochromatic test for colourvision is better than the Ishihara test,” Clinical and Experimental Optometry 89(2), 73–80 (2006).
[21] Farnsworth, D., [The Farnsworth Dichotomous Test for Color Blindness: Panel D-15 ], Psychological Cor-poration (1947).
[22] Lanthony, P., “The desaturated panel D-15,” Documenta Ophthalmologica 46(1), 185–189 (1978).
[23] McGill, R., Tukey, J. W., and Larsen, W. A., “Variations of box plots,” The American Statistician 32(1),12–16 (1978).