modeling and analysis of a composite b-pillar … · side-impact protection of occupants in a sedan...
TRANSCRIPT

MODELING AND ANALYSIS OF A COMPOSITE B-PILLAR FOR
SIDE-IMPACT PROTECTION OF OCCUPANTS IN A SEDAN
A Thesis by
Santosh Reddy
Bachelor of Engineering, VTU, India, 2003
Submitted to the College of Engineering
and the faculty of Graduate School of
Wichita State University
in partial fulfillment of
the requirements for the degree of
Master of Science
May 2007

ii
MODELING AND ANALYSIS OF A COMPOSITE B-PILLAR FOR
SIDE-IMPACT PROTECTION OF OCCUPANTS IN A SEDAN
I have examined the final copy of thesis for form and content and recommend that it be
accepted in partial fulfillment of the requirements for the degree of Master of Science,
with a major in Mechanical Engineering.
__________________________________
Hamid M. Lankarani, Committee Chair
We have read this thesis and recommend its acceptance
___________________________________
Kurt soschinske, Committee Member
___________________________________
M.Bayram Yildirim, Committee Member

iii
DEDICATION
To My Parents & Sister

iv
ACKNOWLEDGEMENTS
I would like to express my sincere gratitude to my graduate advisor, Dr. Hamid
M. Lankarani, who has been instrumental in guiding me towards the successful
completion of this thesis. I would also like to thank Dr. Kurt Soschinske and Dr. M.
Bayram Yildirim for reviewing my thesis and making valuable suggestions.
I am indebted to National Institute for Aviation Research (NIAR) for supporting
me financially throughout my Master’s degree. I would like to acknowledge the support
of my colleagues at NIAR, especially the managers Thim Ng, Tiong Keng Tan and Kim
Leng in the completion of this thesis.
Special thanks to Ashwin Sheshadri, Kumar Nijagal, Arun Kumar Gowda,
Siddartha Arood, Krishna N Pai, Anup Sortur, ShashiKiran Reddy, Sahana
Krishnamurthy, Praveen Shivalli, Geetha Basavaraj, Akhil Kulkarni, Sir Chin Leong,
Evelyn Lian, Arvind Kolhar in encouragement and suggestions throughout my Masters
degree.
I also extend my gratitude to my parents, sister, cousins and all my friends who
stood by me at all times.

v
ABSTRACT
Cars safety became an issue almost immediately after the invention of the
automobile. To protect occupants from a direct impact, the passenger compartment and
the structure of the vehicle should keep its shape in a crash. Continuous developments to
improve is proposed everyday, standards are set in pertinent to different crash scenarios
such as the frontal crash, side impact and so on. Among these standards, side impact is
one of the most fatal crash scenarios that lead to death of people in the United States and
across the globe. In the contemporary world, fuel consumption also poses a serious issue
that has to be considered. With these constraints in consideration, a lighter and stronger
material than steel, the composite material, can be used. Using this material would help in
reducing the fuel efficiency without sacrificing the safety of the vehicle.
With the advance in computer simulations, finite element (FE) model of the Ford
Taurus and Moving Deformable Barrier (MDB) developed by the National Crash
Analysis Center (NCAC) has been used for different impact scenarios to predict the
vehicle behavior and occupant response. In addition, MSC Patran has been used as the
modeler and LS-Dyna as the solver to run the required simulations. MADYMO is used to
predict the injury parameters.
In this research, a composite B-Pillar that is the energy absorbing structure is
modeled and analyzed with Finite Element Analysis. The injuries sustained by the
occupant are predicted using Madymo. An attempt is made to use carbon and glass fiber
composite materials in the B-Pillar modeled in this study. In addition, a parametric study
is carried out on the B-Pillar to determine the maximum possible energy absorbing
parameters. It is demonstrated that the new modeling with the use of carbon/glass with a

vi
pertinent orientation and thickness may present more energy absorption than the present
steel pillar. Energy absorption, displacement and the acceleration of the present and the
new model are also compared and discussed in detail. Occupant injuries, such as chest
and head injuries are compared for the vehicle occupants with present and the new
model. It is demonstrated that the new B-Pillar composite model with carbon may be
more effective than the present steel pillar.
vii
TABLE OF CONTENTS
Chapter Page
1. INTRODUCTION……………………………………………………………………...1
1.1 Motivation……………………………………………………………………...1
1.2 Crash worthiness…………….……………………............................................1
1.2.1 Composite materials in crashworthiness…………………………… …..3
1.3 Crash Statistics………………………….……………………..……………….5
1.4 Test Methodologies…………………………….. ……………………………..6
1.4.1 Quasi-Static Testing………………………………..………………...…..6
1.4.2 Dynamic Collision Test (FMVSS 214)...………………...……………...7
1.4.3 Composite test procedure (CTP) for vehicle side impact testing………..7
1.4.4 Impact Testing……………………………………..…………………….8
1.4.5 Crushing Modes and Mechanisms………………..…………………….. 8
1.4.5.1 Catastrophic Failure Mode…..………….……………………...9
1.4.5.2 Progressive Failure Modes…………………………….……….9
1.4.5.3 Transverse Shearing or Fragmentation Mode…………….……9
1.4.5.4 Lamina Bending or Splaying Mode…………….…………….10
1.4.5.5 Brittle Fracturing…………………………….………………..11
1.4.5.6 Local Buckling or Progressive Folding…………….…....…...11
1.5 Injury Criteria……………….……………………..….………………….......13
1.5.1 Head Injury Criterion (HIC)…...………………..……………………...13
1.5.2 Thoracic Trauma Index (TTI)……………………………..……………14
1.5.3 Viscous Injury Response (VC)…………………………... .…………...15
1.6 NHTSA/ Standard…………………………………………………………….15
1.7 B-Pillar………………………………………………………………...……...17
2. OBJECTIVE AND METHODOLOGY ....................................................................... 19
2.1 Objective………………………………………………………...……………19
2.2 Methodology……………………………………………………...…………..19
3. LITERATURE REVIEW..............................................................................................22
3.1 Energy Absorbed Per Unit Mass…………………………………...…………23
3.2 Energy Absorbed Per Unit Volume………………………………...………...23
3.3 Energy Absorbed Per Unit Length…………………………………...……….23
3.4 B-Pillar and Side impact Beam………………………………………...……..24
3.5 Composites Materials…………………………………………………...…….25
3.5.1 Composite in automobile parts…………………………………………25
3.5.2 Impact damage response on composite materials……………………...26

viii
TABLE OF CONTENTS (Continued)
Chapter Page
3.5.2.1 Matrix Cracking..........................................................................26
3.5.2.2 Delamination...............................................................................27
3.5.2.3 Fiber Breakage............................................................................27
3.5.3 Energy absorption in various composite materials..................................27
3.5.4 Properties effecting energy absorption of composite material................28
3.5.4.1 Fiber............................................................................................28
3.5.4.2 Matrix Material...........................................................................31
3.5.4.3 Fiber & Matrix Combination………………………….……….32
3.5.4.4 Effect of orientation & lay-up…………………………….……33
3.5.4.5 Effect of Geometry………………………………………….…33
4. COMPUTER AIDED ENGINEERING TOOLS……………………………………..35
4.1 MSC PATRAN……………………………………….……………………….35
4.2 LS-Dyna……………………………………………………………………….36
4.3 MADYMO…………………………………………………………………….38
4.4 EASI CRASH DYNA (ECD)…………………………………………………40
4.4.1 Pre-processing features…………………………………………………..40
4.4.2 Post-processing features………………………………………………….40
4.5 Easi-Crash Mad………………………………………………………………..41
5. SECTION MODELLING AND ANALYSIS OF B-PILLAR IMPACT WITH
SPHERE……………………………………………………………………………… 42
5.1 Design of B-Pillar………………………...………………………………..…42
5.2 Impactor………………………………………………………………………44
5.3 Analysis of B-Pillar with sphere……………………………………………...45
5.4 Displacements of the B-Pillar……………...…………………………………49
6. SIDE IMPACT MODELING AND ANALYSIS OF B-PILLAR IN A SEDAN ……51
6.1 Finite element study of Ford Taurus……………...…………………………..51
6.2 Impactor Modeling…………………………………...……………………….53
6.3 Side-Impact Analysis…………………………...…………………………….55
6.3.1 LS-Dyna simulation……………………………………………………...55
6.4 Orientation………………………………………………………...………….57
6.5 Thickness……………………………………………...……………………...59
6.6 Analysis of B-Pillar……………………….…………………………………..59

ix
TABLE OF CONTENTS (Continued)
Chapter Page
6.6.1 FMVSS Test……………….…………………….……………………..60
6.6.2 Simulation of side impact with the present B-Pillar……….……….…..60
6.6.3 Simulation of side impact crash with composite B-Pillar…….………..61
6.6.4 Results and Discussions………………………………………..…….…62
7. OCCUPENT BIODYNAMIC MODELLING AND POTENTIAL INJURY..……….66
7.1 Madymo Modelling………….……………………………………..………...66
7.2 Simulation…………………….……………………………………..………..66
7.3 Dummy features………………………………………………………………70
7.3.1 Head and neck……………………………………………………………70
7.3.2 Upper torso……………………………………………………………….70
7.3.3 Lower torso………………………………………………………………71
7.4 Simulation…………………………………………………………………….72
7.5 Potential injuries……………………………………………………………...75
8. CONLCUSIONS AND FUTURE WORK……………………………………………79
8.1 Conclusions……………………………………………………...……………79
8.2 Future work……………………………………………………...……………80
REFERENCES…………………………………………………………………………..81
APPENDIX A……………………………………………………………………………84

x
LIST OF FIGURES
Figure Page
1. Crash Types……………………………………………………………………….5
2. Comparison of frontal and side impact crash…......................................................6
3. Fragmentation Crushing Mode…………………………………………………..10
4. Splaying Crushing Mode………………………………………………………...11
5. Brittle Fracturing Crushing Mode………………………………………….…….12
6. Progressive Crushing Mode……………………………………………………...12
7. FMVSS 214 Test Configuration………………………………………………....16
8. B-Pillar………………...………………………………………………………....18
9. Methodology…...……...………………………………………………………....20
10. Specific Energy Of Different Material…………………………………………..28
11. B-Pillar…………………………………………………………………………...42
12. Sphere.…………………………………………………………………………...44
13. B-Pillar Section Model with Sphere……………………………………………..46
14. Fringe Levels For B-Pillar…………………………………………………….....47
15. Internal Energy v/s Time for different materials………..……………………….48
16. Displacement of the B-Pillar…………………………………………………......49
17. Force v/s Displacement for Different materials……………………………….....50
18. Ford Taurus Model………………………………………………………………52
19. FEM Model of MDB…………………………………………………………….53
20. Specification of MDB……...……………………………………………………54

xi
LIST OF FIGURES (Continued)
Figure Page
21. Dimensions of Moving Deformable Barrier (MDB)…………………………….55
22. Animation sequence of a side-impact crash analysis………………………….…56
23. Force v/s Displacement for different orientations…………………………….…58
24. Deformation in the present B-Pillar……………………………………………....60
25. Deformation in the composite B-Pillar…………………………………………...61
26. Force vs. Displacement for different materials…………………………..…….…62
27. Energy vs. time for different materials……………………………………….…..63
28. Displacement at the center of gravity………………………………………….....64
29. Acceleration of B-Pillar…………... ...………………………………………...…65
30. Ellipsoidal dummy models…………….……………………………………..…..67
31. Hybrid III 50th percentile side impact dummy……………………………….…...68
32. Rear and left side view of dummy……………………………………………......68
33. Loading and Unloading curve for the FE belt………………………………..…..72
34. Dummy merged with car……………………………………………………....…73
35. Animation sequence of an impact analysis…………………………………....….74
36. Head Acceleration…………………………………………………………..….....75
37. Thorax Spine Acceleration…………………………………………………...…..76
38. Pelvis Acceleration…………………………………………………………....….76

xii
LIST OF TABLES
Table Page
1. Specific Energy Absorption of different Composite materials…………………….29
2. Physical properties of different fibers types…………………………………….....31
3. Mechanical Properties of resin systems………………………………………...….32
4. Properties of B-Pillar………………………………………………………………44
5. Properties of sphere...………………………………………………………………45
6. Specific Energy absorption of different materials……………….….……………..48
7. Finite element summary of Ford Taurus………………………………………..…52
8. Summary of MDB……………………………………………………….….…..…54
9. Energy absorption of different materials…………………………………..…..…..63
10. Weight table…….……………………………………………………….….…...…54
11. Segmental weights……………………………………………………….….…..…54
12. External dimension for the Hybrid III 50th percentile male………………….….…71
13. Injury ratings……………………………………………………………………….77
14. Injury criteria’s calculated for the side impact crash………………………..…..…77
15. Glass fiber properties…………………………………………………..……...…...85
16. Carbon properties…………………………………………………….………….....86

xiii
LIST OF SYMBOLS
ρ Density of the structure material
σ Average collapse shear
δ Deformed length
F Average collapse load
Ѡ Angular velocity
Vnode Nodal velocity
Vcm Velocity at the center of mass
Viscosity coefficient
G Elastic shear modulus
λ Strain rate

1
CHAPTER 1
INTRODUCTION
1.1 Motivation
Development of automotive structures to sustain impact loading in diverse crash
conditions such as, frontal perpendicular, angular, offset, pole impacts and side collisions
are required. In addition, other non-crash functional requirements, such as, vibration,
durability and fatigue life cycle are also integral part of vehicle design. However, with
growing focus on safety new vehicles are expected to be crash tested under newer and
more demanding crash conditions, such as, the vehicle-to-vehicle 30-degree oblique
offset impact under consideration by National Highway Traffic Safety Administration
[1]. This shift may result into body structure designs with higher strength, stiffness and
higher mass. At the same time environmental and fuel economy requirements dictate that
vehicle design be lighter and compact resulting in smaller crush space. When crush space
is limited, the body structure, typically designated to dissipate major share of impact
energy, require thicker sheet metal and/or higher strengths alloys translating to added
weight.
1.2 Crashworthiness
The ability of the vehicle to absorb energy and to prevent occupant injuries in the
event of an accident is referred to as “Crashworthiness” [2]. The vehicle must be
designed such that, at higher speeds its occupants do not experience a net deceleration
greater than 20 g. Crashworthiness can be categorized into three basic areas, materials
engineering and design, combustion and fire and finally medical engineering
(biomechanics). It covers civil, automotive, military, marine and aerospace oriented

2
applications, where the automotive sector is probably the most prominent area in this
respect. Crashworthiness features includes air bags, seat belts, crumple zones, side impact
protection, interior padding and headrests. These features are updated when there is a
new safer and better design [2].
Crashworthiness is not the same as vehicle safety, and the two topics must be
distinguished. The safety of a vehicle depends on crashworthiness and as well as the
accident avoidance features, which might include ABS, good handling characteristics, or
even oversize tires. One vehicle might be safer statistically than another and still have a
significant crashworthiness defect. It could even conceivably be less crashworthy overall
while still being a "safer" vehicle.
Structural crashworthiness involves absorption of kinetic energy by considering
designs and materials suitable for controlled and predictive energy absorption. In this
process, the kinetic energy of the colliding bodies is partly converted into internal work
of the bodies involved in the crash. Crash events are non-linear and may involve material
failure, global and local structural instabilities and failure of joints. In addition, strain-rate
and inertia effects may play an important role in the response of the structures involved.
Crashworthiness of a material is expressed in terms of its specific energy
absorption, Es= F/D, where D is the density of the composite material and F is the mean
crush stress. In order to protect passengers during an impact, a structure based on strength
and stiffness is far from being optimal. Rather, the structure should collapse in a well-
defined deformation zone and keep the forces well below dangerous accelerations.
However, since the amount of absorbed energy equals the area under the load deflection
curve, the two above mentioned criteria are somewhat contradictory, thus showing that, it

3
is not only important to know how much energy is absorbed but also how it is absorbed,
i.e., how inertia loads are transferred from impact point to panel supports. Therefore, in
addition to designing structures able to withstand static and fatigue loads, structures have
to be designed to allow maximum energy absorption during impact.
1.2.1 Composite Materials in Crashworthiness
The fuel efficiency and gas emission regulation of the car are also very important
in the contemporary world. Every day the price of the fuel and the requirement of the fuel
is increasing randomly, eventually emission of chemicals from the vehicle exhaust
pollute the environment and increase the global temperature [3]. Composite materials
help in reducing the weight of the structure thus bringing down the fuel used.
Composites are engineered materials that have been designed to provide
significantly higher specific stiffness and specific strength (stiffness or strength divided
by material density)—that is, higher structural efficiency—relative to previously
available structural materials. In composite materials, strength and stiffness are provided
by the high-strength, high-modulus reinforcements.
Composite materials offer a high potential for tailored designs by a wide variety
of matrices and fibers, various performs, and laminate architecture; i.e. fiber orientation
and stacking sequence of single laminate. Composite materials also have a considerable
potential for absorbing kinetic energy during crash [6]. The composite energy absorption
capability offers a unique combination of reduced structural weight and improved vehicle
safety by higher or at least equivalent crash resistance compared to metal structures.
Crash resistance covers the energy absorbing capability of crushing structural parts as

4
well as the demand to provide a protective shell around the occupants (structural
integrity) [3].
In the last decade, several studies have demonstrated the ability of composite
materials to absorb energy under crashworthy conditions. Some of the energy absorbing
composite materials structural concepts that have been studied experimentally, especially
for this application, include honeycomb sandwich, sine wave web and foam filled
stiffened beams. Effects of various material characteristics like ply orientation, stacking
sequence, fiber and matrix properties have been investigated and reported. However,
different fiber/matrix systems and different geometrical shapes produce substantially
different crushing response [6]. Moreover, due to the complex failure behavior, energy
absorption and crush/crash behavior of composite structures, there has been a lack of
experience when compared with the metallic structures. In this context, extensive tests
are typically used to guarantee the crashworthiness of composite structures and to
understand the mechanism of energy absorption and failure. The specific energy
absorption, post-crushing integrity and energy release of the candidate materials must be
known to match specific design requirements. The specific energy absorption for
composites is a function of material properties constituting their fiber and matrix, as well
as their ply orientation, whereas for metals it is primarily a function of only their plastic
behavior. To a limited extent, specimen geometry and material property effects have been
reported.
The cost of conducting a crashworthy structure development program is high and
as a reason the use of Finite Element Analysis for simulating the response of composite
structures under impact and crash loads is preferred. To date, finite element analyses of

5
composite structures for crashworthiness rely heavily on experimental data. This means
that the testing of composite structures or specimens will continue for determining energy
absorption behavior [6].
Similarly, due to the high cost and high computational time involved in modeling
large structures, finite element analysis is carried out for simulating the crash response of
semi-scale structures and specimens. Hybrid finite element models are used to conduct
crash analysis of full-scale structures and, to compensate the high computational time.
1.3 Crash Statistics
In the present day accidents happen every hour around the world and most of
these are very dangerous. Side-Impact crash is the second most severe crash scenario
after frontal-impact. Figure 1 shows the comparison of different crash scenarios involved.
It can be observed that the frontal impact is higher than the side-impact. However, the
space required for any structure in the event of a side-impact to absorb energy is very less
than the frontal-impact. The occupant injuries in the side-impact crash are severe when
compared with the frontal crash. Other crashes involved are the rollover and rear impact.
These amounts to a lesser crash scenario than the side or the frontal crash [4].
Figure 1. Crash types [4]

6
Many researchers have carried out extensive study on frontal and side impact
crash analysis and have been successful in reducing the risk of the injuries sustained by
the occupant. From figure 2, it can be seen that over the past two decades the research on
frontal impact has helped in reducing injuries, however, the injuries involved in the event
of a side impact crash has increased [4].
Figure 2. Comparison of frontal and side impact crash [4]
1.4 Test Methodologies
There are different methodologies that can be carried out in a crash test [6].
1.4.1 Quasi-static Testing
In quasi-static testing, the test specimen is crushed at a constant speed. Quasi-
static tests may not be an actual simulation of the crash condition because in an actual
crash condition, the structure is subjected to a decrease in crushing speed, from an initial
impact speed, finally to rest.
The following are some advantages of quasi-static testing.
• Quasi-static tests are simple and easy to control.

7
• To follow the crushing process, Impact tests require very expensive
equipment, as the whole process occurs in a split second. Hence, quasi-static tests
are used to study the failure mechanisms in composites, by selection of
appropriate crush speeds.
The following is a major disadvantage of quasi-static testing.
• Quasi-static tests may not be a true simulation of the actual crash conditions
since certain materials are strain rate sensitive.
1.4.2 Dynamic Collision Test (FMVSS 214)
In this test procedure, a deformable barrier mounted on a sled impacts a car side
door angularly. That is, all four wheels of the barrier-sledge are inclined at an angle of
27°. In the front, an aluminum honeycomb barrier is fixed and this is at the height of the
bumper so that the real simulation of crash is simulated. Inside the vehicle, a US-Side
Impact Dummy is placed on the front seat and this dummy measures the Injury levels
sustained [9].
1.4.3 Composite Test Procedure (CTP) for Vehicle Side Impact Testing
As the terminology could imply, this test procedure is not only for a composite.
This test starts with the displacement of the barrier into the side of the vehicle until the
inner door is in contact with the dummy. At this point, the barrier face is half in this
position until the inner wall of the door is loaded using the body forms. Sufficient force-
deflection data is obtained for the computer model [10]. After full retraction of the body
forms, the barrier face is then deformed further into the side structure of the vehicle and
unloaded. Once again, the amount of intrusion is such that suitable force-deflection
characteristics of the vehicle side structure ate obtained.

8
1.4.4 Impact Testing
The crushing speed decreases from the initial impact speed to rest as the specimen
absorbs the energy.
The following is a major advantage of impact testing
• It is a true simulation of the crash condition since it takes into account the stress
rate sensitivity of materials.
The following is a major disadvantage of impact testing.
• In Impact testing, the crushing process takes place in a fraction of a second.
Therefore, it is recommended that crushing be studied with high-speed camera
[4].
1.4.5 Crushing Modes and Mechanisms
1.4.5.1 Catastrophic Failure Modes
Catastrophic failure modes are not of interest to the design of crashworthy
structures. This type of failure occurs because of the following events:
� When unstable intralaminar or interlaminar crack growth occurs.
� In long thin walled tubes because of column instability.
� In tubes composed of brittle fiber reinforcement, when the lamina bundles do
not bend or fracture due to interlaminar cracks being less than a ply thickness.
Catastrophic failure is characterized by a sudden increase in load to a peak value
followed by a low post failure load. When unstable interlaminar or interlaminar growth
occurs, there is a catastrophic failure. As a result of this, the actual magnitude of energy
absorbed is much less and the peak load is too high to prevent injury to the passengers
[2].

9
1.4.5.2 Progressive Failure Modes
Progressive failure can be achieved by providing a trigger at one end. This
initiates a failure at a specific location within the structure. The most widely used method
of triggering is to chamfer one end of the tube. A number of trigger geometries such as
bevels, grooves and holes that have been investigated in laboratory specimens are not as
easy to use in vehicle structures
The following are the advantages of progressive failure in the design of
crashworthy structures.
� The energy absorbed in progressive crushing is larger than the energy absorbed
in catastrophic failure.
� A structure designed to react to loads produced by progressively failing energy
absorbers are lighter than structures designed to react to loads produced by
catastrophically failing energy absorbers [2].
The following are the different types of progressive failure modes:
1.4.5.3 Transverse Shearing or Fragmentation Mode
� The fragmentation mode is characterized by a wedge-shaped laminate cross
section with one or multiple short interlaminar and longitudinal cracks that form
partial lamina bundles (Figure 3).
� Brittle fiber reinforcement tubes exhibit this crushing mode.
� The main energy absorption mechanisms is fracturing of lamina bundles.
� When fragmentation occurs, the length of the longitudinal and interlaminar
cracks is less than that of the lamina which helps in the transverse shearing or
fragmentation mode.

10
� Mechanisms like interlaminar crack growth and fracturing of lamina bundles
control the crushing process for fragmentation [2].
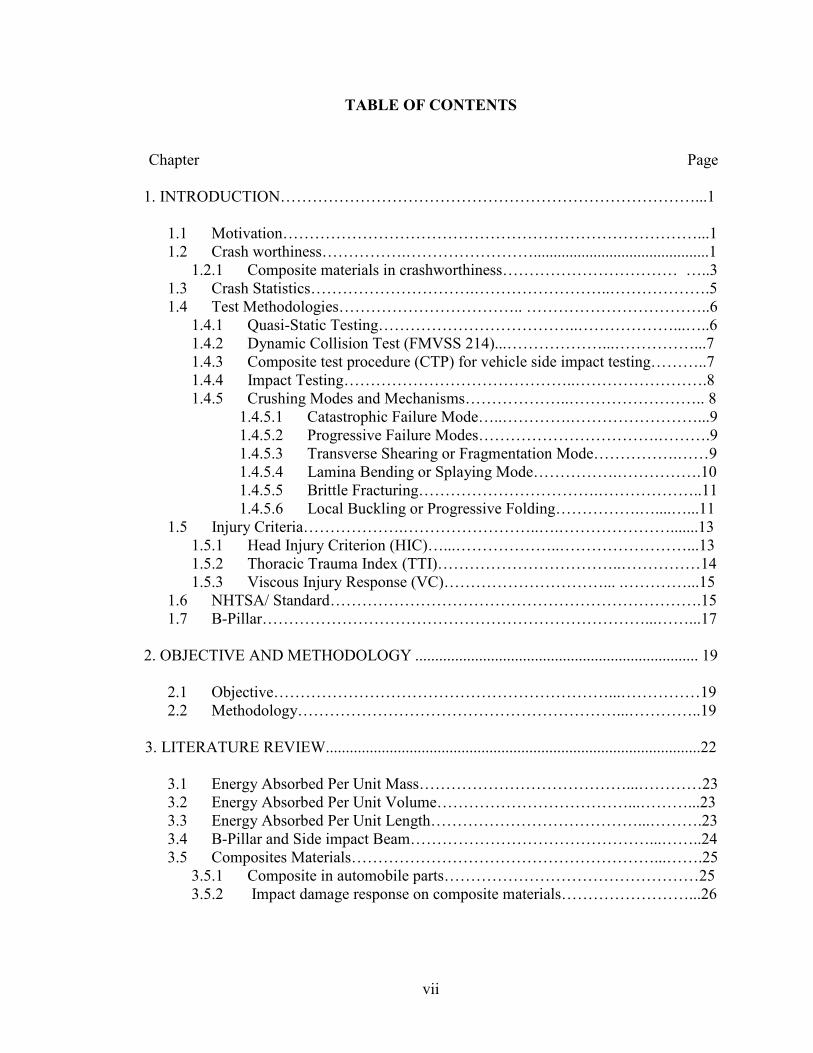
Figure 3. Fragmentation crushing mode [2]
1.4.5.4 Lamina Bending or Splaying Mode
� Very long interlaminar, intralaminar, and parallel to fiber cracks characterizes
the splaying mode. The lamina bundles do not fracture. (Figure 4)
� Brittle fiber reinforcement tubes exhibit this crushing mode.
� The main energy absorbing mechanism is matrix crack growth. Two secondary
energy absorption mechanisms related to friction occur in tubes that exhibit
splaying mode.
� Mechanisms like interlaminar, intralaminar and parallel to fiber crack growth
control the crushing process for splaying.
11
Figure 4. Splaying crushing mode [2]
1.4.5.5 Brittle Fracturing
� The brittle fracturing crushing mode is a combination of fragmentation and
splaying crushing modes (Figure 3).
� Brittle fiber reinforcement tubes exhibit this crushing mode.
� The main energy absorption mechanism is fracturing of lamina bundles.
� When brittle fracturing occurs, the lengths of the interlaminar cracks are
between 1 and 10 laminate thickness.
1.4.5.6 Local Buckling or Progressive Folding
� The progressive folding mode is characterized by the formation of local
buckles (Figure 4).
� This mode is exhibited by both brittle and ductile fiber reinforced composite
material.
� Mechanisms like plastic yielding of the fiber and/or matrix control the
crushing process for progressive folding [2].

12
Figure 5. Brittle fracturing crushing mode [5]
Figure 6. Progressive crushing mode [5]

13
1.5 Injury Criteria
An injury criterion can be defined as a biomechanical index of exposure severity,
which indicates the potential for impact induced injury by its magnitude. There are
several kinds of injury criteria’s that are related to the human body. These are basically
the impact loads acting on the human body. Some of the criteria’s pertinent to the Side
Impact are discussed here.
1.5.1 Head Injury Criterion (HIC)
The Head Injury Criteria is defined as:
( ) ( )12
5.2
1221
2
1
1
0
maxttdttR
ttTEttTHIC
t
t
−
−<<<= ∫ (1.1)
where T0 = start time of simulation
TE = end time of simulation
R(t) = is the resultant head acceleration in g’s measured at head’s center of gravity
over the time interval TEtT 0 <<
t1 and t2 are the initial and final times (in sec) of the interval during which the HIC
attains a maximum value [16].
A value of 623 is specified as good for the HIC as concussion tolerance level in
side (contact) impact. Table 13 shows the injury ratings according to insurance institute
for highway safety. For practical reasons, the maximum time interval t2-t1 that is
considered to give appropriate head injury criteria values was set to 36 ms. This time
interval greatly affects the head injury criteria calculations, and recently this time interval
has been proposed to be further reduced to 16 ms in order to restrict the use of HIC to
hard head contact impacts.

14
1.5.2 Thoracic Trauma Index (TTI)
The TTI is the acceleration criterion based on accelerations of the lower thoracic
spine and the ribs. The thoracic trauma index (TTI) provides an indication of the severity
of injuries received by motor vehicle occupants in side-impact collision environments. It
is the method of quantifying the anatomical extent of the injury, which includes injuries
to intrathoracic organs. The TTI can be used as an indicator for the side impact
performance of passenger cars. The specific benefit of the TTI is that it can be used to
address the entire population of vehicle occupants because the age and the weight of the
cadaver are included. The TTI is defined by Morgan: [24]
( ) MSTDMASSTRIBAGETTI g *12*5.0*4.1 ++= (1.2)
Where AGE = age of the test subject in years,
RIBg = maximum absolute value of acceleration in g’s of the 4th and 8
th rib on the struck
side,
T12g = maximum absolute acceleration values in g’s of the 12th thoracic vertebra, in
lateral direction,
MASS = test subject mass in kg
MSTD = standard reference mass of 75 kg.
There is also a definition for the TTI that could be used for dummies without a specific
age, called the TTI (d). It is defined for 50th percentile dummies with a mass of 75 kg:
( ) ( )gg TRIBdTTI 12*5.0 += (1.3)
The dynamic performance requirement, as stated in FMVSS 214 regulations of 1990, is
that the TTI (d) level shall not exceed 85 g for passenger cars with four side doors and 90
g for two side doors.
15
1.5.3 Viscous Injury Response (V*C)
The Viscous Response, denoted as V*C (3), is the maximum value of a time
function formed by the product of velocity of deformation (V) and the instantaneous
compression function (C): [16]
( ) ( )
=SZ
tD
dt
tdDmaxC*V (1.4)
where D (t) is deflection and SZ is prescribed size (the initial torso thickness for frontal
impacts or half the torso width for side impacts). Analysis of data from experiments on
human cadavers show that a frontal impact which produces a V*C value of 1m/s has a
50% chance of causing severe thoracic injuries (AIS ≥ 4).
1.6 NHTSA/Standard
The National Highway Traffic Safety Administration (NHTSA), under the
U.S. Department of Transportation, was established by the Highway Safety Act of 1970,
as the successor to the National Highway Safety Bureau, to carry out safety programs
under the National Traffic and Motor Vehicle Safety Act of 1966 and the Highway Safety
Act of 1966. The Vehicle Safety Act has subsequently been recoded under Title 49 of the
U. S. Code in Chapter 301, Motor Vehicle Safety. NHTSA also carries out consumer
programs established by the Motor Vehicle Information and Cost Savings Act of 1972,
which has been recoded in various Chapters under Title 49. NHTSA is responsible for
reducing deaths, injuries and economic losses resulting from motor vehicle crashes. This
is accomplished by setting and enforcing safety performance standards for motor vehicles
and motor vehicle equipment, and through grants to state and local governments to enable
them to conduct effective local highway safety programs. NHTSA investigates safety
defects in motor vehicles, sets and enforces fuel economy standards, helps states and a

16
local community reduce the threat of drunk drivers, promote the use of safety belts, child
safety seats and air bags, investigate odometer fraud, establish and enforce vehicle anti-
theft regulations and provides consumer information on motor vehicle safety topics.
NHTSA also conducts research on driver behavior and traffic safety, to develop the most
efficient and effective means of bringing about safety improvements.
Federal Motor Vehicle Safety Standard (FMVSS) 214 (Figure 7), “Side Impact
Protection” was amended in 1990 to assure occupant protection in a dynamic test that
simulates a severe right-angle collision. It is one of the most important and promising
safety regulation issued by the National Highway Traffic Safety Administration
(NHTSA). It was phased into new passenger cars during model years 1994-97. In 1993,
side impacts accounted for 33 percent of the fatalities to passenger car occupants [9].
Figure 7. FMVSS 214 test configuration [9]

17
� A test configuration using a Moving Deformable Barrier (MDB) simulating a
severe intersection collision between two passenger vehicles.
� Injury criteria, Thoracic Trauma Index (TTI) that predicts the severity of thoracic
injuries when occupant’s torsos contact the interior side surfaces of a car.
� A Side Impact Dummy (SID) on which TTI could be reliably measured in side
impact tests. The injury score measured on the dummy is called TTI.
� The new FMVSS 214, allowing TTI upto 90 in 2-door cars and 85 in 4-doors
cars.
The Government Performance and Results Act of 1993 and Executive Order
12866 require various agencies and automobile manufacturers to evaluate their existing
programs and regulations. The objectives of an evaluation are to determine the actual
benefits – lives saved, injuries prevented, and damages avoided – and costs of safety
equipment installed in production vehicles in connection with a rule [9].
1.7 B-Pillar
B-pillars are one of the most sophisticated parts of the automobile body, because
this component has to comply with lot of requirements and specifications. Figure 8 shows
the position of B-Pillar in a car. There are 2 parts in the B-Pillar, one is the outer layer
and the other is the inner layer. These two layers are made of steel and they are welded
together [12]. The distance between the B-Pillar and the occupant is very less in side
impact when compared to the frontal impact. In addition, when the impact occurs, the B-
Pillar or structures in the B-Pillar have to absorb more energy with minimal acceleration.
Since the distance between the B-Pillar and the occupant is very less care has to be taken
in the design and manufacture of the B-Pillar. Safety is the main concern in this design.

18
Figure 8. Position of B-Pillar in a car
For the structural analysis of the B-Pillar, Finite Element Method was used since
it is the most widely used computational method in the automotive industry.
Steel is still used as the material for this component. However, lighter materials
such as the Fiber Reinforced Plastics (FRP) are initiated in the automotive industry. FRP
can be used as a substitute for steel for this component as they offer higher energy
absorption than the steel. As discussed earlier Composites have high strength and
stiffness-to-weight ratio in the fiber direction and as well as the in the direction
perpendicular to the fiber even though their Young’s Modulus is lesser than the steel.
This means that the composites have an increased thickness than the steel and larger
second moment of inertia to reduce the effect of elastic bending. There are also some
disadvantages of composites, which includes higher production and tooling costs,
whereas processing of the complex parts in one piece is much easier. Also, by using
composites as the materials for the B-Pillar, reduction in weight can be observed which
lead to lesser fuel consumption.

19
CHAPTER 2
OBJECTIVE AND METHODOLOGY
2.1 Objective
In this study, the objective is to model and analyze a composite B-Pillar instead of
the present steel pillar and thus reducing the injuries sustained by the occupant. Efforts
are made to reduce the weight of the car without sacrificing the safety of the occupant. As
per the crashworthiness standards, which require minimal displacement and higher
energy absorption, the use of composite in the safety B-Pillar is proposed and the efficacy
of the B-Pillar designed is studied.
There are several areas in the field of crash-impact dynamics that need to be
studied to improve the crashworthy design of the B-Pillar. To date, there have been many
contributions in understanding and analysis of the energy absorption characteristics. In
this study, Finite Element Method is used as an alternative method in studying the energy
absorption of a B-Pillar. In addition, one can try to physically understand the behavior by
conducting full-scale crash simulations. This is the best possible method, but this is again
a very expensive method and can provide information for only a few limited impact
conditions and design.
2.2 Methodology
In a crash condition, bending load and progressive crushing absorb most of the
crash- related kinetic energy. Structures have to be designed such that they perform the
dual role of reacting to both bending loads and progressive crushing in a crash. An
attempt is made in this study to composite model a B-Pillar would reduce the injuries
sustained by the occupant.

20
Figure 9. Methodology
B-Pillar
Original Model
Composite Modeling
Parametric study on B-Pillar to find
out material thickness and orientation
FMVSS 214
Energy absorption and Accelerations are
recorded
Madymo Modeling
Optimization
Intrusion of the B-Pillar
Occupant injury calculation

21
Lately, due to the merits of convenience in fabrication, crushing stability and high
energy absorbing capability, fiber reinforced composites and their tubular structures have
been widely used in vehicles and aircraft.
From figure 9 methodology carried out in this research is depicted.
� This study starts with the composite modeling of car B-pillar where in the B-Pillar
is totally made of composite which had proved out to be very efficient.
� Parametric study is carried out on the B-pillar, which included changing the
material, layers, orientation and thickness. In order for the B-Pillar to be more
energy absorbing these factors are considered.
� Finally, the maximum energy sustained by the B-pillar with the pertinent material,
layers orientation and thickness is used for composite modeling. The maximum
energy is found out as for the safety of the occupant.
� Intrusion of the B-Pillar is studied.
� Simulation is carried out according to Federal Motor Vehicle Safety Standards
(FMVSS) 214 test specifications. These are the standards used for the side impact
in a sedan.
� Energy absorption and Accelerations is note down for all the cases and the best
energy absorption material is used.
� A Hybrid III 50th percentile side impact dummy is placed in the car. This dummy
model created is merged into the car using Easy Crash Dyna.
� Finally, the acceleration pulse values are input to the Madymo model and
Injuries sustained by the dummy were compared.
22
CHAPTER 3
LITERATURE REVIEW
Over the past, crashworthiness has been a growing realization of importance in
virtually every transportation sector. Newer designs are proposed every day to improve
the crashworthiness of the structure. There is no end in the field of crashworthiness in
reducing the injuries sustained by the occupant [3]. It is preferable to design a vehicle to
collapse in a controlled manner, thereby ensuring the safe dissipation of kinetic energy
and limiting the seriousness of injuries incurred by the occupants.
Use of composites as discussed earlier has increased dramatically over the last
few decades. Fiber-reinforced composite materials are characterized by specific stiffness
and strength exceeding that of similar metal structures. The prediction of damage to
structures caused by accidental collision – whether to automobiles, offshore installations
or simply the packaging around an electrical appliance is a crucial factor in the design.
With emphasis on light weight vehicles, the use of composite materials in aerospace and
automotive structures has created a need to further understand the energy absorption
characteristics of composite materials.
Several studies have demonstrated the ability of composite materials to absorb
energy under crashworthy conditions [5]. Car safety, gas emission and weight reduction
which are the important needs in the design of a car structure are directly influenced by
the efficient design and increased use of composite materials. These materials can absorb
more deformation and composite materials have high specific strength and high specific
stiffness. Composites are lightweight and the manufacturing can be done at a low cost.
They also have very high impact load absorbing and damping properties.

23
3.1 Energy Absorbed Per Unit Mass.
The energy absorbed per unit mass, or specific energy absorption, E, is defined as
the energy absorbed by crushing E, per unit mass of deformed structure. Using the
notation of Fig, this can be written as [7]:
E S = matA
E
ρδ=
matA
Fdx
ρδ
δ
∫0 (3.1)
For the ease of analysis, Eq.3.1 is often estimated using an average collapse
load,F or an average collapse stressσ . This approximate E s , given in Eq 3.2 is
sometimes known as specific sustained crushing stress .
E S ≈matA
F
ρ=ρσ (3.2)
Specific energy absorption is an especially useful measure for comparing the
energy absorption capabilities of different materials for structures in which weight is an
important consideration.
3.2 Energy Absorbed Per Unit Volume.
The energy absorbed per unit volume will be of interest in situations in which the
space available for energy absorption deformation zone or device is in some way
restricted [7]. It may also be appropriate when mechanisms other than deformation of the
parent material contribute significantly to a structure’s overall energy absorption
capability.
3.3 Energy Absorbed Per Unit Length.
The energy absorbed per unit length, LE from Eq.3.3 is defined as the energy
absorbed per unit of deformation distance. This can be expressed as;
24
LE =δE (3.3)
The energy absorbed per unit length provides a convenient and easily measured
way of quantifying the crashworthiness of structures where collapse is restricted to a well
defined crumple zone [10]. A relatively straightforward crashworthiness specification
such as this allows for the ready verification of structures with appropriate test
procedures or finite element simulation.
It can therefore be seen that the choice of the most suitable normalized energy
absorption parameter for a given circumstance will depend upon the material and
geometry of the crushed structure, as well as particular application under consideration.
3.4 B-Pillar And Side-Impact Beam
B-pillars are one of the most sophisticated parts of the automobile body, because
this component has to comply with lot of requirements and specifications. There are 2
parts in the B-Pillar, one is the outer layer and the other is the inner layer. These two
layers are made of steel and they are welded together [12]. The distance between the B-
Pillar and the occupant is very less in side impact when compared to the frontal impact.
Federal Motor Vehicle Safety Standards (FMVSS) No. 214 establishes the
minimum strength required for side doors of passenger cars. The side doors must be able
to withstand an initial crush resistance of at least 2,250 pounds after 6 inches of
deformation, and intermediate crush resistance of at least 3,500 pounds (without seats
installed) or 4,375 pounds (with seats installed) after 12 inches of deformation. A peak
crush resistance of two times the weight of the vehicle or 7,000 pounds whichever is
less(without seat installed) or 3-1/2 times the weight of the vehicle or 12,000 ponds
whichever is less(with seats installed) after 18 inches of deformation [9].

25
3.5 Composites Materials
3.5.1 Composite in automobile parts
Increasing legal and market demands for safety, the weight of the car body will
most likely increase in the future. At the same time, environmental demands will become
stronger and lower weight will play an important part in meeting them. In the European
Union, the car manufacturers have agreed to an overall 25% increase in fuel efficiency by
the year 2005 compared to 1990 [10].
Fuel efficiency of the vehicle directly depends on the weight of the vehicle. The
carbon fiber composite body structure is 57% lighter than steel structure of the same size
and providing the superior crash protection, improved stiffness and favorable thermal and
acoustic properties [15].
Composite materials may find the exciting opportunity in the automotive industry
as a means of increasing fuel efficiency. With 75 percent of fuel consumption relating
directly to vehicle weight, the automotive industry can expect an impressive 6 to 8
percent improvement in fuel usage with mere 10 percent reduction in vehicle weight.
This translates into reduction of around 20 kilogram of carbon dioxide per kilogram of
weight reduction over the vehicle’s lifetime. [17]
Even structural parts like self-supporting car side doors play a role in contributing
to the weight reduction without compromise to the existing requirements and will be a
cost competitive challenge for future vehicle components. When compared to the
passenger car side doors made out of deep drawn steel-sheets, FRP car side doors offer
many potential advantages, better NVH-behavior, low specific weight, higher energy
26
absorption capabilities, and potential of functional integration combined with low
production costs [5] .
For the first time FRP’s were introduced to the formula-1 in 1980 by McLaren
team. Since then the crashworthiness of the racing cars has improved beyond all
recognition. Carbon fiber composite has been used to manufacture the body, which is low
weight, high rigidity and provided the high crash safety standards. [2]
The report from the United states and Canada predicted that plastics and
composites would be widely used applied to body panels, bumper systems, flexible
components, trims, drive shaft and transport parts of cars. In addition, rotors
manufactured using RTM (Resin Transfer Moldings) for air compressor or superchargers
of cars have been used to substitute for metal rotors which are difficult to machine. [6]
3.5.2 Impact damage response on composite materials
A significant amount of research has focused on investigating the damage,
crashworthiness, and behavior of dynamic loading under impact. Impact damage in
composites occurs when a foreign object causes through the thickness and/or in-plane
fracture in the material. The damaged areas can be investigated visually or by using
optical or electron microscopy, ultrasonic C-scanning, and acoustic imaging.
Impact damage in composite plates is associated with these major failure modes:
delamination, matrix cracking, and fiber breakage. Matrix cracking and delamination are
properties of the resin matrix, whereas the fiber breakage is more responsive to the fiber
specifications and characteristics and is usually caused by higher energy impacts. [10]
3.5.2.1 Matrix Cracking
Matrix cracking in an impacted composite is caused by tensile stress and by
stress concentrations at the fiber-matrix interface. A higher tensile stress results in a

27
longer and denser cracking pattern. The total energy absorbed by matrix cracking is equal
to the product of the surface energy and the small area produced by the crack. Larger
crack areas are normally caused by crack branching, in which case the cracks run in the
direction normal to the general direction of fracture. In many cases, the surface area
created by such cracks is much larger than the area parallel to the primary cracks,
increasing the fracture energy significantly. This, in effect, can increase the toughness of
composites or the total energy of damage absorbed during impact. [11]
3.5.2.2 Delamination
Different orientation of the plies can promote delamination of two adjacent plies
due to the stiffness mismatch at their interface. The delamination areas are influenced
directly by changes in the energy of impact. The cracks, which can initiate delamination,
can propagate through the plies and may be arrested as the crack tips reach the fiber–
matrix interface in the adjacent plies. [5]
3.5.2.3 Fiber Breakage
Fiber breakage can be a direct result of crack propagation in the direction
perpendicular to the fibers. If sustained, the fiber breakage will eventually grow to form a
complete separation of the laminate. Reaching the fracture strain limit in a composite
component results in fiber breakage. For the same impact energy, higher capacity of
fibers to absorb energy results in less fiber breakage and a higher residual tensile
strength. Secondary matrix damage, which occurs after initial fiber failure, is also
reduced allowing residual compressive strength to increase. [19]
3.5.3 Energy absorption in various composite materials
Composites absorb more energy than steel or aluminum. Steel has higher young’s
modulus, yet fails to absorb higher energy absorption. In composites, there are different

28
kinds of fibers having different stiffness. For instance from figure 10, carbon fibers are
stronger than glass, yet glass fiber withstand load for a longer time than carbon fibers.
The energy absorption capability of the composite materials offers a unique combination
of reduced weight and improves crashworthiness of the vehicle structures.
Figure 10. Specific energy of different materials [18]
3.5.4 Properties effecting energy absorption of composite material
In the past, crushing of tube was the method of testing composite specimens and
this was primarily used to determine the energy absorption performance of composite
materials. [7]
3.5.4.1 Fiber
Farley, reports that, in tests conducted on comparable specimens, carbon fiber
reinforced tubes absorb higher energy than those of glass or aramid fibers. This is
supported by the data in Table 1 [19]. The reasons for this are related to the physical
properties of the fibers, overall failure mechanisms and fiber-matrix bond strengths. [2]
Farley observed that glass and carbon fiber reinforced thermoset tubes
progressively crush in fragmentation and splaying modes. Aramid (Kevlar and Dyneema)

29
fiber reinforced thermo set tubes, on the other hand, crush by a progressive folding mode.
Similar results were obtained when impact and static compression tests were carried on
Graphite/epoxy, Kevlar/epoxy and Glass/epoxy composite tube specimens respectively.
The graphite/epoxy and glass/epoxy angle-ply tubes exhibited brittle failure modes
consisting of fiber splitting and ply delamination, whereas the Kevlar/epoxy angle-ply
tubes collapsed in a buckling mode. The lower strain to failure of the glass and carbon
fibers, which fail at about 1% strain, compared to aramid fibers, which fail at about 8%
strain attributes to this difference in behavior. [2]
TABLE 1
SPECIFIC ENERGY ABSORPTION OF DIFFERENT COMPOSITE
MATERIALS [19]
Fiber-Matrix Lay up
Thickness to
diameter
ratio
Specific
Energy
absorption
Carbon-Epoxy [0/±15]3 0.033 99
Carbon-Epoxy [±45]3 0.021 50
Aramid-Epoxy [±45]8 0.066 60
Aramid-Epoxy [0/±15]2 0.02 9
Glass-Epoxy [0/±75]2 0.069 53
Glass-Epoxy [0/±15]2 0.06 30
1015 Steel 0.06 42
6061 Al 0.06 44
Results of static crushing tests of graphite reinforced composite tubes were
conducted to study the effects of fiber and matrix strain failure on energy absorption
helped in drawing the following conclusion: ‘‘To obtain the maximum energy absorption
from a particular fiber, the matrix material in the composite must have a greater strain at

30
failure than the fiber’’. The graphite/epoxy tubes had specific energy absorption values
greater than that of Kevlar/epoxy and glass/epoxy tubes having similar ply constructions.
This is attributed to the lower density of carbon fibers compared to glass and Kevlar
fibers. [19]
Research was done on PEEK matrix composite tubes reinforced with AS4 carbon
fiber, IM7 carbon fiber and S2 glass fiber respectively. The tubes crushed progressively
by the splaying mode. The S2/PEEK tubes displayed approximately 20% lower ES than
the AS4/PEEK and IM7/PEEK tubes though the mean crush stress of S2/PEEK tubes is
comparable to that of AS4/PEEK and IM7/PEEK tubes. This is a direct result of the
lower density of carbon fiber reinforced materials than the glass reinforced material,
since the specific energy absorption is defined as the ratio of the mean crush stress and
density of the composite.
A finite element analysis was carried out to model the crushing process of
continuous-fiber-reinforced tubes by Farley et al. The analysis is compared with
experiments on graphite/epoxy and Kevlar/epoxy tubes. The method obtained a
reasonable agreement between the analysis and the experiment. Thornton et al. examined
the energy absorption capability in graphite/epoxy, Kevlar/epoxy and glass/epoxy
composite tubes. The composite tubes collapsed by fracture and folding mechanisms. The
load–compression curves for the graphite/epoxy and the glass/epoxy tubes had similar
characteristics but the Kevlar/epoxy composite tubes collapsed by buckling. [8]
In addition, it can be observed from Table 2 [10] that the carbon fibers have high
specific energy absorption because of the low density and high strength of the constituent
carbon fibers. If aramid fibers are considered, these have low specific energy absorption
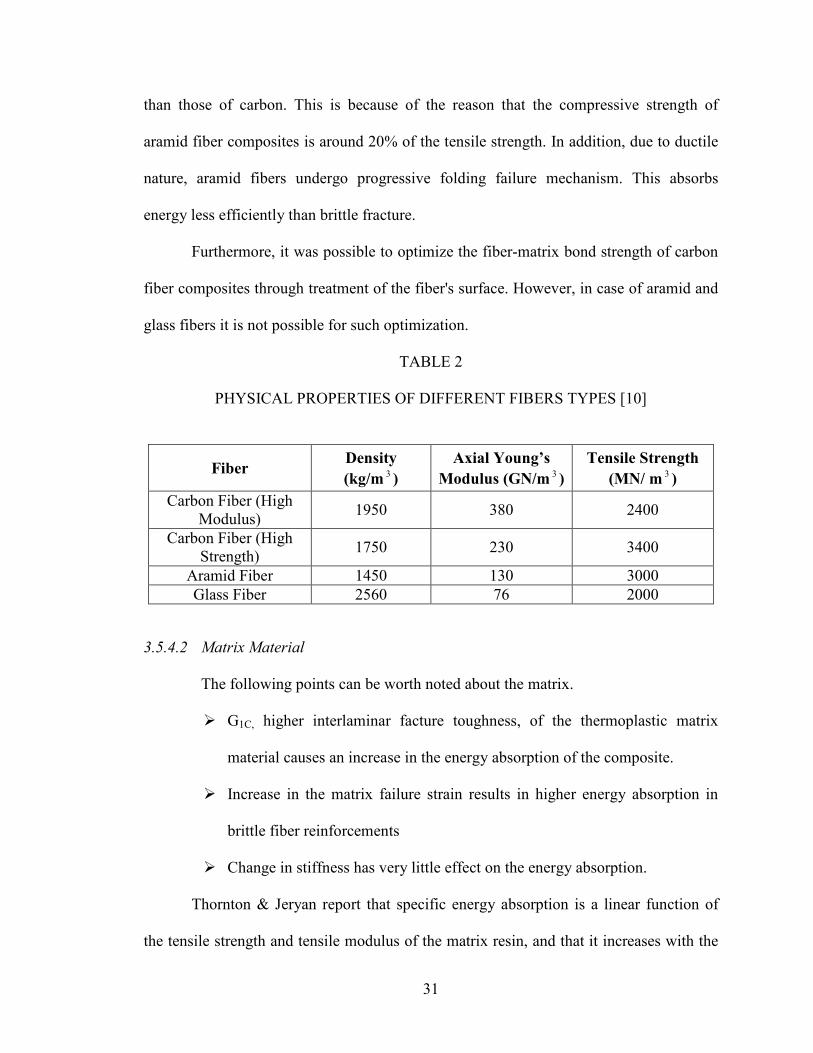
31
than those of carbon. This is because of the reason that the compressive strength of
aramid fiber composites is around 20% of the tensile strength. In addition, due to ductile
nature, aramid fibers undergo progressive folding failure mechanism. This absorbs
energy less efficiently than brittle fracture.
Furthermore, it was possible to optimize the fiber-matrix bond strength of carbon
fiber composites through treatment of the fiber's surface. However, in case of aramid and
glass fibers it is not possible for such optimization.
TABLE 2
PHYSICAL PROPERTIES OF DIFFERENT FIBERS TYPES [10]
Fiber Density
(kg/m 3 )
Axial Young’s
Modulus (GN/m 3 )
Tensile Strength
(MN/ m 3 )
Carbon Fiber (High
Modulus) 1950 380 2400
Carbon Fiber (High
Strength) 1750 230 3400
Aramid Fiber 1450 130 3000
Glass Fiber 2560 76 2000
3.5.4.2 Matrix Material
The following points can be worth noted about the matrix.
� G1C, higher interlaminar facture toughness, of the thermoplastic matrix
material causes an increase in the energy absorption of the composite.
� Increase in the matrix failure strain results in higher energy absorption in
brittle fiber reinforcements
� Change in stiffness has very little effect on the energy absorption.
Thornton & Jeryan report that specific energy absorption is a linear function of
the tensile strength and tensile modulus of the matrix resin, and that it increases with the

32
order phenolic < polyester < epoxy for glass fiber tubes. While this observation may be
reasonable, it is not conclusively verified by direct reference to material property data
(Table 2) because of the spread in reported values [19].
TABLE 3
MECHANICAL PROPERTIES OF RESIN SYSTEMS [10]
Fiber Density
(kg/m3
Young's
Modulus
(GN/m2)
Tensile
Strength
(MN/m2)
Epoxy 1100-1400 2.1-6.0 35-90
Polyester 1100-1500 1.3-4.5 45-85
Phenolic 1300 4.4 50-60
Carbon fiber reinforced composite tubes with different kinds of thermoplastic
matrices were studied. From Table 3 [10] the specific energy of thermoplastic tubes
follow the order PAS<PI<PEI< PEEK. In a similar study, energy absorption of
carbon/PEI (C/PEI), carbon/polyimide (C/PI), carbon/polyarylsulfore (C/PAS),
carbon/PEEK (C/PEEK), were investigated and compared with that of carbon/epoxy and
glass/polyester. Carbon/thermoplastic tubes demonstrated superior energy absorbing
capabilities (ES=128–194 kJ/kg) than carbon/epoxy (ES=110 kJ/kg) or glass/polyester
(ES=80 kJ/kg) structures. [10]
3.5.4.3 Fiber & Matrix Combination
The studies described above tend to relate the energy absorption capability of an
FRP to the individual properties of its constituent fibers and matrix. It was proposed that
energy absorption is substantially dependent on the relative (rather than the absolute)
properties of the fibers and matrix. In particular, he reports that the relative values of
fiber and matrix failure strain significantly affect energy absorption. It is suggested that to

33
achieve maximum energy absorption from an FRP, a matrix material with a higher failure
strain than the fiber reinforcement should be used. This ensures crushing by high-energy
fragmentation. [18]
3.5.4.4 Effect of orientation and lay-up
The orientation of the fibers in a given layer, and the relative orientation of
successive layers within a laminate, can significantly affect a component's mechanical
properties.
Energy absorption capability varies with ply orientation. Variations in specific
energy absorption were observed in tests on [0/±θ]3 carbon/epoxy tubes for 15o<θ <45
o
(Figure 10). Specific energy absorption fell quite markedly over this range. This would
suggest that carbon fibers absorb most energy when their orientation tends towards that
of the loading. However, it was noted that a laminate consisting entirely of 0o fibers
would be unlikely to have good energy absorption characteristics. In particular, the
absence of an outer hoop (90o) layer can lead to very low energy absorption.
In pertinent to aramid/epoxy it was observed that smaller variations in energy
absorption capability for [0/±θ]3 (Figure 10). Specific energy absorption generally
increased with increasing θ over the range 45o<θ <90
o. No significant variation was
observed for 15o<θ <45
o. This trend is opposite to that observed for carbon-epoxy. [18]
3.5.4.5 Effect of Geometry
These points are some important findings:
� Crush zone mechanisms determine the overall energy absorption of a
composite material and

34
� Specific energy absorption follows the order: circular > square > rectangle
for a given fiber lay up and tube geometry.
Thornton and Edwards conducted a study investigating the geometrical effects in
energy absorption of circular, square, and rectangular cross section tubes. They
concluded that for a given fiber lay up and tube geometry, the specific energy follow the
order, circular>square>rectangle.The structural integrity and damage tolerance of typical
composite constructed from glass fiber reinforced plastic plays an important role. The
effect of the geometry and the strain distribution was investigated using finite element
analysis. The results, showed that the critical strains were significantly affected by the
joint geometry. This showed that particular defects led to large changes in the strains in
the structure [7].
Farley investigated the geometrical scalability of graphite/epoxy and
Kevlar/epoxy [±45]N by quasi-statically crush testing them. All circular cross section
graphite/epoxy exhibited a progressive brittle fracturing mode. All Kevlar/epoxy when
crushed exhibited the characteristic local buckling crushing mode. It was found that
carbon/epoxy exhibited large changes in their energy absorption characteristics with a
range of values of diameter (D), wall thickness (t) and (D/t) ratio. In this study, (D/t) ratio
was determined to significantly affect the energy absorption capability of the composite
materials. [7]

35
CHAPTER 4
COMPUTER AIDED ENGINEERING TOOLS
Due to increasing cost on conducting real-time crash simulations, CAE tools are
very widely used in auto industry. As a result, automakers have reduced product
development cost and time while improving safety, comfort, and durability of the
vehicles they produce. The predictive capability of CAE tools has progressed to the point
where much of the design verification is now done using computer simulations rather
than physical prototype testing. Tools used in this study are briefly explained below.
4.1 MSC PATRAN
MSC Patran is one of the versatile software’s that deals with design and finite-
element analysis. It is a finite element modeler used to perform a variety of CAD/CAE
tasks including modeling, meshing, and post processing for FEM solvers LSDYNA,
NASTRAN, ABAQUS Etc. Patran provides direct access to geometry from the worlds
leading CAD systems and standards. Using sophisticated geometry access tools Patran
addresses, many of the traditional barriers to shared geometry, including topological
incompatibilities, solid body healing, mixed tolerances, and others.
MSC.Patran provides an open, integrated, CAE environment for multi
disciplinary design analysis. This feature can be used to simulate product performance
and manufacturing process early in the design-to-manufacture process. This has the
ability to import geometry from any CAD system and various data exchange standards.
Powerful and flexible meshing is available with the capabilities that range from
fully automatic solid meshing to detailed node and element editing. Loads and boundary
conditions can vary and may be associated with the design geometry or with the analysis

36
model. The result visualization tools enable to identify critical information, including
minimums, maximums, trends, and correlations. Isosurfaces and other advanced
visualization tools help to speed and improve results evaluation.
In this study, MSC Patran has been used to model the Composite tube. The mesh
needed for FEA is generated by this software. The major part of this study, which
involves designing of the side-impact beam, is again designed and meshed using MSC
Patran. This serves as a very helpful tool in modeling the composites.
4.2 LS-Dyna
LS-DYNA is a general-purpose, explicit finite element program used to analyze
the nonlinear dynamic response of three-dimensional inelastic structures. Its fully
automated contact analysis capability and error-checking features have enabled users
worldwide to solve successfully many complex crash and forming problems [20].
An explicit time integration scheme offers advantages over the implicit methods
found in many FEA codes. A solution is advanced without forming a stiffness matrix
(thus saving storage requirements). Complex geometries may be simulated with many
elements that undergo large deformations. For a given time step, an explicit code requires
fewer computations per time step than an implicit one [20]. This advantage is especially
dramatic in solid and shell structures. In extensive car crash, airbag and metal forming
benchmark analyses, the explicit method has been shown to be faster, more accurate, and
more versatile than implicit methods.
LS-DYNA has over one hundred metallic and nonmetallic material models like
Elastic, Elastoplastic, Elasto-viscoplastic, Foam models, Linear Viscoelastic, Glass
Models, Composites, etc.

37
The fully automated contact analysis capability in LS-DYNA is easy to use,
robust, and validated. It uses constraint and penalty methods to satisfy contact conditions.
These techniques have worked extremely well over the past twenty years in numerous
applications such as full-car crashworthiness studies, systems/component analyses, and
occupant safety analyses. Coupled thermo-mechanical contact can also be handled. Over
twenty-five different contact options are available. These options primarily treat contact
of deformable to deformable bodies, single surface contact in deformable bodies, and
deformable body to rigid body contact. Multiple definitions of contact surfaces are also
possible. A special option exists for treating contact between a rigid surface (usually
defined as an analytical surface) and a deformable structure. One example is in metal
forming, where the punch and die surface geometries can be input as IGES or VDA-
surfaces which are assumed rigid. Another example is in occupant modeling, where the
rigid-body occupant dummy (made up of geometric surfaces) contacts deformable
structures such as airbags and instrument panels [20].
Some of the prime application areas of LS-DYNA are as follows:
� Crashworthiness simulations: automobiles, airplanes, trains, ships, etc.
� Occupant safety analyses: airbag/dummy interaction, seat belts, foam padding.
� Bird strike.
� Metal forming: rolling, extrusion, forging, casting, spinning, ironing, superplastic
forming, sheet metal stamping, profile rolling, deep drawing, hydroforming
(including very large deformations), and multi-stage processes.
� Biomedical applications and many more.

38
LS-DYNA runs on leading UNIX workstations, supercomputers, and MPP
(massively parallel processing) machines. Computer resource requirements vary
depending on problem size. Simulations with more than 1.200.000 elements have been
run using 250 million words of memory and 3.5 GB of disk space. On supercomputers,
the code is highly vectorized and takes advantage of multiple processors [20].
LS-Dyna is used to simulate the crushing process of a composite tube and it is
used to compare the different composite materials in determining the most energy
absorbing material. Three point bending test is also carried out using this FEA solver.
The side-impact B-Pillar designed is placed in the car and then side-impact analysis is
carried in LS-Dyna. Finally, MADYMO/LS-Dyna is coupled to determine the injuries
sustained [20].
4.3 MADYMO
MADYMO (MAthematical DYnamical MOdels) is a general-purpose software
package, which can be used to simulate the dynamic behavior of mechanical systems
[21]. Although originally developed for studying passive safety, MADYMO is now
increasingly used for active safety and general biomechanics studies. It is used
extensively in industrial engineering, design offices, research laboratories and technical
universities. It has a unique combination of fully integrated multibody and finite element
techniques.
MADYMO combines in one simulation program the capabilities offered by
multibody, for the simulation of the gross motion of systems of bodies connected by
complicated kinematical joints and finite element techniques, for the simulation of
39
structural behavior. It is not necessary to include both in a model, i.e. a model with either
finite elements or multibodies can be used [21].
The multibody algorithm in MADYMO yields the second time derivatives of the
degrees of freedom in explicit form. The number of computer operations is linear in the
number of bodies if all joints have the same number of degrees of freedom. This leads to
an efficient algorithm for large systems of bodies. At the start of the integration, the
initial state of the systems of bodies has to be specified (initial conditions). Several
different kinematic joint types are available with dynamic restraints to account for joint
stiffness, damping and friction. Joints can be unlocked or removed based on a user
defined criterion.
Planes, ellipsoids, cylinders and facet surfaces can be attached to a body to
represent its shape. These surfaces are also used to model contact with other bodies or
with finite elements. The contact surfaces are of major importance in the description of
the interaction of the occupant with the vehicle interior. The elastic contact forces,
including hysteresis, are a function of the penetration of the contact surfaces. In addition
to elastic contact forces, damping and friction can be specified.
The output generated by MADYMO is specified through a set of output control
parameters. A large number of standard output parameters are available, such as
accelerations, forces, torques and kinematics data [21]. MADYMO offers in addition to
standard output quantities, the possibility to calculate injury parameters like femur and
tibia loads, Head Injury Criterion (HIC), Gadd Severity Index (GSI), Thoracic Trauma
Index (TTI) and Viscous Injury Response (VC). Special output can be obtained through

40
user-defined output routines. Results of the simulation are stored in a number of output
files, which are accessible by post-processing programs.
4.4 EASI CRASH DYNA (ECD)
EASI CRASH DYNA is the first fully integrated simulation environment
specially designed for crash engineering requiring large manipulation capability [20]. It
can directly read files in IGES, NASTRAN, PAM-CRASH, MADYMO and LSDYNA
data. ECD has unique features, which enable the crash simulation more realistic and
more accurate. These are
4.4.1 Pre-Processing Features
� Fully automatic meshing and automatic weld creation.
� Rapid graphical assembly of system models.
� FE-Dummy and Rigid body dummy structuring, positioning and orientation.
� Material database access and manipulation.
� Graphical creation, modification and deletion of contacts, materials, constraints
and I/O controls.
� Automatic detection and correction of initial penetration.
� Replacing the component from one model to another model.
4.4.2 Post-Processing Features
� Highly optimized loading and animation of DYNA results for design.
� Superposition of results for design.
� User friendly and complete plotting for processing simulation and test data
comparisons.
� Quick access to stress energies and displacements without reloading the file.

41
� Dynamic inclusion/exclusion of parts during animation and visualization.
� Import and super-imposition of test results with simulation results.
� Synchronization between animation and plots, between simulation result file and
test result file.
4.5 Easi-Crash Mad
EASi-CRASH is based on EASi's 10 years of practical experience in crash
simulations. It greatly enhances the simulation process by allowing concurrent access to
the model and simulation results. Animation, visualization and synchronized curve
plotting make EASi-CRASH MAD a high performance CAE environment [21]. The
preprocessing features are listed below.
� Graphical creation, modification and deletion of multi-bodies and FE entities.
� FE meshing and manipulation capabilities.
� Graphical display, browsing and editing of MADYMO entities through browser
interface (MADYMO explorer).
� Supports INCLUDE files.
� Card Image representation of MADYMO input deck.
� Quick JOINT definition and orientation.
� Easy dummy positioning .
� Rapid contact creation, modification and preview through Contact spreadsheet.
� High speed generation of MADYMO and FE seat belt using automated belt
routing techniques.
� Supports advanced airbag modeling (CFD).

42
CHAPTER 5
SECTION MODEL AND ANALYSIS OF B-PILLAR IMPACT WITH SPHERE
5.1 Design of B-Pillar
B-pillars are one of the most sophisticated parts of the automobile body, because
this component has to comply with lot of requirements and specifications. The distance
between the B-Pillar and the occupant is very less in side impact when compared to the
frontal impact. In addition, when the impact occurs, the B-Pillar or structures in the B-
Pillar have to absorb more energy with minimal acceleration to the occupant. [12]
Length = 1000mm
Width = 272mm
Figure 11. B-Pillar
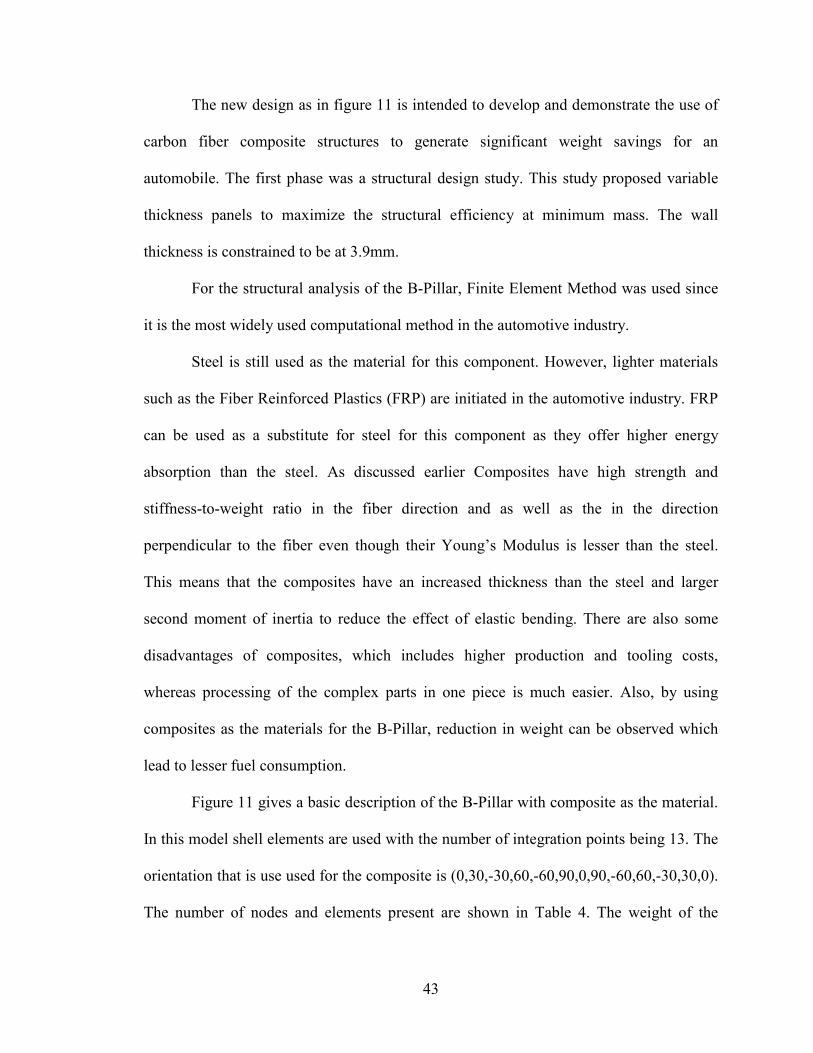
43
The new design as in figure 11 is intended to develop and demonstrate the use of
carbon fiber composite structures to generate significant weight savings for an
automobile. The first phase was a structural design study. This study proposed variable
thickness panels to maximize the structural efficiency at minimum mass. The wall
thickness is constrained to be at 3.9mm.
For the structural analysis of the B-Pillar, Finite Element Method was used since
it is the most widely used computational method in the automotive industry.
Steel is still used as the material for this component. However, lighter materials
such as the Fiber Reinforced Plastics (FRP) are initiated in the automotive industry. FRP
can be used as a substitute for steel for this component as they offer higher energy
absorption than the steel. As discussed earlier Composites have high strength and
stiffness-to-weight ratio in the fiber direction and as well as the in the direction
perpendicular to the fiber even though their Young’s Modulus is lesser than the steel.
This means that the composites have an increased thickness than the steel and larger
second moment of inertia to reduce the effect of elastic bending. There are also some
disadvantages of composites, which includes higher production and tooling costs,
whereas processing of the complex parts in one piece is much easier. Also, by using
composites as the materials for the B-Pillar, reduction in weight can be observed which
lead to lesser fuel consumption.
Figure 11 gives a basic description of the B-Pillar with composite as the material.
In this model shell elements are used with the number of integration points being 13. The
orientation that is use used for the composite is (0,30,-30,60,-60,90,0,90,-60,60,-30,30,0).
The number of nodes and elements present are shown in Table 4. The weight of the

44
composite B-Pillar is reduced drastically when compared to the present B-Pillar. The
weight of the composite B-Pillar is 1.04 kg where as the weight of the present B-Pillar
made of steel is 2.15 kg. The weight of the composite is 53% less when compared to the
steel B-Pillar. This shows the weight reduction when a composite material is used.
TABLE 4
PROPERTIES OF B-PILLAR
Number of Nodes Number of
433
Number of
Elements
754
Material
Carbon fiber
Thickness 3.9mm
Weight 1.05kgs
5.2 Impactor
Diameter = 300mm
Figure 12. Sphere (Impactor)

45
Figure 12 shows the impactor. The geometry of the impactor is chosen as a
sphere. The impactor is made of honeycomb material whose behavior is anisotropic and
is a solid. This material is chosen since the barrier in FMVSS 214 regulation is of the
same material. Table 5 shows the properties with the number of nodes and elements [7].
Thornton and Edwards conducted a study investigating the geometrical effects in energy
absorption of circular, square, and rectangular cross section tubes. They concluded that
for a given fiber lay up and geometry, the specific energy follow the order,
circular>square>rectangle.
TABLE 5
PROPERTIES OF SPHERE
Number of Nodes Number of
1616
Number of
Elements
1600
Material
Honeycomb
Weight 5.12kgs
5.3 Analysis of B-Pillar impact with sphere
B-pillars are one of the most sophisticated parts of the automobile body,
because this component has to comply with lot of requirements and specifications. The
distance between the B-Pillar and the occupant is very less in side impact when compared
to the frontal impact. In addition, when the impact occurs, the B-Pillar or structures in the
B-Pillar have to absorb more energy with minimal acceleration to the occupant.

46
Therefore this simulation is carried out as verification for FMVSS 214 regulations and to
show that composite B-Pillar can be used for the actual side impact.
Figure 13. B-Pillar section model with sphere
Figure 13 shows the model of a B-Pillar of a car with an impact object, the
sphere. The sphere is made of honeycomb material with diameter 300mm. Honeycomb
material is used because this is the actual material that is used in the moving deformable
barrier according to federal motor vehicle standards. The impactor is at a height of
330mm from the base of the B-Pillar. The top and the bottom nodes of the B-Pillar are
constrained in all directions. Initial velocity is given on the sphere which is 33.5mph.The
analysis is run for 0.012 seconds and then the results are noted. The elements used in the
B-pillar are shell elements that are elastic plastic elements. The point of contact of the
impactor is same as the contact of the barrier according to the regulations [9]. Three
different materials are used for the B-Pillar which are steel, glass and carbon fiber.
Both ends fixed
Impacting speed = 33.5mph
Height from the base of B-Pillar =330mm

47
Results are compared and the best material is used in the B-Pillar. In this case carbon
proved out to be the best material as the energy absorption of carbon is twice as that of
steel which is the original material. Figure 14 shows the fringe levels at different times.
0.003 sec 0.006 sec
0.009 sec 0.012 sec
Figure 14. Fringe levels for B-Pillar

48
-1.00E+06
0.00E+00
1.00E+06
2.00E+06
3.00E+06
4.00E+06
5.00E+06
6.00E+06
7.00E+06
0.000 0.002 0.004 0.006 0.008 0.010 0.012 0.014
Time (S)
Inte
rnal E
nerg
y (N
-mm
)
Carbon
Glass
Steel
Figure 15. Internal Energy v/s Time for different materials
TABLE 6
SPECIFIC ENERGY ABSORPTION OF DIFFERENT MATERIALS
Material Energy Absorption
Carbon Fiber 6.52e+6 N-mm
Glass fiber epoxy 4.24e+6 N-mm
Steel 3.58 e+6 N-mm
Table 6 shows energy absorbed by different materials. Carbon fiber absorbs
almost twice the energy when compared to steel. The thickness of carbon fiber is 3.9mm
and is made of shell elements. Figure 15 shows time vs. internal energy graph. Internal
energy of the material specifies the ability of the material to withstand the load while it is
deformed. Higher the internal energy, higher will be ability of the material in taking the
load and therefore the energy absorption of the material increases. From figure 15 the end

49
time specific energy absorption of carbon is very high when compared to steel and glass.
Thus, it can be concluded that carbon fiber with thickness at 3.9 mm has higher energy
absorption. Therefore, these are the parameters considered when analyzing the B-Pillar.
0
10
20
30
40
50
60
0.000 0.002 0.004 0.006 0.008 0.010 0.012 0.014
Time (S)
Dis
pla
cem
ent (m
m)
Glass
Carbon
Steel
Figure 16. Displacement of the B-Pillar
5.4 Displacements of the B-Pillar
Figure 16 shows the Displacements of the B-Pillar in pertinent to time.
Different materials such as steel, Glass fiber and Carbon fiber are illustrated. The curve is
self-explanatory with the Glass fiber and steel having almost no difference in the
displacement. Since the density of glass is very high compared to carbon fiber the ability
for glass to withstand load is very less. However, B-Pillar with carbon fiber shows very
less displacement. This indicates that there is very less intrusion into the occupant cabin,
which results in reducing the fatal injuries caused by side impact. Area under the curve
for carbon shows the amount of intrusion in the car.

50
0.00E+00
5.00E+03
1.00E+04
1.50E+04
2.00E+04
2.50E+04
3.00E+04
0.00E+00 1.00E+02 2.00E+02 3.00E+02 4.00E+02 5.00E+02 6.00E+02
Displacement (mm)
Forc
e (N
)
steel
Glass
Carbon
Figure 17. Force v/s Displacement for different materials
Force v/s Displacement for different materials such as steel, Glass fiber and
Carbon fiber are illustrated. As the area under the curve indicates the energy absorbed by
the structure, it is evident from figure 17 that the structure with carbon fiber material
absorbs more energy. The carbon fiber as seen has a higher ability to withstand load. This
means that the injury sustained by the occupant in a vehicle is reduced considerably. This
is the reason why carbon fiber can be used in the B-Pillar.
The least energy absorbing material is steel as per the study. This means that
the injury sustained by using steel is more when compared to carbon. Glass fiber also
gives the same properties as steel as the density of glass is more than carbon. Hence, it is
not advisable to use either steel or glass fiber as the material for the B-Pillar. However,
the initial peak loads of carbon fiber is high and this might induce more forces on the
occupant. However, the high sustaining load offered by the carbon fiber, which absorbs
higher energy thus reducing the injuries, fixes this issue.

51
CHAPTER 6
SIDE IMPACT MODELING AND ANALYSIS OF B-PILLAR IN A SEDAN
Federal Motor Vehicle Safety Standard (FMVSS) 214 is the standard used for
side-impact crash analysis [9]. This was developed by NHTSA (National Highway
Traffic Safety Administration) [28]. In this, a deformable barrier (MDB) is made to strike
a stationary car according to federal motor vehicle safety standards. A side impact
dummy is placed in the driver’s side of the car to record the injuries. Ford Taurus is the
standard car used in the side-impact crash analysis and this model is explained in detail in
the next section.
6.1 Finite element study of Ford Taurus
Due to the increasing cost of conducting an experiment, finite element models are
used everywhere. Automotive industry is the filed, which utilizes the FEM to the most.
Finite Element Models are accurate to simulate several different crash tests and predict
the vehicle and occupant response various crash scenarios. Such a design leads to
minimize the time and the cost of the testing process and helps in making effective safety
decisions.
The Ford Taurus model used for the analysis is a four-door sedan with 5 meters
length and 2.76 m wheelbase. It is developed by NHTSA. Figure 18 shows the finite
element model of Ford Taurus Model. It has 134 parts, which represent different vehicle
parts and these parts are joined by rigid body constrained options and spot-weld. The
contacts between different parts are modeled as single surface sliding interface
(AUTOMATIC_SINGLE_SURFACE).

52
Figure 18. Ford Taurus model [28]
TABLE 7
FINITE ELEMENT SUMMARY OF FORD TAURUS [28]
Number of Parts 134
Number of Nodes 26797
Number of Quad Elements 23124
Number of Tria Elements 4750
Number of Hexa Elements 338
Number of Penta Elements 10
Table 7 depicts the finite element summary of Ford Taurus. It consists of 134
parts and these represent the different parts of the vehicle. Two different types of shell
elements are used, triangular and quadrilateral. This model consists of shell, B-Pillar and
the solid elements. The shell elements have isotropic elastic plastic material and eight
stress strain points define the stress strain relationship. B-Pillar elements are assigned

53
with isotropic elastic material and the solid elements have honeycomb material with
constant stress element formulation.
6.2 Impactor Modeling
Impactor used in FMVSS 214 is a moving deformable barrier (MDB) which was
designed to be representative of the mass and size of U.S. vehicles. The relative
longitudinal and lateral speed of the MDB and the target vehicle is considered the
threshold for serious injury in actual crashes. The finite element model of the barrier is
shown in figure 19.
Figure 19. FEM model of MDB [28]
The MDB face assembly includes a bumper constructed of honeycomb 1690+/-
103 kPa sandwiched between 3.2 mm thick aluminum plates. The bumper is a flexion
member and develops flexion strength based on the material properties of these front and
back plates.

54
The aluminum material for honeycomb structure of the barrier face is specified by
design. The bottom edge of the MDB is 279 mm from the ground. The protruding portion
of the barrier simulating a bumper is 330 mm from the ground. Figure 20 and 21 shows
the specifications of MDB. The MDB has total mass of 1367 Kg. For defining material
model in LS-DYNA for honeycomb structure of the barrier face, MAT_HONEYCOMB
card has been defined [28]. Summary of the FEM barrier is illustrated in Table 8.
TABLE 8
SUMMARY OF MDB [28]
Number of Parts 8
Number of Nodes 11033
Number of Quad Elements 718
Number of Hexa Elements 7324
The specifications of the MDB are described in detail in figure 21
Figure 20. Specifications of MDB [28]

55
Figure 21. Dimensions of Moving Deformable Barrier (MDB) [28]
6.3 Side-Impact Analysis
6.3.1 LS-Dyna simulation
According to the FMVSS 214 standard, the barrier moves in the direction of the
car and strikes the driver side of the car at a crabbed angle of 27° with the velocity of the
barrier at 33.5 mph. The distance between the vehicle and the barrier is kept to the
minimum in order to minimize the simulation time [9]. This simulation is run for 0.12s
and figures 22 shows animation sequence of the side-impact crash analysis.

56
Time = 0 sec
Time = 0.04 sec
Time = 0.08 sec
Time = 0.12 sec
Figure 22. Animation sequence of a side-impact crash analysis

57
According to the figure 22, it can be noticed that there is considerable
deformation sustained by the Ford Taurus sedan. The MDB has had almost even damage,
but it passes all its energy into the side door of a car. As a reason the side door of the car
should have the ability to withstand the load so that there is less injury on the occupant of
the vehicle.
6.4 Fiber Orientation
The parametric study on the B-Pillar is carried out by starting with the variation in
lay-up sequence. Four different lay-up sequences are analyzed and they are as follows.
The material used while altering the lay-ups is glass fiber and carbon fiber.
1) [(±45°)6/90°]
2) 0,30,-30,60,-60,90,0,90,-60,60,-30,30,0
3) 45,-45,45,-45,45,-45,0, 45,-45,45,-45,45,-45
4) 0,45,0,45,0,45,0,45,0,45,0,45,0
5) 0,90,0,90,0,90,45,90,0,90,0,90,0
Finding out an orientation which is more energy absorbing is a complicated issue.
Deciding the directions of lay-up for the specimen is very important. These above
orientations are commonly used and are compared using the Force v/s Displacement
curve and the energy dissipated in each specimen. In addition, the energy absorbed in
these specimens are also investigated and compared. Finally, an orientation with a high-
energy absorption is chosen for further study in this research. Figure 23 shows the
corresponding curves for the above mentioned lay-up sequences. From the graph it can be
seen that, area under the curve for the layup sequence 0,30,-30,60,-60,90,0,90,-60,60,-
30,30,0 is more and thus energy absorbed is more in this orientation.

58
0
1000
2000
3000
4000
5000
6000
7000
8000
0 100 200 300 400 500 600 700 800
Displacement (mm)
Forc
e(N
)
0.30.60
45.-45.45
0.90.0.90
0.45.0.45
Figure 23. Force v/s Displacement for different orientations
It can also be seen that the load sustained by this orientation is higher than any
other orientation. The next higher sustaining load is the (45,-45,45,-45,45,-45,0, 45,-
45,45,-45,45,-45). However, the deformation pattern in this orientation is not progressive
and this cannot absorb more energy than the #1 orientation. In addition, from the figure
23 it can be seen that the orientation #1 has higher energy than any other orientation. This
means that this orientation has the ability to withstand higher load than any other
orientation.
Finally, comparing the energy absorption values from figure 23, it can be
concluded that the orientation (0,30,-30,60,-60,90,0,90,-60,60,-30,30,0) has better energy
absorption and this is used in every composite part designed in this study.

59
6.5 Thickness
Thickness of the structure plays a vital role in energy absorption of a material. By
increasing the thickness, the structure can be made to withstand more load and thus more
energy absorption. However, the volume also increases when there is any increase in
thickness and this in turn increases the mass of the structure. This not acceptable in the
filed of crashworthiness as weight plays a very critical role in increasing the fuel
efficiency of the vehicle.
In this study, thickness is varied to 1.3 mm and 3.9 mm. When the 1.3 mm
thickness is used, the deformation is very much and the deformation pattern is completely
different. In addition, the energy absorption is very less. The 3.9 mm thickness yielded
very good energy absorption. Therefore, 3.9mm thickness is used in every composite part
Once the orientation and the thickness are decided, the next step is to find a
material that has higher energy absorption. Keeping the orientation to 0,30,-30,60,-
60,90,0,90,-60,60,-30,30,0 and thickness at 3.9 mm, different materials are analyzed
which included Carbon/Epoxy, Glass-fiber epoxy and Steel. The properties of these
materials are shown in Table 11 of Appendix A respectively. Figure 26 shows the Force
v/s Displacement of different materials considered.
6.6 Analysis of B-Pillar
The new modelled B-Pillar is placed in the car as shown in figure 24. Easi-Crash
Dyna is used to merge the B-Pillar with the car. ECD is also used to assemble the newly
designed side-impact B-Pillar. This analysis is done using FMVSS 214 standards. First of
all FMVSS 214 standard is used to study the deformation sustained by the car when using
the new designed B-Pillar.

60
It has already been decided earlier in this study that carbon fiber composite is
stronger and absorbs more energy. In this chapter, this is proved again by implementing
the new-modelled composite B-Pillar in the car. In addition, glass fiber results are also
included to help in interpreting the results.
6.6.1 FMVSS 214 test
As discussed earlier, in this test, a MDB is made to impact the side of the car at
33.5 mph. The MDB moves at a crabbed angle of 27° [9].
6.6.2 Simulation of side impact crash with the present B-Pillar
The full Side Impact model is carried out in LS-DYNA for 0.1 seconds. The
accelerometers are placed at eight locations (near the driver side) in the vehicle. The
contacts are defined by geometric interface. Figure 24 shows the deformation sustained
when MDB crashes into the car.
Figure 24. Deformation in the present B-Pillar

61
6.6.3 Simulation of side impact crash with Composite B-Pillar
The present B-pillar in the Ford Taurus car was removed using ECD and the
composite B-Pillar was merged with car. Deformation sustained by the car while using
the carbon fiber reinforced composite B-Pillar is shown in figure 25.
Figure 25. Deformation in the Composite B-Pillar
From figure 24, and 25, it can be seen that the deformation of the car when the
present B-Pillar is used is very high. This indicates that the displacements and the
accelerations sustained by the car is increased, hence increasing the injuries sustained by
the occupant. In addition, it can be observed that the deformation on the composite
carbon fiber B-Pillar is less, which means that the energy absorbed by the structure is
high and it passes very less force onto other structures in the car. This helps in
minimizing the injury criteria to as low as possible. This becomes very clear when the
injury levels are studied using MADYMO.

62
6.6.4 Results and Discussion
-2.00E+04
0.00E+00
2.00E+04
4.00E+04
6.00E+04
8.00E+04
1.00E+05
0 200 400 600 800 1000
Displacement (mm)
Forc
e(N
)
carbon
steel
glass
Figure 26. Force v/s Displacement for different materials
Force v/s Displacement for different materials considered can be seen from figure
26. The carbon fiber as seen has a higher ability to withstand load. The least energy
absorbing material is steel as per the study. Carbon fiber is the material used for B-Pillar
in this study. It can also be seen that the displacement of the B-Pillar is lesser than other
materials. This means that the injury sustained by the occupant in a vehicle is reduced
considerably. However, the initial peak loads of carbon fiber is high and this might
induce more forces on the occupant. However, the high sustaining load offered by the
carbon fiber, which absorbs higher energy thus reducing the injuries, fixes this issue.
Energy v/s time is shown in figure 27. It can be seen that carbon fiber exhibits higher
internal energy than any other materials, which helps in absorbing more energy.

63
-5.00E+05
0.00E+00
5.00E+05
1.00E+06
1.50E+06
2.00E+06
2.50E+06
0.00 0.02 0.04 0.06 0.08 0.10 0.12 0.14
Time (S)
Energ
y (N
-mm
)
Glass
Steel
Carbon
Figure 27. Energy v/s Time for different materials
TABLE 09
ENERGY ABSORPTION OF DIFFERENT MATERIALS
Material Energy Absorption
Carbon Fiber 2.21e+6 N-mm
Glass fiber epoxy 2.01e+6 N-mm
Steel 1.84 e+6 N-mm
Table 09 shows energy absorbed by different materials. From the figure 26 and
figure 27 it can be concluded that carbon fiber with orientation (0,30,-30,60,-60,90,0,90,-
60,60,-30,30,0) and thickness at 3.9 mm has higher energy absorption. Therefore, these
are the parameters considered when analyzing the B-Pillar.
Displacements and accelerations obtained in the side impact crash are shown in
this section. In all of these displacements and accelerations curves, carbon fiber B-Pillar
proves very useful.

64
-100
0
100
200
300
400
500
600
700
800
900
1000
0.00 0.02 0.04 0.06 0.08 0.10 0.12 0.14
Time (sec)
Dis
pla
cem
ent (m
m)
Carbon
Glass
Steel
Figure 28. Displacements at the center of gravity
Figure 28 shows car’s CG displacement with respect to time. Displacements
in pertinent to the Present B-Pillar (Steel), Glass fiber B-Pillar (GF) and Carbon fiber B-
Pillar (CF) are illustrated. The curve is self-explanatory with the Glass fiber and the
present B-Pillar having almost no difference in the displacement. However, the carbon
fiber B-Pillar absorbs more energy and therefore the car’s displacement reduces by
almost 55%. This validates the fact that carbon fibers absorb more energy and thus
reduces the displacement. B-Pillar with carbon fiber shows very less displacement
indicating very less intrusion into the occupant cabin. Area under the curve for carbon
shows the amount of intrusion in the cabin. Intrusion in a car plays a very important role
as it is directed to the safety of the occupant that is a major criterion in side impacts.

65
0
10
20
30
40
50
60
70
80
90
100
0.00 0.02 0.04 0.06 0.08 0.10 0.12 0.14
Time (s)
Accele
rtio
n (g's
)
Carbon
Glass
Steel
Figure 29. Acceleration of B-Pillar
Figure 29 shows the acceleration graph with respect to time. The accelerometers
placed on the B-Pillar of the car shows the acceleration levels that are acting on the pillar
at the time of impact. These accelerations are measured in g-forces. For a good B-Pillar
the g-forces should not exceed 90g’s. This is more explained in the actual crash with
dummy. Here we can see that the peak acceleration of steel is very high. But carbon and
glass are also very close. At the end time, acceleration of steel is 20g’s and carbon is
around 10g’s that is lesser than steel which is in the present B-Pillar. When the peak
acceleration is seen we can see that steel reaches 75g’s, glass reaches 65g’s and carbon is
58g’s which is much lesser than steel. This shows that carbon can be used in the B-Pillar
and hence injury levels can be reduced.

66
CHAPTER 7
OCCUPENT BIO-DYNAMIC MODELLING AND POTENTIAL INJURY
7.1 MADYMO Modeling
Crashworthiness and occupant injury simulations are often used to evaluate the
effectiveness, and potential limitations of proposed test procedures and safety
countermeasures. Safety of occupant is the most important issue that concerns during the
design and development of vehicle.
7.2 Dummy models [21]
To simulate a human being in crash scenario MADYMO dummy models are
used. Three MADYMO model types are available as shown in figure 30. These model
types are Ellipsoid models, Facet models and Finite Element models.
Ellipsoid models are models that are based fully on MADYMO’s rigid body
modeling features. Their geometry is described by means of ellipsoids, cylinders and
planes. They are the most CPU-time efficient type of models. Therefore, they are
particularly suitable for concept, optimization and extensive parameter sensitivity studies.
A wide range of MADYMO ATD models are available. The standard models of
the adult and child Hybrid III dummies are the 5th percentile female, the 50th percentile
male, the 95th percentile male, 6-year-old child and 3-year-old child Hybrid III dummy
models. The size and weight of the Hybrid III 50th percentile male represents an
“average” of the American adult male population. In order to cover the extremes of the
American adult population two other versions of the Hybrid III have been developed, the
5th percentile small female and the 95
th percentile large male.

67
Hybrid III 50th percentile
dummy
EUROSID-I dummy
ellipsoidal model
Standing Hybrid III 50th %
dummy
Figure 30. Ellipsoidal dummy models [21]
Figure 30 shows the ellipsoidal dummy models. Hybrid III 50th percentile dummy
is the most widely applied dummy for the evaluation of automotive safety restraint
systems in frontal and side crash testing.
The EUROSID-1 Side Impact Dummy has been designed to represent a 50th
percentile adult male subject during side impact crash conditions. It is used in European
and Japanese side impact test procedures. The EuroSID is a lateral impact dummy which
is specified in the 96/27/EG directive for the protection of motor vehicle occupants [21].
The standard Hybrid III 50th percentile dummy as shown in figure 31 has been
developed for seated automotive applications. The standing Hybrid III contains some
adapted parts and thereby has a wider range of application including standing and testing
pedestrian accidents.

68
Figure 31. Hybrid III 50th percentile side impact dummy model [21]
Figure 32. Rear and left side view of dummy [14]
Head
Neck
Torso
Arm
Pelvis
Leg
Knee
Feet

69
TABLE 10
WEIGHT TABLE [14]
Table 10 shows the weight of the Hybrid III 50th percentile side impact dummy.
The stature of the dummy is about 69 in measured from the pelvis and the sitting height is
34.8 in which can be seen from figure 32. Their geometry is described by means of
ellipsoids, cylinders and planes. Segmented weights of each part from head to feet are
shown in table 11.
TABLE 11
SEGMENTED WEIGHTS [14]
Part Weight (lb)
Head 10.0
Neck 3.4
Upper Torso 37.9
Lower Torso 50.8
Upper Arms 8.8
Lower Arms and Hands 10.0
Upper Legs 26.4
Lower Legs and Feet 25.0
Total Weight 172.3
Factors
Hybrid III 50th percentile
male dummy
Weight 172.3 lbs
Stature 69.0 in
Sitting Height 34.8 in
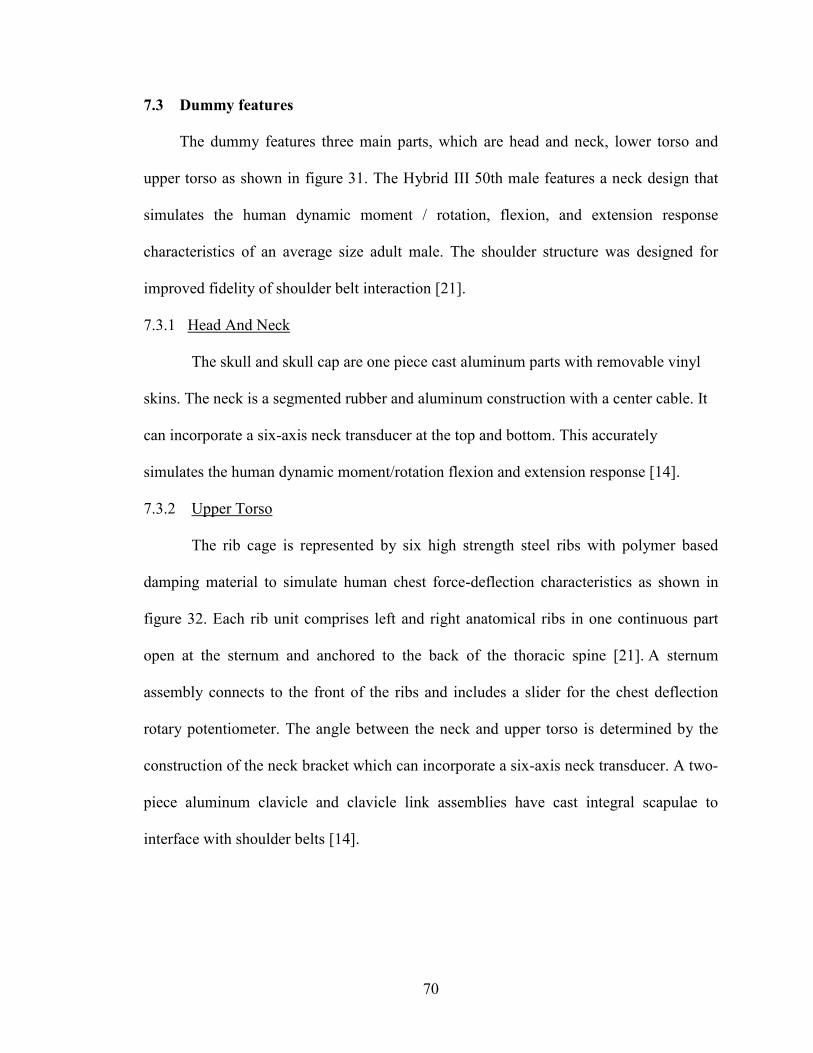
70
7.3 Dummy features
The dummy features three main parts, which are head and neck, lower torso and
upper torso as shown in figure 31. The Hybrid III 50th male features a neck design that
simulates the human dynamic moment / rotation, flexion, and extension response
characteristics of an average size adult male. The shoulder structure was designed for
improved fidelity of shoulder belt interaction [21].
7.3.1 Head And Neck
The skull and skull cap are one piece cast aluminum parts with removable vinyl
skins. The neck is a segmented rubber and aluminum construction with a center cable. It
can incorporate a six-axis neck transducer at the top and bottom. This accurately
simulates the human dynamic moment/rotation flexion and extension response [14].
7.3.2 Upper Torso
The rib cage is represented by six high strength steel ribs with polymer based
damping material to simulate human chest force-deflection characteristics as shown in
figure 32. Each rib unit comprises left and right anatomical ribs in one continuous part
open at the sternum and anchored to the back of the thoracic spine [21]. A sternum
assembly connects to the front of the ribs and includes a slider for the chest deflection
rotary potentiometer. The angle between the neck and upper torso is determined by the
construction of the neck bracket which can incorporate a six-axis neck transducer. A two-
piece aluminum clavicle and clavicle link assemblies have cast integral scapulae to
interface with shoulder belts [14].

71
7.3.3 Lower Torso
A curved cylindrical rubber lumbar spine mounts provides human-like slouch of a
seated person and mounts to the pelvis through an optional three axis lumbar load cell.
The pelvis is a vinyl skin/urethane foam molded over an aluminum casting in the seated
position as shown in figure 32. The ball-jointed femur attachments carry bump stops to
reproduce the human leg to hip moment/rotation characteristics. The femur, tibia and
ankle can be instrumented to predict bone fracture and the knee can evaluate tibia to
femur ligament injury. The foot and ankle simulates heel compression and ankle range of
motion [14]
TABLE 12
EXTERNAL DIMENSIONS FOR THE HYBRID III 50TH PERCENTILE MALE [14]
Dimension Description Specifications (in)
Head Circumference 23.5
Head Breadth 6.1
Head Depth 8.0
Erect Sitting Height 34.8
Shoulder to Elbow Length 13.3
Back of Elbow to Wrist Pivot Length 11.7
Buttock to Knee Length 23.3
Knee Pivot Height 19.5
Table 12 shows the dimension of each of the parts in the Hybrid III 50th male
dummy. Here the head circumference, breadth and depth are taken from a average
american adult male population.

72
7.4 Simulation
In this study Hybrid III 50th percentile side impact dummy model is used as the
reference model. Seat belts play a vital role in reducing the injuries of the occupant. Here
the seat belts developed in MADYMO 601 are classified as FEM belts. These are
basically the three-point belt restraint system. The width and thickness of the belt are
equal to 40mm and 1mm respectively. Belts are modeled with 0.02 size tria-elements.
HYSISO material is used for belts with density of 7850 kg/mm3. Loading and unloading
function for the FE belts are specified and they are as depicted in figure 33.
The contact between the dummy and the belt is defined by kinematic contacts
with coefficient of friction of 0.3. The belt section of the shoulder belt is in contact with
the right clavicle, the right upper arm, the neck and the collar, the left and right upper
torso, the ribs, the sternum, breasts and the abdomen. The FE belt section of the lap belt
is in contact with the hips, abdomen, the bottom ribs and the lower torso of the dummy.
US DoT SID dummy with the planes and seatbelts is shown in figure 35.
Loading and unloading curves for the seat belt
0.00E+00
2.00E+07
4.00E+07
6.00E+07
8.00E+07
1.00E+08
1.20E+08
1.40E+08
1.60E+08
0.00E+00 2.00E-02 4.00E-02 6.00E-02 8.00E-02 1.00E-01 1.20E-01
Displacement (mm)
Forc
e (N
)
loading
unlaoding
Figure 33. Loading and unloading curve for the FE belt

73
This dummy model created in Easi Crash MAD is merged into the car using ECD
as shown in figure 34. To run the analysis, MADYMO is coupled with LS-Dyna using
the simple coupling and the analysis is run for 0.1 sec. Animation sequence is shown in
figure 34.
Figure 34. Dummy merged with the car

74
Time = 0 sec Time = 0.01 sec
Time = 0.04 sec Time = 0.07 sec
Figure 35. Animation sequence of an impact analysis

75
7.5 Potential injuries
Head Acceleration
-20
0
20
40
60
80
100
120
0 0.02 0.04 0.06 0.08 0.1 0.12
Time (s)
Accele
ration (g's
)
Steel
Glass
Carbon
Figure 36. Head acceleration
Figure 36 shows the comparison of Head CG acceleration of driver occupant for
present B-Pillar, composite B-Pillar and glass fiber. From the figure 36, it can be
observed that, head CG acceleration for the car with composite fiber is lower as
compared to the present and the glass fiber model. Acceleration of the present B-Pillar is
around 94 g’s where as the carbon fiber B-Pillar is around 20 g’s. Due to this, the injury
criteria HIC, reduces tremendously.
Figure 37 the comparison of Thorax Spine acceleration of driver occupant for
present B-Pillar, composite B-Pillar with glass fiber and carbon fiber. Carbon fiber
exhibits lesser acceleration than the other impact B-Pillar. Acceleration of the present B-
Pillar is around 40 g’s and the new designed B-Pillar with carbon fiber is around 10 g’s.

76
0
5
10
15
20
25
30
35
40
0 0.02 0.04 0.06 0.08 0.1 0.12
Time (s)
Accele
ration (g's
)
Steel
Gass
Carbon
Figure 37. Thorax Spine acceleration
0
20
40
60
80
100
120
140
160
0 0.02 0.04 0.06 0.08 0.1 0.12
Time (s)
Accele
ration (g's
)
Steel
Glass
Carbon
Figure 38. Pelvis acceleration

77
Figure 38 illustrates the curve between acceleration of pelvis regions. It can be
seen that the composite fiber dominates in having lesser acceleration than the other side
impact B-Pillar. This also indicates that the energy absorption of the composite fiber B-
Pillar is higher and thus it helps in reducing injuries to the occupant.
TABLE 13
INJURY RATING [4]
Injury
Measure Good Acceptable Marginal Poor
HIC 0-623 624-779 780-935 > 935
V*C (m/s) 0-1.00 1.01-1.20 1.21-1.40 > 1.40
TTI 0-90 91-100 101-120 >120
TABLE 14
INJURY CRITERIA CALCULATED FOR THE SIDE IMPACT CRASH
Steel Model Carbon Fiber
Model
Glass Fiber Model
HIC
512 144 640
Head CG
Acceleration (g’s)
94 20 75
Thorax trauma
Index 40 15 35
Pelvis Acceleration
(<130g’s)
120 75 100
V*C (m/s)
0.8 0.3 0.6
Table 13 shows the injury rating standards according to Insurance Institute for
Highway Safety. The head injury criteria and viscous injury criteria ratings are shown

78
and we can see which is a good structure and a bad structure according to the values
obtained.
To supplement head injury measures, the movements and contacts of the
dummies' heads during the crash are evaluated. This assessment is more important for
seating positions without head protection airbags, which (assuming they perform as
intended) should prevent injurious head contacts. Very high head injury measures
typically are recorded when the moving deformable barrier hits the dummy head during
impact. Analysis of the movement and contact points of the dummies' heads during the
side impact crash test is used to assess this aspect of protection.
Table 14 shows the injury criteria calculated during a side impact crash test. For
head injury criteria a value of 623 is specified as the concussion tolerance level in side
impacts [4]. It can be seen that the Head CG Acceleration value for the carbon fiber is
very less when compared to steel and glass and is very much accepted in the field of
crashworthiness. The TTI is the acceleration criterion based on accelerations of the lower
thoracic spine and the ribs. The TTI can be used as an indicator for the side impact
performance of passenger cars. The dynamic performance requirement, as stated in
FMVSS 214 regulations of 1990, is that the TTI (d) level shall not exceed 85 g for
passenger cars with four side doors and 90 g for two side doors. We can see that carbon
fiber is about 15g’s, which is very less than the specified standards.
The pelvic acceleration standard shows that a good structure is whose g-levels are
less than 130. From table 14 we can see that the pelvis acceleration levels are very less
and is very much accepted in the field of crashworthiness. When seen the viscous critera
carbon fiber is again in the acceptable level.

79
CHAPTER 8
CONLCUSIONS AND FUTURE WORK
In this study, the objective was to investigate the use of composites as an
alternative in the vehicle B-Pillar and thus help in reducing the risk of injuries on the
occupant. The composite B-Pillar was tested on different grounds to find out the
maximum possible energy absorbing material, orientation and thickness. A side impact
B-Pillar was designed and an attempt is made to use this B-Pillar in the vehicle. FMVSS
tests are conducted to find out the accelerations and the intrusion sustained by the vehicle
before and after the use of composite B-Pillar. Finally, occupant kinematics was studied
and discussed in detail.
The composite B-Pillar designed is tested axially and in the transverse direction.
Different materials and orientation are used to find out the parameters that gives the
highest possible energy absorption. By implementing the composite designed B-Pillar
into the vehicle, the acceleration, displacement and the injuries sustained by the occupant
was eventually reduced.
8.1 Conclusions
The following conclusions can be made:
� Composite B-Pillar absorbs more energy and hence, the deformation
sustained by the B-Pillar is more, which leads to decrease in the
displacement and acceleration of the car to about 55%.
� Using this B-Pillar would reduce the weight of the side impact B-Pillar to
about 65%.

80
� Injury level reduces (70%) drastically assuring the composite B-Pillar is
stronger than the present B-Pillar.
� This B-Pillar is effective in FMVSS (25% reduction in acceleration)
standards.
� With the present technologies involved, this B-Pillar is easy to manufacture.
� There are no complications of adhering the composite B-Pillar to the car.
� Although the composite B-Pillar fail by buckling during impact loading, by
proper design, fiber orientation and fiber matrix combination buckling
failure can be reduced.
8.2 Future Work
The following recommendations for future work can be noted:
� Materials other than carbon fiber/glass fiber can be used or a combination of
different composite materials can be used to strengthen the B-Pillar.
� Experimental tests can be carried out to find out the accuracy of the results
obtained.
� Manufacturing though easy can be expensive, an alternative to reduce the
manufacturability can be figured out.
� Extensive MADYMO analysis dealing with the Neck Injuries, viscous
injury response and so on can be studied to know the effectiveness of the
composite B-Pillar.

81
REFERENCES

82
REFERENCES
[1] D.B. Miracle, S.L. Donaldson, “Introduction to Composites”. Journal of Composite
Materials, vol.34, pp.200-215, 1995.
[2] Farley, G.L.,and Jones, R.M., “Crushing Characteristics of Continuous Fiber-
Reinforced Composite Tubes,” Journal of Composite Materials, Vol.26, No.1, pp.
37-50, 1992.
[3] Matzenmiller, A., and Schweizerhof, K., “Crashworthiness Simulations of
Composite Structures-A First Step with Explicit Time Integration,” Nonlinear
Computational Mechanics- A State of the Art, Springer Verlag, New York, 1991.
[4] IIHS, “Crashworthiness Evaluation Side Impact Crash Test Protocol (version III)”,
Insurance Institute for Highway Safety, April 2004.
[5] R Adam, H., Patberg, L., Philipps, M. & Dittmann, R., “Testing of New Composite
Side Door Concepts”, Proceedings of the 1998 SAE International Congress &
Exposition, SAE Special Publications, Vol. 1320, pp. 23-30, 1998.
[6] Philipps, M., Patberg, L., Dittmann, R., Henrik, A., “Structural Analysis and
Testing of Composites in Automotive Crashworthiness Application”, SAE Special
Publications, Safety and Material Test Methodologies, v 1320,pp. 97-101, 1998.
[7] Jacob, C.G., Fellers, F.J, Simunovic, S., Starbuck, J.M., "Energy Absorption in
Polymer Composites for Automotive Crashworthiness", 1996.
[8] Fleming, D.C., “The Energy Absorption of Graphite/Epoxy Truncated Cones,” M.S.
Thesis, Department of Aerospace Engineering, University of Maryland, College
Park, 1991.
[9] Federal Motor Vehicle Safety Standards (FMVSS) No.214 “Side Impact Protection.
U.S Department of Transportation”, 1995.
[10] Farely, G.L., “Energy Absorption of Composite Materials”, Journal of composite Materials, Vol. 17, pp. 267-279, 1983.
[11] Philipps, M., Patberg, L., Dittmann, R., “Fiber-reinforced Composites in the Car Side Structure”. SAE Special publications, 981140, Safety and Material Test
Methodologies, v 1420, pp 105-107, Feb, 1998.
[12] Cheon, Seong Sik, "Composite Side-door Impact B-Pillar for Passenger Cars", Vol. 38, No. 1-4, pp. 229-239, 1997.
83
[13] Marklund, P.O., Nilson, L., “Optimization of a Car Body Component Subjected to Side Impact", Vol. 12, pp.100-105, 1999.
[14] Cing-Dao, Dhafer Marzougui, “Development of a 50th Percentile Hybrid III Dummy Model”, pp. 1-10, 2003.
[15] Joseph N. Kanianthra, Glen C.Rains and Thomas J. Trella. “Strategies for Passenger Car Design to Improve Occupant Protection in Real World Side
Crashes”, 1994.
[16] Nguyen, Q.M.,Elder J.D., Bayandor, J., Thomson, S.R., Scott, L.M., "A review of Explicit Finite Element Software for Composite Impact Analysis",1999.
[17] S. Ramakrishna and H. Hamada, “Energy Absorption Characteristics of Crash worthy Structural Composite Materials”, Engineering Materials, Vol. 141-143
pp.585-620, 1998.
[18] Thornton, P.H., “Energy Absorption in Composite Structures”, Journal of Composite Materials, Vol. 13, pp. 247-262, 1979.
[19] Mamalis, A.G.Robinson, M.Carruthers, “The Energy Absorption Properties of Composite Materials”, Composite Structures Vol. 37, pp 109-134, 1997.
[20] LS-Dyna User's Manual Version 970.
[21] MADYMO User Manual Version 6.0.1.
[22] Schweizerhof, K., Weimar, K., Th. Munz, Rottner, T., “Crashworthiness Analysis with Enhanced Composite Material Models in LS-DYNA Merits and Limits”, 1997.
[23] Johnson, A.F.,and Kohlgrüber, D., “ Modelling the Crash Response of Composite Aircraft Structures,” European Conference on Composite Materials Naples, Italy,
Vol. 1, pp. 283- 290, 1998.
[24] Honnagangaiah.K, ”Design and Evaluation of Car Front Sub frame Rails in a Sedan and its Corresponding Crash Injury Response”, M.S. Thesis, Department of
Mechanical Engineering, Wichita state university, 2006.
[27] Sheshadri, A., “Design and Analysis of a Composite Beam and its use in Reducing
the Side-impact Injuries in a Sedan”, M.S. Thesis, Department of Mechanical
Engineering, Wichita State University , Wichita, 2006.
[28] “National Highway Traffic Safety Administration Annual Report”, 2005.
[29] Hansun Chan, James.R.Hackney, Richard. M. Morgan, “An Analysis of Side Impact
Crash Data”, Conrad Technologies, pp. 0-12, 1998.

84
APPENDIX

85
APPENDIX
TABLE 15
GLASS FIBER PROPERTIES
Property Value Units
Density 1.97E-06 Kg/mm3
Ply longtitudinal modulus 45.84 Gpa
Ply transverse modulus 17.50 Gpa
Ply poisson's ratio 0.26 -
Ply shear modulus in plane 8.63 Gpa
Ply transverse modulus parallel to fiber direction 6.57 Gpa
Ply transverse modulus perpendicular to fiber
direction 8.63 Gpa
Ply longitudinal tensile strength 1.12 Gpa
Ply longitudinal compressive strength 0.9 Gpa
Ply transverse tensile strength 0.03 Gpa
Ply transverse compression strength 0.13 Gpa
Ply shear strength 0.07 Gpa

86
APPENDIX (Continued)
TABLE 16
CARBON PROPERTIES
Property Value Units
Density 1.58E-06 Kg/mm3
Ply longtitudinal modulus 142 Gpa
Ply transverse modulus 10.3 Gpa
Ply poisson's ratio 0.27 -
Ply shear modulus in plane 7.12 Gpa
Ply transverse modulus parallel to fiber direction 3.15 Gpa
Ply transverse modulus perpendicular to fiber
direction 7.12 Gpa
Ply longitudinal tensile strength 1.83 Gpa
Ply longitudinal compressive strength 1.09 Gpa
Ply transverse tensile strength 0.05 Gpa
Ply transverse compression strength 0.22 Gpa
Ply shear strength 0.07 Gpa