modeling a driver’s directional and longitudinal speed
TRANSCRIPT

Research ArticleModeling a Driver’s Directional and Longitudinal SpeedControl Based on Racing Track Features
JianfengWang ,1,2 Weihua Li ,1 Jun Li,2 Yiqun Liu ,1 Baoyu Song,2 and Haibo Gao2
1School of Automotive Engineering, Harbin Institute of Technology, Weihai, Shandong, China2State Key Laboratory of Robotics and System, Harbin Institute of Technology, Harbin, China
Correspondence should be addressed to Weihua Li; [email protected]
Received 19 October 2017; Accepted 1 April 2018; Published 8 May 2018
Academic Editor: Onome E. Scott-Emuakpor
Copyright © 2018 JianfengWang et al. This is an open access article distributed under the Creative Commons Attribution License,which permits unrestricted use, distribution, and reproduction in any medium, provided the original work is properly cited.
This study firstly analyses the driver’s manipulation behaviour and relates the different components of the driver model. Then, amodel controlling the driver directions is built according to the prediction-follower theory with the aim of improving the pointsearch algorithm. A model of the driving system of an electric vehicle is used to establish the longitudinal speed control model ofthe driver by using a feedforward-PID feedback control strategy. Our approach is to release the coupling between direction andspeed control and build an integrated model that includes the direction and speed for an arbitrary path. Finally, the characteristicsof an actual racing track are considered to establish the fastest driver control model. We simulated the typical operating conditionsof our driver operation model. The simulation confirmed the effectiveness of the improved predictive point search algorithm andthe integrated driver model to control the direction and speed for an arbitrary path.
1. Introduction
The study of driver behaviour is an important part of vehicledynamics and control research. Additionally, it is also animportant basis for the closed-loop evaluation of vehiclecontrol stability and the development of a vehicle-assisteddriving system [1]. When manipulating the vehicle, thedriver’s behaviour is a process consisting of simultaneouslyadjusting the direction and speed of the vehicle. This enablesthe vehicle to proceed safely in accordance with the driver’sintention. Driving behaviour mainly includes two aspects,namely, vehicle direction control and vehicle speed control.In this regard, the prediction-follower theory is a highlyeffective method to establish the driver model. Currently,driver models that are widely used in passenger cars forthe driver direction control and driver speed control areestablished based on neural network theory or simple PIDcontrol. However, this approach is only suitable for pathswith a small amount of curvature. A racing track, whichis characterised by a high adhesion coefficient and largecurvature, is quite different from an ordinary road.Therefore,the driver model for passenger cars is not fully applicable to
racing cars. It is thus highly important to establish a drivercontrolmodel based on the characteristics of the racing driverfor the development of a car control system.
Driver manipulation of the vehicle can be divided intothree parts, namely, information perception, prediction deci-sion, and control correction, as shown in Figure 1. Theinformation perception module describes the driver’s per-ception and understanding of the information such as thedriving environment of the road outside and the state ofvehicle motion. It provides the driver with effective roadenvironment data and information about the state of thevehicle, as well as the database of the prediction decisionmodule and the control calibration module. At present,the perception of the environment surrounding the vehiclemainly depends on the combined use of distance-measuringand visual sensors.The information provided by the distance-measuring sensor is accurate and real-time, whereas thevisual sensor collects richer information, because its algo-rithm is more mature. A combination of the two would behighly effective. Multiple sensors are often used to measurethe same object under complex conditions, in which case arandom class method, such as the weighted mean method,
HindawiShock and VibrationVolume 2018, Article ID 7487295, 12 pageshttps://doi.org/10.1155/2018/7487295

2 Shock and Vibration
Fron
t roa
d in
form
atio
n
Feas
ible
dom
ain
judg
men
t
Thecar
Externalinterference
Expe
cted
pat
h
Optimallateral
acceleration
Optimallongitudinalacceleration
Steeringwheel corner
Accelerator/brake pedal
Vehicle status information
ControlcorrectionPrediction decision
Informationperception
Driver model
Figure 1: Basic structure of the driver model.
multi-Bayesian estimation method, and intelligent controlmethod (e.g., fuzzy logic reasoning and a neural network),is used for data fusion [2–4]. Vehicle information, such asits location, yaw angle, centre of mass angle, longitudinalvelocity, lateral velocity, longitudinal acceleration, lateralacceleration, and wheel speed, is very important for thedesign of a vehicle chassis control system.The various vehicleinformation estimates are obtained by integrating the GPS,INS, and wheel speed information and necessitate the use ofa Kalman filter [5].
The decision module simulates the process by which thedriver chooses the best course of action from among a num-ber of viable alternatives [6]. For racing, the decision-makingprocess can be simplified as the shortest single-objectivedecision-making problem. Decision-making methods thatare commonly used are fuzzy reasoning, neural networks,machine learning, and so on. All of these algorithms areadaptive with the ability to learn.
The control calibration module simulates the process bywhich the driver manoeuvres the vehicle toward the desiredposition through the steering wheel, the accelerator pedal,and the brake pedal.The driver’s manipulation control actionis the reason for the change in the movement state of thevehicle.
Domestic and foreign scholars have studied the drivermodel in different ways. Sentouh et al. attempted to constructa cybernetic model of a driver steering road vehicle inorder to make the sensorimotor dynamics explicit [7]. Apartfrom the visual and kinesthetic perception, compensatoryand anticipatory processes were also taken into account inthis proposed model, which extended previous work. Theunknown parameters of the model were identified using thegrey box identification concept to simulate car trajectories.The driver-vehicle system was then analysed in order toimprove parameter sensitivity. Yang and Peng presentedan error-inducing car-following driver model, which wasdeveloped for the evaluation and design of active safety
systems [8]. They obtained car-following data from a large-scale naturalistic driving database to develop this model.Three error-inducing behaviours were introduced in thispaper, by which rear-end collisions with the lead vehiclecould occur. Gray et al. enforced safety constraints withminimal control intervention by using a robust Model Pre-dictive Controller (MPC) [9]. The robust MPC computesthe smallest corrective steering action required to ensurethe safety of the driver for all predicted trajectories. Theeffect of the proposed framework was shown in simulationsof a driver approaching multiple obstacles. By previewingthe path ahead of the vehicle, Chatzikomis and Spentzaspresented a combined longitudinal-lateral controller, whichregulated the steering angle and throttle/brake levels [10].The heading and position deviation between the vehicle andthe road were used as input in the lateral steering controller.The curvature of the path ahead of the vehicle was used inthe longitudinal speed controller in order to determine theappropriate velocity.Menhour et al. proposed amathematicaldrivermodel combined with 2-DOF PIDmultiple controllers[11]. Linear time invariant models were used to construct thismodel synthesised by the Ziegler-Nichols oscillationmethod.Li et al. presented a new comprehensive driver model forcritical manoeuvring conditions withmore accurate dynamiccontrol performance [12]. A new path-planning schemewas designed to maintain vehicle stability. Simulation wasused to validate the control performance compared withthe optimal preview driver model proposed before. Mikamiet al. developed a personalised driver assisting system,which made use of a driver behaviour model [13]. Theyproduced the Probability-weighted ARX (PrARX) model, asa driving behaviour model, to describe the driver’s vehicle-following skill. This model was based on a simple gradientdescent algorithm using actual driving data from a drivingsimulator.
This paper firstly improves the prediction point searchalgorithm on the basis of the propulsion optimisation

Shock and Vibration 3
f yF(s)
feP(s)
Figure 2: Prediction-follower system.
artificial neural network driver direction control model,making it suitable to follow a path with a large amount ofcurvature. Subsequently, a driver direction control model isestablished for racing drivers.We overcame the shortcomingsof PID control (slow response and large overshoot of driverspeed control model) by using a feedforward-PID feedbackcompound control strategy to establish the driver speedcontrol model. Furthermore, by releasing the couplingbetween the longitudinal and lateral dynamic characteristics,we built the integrated control driver model of direction andspeed for racing along an arbitrary path. Finally, in terms ofthe racing characteristics, the control driver model capableof supporting the fastest speed is established.
2. Establishment of Driver DirectionControl Model
Thedriver-vehicle closed-loop system could be understood asa system for following control based on the input informationof the previous path. This system could be modeled as atandem system with a previewer and a follower, knownas a prediction-follower system [14], as shown in Figure 2.A propulsion optimisation artificial neural network drivermodel was proposed by analysing the prediction-followsystem process and by combining artificial neural networktopology [15].
In practice, the driver could observe the front pathinformation in advance; thus the multipoint predictionmethod was used in the simulation. Because the driver couldnot take action immediately when receiving the pavementinformation, hysteresis and a first-order inertia link was usedin the simulation. In order to simplify the prediction artificialneural network driver model to reduce the calculation timeof the model, this study considered a single-layer neuralnetwork instead of the original neural network topology [16].According to [16], the prediction was further simplified asshown in Figure 3.
The dynamics of the vehicle was studied by simultane-ously simplifying the model. The vehicle could be simplifiedas a 2-DOF (degree-of-freedom) system [1, 17]. The modelparameters were determined by using an analytical methodfor error analysis to compute the parameters of the driver’sdirection control model [17], as shown in Figure 4. Thisallowed the driver direction control model to obtain theweight value and other parameters by the vehicle parameters,driver lag time constant, and prediction time. This greatlysimplified the parameter acquisition process of the model,which increased the applicability of the model.
The application of the simplified preview optimisationartificial neural network driver direction control modelrequires the vehicle model established in Carsim, a vehicledynamics simulation software of MSC company in USA, to
be equivalent to a 2-DOF vehiclemodel.Themethods were asfollows. In this study, we selected the trapezoidal signal as theinput signal of the Carsim vehicle model steering wheel angleto excite the frequency characteristics of the Carsim vehiclemodel, as shown in Figure 5(a). The signal was inputted tothe 2-DOF vehicle model and the Carsim vehicle model.The lateral accelerations of the 2-DOF vehicle model andthe Carsim vehicle model, 𝑎𝑦 and 𝑎𝑦 were extracted. Thedifference between them, 𝑎𝑦 − 𝑎𝑦, was set as the objectivefunction and the parameters of the model were obtained bythe optimisation method shown in
𝐽 = ∫𝑡0(𝑎𝑦 − 𝑎𝑦)2 𝑑𝑡. (1)
The identification results of the Carsim vehicle modelat different vehicle speeds are shown in Figures 5(b) and5(c). The results in the two figures indicate that the outputof the 2-DOF vehicle model could be consistent with theoutput of the Carsim vehicle model over a large vehicle speedrange.
Previously, researchers [18, 19] used a discrete numbertable to describe any path and proposed a prediction pointsearch algorithm for the small curvature path. This methodtransformed the trajectory following the time domain intothat following the spatial domain. Figure 6 showed the eight-shaped surrounding track of Fortinet Server AuthenticationExtension (FSAE), which was simplified for verification ofthe prediction point search algorithm. The HRT-15E racingcar model built in Carsim was used and the speed was40 km/h. The simulation result is shown in Figure 8. Thesimulation represented by the red solid line showed thatthe vehicle travel path terminated at a larger curvatureand that the next prediction point could not be correctlyidentified within the field of view after the current predictionpoint. The results proved that although this prediction pointsearch method suited the small curvature path well, it wouldnot meet the requirements of a racing track with highcurvature.
To solve the problem presented by tracking a path witha large amount of curvature, we improved the predictionsearch algorithm, as shown in Figure 7. The basic flow of theimproved prediction search algorithm is as follows:(1) finding the nearest point in the current position of thevehicle as the starting point of the next search in the tableshowing the centre line of the road ahead;(2) finding two adjacent points in the table, setting thepreview point exactly between the two points, then using alinear interpolation method to obtain the prediction point,and converting it into the vehicle coordinate system.
The same method was used to search the vehicle location[19], as shown in (2), although the method to search for theprediction point was different as shown in Figure 7.
[𝑥 (𝑚) − V𝑥𝑇] [𝑥 (𝑚 + 1) − V𝑥𝑇] ≤ 0. (2)
The distance covered by the vehicle should be equal tothe vehicle travel distance during the prediction time 𝑇𝑝, asfollows:
𝑆𝑑 = V𝑥 ⋅ 𝑇𝑝. (3)

4 Shock and Vibration
Coo
rdin
ate
tran
sform
atio
n
Coor
dina
tetr
ansfo
rmat
ion
Thecar
y
F(X(t))
Y(X(t))
1
2
4
3
∗sw sw 1
s
1
s
yye−ts
Tℎs + 1
eTs
Figure 3: Simplified model [16].
y
f feeTs 11
22
3344
∗sw sw 1
s
1
s
yye−ts
Tℎs + 1
1
K0
1
GayGay ·
Ty2 · s2 + Ty1 · s + 1
T2 · s2 + T1 · s + 1
y∗
Figure 4: Error analysis method.
Thus, the closest point in the prediction trajectory after thecurrent point could be determined by
[[𝑚∑𝑗=𝑖0
√(𝑥 (𝑗 + 1) − 𝑥 (𝑗))2 + (𝑦 (𝑗 + 1) − 𝑦 (𝑗))2
− V𝑥𝑇]]⋅ [[𝑚+1∑𝑗=𝑖0
√(𝑥 (𝑗 + 1) − 𝑥 (𝑗))2 + (𝑦 (𝑗 + 1) − 𝑦 (𝑗))2
− V𝑥𝑇]]≤ 0.
(4)
Further,Δ𝑓𝑝 could still be obtained by the linear interpolationmethod of the coordinates of point𝑚 and point𝑚 + 1 in thevehicle coordinate system.
Δ𝑓𝑝 = 𝑦 (𝑚) + 𝑦 (𝑚 + 1) − 𝑦 (𝑚)𝑥 (𝑚 + 1) − 𝑥 (𝑚) [V𝑥𝑇 − 𝑥 (𝑚)] . (5)
Again simulating under the same condition as beforeproduces the result shown in Figure 8. Clearly, the improvedprediction point search algorithm could track the largecurvature path well.
3. Driver Direction Control Model
The specific structure of the HRT-15E racing power transmis-sion systemwe studied as shown in Figure 9.The power drivesystem is mainly composed of the motor and transmissionsystem, with the torque provided by the motor responsiblefor powering the vehicle through the transmission system tothe drive wheel. The HRT-15E electric racing motor was ahigh-pressure water-cooled three-phase permanent magnetsynchronousmotor, named EMRAX 228, of the Enstroj com-pany, Slovenia, with a motor controller based on SVPWM(Space Vector Pulse Width Modulation) technology. Themotor characteristic curve is shown in Figure 10.
Because of the complexity of the model of the motordynamics [20], in this research we ignored the dynamiccharacteristics of the motor and were only concerned aboutthe input and output characteristics of the motor and itscontroller.
The vehicle chassis control system, including vehicledirection control and vehicle speed control, is controlledby the driver, who controls the vehicle via the steeringwheel, accelerator pedal, and brake pedal. The controlledsystem, which was a strongly nonlinear system with time-varying parameters, made it difficult to build the modelprecisely. In this study, a linear approximation method wasused to linearise the strong nonlinearity of the vehicle nearits equilibrium point [21, 22]. The effective input 𝜎 of theaccelerator pedal and brake pedalwas taken as the input of thepower drive unit. The motor output torque 𝑇𝑚 was taken asthe output of the power drive unit. The relationship between

Shock and Vibration 5
1 2 3 4 5 6 7 8 9 1000.0
0.2
0.4
0.6
0.8
1.0St
eerin
g w
heel
corn
er (r
ad)
Time (s)
(a)
2-DOF model outputCarsim model output
−2
−1
0
1
2
3
4
5
6
7
Late
ral a
ccel
erat
ion
(m/M
2)
1 2 3 4 5 6 7 8 9 100Time (s)
(b)
2-DOF model outputCarsim model output
Time (s)1 2 3 4 5 6 7 8 9 100
−10
−5
0
5
10
15
20
25
Late
ral a
ccel
erat
ion(G
/M2)
(c)
Figure 5: Identification results of the Carsim vehicle model. (a) Input signal. (b) V = 20 km/h. (c) V = 90 km/h.
5 10 15 20 25 30 35 400X (m)
−20
−15
−10
−5
0
5
10
15
20
Y (m
)
Figure 6: Figure-eight-shaped continuously looping track.

6 Shock and Vibration
X
Y
O
P
m
m
m + 1
Path
Travel distance
(t)
Δfp
o
i0i0
+ 1
y
Sd
x
Sd= x · Tp
Figure 7: Method of tracking a path with a large amount of curvature.
PathBeforeAfter
−202468
101214161820
Y (m
)
5 10 15 20 25 30 35 40 45 50 55 600X (m)
Figure 8: Simulation result of improved prediction point search algorithm.
Acceleration pedal
Brake pedalVehicle
controller
Energymanagement
system
MotorController
Powerbattery
pack
Gearbox Chaindrive DifferentialMotor
AC-DC
Wheel
Wheel
Signal
Electrical connectionsMechanical connection
Half axle
Half axle
Figure 9: HRT-15E racing power transmission system.

Shock and Vibration 7
Peak torque
Continuous
torque
Peak power
Continuous power
EMRAX 228 High Voltage LC
0
2000
4000
6000
8000
10000
12000
Pow
er (K
W)
0
60
120
180
240
300
360
Torq
ue (N
m)
1000 2000 3000 4000 50000Motor speed (rpm)
Figure 10: Motor characteristic curve.
10 20 30 40 50 60 70 80 90 1000Throttle opening 1 (%)
0
40
80
120
160
200
240
Mot
or to
rque
Tm
(Nm
)
Figure 11: Throttle opening and motor output torque curve.
the throttle opening and the motor output torque, based onthe design of the HRT-15E electric racing power drive unit, isshown in Figure 11 and is expressed by
𝑇𝑚 = {{{0 0 ≤ 𝜎1 ≤ 0.1,273 (𝜎1 − 0.1) 0.1 ≤ 𝜎1 ≤ 1. (6)
The throttlewas prevented fromopening during an emptystroke by tuning the throttle opening 𝜎1 according to theeffective input 𝜎 of the accelerator pedal. The relationshipbetween them was 𝜎1 = 0.1 + 0.9𝜎. Hence, the relationshipbetween the effective input of the accelerator pedal and theoutput torque 𝑇𝑚 of the motor was 𝑇𝑚 = 245𝜎. It wasdifficult to test the relationship between the output torqueof the motor and the effective input of the accelerator pedal,because of the lack of test equipment; thus, dynamic itemswere ignored.
This study mainly investigated the driving behaviour ofthe driver. Therefore, the transmission system was regardedas rigid, regardless of the torque and energy loss of the trans-mission process. The HRT-15E electric racing transmissionsystemmainly included a transmission chain, antiskid differ-ential, drive shaft, and wheel. Among them, the transmissionchain played the role of transmission and main reducerin traditional vehicles with an internal combustion engine.According to the number of teeth of the small and large
Front brake
Rear brake
Brake pedal
Front master cylinder
Rear mastercylinder
Figure 12: Dual-loop braking system in HRT-15E.
sprockets, the transmission ratio should be 3.077.The antislipdifferential only had a torque distribution function. Thispaper focused on the torque input and output characteristicsof the power drive system. The motor output torque 𝑇𝑚and the driving torque 𝑇𝑒 acting on the drive shaft satisfiedthe relationship in (7), which is the transmission systemmodel:
𝑇𝑒 = 𝑖 ⋅ 𝑇𝑚. (7)
Tomeet FSAE rules, a dual-loop braking systemwas usedin HRT-15E, as shown in Figure 12. This system facilitatedadjustment of the front and rear wheel braking force ratio.According to the braking system design scheme, the ratio ofthe front and rear wheel braking force was 4 : 6.
In the simplified prediction optimisation model of arti-ficial neural network driver direction control, movement ofthe vehicle in the prediction time was assumed to be uniformacceleration movement [15], even though this is not thecase in reality. In previous work [23], it was assumed thatduring the period of prediction time, the movement couldbe regarded as uniform acceleration, provided the speed didnot change dramatically. On this basis, a PID control strategycould be used to achieve longitudinal velocity control [22,24]. Considering the driver’s nerve response lag time 𝑡𝑑 andinertia lag time 𝑡ℎ, a lag 𝑒−𝑡𝑑𝑠/(𝑡ℎ𝑠 + 1) was connected inseries with the controller. The control strategy is depicted inFigure 13.
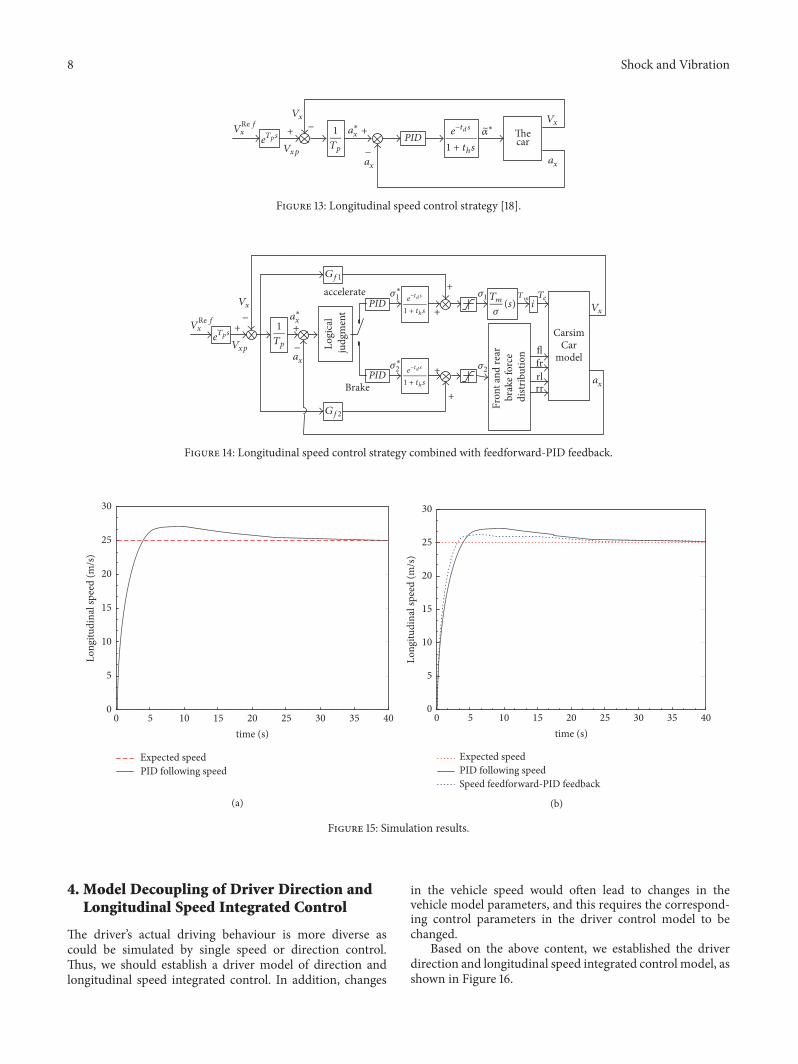
A longitudinal speed control simulation system for theHRT-15E electric racer was built based on the Simulink-Carsim simulation platform, which was the same as the sys-tem removing 𝐺𝑓1 and 𝐺𝑓2 in Figure 14. The expected speedtracking results are shown in Figure 15(a), which indicatesthat the tracking response time of the simple PID was slightlylonger and did not meet the fast response characteristics ofa racing driver. Thus, we built a longitudinal velocity controlstrategy combined with feedforward-PID feedback, as shownin Figure 14. The feedback, 𝐺𝑓1 and 𝐺𝑓2, could be obtainedby analysis of the control system.
The simulation results are presented in Figure 15(b). Theresponse time and overshoot of the improved model wereboth less than that of model based only on PID feedbackunder the same step signal. Therefore, a longitudinal speedcontrol strategy combined with feedforward-PID feedbackcould be effectively used in the development of an electricracing chassis control system.
8 Shock and Vibration
PID Thecar
+ − +
−
Vx Vx
Vxp
eTsV
2?fx a∗
x
ax ax
1
Tp
∗e−ts
1 + tℎs
Figure 13: Longitudinal speed control strategy [18].
CarsimCar
model
+−
+
−
i
Fron
t and
rear
br
ake f
orce
di
strib
utio
n
PID
Logi
cal
judg
men
tflfrrlrrBrake
acceleratePID
+
+
+
+
V2?fx
Vx Vx
Vxp
a∗x
ax
ax
1
TpeTs
Gf2
Gf1
e−ts
1 + tℎs
e−ts
1 + tℎs
∗1
∗2 2
1 TmTm
(s)
Te
Figure 14: Longitudinal speed control strategy combined with feedforward-PID feedback.
Expected speedPID following speed
0
5
10
15
20
25
30
Long
itudi
nal s
peed
(m/s
)
5 10 15 20 25 30 35 400time (s)
(a)
Expected speedPID following speedSpeed feedforward-PID feedback
5 10 15 20 25 30 35 400time (s)
0
5
10
15
20
25
30
Long
itudi
nal s
peed
(m/s
)
(b)
Figure 15: Simulation results.
4. Model Decoupling of Driver Direction andLongitudinal Speed Integrated Control
The driver’s actual driving behaviour is more diverse ascould be simulated by single speed or direction control.Thus, we should establish a driver model of direction andlongitudinal speed integrated control. In addition, changes
in the vehicle speed would often lead to changes in thevehicle model parameters, and this requires the correspond-ing control parameters in the driver control model to bechanged.
Based on the above content, we established the driverdirection and longitudinal speed integrated control model, asshown in Figure 16.

Shock and Vibration 9
CarsimCar
model
−
+
−
i
Fron
t and
re
ar b
raki
ng
forc
e di
strib
utio
n
PID
Logi
cal
judg
men
t
flfrrlrrBrake
Accelerate
Prediction pointalgorithm under
arbitrary path
X
Y
Drivermodel
Path data table
PID + +
+
+
TmTm Te
(s)
Vx
Vx
ax
Vy
Vy
ay
ay
∗1
∗2 2
1
Gf1
Gf2
a∗x
ax
1
Tp
Vx
Vxp
swΔfp
w22
w33
1
K0
1
Gay
e−ts
Tℎs + 1
w22 (Vx), w33 (Vx), , Gay (Vx)K0 (Vx)
X Y Vxp
X1 Y1 V1
X2 Y2 V2
· · ·
Xn Yn Vne−ts
1 + tℎs
e−ts
1 + tℎs
Figure 16: Direction and longitudinal speed integrated control model.
It is known that the coupling between the parametersrepresenting the lateral and longitudinal characteristics of thevehicle affects the parameters of the direction control modelor the longitudinal speed controlmodel [25, 26].Owing to thedifficulty in controlling the coupling system, it was desirableto decouple the coupling system into multiple independentsingle-input and single-output subsystems by realising thata certain output was only controlled by a certain input [27].Researchers have previously pointed out [18] that in a shorterprediction time interval, because of smaller changes in thevehicle status, the influence of the steering wheel on thelongitudinal characteristics was small and could be ignored.
The longitudinal velocity of the vehicle had a large effecton the lateral characteristics of the vehicle. The lateral gain𝐺𝑎𝑦 could be fitted to the function of longitudinal steady-stategain 𝑉𝑥 on the steering wheel angle. The above-mentionedparameter identification method was used to conduct anequivalent 2-DOF vehicle model parameter identification.These identification results were transformed into the lateralacceleration 𝐺𝑎𝑦 on the steering wheel steady-state gain,the functional relationship between the vehicle dynamicparameters, 𝑇𝑞1 and 𝑇𝑞2, and longitudinal velocity 𝑉𝑥. Thefitting results are shown in Figure 17. As for 𝑇𝑞1, the fittingresult was negative at the time 𝑉𝑥 = 0 km/h, which wasobviously unreasonable. Therefore, a compensation gain wasadded to correct the result, as shown in Figure 17(d).
Finally, our aim was to use the idea of ensuring localoptimal optimisation to achieve the global optimum as far aspossible to enable the vehicle on a local path to attain a highspeed to suit the characteristics of racing. This process wasrepeated to achieve the shortest travel time of the vehicle forthe overall path.
5. Simulation Analysis in TypicalOperating Conditions
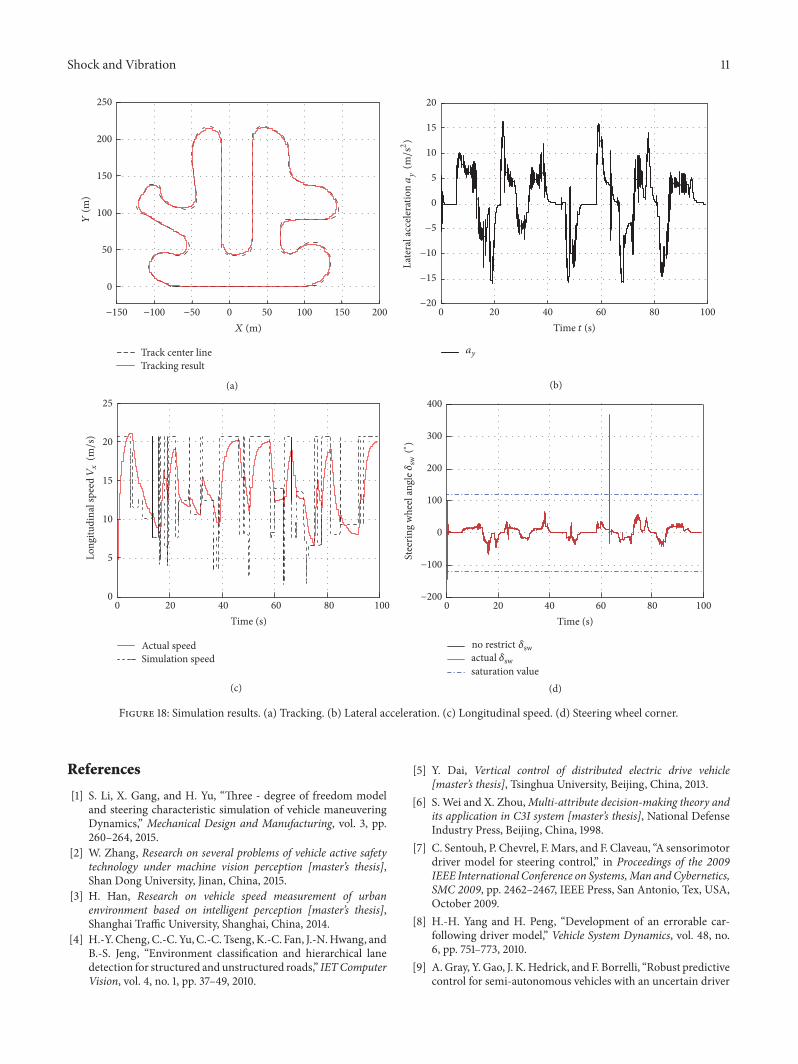
For this research, we chose the durable track located inXiangyang, China, which is one of the most complex racingtracks in China, as a typical working condition. The mainsimulation parameters were set as follows: the friction coef-ficient between the hot melt and the track is specified as𝜇 = 1.5, and the vehicle speed when running resistancewas balanced with the maximum driving force of the vehicle:𝑉𝑏 = 75 km/h.
The simulation results are shown in Figure 18.The electricracing carwas rapidly accelerated from stationary to the high-est speed and then decelerated (accelerated) as the curvatureincreased (decreased) until the mission was completed. Theresult in Figure 18(a) indicates that the model could track thelarge curvature path well, and the tracking deviation was verysmall.
Figure 18(b) shows that the lateral acceleration duringthe whole simulation process was less than 15m/s2 andFigure 18(c) shows that the longitudinal velocity varies withthe curvature of the curve. In Figure 18(d), it can be seenthat, at the larger curvature, the required steering wheel anglecalculated theoretically exceeded the maximum value of theHRT-15E steering system; as a result, the saturation value wasselected as the actual steering wheel input.
The simulation results of the durability track inXiangyang confirmed that the final model of the racingdriver could successfully complete the tracking task of atrack with a large amount of curvature. The model could befurther used for the development of an electric racing chassiscontrol system.

10 Shock and Vibration
GayGay fitting
5 10 15 20 25 30 35 40 450Speed Vx (m/s)
0
20
40
60
80
100
120G
ay
(a)
Tq1Tq1 fitting
5 10 15 20 25 30 35 40 450Speed Vx (m/s)
0.00
0.05
0.10
0.15
0.20
0.25
0.30
0.35
Tq
1
(b)
Tq2Tq2 fitting
5 10 15 20 25 30 35 40 450Speed Vx (m/s)
0.00
0.02
0.04
0.06
0.08
0.10
0.12
0.14
0.16
Tq
2
(c)
Tq1Tq1 fitting
−0.05
0.00
0.05
0.10
0.15
0.20
0.25
0.30
0.35Tq
1
5 10 15 20 25 30 35 40 450Speed Vx (m/s)
(d)
Figure 17: Fitting results. (a) 𝐺𝑎𝑦, (b) 𝑇𝑞1, (c) 𝑇𝑞2, (d) 𝑇𝑞1 correcting.
6. Conclusion
Based on the preview-follower theory, the improved previewpoint search algorithm is used to establish a driver directioncontrol model suitable for racing cars. The tracking simu-lation of an figure-eight-shaped continuously looping trackwas used to prove that the driver direction control model cansuccessfully track a path with a large amount of curvature.
On the basis of the power drive system model, thedriver longitudinal speed control model was established byimplementing feedforward-PID feedback. Simulation underthe same step signal proved that the longitudinal velocitycontrol model has a smaller response time and overshoot,which ismore accurate than themodelwithout improvement.
The driver model presented in this paper was constructedby combining the two driver models and a decouplingsystem, after which this combination was integrated with
the fastest speed control driver model, which achieves theshortest global travel time. Simulation of the durable trackin Xiangyang, China, proved that the final model is excellentfor completing a track with considerable curvature. Thus,the model can be effectively used in the development of anelectric racing chassis control system.
Conflicts of Interest
The authors declare that there are no conflicts of interestregarding the publication of this paper.
Acknowledgments
This study was supported in part by the Foundation ofChinese StateKey Laboratory of Robotics and Systems (Grantno. SKLRS201602B).
Shock and Vibration 11
Track center lineTracking result
−100 −50 0 50 100 150 200−150X (m)
0
50
100
150
200
250Y
(m)
(a)
0 40 60 80 10020Time t (s)
ay
−20
−15
−10
−5
0
5
10
15
20
Late
ral a
ccel
erat
ionay(G
/M2)
(b)
Actual speedSimulation speed
0
5
10
15
20
25
Long
itudi
nal s
peed
Vx(G
/M)
20 40 60 80 1000Time (s)
(c)
no restrictactualsaturation value
−200
−100
0
100
200
300
400St
eerin
g w
heel
angl
esw
swsw
(∘)
20 40 60 800 100Time (s)
(d)
Figure 18: Simulation results. (a) Tracking. (b) Lateral acceleration. (c) Longitudinal speed. (d) Steering wheel corner.
References
[1] S. Li, X. Gang, and H. Yu, “Three - degree of freedom modeland steering characteristic simulation of vehicle maneuveringDynamics,” Mechanical Design and Manufacturing, vol. 3, pp.260–264, 2015.
[2] W. Zhang, Research on several problems of vehicle active safetytechnology under machine vision perception [master’s thesis],Shan Dong University, Jinan, China, 2015.
[3] H. Han, Research on vehicle speed measurement of urbanenvironment based on intelligent perception [master’s thesis],Shanghai Traffic University, Shanghai, China, 2014.
[4] H.-Y.Cheng, C.-C. Yu,C.-C. Tseng, K.-C. Fan, J.-N.Hwang, andB.-S. Jeng, “Environment classification and hierarchical lanedetection for structured and unstructured roads,” IETComputerVision, vol. 4, no. 1, pp. 37–49, 2010.
[5] Y. Dai, Vertical control of distributed electric drive vehicle[master’s thesis], Tsinghua University, Beijing, China, 2013.
[6] S. Wei and X. Zhou,Multi-attribute decision-making theory andits application in C3I system [master’s thesis], National DefenseIndustry Press, Beijing, China, 1998.
[7] C. Sentouh, P. Chevrel, F. Mars, and F. Claveau, “A sensorimotordriver model for steering control,” in Proceedings of the 2009IEEE International Conference on Systems,Man andCybernetics,SMC 2009, pp. 2462–2467, IEEE Press, San Antonio, Tex, USA,October 2009.
[8] H.-H. Yang and H. Peng, “Development of an errorable car-following driver model,” Vehicle System Dynamics, vol. 48, no.6, pp. 751–773, 2010.
[9] A. Gray, Y. Gao, J. K. Hedrick, and F. Borrelli, “Robust predictivecontrol for semi-autonomous vehicles with an uncertain driver

12 Shock and Vibration
model,” in Proceedings of the IEEE Intelligent Vehicles Sympo-sium (IV ’13), pp. 208–213, Gold Coast, Australia, June 2013.
[10] C. I. Chatzikomis and K. N. Spentzas, “A path-following drivermodel with longitudinal and lateral control of vehicle’s motion,”Forschung im Ingenieurwesen, vol. 73, no. 4, pp. 257–266, 2009.
[11] L. Menhour, D. Lechner, and A. Charara, “Two degrees offreedom PIDmulti-controllers to design a mathematical drivermodel: Experimental validation and robustness tests,” VehicleSystem Dynamics, vol. 49, no. 4, pp. 595–624, 2011.
[12] H.-Z. Li, L. Li, J. Song, and L.-Y. Yu, “Comprehensive lateraldrivermodel for criticalmaneuvering conditions,” InternationalJournal of Automotive Technology, vol. 12, no. 5, pp. 679–686,2011.
[13] K. Mikami, H. Okuda, S. Taguchi, Y. Tazaki, and T. Suzuki,“Model predictive assisting control of vehicle following taskbased on driver model,” in Proceedings of the 2010 IEEEInternational Conference on Control Applications, CCA 2010, pp.890–895, Japan, September 2010.
[14] K. Guo, “Prediction of the large angle maneuvering motion ofthe closed loop system based on the theory of maneuvering,”Automotive Engineering, vol. 01, pp. 1–11, 1992.
[15] K. Guo, F. Pan, Y. Cheng, and H. Ding, “Driver model based onthe preview optimal artificial neural network,” in Proceedingsof the the 6th International Symposium on Advanced VehicleControl (AVEC’02), 2002.
[16] F. Pan,Human-car closed-loop system driver neural network inte-grated optimization modeling [master’s thesis], Jilin University,Changchun, China, 2001.
[17] Y. Cheng,TheDriver model based on error analysis and its appli-cation in ADAMS [master’s thesis], Jilin University, Changchun,China, 2003.
[18] F.Wan,Neural network drivermodel for vehicle handling stabilityevaluation [master’s thesis], Jilin University, Changchun, China,2005.
[19] H. Ding, K. Guo, F. Li, and J. Zhang, “Arbitrary path and speedfollowing driver model based on vehicle acceleration feedback,”Journal of Mechanical Engineering, vol. 46, no. 10, pp. 116–120,2010.
[20] Y. Liu, Research onmodulation strategy of dual-phase permanentmagnet synchronous starting generator for electric vehicle [mas-ter’s thesis], Harbin Institute of Technology,Harbin, China, 2014.
[21] L. Zhang, Research on unified decision model of vehicle driver’scontrol behavior [master’s thesis], Jilin University, Changchun,China, 2007.
[22] J. E. A. Dias, G. A. S. Pereira, and R. M. Palhares, “LongitudinalModel Identification and Velocity Control of an AutonomousCar,” IEEE Transactions on Intelligent Transportation Systems,vol. 16, no. 2, pp. 776–786, 2015.
[23] Y. Li, Direction and speed integrated control of driver modeland its application in ADAMS [master’s thesis], Jilin University,Changchun, China, 2008.
[24] H. Ding, K. Guo, F. Li, and J. Zhang, “Arbitrary path and speedfollowing driver model based on vehicle acceleration feedback,”Journal of Mechanical Engineering, vol. 46, no. 10, pp. 116–125,2010.
[25] M.Yamakado andM.Abe, “An experimentally confirmeddriverlongitudinal acceleration control model combined with vehiclelateral motion,”Vehicle System Dynamics, vol. 46, no. 1, pp. 129–149, 2008.
[26] Y.Koh,H.Her, K. Yi, andK.Kim, “Integrated speed and steeringcontrol drivermodel for vehicle-driver closed-loop simulation,”
IEEE Transactions on Vehicular Technology, vol. 65, no. 6, pp.4401–4411, 2016.
[27] C. Han, Remote sensing control analysis and design [master’sthesis], Xi’an Jiaotong University Press, Xi’an, China, 2011.

International Journal of
AerospaceEngineeringHindawiwww.hindawi.com Volume 2018
RoboticsJournal of
Hindawiwww.hindawi.com Volume 2018
Hindawiwww.hindawi.com Volume 2018
Active and Passive Electronic Components
VLSI Design
Hindawiwww.hindawi.com Volume 2018
Hindawiwww.hindawi.com Volume 2018
Shock and Vibration
Hindawiwww.hindawi.com Volume 2018
Civil EngineeringAdvances in
Acoustics and VibrationAdvances in
Hindawiwww.hindawi.com Volume 2018
Hindawiwww.hindawi.com Volume 2018
Electrical and Computer Engineering
Journal of
Advances inOptoElectronics
Hindawiwww.hindawi.com
Volume 2018
Hindawi Publishing Corporation http://www.hindawi.com Volume 2013Hindawiwww.hindawi.com
The Scientific World Journal
Volume 2018
Control Scienceand Engineering
Journal of
Hindawiwww.hindawi.com Volume 2018
Hindawiwww.hindawi.com
Journal ofEngineeringVolume 2018
SensorsJournal of
Hindawiwww.hindawi.com Volume 2018
International Journal of
RotatingMachinery
Hindawiwww.hindawi.com Volume 2018
Modelling &Simulationin EngineeringHindawiwww.hindawi.com Volume 2018
Hindawiwww.hindawi.com Volume 2018
Chemical EngineeringInternational Journal of Antennas and
Propagation
International Journal of
Hindawiwww.hindawi.com Volume 2018
Hindawiwww.hindawi.com Volume 2018
Navigation and Observation
International Journal of
Hindawi
www.hindawi.com Volume 2018
Advances in
Multimedia
Submit your manuscripts atwww.hindawi.com