model portfolio service - albertesharp.com model portfolio service risk rating 8/10 commentary to...
TRANSCRIPT

Model Portfolio Service
Risk Rating 1-2/10
Commentary To March 31st 2020
The Albert E Sharp Model 1-2 portfolio fell 6.3% in Q1 of 2020 against the benchmark 3 month LIBOR return of 0.2%. Over five years, the strategy is down 7.4% compared to the benchmark’s 3.0%.Fixed-Income was hit hard in March as credit spreads blew out to their widest levels since the financial crisis. Schroder Strategic Credit, Baillie Gifford Strategic Bond and RLAM Global Bond Opportunities were hit hardest, all falling more than 10% in the quarter. It is important to remember that just because these funds have experienced a drawdown, it doesn’t mean the underlying credits are non-performing and worthless. A narrowing of spreads and a return of liquidity across these markets and we could see a sizeable jump in the net asset value of each fund.In the absolute return allocation, our long/short equity hedge funds performed exactly as we wanted. Artemis US Absolute Return and BlackRock European Absolute Alpha both finished the quarter in positive territory, up 0.3% and 4.3% respectively. Muzinich Global Tactical Credit wasn’t able to follow suit, finishing down 7.3% suffering from similar liquidity issues to the wider fixed income market.Portfolio ChangesFollowing a number of changes made earlier in the quarter, we initiated the outright sale of Kames Property Income during March, incepting the trade on Friday 13th. This was successful across all major platforms bar True Potential, where dealing functionality prevented the swift sale we wanted before the fund subsequently suspended dealing at Midday on the 16th. The sale has not been reinvested and continues to sit as cash within the strategy.OutlookAlthough we have taken an optimistic view of equities in recent years, even when everything was rising in what was a pretty straight line, we were always cautious in making predictions, often reminding people that there is no such thing as a crystal ball; if someone does claim to have one, run! At no point in time is it more pertinent to remember this. The primary effects of current events are clearly evident, with lockdown in full swing there is a significantly diminished level of economic activity. What is yet to be understood is what the secondary and tertiary effects will be and indeed the scale of their impact. Without said crystal ball, the most pertinent path forward, as always, is the one which skews the probability in our favour. For this to occur, one must aim to survive; a point made by Terry Smith in a recent newsletter where he used Rick Mears’ famous quote, “In order to finish first. You must first finish”. Going concern is now the most important goal for companies and those with the highest probability of survival have the strongest balance sheets and ability to withstand a prolonged period of significantly lower earnings. Companies with such characteristics have generally been the best performers, especially in Q1 2020, as indicated by the MSCI US Quality Index’s drawdown of 15.1% compared to the MSCI US Value Index’s 25.9%. Do not get drawn into the notion that what led you into difficulty in the first place will then lead you out. Submitting to the natural human behaviour of scooping up shares in companies fallen by 50%+ with the attitude of “it can’t fall that much further” is a dangerous path. The downside remains 100% and the probability weighted upside significantly lower as a result of the chances of bankruptcy growing We will continue to hold funds invested in the highest quality companies, making sure in the process the underlying managers are sticking to their strategies and not being tempted by the ‘cheapness’ of lesser quality companies. The phrase ‘Never catch a falling knife,’ has never been more relevant.
Investment Objective
To achieve a return in excess of that received from a savings account over a rolling three year period. Downside protection is derived from diversification into fixed-income and absolute return funds.
This strategy is suitable for investors with the ‘very lowest’ rating of willingness to accept risk, according to Dynamic Planner®.
Portfolio Performance
Platform Availability
Albert E Sharp, 7 Elm Court, Arden Street, CV37 6PA
www.albertesharp.com 01789 404000 [email protected]
-2%
-1%
0%
1%
2%
3%
4%
5%
6%
7%
Cum
ulat
ive
Retu
rn
AES Model 1-2 (Net) 3 Month LIBOR Fixed-Income53%
Absolute Return, 38%
Cash, 9%

Albert E Sharp, 7 Elm Court, Arden Street, CV37 6PA
www.albertesharp.com 01789 404000 [email protected]
* Figures are net of underlying fund OCFs and Albert E Sharp AMC of 0.6% (inc VAT) p.a. charged monthly
Discrete Performance *
Cumulative Performance *
Risk & Return Analysis *
Capacity For Loss Analysis
Portfolio StatisticsAES Management Fees (p.a.) 0.5% + VAT
Custody Fees (p.a.) Variable Across Platforms
Estimated Portfolio Yield (p.a.) -
Portfolio OCF (p.a.) 0.60%
Minimum Investment £10,000
Strategy Launch Date 31st Dec 2010
Mapping & Benchmarks WMA ConservativeARC Sterling Cautious Asset PCI
IA Mixed Investment 0-35%eValue FE 1
Sterling 3-month LIBOR
Current Portfolio
Model Portfolio Service
Risk Rating 1-2/10
The views expressed in this report are not intended as an offer or solicitation for the purchase or sale of any investment or financial instrument. The views reflect the views of Albert E Sharp at the date of this document and, whilst the opinions stated are honestly held, they are not guarantees and should not be relied upon and may be subject to change without notice. Investments entail risks. Past performance is not necessarily a guide to future performance. There is no guarantee that you will recover the amount of your original investment. The information contained in this document does not constitute investment advice and should not be used as the basis of any investment decision. Any references to specific securities or indices are included for the purposes of illustration only and should not be construed as a recommendation to either buy or sell these securities, or invest in a particular sector. If you are in any doubt, please speak to us or your financial adviser as appropriate.
Issued by Albert E Sharp, a trading name of Albert E Sharp LLP which is authorised and regulated by the Financial Conduct Authority. © Albert E Sharp LLP 2019. Registered in England & Wales with the partnership number OC339858.
-3.9%
-1.8%
-1.0%
0.76%
2.01%
3.05%
-5%
-4%
-3%
-2%
-1%
0%
1%
2%
3%
4%
1YR 3YR 5YR
AES 1-2 3 Month LIBOR
AES 1-2
AES 2 AES 3
AES 4
AES 5
AES 6AES 7
AES 8
AES 10
-5%
0%
5%
10%
15%
20%
25%
30%
0 1 2 3 4 5 6 7 8 9 10 11 12 13 14
5 Ye
ar R
etur
n
Volatility (3yr Volatility Annualised)
Year Jan Feb Mar Apr May Jun Jul Aug Sep Oct Nov Dec FY2013 -0.20% 0.68% 1.76% 1.25% -2.42% -3.18% 0.41% -1.53% 0.42% 1.58% -0.10% 0.20% -1.25%2014 0.42% 0.57% 0.05% 0.25% 0.39% 0.11% 0.50% -0.03% -0.09% -0.41% 0.70% -0.12% 2.36%2015 1.40% 0.20% 0.08% -0.18% 0.11% -0.99% 0.18% -0.41% -0.39% 0.77% 0.09% -0.39% 0.45%2016 -0.41% -0.31% 0.53% 0.67% 0.48% -0.08% 0.96% 0.38% -0.34% -0.19% -1.24% 0.89% 1.32%2017 -0.02% 0.53% 0.20% 0.68% 0.60% -0.32% 0.29% 0.40% -0.40% 0.47% -0.04% 0.03% 2.44%2018 0.49% -0.75% -0.31% 0.15% -0.44% -0.11% 0.46% 0.01% -0.08% -0.23% -0.50% -0.08% -1.39%2019 0.83% 0.39% 0.66% 0.36% 0.13% 0.69% 0.47% 0.62% -0.14% -0.14% 0.24% 0.29% 4.48%2020 0.92% -0.84% -6.39% -6.32%
+5.2%
+20.0%
+42.9%
+55.1%
+112.3%
-3.7% -0.5% +9.6% +23.2% +66.2%
+0.5%+6.4%
+20.0%
+34.7%
+82.0%
-20%
0%
20%
40%
60%
80%
100%
120%
1m 12m 3y 5y 10y
AES 1-2 Return Profile: 31 Dec 1997 - 31 March 2020
Best Return Worst Return Average Return
Sector Fund Name WeightUK Corp Bonds RLAM Short Duration Credit 8.0%
Morgan Stanley Sterling Corporate Bond 7.0%PIMCO GIS UK Corp Bond 7.0%
UK Corp Bonds Total 22.0%Strategic Bonds Artemis Strategic Bond 8.0%
RLAM Global Bond Opps 8.0%Schroder Strat Credit Fund 8.0%Baillie Gifford Strat Bond 7.0%
Strategic Bonds Total 31.0%Equity L/S (AR) Artemis US Abs Ret 8.0%
BlackRock Euro Abs Alpha 8.0%Henderson UK Abs Ret 7.0%
Equity L/S (AR) Total 23.0%Specialist (A/R) Muzinich Global Tactical Credit 8.0%
Smith & Williamson Defensive Growth 7.0%Specialist (A/R) Total 15.0%Cash Cash 9.0%Cash Total 9.0%Grand Total 100.0%

Model Portfolio Service
Risk Rating 2/10
Commentary To March 31st 2020
The Albert E Sharp Model 2 portfolio fell 8.0% in Q1 of 2020 against the ARC Cautious Index’s -6.3%*. Over five years, the strategy is up 2.9% compared to the index’s 5.9%.Within our equity allocations, the move taken earlier this year to increase overseas exposure has had a material impact on performance as the pound crashed to a level against the dollar not seen since the mid-80s. In the US, adding the concentrated quality portfolio of Investec American Franchise highlighted the benefits of active management in the most efficient of equity markets. Year-to-date the fund is off 6.4% against the index’s 14.0%. Baillie Gifford American, a smaller position in the US allocation, finished the quarter in positive territory, up 1.5%. In the small cap space, Artemis US Smallers fared the worst amongst our US funds, down 19.2% for the quarter, yet still 6.5% ahead of its benchmark.In the UK, Lindsell Train UK Equity fell 15.9% against the All Share index’s 25.3%. UK Buffettology lagged, finishing down 26.4%.In Asia, the performance of Lindsell Train Japan surprised both us and the fund manager as it finished the quarter down just 3.3% against the index’s -11.8%, having rallied 10.5% in March. Elsewhere, Schroder Asian Alpha Plus and Legg Mason Japan finished the quarter down 14.1% and 19.3% respectively. Holding the currency hedged share class of the latter worked against us in this case as sterling lost 7.1% of its value against the yen.Man GLG Continental European Growth finished the quarter down just 9.8% against the Euro Stoxx 50’s -22.2%. It should be of no surprise that this outperformance is down to a philosophy which is uncompromising about company balance sheet strength. As a consequence the sector profile has avoided hardest hit sectors such as oil, banks and insurers; a common theme across the funds held within the model portfolio strategies.Fixed-Income was hit hard in March as credit spreads blew out to their widest levels since the financial crisis. Schroder Strategic Credit, Baillie Gifford Strategic Bond and RLAM Global Bond Opportunities were hit hardest, all falling more than 10% in the quarter. It is important to remember that just because these funds have experienced a drawdown, it doesn’t mean the underlying credits are non-performing and worthless. A narrowing of spreads and a return of liquidity across these markets and we could see a sizeable jump in the net asset value of each fund.In the absolute return allocation, our long/short equity hedge funds performed exactly as we wanted. Artemis US Absolute Return and BlackRock European Absolute Alpha both finished the quarter in positive territory, up 0.3% and 4.3% respectively. Muzinich Global Tactical Credit wasn’t able to follow suit, finishing down 7.3% suffering from similar liquidity issues to the wider fixed income market.
Portfolio ChangesFollowing a number of changes made earlier in the quarter, we initiated the outright sale of Kames Property Income during March, incepting the trade on Friday 13th. This was successful across all major platforms bar True Potential, where dealing functionality prevented the swift sale we wanted before the fund subsequently suspended dealing at Midday on the 16th. The sale has not been reinvested and continues to sit as cash within the strategy.OutlookAlthough we have taken an optimistic view of equities in recent years, even when everything was rising in what was a pretty straight line, we were always cautious in making predictions, often reminding people that there is no such thing as a crystal ball; if someone does claim to have one, run! At no point in time is it more pertinent to remember this. The primary effects of current events are clearly evident, with lockdown in full swing there is a significantly diminished level of economic activity. What is yet to be understood is what the secondary and tertiary effects will be and indeed the scale of their impact. Without said crystal ball, the most pertinent path forward, as always, is the one which skews the probability in our favour. For this to occur, one must aim to survive; a point made by Terry Smith in a recent newsletter where he used Rick Mears’ famous quote, “In order to finish first. You must first finish”. Going concern is now the most important goal for companies and those with the highest probability of survival have the strongest balance sheets and ability to withstand a prolonged period of significantly lower earnings. Companies with such characteristics have generally been the best performers, especially in Q1 2020, as indicated by the MSCI US Quality Index’s drawdown of 15.1% compared to the MSCI US Value Index’s 25.9%. Do not get drawn into the notion that what led you into difficulty in the first place will then lead you out. Submitting to the natural human behaviour of scooping up shares in companies fallen by 50%+ with the attitude of “it can’t fall that much further” is a dangerous path. The downside remains 100% and the probability weighted upside significantly lower as a result of the chances of bankruptcy growing We will continue to hold funds invested in the highest quality companies, making sure in the process the underlying managers are sticking to their strategies and not being tempted by the ‘cheapness’ of lesser quality companies. The phrase ‘Never catch a falling knife,’ has never been more relevant.*ARC performance numbers are provisional estimates, based upon a sample of ETFs. This is subject to revision based on actual performance of ARC contributors.
Investment Objective
To achieve a moderate level of total return. Up to 20% of the portfolio may be invested in UK and international equities, downside protection is derived from diversification into fixed-income and absolute return funds.
This strategy is suitable for investors with a ‘very low’ rating of willingness to accept risk, according to Dynamic Planner®.
Portfolio Performance
Platform Availability
Albert E Sharp, 7 Elm Court, Arden Street, CV37 6PA
www.albertesharp.com 01789 404000 [email protected]
-10%
-5%
0%
5%
10%
15%
20%
25%
30%
35%
40%
Cum
ulat
ive
Retu
rn
AES Model 2 (Net) ARC Cautious PCI UK All Share [TR] Equity17%
Fixed-Income, 46%
Absolute Return, 28%
Cash, 9%

* Figures are net of underlying fund OCFs and Albert E Sharp AMC of 0.6% (inc VAT) p.a. charged monthly
Discrete Performance *
Cumulative Performance *
Risk & Return Analysis *
Capacity For Loss Analysis
Portfolio StatisticsAES Management Fees (p.a.) 0.5% + VAT
Custody Fees (p.a.) Variable Across Platforms
Estimated Portfolio Yield (p.a.) -
Portfolio OCF (p.a.) 0.59%
Minimum Investment £10,000
Strategy Launch Date 31st Dec 2010
Mapping & Benchmarks WMA ConservativeARC Sterling Cautious Asset PCI
IA Mixed Investment 0-35%eValue FE 2
Current Portfolio
Model Portfolio Service
Risk Rating 2/10
-4.0%
-0.1%
2.9%
-2.1%
0.2%
5.9%
-18.5%
-12.2%
2.9%
-20%
-15%
-10%
-5%
0%
5%
10%
1YR 3YR 5YRAES 2 ARC Cautious PCI All Share TR
AES 1-2
AES 2 AES 3
AES 4
AES 5
AES 6AES 7
AES 8
AES 10
-5%
0%
5%
10%
15%
20%
25%
30%
0 1 2 3 4 5 6 7 8 9 10 11 12 13 14
5 Ye
ar R
etur
n
Volatility (3yr Volatility Annualised)
Year Jan Feb Mar Apr May Jun Jul Aug Sep Oct Nov Dec FY2013 0.11% 1.39% 1.39% 1.57% -1.39% -2.89% 1.48% -1.85% 0.88% 2.11% -1.33% -0.59% 0.73%2014 0.41% 0.85% -0.15% 0.38% 1.00% 0.22% 0.54% 0.65% -0.27% -0.10% 1.26% -0.19% 4.68%2015 1.90% 0.73% 0.17% 0.04% 0.62% -1.48% 0.22% -1.24% -0.87% 1.48% 0.32% -0.35% 1.49%2016 -1.58% -0.18% 1.03% 0.38% 0.79% -0.52% 2.13% 0.64% 0.05% 0.04% -1.01% 1.20% 2.95%2017 0.24% 0.77% 0.34% 0.67% 0.92% -0.44% 0.40% 0.62% -0.34% 1.01% -0.04% 0.36% 4.59%2018 0.44% -0.84% -0.80% 0.75% 0.26% -0.08% 0.73% 0.30% -0.01% -1.58% -0.21% -1.11% -2.16%2019 1.45% 0.62% 0.97% 1.16% -0.44% 1.25% 1.09% 0.14% -0.04% -0.26% 0.79% 0.48% 7.43%2020 0.53% -1.88% -6.69% -7.96%
4.0%
18.6%
42.8%53.1%
105.8%
-4.8% -6.6%2.6% 20.7% 62.0%
0.5%6.3%
19.3%
33.1%
75.7%
-20%
0%
20%
40%
60%
80%
100%
120%
1m 12m 3y 5y 10y
AES 2 Return Profile: 31 Dec 1997 - 31 March 2020
Best Return Worst Return Average Return
Sector Fund Name WeightUK Equity LF Lindsell Train UK Equity Fund 2.0%
CFP SDL UK Buffettology 2.0%UK Equity Total 4.0%US Equity HSBC American Index 3.5%
Investec American 2.5%Artemis US Smaller Cos 1.5%
US Equity Total 7.5%Europe ex-UK Equity Man GLG Continental Europe 1.5%Europe ex-UK Equity Total 1.5%Japan Equity Lindsell Train Japan 1.0%
Legg Mason Japan Equity (Hdg) 1.0%Japan Equity Total 2.0%Asia Pac ex-Jpn Equity Schroder Asia Alpha Plus 1.0%Asia Pac ex-Jpn Equity Total 1.0%Emg Market Equity Fidelity Emerging Markets Focus 1.0%Emg Market Equity Total 1.0%UK Corp Bonds RLAM Short Duration Credit 7.0%
MS Sterling Corporate Bond 6.0%PIMCO GIS UK Corp Bond 6.0%
UK Corp Bonds Total 19.0%Strategic Bonds Artemis Strategic Bond 7.0%
RLAM Global Bond Opps 7.0%Schroder Strat Credit Fund 7.0%Baillie Gifford Strat Bond 6.0%
Strategic Bonds Total 27.0%Equity L/S (AR) BlackRock Euro Abs Alpha 7.5%
Artemis US Abs Ret 7.5%Equity L/S (AR) Total 15.0%Specialist (A/R) Muzinich Global Tactical Credit 7.0%
Smith & Williamson Defensive Growth 6.0%Specialist (A/R) Total 13.0%Cash Cash 9.0%Cash Total 9.0%Grand Total 100.0%
Albert E Sharp, 7 Elm Court, Arden Street, CV37 6PA
www.albertesharp.com 01789 404000 [email protected]
The views expressed in this report are not intended as an offer or solicitation for the purchase or sale of any investment or financial instrument. The views reflect the views of Albert E Sharp at the date of this document and, whilst the opinions stated are honestly held, they are not guarantees and should not be relied upon and may be subject to change without notice. Investments entail risks. Past performance is not necessarily a guide to future performance. There is no guarantee that you will recover the amount of your original investment. The information contained in this document does not constitute investment advice and should not be used as the basis of any investment decision. Any references to specific securities or indices are included for the purposes of illustration only and should not be construed as a recommendation to either buy or sell these securities, or invest in a particular sector. If you are in any doubt, please speak to us or your financial adviser as appropriate.
Issued by Albert E Sharp, a trading name of Albert E Sharp LLP which is authorised and regulated by the Financial Conduct Authority. © Albert E Sharp LLP 2019. Registered in England & Wales with the partnership number OC339858.

Model Portfolio Service
Risk Rating 3/10
Commentary To March 31st 2020
The Albert E Sharp Model 3 portfolio fell 8.4% in Q1 of 2020 against the ARC Cautious Index’s -6.3%*. Over five years, the strategy is up 3.0% compared to the index’s 5.7%.Within our equity allocations, the move taken earlier this year to increase overseas exposure has had a material impact on performance as the pound crashed to a level against the dollar not seen since the mid-80s. In the US, adding the concentrated quality portfolio of Investec American Franchise highlighted the benefits of active management in the most efficient of equity markets. Year-to-date the fund is off 6.4% against the index’s 14.0%. Baillie Gifford American, a smaller position in the US allocation, finished the quarter in positive territory, up 1.5%. In the small cap space, Artemis US Smallers fared the worst amongst our US funds, down 19.2% for the quarter, yet still 6.5% ahead of its benchmark.In the UK, Lindsell Train UK Equity fell 15.9% against the All Share index’s 25.3%. UK Buffettology lagged, finishing down 26.4%.In Asia, the performance of Lindsell Train Japan surprised both us and the fund manager as it finished the quarter down just 3.3% against the index’s -11.8%, having rallied 10.5% in March. Elsewhere, Schroder Asian Alpha Plus and Legg Mason Japan finished the quarter down 14.1% and 19.3% respectively. Holding the currency hedged share class of the latter worked against us in this case as sterling lost 7.1% of its value against the yen.Man GLG Continental European Growth finished the quarter down just 9.8% against the Euro Stoxx 50’s -22.2%. It should be of no surprise that this outperformance is down to a philosophy which is uncompromising about company balance sheet strength. As a consequence the sector profile has avoided hardest hit sectors such as oil, banks and insurers; a common theme across the funds held within the model portfolio strategies.Fixed-Income was hit hard in March as credit spreads blew out to their widest levels since the financial crisis. Schroder Strategic Credit, Baillie Gifford Strategic Bond and RLAM Global Bond Opportunities were hit hardest, all falling more than 10% in the quarter. It is important to remember that just because these funds have experienced a drawdown, it doesn’t mean the underlying credits are non-performing and worthless. A narrowing of spreads and a return of liquidity across these markets and we could see a sizeable jump in the net asset value of each fund.In the absolute return allocation, our long/short equity hedge funds performed exactly as we wanted. Artemis US Absolute Return and BlackRock European Absolute Alpha both finished the quarter in positive territory, up 0.3% and 4.3% respectively. Muzinich Global Tactical Credit wasn’t able to follow suit, finishing down 7.3% suffering from similar liquidity issues to the wider fixed income market.
Portfolio ChangesFollowing a number of changes made earlier in the quarter, we initiated the outright sale of Kames Property Income during March, incepting the trade on Friday 13th. This was successful across all major platforms bar True Potential, where dealing functionality prevented the swift sale we wanted before the fund subsequently suspended dealing at Midday on the 16th. The sale has not been reinvested and continues to sit as cash within the strategy.OutlookAlthough we have taken an optimistic view of equities in recent years, even when everything was rising in what was a pretty straight line, we were always cautious in making predictions, often reminding people that there is no such thing as a crystal ball; if someone does claim to have one, run! At no point in time is it more pertinent to remember this. The primary effects of current events are clearly evident, with lockdown in full swing there is a significantly diminished level of economic activity. What is yet to be understood is what the secondary and tertiary effects will be and indeed the scale of their impact. Without said crystal ball, the most pertinent path forward, as always, is the one which skews the probability in our favour. For this to occur, one must aim to survive; a point made by Terry Smith in a recent newsletter where he used Rick Mears’ famous quote, “In order to finish first. You must first finish”. Going concern is now the most important goal for companies and those with the highest probability of survival have the strongest balance sheets and ability to withstand a prolonged period of significantly lower earnings. Companies with such characteristics have generally been the best performers, especially in Q1 2020, as indicated by the MSCI US Quality Index’s drawdown of 15.1% compared to the MSCI US Value Index’s 25.9%. Do not get drawn into the notion that what led you into difficulty in the first place will then lead you out. Submitting to the natural human behaviour of scooping up shares in companies fallen by 50%+ with the attitude of “it can’t fall that much further” is a dangerous path. The downside remains 100% and the probability weighted upside significantly lower as a result of the chances of bankruptcy growing We will continue to hold funds invested in the highest quality companies, making sure in the process the underlying managers are sticking to their strategies and not being tempted by the ‘cheapness’ of lesser quality companies. The phrase ‘Never catch a falling knife,’ has never been more relevant.
*ARC performance numbers are provisional estimates, based upon a sample of ETFs. This is subject to revision based on actual performance of ARC contributors.
Investment Objective
To achieve a moderate level of total return. Up to 40% of the portfolio may be invested in UK and international equities, downside protection is derived from diversification into fixed-income and absolute return funds.
This strategy is suitable for investors with a ‘low’ rating of willingness to accept risk, according to Dynamic Planner®.
Portfolio Performance
Platform Availability
Albert E Sharp, 7 Elm Court, Arden Street, CV37 6PA
www.albertesharp.com 01789 404000 [email protected]
-10%
-5%
0%
5%
10%
15%
20%
25%
30%
35%
40%
Cum
ulat
ive
Retu
rn
AES Model 3 (Net) ARC Cautious PCI UK All Share [TR]Equity
24%
Fixed-Income, 42%
Absolute Return, 26%
Cash, 9%

* Figures are net of underlying fund OCFs and Albert E Sharp AMC of 0.6% (inc VAT) p.a. charged monthly
Discrete Performance *
Cumulative Performance *
Risk & Return Analysis *
Capacity For Loss Analysis
Portfolio StatisticsAES Management Fees (p.a.) 0.5% + VAT
Custody Fees (p.a.) Variable Across Platforms
Estimated Portfolio Yield (p.a.) -
Portfolio OCF (p.a.) 0.61%
Minimum Investment £10,000
Strategy Launch Date 31st Dec 2010
Mapping & Benchmarks WMA ConservativeARC Sterling Cautious Asset PCI
IA Mixed Investment 0-35%eValue FE 3
Current Portfolio
Model Portfolio Service
Risk Rating 3/10
Sector Fund Name WeightUK Equity LF Lindsell Train UK Equity Fund 2.5%
CFP SDL UK Buffettology 2.5%UK Equity Total 5.0%US Equity HSBC American Index 3.5%
Investec American 2.5%Artemis US Smaller Cos 2.5%
US Equity Total 8.5%Europe ex-UK Equity Man GLG Continental Europe 3.0%Europe ex-UK Equity Total 3.0%Japan Equity Lindsell Train Japan 1.5%
Legg Mason Japan Equity (Hdg) 1.5%Japan Equity Total 3.0%Asia Pac ex-Jpn Equity Schroder Asia Alpha Plus 2.0%Asia Pac ex-Jpn Equity Total 2.0%Emg Market Equity Fidelity Emerging Markets Focus 2.0%Emg Market Equity Total 2.0%UK Corp Bonds RLAM Short Duration Credit 6.5%
MS Sterling Corporate Bond 6.0%PIMCO GIS UK Corp Bond 6.0%
UK Corp Bonds Total 18.5%Strategic Bonds Artemis Strategic Bond 6.0%
RLAM Global Bond Opps 6.0%Schroder Strat Credit Fund 6.0%Baillie Gifford Strat Bond 5.0%
Strategic Bonds Total 23.0%Equity L/S (AR) BlackRock Euro Abs Alpha 7.0%
Artemis US Abs Ret 7.0%Equity L/S (AR) Total 14.0%Specialist (A/R) Muzinich Global Tactical Credit 7.0%
Smith & Williamson Defensive Growth 5.0%Specialist (A/R) Total 12.0%Cash Cash 9.0%Cash Total 9.0%Grand Total 100.0%
-4.5%
-0.8%
3.0%
-2.1%
0.2%
5.9%
-18.5%
-12.2%
2.9%
-20%
-15%
-10%
-5%
0%
5%
10%
1YR 3YR 5YRAES 3 ARC Cautious PCI All Share TR
AES 1-2
AES 2 AES 3
AES 4
AES 5
AES 6AES 7
AES 8
AES 10
-5%
0%
5%
10%
15%
20%
25%
30%
0 1 2 3 4 5 6 7 8 9 10 11 12 13 14
5 Ye
ar R
etur
n
Volatility (3yr Volatility Annualised)
Year Jan Feb Mar Apr May Jun Jul Aug Sep Oct Nov Dec FY2013 1.35% 1.65% 1.62% 1.91% 0.54% -3.35% 2.77% -1.25% 0.69% 2.73% -0.80% -0.12% 7.83%2014 0.50% 1.45% -0.27% 0.59% 1.61% -0.19% 0.46% 2.09% -0.91% 0.66% 2.09% 0.51% 8.88%2015 3.76% -0.76% 1.01% 0.11% 0.73% -1.94% 0.18% -1.78% -1.09% 1.87% 0.53% -0.32% 2.18%2016 -2.08% -0.12% 1.35% 0.24% 0.84% -0.51% 2.73% 0.80% 0.35% 0.15% -1.04% 1.13% 3.82%2017 0.32% 0.92% 0.50% 0.68% 1.09% -0.52% 0.52% 0.79% -0.35% 1.21% -0.02% 0.52% 5.79%2018 0.43% -0.85% -0.96% 0.85% 0.52% -0.13% 0.76% 0.17% -0.03% -2.24% -0.21% -1.45% -3.14%2019 1.40% 0.66% 1.08% 1.38% -0.85% 1.38% 1.11% -0.02% 0.02% -0.32% 0.93% 0.58% 7.57%2020 0.27% -2.21% -6.58% -8.39%
4.4%
19.5%
43.2%52.4%
108.4%
-5.6% -9.2%
-0.2%20.6% 63.0%
0.5%6.5%
19.9%
34.2%
78.7%
-20%
0%
20%
40%
60%
80%
100%
120%
1m 12m 3y 5y 10y
AES 3 Return Profile: 31 Dec 1997 - 31 March 2020
Best Return Worst Return Average Return
Albert E Sharp, 7 Elm Court, Arden Street, CV37 6PA
www.albertesharp.com 01789 404000 [email protected]
The views expressed in this report are not intended as an offer or solicitation for the purchase or sale of any investment or financial instrument. The views reflect the views of Albert E Sharp at the date of this document and, whilst the opinions stated are honestly held, they are not guarantees and should not be relied upon and may be subject to change without notice. Investments entail risks. Past performance is not necessarily a guide to future performance. There is no guarantee that you will recover the amount of your original investment. The information contained in this document does not constitute investment advice and should not be used as the basis of any investment decision. Any references to specific securities or indices are included for the purposes of illustration only and should not be construed as a recommendation to either buy or sell these securities, or invest in a particular sector. If you are in any doubt, please speak to us or your financial adviser as appropriate.
Issued by Albert E Sharp, a trading name of Albert E Sharp LLP which is authorised and regulated by the Financial Conduct Authority. © Albert E Sharp LLP 2019. Registered in England & Wales with the partnership number OC339858.
Model Portfolio Service
RISK RATING 4/10
Commentary To March 31st 2020
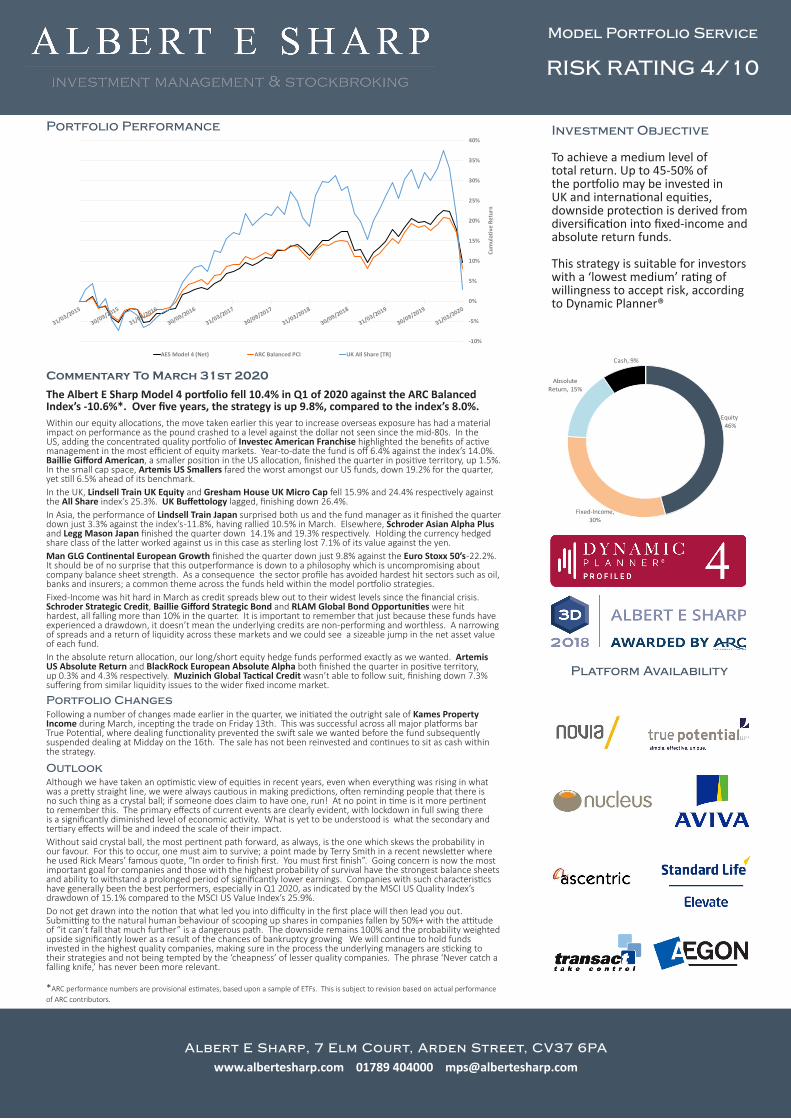
The Albert E Sharp Model 4 portfolio fell 10.4% in Q1 of 2020 against the ARC Balanced Index’s -10.6%*. Over five years, the strategy is up 9.8%, compared to the index’s 8.0%.Within our equity allocations, the move taken earlier this year to increase overseas exposure has had a material impact on performance as the pound crashed to a level against the dollar not seen since the mid-80s. In the US, adding the concentrated quality portfolio of Investec American Franchise highlighted the benefits of active management in the most efficient of equity markets. Year-to-date the fund is off 6.4% against the index’s 14.0%. Baillie Gifford American, a smaller position in the US allocation, finished the quarter in positive territory, up 1.5%. In the small cap space, Artemis US Smallers fared the worst amongst our US funds, down 19.2% for the quarter, yet still 6.5% ahead of its benchmark.In the UK, Lindsell Train UK Equity and Gresham House UK Micro Cap fell 15.9% and 24.4% respectively against the All Share index’s 25.3%. UK Buffettology lagged, finishing down 26.4%.In Asia, the performance of Lindsell Train Japan surprised both us and the fund manager as it finished the quarter down just 3.3% against the index’s -11.8%, having rallied 10.5% in March. Elsewhere, Schroder Asian Alpha Plus and Legg Mason Japan finished the quarter down 14.1% and 19.3% respectively. Holding the currency hedged share class of the latter worked against us in this case as sterling lost 7.1% of its value against the yen.Man GLG Continental European Growth finished the quarter down just 9.8% against the Euro Stoxx 50’s -22.2%. It should be of no surprise that this outperformance is down to a philosophy which is uncompromising about company balance sheet strength. As a consequence the sector profile has avoided hardest hit sectors such as oil, banks and insurers; a common theme across the funds held within the model portfolio strategies.Fixed-Income was hit hard in March as credit spreads blew out to their widest levels since the financial crisis. Schroder Strategic Credit, Baillie Gifford Strategic Bond and RLAM Global Bond Opportunities were hit hardest, all falling more than 10% in the quarter. It is important to remember that just because these funds have experienced a drawdown, it doesn’t mean the underlying credits are non-performing and worthless. A narrowing of spreads and a return of liquidity across these markets and we could see a sizeable jump in the net asset value of each fund.In the absolute return allocation, our long/short equity hedge funds performed exactly as we wanted. Artemis US Absolute Return and BlackRock European Absolute Alpha both finished the quarter in positive territory, up 0.3% and 4.3% respectively. Muzinich Global Tactical Credit wasn’t able to follow suit, finishing down 7.3% suffering from similar liquidity issues to the wider fixed income market.
Portfolio ChangesFollowing a number of changes made earlier in the quarter, we initiated the outright sale of Kames Property Income during March, incepting the trade on Friday 13th. This was successful across all major platforms bar True Potential, where dealing functionality prevented the swift sale we wanted before the fund subsequently suspended dealing at Midday on the 16th. The sale has not been reinvested and continues to sit as cash within the strategy.
OutlookAlthough we have taken an optimistic view of equities in recent years, even when everything was rising in what was a pretty straight line, we were always cautious in making predictions, often reminding people that there is no such thing as a crystal ball; if someone does claim to have one, run! At no point in time is it more pertinent to remember this. The primary effects of current events are clearly evident, with lockdown in full swing there is a significantly diminished level of economic activity. What is yet to be understood is what the secondary and tertiary effects will be and indeed the scale of their impact. Without said crystal ball, the most pertinent path forward, as always, is the one which skews the probability in our favour. For this to occur, one must aim to survive; a point made by Terry Smith in a recent newsletter where he used Rick Mears’ famous quote, “In order to finish first. You must first finish”. Going concern is now the most important goal for companies and those with the highest probability of survival have the strongest balance sheets and ability to withstand a prolonged period of significantly lower earnings. Companies with such characteristics have generally been the best performers, especially in Q1 2020, as indicated by the MSCI US Quality Index’s drawdown of 15.1% compared to the MSCI US Value Index’s 25.9%. Do not get drawn into the notion that what led you into difficulty in the first place will then lead you out. Submitting to the natural human behaviour of scooping up shares in companies fallen by 50%+ with the attitude of “it can’t fall that much further” is a dangerous path. The downside remains 100% and the probability weighted upside significantly lower as a result of the chances of bankruptcy growing We will continue to hold funds invested in the highest quality companies, making sure in the process the underlying managers are sticking to their strategies and not being tempted by the ‘cheapness’ of lesser quality companies. The phrase ‘Never catch a falling knife,’ has never been more relevant.
*ARC performance numbers are provisional estimates, based upon a sample of ETFs. This is subject to revision based on actual performance of ARC contributors.
Investment Objective
To achieve a medium level of total return. Up to 45-50% of the portfolio may be invested in UK and international equities, downside protection is derived from diversification into fixed-income and absolute return funds.
This strategy is suitable for investors with a ‘lowest medium’ rating of willingness to accept risk, according to Dynamic Planner®
Platform Availability
Albert E Sharp, 7 Elm Court, Arden Street, CV37 6PA
www.albertesharp.com 01789 404000 [email protected]
Portfolio Performance
-10%
-5%
0%
5%
10%
15%
20%
25%
30%
35%
40%
Cum
ulat
ive
Retu
rn
AES Model 4 (Net) ARC Balanced PCI UK All Share [TR]
Equity46%
Fixed-Income, 30%
Absolute Return, 15%
Cash, 9%

Discrete Performance *
Current Portfolio
Portfolio StatisticsAES Management Fees (p.a.) 0.5% + VAT
Custody Fees (p.a.) Variable Across Platforms
Estimated Portfolio Yield (p.a.) -
Portfolio OCF (p.a.) 0.64%
Minimum Investment £10,000
Strategy Launch Date 31st Dec 2010
Mapping & Benchmarks WMA IncomeARC Sterling Balanced Asset PCI
IA Mixed Investment 20-60%eValue FE 4
Cumulative Performance *
Risk & Return Analysis *
Capacity For Loss Analysis
Model Portfolio Service
RISK RATING 4/10
Sector Fund Name WeightUK Equity CFP SDL UK Buffettology 4.5%
LF Lindsell Train UK Equity Fund 4.5%Gresham House UK Microcap 2.0%
UK Equity Total 11.0%US Equity HSBC American Index 5.5%
Investec American 4.5%Artemis US Smaller Cos 4.0%Baillie Gifford American 3.0%
US Equity Total 17.0%Europe ex-UK Equity Man GLG Continental Europe 6.0%Europe ex-UK Equity Total 6.0%Japan Equity Lindsell Train Japan 2.0%
Legg Mason Japan Equity (Hdg) 2.0%Japan Equity Total 4.0%Asia Pac ex-Jpn Equity Schroder Asia Alpha Plus 3.0%Asia Pac ex-Jpn Equity Total 3.0%Emg Market Equity Fidelity Emerging Markets Focus 3.0%Emg Market Equity Total 3.0%Global Equity AXA Fram Gbl Technology 2.0%Global Equity Total 2.0%UK Corp Bonds RLAM Short Duration Credit 6.0%
MS Sterling Corporate Bond 4.0%UK Corp Bonds Total 10.0%Strategic Bonds Baillie Gifford Strat Bond 5.0%
RLAM Global Bond Opps 5.0%Artemis Strategic Bond 5.0%Schroder Strat Credit Fund 5.0%
Strategic Bonds Total 20.0%Equity L/S (AR) BlackRock Euro Abs Alpha 4.0%
Artemis US Abs Ret 4.0%Equity L/S (AR) Total 8.0%Specialist (A/R) Muzinich Global Tactical Credit 4.0%
Smith & Williamson Defensive Growth 3.0%Specialist (A/R) Total 7.0%Cash Cash 9.0%Cash Total 9.0%Grand Total 100.0%
* Figures are net of underlying fund OCFs and Albert E Sharp AMC of 0.6% (inc VAT) p.a. charged monthly
-4.4%
2.1%
9.8%
-4.9%
-1.0%
8.0%
-18.5%
-12.2%
2.9%
-20%
-15%
-10%
-5%
0%
5%
10%
15%
1YR 3YR 5YRAES 4 ARC Balanced PCI All Share TR
AES 1-2
AES 2 AES 3
AES 4
AES 5
AES 6AES 7
AES 8
AES 10
-5%
0%
5%
10%
15%
20%
25%
30%
0 1 2 3 4 5 6 7 8 9 10 11 12 13 14
5 Ye
ar R
etur
n
Volatility (3yr Volatility Annualised)
Year Jan Feb Mar Apr May Jun Jul Aug Sep Oct Nov Dec FY2013 4.09% 1.61% 2.15% 0.97% 0.49% -3.95% 3.14% -1.62% 0.44% 3.39% -0.20% 0.79% 11.59%2014 -0.75% 2.18% -0.82% -0.38% 1.58% 0.17% 0.13% 1.77% -0.54% 0.39% 2.17% -0.13% 5.85%2015 1.83% 1.84% 0.51% 0.01% 1.15% -2.62% 0.29% -2.75% -1.46% 2.67% 0.97% -0.28% 2.01%2016 -3.18% 0.25% 1.98% -0.03% 1.05% 0.37% 3.43% 0.55% 0.82% 0.51% -0.53% 1.46% 6.74%2017 0.73% 1.51% 0.61% 0.52% 1.61% -0.71% 0.71% 1.04% -0.32% 1.85% -0.07% 0.95% 8.72%2018 0.40% -0.81% -1.52% 1.63% 1.62% 0.01% 1.12% 0.88% -0.04% -3.87% 0.20% -2.90% -3.39%2019 2.18% 1.04% 1.35% 2.65% -1.49% 1.96% 1.90% -0.75% 0.10% -0.59% 1.79% 0.99% 11.60%2020 -0.03% -3.72% -6.88% -10.37%
5.3%
27.7%
47.5%
70.1%
136.6%
-8.3%-15.7% -11.1%
10.1% 44.7%
0.6%7.0%
21.1%
36.7%
85.5%
-20%
0%
20%
40%
60%
80%
100%
120%
140%
1m 12m 3y 5y 10y
AES 4 Return Profile: 31 Dec 1997 - 31 March 2020
Best Return Worst Return Average Return
Albert E Sharp, 7 Elm Court, Arden Street, CV37 6PA
www.albertesharp.com 01789 404000 [email protected]
The views expressed in this report are not intended as an offer or solicitation for the purchase or sale of any investment or financial instrument. The views reflect the views of Albert E Sharp at the date of this document and, whilst the opinions stated are honestly held, they are not guarantees and should not be relied upon and may be subject to change without notice. Investments entail risks. Past performance is not necessarily a guide to future performance. There is no guarantee that you will recover the amount of your original investment. The information contained in this document does not constitute investment advice and should not be used as the basis of any investment decision. Any references to specific securities or indices are included for the purposes of illustration only and should not be construed as a recommendation to either buy or sell these securities, or invest in a particular sector. If you are in any doubt, please speak to us or your financial adviser as appropriate.
Issued by Albert E Sharp, a trading name of Albert E Sharp LLP which is authorised and regulated by the Financial Conduct Authority. © Albert E Sharp LLP 2019. Registered in England & Wales with the partnership number OC339858.
Commentary To March 31st 2020
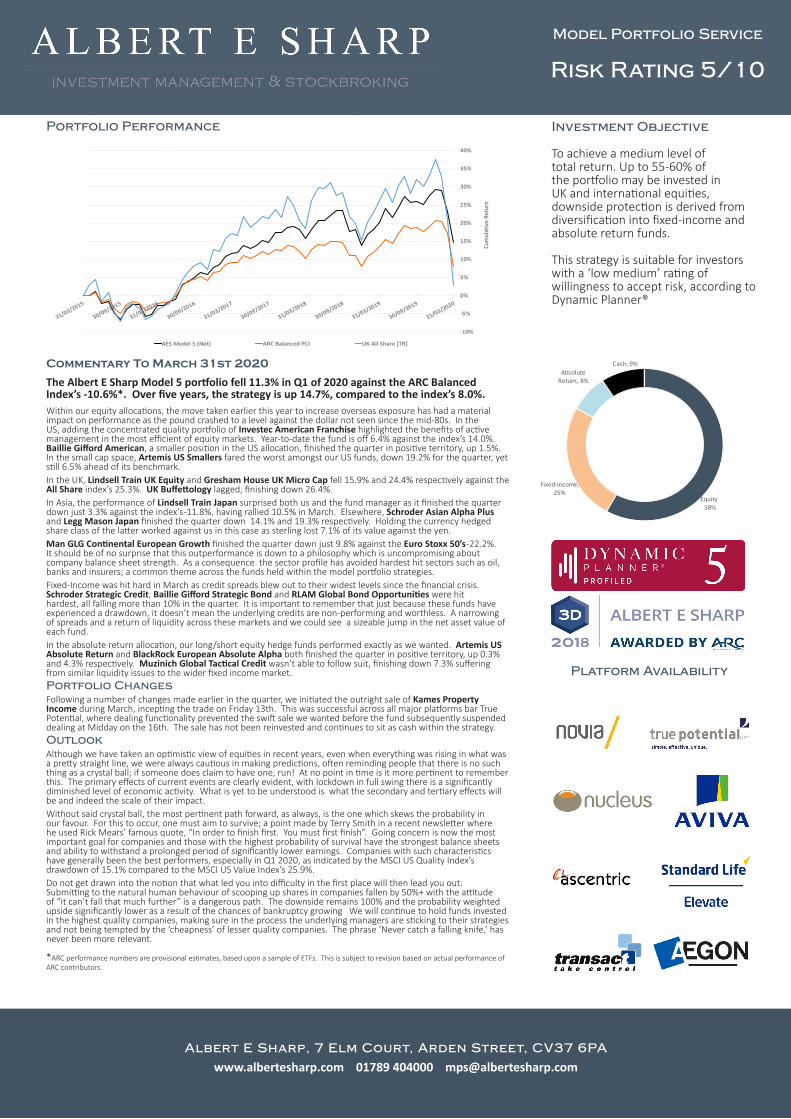
The Albert E Sharp Model 5 portfolio fell 11.3% in Q1 of 2020 against the ARC Balanced Index’s -10.6%*. Over five years, the strategy is up 14.7%, compared to the index’s 8.0%.Within our equity allocations, the move taken earlier this year to increase overseas exposure has had a material impact on performance as the pound crashed to a level against the dollar not seen since the mid-80s. In the US, adding the concentrated quality portfolio of Investec American Franchise highlighted the benefits of active management in the most efficient of equity markets. Year-to-date the fund is off 6.4% against the index’s 14.0%. Baillie Gifford American, a smaller position in the US allocation, finished the quarter in positive territory, up 1.5%. In the small cap space, Artemis US Smallers fared the worst amongst our US funds, down 19.2% for the quarter, yet still 6.5% ahead of its benchmark.In the UK, Lindsell Train UK Equity and Gresham House UK Micro Cap fell 15.9% and 24.4% respectively against the All Share index’s 25.3%. UK Buffettology lagged, finishing down 26.4%.In Asia, the performance of Lindsell Train Japan surprised both us and the fund manager as it finished the quarter down just 3.3% against the index’s -11.8%, having rallied 10.5% in March. Elsewhere, Schroder Asian Alpha Plus and Legg Mason Japan finished the quarter down 14.1% and 19.3% respectively. Holding the currency hedged share class of the latter worked against us in this case as sterling lost 7.1% of its value against the yen.Man GLG Continental European Growth finished the quarter down just 9.8% against the Euro Stoxx 50’s -22.2%. It should be of no surprise that this outperformance is down to a philosophy which is uncompromising about company balance sheet strength. As a consequence the sector profile has avoided hardest hit sectors such as oil, banks and insurers; a common theme across the funds held within the model portfolio strategies.Fixed-Income was hit hard in March as credit spreads blew out to their widest levels since the financial crisis. Schroder Strategic Credit, Baillie Gifford Strategic Bond and RLAM Global Bond Opportunities were hit hardest, all falling more than 10% in the quarter. It is important to remember that just because these funds have experienced a drawdown, it doesn’t mean the underlying credits are non-performing and worthless. A narrowing of spreads and a return of liquidity across these markets and we could see a sizeable jump in the net asset value of each fund.In the absolute return allocation, our long/short equity hedge funds performed exactly as we wanted. Artemis US Absolute Return and BlackRock European Absolute Alpha both finished the quarter in positive territory, up 0.3% and 4.3% respectively. Muzinich Global Tactical Credit wasn’t able to follow suit, finishing down 7.3% suffering from similar liquidity issues to the wider fixed income market.Portfolio ChangesFollowing a number of changes made earlier in the quarter, we initiated the outright sale of Kames Property Income during March, incepting the trade on Friday 13th. This was successful across all major platforms bar True Potential, where dealing functionality prevented the swift sale we wanted before the fund subsequently suspended dealing at Midday on the 16th. The sale has not been reinvested and continues to sit as cash within the strategy.OutlookAlthough we have taken an optimistic view of equities in recent years, even when everything was rising in what was a pretty straight line, we were always cautious in making predictions, often reminding people that there is no such thing as a crystal ball; if someone does claim to have one, run! At no point in time is it more pertinent to remember this. The primary effects of current events are clearly evident, with lockdown in full swing there is a significantly diminished level of economic activity. What is yet to be understood is what the secondary and tertiary effects will be and indeed the scale of their impact. Without said crystal ball, the most pertinent path forward, as always, is the one which skews the probability in our favour. For this to occur, one must aim to survive; a point made by Terry Smith in a recent newsletter where he used Rick Mears’ famous quote, “In order to finish first. You must first finish”. Going concern is now the most important goal for companies and those with the highest probability of survival have the strongest balance sheets and ability to withstand a prolonged period of significantly lower earnings. Companies with such characteristics have generally been the best performers, especially in Q1 2020, as indicated by the MSCI US Quality Index’s drawdown of 15.1% compared to the MSCI US Value Index’s 25.9%. Do not get drawn into the notion that what led you into difficulty in the first place will then lead you out. Submitting to the natural human behaviour of scooping up shares in companies fallen by 50%+ with the attitude of “it can’t fall that much further” is a dangerous path. The downside remains 100% and the probability weighted upside significantly lower as a result of the chances of bankruptcy growing We will continue to hold funds invested in the highest quality companies, making sure in the process the underlying managers are sticking to their strategies and not being tempted by the ‘cheapness’ of lesser quality companies. The phrase ‘Never catch a falling knife,’ has never been more relevant.
*ARC performance numbers are provisional estimates, based upon a sample of ETFs. This is subject to revision based on actual performance of ARC contributors.
Investment Objective
To achieve a medium level of total return. Up to 55-60% of the portfolio may be invested in UK and international equities, downside protection is derived from diversification into fixed-income and absolute return funds.
This strategy is suitable for investors with a ‘low medium’ rating of willingness to accept risk, according to Dynamic Planner®
Model Portfolio Service
Risk Rating 5/10
Platform Availability
Albert E Sharp, 7 Elm Court, Arden Street, CV37 6PA
www.albertesharp.com 01789 404000 [email protected]
Portfolio Performance
-10%
-5%
0%
5%
10%
15%
20%
25%
30%
35%
40%
Cum
ulat
ive
Retu
rn
AES Model 5 (Net) ARC Balanced PCI UK All Share [TR]
Equity58%
Fixed-Income, 25%
Absolute Return, 8%
Cash, 9%
Cumulative Performance *
Capacity For Loss Analysis
Risk & Return Analysis *
Discrete Performance *
Current Portfolio
Portfolio Statistics
AES Management Fees (p.a.) 0.5% + VAT
Custody Fees (p.a.) Variable Across Platforms
Estimated Portfolio Yield (p.a.) 1.98%
Portfolio OCF (p.a.) 0.66%
Minimum Investment £10,000
Strategy Launch Date 31st Dec 2010
Mapping & Benchmarks WMA BalancedARC Sterling Balanced Asset PCI
IA Mixed Investment 20-60%eValue FE 5
Model Portfolio Service
Risk Rating 5/10
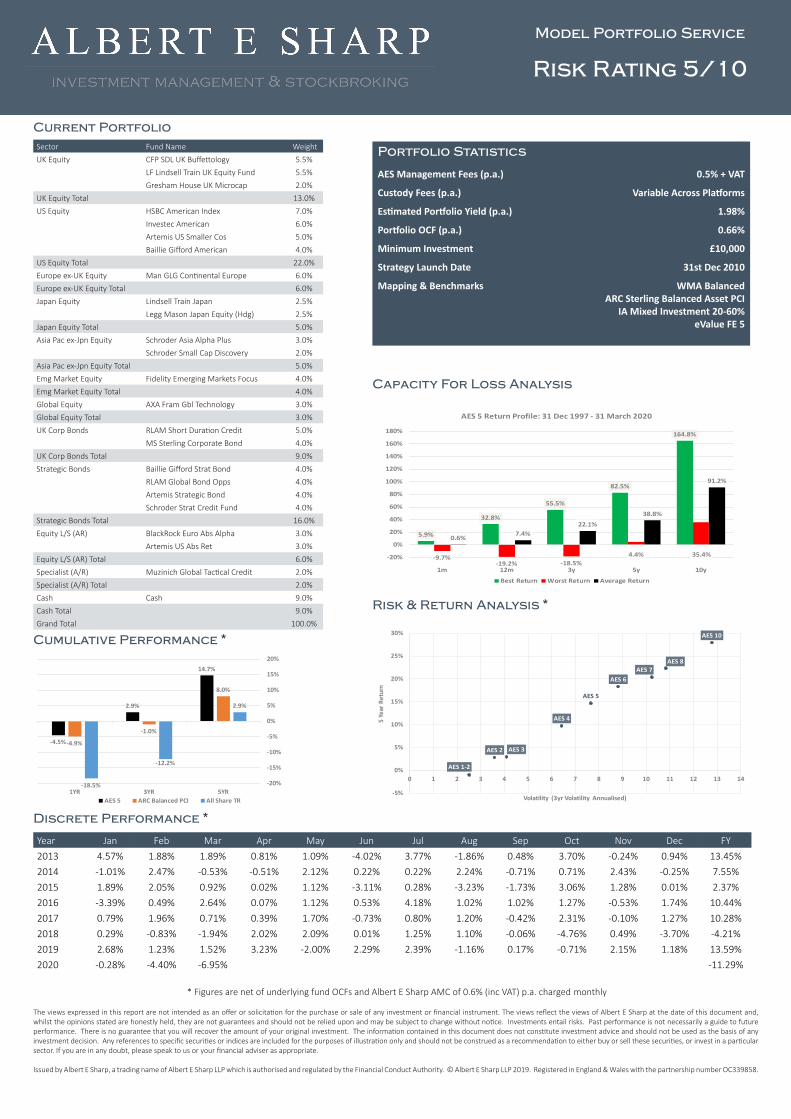
Sector Fund Name WeightUK Equity CFP SDL UK Buffettology 5.5%
LF Lindsell Train UK Equity Fund 5.5%Gresham House UK Microcap 2.0%
UK Equity Total 13.0%US Equity HSBC American Index 7.0%
Investec American 6.0%Artemis US Smaller Cos 5.0%Baillie Gifford American 4.0%
US Equity Total 22.0%Europe ex-UK Equity Man GLG Continental Europe 6.0%Europe ex-UK Equity Total 6.0%Japan Equity Lindsell Train Japan 2.5%
Legg Mason Japan Equity (Hdg) 2.5%Japan Equity Total 5.0%Asia Pac ex-Jpn Equity Schroder Asia Alpha Plus 3.0%
Schroder Small Cap Discovery 2.0%Asia Pac ex-Jpn Equity Total 5.0%Emg Market Equity Fidelity Emerging Markets Focus 4.0%Emg Market Equity Total 4.0%Global Equity AXA Fram Gbl Technology 3.0%Global Equity Total 3.0%UK Corp Bonds RLAM Short Duration Credit 5.0%
MS Sterling Corporate Bond 4.0%UK Corp Bonds Total 9.0%Strategic Bonds Baillie Gifford Strat Bond 4.0%
RLAM Global Bond Opps 4.0%Artemis Strategic Bond 4.0%Schroder Strat Credit Fund 4.0%
Strategic Bonds Total 16.0%Equity L/S (AR) BlackRock Euro Abs Alpha 3.0%
Artemis US Abs Ret 3.0%Equity L/S (AR) Total 6.0%Specialist (A/R) Muzinich Global Tactical Credit 2.0%Specialist (A/R) Total 2.0%Cash Cash 9.0%Cash Total 9.0%Grand Total 100.0%
* Figures are net of underlying fund OCFs and Albert E Sharp AMC of 0.6% (inc VAT) p.a. charged monthly
-4.5%
2.9%
14.7%
-4.9%
-1.0%
8.0%
-18.5%
-12.2%
2.9%
-20%
-15%
-10%
-5%
0%
5%
10%
15%
20%
1YR 3YR 5YRAES 5 ARC Balanced PCI All Share TR
AES 1-2
AES 2 AES 3
AES 4
AES 5
AES 6AES 7
AES 8
AES 10
-5%
0%
5%
10%
15%
20%
25%
30%
0 1 2 3 4 5 6 7 8 9 10 11 12 13 14
5 Ye
ar R
etur
n
Volatility (3yr Volatility Annualised)
Year Jan Feb Mar Apr May Jun Jul Aug Sep Oct Nov Dec FY2013 4.57% 1.88% 1.89% 0.81% 1.09% -4.02% 3.77% -1.86% 0.48% 3.70% -0.24% 0.94% 13.45%2014 -1.01% 2.47% -0.53% -0.51% 2.12% 0.22% 0.22% 2.24% -0.71% 0.71% 2.43% -0.25% 7.55%2015 1.89% 2.05% 0.92% 0.02% 1.12% -3.11% 0.28% -3.23% -1.73% 3.06% 1.28% 0.01% 2.37%2016 -3.39% 0.49% 2.64% 0.07% 1.12% 0.53% 4.18% 1.02% 1.02% 1.27% -0.53% 1.74% 10.44%2017 0.79% 1.96% 0.71% 0.39% 1.70% -0.73% 0.80% 1.20% -0.42% 2.31% -0.10% 1.27% 10.28%2018 0.29% -0.83% -1.94% 2.02% 2.09% 0.01% 1.25% 1.10% -0.06% -4.76% 0.49% -3.70% -4.21%2019 2.68% 1.23% 1.52% 3.23% -2.00% 2.29% 2.39% -1.16% 0.17% -0.71% 2.15% 1.18% 13.59%2020 -0.28% -4.40% -6.95% -11.29%
5.9%
32.8%
55.5%
82.5%
164.8%
-9.7%-19.2% -18.5%
4.4% 35.4%
0.6%7.4%
22.1%38.8%
91.2%
-20%
0%
20%
40%
60%
80%
100%
120%
140%
160%
180%
1m 12m 3y 5y 10y
AES 5 Return Profile: 31 Dec 1997 - 31 March 2020
Best Return Worst Return Average Return
Albert E Sharp, 7 Elm Court, Arden Street, CV37 6PA
www.albertesharp.com 01789 404000 [email protected]
The views expressed in this report are not intended as an offer or solicitation for the purchase or sale of any investment or financial instrument. The views reflect the views of Albert E Sharp at the date of this document and, whilst the opinions stated are honestly held, they are not guarantees and should not be relied upon and may be subject to change without notice. Investments entail risks. Past performance is not necessarily a guide to future performance. There is no guarantee that you will recover the amount of your original investment. The information contained in this document does not constitute investment advice and should not be used as the basis of any investment decision. Any references to specific securities or indices are included for the purposes of illustration only and should not be construed as a recommendation to either buy or sell these securities, or invest in a particular sector. If you are in any doubt, please speak to us or your financial adviser as appropriate.
Issued by Albert E Sharp, a trading name of Albert E Sharp LLP which is authorised and regulated by the Financial Conduct Authority. © Albert E Sharp LLP 2019. Registered in England & Wales with the partnership number OC339858.

Commentary To March 31st 2020
The Albert E Sharp Model 6 portfolio fell 12.1% in Q1 of 2020 against the ARC Steady Growth Index’s 14.3%*. Over five years, the strategy is up 18.3% compared to the index’s 11.9%.Within our equity allocations, the move taken earlier this year to increase overseas exposure has had a material impact on performance as the pound crashed to a level against the dollar not seen since the mid-80s. In the US, adding the concentrated quality portfolio of Investec American Franchise highlighted the benefits of active management in the most efficient of equity markets. Year-to-date the fund is off 6.4% against the index’s 14.0%. Baillie Gifford American, a smaller position in the US allocation, finished the quarter in positive territory, up 1.5%. In the small cap space, Artemis US Smallers fared the worst amongst our US funds, down 19.2% for the quarter, yet still 6.5% ahead of its benchmark.In the UK, Lindsell Train UK Equity and Gresham House UK Micro Cap fell 15.9% and 24.4% respectively against the All Share index’s 25.3%. UK Buffettology lagged, finishing down 26.4%.In Asia, the performance of Lindsell Train Japan surprised both us and the fund manager as it finished the quarter down just 3.3% against the index’s -11.8%, having rallied 10.5% in March. Elsewhere, Schroder Asian Alpha Plus and Legg Mason Japan finished the quarter down 14.1% and 19.3% respectively. Holding the currency hedged share class of the latter worked against us in this case as sterling lost 7.1% of its value against the yen.Man GLG Continental European Growth finished the quarter down just 9.8% against the Euro Stoxx 50’s -22.2%. It should be of no surprise that this outperformance is down to a philosophy which is uncompromising about company balance sheet strength. As a consequence the sector profile has avoided hardest hit sectors such as oil, banks and insurers; a common theme across the funds held within the model portfolio strategies.Fixed-Income was hit hard in March as credit spreads blew out to their widest levels since the financial crisis. Schroder Strategic Credit, Baillie Gifford Strategic Bond and RLAM Global Bond Opportunities were hit hardest, all falling more than 10% in the quarter. It is important to remember that just because these funds have experienced a drawdown, it doesn’t mean the underlying credits are non-performing and worthless. A narrowing of spreads and a return of liquidity across these markets and we could see a sizeable jump in the net asset value of each fund.In the absolute return allocation, our long/short equity hedge funds performed exactly as we wanted. Artemis US Absolute Return and BlackRock European Absolute Alpha both finished the quarter in positive territory, up 0.3% and 4.3% respectively.
Portfolio ChangesFollowing a number of changes made earlier in the quarter, we initiated the outright sale of Kames Property Income during March, incepting the trade on Friday 13th. This was successful across all major platforms bar True Potential, where dealing functionality prevented the swift sale we wanted before the fund subsequently suspended dealing at Midday on the 16th. The sale has not been reinvested and continues to sit as cash within the strategy.OutlookAlthough we have taken an optimistic view of equities in recent years, even when everything was rising in what was a pretty straight line, we were always cautious in making predictions, often reminding people that there is no such thing as a crystal ball; if someone does claim to have one, run! At no point in time is it more pertinent to remember this. The primary effects of current events are clearly evident, with lockdown in full swing there is a significantly diminished level of economic activity. What is yet to be understood is what the secondary and tertiary effects will be and indeed the scale of their impact. Without said crystal ball, the most pertinent path forward, as always, is the one which skews the probability in our favour. For this to occur, one must aim to survive; a point made by Terry Smith in a recent newsletter where he used Rick Mears’ famous quote, “In order to finish first. You must first finish”. Going concern is now the most important goal for companies and those with the highest probability of survival have the strongest balance sheets and ability to withstand a prolonged period of significantly lower earnings. Companies with such characteristics have generally been the best performers, especially in Q1 2020, as indicated by the MSCI US Quality Index’s drawdown of 15.1% compared to the MSCI US Value Index’s 25.9%. Do not get drawn into the notion that what led you into difficulty in the first place will then lead you out. Submitting to the natural human behaviour of scooping up shares in companies fallen by 50%+ with the attitude of “it can’t fall that much further” is a dangerous path. The downside remains 100% and the probability weighted upside significantly lower as a result of the chances of bankruptcy growing We will continue to hold funds invested in the highest quality companies, making sure in the process the underlying managers are sticking to their strategies and not being tempted by the ‘cheapness’ of lesser quality companies. The phrase ‘Never catch a falling knife,’ has never been more relevant.
*ARC performance numbers are provisional estimates, based upon a sample of ETFs. This is subject to revision based on actual performance of ARC contributors.
Investment Objective
To achieve capital growth. Up to 70-75% of the portfolio may be invested in UK and international equities, downside protection is derived from diversification into fixed-income and absolute return funds.
This strategy is suitable for investors with a ‘high medium’ rating of willingness to accept risk, according to Dynamic Planner®
Model Portfolio Service
Risk Rating 6/10
Platform Availability
Albert E Sharp, 7 Elm Court, Arden Street, CV37 6PA
www.albertesharp.com 01789 404000 [email protected]
Portfolio Performance
-10%
-5%
0%
5%
10%
15%
20%
25%
30%
35%
40%
Cum
ulat
ive
Retu
rn
AES Model 6 (Net) ARC Steady Growth PCI UK All Share [TR]
Equity68%
Fixed-Income, 18%
Absolute Return, 5%
Cash, 9%

Cumulative Performance *
Risk & Return Analysis *
Capacity For Loss Analysis
Discrete Performance *
Current Portfolio
Portfolio Statistics
AES Management Fees (p.a.) 0.5% + VAT
Custody Fees (p.a.) Variable Across Platforms
Estimated Portfolio Yield (p.a.) -
Portfolio OCF (p.a.) 0.67%
Minimum Investment £10,000
Strategy Launch Date 31st Dec 2010
Mapping & Benchmarks WMA GrowthARC Steady Growth PCI
IA Mixed Investment 40-85%eValue FE 6
Model Portfolio Service
Risk Rating 6/10
Sector Fund Name WeightUK Equity CFP SDL UK Buffettology 6.0%
LF Lindsell Train UK Equity Fund 6.0%Gresham House UK Microcap 3.0%
UK Equity Total 15.0%US Equity HSBC American Index 7.5%
Artemis US Smaller Cos 6.5%Investec American 6.5%Baillie Gifford American 4.5%
US Equity Total 25.0%Europe ex-UK Equity Man GLG Continental Europe 7.0%Europe ex-UK Equity Total 7.0%Japan Equity Lindsell Train Japan 3.0%
Legg Mason Japan Equity (Hdg) 2.0%Japan Equity Total 5.0%Asia Pac ex-Jpn Equity Schroder Asia Alpha Plus 5.0%
Schroder Small Cap Discovery 3.0%Asia Pac ex-Jpn Equity Total 8.0%Emg Market Equity Fidelity Emerging Markets Focus 4.0%Emg Market Equity Total 4.0%Global Equity AXA Fram Gbl Technology 4.0%Global Equity Total 4.0%UK Corp Bonds RLAM Short Duration Credit 4.0%
MS Sterling Corporate Bond 3.0%UK Corp Bonds Total 7.0%Strategic Bonds Baillie Gifford Strat Bond 3.0%
RLAM Global Bond Opps 3.0%Artemis Strategic Bond 2.5%Schroder Strat Credit Fund 2.5%
Strategic Bonds Total 11.0%Equity L/S (AR) BlackRock Euro Abs Alpha 2.5%
Artemis US Abs Ret 2.5%Equity L/S (AR) Total 5.0%Cash Cash 9.0%Cash Total 9.0%Grand Total 100.0%
* Figures are net of underlying fund OCFs and Albert E Sharp AMC of 0.6% (inc VAT) p.a. charged monthly
-4.8%
3.6%
18.3%
-7.6%
-1.0%
11.9%
-18.5%
-12.2%
2.9%
-20%
-15%
-10%
-5%
0%
5%
10%
15%
20%
1YR 3YR 5YRAES 6 ARC Steady Growth PCI All Share TR
AES 1-2
AES 2 AES 3
AES 4
AES 5
AES 6AES 7
AES 8
AES 10
-5%
0%
5%
10%
15%
20%
25%
30%
0 1 2 3 4 5 6 7 8 9 10 11 12 13 14
5 Ye
ar R
etur
n
Volatility (3yr Volatility Annualised)
Year Jan Feb Mar Apr May Jun Jul Aug Sep Oct Nov Dec FY2013 5.34% 2.38% 2.19% 0.64% 1.81% -3.29% 4.17% -1.94% 0.58% 4.10% -0.34% 1.04% 17.60%2014 -1.25% 2.65% -0.65% -0.74% 2.57% 0.29% 0.44% 2.91% -0.58% 1.02% 2.79% -0.10% 9.61%2015 2.00% 2.32% 1.46% 0.07% 1.51% -3.34% 0.30% -3.89% -1.92% 3.54% 1.23% -0.28% 2.74%2016 -4.36% 0.56% 2.79% -0.25% 1.30% 0.94% 5.56% 1.56% 1.32% 1.09% -0.13% 1.83% 12.59%2017 1.17% 2.36% 0.91% 0.20% 1.87% -0.52% 0.83% 1.43% -0.58% 2.49% -0.17% 1.58% 12.13%2018 0.16% -0.79% -2.19% 2.41% 2.47% 0.00% 1.36% 1.29% -0.16% -5.45% 0.80% -4.12% -4.46%2019 3.01% 1.35% 1.74% 3.63% -2.33% 2.60% 2.69% -1.54% 0.18% -0.88% 2.45% 1.40% 15.04%2020 -0.35% -4.98% -7.20% -12.12%
7.1%
37.7%
63.3%
93.5%
191.3%
-11.3%-22.4% -25.1%
-1.3% 28.6%
0.6% 7.8%23.2%
40.7%
96.3%
-40%
0%
40%
80%
120%
160%
200%
1m 12m 3y 5y 10y
AES 6 Return Profile: 31 Dec 1997 - 31 March 2020
Best Return Worst Return Average Return
Albert E Sharp, 7 Elm Court, Arden Street, CV37 6PA
www.albertesharp.com 01789 404000 [email protected]
The views expressed in this report are not intended as an offer or solicitation for the purchase or sale of any investment or financial instrument. The views reflect the views of Albert E Sharp at the date of this document and, whilst the opinions stated are honestly held, they are not guarantees and should not be relied upon and may be subject to change without notice. Investments entail risks. Past performance is not necessarily a guide to future performance. There is no guarantee that you will recover the amount of your original investment. The information contained in this document does not constitute investment advice and should not be used as the basis of any investment decision. Any references to specific securities or indices are included for the purposes of illustration only and should not be construed as a recommendation to either buy or sell these securities, or invest in a particular sector. If you are in any doubt, please speak to us or your financial adviser as appropriate.
Issued by Albert E Sharp, a trading name of Albert E Sharp LLP which is authorised and regulated by the Financial Conduct Authority. © Albert E Sharp LLP 2019. Registered in England & Wales with the partnership number OC339858.

Commentary To March 31st 2020
The Albert E Sharp Model 7 portfolio fell 13.3% in Q1 of 2020, against the ARC Equity Risk Index’s -17.7%*. Over five years, the strategy is up 20.4% compared to the index’s 12.0%.Within our equity allocations, the move taken earlier this year to increase overseas exposure has had a material impact on performance as the pound crashed to a level against the dollar not seen since the mid-80s. In the US, adding the concentrated quality portfolio of Investec American Franchise highlighted the benefits of active management in the most efficient of equity markets. Year-to-date the fund is off 6.4% against the index’s 14.0%. Baillie Gifford American, a smaller position in the US allocation, finished the quarter in positive territory, up 1.5%. In the small cap space, Artemis US Smallers fared the worst amongst our US funds, down 19.2% for the quarter, yet still 6.5% ahead of its benchmark.In the UK, Lindsell Train UK Equity and Gresham House UK Micro Cap fell 15.9% and 24.4% respectively against the All Share index’s 25.3%. UK Buffettology lagged, finishing down 26.4%.In Asia, the performance of Lindsell Train Japan surprised both us and the fund manager as it finished the quarter down just 3.3% against the index’s -11.8%, having rallied 10.5% in March. Elsewhere, Schroder Asian Alpha Plus and Legg Mason Japan finished the quarter down 14.1% and 19.3% respectively. Holding the currency hedged share class of the latter worked against us in this case as sterling lost 7.1% of its value against the yen.Man GLG Continental European Growth finished the quarter down just 9.8% against the Euro Stoxx 50’s -22.2%. It should be of no surprise that this outperformance is down to a philosophy which is uncompromising about company balance sheet strength. As a consequence the sector profile has avoided hardest hit sectors such as oil, banks and insurers; a common theme across the funds held within the model portfolio strategies.Fixed-Income was hit hard in March as credit spreads blew out to their widest levels since the financial crisis. Baillie Gifford Strategic Bond and RLAM Global Bond Opportunities were hit hardest, both falling more than 10% in the quarter. It is important to remember that just because these funds have experienced a drawdown, it doesn’t mean the underlying credits are non-performing and worthless. A narrowing of spreads and a return of liquidity across these markets and we could see a sizeable jump in the net asset value of each fund.In the absolute return allocation, our long/short equity hedge funds performed exactly as we wanted. Artemis US Absolute Return and BlackRock European Absolute Alpha both finished the quarter in positive territory, up 0.3% and 4.3% respectively.
Portfolio ChangesFollowing a number of changes made earlier in the quarter, we initiated the outright sale of Kames Property Income during March, incepting the trade on Friday 13th. This was successful across all major platforms bar True Potential, where dealing functionality prevented the swift sale we wanted before the fund subsequently suspended dealing at Midday on the 16th. The sale has not been reinvested and continues to sit as cash within the strategy.Outlook
Although we have taken an optimistic view of equities in recent years, even when everything was rising in what was a pretty straight line, we were always cautious in making predictions, often reminding people that there is no such thing as a crystal ball; if someone does claim to have one, run! At no point in time is it more pertinent to remember this. The primary effects of current events are clearly evident, with lockdown in full swing there is a significantly diminished level of economic activity. What is yet to be understood is what the secondary and tertiary effects will be and indeed the scale of their impact. Without said crystal ball, the most pertinent path forward, as always, is the one which skews the probability in our favour. For this to occur, one must aim to survive; a point made by Terry Smith in a recent newsletter where he used Rick Mears’ famous quote, “In order to finish first. You must first finish”. Going concern is now the most important goal for companies and those with the highest probability of survival have the strongest balance sheets and ability to withstand a prolonged period of significantly lower earnings. Companies with such characteristics have generally been the best performers, especially in Q1 2020, as indicated by the MSCI US Quality Index’s drawdown of 15.1% compared to the MSCI US Value Index’s 25.9%. Do not get drawn into the notion that what led you into difficulty in the first place will then lead you out. Submitting to the natural human behaviour of scooping up shares in companies fallen by 50%+ with the attitude of “it can’t fall that much further” is a dangerous path. The downside remains 100% and the probability weighted upside significantly lower as a result of the chances of bankruptcy growing We will continue to hold funds invested in the highest quality companies, making sure in the process the underlying managers are sticking to their strategies and not being tempted by the ‘cheapness’ of lesser quality companies. The phrase ‘Never catch a falling knife,’ has never been more relevant.*ARC performance numbers are provisional estimates, based upon a sample of ETFs. This is subject to revision based on actual performance of ARC contributors.
Investment Objective
To achieve a moderate level of capital growth. Up to 80-85% of the portfolio may be invested in UK and international equities, downside protection is derived from diversification into fixed-income and absolute return funds.
This strategy is suitable for investors with a ‘highest medium’ rating of willingness to accept risk, according to Dynamic Planner®
Model Portfolio Service
Risk Rating 7/10
Platform Availability
Albert E Sharp, 7 Elm Court, Arden Street, CV37 6PA
www.albertesharp.com 01789 404000 [email protected]
Portfolio Performance
-10%
-5%
0%
5%
10%
15%
20%
25%
30%
35%
40%
Cum
ulat
ive
Retu
rn
AES Model 7 (Net) ARC Equity Risk PCI UK All Share [TR]
Equity80%
Fixed-Income, 8%
Absolute Return, 3%
Cash, 9%

Cumulative Performance *
Risk & Return Analysis *
Capacity For Loss Analysis
Discrete Performance *
Current Portfolio
Portfolio Statistics
AES Management Fees (p.a.) 0.5% + VAT
Custody Fees (p.a.) Variable Across Platforms
Estimated Portfolio Yield (p.a.) -
Portfolio OCF (p.a.) 0.70%
Minimum Investment £10,000
Strategy Launch Date 31st Dec 2010
Mapping & Benchmarks WMA Global GrowthARC Equity Risk PCI
IA Mixed Investment 40-85%eValue FE 7
Model Portfolio Service
Risk Rating 7/10
Sector Fund Name WeightUK Equity CFP SDL UK Buffettology 6.0%
LF Lindsell Train UK Equity Fund 6.0%Gresham House UK Microcap 3.0%
UK Equity Total 15.0%US Equity HSBC American Index 8.5%
Investec American 8.0%Artemis US Smaller Cos 7.0%Baillie Gifford American 5.5%
US Equity Total 29.0%Europe ex-UK Equity Man GLG Continental Europe 8.0%Europe ex-UK Equity Total 8.0%Japan Equity Lindsell Train Japan 3.0%
Legg Mason Japan Equity (Hdg) 3.0%Japan Equity Total 6.0%Asia Pac ex-Jpn Equity Schroder Asia Alpha Plus 5.0%
Schroder Small Cap Discovery 4.0%Asia Pac ex-Jpn Equity Total 9.0%Emg Market Equity Fidelity Emerging Markets Focus 8.0%Emg Market Equity Total 8.0%Global Equity AXA Fram Gbl Technology 5.0%Global Equity Total 5.0%UK Corp Bonds RLAM Short Duration Credit 4.0%UK Corp Bonds Total 4.0%Strategic Bonds Baillie Gifford Strat Bond 2.0%
RLAM Global Bond Opps 2.0%Strategic Bonds Total 4.0%Equity L/S (AR) BlackRock Euro Abs Alpha 1.5%
Artemis US Abs Ret 1.5%Equity L/S (AR) Total 3.0%Cash Cash 9.0%Cash Total 9.0%Grand Total 100.0%
* Figures are net of underlying fund OCFs and Albert E Sharp AMC of 0.6% (inc VAT) p.a. charged monthly
-5.4%
3.7%
20.4%
-10.0%
-2.9%
12.0%
-18.5%
-12.2%
2.9%
-20%
-15%
-10%
-5%
0%
5%
10%
15%
20%
25%
1YR 3YR 5YR
AES 7 ARC Equity Risk PCI All Share TR
AES 1-2
AES 2 AES 3
AES 4
AES 5
AES 6AES 7
AES 8
AES 10
-5%
0%
5%
10%
15%
20%
25%
30%
0 1 2 3 4 5 6 7 8 9 10 11 12 13 14
5 Ye
ar R
etur
n
Volatility (3yr Volatility Annualised)
Year Jan Feb Mar Apr May Jun Jul Aug Sep Oct Nov Dec FY2013 6.42% 3.04% 2.15% 0.33% 2.69% -3.03% 5.01% -2.26% 0.58% 4.55% -0.29% 1.29% 21.97%2014 -1.63% 2.95% -0.66% -1.13% 3.04% 0.31% 0.50% 3.41% -0.60% 1.15% 3.10% -0.25% 10.47%2015 2.15% 2.63% 1.67% 0.01% 1.58% -3.80% 0.36% -4.56% -2.05% 4.06% 1.41% -0.26% 2.86%2016 -4.96% 0.72% 2.95% -0.41% 1.44% 1.42% 6.08% 1.68% 1.71% 1.54% -0.14% 1.88% 14.42%2017 1.37% 2.58% 1.13% 0.03% 2.11% -0.68% 0.88% 1.66% -0.76% 2.82% -0.18% 1.72% 13.35%2018 0.26% -0.71% -2.56% 2.63% 2.95% -0.03% 1.48% 1.46% -0.15% -6.34% 1.17% -4.83% -5.01%2019 3.47% 1.54% 1.96% 4.19% -2.91% 2.94% 3.03% -2.04% 0.26% -0.87% 2.73% 1.61% 16.79%2020 -0.81% -5.65% -7.33% -13.27%
8.3%
43.7%
75.3%
104.5%
222.9%
-13.8%-26.1% -32.3%
-7.1% 23.3%
0.7% 8.4%24.8%
43.5%
103.9%
-40%
0%
40%
80%
120%
160%
200%
240%
1m 12m 3y 5y 10y
AES 7 Return Profile: 31 Dec 1997 - 31 March 2020
Best Return Worst Return Average Return
Albert E Sharp, 7 Elm Court, Arden Street, CV37 6PA
www.albertesharp.com 01789 404000 [email protected]
The views expressed in this report are not intended as an offer or solicitation for the purchase or sale of any investment or financial instrument. The views reflect the views of Albert E Sharp at the date of this document and, whilst the opinions stated are honestly held, they are not guarantees and should not be relied upon and may be subject to change without notice. Investments entail risks. Past performance is not necessarily a guide to future performance. There is no guarantee that you will recover the amount of your original investment. The information contained in this document does not constitute investment advice and should not be used as the basis of any investment decision. Any references to specific securities or indices are included for the purposes of illustration only and should not be construed as a recommendation to either buy or sell these securities, or invest in a particular sector. If you are in any doubt, please speak to us or your financial adviser as appropriate.
Issued by Albert E Sharp, a trading name of Albert E Sharp LLP which is authorised and regulated by the Financial Conduct Authority. © Albert E Sharp LLP 2019. Registered in England & Wales with the partnership number OC339858.

Model Portfolio Service
Risk Rating 8/10
Commentary To March 31st 2020
The Albert E Sharp Model 8 portfolio fell 13.6% in Q1 of 2020 against the ARC Equity Risk Index’s -17.7%*. Over five years, the strategy is up 22.4% compared to the index’s 12.0%.Within our equity allocations, the move taken earlier this year to increase overseas exposure has had a material impact on performance as the pound crashed to a level against the dollar not seen since the mid-80s. In the US, adding the concentrated quality portfolio of Investec American Franchise highlighted the benefits of active management in the most efficient of equity markets. Year-to-date the fund is off 6.4% against the index’s 14.0%. Baillie Gifford American, a smaller position in the US allocation, finished the quarter in positive territory, up 1.5%. In the small cap space, Artemis US Smallers fared the worst amongst our US funds, down 19.2% for the quarter, yet still 6.5% ahead of its benchmark.In the UK, Lindsell Train UK Equity and Gresham House UK Micro Cap fell 15.9% and 24.4% respectively against the All Share index’s 25.3%. UK Buffettology lagged, finishing down 26.4%.In Asia, the performance of Lindsell Train Japan surprised both us and the fund manager as it finished the quarter down just 3.3% against the index’s -11.8%, having rallied 10.5% in March. Elsewhere, Schroder Asian Alpha Plus and Legg Mason Japan finished the quarter down 14.1% and 19.3% respectively. Holding the currency hedged share class of the latter worked against us in this case as sterling lost 7.1% of its value against the yen.Man GLG Continental European Growth finished the quarter down just 9.8% against the Euro Stoxx 50’s -22.2%. It should be of no surprise that this outperformance is down to a philosophy which is uncompromising about company balance sheet strength. As a consequence the sector profile has avoided hardest hit sectors such as oil, banks and insurers; a common theme across the funds held within the model portfolio strategies.Fixed-Income was hit hard in March as credit spreads blew out to their widest levels since the financial crisis. Baillie Gifford Strategic Bond was hit hard, falling more than 10% in the quarter. It is important to remember that just because the fund has experienced a drawdown, it doesn’t mean the underlying credits are non-performing and worthless. A narrowing of spreads and a return of liquidity across these markets and we could see a sizeable jump in the net asset value of the fund.
Portfolio ChangesFollowing a number of changes made earlier in the quarter, we initiated the outright sale of Kames Property Income during March, incepting the trade on Friday 13th. This was successful across all major platforms bar True Potential, where dealing functionality prevented the swift sale we wanted before the fund subsequently suspended dealing at Midday on the 16th. The sale has not been reinvested and continues to sit as cash within the strategy.OutlookAlthough we have taken an optimistic view of equities in recent years, even when everything was rising in what was a pretty straight line, we were always cautious in making predictions, often reminding people that there is no such thing as a crystal ball; if someone does claim to have one, run! At no point in time is it more pertinent to remember this. The primary effects of current events are clearly evident, with lockdown in full swing there is a significantly diminished level of economic activity. What is yet to be understood is what the secondary and tertiary effects will be and indeed the scale of their impact. Without said crystal ball, the most pertinent path forward, as always, is the one which skews the probability in our favour. For this to occur, one must aim to survive; a point made by Terry Smith in a recent newsletter where he used Rick Mears’ famous quote, “In order to finish first. You must first finish”. Going concern is now the most important goal for companies and those with the highest probability of survival have the strongest balance sheets and ability to withstand a prolonged period of significantly lower earnings. Companies with such characteristics have generally been the best performers, especially in Q1 2020, as indicated by the MSCI US Quality Index’s drawdown of 15.1% compared to the MSCI US Value Index’s 25.9%. Do not get drawn into the notion that what led you into difficulty in the first place will then lead you out. Submitting to the natural human behaviour of scooping up shares in companies fallen by 50%+ with the attitude of “it can’t fall that much further” is a dangerous path. The downside remains 100% and the probability weighted upside significantly lower as a result of the chances of bankruptcy growing We will continue to hold funds invested in the highest quality companies, making sure in the process the underlying managers are sticking to their strategies and not being tempted by the ‘cheapness’ of lesser quality companies. The phrase ‘Never catch a falling knife,’ has never been more relevant.
*ARC performance numbers are provisional estimates, based upon a sample of ETFs. This is subject to revision based on actual performance of ARC contributors.
Investment Objective
To achieve a moderate level of total return. Up to 85% of the portfolio may be invested in UK and international equities, downside protection is derived from diversification into fixed-income and absolute return funds.
This strategy is suitable for investors with a ‘high’ rating of willingness to accept risk, according to Dynamic Planner®.
Portfolio Performance
Platform Availability
Albert E Sharp, 7 Elm Court, Arden Street, CV37 6PA
www.albertesharp.com 01789 404000 [email protected]
-10%
-5%
0%
5%
10%
15%
20%
25%
30%
35%
40%
45%
Cum
ulat
ive
Retu
rn
AES Model 8 (Net) ARC Equity Risk PCI UK All Share [TR]
Equity84%
Fixed-Income, 9%
Cash, 7%

Cumulative Performance *
Risk & Return Analysis *
Capacity For Loss Analysis
Discrete Performance *
Current Portfolio
Portfolio Statistics
AES Management Fees (p.a.) 0.5% + VAT
Custody Fees (p.a.) Variable Across Platforms
Estimated Portfolio Yield (p.a.) -
Portfolio OCF (p.a.) 0.71%
Minimum Investment £10,000
Strategy Launch Date 31st Dec 2010
Mapping & Benchmarks WMA Global GrowthARC Equity Risk PCI
IA Mixed Investment 40-85%eValue FE 8
Model Portfolio Service
Risk Rating 8/10
Sector Fund Name WeightUK Equity CFP SDL UK Buffettology 6.0%
LF Lindsell Train UK Equity Fund 6.0%Gresham House UK Microcap 3.0%
UK Equity Total 15.0%US Equity HSBC American Index 8.5%
Investec American 8.0%Artemis US Smaller Cos 7.0%Baillie Gifford American 5.5%
US Equity Total 29.0%Europe ex-UK Equity Man GLG Continental Europe 8.0%Europe ex-UK Equity Total 8.0%Japan Equity Lindsell Train Japan 3.0%
Legg Mason Japan Equity (Hdg) 3.0%Japan Equity Total 6.0%Asia Pac ex-Jpn Equity Schroder Asia Alpha Plus 5.0%
Schroder Small Cap Discovery 4.0%Asia Pac ex-Jpn Equity Total 9.0%Emg Market Equity Fidelity Emerging Markets Focus 8.0%Emg Market Equity Total 8.0%Global Equity AXA Fram Gbl Technology 6.0%
Baillie Gifford Global Discovery 3.0%Global Equity Total 9.0%UK Corp Bonds RLAM Short Duration Credit 4.0%UK Corp Bonds Total 4.0%Strategic Bonds Baillie Gifford Strat Bond 5.0%Strategic Bonds Total 5.0%Cash Cash 7.0%Cash Total 7.0%Grand Total 100.0%
* Figures are net of underlying fund OCFs and Albert E Sharp AMC of 0.6% (inc VAT) p.a. charged monthly
-5.4%
4.1%
22.3%
-10.0%
-2.9%
12.0%
-18.5%
-12.2%
2.9%
-20%
-15%
-10%
-5%
0%
5%
10%
15%
20%
25%
1YR 3YR 5YR
AES 8 ARC Equity Risk PCI All Share TR
AES 1-2
AES 2 AES 3
AES 4
AES 5
AES 6AES 7
AES 8
AES 10
-5%
0%
5%
10%
15%
20%
25%
30%
0 1 2 3 4 5 6 7 8 9 10 11 12 13 14
5 Ye
ar R
etur
n
Volatility (3yr Volatility Annualised)
Year Jan Feb Mar Apr May Jun Jul Aug Sep Oct Nov Dec FY2013 7.01% 3.29% 2.20% 0.27% 3.22% -2.99% 5.52% -2.32% 0.37% 4.57% 0.05% 1.61% 24.72%2014 -1.11% 2.57% -0.84% -1.06% 3.01% 0.15% 0.49% 3.54% -0.30% 0.87% 2.53% 0.00% 10.14%2015 1.92% 2.31% 1.67% 0.64% 1.48% -3.76% 0.29% -4.77% -1.52% 3.72% 1.42% 0.26% 3.36%2016 -5.19% 0.86% 2.78% -0.35% 1.70% 1.46% 5.54% 1.34% 2.14% 1.90% 0.07% 2.11% 14.94%2017 1.07% 2.61% 1.15% 0.00% 2.16% -0.66% 0.58% 1.78% -0.62% 2.49% -0.21% 1.73% 12.68%2018 0.04% -0.37% -2.66% 2.65% 3.19% 0.03% 1.55% 1.81% -0.24% -6.81% 1.36% -5.19% -5.05%2019 3.89% 1.87% 1.94% 4.39% -2.95% 3.09% 3.57% -2.45% 0.03% -0.95% 3.10% 1.50% 18.02%2020 -0.58% -5.94% -7.56% -13.55%
8.7%
45.5%
77.6%
110.5%
236.2%
-14.1%-27.5% -34.6%
-9.2% 18.5%
0.7% 8.5%25.0%
43.9%
104.8%
-40%
0%
40%
80%
120%
160%
200%
240%
1m 12m 3y 5y 10y
AES 8 Return Profile: 31 Dec 1997 - 31 March 2020
Best Return Worst Return Average Return
Albert E Sharp, 7 Elm Court, Arden Street, CV37 6PA
www.albertesharp.com 01789 404000 [email protected]
The views expressed in this report are not intended as an offer or solicitation for the purchase or sale of any investment or financial instrument. The views reflect the views of Albert E Sharp at the date of this document and, whilst the opinions stated are honestly held, they are not guarantees and should not be relied upon and may be subject to change without notice. Investments entail risks. Past performance is not necessarily a guide to future performance. There is no guarantee that you will recover the amount of your original investment. The information contained in this document does not constitute investment advice and should not be used as the basis of any investment decision. Any references to specific securities or indices are included for the purposes of illustration only and should not be construed as a recommendation to either buy or sell these securities, or invest in a particular sector. If you are in any doubt, please speak to us or your financial adviser as appropriate.
Issued by Albert E Sharp, a trading name of Albert E Sharp LLP which is authorised and regulated by the Financial Conduct Authority. © Albert E Sharp LLP 2019. Registered in England & Wales with the partnership number OC339858.

Commentary To March 31st 2020
The Albert E Sharp Model 10 portfolio fell 14.7% in Q1 of 2020 against the ARC Equity Risk Index’s -17.7%*. Over five years, the strategy is up 27.9% compared to the index’s 12.0%.Within our equity allocations, the move taken earlier this year to increase overseas exposure has had a material impact on performance as the pound crashed to a level against the dollar not seen since the mid-80s. In the US, adding the concentrated quality portfolio of Investec American Franchise highlighted the benefits of active management in the most efficient of equity markets. Year-to-date the fund is off 6.4% against the index’s 14.0%. Baillie Gifford American, a smaller position in the US allocation, finished the quarter in positive territory, up 1.5%. In the small cap space, Artemis US Smallers fared the worst amongst our US funds, down 19.2% for the quarter, yet still 6.5% ahead of its benchmark.In the UK, Lindsell Train UK Equity and Gresham House UK Micro Cap fell 15.9% and 24.4% respectively against the All Share index’s 25.3%. UK Buffettology lagged, finishing down 26.4%.In Asia, the performance of Lindsell Train Japan surprised both us and the fund manager as it finished the quarter down just 3.3% against the index’s -11.8%, having rallied 10.5% in March. Elsewhere, Schroder Asian Alpha Plus and Legg Mason Japan finished the quarter down 14.1% and 19.3% respectively. Holding the currency hedged share class of the latter worked against us in this case as sterling lost 7.1% of its value against the yen.Man GLG Continental European Growth finished the quarter down just 9.8% against the Euro Stoxx 50’s -22.2%. It should be of no surprise that this outperformance is down to a philosophy which is uncompromising about company balance sheet strength. As a consequence the sector profile has avoided hardest hit sectors such as oil, banks and insurers; a common theme across the funds held within the model portfolio strategies.
Portfolio ChangesA number of changes were made in the portfolio during the quarter. We trimmed our UK equity allocation with the sale of HSBC FTSE All Share Index, reallocating the proceeds into the US. In the US, we added Investec American Franchise and Baillie Gifford American, removing Dodge & Cox US Stock in the process. Both Artemis European Opps and BMO European Smallers exited the portfolio in favour of Man GLG Continental European Growth. Finally, we sold our passive exposure in Japan in order to make room for Lindsell Train Japan. Further details of these switches can be found in February’s monthly update.OutlookAlthough we have taken an optimistic view of equities in recent years, even when everything was rising in what was a pretty straight line, we were always cautious in making predictions, often reminding people that there is no such thing as a crystal ball; if someone does claim to have one, run! At no point in time is it more pertinent to remember this. The primary effects of current events are clearly evident, with lockdown in full swing there is a significantly diminished level of economic activity. What is yet to be understood is what the secondary and tertiary effects will be and indeed the scale of their impact. Without said crystal ball, the most pertinent path forward, as always, is the one which skews the probability in our favour. For this to occur, one must aim to survive; a point made by Terry Smith in a recent newsletter where he used Rick Mears’ famous quote, “In order to finish first. You must first finish”. Going concern is now the most important goal for companies and those with the highest probability of survival have the strongest balance sheets and ability to withstand a prolonged period of significantly lower earnings. Companies with such characteristics have generally been the best performers, especially in Q1 2020, as indicated by the MSCI US Quality Index’s drawdown of 15.1% compared to the MSCI US Value Index’s 25.9%. Do not get drawn into the notion that what led you into difficulty in the first place will then lead you out. Submitting to the natural human behaviour of scooping up shares in companies fallen by 50%+ with the attitude of “it can’t fall that much further” is a dangerous path. The downside remains 100% and the probability weighted upside significantly lower as a result of the chances of bankruptcy growing We will continue to hold funds invested in the highest quality companies, making sure in the process the underlying managers are sticking to their strategies and not being tempted by the ‘cheapness’ of lesser quality companies. The phrase ‘Never catch a falling knife,’ has never been more relevant.
*ARC performance numbers are provisional estimates, based upon a sample of ETFs. This is subject to revision based on actual performance of ARC contributors.
Investment Objective
To achieve a moderate level of total return. Up to 100% of the portfolio may be invested in UK and international equities, downside protection is derived from diversification into fixed-income and absolute return funds.
This strategy is suitable for investors with a ‘highest’ rating of willingness to accept risk, according to Dynamic Planner®.
Portfolio Performance
Platform Availability
Albert E Sharp, 7 Elm Court, Arden Street, CV37 6PA
www.albertesharp.com 01789 404000 [email protected]
-10%
0%
10%
20%
30%
40%
50%
Cum
ulat
ive
Retu
rn
AES Model 10 (Net) ARC Equity Risk PCI UK All Share [TR]
Equity98%
Cash, 2%
Model Portfolio Service
Risk Rating 10/10

Cumulative Performance *
Risk & Return Analysis *
Capacity For Loss Analysis
Discrete Performance *
Current Portfolio
Portfolio Statistics
AES Management Fees (p.a.) 0.5% + VAT
Custody Fees (p.a.) Variable Across Platforms
Estimated Portfolio Yield (p.a.) -
Portfolio OCF (p.a.) 0.78%
Minimum Investment £10,000
Strategy Launch Date 31st Dec 2010
Mapping & Benchmarks WMA Global GrowthARC Equity Risk PCI
IA GlobaleValue FE 10
Model Portfolio Service
Risk Rating 10/10
Sector Fund Name Weight
UK Equity CFP SDL UK Buffettology 6.0%
LF Lindsell Train UK Equity Fund 6.0%
Gresham House UK Microcap 3.0%
UK Equity Total 15.0%
US Equity HSBC American Index 10.0%
Artemis US Smaller Cos 8.5%
Investec American 8.5%
Baillie Gifford American 6.0%
US Equity Total 33.0%
Europe ex-UK Equity Man GLG Continental Europe 10.0%
Europe ex-UK Equity Total 10.0%
Japan Equity Lindsell Train Japan 4.0%
Legg Mason Japan Equity (Hdg) 3.0%
Japan Equity Total 7.0%
Asia Pac ex-Jpn Equity Schroder Asia Alpha Plus 5.0%
Schroder Small Cap Discovery 4.0%
Asia Pac ex-Jpn Equity Total 9.0%
Emg Market Equity Fidelity Emerging Markets Focus 10.0%
Emg Market Equity Total 10.0%
Global Equity AXA Fram Gbl Technology 8.0%
Baillie Gifford Global Discovery 6.0%
Global Equity Total 14.0%
Cash Cash 2.0%
Cash Total 2.0%
Grand Total 100.0%
* Figures are net of underlying fund OCFs and Albert E Sharp AMC of 0.6% (inc VAT) p.a. charged monthly
-6.1%
4.5%
27.9%
-10.0%
-2.9%
12.0%
-18.5%
-12.2%
2.9%
-20%
-15%
-10%
-5%
0%
5%
10%
15%
20%
25%
30%
1YR 3YR 5YR
AES 10 ARC Equity Risk PCI All Share TR
AES 1-2
AES 2 AES 3
AES 4
AES 5
AES 6AES 7
AES 8
AES 10
-5%
0%
5%
10%
15%
20%
25%
30%
0 1 2 3 4 5 6 7 8 9 10 11 12 13 14
5 Ye
ar R
etur
n
Volatility (3yr Volatility Annualised)
Year Jan Feb Mar Apr May Jun Jul Aug Sep Oct Nov Dec FY2013 7.32% 5.00% 2.34% -0.18% 2.91% -2.42% 4.00% -4.04% 0.42% 4.74% -0.40% 1.49% 22.64%2014 -1.92% 3.39% -0.88% -1.18% 3.09% 0.26% 0.29% 3.72% -0.97% 1.26% 3.36% -0.33% 10.31%2015 2.31% 2.91% 1.69% -0.06% 1.62% -4.20% 0.60% -5.20% -2.30% 4.61% 1.74% -0.45% 2.83%2016 -5.25% 0.96% 3.77% -0.61% 1.56% 2.54% 7.11% 2.04% 2.19% 2.04% 0.29% 2.33% 20.16%2017 1.67% 3.14% 1.17% -0.32% 2.44% -0.77% 1.00% 1.99% -1.01% 3.24% -0.24% 2.05% 15.20%2018 0.35% -0.75% -3.18% 3.16% 3.59% 0.03% 1.82% 2.37% -0.40% -8.04% 1.70% -6.32% -6.24%2019 4.61% 2.35% 2.03% 4.89% -3.32% 3.60% 4.01% -2.97% -0.13% -1.20% 3.69% 1.50% 20.27%2020 -0.71% -6.84% -7.76% -14.67%
10.1%
52.3%90.6%
127.2%
285.1%
-16.8% -31.6% -42.5%-17.2% 9.0%
0.7% 9.1%26.7%
46.9%
111.5%
-80%
-40%
0%
40%
80%
120%
160%
200%
240%
280%
320%
1m 12m 3y 5y 10y
AES 10 Return Profile: 31 Dec 1997 - 31 March 2020
Best Return Worst Return Average Return
The views expressed in this report are not intended as an offer or solicitation for the purchase or sale of any investment or financial instrument. The views reflect the views of Albert E Sharp at the date of this document and, whilst the opinions stated are honestly held, they are not guarantees and should not be relied upon and may be subject to change without notice. Investments entail risks. Past performance is not necessarily a guide to future performance. There is no guarantee that you will recover the amount of your original investment. The information contained in this document does not constitute investment advice and should not be used as the basis of any investment decision. Any references to specific securities or indices are included for the purposes of illustration only and should not be construed as a recommendation to either buy or sell these securities, or invest in a particular sector. If you are in any doubt, please speak to us or your financial adviser as appropriate.
Issued by Albert E Sharp, a trading name of Albert E Sharp LLP which is authorised and regulated by the Financial Conduct Authority. © Albert E Sharp LLP 2019. Registered in England & Wales with the partnership number OC339858.