model of multi product classification with regular demand
TRANSCRIPT

170 Majalah Ilmiah Bijak Vol. 17, No.2, September 2020, pp. 170 - 178
E ISSN 2621-749X
http://ojs.stiami.ac.id [email protected]
Model of Multi Product Classification with Regular Demand on
Inventory System in a Raw Material Supply Company
Tri Febrion Widiadvito 1*, Joniarto Parung 2
1 Fakultas Bisnis dan Ekonomika, Universitas Surabaya, Indonesia 2 Fakultas Teknologi Industri, Universitas Surabaya, Indonesia E-mail: [email protected], [email protected]
* Corresponding Author
1. INTRODUCTION
The right strategy in inventory is the main point in maintaining adequate and guaranteed supply continuity. Inventory strategies are becoming increasingly important but complex when the
number of raw material items to be prepared is relatively large. The approach based on product
grouping analysis is expected to divide the raw material products into several classifications.
Priority products can be mapped so that they can be a concern and a basis in making decisions for
procurement and marketing strategies. (Gasperez, 1998)
Many case studies have been carried out in classifying products for various purposes, almost
all of which aim to find effective and efficient methods that can reduce costs. Several studies that have been carried out only provide an alternative solution model by developing existing ABC
theory, not focusing on the ABC-XYZ classification method and without considering the type of
product being managed. There are also case studies of irregular and multi-item product conditions
with uniform storage handling characteristics.(Jay et al, 2014)
Nenes, Panagiotidou, and Tagaras (2010) conducted research on inventory management for
multiple items with irregular demand by taking cases from wheel and caster distributor companies.
With thousands of product items supplied from 20 countries in Europe and Asia, they are sold to many different types of customers. By using accurate demand modeling with gamma distribution
ART ICL E IN FO
ABST RACT
Article history Received 2020-09-05 Revised 2020-09-19 Accepted 2020-09-26
The right strategy in inventory is the main point in maintaining adequate
and guaranteed supply continuity. Inventory strategies are becoming
important but complex when the number of items that must be prepared is
increasing. In this regard, it is necessary to analyze the product groupings in several classifications. Prioritized products receive special attention.
The same problem is faced by PT PEKA, an import raw material
distribution company that has nearly 2000 product items. Based on data
demand is known, that the company's demand does not have a fixed
pattern. Many products have regular and irregular demand, even the
number of regular demand is very volatile. Companies often experience
excess stock or vice versa due to lack of stock demand according to
predictions, long lead times and product self-life that varies. Related to
this, alternative product groupings or classifications are needed in
accordance with company conditions. The company currently has frozen
and unfrozen products, has items made from natural and non-natural raw materials and has a short and relatively long lead time.
PT. PEKA groups products in various stages, which lead to a combination
of ABC and XYZ classifications. Demand of priority items generated from
the grouping is then forecast according to the model that gives the
smallest MSE / MAD. Furthermore, a case study was carried out to
calculate the Total Relevance Cost (TRC) from the calculation results to
be compared with the real TRC. TRC according to the classification
results was Rp. 1,293,370,148, - lower than the actual condition TRC,
which amounted to Rp. 1,805,887,874,
Keywords inventory management, ABC analysis, multi product

Majalah Ilmiah Bijak Vol. 17, No.2, September 2020, pp. 170 - 178 171
E ISSN 2621-749X
Tri Febrion Widiadvito (Model of Multi Product Classification with Regular Demand on Inventory …)
or poisson distribution models for slow moving items, and developing efficient procedures to
obtain accurate stock levels.
Mohammaditabar, Ghodsypour and O'Brien (2010) suggest a model that simultaneously
combines inventory item classifications and policies that are appropriate for each group with the
aim of obtaining effective inventory performance. The resulting model was compared with the
findings of other methods and the differences and total available values were sought.
Jin-Xiao Chen (2011) writes about multi criteria ABC Inventory Control (MCIC), using a
weighting and aggregating approach to the most favorable and most unfavorable factors for each
product item objectively then compared with the previous method which is illustrated. based on
MCIC problem.
Jiapeng Liu, Xiuwu Liao, Wenhong Zhao and Na Yang (2015) suggest an alternative
approach based on the outranking relationship defined in ELECTRE for the MCABC problem
when non-compensation between criteria must be considered. This approach differentiates from the previous MC ABC method by adding new features. The first is to consider non compensation
between the criteria on the MC ABC problem. The two clustering analyzes were combined into the
ABC classification process. The third is to simulate annealing algorithm to find optimal solutions
based on the resulting cluster hierarchy. (Ma, 2012)
The difference between this research and what has been done is that it focuses more on the
use of the ABC-XYZ theory with the grouping stages between the ABC and ABC-XYZ classifications, where after the ABC classification is carried out, the A classification will be
grouped according to storage method, product origin and time span. order before making the ABC-
XYZ matrix. Another difference is the characteristics of the product being managed, where this
research is a case study with real data on perishable goods products and has different storage and supply handling categories in national companies supplying raw materials for drugs, food and
beverages.(Ivanov, 2019)
As a case study is a company that supplies raw materials for the food and pharmaceutical industries. PT PEKA, which has been a supplier of imported raw materials for the food and
pharmaceutical industries since 1958, is headquartered in Jakarta and is assisted by 10 branch
offices located in the major cities of Java and Bali, as well as Makassar and Palembang.
PT PEKA's problems are getting more complicated when observing demand data that does
not have a fixed pattern. There are many products whose demand is regular but the amount
fluctuates, large in the previous year, but decreased in the following year. On the other hand, there
are products whose demand in the previous 2 years was relatively low but in the following years it was high. There are also products whose demand was there in the previous year but became zero in
the following year and even 2 years later. There are still many erratic demand patterns at PT
PEKA, which also have a risk of self-life problems (expiration). Therefore, accurate and precise product classification is a need that needs to be prepared so that more attention is paid to products
with important classifications. (Dwiantara et al, 2004)
It is hoped that more precise grouping of inventory products can make it easier for the
inventory section to determine the buffer stock and re-order points of each product based on
forecast, self-life and lead time orders (Makridakis, 1999).
2. METHOD
This research is applied research because it is conducted to provide alternative solutions to
problems experienced by a company (PT PEKA). In practice, the paradigm used is the positivism
paradigm. In the positivism paradigm, the ontology assumption is used that reality is external and
objective using quantitative measures. Meanwhile, epistemologically, this study assumes that this research is meaningful because it is carried out through direct observation in the field according to
the real conditions in the field (Parung, 2012).
172 Majalah Ilmiah Bijak Vol. 17, No.2, September 2020, pp. 170 - 178
E ISSN 2621-749X
Tri Febrion Widiadvito (Model of Multi Product Classification with Regular Demand on Inventory …)
Seeing the supply chain constraints and problems at PT PEKA, such as the number of product items being managed, different types of storage, long lead time for orders, product availability at
suppliers and unstable prices, resulting in low forecast accuracy, it is necessary to create a system
which can help facilitate the supply chain team in carrying out inventory management through
product grouping.
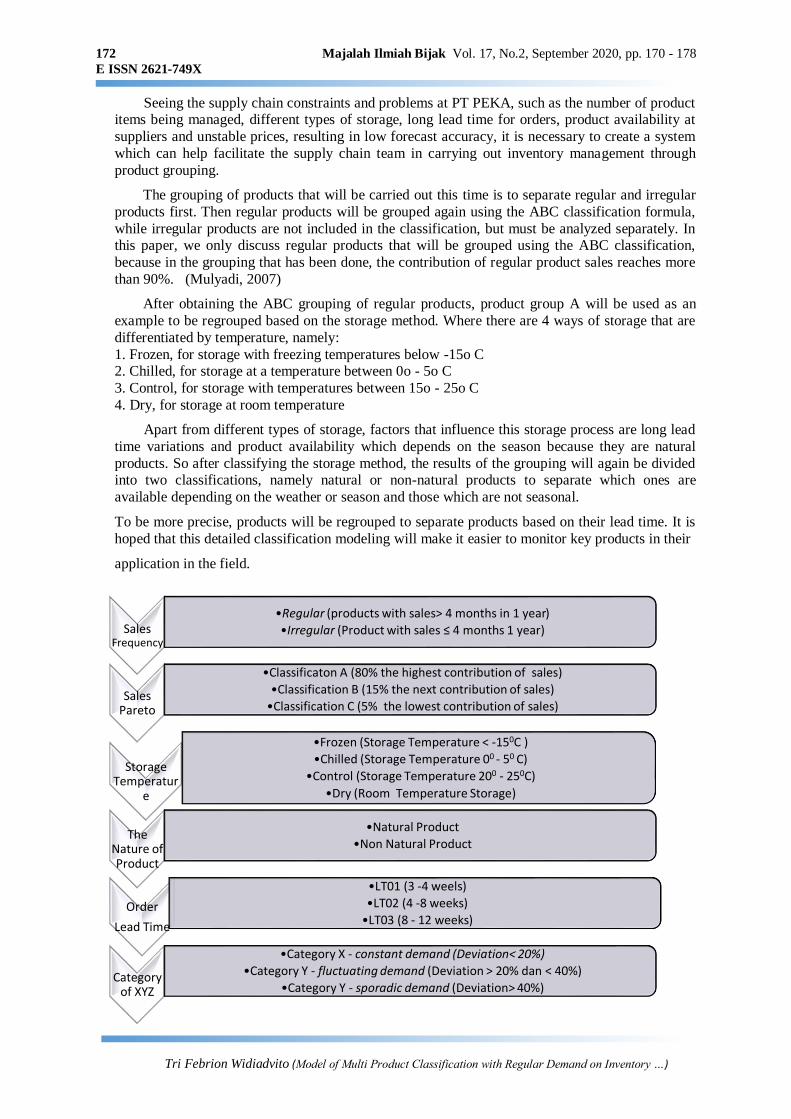
The grouping of products that will be carried out this time is to separate regular and irregular
products first. Then regular products will be grouped again using the ABC classification formula,
while irregular products are not included in the classification, but must be analyzed separately. In this paper, we only discuss regular products that will be grouped using the ABC classification,
because in the grouping that has been done, the contribution of regular product sales reaches more
than 90%. (Mulyadi, 2007)
After obtaining the ABC grouping of regular products, product group A will be used as an
example to be regrouped based on the storage method. Where there are 4 ways of storage that are
differentiated by temperature, namely:
1. Frozen, for storage with freezing temperatures below -15o C 2. Chilled, for storage at a temperature between 0o - 5o C
3. Control, for storage with temperatures between 15o - 25o C
4. Dry, for storage at room temperature
Apart from different types of storage, factors that influence this storage process are long lead
time variations and product availability which depends on the season because they are natural
products. So after classifying the storage method, the results of the grouping will again be divided into two classifications, namely natural or non-natural products to separate which ones are
available depending on the weather or season and those which are not seasonal.
To be more precise, products will be regrouped to separate products based on their lead time. It is
hoped that this detailed classification modeling will make it easier to monitor key products in their
application in the field.
Sales Frequency
•Regular (products with sales> 4 months in 1 year)
•Irregular (Product with sales ≤ 4 months 1 year)
Sales Pareto
•Classificaton A (80% the highest contribution of sales)
•Classification B (15% the next contribution of sales)
•Classification C (5% the lowest contribution of sales)
Storage Temperatur
e
•Frozen (Storage Temperature < -150C )
•Chilled (Storage Temperature 00 - 50 C)
•Control (Storage Temperature 200 - 250C)
•Dry (Room Temperature Storage)
The Nature of Product
•Natural Product
•Non Natural Product
Order
Lead Time
•LT01 (3 -4 weels)
•LT02 (4 -8 weeks)
•LT03 (8 - 12 weeks)
Category of XYZ
•Category X - constant demand (Deviation< 20%)
•Category Y - fluctuating demand (Deviation > 20% dan < 40%)
•Category Y - sporadic demand (Deviation> 40%)
Majalah Ilmiah Bijak Vol. 17, No.2, September 2020, pp. 170 - 178 173
E ISSN 2621-749X
Tri Febrion Widiadvito (Model of Multi Product Classification with Regular Demand on Inventory …)
Fig. 1. Steps to Classify Products
3. RESULT AND DISCUSSION
From the sales data for 2018, regular and irregular products are separated, then products that
are included in the regular category are grouped back into the ABC classification. Products in classification A, which represent 20% contribution to the sales value of regular products, are
reclassified according to storage method, nature of product origin and product order lead time.
After the grouping is done, there are 20 products that will be analyzed to make a forecast to
calculate the demand for the next 10 months.
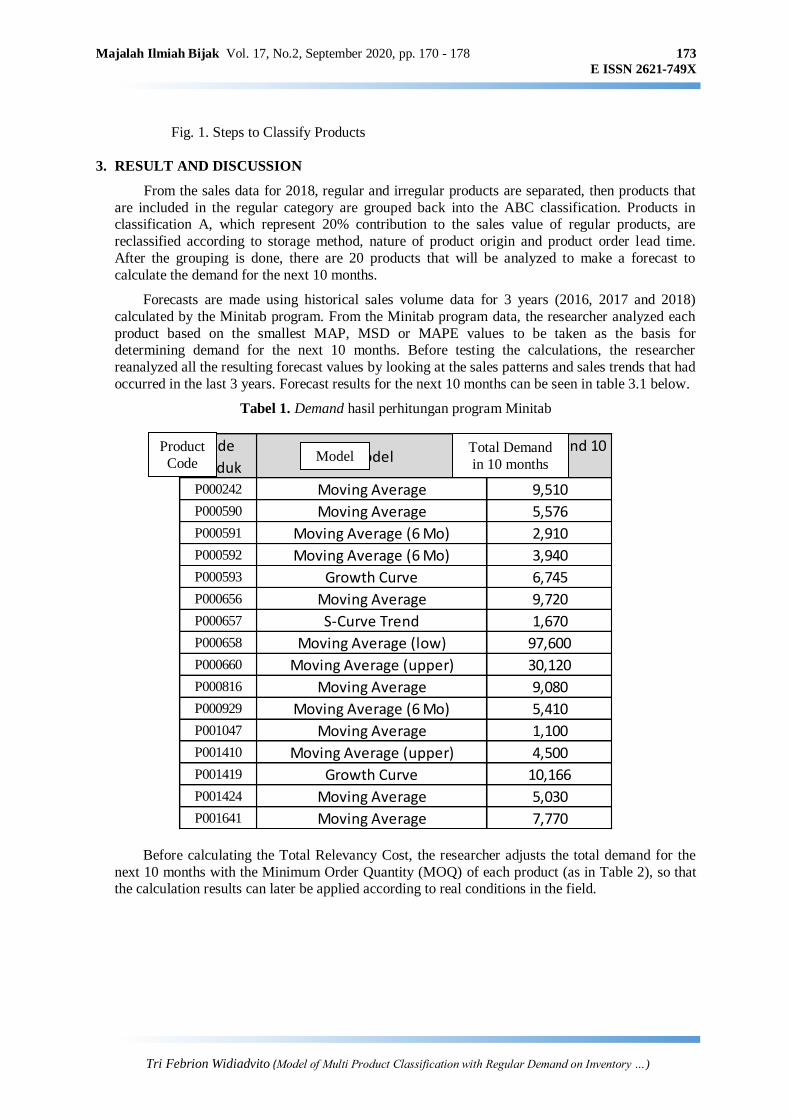
Forecasts are made using historical sales volume data for 3 years (2016, 2017 and 2018)
calculated by the Minitab program. From the Minitab program data, the researcher analyzed each
product based on the smallest MAP, MSD or MAPE values to be taken as the basis for determining demand for the next 10 months. Before testing the calculations, the researcher
reanalyzed all the resulting forecast values by looking at the sales patterns and sales trends that had
occurred in the last 3 years. Forecast results for the next 10 months can be seen in table 3.1 below.
Tabel 1. Demand hasil perhitungan program Minitab
Before calculating the Total Relevancy Cost, the researcher adjusts the total demand for the
next 10 months with the Minimum Order Quantity (MOQ) of each product (as in Table 2), so that the calculation results can later be applied according to real conditions in the field.
Kode
ProdukModel
Total Demand 10
bulan
P000242 Moving Average 9,510
P000590 Moving Average 5,576
P000591 Moving Average (6 Mo) 2,910
P000592 Moving Average (6 Mo) 3,940
P000593 Growth Curve 6,745
P000656 Moving Average 9,720
P000657 S-Curve Trend 1,670
P000658 Moving Average (low) 97,600
P000660 Moving Average (upper) 30,120
P000816 Moving Average 9,080
P000929 Moving Average (6 Mo) 5,410
P001047 Moving Average 1,100
P001410 Moving Average (upper) 4,500
P001419 Growth Curve 10,166
P001424 Moving Average 5,030
P001641 Moving Average 7,770
Product
Code Model
Total Demand
in 10 months

174 Majalah Ilmiah Bijak Vol. 17, No.2, September 2020, pp. 170 - 178
E ISSN 2621-749X
Tri Febrion Widiadvito (Model of Multi Product Classification with Regular Demand on Inventory …)
Table 2. Demand Modification According to the MOQ
After obtaining the modified forecast figures for the next 10 months, the demand forecast in
10 months is used to calculate the Total Relevancy Cost (Trc) of the inventory for each product using the following formula:
𝑇𝑟𝑐 = 𝐼𝑛𝑣𝑒𝑛𝑡𝑜𝑟𝑦 𝑐𝑜𝑠𝑡 + 𝑂𝑟𝑑𝑒𝑟 𝑐𝑜𝑠𝑡 (1)
𝑇𝑟𝑐 = (𝑄
2 𝑥 𝑃 𝑥 𝑓) + (
𝐷
𝑄 𝑥 𝐶)
where
Trc = Total Relevancy Cost Q = Product Quantity of Each Order
P = Product Price
f = Storage Cost Fraction
D = Annual Demand C = Order Cost
The number of products in each order can be calculated using the economic order quantity (EOQ) formula as follows:
𝑄 = √2 𝐶 𝐷
𝐻 (2)
where H = Storage Cost ( f x P )
In the calculation of this modification, the value of Q (number of products in each order) uses
the minimum order quantity (MOQ) of each product. The results of the calculations can be seen in
Table 3
Produk MOQ D (Fc) D Modifikasi
P000242 1,160 9,510 9280
P000590 1,000 5,576 5000
P000591 750 2,910 3000
P000592 1,000 3,940 4000
P000593 900 6,745 6300
P000656 2,630 9,720 7890
P000657 1,315 1,670 1315
P000658 2,630 97,600 97310
P000660 1,600 30,120 30400
P000816 1,315 9,080 9205
P000929 800 5,410 5600
P001047 600 1,100 1200
P001410 2,000 4,500 6000
P001419 788 10,166 10244
P001424 2,500 5,000 5000
P001641 3,030 9,090 9090
Product D Modification

Majalah Ilmiah Bijak Vol. 17, No.2, September 2020, pp. 170 - 178 175
E ISSN 2621-749X
Tri Febrion Widiadvito (Model of Multi Product Classification with Regular Demand on Inventory …)
Table 3. The Calculation Results of Total Relevancy Cost (TRC)
Where TIC is Total Inventory Cost and TOC is Total Order Cost. Henceforth, the results of the calculation of the Total Relevancy Cost (Trc) above will be compared with the actual
conditions that have occurred. The actual data used is the data on the number of goods entered in
each product item in the 37th month to the 46th month and the data on the average number of
goods that each time entered into each product.
As a comparison, the results of the calculation of existing demand and total relevancy cost
(TRC) will be compared with the actual data on goods receipts for the next 10 months and also the
actual total relevancy cost (actual Trc). The results of this comparison can be seen in Table 4
Data D in Table 4 is the modified demand forecast and data D (actual) is the actual data on the
procurement of each product in the next 10 months.
Table 4. Comparison of TRC and Actual Demand with The Results of Forecast Calculations
Produk P f C D (modif) H = (P x f) Q Tic Toc TrcP000242 207,800 0.0210 6,000,000 9,280 5,237 1,160 2,531,004 48,000,000 50,531,004
P000590 486,280 0.0210 8,500,000 5,000 12,254 1,000 5,105,940 42,500,000 47,605,940
P000591 562,526 0.0210 8,500,000 3,000 14,176 750 4,429,892 34,000,000 38,429,892
P000592 565,312 0.0210 8,500,000 4,000 14,246 1,000 5,935,776 34,000,000 39,935,776
P000593 656,862 0.0210 8,500,000 6,300 16,553 900 6,207,346 59,500,000 65,707,346
P000656 394,240 0.0210 13,480,000 7,890 9,935 2,630 10,886,938 40,440,000 51,326,938
P000657 353,165 0.0210 8,500,000 1,315 8,900 1,315 4,876,326 8,500,000 13,376,326
P000658 349,191 0.0210 13,480,000 97,310 8,800 2,630 9,642,909 498,760,000 508,402,909
P000660 159,800 0.0210 6,000,000 30,400 4,027 1,600 2,684,640 114,000,000 116,684,640
P000816 308,193 0.0210 13,480,000 9,205 7,766 2,630 8,510,750 47,180,000 55,690,750
P000929 337,447 0.0210 7,500,000 5,600 8,504 800 2,834,555 52,500,000 55,334,555
P001047 843,000 0.0210 6,900,000 1,200 21,244 600 5,310,900 13,800,000 19,110,900
P001410 915,097 0.0210 6,900,000 6,000 23,060 2,000 19,217,037 20,700,000 39,917,037
P001419 132,958 0.0210 8,840,000 10,244 3,351 788 1,100,094 114,920,000 116,020,094
P001424 633,570 0.0210 6,900,000 5,000 15,966 2,500 16,631,213 13,800,000 30,431,213
P001641 759,542 0.0210 6,900,000 9,090 19,140 3,030 24,164,829 20,700,000 44,864,829
Produk Metode D D ( Aktual) Trc Trc ( Aktual)
P000242 Moving Average 9.280 8.920 50.531.004 56.162.505
P000590 Moving Average 5.000 4.165 47.605.940 70.658.280
P000591 Moving Average (6 Mo) 3.000 2.505 38.429.892 53.465.973
P000592 Moving Average (6 Mo) 4.000 3.965 39.935.776 70.941.919
P000593 Growth Curve 6.300 5.224 65.707.346 72.503.774
P000656 Moving Average 7.890 4.095 51.326.938 58.157.834
P000657 S-Curve Trend 1.315 1.448 13.376.326 95.127.074
P000658 Moving Average (low) 97.310 64.287 508.402.909 651.950.597
P000660 Moving Average (upper) 30.400 31.575 116.684.640 122.648.985
P000816 Moving Average 9.205 6.285 55.690.750 71.467.685
P000929 Moving Average (6 Mo) 5.600 6.298 55.334.555 55.687.862
P001047 Moving Average 1.200 2.450 19.110.900 57.910.772
P001410 Moving Average (upper) 6.000 5.751 39.917.037 68.239.843
P001419 Growth Curve 10.244 11.815 116.020.094 133.699.629
P001424 Moving Average 5.000 4.675 30.431.213 59.087.546
P001641 Moving Average 9.090 7.550 44.864.829 108.177.596
210.834 171.008 1.293.370.148 1.805.887.874Total
Product Method D Actual TRC TRC
Actual

176 Majalah Ilmiah Bijak Vol. 17, No.2, September 2020, pp. 170 - 178
E ISSN 2621-749X
Tri Febrion Widiadvito (Model of Multi Product Classification with Regular Demand on Inventory …)
The Total Value of Relevancy Cost (TRC) in the results of the calculation of this study is (Rp. 1,293,370,148,00), indicating a smaller number when compared to the value of Total Relevancy
Cost (TRC) with actual goods procurement data (Rp. 1,805,887,874,00) and this smaller value also
occurs in all product items that have been researched, but not all the calculated demand values are
smaller than the actual procurement value that has been carried out. For example, it can be seen in products that have the biggest difference in demand value calculated and actual procurement,
namely product P000656, where the demand value calculated from forecast after modification
following the MOQ is 7,890 cartons and the actual number of goods procured is 4,095 cartons, but the value of TRC From the calculation forecast of Rp. 51,326,938,00 is still smaller than the TRC
value of the actual procurement of Rp. 58,157,834,00. This can occur because of the difference in
the minimum quantity (Q) in ordering goods, where the actual order data does not follow the applicable MOQ. Several reasons can be explained because of the existence of management
policies in reducing DOI (days of inventory) of a product.
There are several reasons for management to take a policy to reduce goods orders, one of
which is because there are still many carry-over stock from the previous period, this can be seen in the actual sales data for P000656 products in Table 3 which shows sales figures of 7,913 cartons.
Logically it can be concluded, how could there be a sale of 7,913 cartons by only procuring 4095
cartons of goods.
Table 5. Current Year Actual Sales Data, Goods Orders
Actual and Demand Research Results from Forecast Calculations
One more finding from the researcher, the reason for management in reducing the number of
goods orders so that they do not follow the MOQ is because the current storage capacity is very
limited, even though the company has made additional investments, but it has not been able to
keep up with the rate of business growth that has occurred. So that a step is taken to bring in the
product gradually. This is done to maintain the company's cash flow as well.
4. CONCLUSION
PT PEKA has used a product classification system, but in its application in the field it is not
maximally applied, because in determining re-order points or decisions to procure products, it does not use the basis for grouping that has been made and does not follow the optimal MOQ. In
practice, the company's supply chain team relies more on or waits for procurement requests from
the sales team, so that the forecasts that have been made do not function optimally. In this study, it
Produk Penjualan
Aktual
D (Pesanan
Aktual) D (Fc)
P000242 6.919 8.920 9.280
P000590 3.899 4.165 5.000
P000591 3.001 2.505 3.000
P000592 3.674 3.965 4.000
P000593 5.496 5.224 6.300
P000656 7.913 4.095 7.890
P000657 1.586 1.448 1.315
P000658 87.305 64.287 97.310
P000660 28.639 31.575 30.400
P000816 8.458 6.285 9.205
P000929 5.643 6.298 5.600
P001047 1.860 2.450 1.200
P001410 5.112 5.751 6.000
P001419 10.656 11.815 10.244
P001424 4.438 4.675 5.000
P001641 7.494 7.550 9.090
Product Actual
Sales D Actual
Order

Majalah Ilmiah Bijak Vol. 17, No.2, September 2020, pp. 170 - 178 177
E ISSN 2621-749X
Tri Febrion Widiadvito (Model of Multi Product Classification with Regular Demand on Inventory …)
is known that the product grouping with regular demand that can be applied effectively is the ABC
and XYZ models
The classification model and inventory system policy at PT PEKA is carried out in 5 stages,
starting from ABC classification which is then reclassified into frozen-non-frozen, natural-non-
natural products and based on lead time. Furthermore, the results of the grouping are reclassified
into the XYZ model to determine products with constant and fluctuating demand. The results of the forecast and product grouping that have been carried out in this research have resulted in a Trc
(Toatal Relevancy Cost) figure of IDR 1,293,370,148, which is lower than the actual conditions
that have occurred (IDR 1,805,887,874, -). This shows if there is still room for efficiency, which in
the end can save company expenses so that it can provide greater profits.
The main obstacle in implementing the inventory system that has been created is the lead time
and the MOQ (minimum order quantity) of each product. Calculations carried out in this paper, the
MOQ is determined based on data 1 FCL (full container load) of each product. So that the forecast value that has been obtained from the calculation results of the Minitab program, is modified the
forecast amount to adjust the MOQ.
Meanwhile, in real conditions, orders are still influenced by several other factors, such as product availability in the market and lead time as well as management policies in making
decisions on quantities in procurement of goods with consideration of DOI (days of inventory),
cash flow and warehouse capacity.
To get a more optimal and accurate forecast, it is highly recommended that the results of
forecast calculations from this product grouping be discussed first with the sales team and
company management regarding sales strategies and plans, so that it will maximize forecast
accuracy.
After the forecast is obtained from the calculation results and talks with the sales team and
company management, the supply chain team must take into account the plan to bring the product
in relation to the MOQ, so that a more accurate decision will be made in making a procurement
plan. It is possible to combine shipments in the plan to bring in products.
Because product items have a lot of regular demand (approximately 750 product items), PT
PEKA should separate the inventory management process for regular products, so that the supply chain team can concentrate more on regular products and contribute more to sales at PT. PEKA.
Meanwhile, products with an irregular category can be reclassified based on their sales
contribution and re-procurement according to needs (just in time). In certain cases, it is highly
recommended to remove these products from PT PEKA's product list so that the supply chain team
can work more effectively and efficiently.
In addition, the elimination of irregular products will also have an impact on the efficiency of
storage capacity, so that the space that has been used to store irregular products can be used as
storage space for regular products which contributes more to sales value.
REFERENCES
Chen JX. 2011, Peer-estimation formultiple criteria ABC inventory classification. Computers & Operations Research 2011;38(12):1784–91.
Dwiantara,L dan Sumarto, RH.2004. Manajemen Logistik. Jakarta:Grasindo.
Gasperez, Vincent. 1998. Production Planning and Inventory Control. Jakarta: Gramedia Pustaka
Utama

178 Majalah Ilmiah Bijak Vol. 17, No.2, September 2020, pp. 170 - 178
E ISSN 2621-749X
Tri Febrion Widiadvito (Model of Multi Product Classification with Regular Demand on Inventory …)
George Nenes , Sofia Panagiotidou, George Tagaras, 2010, Inventory management of multiple items with irregular demand : A case study, European Journal of Operational Research 205
(2010):313-324
Ivanov Dmitry, Tsipoulanidis A, Schonberger J, 2019. Global Supply Chain and Operations Management, second edition. Springer
Jay, Heizer dan Barry, render. 2014, Operation Management, sustainability and supply chain management, eleventh edition. Pearson
Jiapeng Liu, Xiuwu Liao, wenhong Zhao, Na Yang. 2015, A classification approach based on the outranking model for multiple criteria ABC analysis, Omega 63(2016):19-34
Ma LC. 2012, A two-phase case-based distance approach for multiple-group classi- fication problems.
Computers and Industrial Engineering2012;63(1):89–97.
Makridakis. 1999. Metode dan aplikasi peramalan. Edisi 2. Jakarta: Binarupa Aksara
Mohammaditabar D, Ghodsypour SH, O’Brien C.2011, Inventory control system design by
integrating inventory classification and policy selection
Mulyadi, 2007. Sistem Perencanaan dan Pengendalian Manajemen. Salemba Empat. Jakarta.
Parung, J., 2012, Merancang penelitian berbasis outcome, paradigma dan strategi,Brilian
Internasional Surabaya, 2012