model-based problem solving through symbolic regression via
TRANSCRIPT

Model-based Problem Solving through
Symbolic Regression via
Pareto Genetic Programming
Proefschrift
ter verkrijging van de graad van doctor aande Universiteit van Tilburg, op gezag van derector magnificus, Prof. dr. F.A. van derDuyn Schouten, in het openbaar te verdedigenten overstaan van een door het college voorpromoties aangewezen commissie in de aula vande Universiteit op vrijdag 5 september 2008 om14.15 uur door
Ekaterina Yurievna Vladislavleva
geboren op 11 september 1978 te Moskou,Rusland.

Promotor: prof. dr. ir. D. den HertogCopromotor: dr. G.F. Smits
Overige Commissieleden: prof. dr. W. Banzhafprof. dr. A. Cuytdr. M. Keijzerprof. dr. J.P.C. Kleijnenprof. dr. V.V. Toropov

1Introduction into Model-Based Problem
Solving
1.1 Motivation for data-driven modeling
Models lie at the core of any technology in any industry, be it finance,manufacturing, services, mining, or information technologies. The competitivenessof modern economy and the growing urge for sustainability call for a change inthe industry and therewith in the underlying models. Rapid creation of new and‘better’ models is a convenient aid to guarantee the long-term value, maximizeefficiency, and minimize the costs.
Industrial processes are driven by fundamental models that describe (or aim todescribe1) the true laws of nature. Comprehension and development of accuratefundamental models is one of the primary goals of scientific research. Controlover these models or at least awareness on what are their driving variables is oneof the primary goals of business, since it allows selecting optimal strategies formaximizing impact and profit.
Fundamental models that accurately describe complex systems and processeswithout severe simplifying assumptions are generally unknown. Those modelsthat exist (and are often called fundamental models) either are of limitedapplicability in cases where their (fundamental) assumptions are violated, or are
1For non-deterministic processes, e.g. stock markets, they have to describe both laws ofnature and artifacts.

Chapter 1. Introduction 2
of limited trustworthiness due to the lack of empirical validation. Both limitationsput unavoidable expectations on the development and exploitation of empiricalmodeling techniques, that use observations (data) to model the processes.
Polymer manufacturing, for example, aims to describe and control kinetic andstructural properties of polymers based on first principles of physical and chemicalprocesses. This is a challenging task since polymers essentially change theirbehavior and even physical structure under different environmental conditions,and also because laws of mechanics do not describe all aspects of such changes.The constitutive equations describing the behavior of polymers are generallyunknown and frequently involve unknown functions even when simplified kineticmodels are used. The form of these fundamental models may be so complex anddifferent from classical forms, that the relevant mathematical apparatus is notyet available to solve, or even describe them fully. In these cases, the availabledata can be used for empirical inference of the fundamental relationships betweenthe process variables and for accelerating the research.
Quantitative asset management is another example of a discipline thatactively exploits new empirical modeling technologies for validation and correctionof existing theoretical models. Quantitative asset management aims at modelingefficient stock markets for a purpose of deriving optimal strategies for stocks andmaking profit either by selling over-priced stocks, or buying under-priced stocks.The traditional theoretical models of asset pricing, like the Capital Asset PricingModel by Sharpe (1964) or arbitrage pricing theory by Ross (1976) are linearand have limitations in describing complex non-linear information-rich markets(see (Becker et al., 2006, 2007)). In this case advanced empirical modelingmethods (and genetic programming in particular) are used to derive non-linearrelationships between a multitude of potential factors and increase reliability offorecasting by quantitative models (see (Caplan and Becker, 2004; Neely andWeller, 2003; Neely et al., 1997)).
Another example of using (non-linear) empirical models is forecasting recessionsin macroeconomics. Several studies report that recessions can be predictedthrough simple financial variables like interest rates, stock price indexes,monetary aggregates, see e.g. (Dueker, 1997; Estrella and Mishkin, 1996)reporting that the slope of the yield curve (the spread between the interest rateson the Treasury notes) is a good predictor of recessions of the U.S. economy overone quarter periods. These studies use so-called probit models to estimate the

3 1.1. Motivation for data-driven modeling
probability of recession as a binary variable through a selected set of financialindicators (see also (Bernard and Gerlach, 1998) and (McPhee and Miller, 1995)for recessions in Canada). Probit models are linear in their parameters and usethe assumption that each input variable plays the same role in all recessions overa selected period. Recent studies increase the accuracy of recession forecastingthrough the use of non-linear empirical modeling methods such as multivariateadaptive regression splines (see (Sephton, 2001)).
This thesis focuses on the development of non-linear empirical modelsdescribing the relationships in given data. We use the terms empirical and data-driven as if they were the same. Data-driven models are built using observedand captured properties of the system, exhibited under different conditions orover time, and expressed in the form of data. In this study numeric real-valueddata are used for model development, and no assumptions on data distributionare made.
The task of empirical modeling, or data modeling lies in using a limitednumber of observations of systems variables (data) for inferring relationshipsamong these variables.
The system under study is characterized by a number of control parameters,which are usually difficult to monitor, e.g. they can be measured only in alab, or can be simulated only at high time- and computational costs. Empiricalmodeling attempts to express these critical control variables via other controllablevariables that are easier to monitor, can be measured more accurately or timely,are cheaper to simulate, etc. Control variables are referred to as outputs, orresponses, or response parameters, or key performance indicators, etc. Variables,or properties, that are used for expressing the response are called inputs, or inputvariables, design parameters, or predictors.
An example of a data matrix is given in Figure 1.1. A combination of valuesof all input variables and the associated values of the output variables is calleda data record, data point, design point, fitness case, or scenario. Data comingfrom the measurements may have missing values at any place in the data matrix,or be wrong due to noise or measurement errors. The simulated data may havegaps in the response values, corresponding to the infeasible realizations of certaincombinations of input variables. The task of the modeling is to detect the drivinginput variables that cause the change in the observed response variables, andformulate the exact relationship in a form of an accurate model. The quality of

Chapter 1. Introduction 4
Figure 1.1: Data is the input of a data-driven modeling process. The table below isa schematic view of the data matrix, where each line corresponds to a data point, also knownas sample, data record, fitness case, data level.
Input variables Responses
Dat
aR
ecor
ds
x1 x2 . . . xd y1 . . . yr
• • • • •• • • •• • •• · · · • • •• • • • •...
......
......
Figure 1.2: The goal and the output of a data-driven modeling process is a model ora collection of models that approximate the behavior of the observed system. Basedon the fixed values of the observed input variables, the model should generate an accurateprediction f of the output, such that it is close to the observed output y with respect to aselected fitness measure.
x1
x2...
xd
!!•
!"!!
!! SYSTEM !!
y1
...yr
!!•
MODELS !!f1(x) = y1
...fr(x) = yr
#$""
this model is assessed by the resemblance of the predicted output to the observedoutput based on a number of data points.
Figure 1.2 presents a schematic view of using modeling for prediction.System is the system under study (it can be a real process, or a black-boxsimulation), (x1, . . . ,xd) is a set of input variables, (y1, . . . ,yr) is a set of responsevariables, and model is a collection of modelled relationships predicting observedresponses (y1, . . . ,yr): {yj = f(x1, . . . ,xd), j = 1 : r}.
For many industrial applications the resulting relationships between the input

5 1.2. Requirements for empirical models
variables and the output variables of a physical system can be found implicitly,e.g. in a form of a simulation tool (see, for example, (Kleijnen, 2005; Kleijnenet al., 2005)). Such an implicit2 relationship is called a black box. Since black-boxsimulations are usually developed to simulate processes of extreme complexity,they themselves are complex and computationally intensive. Computing thepredicted value of the response based on the given values of inputs may take along time and severely limits the possible number of calls to the simulation tool.Furthermore, black box models are difficult to invert. Lacking insight into thetrue input-output relationship makes it impossible to answer simple questionsabout the response, e.g. what are the ranges of input variables that cause theresponse to take certain values, not necessarily optimal? To gain insight into animplicit black-box model and to ease its interpretation and manipulation, we cancreate explicit models that mimic its behavior and relate black-box inputs andoutputs. This process is called meta-modeling. In this thesis no assumptionsare made about the source of data or its noise distribution. In fact, all casestudies in this thesis are based on modeling given (historic) data, with data eithersampled from explicit equations. simulations, or taken from measurements of realprocesses.
1.2 Requirements for empirical models
The requirements for empirical models in an industrial setting are defined asfollows (see (Kotanchek et al., 2003; Smits and Kotanchek, 2004; Vladislavlevaet al., 2008)):
1. Capability for (a) on-line reliable prediction of process outputs withinthe given range of operating conditions and outside this range, and (b)trustability metric for these predictions.
2. Interpretability and possibility to integrate information from fundamentalmodels.
3. Low development and maintenance cost with little or minimaloperator intervention.
2By ‘implicit’ we mean anything that differs from an equation containing the output variableand a subset of input variables, expressed analytically

Chapter 1. Introduction 6
4. Robustness with respect to the variability in process inputs.
5. Adaptability to novelties in data and tunability toward changes in theprocess.
Since both measured and simulated data are very often corrupted by noise,and in case of real measurements can be driven by a combination of bothmeasured and unmeasured input variables, empirical models should not onlyaccurately predict the observed response, but also have some extra generalizationcapabilities. The same requirement holds for models developed on simulateddata. Examples of such capabilities are insensitivity to a certain amount of noisein the inputs or a capability to extrapolate the response outside the observedinput region (in fact, in a multi-dimensional data space, any deviation fromthe training points has to be performed with caution and will often be referredto as extrapolation3). We also would like models to exhibit not only requiredproperties, but also additional convenient properties like compactness, smallnumber of constants, etc. It is important, that generated models are interpretableand transparent, in order to provide additional understanding of the underlyingsystem or process.
1.3 Data-driven modeling methods
There is a multitude of empirical modeling techniques that are used forconstructing input-output regression models, but we wish there were onetechnique, producing models that fulfill all the requirements listed above.
3In general, interpolation is defined as prediction of an unknown function within the inputrange of a finite set of samples, and extrapolation is defined as prediction outside the inputrange of data samples or with higher uncertainty. In this thesis we consider modeling high-dimensional undesigned data, which may be imbalanced, i.e. may not have a uniform density inthe input space. For imbalanced, high-dimensional data sets, however, the standard definitionsof interpolation and extrapolation are not always appropriate. If the input points of a one-dimensional modeling problem are located on the intervals [0, 1] and [10, 11], we considerprediction at point 5 to be an extrapolation, despite the fact that 5 belongs to the convexhull of the input samples. In general, if the data is not uniform in the input space, it mayconsist of several connected components (clusters), which number depends on the choice of theuser. The decision on whether we extrapolate or interpolate will depend on the location ofthe prediction point relative to the clusters, while the uncertainty of prediction will dependon the data density in the neighborhood of the prediction point, and on how well the pointis surrounded by its neighbors in the input space. Since the data density decreases whenthe number of dimensions increases at the fixed number of data samples, the uncertainty ofprediction grows in higher dimensions, which substantiates the usage of the term extrapolation.

7 1.3. Data-driven modeling methods
We mention several most common methods to produce empirical models:linear regression (Box and Draper, 1986), nonlinear regression (Johnson andWichern, 1988) including multi-variate rational interpolations on points (Cuytand Verdonk, 1985) and on vertical segments (Salazar Celis et al., 2007) andmulti-point approximations of response surfaces for optimization (Toropov,1989), moving least-squares (Choi et al., 2001; Levin, 1998), kriging (Kleijnen,2008a; Sacks et al., 1989), multi-variate adaptive regression splines (Friedman,1991), radial-basis functions (Powell, 1987), neural networks (Haykin, 1994),support vector regression (Cherkassky and Mulier, 1998; Vapnik, 1997), geneticprogramming (Koza, 1992), and particularly Pareto Genetic Programming (Smitsand Kotanchek, 2004).
Modeling practitioners widely accept that there is no universal approach toempirical modeling, and that the future lies in combining working principles fromvarious approaches and blending them into hybrid methodologies. This sectionmakes a modest attempt to discuss the main differences between some of thementioned methods, to look for complementary principles that should be usedtogether in modeling complex industrial processes and to locate the capabilitiesof the Pareto GP method (which is the main focus of this thesis) on a generalmap of possibilities of regression techniques.
Several studies (Jin et al., 2003, 2000; Shyy et al., 1999; Simpson, 1998)attempting to compare the different approaches to data-driven modeling agreethat no definite conclusions can be drawn on the general advantage of anyparticular technique over others. The difficulty is explained by multiplecompeting criteria for comparison, which tend to vary wildly over differenttechniques.
We categorize the approaches into parametric and non-parametric in thefollowing way4. A parametric approach to regression consists of fixing a modelstructure a priori and finding optimal values for the coefficients (parameters, orweights), that minimize a certain criterion, usually the sum of squared errors.Polynomial regression is a classical parametric modeling method. E.g., for asecond-order model on d input variables, the approximating function is selectedto be the following:
4This division is different from the one used in statistics, where parametric methods assumecertain distribution of samples

Chapter 1. Introduction 8
f(x1, . . . ,xd) = β0 +∑
1≤i≤d
βixi +∑
1≤i≤j≤d
βi,jxixj , (1.1)
where β0,βi, and βi,j are the unknown coefficients.Polynomial regression is a linear parametric method, since it involves solution
of a linear system of ”normal” equations in the unknown parameters.Rational interpolation is a non-linear parametric method, since the model
structure is fixed to represent a ratio of two polynomials, and quadraticprogramming is used to estimate optimal values for unknown coefficients. Weaddress two kinds of rational interpolation - the standard multivariate rationalpoint interpolation, and rational interpolation on intervals (Salazar Celis et al.,2007). The latter is a new method to construct rational interpolations throughintervals of a certain length associated with each data point. The length of theinterval determines the maximal tolerable interpolation error (insensitivity zone).The technique seems to be an elegant extension of rational point interpolations,which removes the dependence of model complexity (measured in the number ofterms) from the data size, and allows a more flexible modeling of data sets witha large number of records.
Feed-forward neural networks (NNs) presented as multi-layered perceptronsbuild the multi-variate prediction model as a superposition of weighted combina-tions of unary basic functions (called inner nodes) and input variables. Neuralnetworks defined as (ordinary) radial basis function networks (RBFNs) buildprediction models as a weighted combination of radial basis functions with centersin the input points. The generalized RBF networks use a much smaller numberof basis functions (inner nodes) at the expense of having to estimate the optimallocation of their centers in addition to unknown weights. We categorize neuralnetworks as a non-linear parametric method.
Support vector machines (SVMs) are non-linear parametric models originatingfrom statistical learning theory (Cherkassky and Mulier, 1998; Vapnik, 1982).A support vector machine is mapping the data space into a multi-dimensionalfeature space, where the prediction function fFeat is linear in the unknownparameters w and b: fFeat(x,w, b) = wx + b. The type of transformationφ : x !→ φ(x) into the feature space is chosen a priori and is usually polynomial,RBF, or a combination of these two (Jordaan, 2002).
SVMs are said to be characterized by their kernel function, denoted as

9 1.3. Data-driven modeling methods
K(x,x0) = φ(x) · φ(x0). The optimal weights for the prediction function arecomputed through minimization of an ε-insensitive error function:
‖w‖+ C∑
i≤N
max{0, |yi − f(xi)|− ε}, (1.2)
where ε is a tolerable error, C is a regularisation coefficient, and w are the weightsof the f . Since weights are computed for the feature space, all x are transformedinto the φ(x) during the optimization of w and b.
The difference between SVMs and NNs is that a NN method defines the modelstructure first and evaluates optimal coefficients for it such that the predictionerror is minimized. A SVM method first determines the tolerable generalizationerror (and also a type of kernel and the regularization term), and then searchesfor the optimal structure for the model, i.e. weights for ’optimal’ data records,called support vectors. The theoretical advantage of the SVM method over NNsis that the error function has no local optima, and the generalization error doesnot depend on the dimensionality of the data space by design (Jin et al., 2003).The main difference between support vector regression and other approximationtechniques is the fact that the SVM model is a not a direct function of the inputvariables, but a function of data points (support vectors), and has the followingform: f(x) =
∑k∈SV ωK(xk,x) + b, where SV is a smallest subset of points
with positive optimal weights called support vectors, and ω and b are the uniqueestimated parameters. This is the main hurdle for the interpretation of SVMmodels, since such notions like variable interactions are absent by design. Astrong point of the SVM method besides a strong theoretical foundation, is itsability to detect outliers in the data; see (Jordaan, 2002).
All methods discussed in this section are global, in the sense that they producea prediction of the observed response globally on the entire training range. Wewill, however, divide parametric methods into global and local ones, depending onthe global or local nature of their parameters. For example, polynomial regressionis a global parametric method whose coefficients do not depend on the point atwhich the predicted response is evaluated.
Moving least-squares (MLS), is a local parametric method, since it requiresre-calculation of coefficients when the evaluation point changes. The differencebetween the polynomial moving least-squares model and a standard polynomialregression model obtained via least-squares is that the coefficients of the MLS

Chapter 1. Introduction 10
model are computed locally for a point x through the least-square minimizationof the weighted error function:
N∑
i=1
(f(xi)− yi)2θ(‖x− xi‖), (1.3)
where θ is a non-negative weight function, ‖ · ‖ is a selected norm in the inputspace Rd, usually Euclidean, and (xi, yi) is the i-th record of the data set. Weightθ is analogous to both the neighborhood size and insensitivity zone - the MLSapproximation can be made local, if θ(p) quickly converges to 0, when p → ∞,and interpolation with MLS can be achieved when θ(0) =∞.
Kriging is another local parametric method for building global multi-variateapproximations, in fact, interpolations. A kriging model is determined as a sum ofa global predictor, often called a signal function S(x), and a localized ‘deviation’ζ(x):
f(x) = S(x) + ζ(x), (1.4)
where ζ(x) is normal random function with zero mean and non-zero covariance:Cov[xi,xj ] = R(xi,xj), where R is a correlation function selected from a familyof parametric correlation functions, often as Rq,θ(xi,xj) = exp[−
∑dk=1 θk|xi
k −xj
k|qk ] (xjk if the k-th component of a sample point xj). Prediction of the
final kriging model in point x is determined by a weighted sum of observedresponses f(x) =
∑Ni=1 c(x)yi, where the optimal values minimize the mean
squared prediction error. Coefficients θk and qk are usually obtained via themaximum likelihood estimation method. Computation of coefficients involvesinversion of the matrix of size d × d (d is the dimensionality), and hence, putslimitations on using kriging for very large data sets.
Multivariate Adaptive Regression Splines (MARS) is a flexible regressiontechnique with a self-explanatory name: the final model is obtained as a weightedlinear combination of separate splines (or basis functions) fitted to distinctintervals of the input variables. The splines are obtained using a non-parametricmethod, but since they are combined in an optimally weighted sum, it is fair tocall this method semi-parametric. The MARS algorithm exhaustively searchesover all possible locations of the endpoints of spline interpolation, as well as allpossible variables and variable interactions. The knots, variables and interactions
11 1.3. Data-driven modeling methods
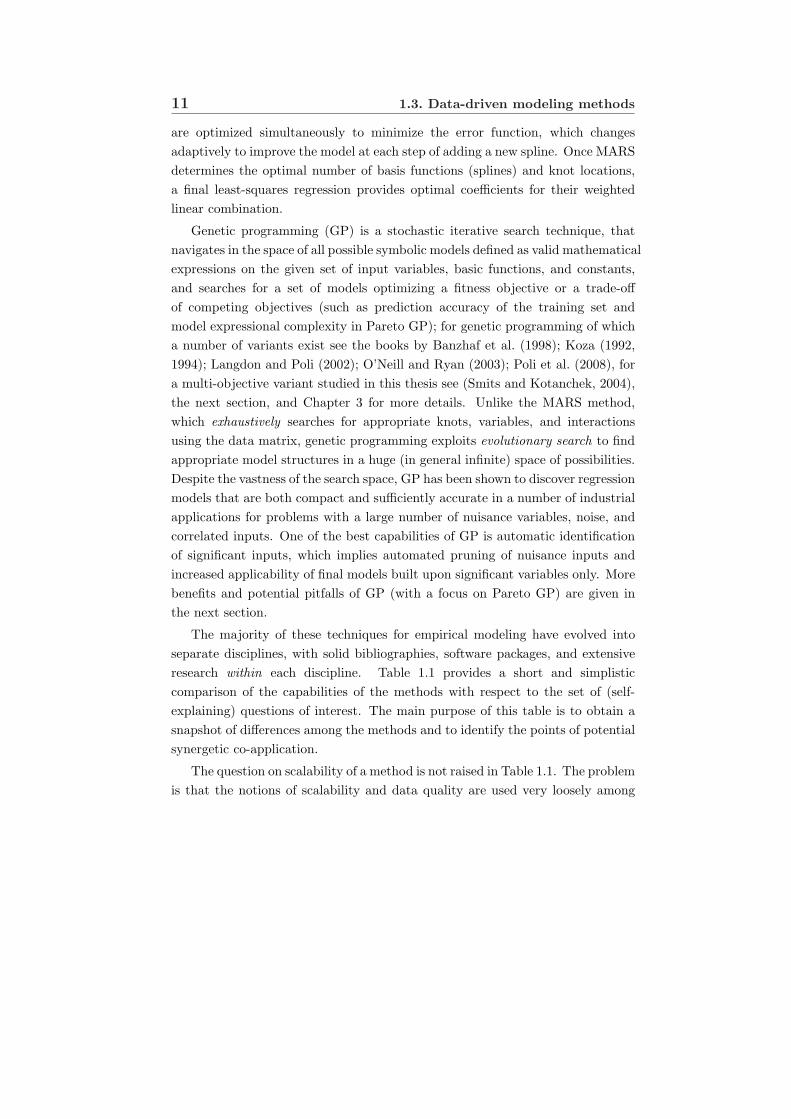
are optimized simultaneously to minimize the error function, which changesadaptively to improve the model at each step of adding a new spline. Once MARSdetermines the optimal number of basis functions (splines) and knot locations,a final least-squares regression provides optimal coefficients for their weightedlinear combination.
Genetic programming (GP) is a stochastic iterative search technique, thatnavigates in the space of all possible symbolic models defined as valid mathematicalexpressions on the given set of input variables, basic functions, and constants,and searches for a set of models optimizing a fitness objective or a trade-offof competing objectives (such as prediction accuracy of the training set andmodel expressional complexity in Pareto GP); for genetic programming of whicha number of variants exist see the books by Banzhaf et al. (1998); Koza (1992,1994); Langdon and Poli (2002); O’Neill and Ryan (2003); Poli et al. (2008), fora multi-objective variant studied in this thesis see (Smits and Kotanchek, 2004),the next section, and Chapter 3 for more details. Unlike the MARS method,which exhaustively searches for appropriate knots, variables, and interactionsusing the data matrix, genetic programming exploits evolutionary search to findappropriate model structures in a huge (in general infinite) space of possibilities.Despite the vastness of the search space, GP has been shown to discover regressionmodels that are both compact and sufficiently accurate in a number of industrialapplications for problems with a large number of nuisance variables, noise, andcorrelated inputs. One of the best capabilities of GP is automatic identificationof significant inputs, which implies automated pruning of nuisance inputs andincreased applicability of final models built upon significant variables only. Morebenefits and potential pitfalls of GP (with a focus on Pareto GP) are given inthe next section.
The majority of these techniques for empirical modeling have evolved intoseparate disciplines, with solid bibliographies, software packages, and extensiveresearch within each discipline. Table 1.1 provides a short and simplisticcomparison of the capabilities of the methods with respect to the set of (self-explaining) questions of interest. The main purpose of this table is to obtain asnapshot of differences among the methods and to identify the points of potentialsynergetic co-application.
The question on scalability of a method is not raised in Table 1.1. The problemis that the notions of scalability and data quality are used very loosely among

Chapter 1. Introduction 12
Table
1.1
:Part
I.A
dra
ftofa
hig
h-levelcom
pari
son
ofcom
mon
em
pir
icalm
odeling
meth
ods.
Fea
ture
Lin
ear
Rational
NN
sSV
Ms
Krigin
gM
LS
MA
RS
GP
&Pare
toG
PR
egre
ssio
nIn
terv
al
Inte
rpola
tion
Know
ledge
about
explici
tm
odel
Yes
No
No
No
No
Yes
No
No
stru
cture
required
?
Para
met
ric
or
Para
m.
Para
m.
Para
m.
Para
m.
Loca
lLoca
lSem
i-para
m.
Non-p
ara
m.
Non-p
ara
met
ric
Para
m.
Para
m.
Poss
ibility
for
No
No
No
No
No
No
Yes
No
Loca
lA
dapta
tion
(Yes
for
(Yes
for
RB
FN
s)so
me
θ)
Model
com
ple
xity
No
No
No
No
Yes
No
No
No
dep
ends
on
the
#(Y
esfo
r(Y
esfo
rofdata
sam
ple
sPI)
RB
FN
s)
Pote
ntialto
crea
teH
igh,if
Moder
ate
,Lim
ited
Lim
ited
Lim
ited
Hig
h,if
Moder
ate
Hig
hco
mpact
model
sst
ruct
ure
ifin
terv
al
stru
cture
irre
spec
tivel
yof
isright
isla
rge
isright
data
size
and
(No,fo
rPI)
stru
cture
Can
inte
rpola
tion
No
Yes
No
Alm
ost
,if
Yes
Alm
ost
,if
No
No
be
guara
nte
edif
nee
ded
?ε
=0
&θ(0
)=∞
C=∞
Danger
toover
-fit
No
Red
uce
d,
Hig
hH
igh
Hig
hR
educe
dR
educe
dH
igh
the
data
without
ifin
terv
al
by
des
ign
explici
tis
larg
eco
mple
xity
contr
ol?
Can
finalm
odel
sYes
Hard
lyH
ard
lyH
ard
lyH
ard
lyH
ard
lyH
ard
lyYes
pro
vid
ein
sight
into
the
pro
ble
m?

13 1.3. Data-driven modeling methods
Table
1.1
:Part
II.A
hig
h-levelcom
pari
son
ofcom
mon
em
pir
icalm
odeling
meth
ods.
Fea
ture
Lin
ear
Rational
NN
sSV
Ms
Krigin
gM
LS
MA
RS
Pare
toG
PR
egre
ssio
nIn
terv
al
Inte
rpola
tion
Com
ple
xity
Yes
,Yes
,Yes
,Yes
,Yes
,Yes
,Yes
,Yes
,co
ntr
ol
by
fixin
gby
incr
easi
ng
by
lim
itin
gby
fixin
gby
usi
ng
by
fixin
gby
usi
ng
by
explici
tposs
ible
?a
model
the
inte
rp.
#ofhid
den
the
pen
alty
asu
bse
ta
model
asu
bse
tco
ntr
olof
stru
cture
inte
rval
nodes
term
,ofdata
stru
cture
ofdata
,m
odel
incr
eas.
part
lypro
per
ties
ε-z
one
pre
sent
or
changin
gK
by
des
ign
Implici
tass
um
ption
Yes
Som
e,N
oN
oSom
e,Yes
No
No
that
input
oth
erw
ise
oth
erw
ise
variable
snum
eric
al
corr
elation
are
pro
ble
ms
should
be
indep
enden
t?poss
ible
redefi
ned
Implici
tass
um
ption
No
No
No
Yes
No
No
No
No
that
all
input
variable
sare
signifi
cant?
Danger
ofhavin
gPre
sent
Pre
sent
Pre
sent
Pre
sent
Pre
sent
Pre
sent
Pre
sent
Not
insi
gnifi
cant
Pre
sent,
variable
sin
or
Hea
vily
finalm
odel
sR
educe
d
Danger
ofN
OT
havin
gN
ot
Not
Pre
sent
Not
Not
Pre
sent
Pre
sent
Pre
sent
signifi
cant
Pre
sent
Pre
sent
Pre
sent
Pre
sent
variable
sin
finalm
odel
s
Majo
rpra
ctic
al
Choosi
ng
Hig
hO
ver
-fitt
ing
Insi
gnif.
Larg
eC
hoosi
ng
Larg
eH
uge
challen
ge
right
dim
ensi
onality
inputs
#R
ecord
sright
data
searc
hsp
ace
model
ofdata
indata
model
matr
ix&
stru
cture
stru
cture
stoch
ast
icity

Chapter 1. Introduction 14
disciplines and depend on the application area. For example, in some industrialmodeling projects carried out during the PhD research, the data with 20 inputvariables, and 25 measurements per variable (in modeling for new products), orwith 10 input variables and 30 measurements per variable (in developing newmeasurement techniques) were given as very rich data sets.
The evolutionary search was developed for handling tremendously difficultproblems, which are intractable for classical approximation techniques. When wetalk about scalability of Pareto GP or other evolutionary techniques to large datasets, we talk about handling hundreds to thousands of variables, and hundredsto millions of records.
For rational interpolation, for example, data sets with dimensionality 8-10are already high-dimensional. It does not make the method any weaker, it onlysuggests that one should probably not use rational interpolation if the trainingdata contains 50 variables and 8000 records. It is possible, however, (and is oftenthe case for real-life problems) that only a handful of those 50 variables or low-order transformations on some variable combinations are significant, but we donot know which, and the correlation analysis or the principal component analysisdo not provide such information. In this case it is beneficial to perform several GPruns on the training data to identify driving variables, or combinations, extractthem, and make the problem tractable for rational interpolation, since the lattercan successfully impose some a priori constraints on the behaviour of the finalmodel.
In general, it will be interesting to express the scalability of the methods asa function of the number of available data records N , and as a function of thenumber of input variables d5.
A discussion on Table 1.1 with a focus on Pareto GP continues in the nextsection.
5This and many other valuable suggestions on improvement of Table 1.1 were made byTrent McConaghy. Trent also suggested to add Random Forests and Boosting Regression Treesmethods to the Table, as well as distinguish between piece-wise linear and piece-wise non-linear methods instead of using one MARS column, and separately consider a good second-order polynomial models and high-order polynomial models within linear regression. Theseadjustments will appear in the on-line version of the thesis.

15 1.4. Symbolic regression via GP: benefits and challenges
1.4 Symbolic regression via GP: benefits and
challenges
1.4.1 The task of symbolic regression
One of the best descriptions of symbolic regression via genetic programming(SR via GP) is given by Schmidt and Lipson (2006), who wrote that “ unlikepolynomial regression or machine learning methods which minimize the error, SRis a system identification method.” The challenging task of symbolic regressionis to identify a convincing model f (or a set of models), that gives a predictionfor the response variable and is expressed analytically using the minimal set ofinput variables and the given set of basic operations and constants.
Industrial challenges we are attempting to solve have two main characteristics:(1) No or little a priori information is known about the underlying system, and,therefore, no assumptions about models can be made; (2) the available data ishigh-dimensional with either an abundant or an insufficient number of samples.
No information about model structure, unknown distribution of data samples,and ‘bad’ data sets dramatically reduce the number of alternative techniques tostart empirical modeling. If the task is structure identification, then parametricmethods should be excluded from the number of options to perform thisidentification. Considering the alternatives presented in Table 1.1, this leavesmultivariate adaptive regression splines and GP as the only non- and semi-parametric methods. If we want models that produce reliable predictionsoutside the training region (see requirement (1) of Section 1.2, we certainly wantextrapolation to be influenced by the behaviour of the entire (true) responsesurface, and not only by the neighboring splines in case of MARS. The needto produce a reliable extrapolation of the response, predicted by an identifiednon-parametric model, suggests to put aside MARS and settle on geneticprogramming. We are going to do this for the rest of the thesis, and focuson Pareto GP, a genetic programming with archiving and multi-objective fitnessfunction. An overview of other variants of GP can be found in a recent monographby Poli et al. (2008).
Chapter 1. Introduction 16
1.4.2 Challenges in view of requirements to models
Genetic programming, and evolutionary search in general, is a very flexiblemethodology, allowing vigorous application and co-application of all kinds ofstrategies and meta-strategies, as long as a cycle between model generation &variation, model evaluation, and model selection is maintained. Having settledfor a particular method for constructing input-output regression models andpresuming that it is very flexible, we will come back to the requirements togood models formulated in Section 1.2 and create a list of necessary features thatour GP-based system should possess in order to produce models satisfying thoserequirements.
(1) Capability for on-line reliable prediction of process outputs within the givenrange of operating conditions and outside this range: The need for reliablepredictions within the training range imposes the use of prediction erroras one of the optimization criteria for model development. The needfor reliable predictions outside the training range, i.e. in the unobservedareas of the data space imposes the need to produce models with smoothresponse surfaces and minimized potential for pathological behaviour underextrapolation.
(2) Interpretability and possibility to integrate information from fundamentalmodels: Interpretability is a tricky notion. It is subjective, and can besaid to solely depend on the creativity of the observer. However, in reality,it is very easy to say whether the model is interpretable or not. It isat least always easy to tell whether the model is uninterpretable. Bya potential for interpretability or for insight I will mean the potentialto connect observations of a model (not only model’s prediction error)to hypotheses about the underlying problem. For example, if model
f(x1, x2, x3, x4, x5) =(x2 + x3
x4
)e1−
(x3x4
)2
has a sufficiently high predictionaccuracy, it suggests that variable x5 is insignificant, and transformationx3x4
can be an important predictor of the response.
The possibility to integrate information from fundamental models is anopen area of research. Pareto GP and GP in general are open for inclusionof various meta-variables or important basic operators (e.g. taken fromfundamental models) into the search process, but property preservation,

17 1.4. Symbolic regression via GP: benefits and challenges
like e.g. creation of monotone models, or only square-integrable functions,is non-trivial and has to involve either a modification of the fitness function,or introduction of new property-preserving modification operators. Thisthesis does not contain a study on imposing a priori constraints to GPsolutions during the modeling process. It is however worth mentioningthat Pareto GP is designed to generate rich sets of diverse final solutions,which gives the user the opportunity to explore these sets of solutions aposteriori in order to select models with desired properties, or the onesthat agree with intuition.
(3) Low development and maintenance cost with minimal operator intervention:Low development cost implies that models should be developed withminimal time and computational effort. The ultimate goal is a one-hit-of-a-button software integrating data preprocessing, analysis and adaptation,model development and problem analysis phases. Low maintenance costrefers to deployment costs associated with implementation and maintenanceof the model or a model ensemble in a real system, e.g. for predicting a hard-to-measure property of a production process. Low maintenance implies thatmodel prediction will not require monitoring, and has a capability for self-assessment expressed in a trust metric. This is useful when, for example,processing conditions change unexpectedly. In general, for multi-variatemeasurements it is hard to say when a point is appropriate or is an outlier.In case of changed processing conditions, a trustworthy model or modelensemble will alarm about entering an unobserved zone, and allow focusedprocess control.
(4) Robustness with respect to the variability in process inputs. The requirementfor robustness is inspired by modeling data coming from real measurements,where not only the response, but also the inputs can be corrupted byconsiderable noise. The need for robustness under small variation of theinputs imposes a constraint on the non-linearity of the response surfacesassociated with models. The smoother, the more robust (most of the time).
(5) Adaptability to novelties in data and tunability toward changes in the process:The need for adaptability requires the system to be capable of identifyingthe novelties in data, assessing whether they correspond to regime changesor to measurement outliers, or require re-modeling. As mentioned in Table

Chapter 1. Introduction 18
1.1, GP does not possess a capability for local adaptation, i.e. if a newsample point is added to the data set, in principle, a total re-modeling ofthe data is required. It is, however, possible to supply an initial set ofalternative solutions with results from the previous efforts and (possibly)make the revised model discovery more efficient.
Capabilities mentioned above can be considered as generic research goalsfor the development of a practical modelling tool. Before we zoom in on theresearch goals of this thesis, we provide a short description of the Pareto geneticprogramming method, and evaluate its benefits and challenges with respect tothe above-mentioned research goals.
1.4.3 Genetic programming versus Pareto GP
Pareto genetic programming is a branch of the genetic programming methodology(GP). GP for symbolic regression is an iterative search technique that looks forappropriate expressions of the response variable in a space of all valid formulaecontaining some of the given input variables and some predefined functionaloperators, like summation, multiplication, division, exponentiation, inversion,sine, etc.
At each iteration step the genetic programming system considers a sufficientlylarge quantity of various formulae, selects a subset of the ’best’ formulae accordingto certain criteria of goodness, and (re)combines these best formulae to createa rich set of new formulae for the next step. This approach is inspired byprinciples of natural selection, where offspring should inherit good features fromboth parents or undergo a beneficial mutation to be successful in survival,adaptation and further propagation. For more general information about geneticprogramming we refer to the monographs by Banzhaf et al. (1998); Koza (1992,1994); Langdon and Poli (2002).
The rationale of doing the ‘evolutionary’ search in a huge space of alternativesis to balance the exploitation of the good solutions that are found so far, withexploration of the new areas of the search space, where even better solutions maybe hiding.
Exploitation usually happens by recombining the features of models that arerelatively good, e.g. they both predict the observed response with a reasonablylow errors. The fundamental expectation here is that the recombination of good

19 1.4. Symbolic regression via GP: benefits and challenges
features encourages the overall improvement of newly created models, despite thefact that such improvement is not at all guaranteed.
Exploration of new areas of the solution space happens by introducing changesin the individual models. Such changes can be minor, e.g. if we decide tosubstitute the multiplication operator by a division in the formula expression,or replace an input variable by another variable; or major, e.g. when we decideto randomly re-initialize the model. Part II of this thesis describes the processesof model generation, selection and evaluation for symbolic regression via ParetoGP in greater detail. It is important to note, that recombination of sub-parts oftwo individuals can often be an explorative operator when, e.g., used to cross-over high-quality individuals with randomly generated individuals. In such casesrecombination is acting as a macro-mutation, aimed at speeding-up the pace ofexploration.
There is a small and yet crucial difference between Pareto GP and a classicalGP. Pareto GP is an archive-based search method, that actively exploits andmaintains the new entity during the evolution - the archive of the ‘best’ discoveredso far individuals. The second difference is that the concept of what is ‘best’ ismulti-objective in Pareto GP. This means that there are at least two or possiblymore criteria used for selecting ’good’ individuals for further propagation. Oftenthese criteria are prediction error and model expressional complexity. Since theseoptimization objectives are competing (there are always ways to achieve the sameprediction error at the expense of greater structural complexity), the performanceof individuals is compared with respect to the Pareto-dominance relation in theobjective space of model complexity and model error (see Chapter 2). In ParetoGP, model development happens in parallel with automatic identification andexploitation of driving inputs that influence the observed output (Smits et al.,2005).
Pareto GP with a presence of the archive and the two-objective optimizationof prediction error and model complexity has been shown to significantlyoutperform the classical GP approach, which uses a single objective minimizationof prediction error for model selection on a variety of test problems see(Kotanchek et al., 2006; Smits and Kotanchek, 2004). The major impact ofPareto GP is in the fact that (1) it allows interpretability of it solutions (since thedrive for minimization of structural complexity of models is explicitly introducedinto the search), and (2) it produces diverse solutions by design (because the

Chapter 1. Introduction 20
Pareto front models, consisting of optimal trade-offs in complexity versus errorspace are always present in the archive of solutions). Explicit complexity controlalso facilitates generation of simplified expressions, and hence contributes toimproved generalization capabilities of solutions (for the same accuracy, modelswith minimal complexity are preferred, and the other way around). In Chapter3 we talk more about the fact that simplicity does not always imply generality,however, it is important to note, that expressional complexity control implicitlymitigates the risk of numerical inaccuracies, since e.g. expression x1 + x2 will beselected over x1 + Exp[Ln[Exp[Ln[x2]]]].
The fact that symbolic regression via GP does not impose any assumptionson the structure of the input-output models means that the model structure isto a large extent determined by data6.
On one hand, this is an advantage and a unique capability of symbolicregression via GP over the other global approximation techniques (see, e.g.,Table 1.1 for parametric and non-parametric methods). Since the search spaceis not limited to expressions of a certain structure, there is a potential todevelop inherently simpler models, than, for example by linear regression onpolynomials or spatial correlation analysis, where the number of terms in themodel depends on the size of the data set. It is for instance very handy to havea sine function among the basic operators to model the response generated by,e.g., a sinc function, compared with a challenge of figuring out the structure andthe coefficients for its series expansion, which approximates sinc(x) accuratelyenough7.
On the other hand, the absence of constraints on model structure is thegreatest challenge for symbolic regression, since it vastly increases the searchspace of possibilities, which is already inherently large. Obviously, larger datasets with more input variables and more records, make symbolic regressioneven harder, since a larger space of possible models has to be explored, andlarger computational effort has to be applied to evaluate predictions of potentialsolutions on more records.
6A note for GP researchers: Recent studies by Keijzer and Foster (2007); Poli et al. (2007)show that the standard random uniform crossover can and does impose a bias on the structure oftree-based models, which means that other forms of crossover should be used for recombinationto justify the statement above.
7There is a general caution, however, for using trigonometric functions among the basicoperators- they should be used only if their presence in final models is plausible from the pointof view of a priori knowledge.

21 1.4. Symbolic regression via GP: benefits and challenges
1.4.4 Research questions of this Thesis
As stated in Table 1.1, time-to-solution, or, more accurately, time-to-convincing-solutions is a major practical challenge of Pareto GP (and GP in general). Andyet, an amazing observation that have been being made continuously over thisPhD project, is that despite the horrendous complexity of the search space, thesimple evolutionary principles do bring ParetoGP to solutions (for all practicalmodeling problems that the author happened to be involved into). These areinspiring news — if we give the system enough time and computational budget -the system will generate the solutions. What we want is to modify the system insuch a way that the computational time and effort are minimized and still leadto solutions of sufficient quality.
Besides the time-to-solution, which not only refers to the efficiency of themethod, but also to its effectiveness (looking for a shorter path to solutionsin the search space is not the same as optimizing efficiency), there are severaladditional challenges in Pareto GP. Below we formulate all challenges as researchquestions:
1. How to minimize the computational effort needed to discover regressionmodels of sufficient quality?
2. What are the alternatives for a more intelligent navigation through avast search space of potential solutions, which would combine abundantexploration of new alternative solutions with sufficient exploitation ofalready discovered, potentially beneficial, sub-structures?
3. The search process is stochastic and requires multiple replications forconfident interpretation of the obtained solutions. How to enhance modelselection strategies in such a way, that it leads to robust reproducibility ofresults?
4. Despite explicit complexity control, solutions of the Pareto GP processobtained through simultaneous minimization of model complexity andprediction accuracy may still exhibit pathological behavior even in minorextrapolations. If structural simplicity does not always imply generality,how to control over-fitting by additional measures or strategies?

Chapter 1. Introduction 22
5. When modeling large data sets (with thousands of records), the ParetoGP system (as well as other GP systems) spend the majority of thecomputational effort on error evaluations of predictions of alternativesolutions against the training set. How to enhance the model evaluationstrategy in such a way that the required number of fitness evaluationsis reduced to the bare minimum, while not deteriorating evolutionaryprogress?
6. Data sets coming from measurements can be very imbalanced. The qualityof given data is intuitively deeply interconnected with the potential todevelop convincing regression models, describing these data. What arethe possibilities of assessing the level of imbalancedness of these data, andthe ways to balance these data for the purpose of improving the results ofPareto GP?
There is one more challenge related to inclusion of domain knowledge intothe modeling process. Inclusion of a priori information on desired modelproperties (like certain asymptotic behaviour, monotonicity intervals, constraintsof differentials, etc.) is not yet handled in Pareto GP, but is not studied in thisthesis.
Another feature of GP and Pareto GP that is important to understand isthat unlike rational interpolation, kriging, or SVMs that guarantee a solutionwith a predefined error on the training set, the error of final solutions of ParetoGP cannot be estimated upfront. Since nothing is known about the problemand about the features of final solutions before the modeling, it is in principleunclear when to stop the modeling process. Definition of the stopping criteriaand prevention of evolutionary stagnation are other open research questions. Wetouch these questions for Pareto GP in Chapter 8, but already indicate here thatthe presence of the archive in Pareto GP has strong advantages in postponingevolutionary stagnation and progress monitoring when compared with standardGP.
1.4.5 Benefits of symbolic regression via Pareto GP
Below we summarize the benefits of symbolic regression via Pareto GP overother global parametric non-linear approximation techniques and over symbolicregression via standard GP for solving hard and messy data-driven problems:

23 1.5. Guide to the Thesis
1. No prior assumptions are imposed on model structure, which gives apotential for unpredictable and counter-intuitive expressions and variablecombinations to be discovered.
2. The final predicting model or model ensemble are chosen from a rich set ofglobal non-linear empirical models that are generated automatically.
3. Sensitivity analysis of the inputs and variable selection is implicitlyperformed with no extra cost, so the dimensionality of the problem canbe reduced.
4. No assumptions are made on the independence or significance of inputvariables.
5. Produced models are intrinsically more trustworthy than solutions ofstandard GP due to explicit complexity and non-linearity minimization(studied in this thesis) and automatic variable selection.
6. Symbolic representation of models may provide additional insight into theproblem, e.g. in a form of important variable transformations.
1.5 Guide to the Thesis
1.5.1 Structure of the Thesis
During this PhD project the author spent at least half of her research time at theR&D department of a large manufacturing company. Exposure to real problemsand challenges focused the research. As can be seen from the previous section,the emphasis of this thesis is put on research topics driven by the requirementsto good empirical models, on those goals that potentially lead to a rapid creationof ‘sellable’ input-output models and to a quick understanding of the problemdifficulty.
Findings of this study are presented in a practical framework of iterativemodel-based problem solving. We view this generic framework as an iterativefeed-back loop between three stages of problem solving (just as it usually happensin real-life applications):
1. Data Generation, Analysis and Adaptation,

Chapter 1. Introduction 24
2. Model Development, and
3. Problem Analysis and Reduction.
An interesting observation is made in the “Towards 2020 Science report”edited by Emmott et al. (2006):
”What is surprising is that science largely looks at data and modelsseparately, and as a result, we miss the principal challenge - thearticulation of modelling and experimentation. Put simply, modelsboth consume experimental data, in the form of the context orparameters with which they are supplied, and yield data in the formof the interpretations that are the product of analysis or execution.Models themselves embed assumptions about phenomena that aresubject of experimentation. The effectiveness of modeling as a futurescientific tool and the value of data as a scientific resource are tiedinto precisely how modelling and experimentation will be broughttogether.”
This is exactly the challenge of model-based problem solving, and researcherspursuing empirical modeling have always been aware of it8.
Also in this thesis we attempt to bring together data, models, and problemanalysis into one generic framework. Ultimately, we want to automate thisiterative feed-back loop over data analysis and generation, model development,and problem reduction as much as possible, not in order to eliminate the expert,but in order to free as much ‘thinking time’ for the expert as possible. Forsuccessful model-based problem solving we emphasize the critical need for anexpert, who will test the theory, facts (data) and their interpretations (models)against each other to iteratively develop a convincing story where all elementsfit and agree.
The outline of the proposed framework, which also forms the structure of thethesis is presented in Figure 1.3–1.6 with the main phases explained. The rest ofthis subsection provides a brief description of the thesis structure, and is followedby the main contributions presented in the next subsection.
8at the very least it concerns the methods described in Section 1.3 of this Chapter,irrespectively of the fact that some of the methods are abused in applications they were notdesigned for

25 1.5. Guide to the Thesis
Figure 1.3: Findings of the Thesis are structured according to the generic schemeof model-based problem solving.

Chapter 1. Introduction 26
Figure 1.4: Layout of the phase of Data Generation, Analysis, and Adaptationpresented in the thesis. Blocks corresponding to novel contributions areemphasized in bold.
Data Generation, Analysis, and Adaptation
Very often, especially in big companies, modelers do not have access to datacreation and experiment planning. This gap is an example of a situation, wheremulti-variate data is given and there is no possibility to gather more or bettersampled data. Modeling given data (also known as historical or legacy data) is themost common application of symbolic regression, and is related to observationsof the real system.
A second situation can be distinguished, when there is a possibility toplan experiments, and to gather new observations of the response for desiredcombinations of input variables, but the assumption is that these experimentsare very expensive, i.e. require long computation, simulation, or experimentationtime. Such a situation is most common in meta-modeling for design and analysisof simulation experiments.
As Figure 1.4 suggests both situations are considered in our generic framework,however the main emphasis of the study is put on the analysis and adaptationof given data (see Chapter 2). The most recent study on Pareto GP considersexploitation of model ensembles for adaptive data collection and trustworthysymbolic regression (Kotanchek et al., 2008). The potential impact of Pareto GPon meta-modeling and adaptive design of experiments is intriguing. We touch onit in Chapter 8 and speculate on its application domain in Conclusions.

27 1.5. Guide to the Thesis
Model Development
In model development we focus on automatic creation of collections of diversedata-driven models that infer hidden dependencies on given data and provideinsight into the problem, process, or system in question. Since we considersymbolic regression via genetic programming as an induction engine for input-output regression models, we present the stage of Model Development as aniterative loop over Model Generation, Model Evaluation, and ModelSelection. The sub-components of these three stages become specific to geneticprogramming. However, many principles presented there are generic and can beused within other techniques for data-driven modeling, especially for the phasesof Model Evaluation and Model Selection.
In Chapter 3 we summarize the basics of evolutionary search performed viagenetic programming and Pareto genetic programming, and explain the stages ofmodel generation, evaluation and selection for Pareto GP.
For effective model selection we enhance Pareto GP with an additionalcriterion of model simplicity and present the new strategy for model selectionin Chapter 4. Also in Chapter 4 we suggest a heuristic that pursues a softselection of models that are not only accurate, but are expressed by compactequations with smooth response surfaces.
For a more effective model evaluation on imbalanced data we study thepossibilities of introducing weights to the fitness function. Variations of such‘balanced’ regression are presented in Chapter 5.
For efficient model evaluation and faster learning we suggest to performsymbolic regression via Pareto GP under principles of goal softening and presenttwo strategies to do this in Chapters 6 and 7.
Problem Analysis and Reduction
The stage of Problem Analysis and Reduction supposes that developed modelsare carefully scrutinized and validated, and preliminary conclusions of problemdifficulty are inferred from the interpretations of the developed models. InChapter 8, we summarize the unique advantages of using symbolic regressionvia genetic programming as a modeling tool for problem analysis and reduction.Many of them, such as variable selection or meta-variable detection andconvergence identification, can in fact be performed on the fly during the model

Chapter 1. Introduction 28
Figure 1.5: Layout of the phase of Model Development presented in the thesis.Blocks corresponding to novel contributions are emphasized in bold.
29 1.5. Guide to the Thesis
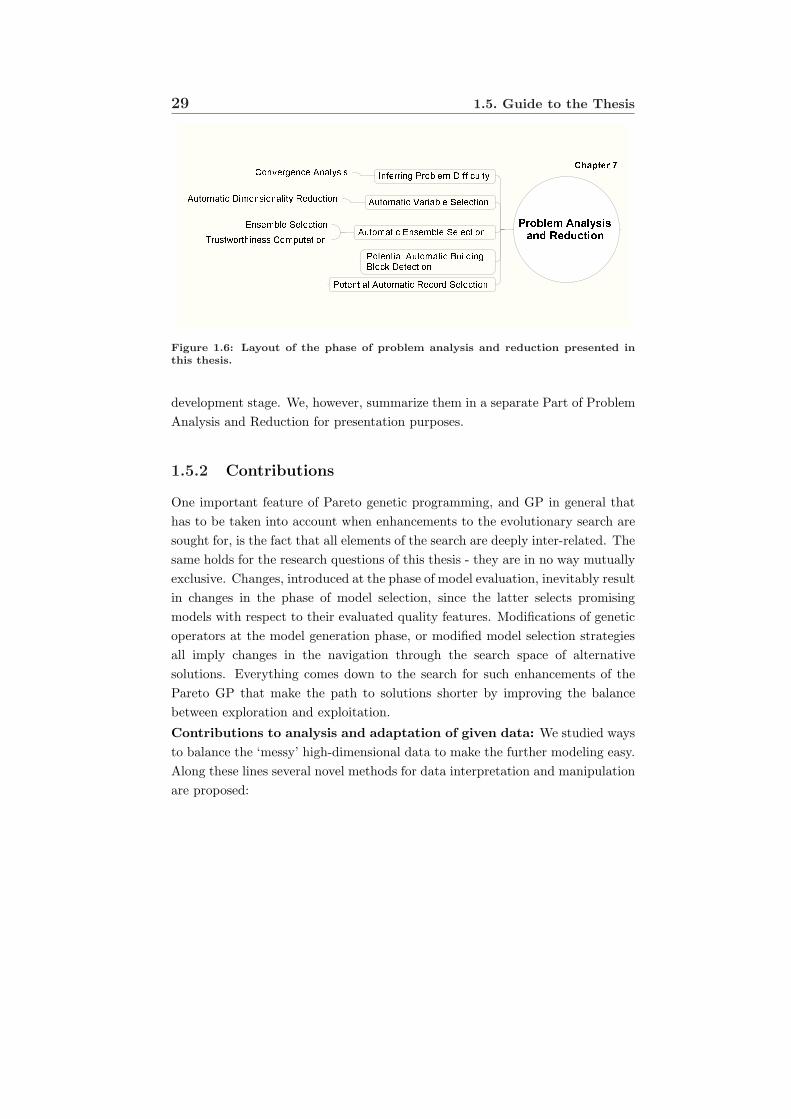
Figure 1.6: Layout of the phase of problem analysis and reduction presented inthis thesis.
development stage. We, however, summarize them in a separate Part of ProblemAnalysis and Reduction for presentation purposes.
1.5.2 Contributions
One important feature of Pareto genetic programming, and GP in general thathas to be taken into account when enhancements to the evolutionary search aresought for, is the fact that all elements of the search are deeply inter-related. Thesame holds for the research questions of this thesis - they are in no way mutuallyexclusive. Changes, introduced at the phase of model evaluation, inevitably resultin changes in the phase of model selection, since the latter selects promisingmodels with respect to their evaluated quality features. Modifications of geneticoperators at the model generation phase, or modified model selection strategiesall imply changes in the navigation through the search space of alternativesolutions. Everything comes down to the search for such enhancements of thePareto GP that make the path to solutions shorter by improving the balancebetween exploration and exploitation.Contributions to analysis and adaptation of given data: We studied waysto balance the ‘messy’ high-dimensional data to make the further modeling easy.Along these lines several novel methods for data interpretation and manipulationare proposed:

Chapter 1. Introduction 30
1. Four simple data weighting procedures are introduced for computingthe importance of a data point relative to its k nearest-in-the-input- spaceneighbors. The importance or the relative information content is definedbased on different notions of closeness to k nearest-in-the-input spaceneighbors. The proposed weights are developed to be incorporated intothe fitness function for symbolic regression, but are also useful for gettinga first glimpse of insight on the relative imbalancedness of data before themodeling.
2. For enhanced analysis of large and imbalanced data sets we introduce aSimple Multi-dimensional Iterative Technique for Sub-sampling.The smits technique allows a sensible compression of multi-dimensionaldata to balanced nested subsets of arbitrary size. The balancedness isunderstood in relation to one of the selected weighting schemes. Weuse the proposed iterative procedure to rank the records of thedata set in the order of decreasing importance and define thecumulative information content of the resulting ranked set. Thesuggested cumulative information content is used to quantify the amountof information in the compressed subsets relative to the original data set(see Chapter 2).
Contributions to reduced over-fitting: In this thesis we study the possibilitiesto generate regression models that not only give good predictions of theobserved data but also have smoother response surfaces and better generalizationcapabilities with respect to extrapolation outside the observed region. Two newheuristics are presented for this purpose:
1. A new complexity measure called the order of non-linearity isintroduced for regression models. It evaluates the behavioral complexityof the model structure, using a simplification of the notion of the degreeof the best fit polynomial approximating a continuous function withcertain precision. We propose two different strategies for using the orderof non-linearity to construct regression models with smoother responsesurfaces. One way is to preform symbolic regression with a two-dimensionaloptimization of model accuracy and model’s order of non-linearity. This

31 1.5. Guide to the Thesis
implies that the selection of potentially good models happens based on atrade-off between two competing criteria (see Chapter 4).
2. Explicit non-linearity control is a continuation of the work by Smitsand Kotanchek (2004), who introduced explicit Pareto-aware controlof expressional complexity to tree-based genetic programming. Theyobserved that minimizing structural complexity together with predictionaccuracy helps to prevent bloat and over-fitting, and focuses modelingeffort on solutions which are both accurate and compact. However,since expressional simplicity does not always imply behavioral simplicity,compact models still could produce pathologies for minor extrapolations.This motivated us to combine more criteria for model selection withoutmaking the objective space unnecessary large. We proposed a heuristic for atwo-objective minimization of model prediction error and model complexity,where the definition of complexity was alternated between the expressionalcomplexity and the order of non-linearity at each iteration step. Thestrategy of alternating complexity measures allows exploiting theefficiency of the bi-objective optimization when more that two competingobjectives are of interest. We show that results of experiments withalternating complexity measures are superior to those of simple bi-objectiveoptimizations of accuracy and expressional complexity and accuracy withthe order of non-linearity. We find that the new strategy applied tocomplexity measures produces solutions which are both compact and havesmoother response surfaces, and hence they contribute better to probleminterpretability and understanding (see Chapter 4).
The main contribution of this study on reduced over-fitting and non-linearitycontrol is not the explicit definition of the order of non-linearity, which despitebeing generic concerns tree-based structures, and not the explicit definition of themodel selection strategy for simultaneous optimization of prediction accuracy andorder of non-linearity. The main contribution of this study to symbolic regressionis the evidence, that structural parsimony may not imply behavioral generality,and that other kinds of parsimony must be considered for the purpose of avoidingover-fitting and producing models with good generalization capabilities.
Contributions to enhanced model evaluation strategies for obtaining

Chapter 1. Introduction 32
‘better solutions faster’: We studied the ways to improve the results ofsymbolic regression by changing the approach to evaluating the fitness ofpotential solutions in a course of a genetic programming run. Several promisingdirections were discovered:
1. A significant enhancement of the quality of the regression models isobserved when some of the weighting functionals, introduced in item (1), areincorporated into the fitness function, and weighted regression via geneticprogramming is applied to an imbalanced data set. We call this approachdata balancing, since it balances the contribution of each data record withthe weight associated with the record’s relative importance (see Chapter5).
2. There are situations when large imbalanced data sets are over-sampled.Sometimes this can be guessed a priori, for example when the processcontrol data comes from the measurements of the same process performedat different plant sites. We suggest to validate the guesses by constructingthe cumulative information content of the data set ranked in the orderof importance. This allows compressing the ‘compressable’ data sets tosmaller subsets of a similar information content. The results of symbolicregression can be significantly enhanced, if the standard regression orweighted regression is applied to the compressed subsets of data with largerpopulation sizes. We call this approach exploratory regression via databalancing (see Chapter 5).
3. The data sets for regression may contain too many variables from whichonly a handful are significantly related to the response. In the absence ofthe information about the significance of the input variables weighting datarecords in the original input-output space can be dangerously wrong, sincethe spurious variables will bias the distance-based concepts of the relativeimportance. Usually, before the weighting, some screening modeling runsare applied to the original data to identify driving input variables andfocus the modeling effort on only those. The need to create ‘bettersolutions faster’ pushes to look for heuristics to improve the quality androbustness of regression models for the high-dimensional data sets withspurious variables. We propose two ways to do that.

33 1.5. Guide to the Thesis
(a) The first approach simply represents a new view at the old trickof using random subsets of the training data for partial fitnessevaluations. The novelty (for GP) of the approach lies in a simpleobservation borrowed from ordinal optimization - if solutions areevaluated coarsely at a smaller computational cost, more of themcan be evaluated within a fixed budget of function evaluations. Weproposed to evaluate more individuals on small subsets of data drawnrandomly at each generation and linearly increase with the subset sizeover the GP run. We called this approach the Soft Ordinal Paretogenetic programming and showed that it causes a significantimprovement over the standard Pareto genetic programming both inthe quality of solutions (on test and the training data) and in thereproducibility of the GP runs (see Chapter 6).
(b) To further improve the Soft Ordinal Pareto approach to GP, wesuggested a new strategy of performing the evolutionary search. Inthe style of ordinal optimization we evaluate more potential solutionson smaller subsets of data, starting with ‘the most important’ records.This time we do not use stochastic sub-sampling of data, but theone defined by our simple multi-dimensional iterative technique forsub-sampling (see item (2) of the contributions additional to researchquestions), applied to the weights proposed in item (2) of thecontributions additional to research questions. We use the data setranked in the order of decreasing importance (w.r.t. a selected weight),start with a small set of the first m most important points andincrementally move the counter along the ranked records. By doingthis we force the GP system to apply most effort on modeling smallsubsets of records carrying the essential fraction of the informationcontent of the data set. We called this approach the ESSENCEalgorithm since it performs an Effective Search Space Explorationvia Nested Content-based Evolutions. The speed of adding new datarecords into nested training subsets is controlled by the shape of thecumulative information content of the ranked data. This explicitlyrelates the learning effort to the quality and compressibility of the dataset (determined independently from the modelling tool), which has not
Chapter 1. Introduction 34
been presented before to the best of our knowledge9 (see Chapter 7).
1.5.3 Overview of related papers
This dissertation includes the material presented in the following list of papersand book chapters (taken in different proportions):
Vladislavleva, E., Smits, G., and den Hertog, D. 2007. Order of non-linearityas a complexity measure for models generated by symbolic regression viaPareto genetic programming. Conditionally accepted for publication byIEEE Transactions on Evolutionary Computation.
Vladislavleva, E., Smits, G., and den Hertog, D. 2007. On the importance ofdata balancing for symbolic regression. In review.
Vladislavleva, E., Smits, G., and den Hertog, D. 2007. Symbolic regressionreduced to its ESSENCE: On Ordinal Approach to Incremental DataModeling. In review.
Vladislavleva, E., Smits, G., and Kotanchek, M. 2007. Better solutions faster :Soft evolution of robust regression models in Pareto genetic programming.In Genetic Programming Theory and Practice V, R. L. Riolo, T. Soule, andB. Worzel, Eds. Genetic and Evolutionary Computation. Springer, AnnArbor, Chapter 2, 13–32.
Smits, G. and Vladislavleva, E. 2006. Ordinal Pareto genetic programming.In Proceedings of the 2006 IEEE Congress on Evolutionary Computation,G. G. Yen, L. Wang, P. Bonissone, and S. M. Lucas, Eds. IEEE Press,Vancouver, Canada, 3114 – 3120.
Kotanchek, M., Smits, G., and Vladislavleva, E. 2006. Pursuing the Paretoparadigm tournaments, algorithm variations & ordinal optimization. InGenetic Programming Theory and Practice IV, R. L. Riolo, T. Soule, andB. Worzel, Eds. Genetic and Evolutionary Computation, vol. 5. Springer,Ann Arbor, Chapter 12, 167–186.
9For corrections and constructive suggestions please contact the author [email protected] or [email protected]

35 1.5. Guide to the Thesis
Smits, G., Kordon, A., Vladislavleva, K., Jordaan, E., and Kotanchek, M. 2005.Variable selection in industrial datasets using pareto genetic programming.In Genetic Programming Theory and Practice III, T. Yu, R. L. Riolo, andB. Worzel, Eds. Kluwer, Ann Arbor, MI, USA, Chapter 6, 79–92.
Kotanchek, M., Smits, G., and Vladislavleva, E. 2007. Trustable symbolicregression models: Using ensembles, interval arithmetic and Pareto frontsto develop robust and trust-aware models. In Genetic Programming Theoryand Practice V, R. L. Riolo, T. Soule, and B. Worzel, Eds. Geneticand Evolutionary Computation, vol. 6. Springer, Ann Arbor, MI, USA,Chapter 12, 203–222.
Kotanchek, M., Smits, G., and Vladislavleva, E. 2008. Exploiting trustablemodels via Pareto GP for targeted data collection. Accepted for GeneticProgramming Theory and Practice VI, R. L. Riolo, T. Soule, and B. Worzel,Eds. Chapter 5. In Press.

Bibliography
Aggarwal, C. C., Hinneburg, A., and Keim, D. A. 2001. On the surprisingbehavior of distance metrics in high dimensional spaces. In ICDT ’01:Proceedings of the 8th International Conference on Database Theory. Springer-Verlag, London, UK, 420–434.
Aggarwal, C. C. and Yu, P. S. 2001. Outlier detection for high dimensionaldata. In SIGMOD ’01: Proceedings of the 2001 ACM SIGMOD internationalconference on Management of data. ACM, New York, NY, USA, 37–46.
Ahluwalia, M. and Bull, L. 2001. Coevolving functions in geneticprogramming. Journal of Systems Architecture 47, 7, 573–585.
Angun, E., Kleijnen, J. P. C., Hertog, D. D., and Gurkan, G. 2002.Recent advances in simulation optimization: response surface methodologyrevisited. In WSC ’02: Proceedings of the 34th conference on Wintersimulation. Winter Simulation Conference, 377–383.
Ashour, A. F., Alvarez, L. F., and Toropov, V. V. 2003. Empiricalmodelling of shear strength of RC deep beams by genetic programming.Computers and Structures 81, 5 (Mar.), 331–338.
Banzhaf, W., Beslon, G., Christensen, S., Foster, J. A., Kepes, F.,Lefort, V., Miller, J. F., Radman, M., and Ramsden, J. J. 2006. Fromartificial evolution to computational evolution: A research agenda. NatureReviews Genetics 7, 729–735.
Banzhaf, W. and Langdon, W. B. 2002. Some considerations on the reasonfor bloat. Genetic Programming and Evolvable Machines 3, 1 (Mar.), 81–91.
Banzhaf, W., Nordin, P., Keller, R. E., and Francone, F. D. 1998.Genetic Programming – An Introduction; On the Automatic Evolution ofComputer Programs and its Applications. Morgan Kaufmann, San Francisco,CA, USA.
Becker, Y., Fei, P., and Lester, A. M. 2006. Stock selection : An innovativeapplication of genetic programming methodology. In Genetic ProgrammingTheory and Practice IV, R. L. Riolo, T. Soule, and B. Worzel, Eds. Genetic

BIBLIOGRAPHY 246
and Evolutionary Computation, vol. 5. Springer, Ann Arbor, Chapter 12, 315–334.
Becker, Y. L., Fox, H., and Fei, P. 2007. An empirical study of multi-objective algorithms for stock ranking. In Genetic Programming Theoryand Practice V, R. L. Riolo, T. Soule, and B. Worzel, Eds. Genetic andEvolutionary Computation. Springer, Ann Arbor, Chapter 14, 241–262.
Bernard, H. and Gerlach, S. 1998. Does the term structure predictrecessions? the international evidence. International Journal of Finance &Economics 3, 3 (July), 195–215.
Blickle, T. 1996. Evolving compact solutions in genetic programming: Acase study. In Parallel Problem Solving From Nature IV. Proceedings ofthe International Conference on Evolutionary Computation, H.-M. Voigt,W. Ebeling, I. Rechenberg, and H.-P. Schwefel, Eds. LNCS, vol. 1141. Springer-Verlag, Berlin, Germany, 564–573.
Blickle, T. and Thiele, L. 1994. Genetic programming and redundancy.In Genetic Algorithms within the Framework of Evolutionary Computation(Workshop at KI-94, Saarbrucken), J. Hopf, Ed. Max-Planck-Institut furInformatik (MPI-I-94-241), Im Stadtwald, Building 44, D-66123 Saarbrucken,Germany, 33–38.
Bongard, J. C. and Lipson, H. 2005. Nonlinear system identification usingcoevolution of models and tests. IEEE Trans. Evolutionary Computation 9, 4,361–384.
Box, G. E. P. and Draper, N. R. 1986. Empirical Model-building andResponse Surfaces. John Wiley & Sons, Inc., New York, NY, USA.
Brameier, M., Hoffmann, F., Nordin, P., Banzhaf, W., and Francone,
F. 1999. Parallel machine code genetic programming. In Proceedings of theGenetic and Evolutionary Computation Conference, W. Banzhaf, J. Daida,A. E. Eiben, M. H. Garzon, V. Honavar, M. Jakiela, and R. E. Smith, Eds.Vol. 2. Morgan Kaufmann, Orlando, Florida, USA, 1228.
Bucci, A., Pollack, J. B., and de Jong, E. D. 2004. Automated extractionof problem structure. In GECCO (1), K. Deb, R. Poli, W. Banzhaf, H.-G.

247 BIBLIOGRAPHY
Beyer, E. K. Burke, P. J. Darwen, D. Dasgupta, D. Floreano, J. A. Foster,M. Harman, O. Holland, P. L. Lanzi, L. Spector, A. Tettamanzi, D. Thierens,and A. M. Tyrrell, Eds. Lecture Notes in Computer Science, vol. 3102. Springer,501–512.
Caplan, M. and Becker, Y. 2004. Lessons learned using genetic programmingin a stock picking context. In Genetic Programming Theory and Practice II,U.-M. O’Reilly, T. Yu, R. L. Riolo, and B. Worzel, Eds. Springer, Ann Arbor,Chapter 6, 87–102.
Castillo, F., Kordon, A., Smits, G., Christenson, B., and Dickerson,
D. 2006. Pareto front genetic programming parameter selection based ondesign of experiments and industrial data. In GECCO 2006: Proceedings of the8th annual conference on Genetic and evolutionary computation, M. Keijzer,M. Cattolico, D. Arnold, V. Babovic, C. Blum, P. Bosman, M. V. Butz,C. Coello Coello, D. Dasgupta, S. G. Ficici, J. Foster, A. Hernandez-Aguirre,G. Hornby, H. Lipson, P. McMinn, J. Moore, G. Raidl, F. Rothlauf, C. Ryan,and D. Thierens, Eds. Vol. 2. ACM Press, Seattle, Washington, USA, 1613–1620.
Cavaretta, M. J. and Chellapilla, K. 1999. Data mining using geneticprogramming: The implications of parsimony on generalization error. InProceedings of the Congress on Evolutionary Computation, P. J. Angeline,Z. Michalewicz, M. Schoenauer, X. Yao, and A. Zalzala, Eds. Vol. 2. IEEEPress, Mayflower Hotel, Washington D.C., USA, 1330–1337.
Cherkassky, V. 2002. Model complexity control and statistical learning theory.Natural Computing: an International Journal 1, 1, 109–133.
Cherkassky, V. and Mulier, F. 1998. Learning from Data: Concepts, Theory,and Methods. John Wiley & Sons, Inc., New York, NY, USA.
Choi, K., Youn, B., and Yang, R.-J. 2001. Moving least squares method forreliability-based design optimization. See Langdon et al. (2002).
Curry, R. and Heywood, M. I. 2004. Towards efficient training on largedatasets for genetic programming. In 17th Conference of the Canadian Societyfor Computational Studies of Intelligence, A. Y. Tawfik and S. D. Goodwin,Eds. LNAI, vol. 3060. Springer-Verlag, London, Ontario, Canada, 161–174.

BIBLIOGRAPHY 248
Curry, R., Lichodzijewski, P., and Heywood, M. I. 2007. Scalinggenetic programming to large datasets using hierarchical dynamic subsetselection. IEEE Transactions on Systems, Man, and Cybernetics: Part B -Cybernetics 37, 4 (Aug.), 1065–1073.
Cuyt, A., Ed. 1993. Rational Approximation theory: A state of the art. Kluwer,Dordrecht.
Cuyt, A. 2003. Recent applications of rational approximation theory: a guidedtour. In Proc. Intern. Conf. NACOM, G. Psihoyios, Ed. Wiley, Weinheim,50–52.
Cuyt, A. and Verdonk, B. 1985. Multivariate rational interpolation.Computing 34, 41–61.
Deb, K., Agrawal, S., Pratap, A., and Meyarivan, T. 2002. A fast andelitist multiobjective genetic algorithm: Nsga-ii. IEEE Trans. EvolutionaryComputation 6, 2, 182–197.
Doherty, K., Adams, R., and Davey, N. 2004. Non-euclidean norms and datanormalisation. In ESANN. d-side publications, Bruges, Belgium, 181–186.
Domingos, P. 1999. The role of occam’s razor in knowledge discovery. DataMining and Knowledge Discovery 3, 4, 409–425.
Drucker, H. 1997. Improving regressors using boosting techniques. In ICML,D. H. Fisher, Ed. Morgan Kaufmann, Nashville, TN, USA, 107–115.
Dueker, M. 1997. Strengthening the case for the yield curve as a predictor ofU.S. recessions. Review of Federal Reserve Bank of St. Louis, 41–51.
Eggermont, J. and van Hemert, J. I. 2000. Stepwise adaptation ofweights for symbolic regression with genetic programming. In Proceedingsof the Twelveth Belgium/Netherlands Conference on Artificial Intelligence(BNAIC’00), A. van den Bosch and H. Weigand, Eds. KUB, De Efteling,Kaatsheuvel, Holland, 259–266.
Eggermont, J. and van Hemert, J. I. 2001. Adaptive genetic programmingapplied to new and existing simple regression problems. In GeneticProgramming, Proceedings of EuroGP’2001, J. F. Miller, M. Tomassini, P. L.

249 BIBLIOGRAPHY
Lanzi, C. Ryan, A. G. B. Tettamanzi, and W. B. Langdon, Eds. LNCS, vol.2038. Springer-Verlag, Lake Como, Italy, 23–35.
Emmott, S., Shapiro, E., Rison, S., Phillips, A., and Herbert, A., Eds.2006. Towards 2020 Science. Microsoft Research.
Estrella, A. and Mishkin, F. S. 1996. The yield curve as a predictor of U.S.recessions. Current Issues in Economics and Finance 6 (June).
Ferreira, C. 2001. Gene expression programming: A new adaptive algorithmfor solving problems. Complex Systems 13, 2, 87–129.
Ficici, S. G. and Pollack, J. B. 2001. Pareto optimality in coevolutionarylearning. In ECAL ’01: Proceedings of the 6th European Conference onAdvances in Artificial Life. Springer-Verlag, London, UK, 316–325.
Folino, G., Pizzuti, C., and Spezzano, G. 2006. GP ensembles for large-scaledata classification. IEEE Transactions on Evolutionary Computation 10, 5,604–616.
Fonseca, C. M. and Fleming, P. 1995. An overview of evolutionaryalgorithms in multiobjective optimization. Evolutionary Computation 3, 1,1–16.
Francois, D., Wertz, V., and Verleysen, M. 2007. The concentrationof fractional distances. IEEE Transactions on Knowledge and DataEngineering 19, 7, 873–886.
Francone, F. D., Deschaine, L. M., Battenhouse, T., and Warren, J. J.
2004. Discrimination of unexploded ordnance from clutter using linear geneticprogramming. In Late Breaking Papers at the 2004 Genetic and EvolutionaryComputation Conference, M. Keijzer, Ed. Seattle, Washington, USA.
Freund, Y. 1995. Boosting a weak learning algorithm by majority. Informationand Computation 121, 2, 256–285.
Freund, Y. and Schapire, R. E. 1995. A decision-theoretic generalizationof on-line learning and an application to boosting. In EuroCOLT, P. M. B.Vitanyi, Ed. Lecture Notes in Computer Science, vol. 904. Springer, Barcelona,Spain, 23–37.

BIBLIOGRAPHY 250
Freund, Y., Seung, H. S., Shamir, E., and Tishby, N. 1993. Information,prediction, and query by committee. In Advances in Neural InformationProcessing Systems 5, [NIPS Conference]. Morgan Kaufmann Publishers Inc.,San Francisco, CA, USA, 483–490.
Friedman, J. H. 1991. Multivariate adaptive regression splines. The Annals ofStatistics 19, 1, 1–67.
Gagne, C., Schoenauer, M., Parizeau, M., and Tomassini, M.
2006. Genetic programming, validation sets, and parsimony pressure.In Proceedings of the 9th European Conference on Genetic Programming,P. Collet, M. Tomassini, M. Ebner, S. Gustafson, and A. Ekart, Eds. LectureNotes in Computer Science, vol. 3905. Springer, Budapest, Hungary, 109–120.
Garshina, N. and Vladislavleva, C. 2004. On development of a complexitymeasure for symbolic regression via genetic programming. In Modeling reportfor Dow Benelux B.V. Technische Universiteit Eindhoven, Eindhoven, theNetherlands.
Gathercole, C. and Ross, P. 1994. Dynamic training subset selection forsupervised learning in genetic programming. In Parallel Problem Solving fromNature III, Y. Davidor, H.-P. Schwefel, and R. Manner, Eds. LNCS, vol. 866.Springer-Verlag, Jerusalem, 312–321.
Gilbert, R. J., Goodacre, R., Shann, B., Kell, D. B., Taylor, J.,and Rowland, J. J. 1998. Genetic programming-based variable selectionfor high-dimensional data. In Genetic Programming 1998: Proceedings of theThird Annual Conference, J. R. Koza, W. Banzhaf, K. Chellapilla, K. Deb,M. Dorigo, D. B. Fogel, M. H. Garzon, D. E. Goldberg, H. Iba, and R. Riolo,Eds. Morgan Kaufmann, University of Wisconsin, Madison, Wisconsin, USA,109–115.
Graves-Morris, P. 1981. Efficient reliable rational interpolation. Lecture Notesin Mathematics 888, 28–63.
Gustafson, S., Ekart, A., Burke, E., and Kendall, G. 2004. Problemdifficulty and code growth in genetic programming. Genetic Programming andEvolvable Machines 5, 3 (Sept.), 271–290.

251 BIBLIOGRAPHY
Hansen, L. K. and Salamon, P. 1990. Neural network ensembles. IEEETransactions on Pattern Analysis and Machine Intelligence 12, 10, 993–1001.
Harding, S. and Banzhaf, W. 2007. Fast genetic programming on gpus.In EuroGP, M. Ebner, M. O’Neill, A. Ekart, L. Vanneschi, and A. Esparcia-Alcazar, Eds. Lecture Notes in Computer Science, vol. 4445. Springer, Valencia,Spain, 90–101.
Harmeling, S., Dornhege, G., Tax, D., Meinecke, F., and Muller, K.-
R. 2006. From outliers to prototypes: Ordering data. Neurocomputing 69, 13-15 (August), 1608–1618.
Haykin, S. 1994. Neural Networks: A Comprehensive Foundation. MacmillanCollege Publishing Company, Inc., New York, NY, USA.
Ho, Y.-C. 2000. Soft optimization for hard problems, computerized lecture viaprivate communication/distribution.
Ho, Y.-C., Cassandras, C., Chen, C.-H., and Dai, L. 2000. Ordinaloptimization and simulation. Journal of the Operational Research Society 51,490–500.
Holland, J. H. 1975. Adaptation in Natural and Artificial Systems. MIT Press,Cambridge, MA, USA.
Horn, J. and Nafpliotis, N. 1993. Multiobjective Optimization using theNiched Pareto Genetic Algorithm. Tech. Rep. IlliGAl Report 93005, Urbana,Illinois, USA.
Hornby, G. S. 2006. ALPS: the age-layered population structure for reducingthe problem of premature convergence. In GECCO 2006: Proceedings of the8th annual conference on Genetic and evolutionary computation, M. Keijzer,M. Cattolico, D. Arnold, V. Babovic, C. Blum, P. Bosman, M. V. Butz,C. Coello Coello, D. Dasgupta, S. G. Ficici, J. Foster, A. Hernandez-Aguirre,G. Hornby, H. Lipson, P. McMinn, J. Moore, G. Raidl, F. Rothlauf, C. Ryan,and D. Thierens, Eds. Vol. 1. ACM Press, Seattle, Washington, USA, 815–822.
Hu, J., Goodman, E., Seo, K., Fan, Z., and Rosenberg, R. 2005. Thehierarchical fair competition (hfc) framework for sustainable evolutionaryalgorithms. Evol. Comput. 13, 2, 241–277.

BIBLIOGRAPHY 252
Iba, H. 1999. Bagging, boosting, and bloating in genetic programming.In Proceedings of the Genetic and Evolutionary Computation Conference,W. Banzhaf, J. Daida, A. E. Eiben, M. H. Garzon, V. Honavar, M. Jakiela,and R. E. Smith, Eds. Vol. 2. Morgan Kaufmann, Orlando, Florida, USA,1053–1060.
Iba, H., de Garis, H., and Sato, T. 1994. Genetic programming using aminimum description length principle. In Advances in Genetic Programming,K. E. Kinnear, Jr., Ed. MIT Press, Cambridge, MA, USA, Chapter 12, 265–284.
InsightFaraday, P., Ed. 2004. A Roadmap for High Throughput Technologies.InsightFaraday Partnership, Runcorn, Cheshire, UK.
Jin, H., Ooi, B. C., Shen, H. T., Yu, C., and Zhou, A. 2003. An adaptiveand efficient dimensionality reduction algorithm for high-dimensional indexing.In ICDE, U. Dayal, K. Ramamritham, and T. M. Vijayaraman, Eds. IEEEComputer Society, Bangalore, India, 87–95.
Jin, R., Chen, W., and Simpson, T. 2000. Comparative studies ofmetamodeling techniques under multiple modeling criteria. Tech. Rep. 2000-4801, AIAA.
Johnson, R. A. and Wichern, D. W., Eds. 1988. Applied multivariatestatistical analysis. Prentice-Hall, Inc., Upper Saddle River, NJ, USA.
Jordaan, E., Kordon, A., Chiang, L., and Smits, G. 2004. Robustinferential sensors based on ensemble of predictors generated by geneticprogramming. In Parallel Problem Solving from Nature - PPSN VIII, X. Yao,E. Burke, J. A. Lozano, J. Smith, J. J. Merelo-Guervos, J. A. Bullinaria,J. Rowe, P. T. A. Kaban, and H.-P. Schwefel, Eds. LNCS, vol. 3242. Springer-Verlag, Birmingham, UK, 522–531.
Jordaan, E. M. 2002. Development of Robust Inferential Sensors: Industrialapplication of support vector machines for regression. Ph.D. thesis, EindhovenUniversity of Technology, Eindhoven, the Netherlands.
Keijzer, M. 2002. Scientific Discovery using Genetic Programming. Ph.D.thesis, Danish Technical University, Lyngby, Denmark.

253 BIBLIOGRAPHY
Keijzer, M. 2003. Improving symbolic regression with interval arithmetic andlinear scaling. In Genetic Programming, Proceedings of EuroGP’2003, C. Ryan,T. Soule, M. Keijzer, E. Tsang, R. Poli, and E. Costa, Eds. LNCS, vol. 2610.Springer-Verlag, Essex, UK, 70–82.
Keijzer, M. and Foster, J. 2007. Crossover bias in genetic programming.In Proceedings of the 10th European Conference on Genetic Programming,M. Ebner, M. O’Neill, A. Ekart, L. Vanneschi, and A. I. Esparcia-Alcazar,Eds. Lecture Notes in Computer Science, vol. 4445. Springer, Valencia, Spain.
Khuri, A. I. and Cornell, J. A. 1987. Response Surfaces: Designs andAnalyses. Marcel Dekker, Inc., New York, NY, USA.
Kleijnen, J. and Sargent, R. 2000. A methodology for fitting and validatingmetamodels in simulation. European Journal of Operational Research 120, 1,14–29.
Kleijnen, J. P. 2008a. Kriging metamodeling in simulation: A review. EuropeanJournal of Operational Research.
Kleijnen, J. P. C. 2005. Forty years of statistical design and analysis ofsimulation experiments (dase). In WSC ’05: Proceedings of the 37th conferenceon Winter simulation. Winter Simulation Conference, 1–17.
Kleijnen, J. P. C. 2008b. DASE: Design and Analysis of SimulationExperiments. Springer, New York, NY, USA.
Kleijnen, J. P. C., Sanchez, S. M., Lucas, T. W., and Cioppa, T. M. 2005.State-of-the-art review: A user’s guide to the brave new world of designingsimulation experiments. INFORMS Journal on Computing 17, 3, 263–289.
Kohavi, R. and John, G. H. 1997. Wrappers for feature subset selection.Artificial Intelligence: Special Issue on Relevance 97, 1-2, 273–324.
Kordon, A., Jordaan, E., Chew, L., Smits, G., Bruck, T., Haney, K.,and Jenings, A. 2004. Biomass inferential sensor based on ensemble of modelsgenerated by genetic programming. In Genetic and Evolutionary Computation– GECCO-2004, Part II, K. Deb, R. Poli, W. Banzhaf, H.-G. Beyer, E. Burke,P. Darwen, D. Dasgupta, D. Floreano, J. Foster, M. Harman, O. Holland, P. L.
BIBLIOGRAPHY 254
Lanzi, L. Spector, A. Tettamanzi, D. Thierens, and A. Tyrrell, Eds. LectureNotes in Computer Science, vol. 3103. Springer-Verlag, Seattle, WA, USA,1078–1089.
Kordon, A., Kalos, A., and Adams, B. 2003. Empirical emulators for processmonitoring and optimization. In MED2003: Proceedings of the IEEE 11thConference on Control and Automation. IEEE, Rhodes, Greece, 111.
Kordon, A. and Lue, C.-T. 2004. Symbolic regression modeling of blown filmprocess effects. In Proceedings of the 2004 IEEE Congress on EvolutionaryComputation. IEEE Press, Portland, Oregon, 561–568.
Kordon, A. K., Smits, G., Jordaan, E., Kalos, A., and Chiang, L.
2006. Empirical models with self-assessment capabilities for on-line industrialapplications. In Proceedings of the 2006 IEEE Congress on EvolutionaryComputation, G. G. Yen, L. Wang, P. Bonissone, and S. M. Lucas, Eds. IEEEPress, Vancouver, 10463–10470.
Kordon, A. K. and Smits, G. F. 2001. Soft sensor development using geneticprogramming. In Proceedings of the Genetic and Evolutionary ComputationConference (GECCO-2001), L. Spector, E. D. Goodman, A. Wu, W. B.Langdon, H.-M. Voigt, M. Gen, S. Sen, M. Dorigo, S. Pezeshk, M. H. Garzon,and E. Burke, Eds. Morgan Kaufmann, San Francisco, California, USA, 1346–1351.
Korns, M. F. 2006. Large-scale, time-constrained symbolic regression. InGenetic Programming Theory and Practice IV, R. L. Riolo, T. Soule, andB. Worzel, Eds. Genetic and Evolutionary Computation, vol. 5. Springer, AnnArbor, Chapter 16, 299–314.
Kotanchek, M., Smits, G., and Kordon, A. 2003. Industrial strength geneticprogramming. In Genetic Programming Theory and Practice, R. L. Riolo andB. Worzel, Eds. Kluwer, Chapter 15, 239–256.
Kotanchek, M., Smits, G., and Vladislavleva, E. 2006. Pursuing thePareto paradigm tournaments, algorithm variations & ordinal optimization.In Genetic Programming Theory and Practice IV, R. L. Riolo, T. Soule, andB. Worzel, Eds. Genetic and Evolutionary Computation, vol. 5. Springer, AnnArbor, Chapter 12, 167–186.

255 BIBLIOGRAPHY
Kotanchek, M., Smits, G., and Vladislavleva, E. 2007. Trustable symbolicregression models: Using ensembles, interval arithmetic and pareto fronts todevelop robust and trust-aware models. In Genetic Programming Theoryand Practice V, R. L. Riolo, T. Soule, and B. Worzel, Eds. Genetic andEvolutionary Computation, vol. 6. Springer, Ann Arbor, MI, USA, Chapter 12,203–222.
Kotanchek, M., Smits, G., and Vladislavleva, E. 2008. Adaptive designof experiments: Using symbolic regression via genetic programming to guidedata collection and model development. In Genetic Programming Theoryand Practice VI, R. L. Riolo, T. Soule, and B. Worzel, Eds. Genetic andEvolutionary Computation. Springer, Ann Arbor.
Koza, J. R. 1992. Genetic Programming: On the Programming of Computersby Means of Natural Selection. MIT Press, Cambridge, MA, USA.
Koza, J. R. 1994. Genetic Programming II: Automatic Discovery of ReusablePrograms. MIT Press, Cambridge Massachusetts.
Krogh, A. and Vedelsby, J. 1995. Neural network ensembles, cross validation,and active learning. In Advances in Neural Information Processing Systems,G. Tesauro, D. Touretzky, and T. Leen, Eds. Vol. 7. The MIT Press,Cambridge, MA, USA, 231–238.
Kudryavtsev, V. 1995. On the automata funcional systems. DiscreteMathematics and Applications 5, 5 (August), 397–424.
Landry, J., Kosta, L. D., and Bernier, T. 2006. Discriminant featureselection by genetic programming: Towards a domain independent multi-class object detection system. Journal of Systemics, Cybernetics andInformatics. 3, 1.
Langdon, W. B., Cantu-Paz, E., Mathias, K. E., Roy, R., Davis, D.,Poli, R., Balakrishnan, K., Honavar, V., Rudolph, G., Wegener, J.,Bull, L., Potter, M. A., Schultz, A. C., Miller, J. F., Burke, E. K.,and Jonoska, N., Eds. 2002. GECCO 2002: Proceedings of the Geneticand Evolutionary Computation Conference, New York, USA, 9-13 July 2002.Morgan Kaufmann.

BIBLIOGRAPHY 256
Langdon, W. B. and Poli, R. 1998. Fitness causes bloat: Mutation.In Proceedings of the First European Workshop on Genetic Programming,W. Banzhaf, R. Poli, M. Schoenauer, and T. C. Fogarty, Eds. LNCS, vol.1391. Springer-Verlag, Paris, France, 37–48.
Langdon, W. B. and Poli, R. 2002. Foundations of Genetic Programming.Springer-Verlag, Heidelberg, Germany.
Langdon, W. B., Soule, T., Poli, R., and Foster, J. A. 1999. Theevolution of size and shape. In Advances in Genetic Programming 3, L. Spector,W. B. Langdon, U.-M. O’Reilly, and P. J. Angeline, Eds. MIT Press,Cambridge, MA, USA, Chapter 8, 163–190.
Lasarczyk, C., Dittrich, P., and Banzhaf, W. 2004. Dynamic subsetselection based on a fitness case topology. Evolutionary Computation 12, 2,223–242.
Lau, T. E. and Ho, Y.-C. 1997. Universal alignment probabilities and subsetselection for ordinal optimization. J. Optim. Theory Appl. 93, 3, 455–489.
Laumanns, M., Thiele, L., Zitzler, E., and Deb, K. 2002. Archivingwith guaranteed convergence and diversity in multi-objective optimization. SeeLangdon et al. (2002), 439–447.
Lemczyk, M. and Heywood, M. I. 2007. Training binary GP classifiersefficiently: A Pareto-coevolutionary approach. In Proceedings of the 10thEuropean Conference on Genetic Programming, M. Ebner, M. O’Neill,A. Ekart, L. Vanneschi, and A. I. Esparcia-Alcazar, Eds. Lecture Notes inComputer Science, vol. 4445. Springer, Valencia, Spain, 229–240.
Levin, D. 1998. The approximation power of moving least-squares. MathematicalComputation 67, 224, 1517–1531.
Liu, Y. and Yao, X. 2002. Learning and evolution by minimization of mutualinformation. In PPSN VII: Proceedings of the 7th International Conference onParallel Problem Solving from Nature. Springer-Verlag, London, UK, 495–504.
Liu, Y., Yao, X., and Higuchi, T. 2000. Evolutionary ensembles with negativecorrelation learning. IEEE Transactions on Evolutionary Computation 4, 4(November), 380.
257 BIBLIOGRAPHY
McPhee, N. F. and Miller, J. D. 1995. Accurate replication in geneticprogramming. In Genetic Algorithms: Proceedings of the Sixth InternationalConference (ICGA95), L. Eshelman, Ed. Morgan Kaufmann, Pittsburgh, PA,USA, 303–309.
Neely, C. J. and Weller, P. A. 2003. Intraday technical trading in theforeign exchange market. Journal of International Money and Finance 22, 2(Apr.), 223–237.
Neely, C. J., Weller, P. A., and Dittmar, R. 1997. Is technical analysisin the foreign exchange market profitable? A genetic programming approach.The Journal of Financial and Quantitative Analysis 32, 4 (Dec.), 405–426.
Neshatian, K., Zhang, M., and Johnston, M. 2007. Feature constructionand dimension reduction using genetic programming. In Australian Conferenceon Artificial Intelligence, M. A. Orgun and J. Thornton, Eds. Lecture Notesin Computer Science, vol. 4830. Springer, 160–170.
Nordin, P. 1994. A compiling genetic programming system that directlymanipulates the machine code. In Advances in Genetic Programming, K. E.Kinnear, Jr., Ed. MIT Press, Boston, USA, Chapter 14, 311–331.
Nordin, P. and Banzhaf, W. 1995. Complexity compression and evolution.In Genetic Algorithms: Proceedings of the Sixth International Conference(ICGA95), L. Eshelman, Ed. Morgan Kaufmann, Pittsburgh, PA, USA, 310–317.
Okabe, A., Boots, B., Sugihara, K., and Chiu, S. N. 2000. SpatialTessellations: Concepts and applications of Voronoi diagrams, 2nd ed.Probability and Statistics. Wiley, New York, NY, USA. 671 pages.
O’Neill, M. and Ryan, C. 2003. Grammatical Evolution: EvolutionaryAutomatic Programming in a Arbitrary Language. Genetic programming,vol. 4. Kluwer Academic Publishers.
Paris, G., Robilliard, D., and Fonlupt, C. 2001. Applying boostingtechniques to genetic programming. In Artificial Evolution 5th InternationalConference, Evolution Artificielle, EA 2001, P. Collet, C. Fonlupt, J.-K. Hao,
BIBLIOGRAPHY 258
E. Lutton, and M. Schoenauer, Eds. LNCS, vol. 2310. Springer Verlag, Creusot,France, 267–278.
Poli, R. 1996. Genetic programming for feature detection and imagesegmentation. In Evolutionary Computing, T. C. Fogarty, Ed. Number 1143.Springer-Verlag, University of Sussex, UK, 110–125.
Poli, R. 2005. Tournament selection, iterated coupon-collection problem,and backward-chaining evolutionary algorithms. In Foundations of GeneticAlgorithms 8, A. H. Wright, M. D. Vose, K. A. De Jong, and L. M. Schmitt,Eds. Lecture Notes in Computer Science, vol. 3469. Springer-Verlag, Aizu-Wakamatsu City, Japan, 132–155.
Poli, R. and Langdon, W. B. 2005. Backward-chaining genetic programming.In GECCO 2005: Proceedings of the 2005 conference on Genetic andevolutionary computation, H.-G. Beyer, U.-M. O’Reilly, D. V. Arnold,W. Banzhaf, C. Blum, E. W. Bonabeau, E. Cantu-Paz, D. Dasgupta, K. Deb,J. A. Foster, E. D. de Jong, H. Lipson, X. Llora, S. Mancoridis, M. Pelikan,G. R. Raidl, T. Soule, A. M. Tyrrell, J.-P. Watson, and E. Zitzler, Eds. Vol. 2.ACM Press, Washington DC, USA, 1777–1778.
Poli, R., Langdon, W. B., and Dignum, S. 2007. On the limiting distributionof program sizes in tree-based genetic programming. In Proceedings of the10th European Conference on Genetic Programming, M. Ebner, M. O’Neill,A. Ekart, L. Vanneschi, and A. I. Esparcia-Alcazar, Eds. Lecture Notes inComputer Science, vol. 4445. Springer, Valencia, Spain.
Poli, R., Langdon, W. B., and McPhee, N. F. 2008. A field guide togenetic programming. Published via http://lulu.com and freely available athttp://www.gp-field-guide.org.uk. (With contributions by J. R. Koza).
Powell, M. D. J. 1987. Radial basis functions for multivariable interpolation:a review. 143–167.
Press, W. H., Teukolsky, S. A., Vetterling, W. T., and Flannery,
B. P. 1992. Numerical Recipes in C: The Art of Scientific Computing.Cambridge University Press, New York, NY, USA.

259 BIBLIOGRAPHY
Provost, F. 2000. Machine learning from imbalanced data sets 101 (extendedabstract). In AAAI2000 Workshop on Imbalanced Data Sets, N. Japkowiczand Cochairs, Eds. AAAI Press, Austin, TX,USA.
Rennen, G. 2008. Subset selection from large datasets for kriging modeling.Tech. rep.
Rivlin, T. J. 1974. The Chebyshev Polynomials. Wiley, New York, NY, USA.
Rosca, J. 1996. Generality versus size in genetic programming. In GeneticProgramming 1996: Proceedings of the First Annual Conference, J. R. Koza,D. E. Goldberg, D. B. Fogel, and R. L. Riolo, Eds. MIT Press, StanfordUniversity, CA, USA, 381–387.
Rosin, C. D. and Belew, R. K. 1997. New methods for competitivecoevolution. Evol. Comput. 5, 1, 1–29.
Ross, S. 1976. Arbitrage theory of capital asset pricing. Journal of EconomicTheory 13, 341–360.
Sacks, J., Welch, W., Mitchell, T. J., and Wynn, H. 1989. Design andanalysis of computer experiments. Statistical Science 4, 409–435.
Salazar Celis, O., Cuyt, A., and Verdonk, B. 2007. Rationalapproximation of vertical segments. Numerical Algorithms 45, 375–388.
Salustowicz, R. and Schmidhuber, J. 1997. Probabilistic incrementalprogram evolution. Evolutionary Computation 5, 2, 123–141.
Schapire, R. E. 1990. The strength of weak learnability. Machine Learning 5, 2,197–227.
Schmidt, M. D. and Lipson, H. 2006. Co-evolving fitness predictors foraccelerating and reducing evaluations. In Genetic Programming Theoryand Practice IV, R. L. Riolo, T. Soule, and B. Worzel, Eds. Genetic andEvolutionary Computation, vol. 5. Springer, Ann Arbor, MI, USA, Chapter 17,113–130.
Sephton, P. 2001. Forecasting recessions: can we do better on mars? FederalReserve Bank of St. Louis Review in Business Mar, 39–49.

BIBLIOGRAPHY 260
Seung, H. S., Opper, M., and Sompolinsky, H. 1992. Query by committee.In Computational Learning Theory. 287–294.
Sharpe, W. 1964. Capital asset prices: A theory of market equilibrium underconditions of risk. Journal of Finance 19(3), 425–442.
Sherrah, J. R., Bogner, R. E., and Bouzerdoum, A. 1997. Theevolutionary pre-processor: Automatic feature extraction for supervisedclassification using genetic programming. In Genetic Programming 1997:Proceedings of the Second Annual Conference, J. R. Koza, K. Deb, M. Dorigo,D. B. Fogel, M. Garzon, H. Iba, and R. L. Riolo, Eds. Morgan Kaufmann,Stanford University, CA, USA, 304–312.
Shyy, W., Tucker, P. K., and Vaidyanathan, R. 1999. Response surfaceand neural network techniques for rocket engine injector optimization. Tech.Rep. 99-2455, AIAA.
Simpson, T. W. 1998. Comparison of response surface and kriging models inthe multidisciplinary design of an aerospike nozzle. Tech. Rep. TR-98-16.
Smits, G., Kordon, A., Vladislavleva, K., Jordaan, E., and
Kotanchek, M. 2005. Variable selection in industrial datasets using paretogenetic programming. In Genetic Programming Theory and Practice III, T. Yu,R. L. Riolo, and B. Worzel, Eds. Kluwer, Ann Arbor, MI, USA.
Smits, G. and Kotanchek, M. 2004. Pareto-front exploitation in symbolicregression. In Genetic Programming Theory and Practice II, U.-M. O’Reilly,T. Yu, R. L. Riolo, and B. Worzel, Eds. Springer, Ann Arbor, MI, USA,Chapter 17, 283–299.
Smits, G. and Vladislavleva, E. 2006. Ordinal Pareto genetic programming.In Proceedings of the 2006 IEEE Congress on Evolutionary Computation, G. G.Yen, L. Wang, P. Bonissone, and S. M. Lucas, Eds. IEEE Press, Vancouver,Canada, 3114 – 3120.
Smits, G. F. 2001. Genetic Programming Toolbox for the Dow ChemicalCompany. Internal Report. The Dow Chemical Company, Terneuzen, theNetherlands.

261 BIBLIOGRAPHY
Song, D., Heywood, M. I., and Zincir-Heywood, A. N. 2005. Traininggenetic programming on half a million patterns: an example from anomalydetection. IEEE Transactions on Evolutionary Computation 9, 3 (June), 225–239.
Soule, T. and Foster, J. A. 1998. Effects of code growth andparsimony pressure on populations in genetic programming. EvolutionaryComputation 6, 4 (Winter), 293–309.
Soule, T., Foster, J. A., and Dickinson, J. 1996. Code growth in geneticprogramming. In Genetic Programming 1996: Proceedings of the First AnnualConference, J. R. Koza, D. E. Goldberg, D. B. Fogel, and R. L. Riolo, Eds.MIT Press, Stanford University, CA, USA, 215–223.
Soule, T. and Heckendorn, R. B. 2002. An analysis of the causes ofcode growth in genetic programming. Genetic Programming and EvolvableMachines 3, 3 (Sept.), 283–309.
Streeter, M. J. 2003. The root causes of code growth in genetic programming.In Genetic Programming, Proceedings of EuroGP’2003, C. Ryan, T. Soule,M. Keijzer, E. Tsang, R. Poli, and E. Costa, Eds. LNCS, vol. 2610. Springer-Verlag, Essex, UK, 443–454.
Sun, P. and Yao, X. 2006. Boosting kernel models for regression. In ICDM’06: Proceedings of the Sixth International Conference on Data Mining. IEEEComputer Society, Washington, DC, USA, 583–591.
Tchebycheff, P. 1857. Sur les questions de minima qui se rattachent ala representation approximative des fonctions. Memoires Acad. Sci. St.Petersbourg par divers savants 7, 191.
Teller, A. and Andre, D. 1997. Automatically choosing the number offitness cases: The rational allocation of trials. In Genetic Programming 1997:Proceedings of the Second Annual Conference, J. R. Koza, K. Deb, M. Dorigo,D. B. Fogel, M. Garzon, H. Iba, and R. L. Riolo, Eds. Morgan Kaufmann,Stanford University, CA, USA, 321–328.
Topchy, A. and Punch, W. F. 2001. Faster genetic programming based onlocal gradient search of numeric leaf values. In Proceedings of the Genetic

BIBLIOGRAPHY 262
and Evolutionary Computation Conference (GECCO-2001), L. Spector, E. D.Goodman, A. Wu, W. B. Langdon, H.-M. Voigt, M. Gen, S. Sen, M. Dorigo,S. Pezeshk, M. H. Garzon, and E. Burke, Eds. 155–162.
Toropov, V. 1989. Simulation approach to structural optimization. StructuralOptimization 1, 1, 37–46.
Toropov, V. V. and Alvarez, L. F. 1998. Application of geneticprogramming to the choice of a structure of multipoint approximations. In1st ISSMO/NASA Internet Conf. on Approximations and Fast Reanalysis inEngineering Optimization. Published on a CD ROM.
Van Barel, M. and Bultheel, A. 1990. A new approach to the rationalinterpolation problem. J. Comput. Appl. Math. 32, 281–289.
Vapnik, V. 1982. Estimation of Dependences Based on Empirical Data: SpringerSeries in Statistics (Springer Series in Statistics). Springer-Verlag New York,Inc., Secaucus, NJ, USA.
Vapnik, V. 1997. The support vector method. In ICANN ’97: Proceedings of the7th International Conference on Artificial Neural Networks. Springer-Verlag,London, UK, 263–271.
Vladislavleva, E., Smits, G., and den Hertog, D. 2008. Order of non-linearity as a complexity measure for models generated by symbolic regressionvia Pareto genetic programming. IEEE Transactions on EvolutionaryComputation. In press..
Vladislavleva, E., Smits, G., and Kotanchek, M. 2007. Better solutionsfaster : Soft evolution of robust regression models in Pareto geneticprogramming. In Genetic Programming Theory and Practice V, R. L. Riolo,T. Soule, and B. Worzel, Eds. Genetic and Evolutionary Computation.Springer, Ann Arbor, Chapter 2, 13–32.
Vladislavleva, E. J. 2005. Symbolic Regression via Genetic Programming,P.D.Eng. Thesis for Dow Benelux B.V. Technische Universiteit Eindhoven,Eindhoven, the Netherlands.
Wolpert, D. H. 1992. Stacked generalization. Neural Networks 5, 2, 241–259.
263 BIBLIOGRAPHY
Xie, H., Zhang, M., and Andreae, P. 2007. An analysis of depth ofcrossover points in tree-based genetic programming. In 2007 IEEE Congresson Evolutionary Computation, D. Srinivasan and L. Wang, Eds. IEEEComputational Intelligence Society, IEEE Press, Singapore, 4561–4568.
Yu, J., Yu, J., Almal, A. A., Dhanasekaran, S. M., Ghosh, D., Worzel,
W. P., and Chinnaiyan, A. M. 2007. Feature selection and molecularclassification of cancer using genetic programming. Neoplasia 9, 4 (Apr.),292–303.
Zhang, B.-T. 1999. Bayesian genetic programming. In Foundations of GeneticProgramming, T. Haynes, W. B. Langdon, U.-M. O’Reilly, R. Poli, andJ. Rosca, Eds. Orlando, Florida, USA, 68–70.
Zhang, B.-T. and Cho, D.-Y. 1998. Genetic programming with activedata selection. In Simulated Evolution and Learning: Second Asia-PacificConference on Simulated Evolution and Learning, SEAL’98. Selected Papers,R. I. B. McKay, X. Yao, C. S. Newton, J.-H. Kim, and T. Furuhashi,Eds. LNAI, vol. 1585. Springer-Verlag, Australian Defence Force Academy,Canberra, Australia, 146–153. published in 1999.
Zhang, B.-T. and Joung, J.-G. 1999. Genetic programming with incrementaldata inheritance. In Proceedings of the Genetic and Evolutionary ComputationConference, W. Banzhaf, J. Daida, A. E. Eiben, M. H. Garzon, V. Honavar,M. Jakiela, and R. E. Smith, Eds. Vol. 2. Morgan Kaufmann, Orlando, Florida,USA, 1217–1224.
Zhang, B.-T. and Muhlenbein, H. 1995. Balancing accuracy and parsimonyin genetic programming. Evolutionary Computation 3, 1, 17–38.
Zhang, B.-T. and Veenker, G. 1991. Focused incremental learning forimprovedgeneralization with reduced training sets. In Artificial NeuralNetworks, T. Kohonen, K. Makisara, O. Simula, and J. Kangas, Eds. Elsevier,Amsterdam, Espoo, Finland, 227–232. Proc. ICANN-91.
Zitzler, E. and Thiele, L. 1999. Multiobjective evolutionary algorithms: Acomparative case study and the strength Pareto evolutionary algorithm. IEEETransactions on Evolutionary Computation 3, 4, 257–271.

BIBLIOGRAPHY 264
Zitzler, E., Thiele, L., Laumanns, M., Fonseca, C. M., and da Fonseca,
V. G. 2003. Performance assessment of multiobjective optimizers: an analysisand review. IEEE Transactions on Evolutionary Computation 7, 2, 117–132.