model-based extracted water desalination system for carbon
TRANSCRIPT

Imagination at work.
Model-Based Extracted Water DesalinationSystem for Carbon Sequestration
Rachel Gettings
GE Global Research Center
Membrane & Separations Lab
1 Research Circle, Niskayuna, NY
Crosscutting Research & Rare Earth Elements Portfolios ReviewMarch 23, 2017
Acknowledgment: "This material is based upon work supported by
the Department of Energy under Award Number(s) DE-FE0026308."
Blank
2
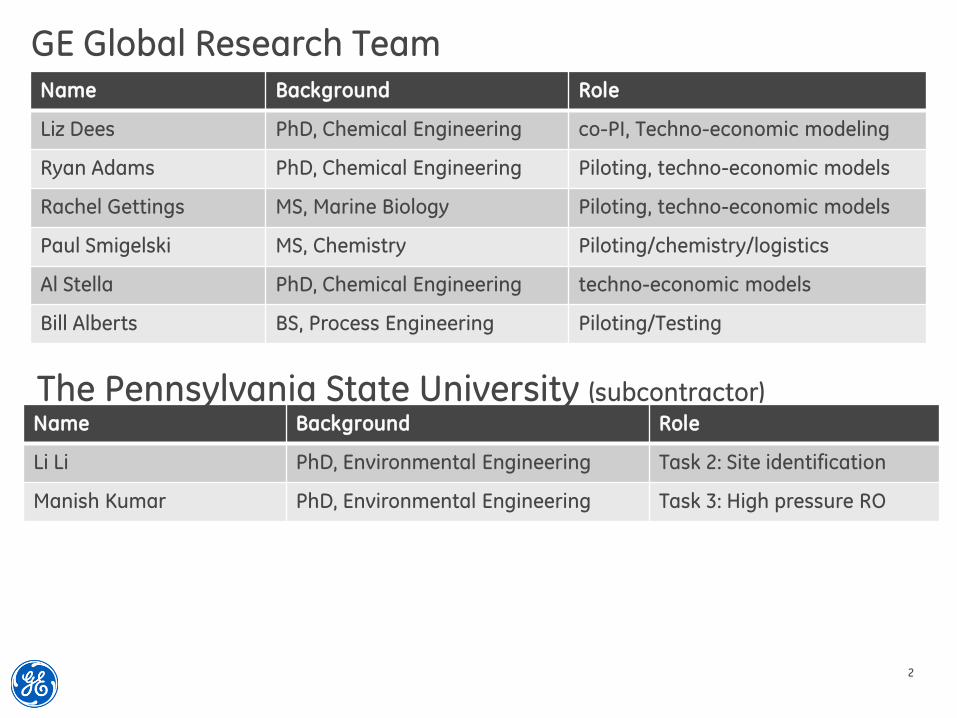
GE Global Research TeamName Background Role
Liz Dees PhD, Chemical Engineering co-PI, Techno-economic modeling
Ryan Adams PhD, Chemical Engineering Piloting, techno-economic models
Rachel Gettings MS, Marine Biology Piloting, techno-economic models
Paul Smigelski MS, Chemistry Piloting/chemistry/logistics
Al Stella PhD, Chemical Engineering techno-economic models
Bill Alberts BS, Process Engineering Piloting/Testing
Name Background Role
Li Li PhD, Environmental Engineering Task 2: Site identification
Manish Kumar PhD, Environmental Engineering Task 3: High pressure RO
The Pennsylvania State University (subcontractor)
Blank
3
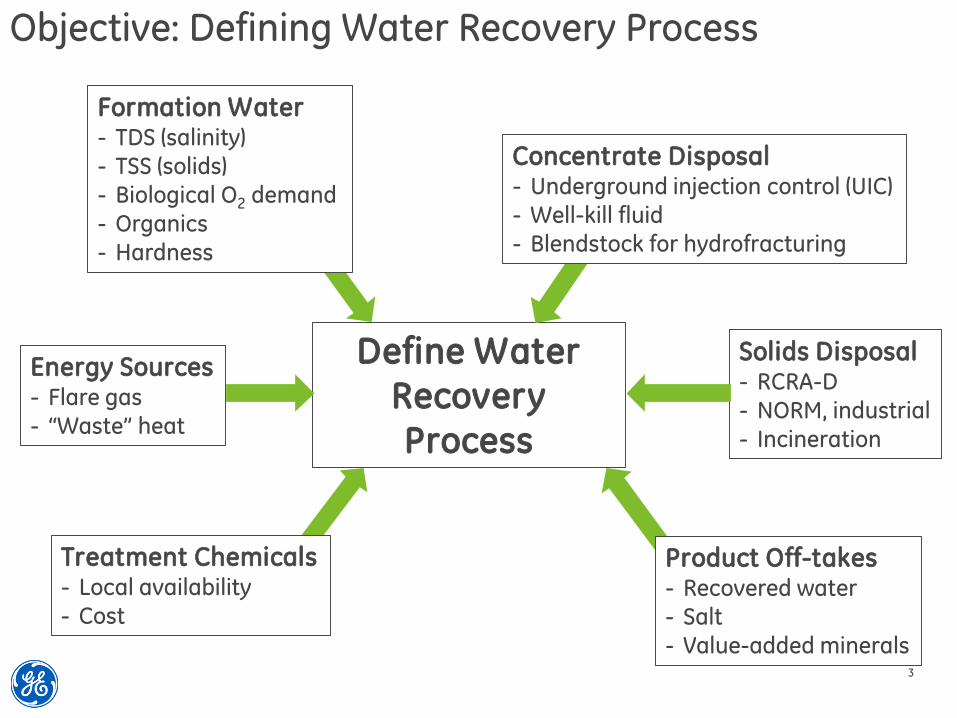
Objective: Defining Water Recovery Process
Energy Sources- Flare gas
- “Waste” heat
Solids Disposal- RCRA-D- NORM, industrial- Incineration
Define Water
Recovery
Process
Formation Water- TDS (salinity)- TSS (solids)- Biological O2 demand- Organics- Hardness
Concentrate Disposal- Underground injection control (UIC)- Well-kill fluid- Blendstock for hydrofracturing
Treatment Chemicals- Local availability- Cost
Product Off-takes- Recovered water- Salt- Value-added minerals

Blank
4
Strategy for Defining Water Recovery Process
• Conventional desalination technology
• Assess required pretreatment needs
• Key question: generate a solid NaCl product?
• Softening required?
- Aspen Plus and Excel models
- Cost of softening chemicals
• Techno-economic modeling of desalination processes
- Aspen Plus and Excel models
- Cost results (normalized by base case cost)
• Bench & pre-pilot scale experiments
• Model refinement
1. Define Base Case
2. Compare Base Case & Alternative Desalination Technologies
3. Validation of Pilot Readiness

Blank
5
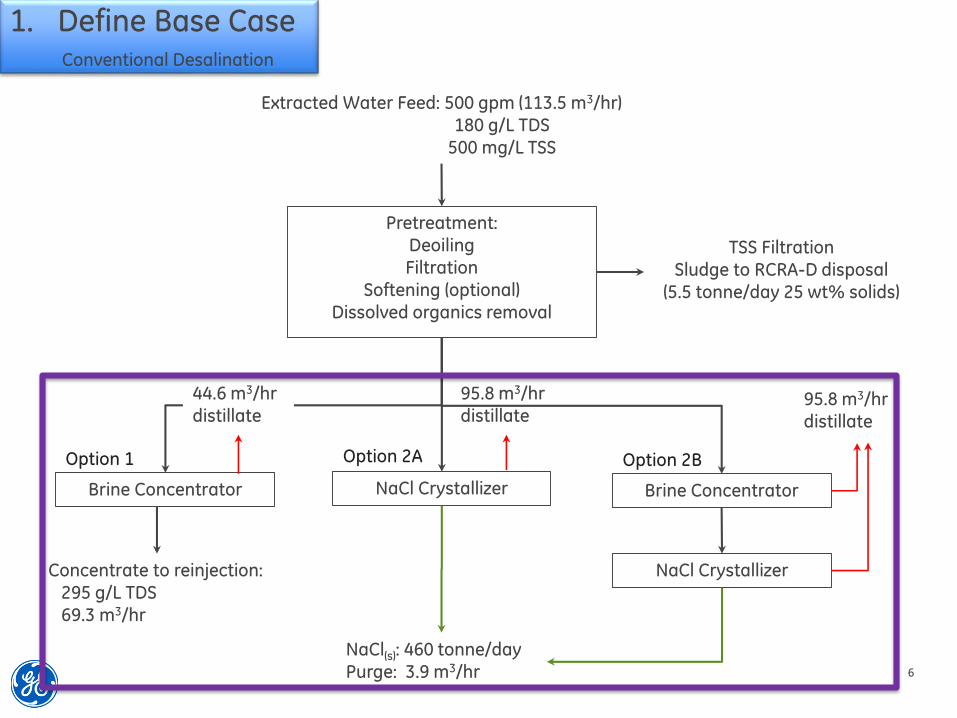
Concentrate to reinjection:295 g/L TDS69.3 m3/hr
TSS FiltrationSludge to RCRA-D disposal
(5.5 tonne/day 25 wt% solids)
Extracted Water Feed: 500 gpm (113.5 m3/hr)180 g/L TDS
500 mg/L TSS
Pretreatment:DeoilingFiltration
Softening (optional)Dissolved organics removal
Brine Concentrator NaCl Crystallizer
NaCl(s): 460 tonne/dayPurge: 3.9 m3/hr
NaCl Crystallizer
Brine Concentrator
Option 1 Option 2B
44.6 m3/hrdistillate
Option 2A
95.8 m3/hrdistillate
95.8 m3/hrdistillate
1. Define Base CasePretreatment
Blank
6
Concentrate to reinjection:295 g/L TDS69.3 m3/hr
TSS FiltrationSludge to RCRA-D disposal
(5.5 tonne/day 25 wt% solids)
Extracted Water Feed: 500 gpm (113.5 m3/hr)180 g/L TDS
500 mg/L TSS
Pretreatment:DeoilingFiltration
Softening (optional)Dissolved organics removal
Brine Concentrator NaCl Crystallizer
NaCl(s): 460 tonne/dayPurge: 3.9 m3/hr
NaCl Crystallizer
Brine Concentrator
Option 1 Option 2B
44.6 m3/hrdistillate
Option 2A
95.8 m3/hrdistillate
95.8 m3/hrdistillate
1. Define Base CaseConventional Desalination
Blank
7
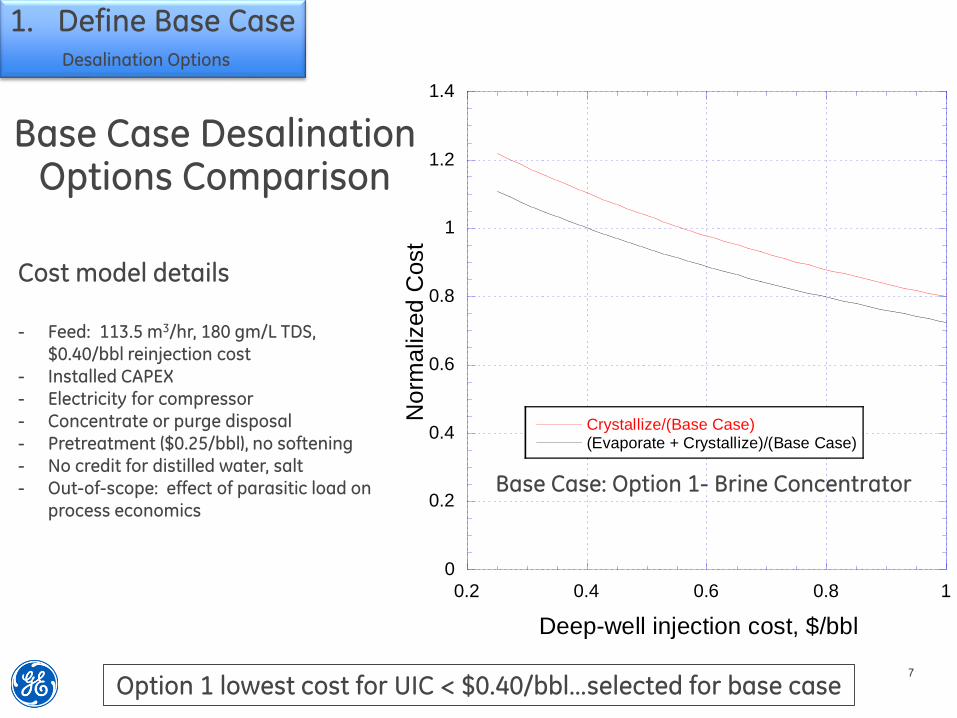
Option 1 lowest cost for UIC < $0.40/bbl…selected for base case
Cost model details
- Feed: 113.5 m3/hr, 180 gm/L TDS, $0.40/bbl reinjection cost
- Installed CAPEX- Electricity for compressor- Concentrate or purge disposal- Pretreatment ($0.25/bbl), no softening- No credit for distilled water, salt- Out-of-scope: effect of parasitic load on
process economics
Base Case Desalination Options Comparison
0
0.2
0.4
0.6
0.8
1
1.2
1.4
0.2 0.4 0.6 0.8 1
Crystallize/(Base Case)(Evaporate + Crystallize)/(Base Case)
No
rma
lized
Cost
Deep-well injection cost, $/bbl
1. Define Base CaseDesalination Options
Base Case: Option 1- Brine Concentrator
Blank
8
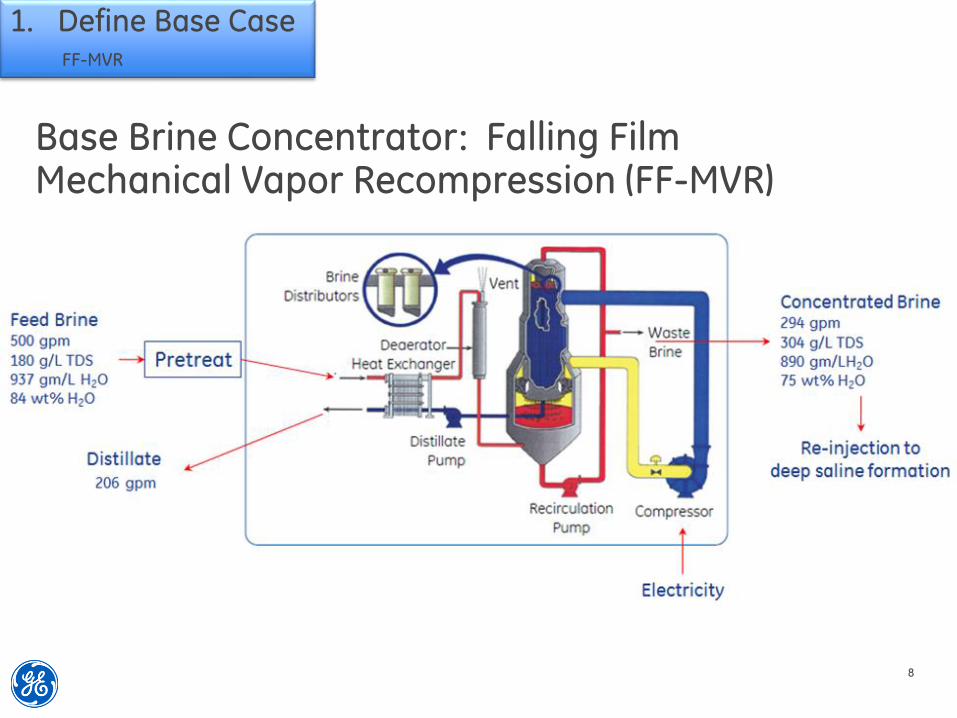
Schematic of FF-MVR desalination system courtesy of GE Water.
1. Define Base CaseFF-MVR
Base Brine Concentrator: Falling Film Mechanical Vapor Recompression (FF-MVR)
Blank
9
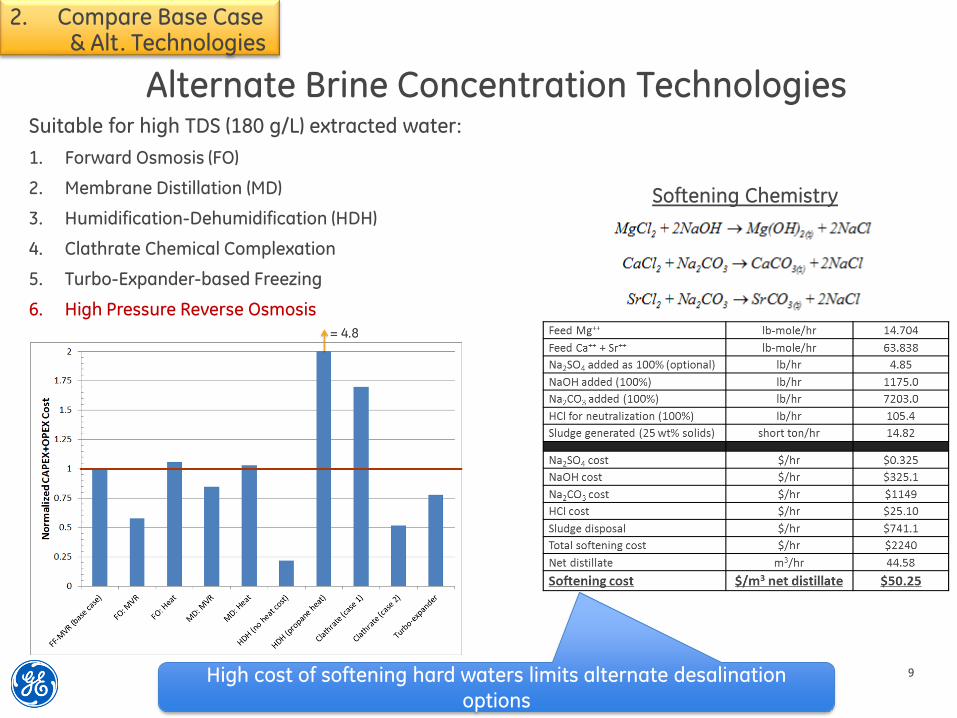
Alternate Brine Concentration TechnologiesSuitable for high TDS (180 g/L) extracted water:
1. Forward Osmosis (FO)
2. Membrane Distillation (MD)
3. Humidification-Dehumidification (HDH)
4. Clathrate Chemical Complexation
5. Turbo-Expander-based Freezing
6. High Pressure Reverse Osmosis
High cost of softening hard waters limits alternate desalination
options
Softening Chemistry
2. Compare Base Case& Alt. Technologies
Blank
10
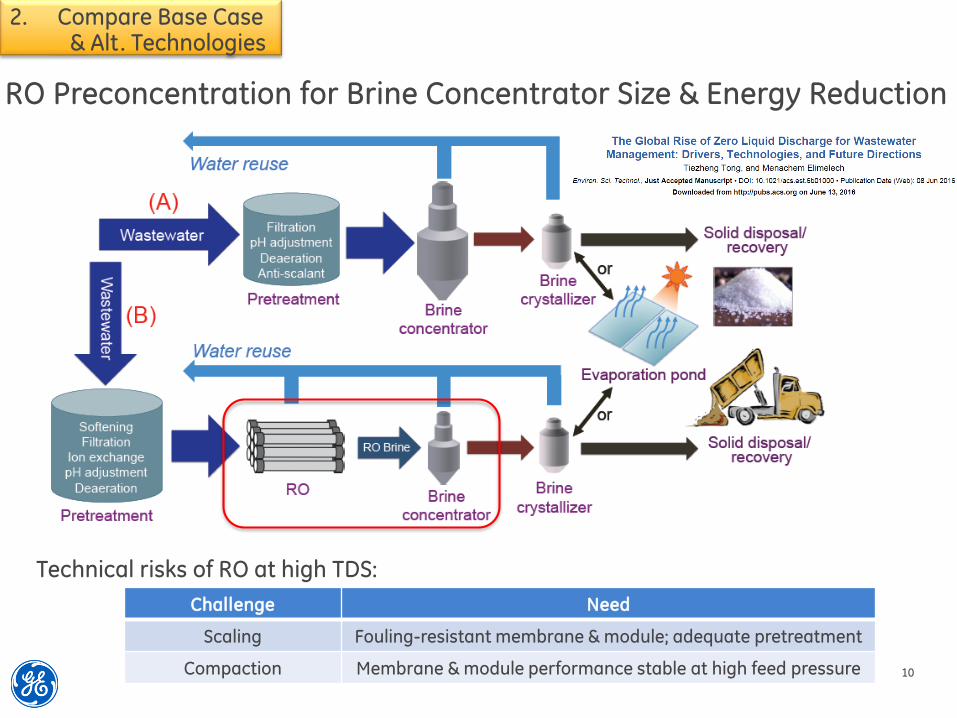
RO Preconcentration for Brine Concentrator Size & Energy Reduction
Technical risks of RO at high TDS:
Challenge Need
Scaling Fouling-resistant membrane & module; adequate pretreatment
Compaction Membrane & module performance stable at high feed pressure
2. Compare Base Case& Alt. Technologies
Blank
11
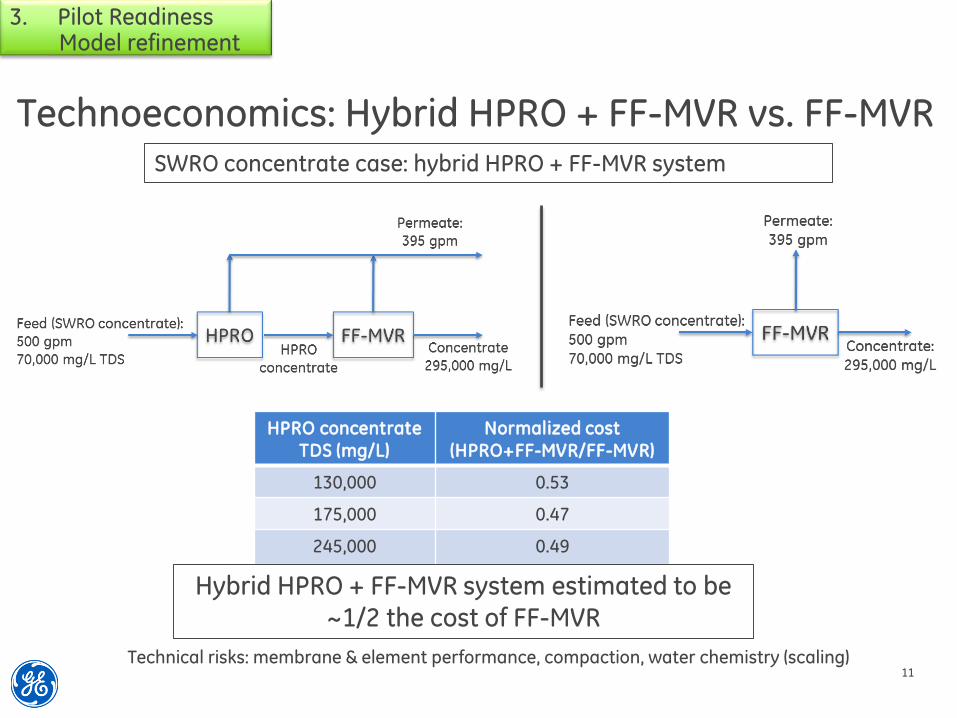
Technoeconomics: Hybrid HPRO + FF-MVR vs. FF-MVR
HPRO concentrate TDS (mg/L)
Normalized cost (HPRO+FF-MVR/FF-MVR)
130,000 0.53
175,000 0.47
245,000 0.49
Hybrid HPRO + FF-MVR system estimated to be ~1/2 the cost of FF-MVR
3. Pilot ReadinessModel refinement
SWRO concentrate case: hybrid HPRO + FF-MVR system
Technical risks: membrane & element performance, compaction, water chemistry (scaling)

Blank
12
Increasing system sizeIncreasing concentrate volumeDecreasing pressure requirement
SWRO + HPRO Hybrid Technoeconomics Summary
2x concentrate disposal cost
SWRO + HPRO hybrid reduces system cost in many cases(dependent on HPRO material, pretreatment & concentrate disposal costs)
Increasing system sizeIncreasing concentrate volumeDecreasing pressure requirement
3. Pilot ReadinessModel refinement
Blank
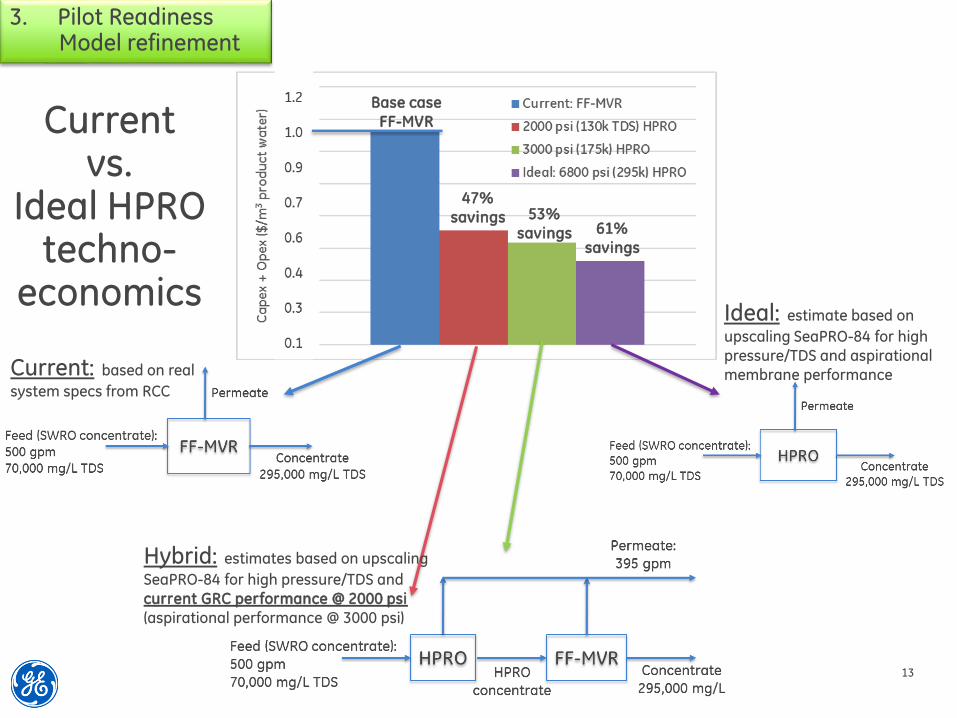
13
Current vs.
Ideal HPRO techno-
economics
Current: based on real
system specs from RCC
47% savings 53%
savings 61% savings
Base case FF-MVR
Ideal: estimate based on
upscaling SeaPRO-84 for high pressure/TDS and aspirational membrane performance
Hybrid: estimates based on upscaling
SeaPRO-84 for high pressure/TDS and current GRC performance @ 2000 psi (aspirational performance @ 3000 psi)
3. Pilot ReadinessModel refinement
Blank
14
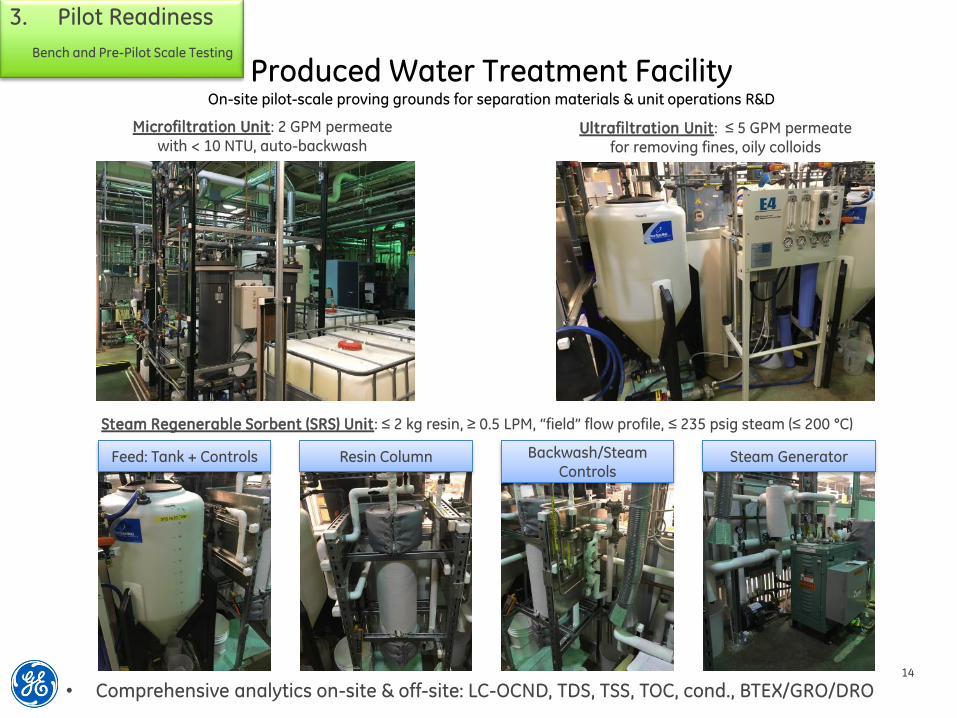
Produced Water Treatment FacilityOn-site pilot-scale proving grounds for separation materials & unit operations R&D
Steam Regenerable Sorbent (SRS) Unit: ≤ 2 kg resin, ≥ 0.5 LPM, “field” flow profile, ≤ 235 psig steam (≤ 200 °C)
Feed: Tank + Controls Resin Column Backwash/Steam Controls
Steam Generator
Microfiltration Unit: 2 GPM permeate
with < 10 NTU, auto-backwashUltrafiltration Unit : ≤ 5 GPM permeate
for removing fines, oily colloids
• Comprehensive analytics on-site & off-site: LC-OCND, TDS, TSS, TOC, cond., BTEX/GRO/DRO
3. Pilot Readiness
Bench and Pre-Pilot Scale Testing
Blank
15
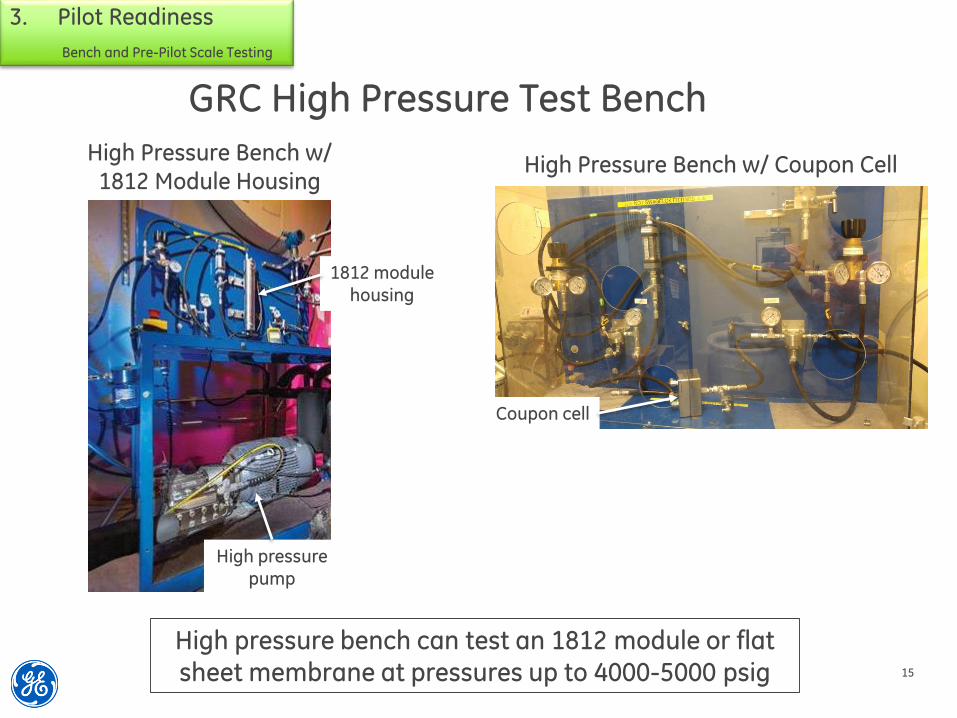
GRC High Pressure Test Bench
High pressure pump
1812 module housing
Coupon cell
High pressure bench can test an 1812 module or flat sheet membrane at pressures up to 4000-5000 psig
High Pressure Bench w/ 1812 Module Housing
High Pressure Bench w/ Coupon Cell
3. Pilot Readiness
Bench and Pre-Pilot Scale Testing

Blank
16
Components Critical for High Pressure RO
https://www.freshwatersystems.com/c-238-ro-membranes.aspx
• Identify components responsible for performance loss at high TDS/pressure• Replace components with suitable alternatives to maximize TDS/pressure
operation range of spiral-wound RO module
3. Pilot Readiness
Bench and Pre-Pilot Scale Testing
Blank
17
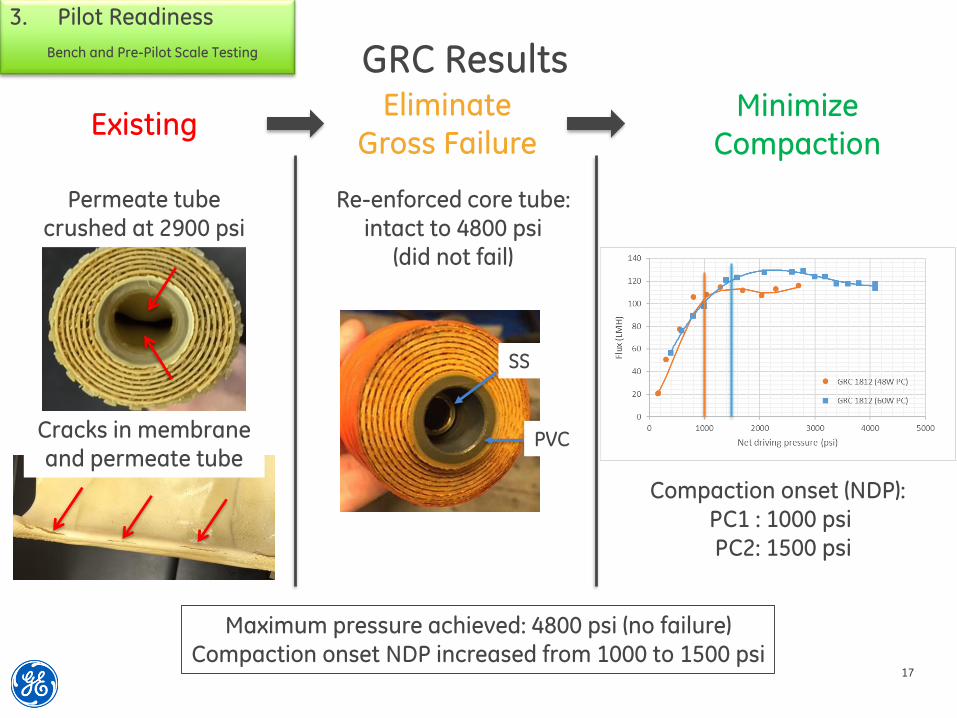
GRC Results
Re-enforced core tube: intact to 4800 psi
(did not fail)
SS
Cracks in membrane and permeate tube
Permeate tube crushed at 2900 psi
ExistingEliminate
Gross FailureMinimize
Compaction
PVC
Compaction onset (NDP):PC1 : 1000 psiPC2: 1500 psi
Maximum pressure achieved: 4800 psi (no failure)
Compaction onset NDP increased from 1000 to 1500 psi
3. Pilot Readiness
Bench and Pre-Pilot Scale Testing
Blank
18
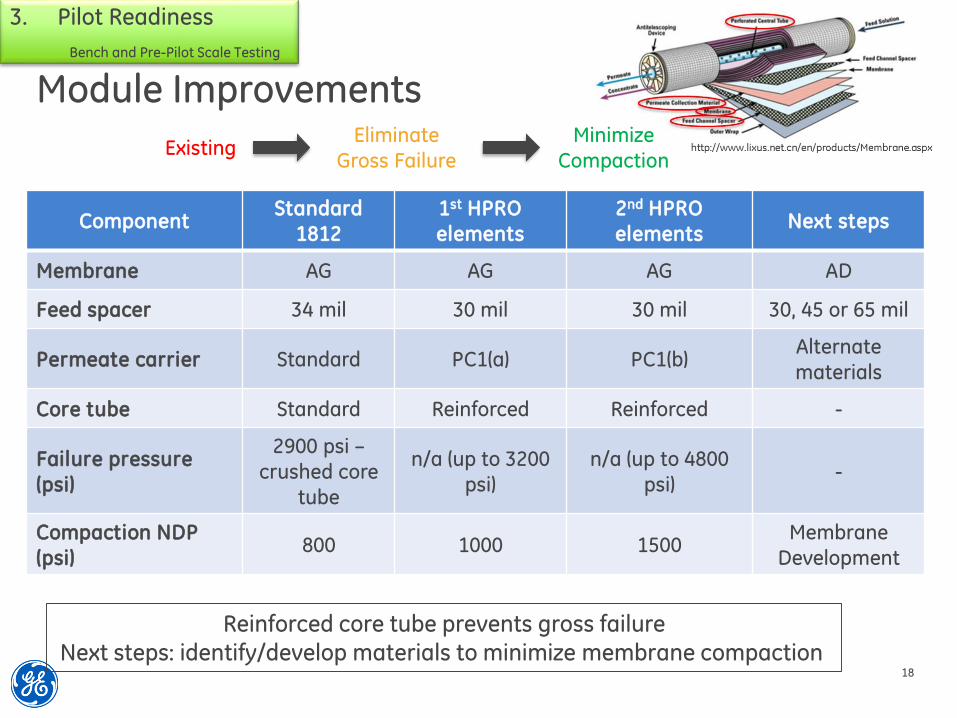
Module Improvements
Reinforced core tube prevents gross failureNext steps: identify/develop materials to minimize membrane compaction
ExistingEliminate
Gross Failure
Minimize
Compaction
ComponentStandard
1812
1st HPRO
elements
2nd HPRO
elementsNext steps
Membrane AG AG AG AD
Feed spacer 34 mil 30 mil 30 mil 30, 45 or 65 mil
Permeate carrier Standard PC1(a) PC1(b)Alternate
materials
Core tube Standard Reinforced Reinforced -
Failure pressure
(psi)
2900 psi –
crushed core
tube
n/a (up to 3200
psi)
n/a (up to 4800
psi)-
Compaction NDP
(psi)800 1000 1500
Membrane
Development
3. Pilot Readiness
Bench and Pre-Pilot Scale Testing
Blank
19
Acknowledgments

Blank
20
Acknowledgment: "This material is based upon work supported by the Department of Energy under Award Number(s) DE-FE0026308."
Disclaimer: "This report was prepared as an account of work sponsored by an agency of the United States Government. Neither the United States Government nor any agency thereof, nor any of their employees, makes any warranty, express or implied, or assumes any legal liability or responsibility for the accuracy, completeness, or usefulness of any information, apparatus, product, or process disclosed, or represents that its use would not infringe privately owned rights. Reference herein to any specific commercial product, process, or service by trade name, trademark, manufacturer, or otherwise does not necessarily constitute or imply its endorsement, recommendation, or favoring by the United States Government or any agency thereof. The views and opinions of authors expressed herein do not necessarily state or reflect those of the United States Government or any agency thereof."
Disclaimer

Blank
22
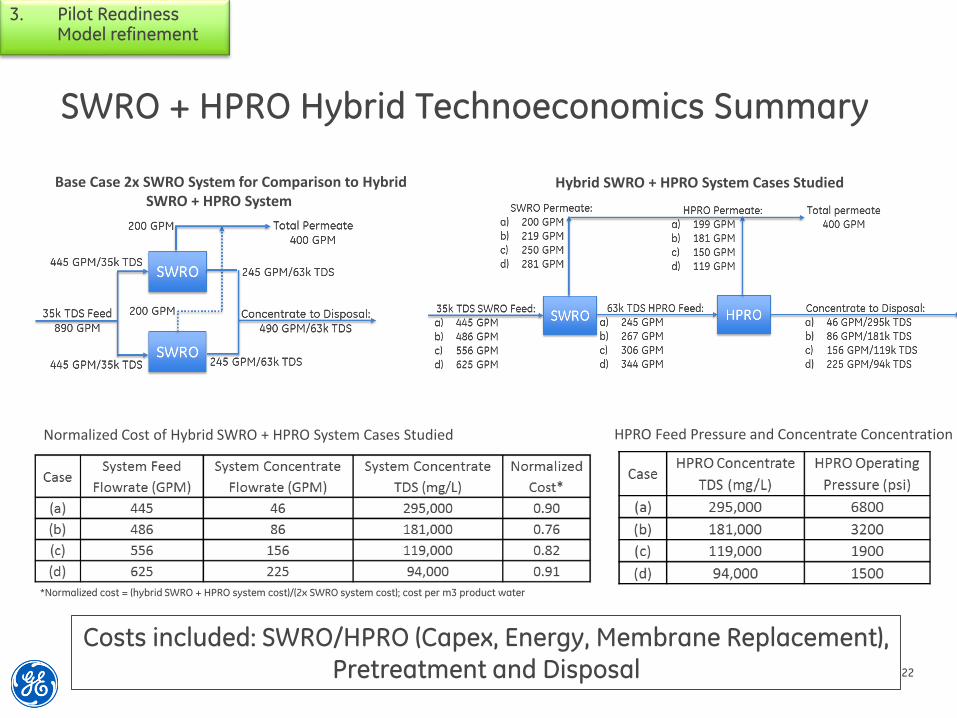
Base Case 2x SWRO System for Comparison to Hybrid SWRO + HPRO System
HPRO Feed Pressure and Concentrate ConcentrationNormalized Cost of Hybrid SWRO + HPRO System Cases Studied
Hybrid SWRO + HPRO System Cases Studied
*Normalized cost = (hybrid SWRO + HPRO system cost)/(2x SWRO system cost); cost per m3 product water
SWRO + HPRO Hybrid Technoeconomics Summary
3. Pilot ReadinessModel refinement
Costs included: SWRO/HPRO (Capex, Energy, Membrane Replacement), Pretreatment and Disposal
Blank
23
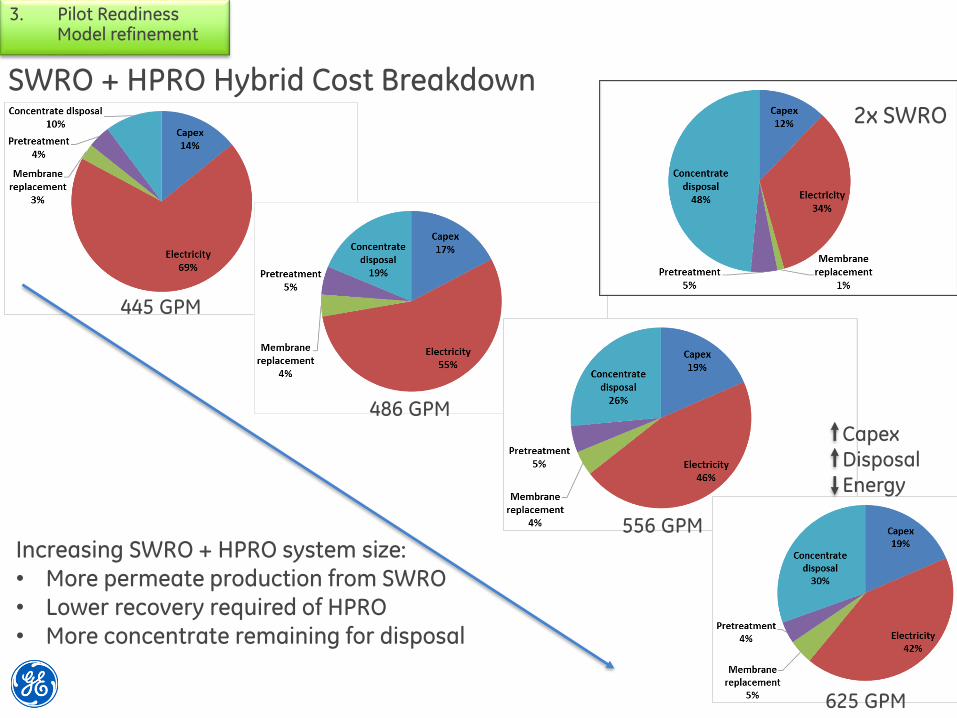
SWRO + HPRO Hybrid Cost Breakdown
445 GPM
2x SWRO
Increasing SWRO + HPRO system size:
• More permeate production from SWRO• Lower recovery required of HPRO• More concentrate remaining for disposal
486 GPM
556 GPM
625 GPM
Capex
Disposal
Energy
3. Pilot ReadinessModel refinement
Blank
24
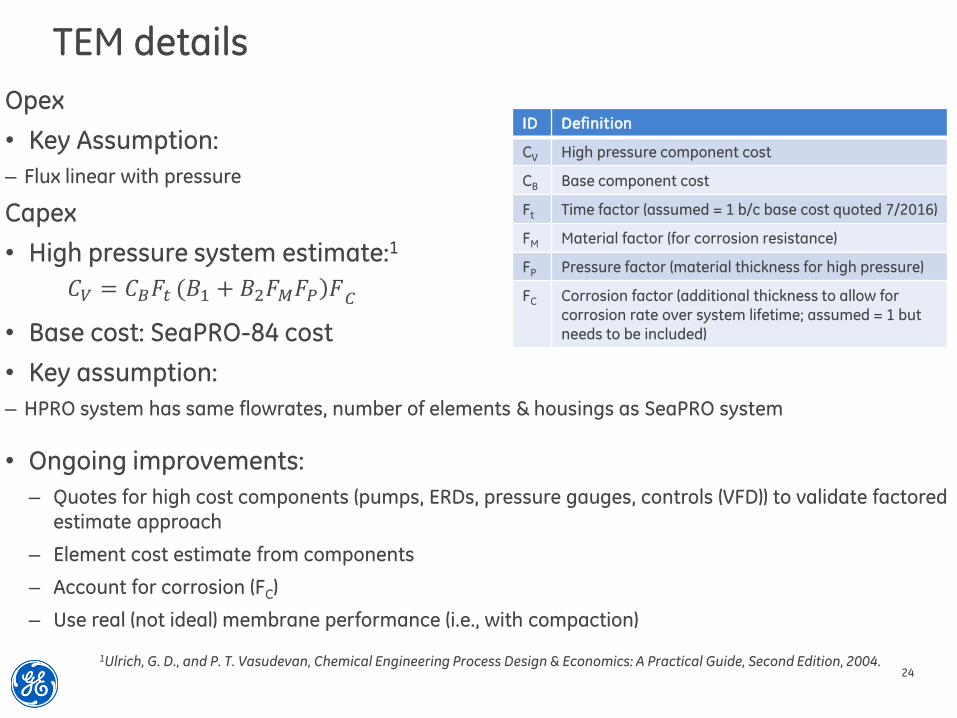
TEM details
Opex
• Key Assumption:
– Flux linear with pressure
Capex
• High pressure system estimate:1
• Base cost: SeaPRO-84 cost
• Key assumption:
– HPRO system has same flowrates, number of elements & housings as SeaPRO system
𝐶𝑉 = 𝐶𝐵𝐹𝑡 (𝐵1 + 𝐵2𝐹𝑀𝐹𝑃ሻ𝐹𝐶
1Ulrich, G. D., and P. T. Vasudevan, Chemical Engineering Process Design & Economics: A Practical Guide, Second Edition, 2004.
ID Definition
CV High pressure component cost
CB Base component cost
Ft Time factor (assumed = 1 b/c base cost quoted 7/2016)
FM Material factor (for corrosion resistance)
FP Pressure factor (material thickness for high pressure)
FC Corrosion factor (additional thickness to allow for corrosion rate over system lifetime; assumed = 1 but needs to be included)
• Ongoing improvements:
– Quotes for high cost components (pumps, ERDs, pressure gauges, controls (VFD)) to validate factored
estimate approach
– Element cost estimate from components
– Account for corrosion (FC)
– Use real (not ideal) membrane performance (i.e., with compaction)