model advancement and hil setup for testing a p2 phev
TRANSCRIPT

Wayne State University
Wayne State University Theses
1-1-2017
Model Advancement And Hil Setup For Testing AP2 Phev Supervisory ControllerSajjan BalakrishnanWayne State University,
Follow this and additional works at: https://digitalcommons.wayne.edu/oa_theses
Part of the Other Mechanical Engineering Commons
This Open Access Thesis is brought to you for free and open access by DigitalCommons@WayneState. It has been accepted for inclusion in WayneState University Theses by an authorized administrator of DigitalCommons@WayneState.
Recommended CitationBalakrishnan, Sajjan, "Model Advancement And Hil Setup For Testing A P2 Phev Supervisory Controller" (2017). Wayne StateUniversity Theses. 549.https://digitalcommons.wayne.edu/oa_theses/549

MODEL ADVANCEMENT AND HIL SETUP FOR TESTING A P2 PHEV SUPERVISORY CONTROLLER
by
SAJJAN BALAKRISHNAN
THESIS
Submitted to the Graduate School
of Wayne State University,
Detroit, Michigan
in partial fulfillment of the requirements
for the degree of
MASTER OF SCIENCE
2017
MAJOR: MECHANICAL ENGINEERING
Approved By:
Advisor Date

i
DEDICATION
To family and friends.

ii
ACKNOWLEDGEMENT
Firstly, thanks to my faculty advisor Dr. Jerry Ku’s dedication. His advice and support
has been very crucial for the successful completion of my master’s thesis. My friends
from the EcoCAR3 team have been very supportive and have contributed significantly
to my thesis work. Last, but not the least, I am grateful to the Advanced Vehicle
Technology Competition sponsors and organizers for providing me and several other
students this great opportunity.

iii
TABLE OF CONTENTS
DEDICATION ................................................................................................................................. i
ACKNOWLEDGEMENT ...............................................................................................................ii
LIST OF FIGURES...................................................................................................................... vii
LIST OF TABLES ......................................................................................................................... ix
CHAPTER 1 INTRODUCTION .................................................................................................. 1
1.1 E AND EC EVENT ............................................................................................................. 2
CHAPTER 2 LITERATURE REVIEW ....................................................................................... 3
2.1 MODEL BASED DEVELOPMENT .................................................................................. 3
2.2 MODEL FIDELITY AND ACCURACY ............................................................................ 5
CHAPTER 3 OVERVIEW ........................................................................................................... 7
3.1 PRETRANSMISSION PARALLEL PLUG-IN HYBRID ELECTRIC VEHICLE ......... 7
3.2 WORK FLOW ..................................................................................................................... 8
3.3 DATA ACQUISITION ...................................................................................................... 11
3.4 MODELING PLATFORM ................................................................................................ 12
3.5 TEST BENCH SETUP .................................................................................................... 13
3.6 ECOCAR3 HEV PLANT MODEL STATUS ................................................................. 14
CHAPTER 4 BASELINE MODEL EVALUATION .................................................................. 17
CHAPTER 5 PLANT MODEL ADVANCEMENT ................................................................... 20

iv
5.1 DRIVETRAIN, WHEELS AND CHASSIS MODELING .............................................. 20
5.1.1 TORQUE CONVERTER .......................................................................................... 20
5.1.2 TRANSMISSION ....................................................................................................... 21
5.1.3 WHEELS .................................................................................................................... 21
5.1.4 CHASSIS .................................................................................................................... 21
5.1.5 SOFT TCM ................................................................................................................. 22
5.1.5 DRIVETRAIN, WHEEL AND CHASSIS COMPONENT MODELS
VALIDATION ....................................................................................................................... 22
5.3 IC ENGINE MODEL ........................................................................................................ 25
5.3.1 MODEL ADVANCEMENT ....................................................................................... 25
5.3.2 IC ENGINE MODEL VALIDATION ........................................................................ 28
5.4 DRIVER MODEL .............................................................................................................. 31
5.5 E-MACHINE MODEL ...................................................................................................... 32
5.5.1 MODEL DEVELOPMENT ........................................................................................ 32
5.5.2 E-MACHINE MODEL VALIDATION....................................................................... 35
5.6 ENERGY STORAGE SYSTEM (ESS) MODEL .......................................................... 37
5.6 ACCESSORY LOADS MODEL ..................................................................................... 43
5.7 SOFT BMS MODEL ........................................................................................................ 43
5.8 SOFT MCU AND SOFT BCM MODELS ...................................................................... 44
v
CHAPTER 6 FULL VEHICLE MODEL VALIDATION ........................................................... 45
6.1 HYBRID MODE VALIDATION RESULTS ................................................................... 46
6.2 ENGINE ONLY MODE VALIDATION RESULT .......................................................... 50
CHAPTER 7 HIL SETUP .......................................................................................................... 51
7.1 HARDWARE AND SOFTWARE TOOLS ..................................................................... 53
7.1.1 COMPONENTS UNDER TEST .............................................................................. 53
7.1.2 COMPONENTS SIMULATING THE VEHICLE .................................................... 54
7.3 HIL SETUP CHALLENGES ........................................................................................... 55
7.3 MODEL PORTABILITY ................................................................................................... 56
7.4 HSC DIAGNOSTICS TESTING IN HIL ........................................................................ 56
7.4.1 COMMON FAULT SCENARIOS ............................................................................ 56
7.4.2 FAULT INSERTION IN HIL ..................................................................................... 57
7.4.3 HSC DIAGNOSTICS HIL VALIDATION RESULTS ............................................ 58
7.5 E and EC DRIVE CYCLE HIL TESTING RESULTS .................................................. 60
CHAPTER 8 RECOMMENDATIONS BASED ON RESEARCH ........................................ 62
8.1 CHARGE AND DISCHARGE CURRENT LIMITS (SOFT BMS) .............................. 62
8.2 DYNAMIC ACCESSORY MODELS ............................................................................. 62
8.3 SIMULATION STEP SIZE .............................................................................................. 63
8.4 EMISSIONS SIMULATION VALIDATION ................................................................... 63

vi
8.5 TRANSMISSION CAN BASED SHIFTING MODEL .................................................. 63
8.6 ECM TORQUE REQUEST MODEL ............................................................................. 64
8.7 REGRESSION TESTING SETUP ................................................................................. 64
CHAPTER 9 CONCLUSION .................................................................................................... 65
REFERENCES ........................................................................................................................... 66
APPENDIX .................................................................................................................................. 70
ABSTRACT ................................................................................................................................. 76

vii
LIST OF FIGURES
Figure 1. E and EC drive cycle................................................................................................... 2
Figure 2. Pre-transmission Parallel Hybrid Electric Vehicle architecture ............................ 7
Figure 3. Detailed modeling workflow ....................................................................................... 8
Figure 4. WSU EcoCAR3 Controls Development Cycle ....................................................... 9
Figure 5. Test bench setup ....................................................................................................... 13
Figure 6. Baseline model evaluation results: Input accelerator pedal position and
simulated vehicle speed ............................................................................................................ 17
Figure 7. Baseline model evaluation results: Simulated distance travelled and fuel
consumption ................................................................................................................................ 18
Figure 8. Baseline model evaluation results: Simulated fuel consumption rate and
transmission gear number ........................................................................................................ 19
Figure 9. Drivetrain, wheel and chassis models test bench ................................................ 20
Figure 10. Soft TCM output validation results ....................................................................... 22
Figure 11. Drivetrain, chassis and wheels models validation results ................................ 23
Figure 12. Drivetrain, chassis and wheels models validation results ................................ 24
Figure 13. IC Engine intake manifold flow dynamics model ................................................ 26
Figure 14. IC Engine model fidelity validation using stock engine parameters ................ 28
Figure 15. IC Engine model fidelity validation using stock engine parameters ................ 29
Figure 16. IC Engine model fidelity validation using stock engine parameters ................ 30
Figure 17. LEA engine model validation results .................................................................... 31
Figure 18. Inside the E-Machine model .................................................................................. 32
viii
Figure 19. GKN EVO AF130-4 IPMSM efficiency map ........................................................ 33
Figure 20. E-Machine model validation results ..................................................................... 35
Figure 21. E-Machine model validation results ..................................................................... 36
Figure 22. Equivalent circuit model of a single Li-ion cell .................................................... 37
Figure 23. Single Li-ion cell model validation results ........................................................... 39
Figure 24. Single Li-ion cell model validation results ........................................................... 40
Figure 25. Battery pack model validation results .................................................................. 40
Figure 26. Battery pack model validation results .................................................................. 41
Figure 27. Battery pack model validation results .................................................................. 42
Figure 28. Full vehicle model CS mode validation results ................................................... 47
Figure 29. Full vehicle model CS mode validation results ................................................... 48
Figure 30. Engine-only mode validation results .................................................................... 50
Figure 31. HIL Setup .................................................................................................................. 51
Figure 32. HIL Layout ................................................................................................................ 52
Figure 33. ETAS Modules and the Axiomatic output controller .......................................... 53
Figure 34. dSPACE Midsize Simulator (left); Vector VN8910A (right) .............................. 54
Figure 35. HSC over volt fault diagnostics testing in HIL .................................................... 58
Figure 36. E and EC HIL simulation results ........................................................................... 60
Figure 37. E and EC HIL simulation results ........................................................................... 61
Figure 38. New torque converter model ................................................................................. 70
Figure 39. New tire rolling resistance model .......................................................................... 70
Figure 40. Detailed MIL and HIL testing work plan ............................................................... 71

ix
Figure 41. HSC APP mismatch diagnostics testing results in HIL ..................................... 71
Figure 42. Thesis MIL model .................................................................................................... 72
Figure 43. Thesis HIL vehicle model ....................................................................................... 72
Figure 44. HSC software model for HIL testing ..................................................................... 73
Figure 45. Inside the new plant model .................................................................................... 73
Figure 46. Electric powertrain test bench ............................................................................... 74
Figure 47. IC Engine test bench .............................................................................................. 74
Figure 48. Energy Storage System(ESS) single Li-ion cell test bench ............................. 74
Figure 49. Stock powertrain test bench .................................................................................. 75
Figure 50. Full vehicle model test bench ................................................................................ 75
LIST OF TABLES
Table 1. HEV plant model status ............................................................................................. 15
Table 2. Full vehicle model validation results ........................................................................ 45
Table 3. E and EC HIL Simulation Results ............................................................................ 60

1
CHAPTER 1 INTRODUCTION
Global environmental and economic factors have urged the automotive manufacturers
and the government to find sustainable and environment friendly transportation
solutions. EcoCAR3 is a premier collegiate Advanced Vehicle Technology Competition
which is an effort to promote innovation and mould the future automotive leaders. The
Wayne State University EcoCAR3 team is one amongst the sixteen North American
Universities developing different Hybrid Electric Vehicle architectures for the Chevrolet
Camaro. Wayne State University EcoCAR3 team is developing the Pre-transmission
Parallel Plug-In Hybrid Electric Vehicle architecture.
The goal of the competition is to reduce the well-to-wheel Green House Gas (GHG)
emissions, criteria tailpipe emissions and energy consumption, thereby improving
overall efficiency while retaining the thrill and ride quality of the well engineered stock
vehicle. This explains the importance of the Emissions and Energy Consumption event
which is a dynamic event in the Final Competition. Teams spend considerable amount
of time in testing the Hybrid Supervisory Controller code and optimizing the control
strategy for better vehicle safety and reduced emissions and energy consumption to be
successful in this event.
Model based development and rapid prototyping are necessary procedures in order to
enable parallel controls development and optimization activities. Accurate vehicle plant
model simulation is essential. A systematic and reliable approach has been taken in
order to achieve the maximum possible accuracy with the available time and resources.
2
1.1 E AND EC EVENT
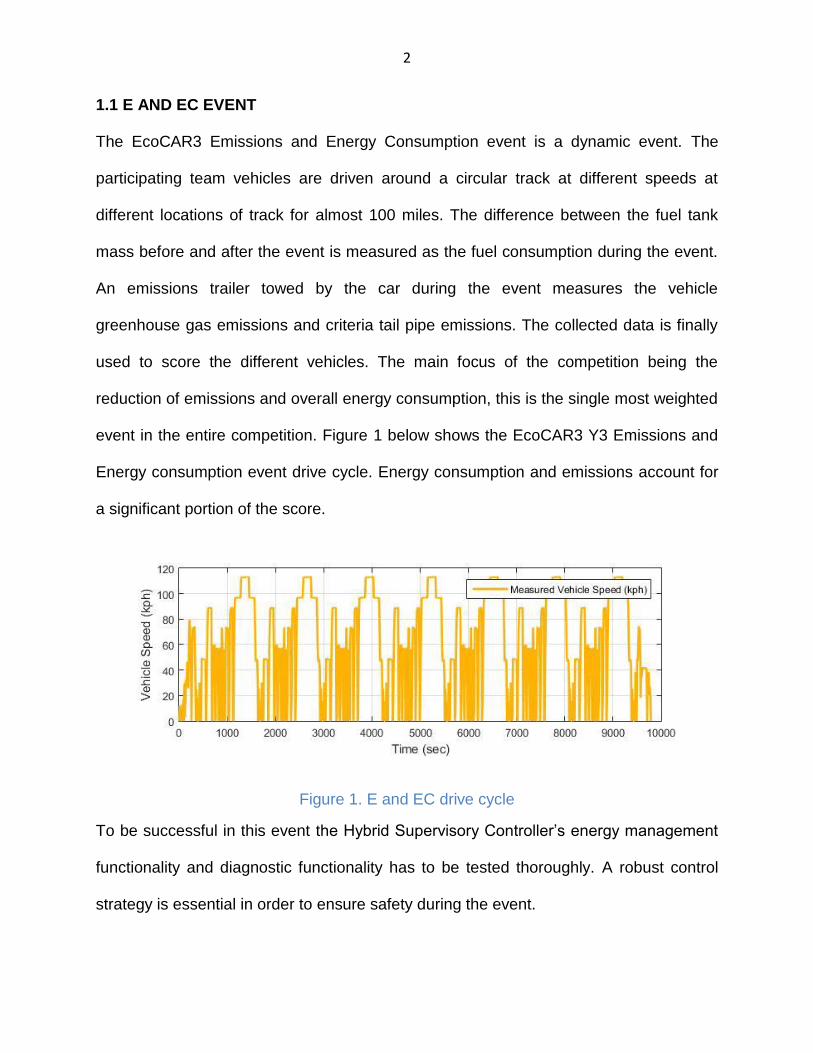
The EcoCAR3 Emissions and Energy Consumption event is a dynamic event. The
participating team vehicles are driven around a circular track at different speeds at
different locations of track for almost 100 miles. The difference between the fuel tank
mass before and after the event is measured as the fuel consumption during the event.
An emissions trailer towed by the car during the event measures the vehicle
greenhouse gas emissions and criteria tail pipe emissions. The collected data is finally
used to score the different vehicles. The main focus of the competition being the
reduction of emissions and overall energy consumption, this is the single most weighted
event in the entire competition. Figure 1 below shows the EcoCAR3 Y3 Emissions and
Energy consumption event drive cycle. Energy consumption and emissions account for
a significant portion of the score.
Figure 1. E and EC drive cycle
To be successful in this event the Hybrid Supervisory Controller‟s energy management
functionality and diagnostic functionality has to be tested thoroughly. A robust control
strategy is essential in order to ensure safety during the event.

3
CHAPTER 2 LITERATURE REVIEW
2.1 MODEL BASED DEVELOPMENT
The EcoCAR teams have benefitted in the past from Model Based Development and
Rapid Controls Prototyping activities as it enables the faster development and
refinement of the Hybrid Supervisory Controller software, eliminating the dependency
on vehicle or component availability for simple testing activities.
In [1] Arizona State University‟s EcoCAR3 team member discuss about their team‟s
plant model and supervisory controller development in Simulink. The team developed
Pre-transmission parallel hybrid electric vehicle architecture for the Chevrolet Camaro.
The vehicle model consists of a modified Chevrolet Camaro plant model with GM 2.4L
LEA E85 engine and GKN AF-130 electric machine, just like ours. The electric machine
is powered by an A123 7M15s3p pack with a capacity of 19.4Ah. The paper provides
details regarding the vehicle plant model development and architecture selection during
the initial phases based on the simulation results. The effect of adding a torque
converter model has been discussed in detail. Moreover, the modeling approach has
been mentioned to be based on data provided by the manufacturers. The authors state
that many parameters have been assumed as the data is unavailable. The paper does
not discuss or propose any approaches to improve or validate the model simulation
accuracy. Moreover, there is no account that the model outputs were validated or
compared against real world test data.
In [2], Ward describes the modeling and simulation of the Ohio State University
EcoCAR3 team‟s hybridized Chevrolet Camaro. The architecture is a plug-in hybrid

4
electric vehicle (PHEV). The modified powertrain consists of a Ford 2.0L GDI4 engine
coupled to a Tremec T-5 five speed automated manual transmission. The electric
counterpart to the ICE is a Parker-Hannifin 150kW electric machine powered by an
A123 Systems 18.9kWhr energy storage system. The thesis discusses the initial
Simulink based model development activities including the optimization of the model
based on the controller testing requirements. The parameters used are mostly data from
the manufacturers and the author mentions that the models are of low fidelity at multiple
occasions. Moreover, the abstract mentions that the model will be continually improved
throughout the four year competition. The author gives a brief estimation of which
component or soft ECU models are expected to get more complex over the course of
the competition and the estimates seem to be reliable.
Marquez [3] discusses the development of the Virginia Tech EcoCAR3 team‟s P3 Plug-
in Parallel Hybrid Electric Vehicle model and controls development. The thesis
discusses architecture selection, model development and component and vehicle
testing activities in detail. The thesis shows a good idea of the initial stages of the
vehicle architecture selection and controls development. However, the paper does not
give a note on the model accuracy relative to the real world data. In [4], the author
discusses the model development and validation for simulating a electric scooter energy
consumption. The validation of the simulated model results have been discussed in
detail in [4]. The test setup and component and vehicle testing requirements are
discussed thoroughly.
In this thesis the vehicle plant model simulation accuracy is validated by comparing the
simulated results with real world measurements.

5
2.2 MODEL FIDELITY AND ACCURACY
Model fidelity is determined by the application. Different modeling approaches for
modeling and simulation of vehicles exist ([5] and [6]). Hofman et al. states that
modeling of longitudinal vehicle dynamics alone in a Forward Dynamic modeling
approach is desirable for energy consumption simulation accuracy. In Hofman et al. [5],
the authors analyze three different engine models and evaluate the Forward Dynamic
engine model accuracy by comparing the results with the other simulation results and
test data. The paper gives an idea of the practically achievable accuracy with the
various models. It has been mentioned that the forward dynamic model produces a
relative error of 4.6%.
Equations for torque converter model are obtained from [7] which identifies the use of
relationship between torque ratio, speed ratio and capacity factor to simulate the effect
of torque converter in an automatic transmission. An example map of the torque
converter efficiency with respect to speed ratio is also provided which can be used as a
good starting point during initial model development when data is not available.
Moreover, the article recommends alternative analytical model based on curve fitting
which can replace these maps. Apart from providing the equations for more powertrain
components models, the paper also briefly reassure the popular use of map based
models for powertrain component efficiency simulations.
Evaluation of various battery circuit models [8] clearly shows the Dual Polarity (DP)
circuit model accuracy is the highest among the battery equivalent circuit models. It can
be seen from the plots in the paper that the Thevenin circuit model simulation results
are closer to the DP model simulation results. Hybrid Pulse Power Characterization

6
(HPPC) test data from the Li-ion cell testing is obtained and used to validate the circuit
models. The simulated results are compared to the HPPC data and the relative error is
used to rank the model. The article provides a good baseline for the practically feasible
SOC simulation accuracy. Further the paper provides the equations for all the circuit
models under discussion.
Reference [4] shows the use of low fidelity map based models for energy consumption
simulations. High fidelity models are required when the goal is to refine, fine tune or
analyze the effects of the failure of one or more parts in a specific component. For
instance, a high fidelity brake model might be essential to simulate the exact brake
pedal feel, which is useful for improving the brake system effectiveness, ergonomics
and driver comfort. Whereas, our application demands effective simulation of energy
consumption while braking or deceleration, and this is affected only by the braking
torque distribution between the conventional brakes and the regenerative torque from
the electric machine. Therefore the braking system‟s internal dynamics can be assumed
to be ideal.
In Wilhelm et al. [9], various driver behavior models are evaluated under different driving
conditions in order to assess the effects of the driver model on simulation accuracy. It is
claimed that the proposed driver model is capable of estimating fuel consumption with
an average error of 1.9% and 1.5% standard deviation.
After thorough literature research the fidelity required in order achieve the desired
accuracy has been determined. A combination of physics and map-based models is
desirable for achieving decent accuracy with higher simulation speeds.

7
CHAPTER 3 OVERVIEW
3.1 PRETRANSMISSION PARALLEL PLUG-IN HYBRID ELECTRIC VEHICLE
The Wayne State University EcoCAR3 team is developing a Pre-transmission Parallel
Plug-In Hybrid Electric Vehicle architecture for the EcoCAR3 team vehicle as shown in
the figure. Figure below shows the high level P2 Hybrid Electric Vehicle powertrain
architecture of the WSU EcoCAR3 team. The powertrain consists of a GM 2.4L LEA
engine which runs on E85 and a 64kW GKN EVO AF130-4 electric machine coupled
together coaxially. The electric machine is powered by a 10.7kWh energy storage
system from Bosch. A 9.3 gallon fuel tank stores the E85 which is an alternative to the
conventional gasoline.
Figure 2. Pre-transmission Parallel Hybrid Electric Vehicle architecture

8
3.2 WORK FLOW
BASELINE MODEL EVALUATION
USING A COMBINATION OF STOCK VEHICLE TEST DATA AND ELECTRIC COMPONENTS TEST DATA
HYBRID POWERTRAIN MODEL INTEGRATION AND VALIDATION
USING DATA FROM LONG DISTANCE TEST DRIVES USING THE MODIFIED POWERTRAIN
COMPONENT AND SUBSYSTEM LEVEL MODEL REFINEMENT AND VALIDATION
DATA USED: STOCK VEHICLE AND MODIFIED POWERTRAIN TEST DRIVE DATA
STOCK DRIVETRAIN MODEL
DEVELOPMENT AND
VALIDATION
TRANSMISSION
CHASSIS
DIFFERENTIAL
WHEELS
ENGINE MODEL
DEVELOPMENT AND
VALIDATION
STOCK ENGINE
MODEL
DEVELOPEMENT
LEA ENGINE MODEL
DEVELOPMENT
ELECTRIC COMPONENT
MODELS DEVELOPMENT AND
VALIDATION
BATTERY
E-MACHINE
DCDC CONVERTER
Figure 3. Detailed modeling workflow

9
Figure 4. WSU EcoCAR3 Controls Development Cycle
Since most of the components were already integrated and were needed for testing
activities demanded by the controls, mechanical and electrical teams during year 3, the
measurements from test drives performed previously were used to validate the model.
The overview of the plan of work is shown in the Figure 3. The available models and the
data were audited initially. The following data were available as a result of the previous
testing activities performed:
1) Stock vehicle test drive data: CAN logs from test drive of the stock vehicle,
performed during year 2 is available. This is the most accurate test result
available on the stock powertrain. The stock drivetrain components are used in
the hybrid powertrain without any major modifications. Therefore the data from
stock vehicle test drive logs can be used to validate the stock drivetrain
components. A test bench to test the components downstream the torque
converter upto the wheels and a chassis dynamics model can be used to test
ENGINE
MODELING,
REFINEMENT
AND
VALIDATION
10
these components. Moreover, the IC engine model fidelity can be validated using
the stock IC engine parameters and this data. That is the IC engine model is
parameterized to represent the stock IC engine and then validated using the
inputs from the stock vehicle test drive logs. Later the IC engine will be replaced
with the parameters for LEA engine and tested against the modified powertrain
logs once the data is available.
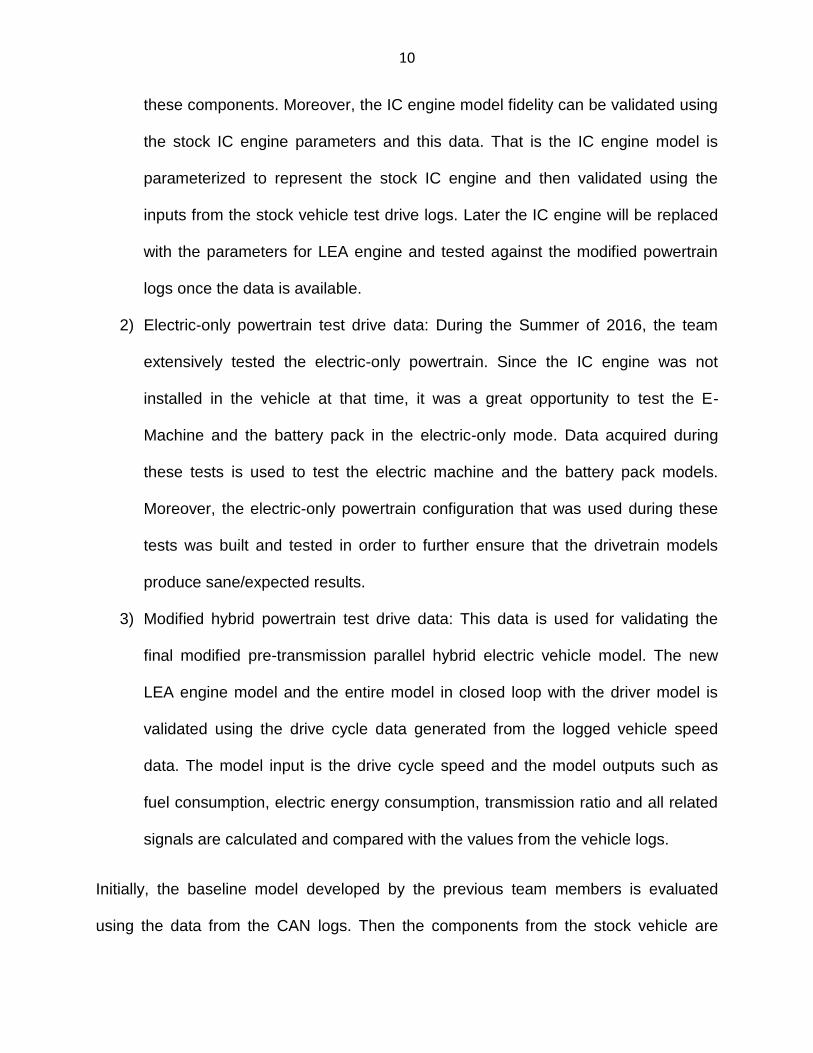
2) Electric-only powertrain test drive data: During the Summer of 2016, the team
extensively tested the electric-only powertrain. Since the IC engine was not
installed in the vehicle at that time, it was a great opportunity to test the E-
Machine and the battery pack in the electric-only mode. Data acquired during
these tests is used to test the electric machine and the battery pack models.
Moreover, the electric-only powertrain configuration that was used during these
tests was built and tested in order to further ensure that the drivetrain models
produce sane/expected results.
3) Modified hybrid powertrain test drive data: This data is used for validating the
final modified pre-transmission parallel hybrid electric vehicle model. The new
LEA engine model and the entire model in closed loop with the driver model is
validated using the drive cycle data generated from the logged vehicle speed
data. The model input is the drive cycle speed and the model outputs such as
fuel consumption, electric energy consumption, transmission ratio and all related
signals are calculated and compared with the values from the vehicle logs.
Initially, the baseline model developed by the previous team members is evaluated
using the data from the CAN logs. Then the components from the stock vehicle are

11
parameterized, refined and validated using data from the stock vehicle test drive.
Models of the E-Machine, battery pack and other electric components newly installed
are developed and validated based on data from electric-only configuration test drive
logs. Finally the refined component models are integrated and validated in closed loop
based on the modified vehicle test drive logs. Later the model is transferred to HIL
platform and validated in the HIL platform with the actual Hybrid Supervisory Controller
hardware in loop with the newly developed and validated pre-transmission parallel
hybrid electric vehicle plant model.
3.3 DATA ACQUISITION
Development and refinement of vehicle plant model involves modeling activities at
component, subsystem and system levels. Though it is ideal to setup component and
subsystem level test benches in order to obtain more accurate measurements, in our
situation this is not very easy because of limited resources. Moreover, most of the
components were already installed in the vehicle during the start of the research work.
Hence removing and reinstalling the components is a very tedious work as it involves
too much manual labor and might interfere with the mechanical and electrical inspection
activities which are equally important. Therefore very practical approaches have been
taken in order to evaluate the model accuracies.
Data acquired using CAN loggers during vehicle test drives are used for validating the
models. Since all the component models send enough information about the component
outputs and inputs this data is sufficient for developing models with sufficient fidelity for
energy consumption simulation. This enables the WSU team to work parallel on multiple
tasks.

12
In some cases, the components were tested separately, that is still installed in the
vehicle but disconnected and disengaged in terms of mechanical and electrical
transmission. For instance, details regarding the Battery Management System (BMS)
startup and shutdown sequence and response to commands were not readily available
from the manufacturers and the information had to be obtained through component
testing. Since the battery pack was already installed in the vehicle, the test had to be
performed in the vehicle. Therefore, the battery pack was electrically isolated and tested
in order to obtain the information needed.
3.4 MODELING PLATFORM
In the initial phases of the controls development process, MIL and SIL are the ideal
platforms suited for the controls code development. Since these platforms avoid the
additional complications arising due to the physical I/O wiring and signal latency which
are a part of the real world, these platforms are ideal for initial code development. Once
the code reaches a sufficient fidelity, then it is time to move on to HIL as it is time to
address the complications arising due to signal latency and other real world failure
scenarios. HIL is a more effective platform for testing the diagnostic functionalities of the
HSC as the test cases can be simulated more accurately. Therefore initially the plant
model is developed in the MIL environment and validated against test data for the
simulation accuracy with minimal complications. Later the MIL model is adapted to the
HIL platform.

13
3.5 TEST BENCH SETUP
Throughout the research work, several virtual test benches were setup in order to
evaluate both the component and system level model accuracy. Though each
component or system test bench is different in terms of the model inputs, outputs and
test data used, the overall topology of the test benches can be basically classified into
two types: 1) Feed forward type test benches for testing component and subsystem
level models and 2) Closed loop system level model test benches.
All the component level and the system level models validations are initially performed
using an open loop/ feed forward test bench. In this setup, the model inputs are
corresponding real world test data acquired during component or vehicle testing. For
instance, the battery pack test bench uses the battery current and ambient atmospheric
temperature measured during component testing as the model input and the model
outputs such as battery voltage and temperature rise due to the current flow is recorded
TEST BENCH
COMPONENT OR SUBSYSTEM MODEL UNDER TEST
MEASURED COMPONENT TEST DATA
COMPARE MODEL OUTPUTS WITH CORRESPONDING COMPONENT TEST DATA
MODEL INPUTS
MODEL OUTPUTS
TEST BENCH
VEHICLE PLANT MODEL UNDER TEST DRIVE CYCLE DATA
COMPARE MODEL OUTPUTS WITH CORRESPONDING TEST DRIVE DATA MODEL
INPUT
MODEL OUTPUTS
Figure 5. Test bench setup

14
and compared with the corresponding component test data. This way we are able to
validate the component or subsystem behavior under the exact same condition as in the
real world component.
The system level model test benches are similar to the actual vehicle plant model. The
actual vehicle plant model is equipped with more measurement tools in order to monitor
and optimize the parameters when working in a closed loop along with the other
component/subsystem models. For the vehicle plant model validations, drive cycle data
and the other environmental factors such as the ambient temperature, atmospheric
pressure and road gradient are the model inputs. The driver model simulates the other
subsystem level model inputs by comparing the drive cycle speed with the actual
vehicle speed, as it would do in the actual drive cycle simulations. The entire simulation
happens in closed loop and no measured data is used as a model input other than the
vehicle speed and the environmental conditions.
3.6 ECOCAR3 HEV PLANT MODEL STATUS
P2_Parallel_MIL_Model_V1.2.slx, hereafter referred to as V1.2 model is the model
developed by the previous EcoCAR3 team members. Though the model contained
significant level of details to start model based development activities, it is not sufficient
and have to be updated as in year 3 more model based testing and development
activities are done. This continuous model update and validation is a routine process in
the EcoCAR series of competitions as the information for modeling the components will
be available only after testing the components. The model developed as a result of this
thesis has been named as P2_Parallel_MIL_Model_Thesis.slx and made available to

15
the EcoCAR3 team members. Table 1 on the following page shows the model status
and improvements from the previous model.
Table 1. HEV plant model status
Models P2_Parallel_MIL_Model_V1.2.slx P2_Parallel_MIL_Model_Thesis.slx
IC Engine
- Mechanical Model Not validated Validated
- Thermal Model Not modeled Not validated
Engine Control Module (ECM)
- ECM I/O model Not validated Validated
- Engine torque control function
model
Not validated Not validated
Battery Management System (BMS)
- Startup/Shutdown function
sequence
Not modeled Validated
- BMS I/O model Not modeled Validated
- Resistance measurement model Not modeled Validated
- Charge and Discharge limits map
model
Not modeled Not modeled
Energy Storage System (ESS)
- Electrical model Not modeled Validated
- Thermal model Not modeled Validated
E Machine (IPMSM)
- Electromechanical model Not modeled Validated
- Thermal model Not modeled Not validated
Motor Control Unit (MCU)
- Torque control model Not modeled Not validated
- MCU I/O model Not validated Validated
- MCU thermal model Not modeled Not validated
Transmission

16
- Mechanical model Not validated Validated
Transmission Control Module (TCM)
- Shift Pattern model Not modeled Validated
- TCM I/O model Not validated Validated
- CAN based gear shift model Not modeled Not modeled
Torque converter model
- Mechanical model Not validated Validated
Differential
- Mechanical model Not validated Validated
Chassis Model
- Physics model Not validated Validated
Fault Insertion Blocks Not modeled Modeled

17
CHAPTER 4 BASELINE MODEL EVALUATION
The baseline model developed by the previous teams is first evaluated. At the beginning
of the year 3 when the baseline model evaluation was performed, the data from the
modified powertrain testing was not yet available. However, due to the Figure 6 and 7
below shows the test bench setup for the baseline model evaluation.
Figure 6. Baseline model evaluation results: Input accelerator pedal position and simulated vehicle speed

18
Figure 7. Baseline model evaluation results: Simulated distance travelled and fuel consumption

19
Figure 8. Baseline model evaluation results: Simulated fuel consumption rate and transmission gear number
20
CHAPTER 5 PLANT MODEL ADVANCEMENT
5.1 DRIVETRAIN, WHEELS AND CHASSIS MODELING
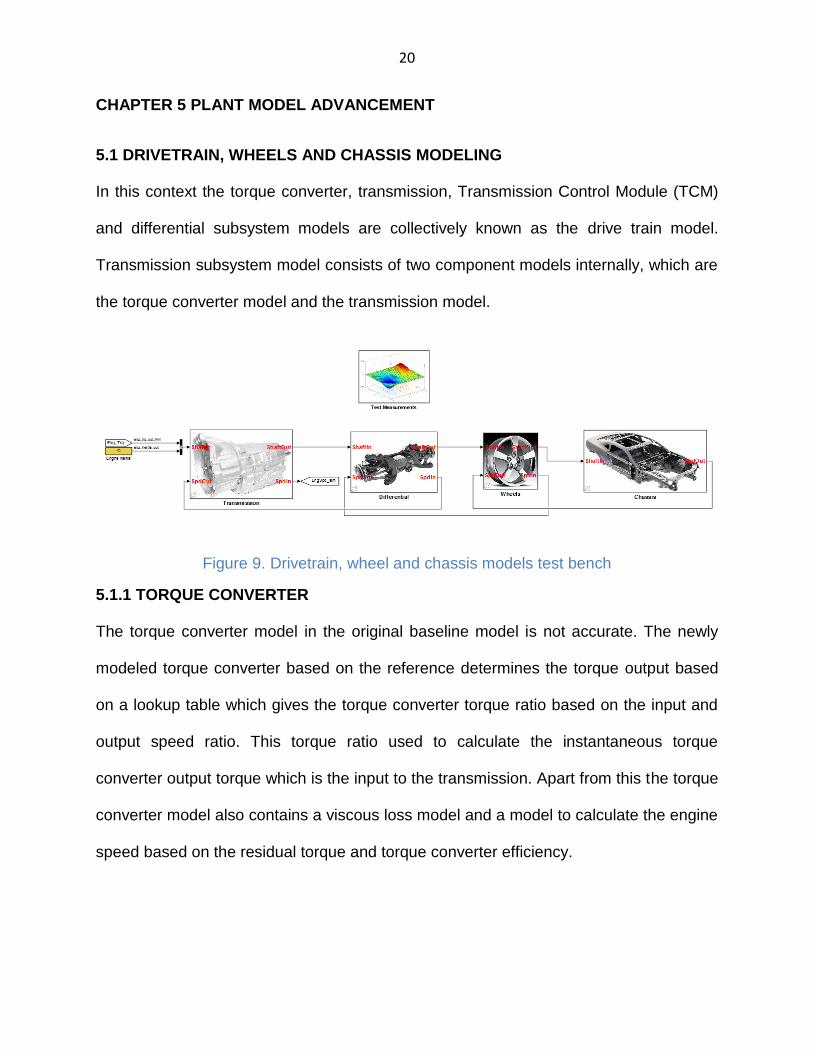
In this context the torque converter, transmission, Transmission Control Module (TCM)
and differential subsystem models are collectively known as the drive train model.
Transmission subsystem model consists of two component models internally, which are
the torque converter model and the transmission model.
Figure 9. Drivetrain, wheel and chassis models test bench
5.1.1 TORQUE CONVERTER
The torque converter model in the original baseline model is not accurate. The newly
modeled torque converter based on the reference determines the torque output based
on a lookup table which gives the torque converter torque ratio based on the input and
output speed ratio. This torque ratio used to calculate the instantaneous torque
converter output torque which is the input to the transmission. Apart from this the torque
converter model also contains a viscous loss model and a model to calculate the engine
speed based on the residual torque and torque converter efficiency.

21
5.1.2 TRANSMISSION
The transmission model simulates the transmission output torque based on the gear
ratio selected by the Soft TCM model and the transmission frictional and viscous losses.
The transmission losses were initially not parameterized to represent the current vehicle
accurately. Therefore a new model which simulates the transmission losses based on
the output speed has been developed and optimized. The original model was super
efficient, that in other terms the simulated losses were lower than in the real vehicle.
The formulas from the original model have been retained with minimal modifications.
5.1.3 WHEELS
The wheel model calculates the wheel rolling resistance. Later the resultant of the linear
force acting on the wheels due to rolling resistance and the wheel input torque is output
as the wheel output force to the chassis model. The baseline model parameters, that is
the coefficients of rolling resistance were incorrect and have been replaced with the
data from manufacturers.
5.1.4 CHASSIS
Chassis Model simulates the force acting on the vehicle which is a resultant of the air
drag, linear vehicle inertia, resistance due to grade and wheel output force and
calculates the rate of acceleration at any instant, instantaneous velocity of the vehicle,
distance travelled, wheel slippage and other associated functions. The model input is
the horizontal wheel force. The model output is the linear velocity of the vehicle. The
vehicle mass and the vehicle frontal area values were incorrect and data from the
manufacturers is used.

22
5.1.5 SOFT TCM
The Soft TCM model simulates the transmission shift behavior based on the shift lever
position, vehicle speed, APP and BPP. The baseline TCM model contained assumed
shift pattern data based on a six speed transmission. The transmission shift pattern has
been updated with the data from manufacturers. Figure 10 below shows the
transmission gear numbers simulated during the transmission testing.
Figure 10. Soft TCM output validation results
5.1.5 DRIVETRAIN, WHEEL AND CHASSIS COMPONENT MODELS VALIDATION
Since the drivetrain from the stock vehicle is used as such, except for minor
modifications to the propeller shaft, the CAN data from the stock vehicle test drive
recorded by the previous teams have been used to optimize and validate these models.
The original transmission and differential models were not parameterized to reflect the
mechanical transmission losses of the stock vehicle accurate enough. The difference in
the simulated vehicle speed produced during baseline model evaluation and the actual
vehicle speed logged during on-road testing can be seen in the figure 11 below. The
difference in the simulation is due to the lack of an accurate transmission losses model.
23
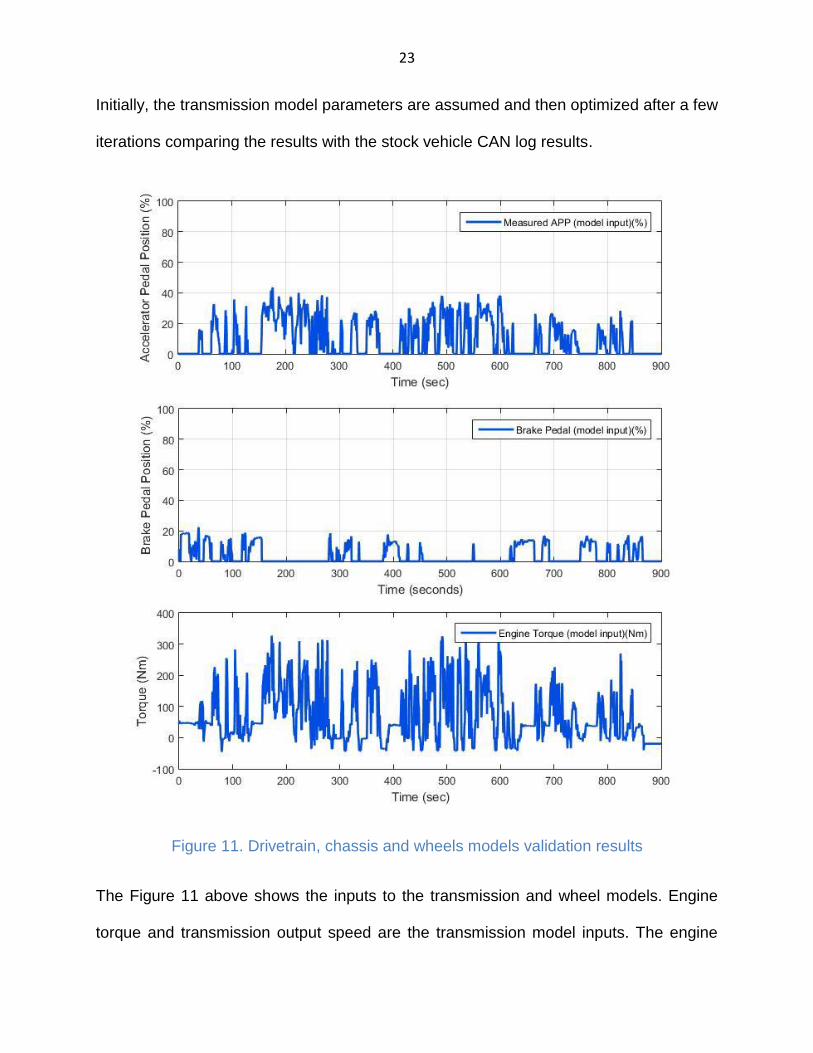
Initially, the transmission model parameters are assumed and then optimized after a few
iterations comparing the results with the stock vehicle CAN log results.
Figure 11. Drivetrain, chassis and wheels models validation results
The Figure 11 above shows the inputs to the transmission and wheel models. Engine
torque and transmission output speed are the transmission model inputs. The engine

24
torque data from the measured stock vehicle CAN logs is used in place of the output
from the engine model. APP is an input to the Soft TCM model which determines the
transmission shift pattern and the BPP is an input to the brake model which is inside the
wheel subsystem model.
Figure 12. Drivetrain, chassis and wheels models validation results
25
5.3 IC ENGINE MODEL
5.3.1 MODEL ADVANCEMENT
An IC Engine plant model with a mean value manifold filling dynamics model as shown
in [10] and map based torque, fuel consumption and emissions models is desirable
fidelity for achieving accurate energy consumption simulation. The baseline model did
not contain a manifold dynamics model and hence the simulated fuel consumption was
far lower than the actual under closed loop testing and too high during open loop or feed
forward testing.
IC Engine plant model currently developed consists of a manifold dynamics model used
to calculate the manifold absolute pressure based on the throttle position and the
engine speed. The output of this model is used to calculate the mass air flow into the
combustion chamber using the Speed-Density equation [10], [11]. The volumetric
efficiency of the engine is obtained from a lookup table based on the engine speed and
the manifold absolute pressure. The dynamic engine torque is obtained from a lookup
table based on the engine speed and the mass air flow into the engine. Later engine
torque and engine speed are used to obtain the dynamic fuel consumption and
emission values from lookup tables containing data from the manufacturer.

26
Figure 13. IC Engine intake manifold flow dynamics model
Equations used to calculate manifold air flow and manifold absolute pressure:
𝑚𝑖 = 𝑁 ∗ 𝑉𝑑𝑖𝑠𝑝 ∗ 𝑃𝑚𝑎𝑝 ∗ 𝜂𝑣𝑜𝑙
2 ∗ 𝑅 ∗ 𝑇𝑎𝑚𝑏
Eq 1
𝑃𝑚𝑎𝑝 = 𝑅𝑇𝑖𝑉𝑚𝑎𝑛
−𝑚𝑖 + 𝑚𝑡 + 𝑃𝑚𝑎𝑝 (𝑇𝑖
𝑇𝑖)
Eq 2
𝑚𝑡 = 𝑇𝐶𝐴 ∗ 𝐶𝑑 ∗ 𝑃𝑎𝑚𝑏 ∗ 𝐾′
𝑅𝑇𝑎𝑚𝑏∗ 𝛽2 𝑚𝑎𝑝 + 𝑚𝑡0
Eq 3
𝐾 ′ = 2𝐾/(𝐾 − 1) Eq 4
𝛽2 𝑚𝑎𝑝 =
𝑃𝑟
2/𝐾− 𝑃𝑟
(𝐾+1)/𝐾, 𝑖𝑓 𝑃𝑟 ≥
2
𝐾 + 1
𝐾𝐾−1
1
𝐾′
2
𝐾 + 1
𝐾+1𝐾−1
, 𝑜𝑡𝑒𝑟𝑤𝑖𝑠𝑒
Eq 5
𝑃𝑟 = 𝑃𝑚𝑎𝑝𝑃𝑎𝑚𝑏
Eq 6

27
Where,
𝑚𝑡 = instantaneous air mass flow past throttle plate (kg/sec)
𝑚𝑡0 = previous air mass flow past throttle plate (kg/sec)
𝑚𝑖 = instantaneous air mass flow into intake port (kg/sec)
𝑃𝑚𝑎𝑝 = absolute manifold pressure derivative (N/m2)
𝑃𝑚𝑎𝑝 = absolute manifold pressure (N/m2)
𝑃𝑎𝑚𝑏 = ambient pressure (N/m2)
𝑇𝑖 = intake manifold temperature (K)
𝑉𝑑𝑖𝑠𝑝 = Engine displaced volume (m3)
𝑉𝑚𝑎𝑛 = manifold + port passage volume (m3)
𝑅 = ideal gas constant
𝐾 = ratio of
𝑇𝐶𝐴 = throttle effective area, (m2)
𝑇𝑎𝑚𝑏 = ambient temperature, (K)
𝐶𝑑 = coefficient of discharge
𝜂𝑣𝑜𝑙 = engine volumetric efficiency
𝑁 = engine speed, rad/sec
28
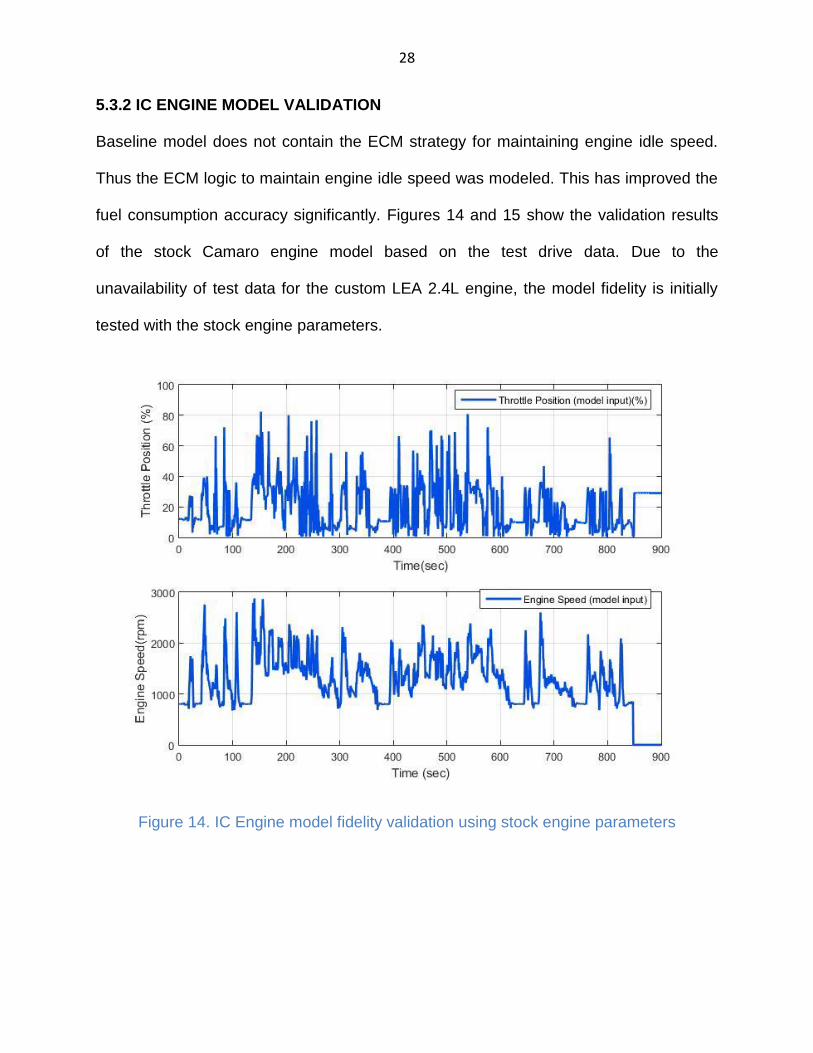
5.3.2 IC ENGINE MODEL VALIDATION
Baseline model does not contain the ECM strategy for maintaining engine idle speed.
Thus the ECM logic to maintain engine idle speed was modeled. This has improved the
fuel consumption accuracy significantly. Figures 14 and 15 show the validation results
of the stock Camaro engine model based on the test drive data. Due to the
unavailability of test data for the custom LEA 2.4L engine, the model fidelity is initially
tested with the stock engine parameters.
Figure 14. IC Engine model fidelity validation using stock engine parameters

29
Figure 15. IC Engine model fidelity validation using stock engine parameters

30
Figure 16. IC Engine model fidelity validation using stock engine parameters
Now, the model parameters are updated with the LEA2.4L engine parameters provided
by the manufacturer and simulated. The simulation outputs are compared with the data
from on-road testing of the vehicle with newly developed power train in engine-only
mode. Figure 17. shows the validation results of the modified LEA 2.4L engine based
on test data from on-road testing.

31
Figure 17. LEA engine model validation results
5.4 DRIVER MODEL
Key position, accelerator pedal, brake pedal and shift lever position are the inputs
needed from the driver for normal driving. Modeling the driver behavior involves many
factors including but not limited to road quality, turns, weather and driver psychology as

32
shown in the [12], [9]. However for drive cycle simulations to calculate vehicle energy
consumption the environmental data for simulating the vehicle dynamics are not
available.
5.5 E-MACHINE MODEL
5.5.1 MODEL DEVELOPMENT
The E-Machine used in EcoCAR3 is GKN EVO AF130-4, an Internal Permanent Magnet
Synchronous Electric machine (IPMSM). The sponsor donated electric machine is
controlled by a Rinehart PM150DX Electric machine Control Unit (MCU), which will be
discussed in a later section. A map based E-Machine model has been used to
accurately simulate the IPMSM energy consumption at any point of the simulation.
Since the purpose of the model is only to simulate the electric machine‟s energy
consumption two maps defining the electric machine‟s peak torque curve and the
electric machine‟ efficiency map are used to calculate the electric current consumed and
the mechanical torque produced at any instant of the simulation with the following
formulas. Figure 18 shows a view of the map based electric machine model.
Figure 18. Inside the E-Machine model

33
In the efficiency map (Figure 19) produced using data from the manufacturers, it can be
seen that at many points the electric machine‟s efficiency is zero. Though theoretically
0% efficiency is possible, the calculated electrical energy consumption cannot be infinite
practically. Thus a value of 1% has been assumed to be the lowest possible efficiency
in order to simulate logical values of electrical energy consumption at very low speed
and torque regions. The inverter efficiency was modeled to be constant following data
from the Rinehart document.
Figure 19. GKN EVO AF130-4 IPMSM efficiency map
Equations Used:
𝑃𝑚𝑒𝑐 =2𝜋𝑁𝑇
60
Eq7
𝑃𝑒𝑙𝑒𝑐 =
𝑃𝑚𝑒𝑐 𝜂𝑚𝑜𝑡 (𝑁,𝑇) ∗ 𝜂𝑚𝑐𝑢
, 𝑤𝑒𝑛 𝑚𝑜𝑡𝑜𝑟𝑖𝑛𝑔
𝑃𝑚𝑒𝑐 ∗ 𝜂𝑚𝑜𝑡 (𝑁,𝑇) ∗ 𝜂𝑚𝑐𝑢 , 𝑤𝑒𝑛 𝑟𝑒𝑔𝑒𝑛𝑒𝑟𝑎𝑡𝑖𝑛𝑔
Eq 8
𝑖𝑚𝑐𝑢 =𝑃𝑒𝑙𝑒𝑐𝑉𝑏𝑎𝑡
Eq 9

34
Where,
𝑃𝑚𝑒𝑐 = Mechanical Power (W)
𝑃𝑒𝑙𝑒𝑐 = Electrical Power (W)
𝜂𝑚𝑜𝑡 (𝑁,𝑇) = Instantaneous IPMSM Efficiency based on electric machine speed and
torque (%)
𝜂𝑚𝑐𝑢 = Rinehart MCU Efficiency (%)
𝑖𝑚𝑐𝑢 = Instantaneous DC current consumed by the inverter (A)
𝑉𝑏𝑎𝑡 = Instantaneous battery voltage (V)
𝑁 = Electric machine speed (rpm)
𝑇 = Electric machine torque (Nm)

35
5.5.2 E-MACHINE MODEL VALIDATION
Figure 20. E-Machine model validation results
36
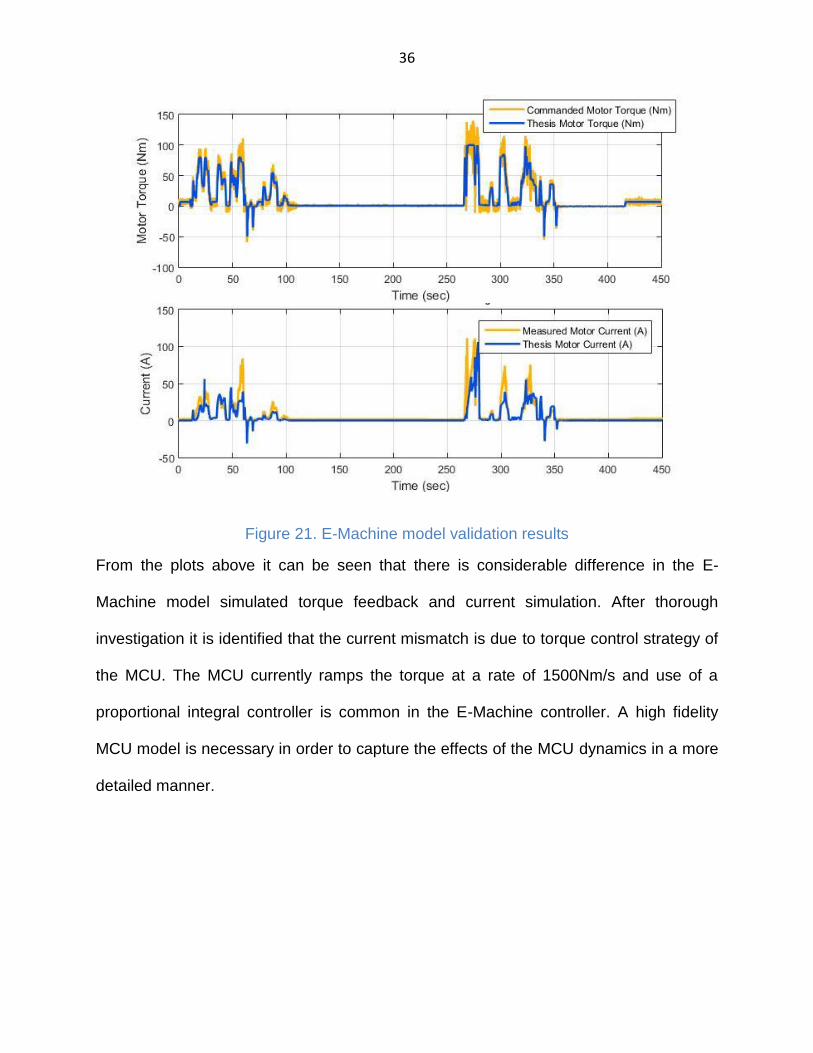
Figure 21. E-Machine model validation results
From the plots above it can be seen that there is considerable difference in the E-
Machine model simulated torque feedback and current simulation. After thorough
investigation it is identified that the current mismatch is due to torque control strategy of
the MCU. The MCU currently ramps the torque at a rate of 1500Nm/s and use of a
proportional integral controller is common in the E-Machine controller. A high fidelity
MCU model is necessary in order to capture the effects of the MCU dynamics in a more
detailed manner.

37
5.6 ENERGY STORAGE SYSTEM (ESS) MODEL
The Energy Storage System used by the team is a Li-ion battery pack from Bosch.
Quasi-static circuit model of the pack is needed for obtaining accurate SOC prediction
during drive cycle simulation. More accurate models based on battery electrochemistry
can be developed but at the cost of simulation time. A Thevenin circuit model is
developed after confirming its prediction accuracy through previous research work [8].
Though DP model is marginally more accurate than Thevenin circuit model, considering
time allocation for the model and amount of work required to optimize the parameters
the later is used.
Figure 22. Equivalent circuit model of a single Li-ion cell
Lookup tables are used to determine the dynamic battery open circuit voltage,
resistance and capacitance values based on the SOC and cell temperature. These
parameters were identified based on the Li cell HPPC test data provided by the
manufacturer. The Simulink parameter optimization tool was used effectively to
automate the parameter optimization process. These values are used to calculate the
instantaneous cell output voltage based on SOC and cell temperature. Later the cell

38
voltage is scaled to the pack voltage. Figure shows a single Li-ion cell equivalent circuit
model which has been modeled and parameterized based on input from Bosch.
Equations used:
𝑉𝑐𝑒𝑙𝑙 = 𝑉𝑜𝑐(𝑆𝑂𝐶) − 𝑉𝑑𝑟𝑜𝑝 Eq 10
𝑉𝑑𝑟𝑜𝑝 = 𝑖𝑐𝑒𝑙𝑙 ∗ 𝑅1(𝑆𝑂𝐶 ,𝑇) + 𝑉𝑡 Eq 11
𝑉𝑡 = 𝑖𝑐𝑒𝑙𝑙𝐶
−𝑉𝑡0
𝑅2(𝑆𝑂𝐶 ,𝑇) ∗ 𝐶
Eq 12
𝑄 = 𝑉𝑑𝑟𝑜𝑝 ∗ 𝑖𝑐𝑒𝑙𝑙 Eq 13
Where,
𝑉𝑐𝑒𝑙𝑙 = cell voltage in V
𝑖𝑐𝑒𝑙𝑙 = cell current in A
𝑅1 𝑆𝑂𝐶 ,𝑇 , 𝑅2(𝑆𝑂𝐶 ,𝑇) = Instantaneous Li-ion cell internal resistances with respect to SOC
and temperature in Ohms
𝐶 = cell capacitance in F
𝑉𝑜𝑐(𝑆𝑂𝐶) = open circuit voltage corresponding to the current SOC V
𝑄 = heat generated in the battery cell in J

39
Figure 23 below shows the component level validation results of the battery pack. The
HPPC test data from Bosch is used to test the Li-ion cell model. The figure 25 shows
the validation results of the battery pack.
Figure 23. Single Li-ion cell model validation results

40
Figure 24. Single Li-ion cell model validation results
The figures 23 and 24 show the results of Li cell model testing. As seen the simulated
voltage and temperature values are considerably accurate and correlate with the test
data. A large difference can be seen in the voltage prediction because of the sudden
change in the battery voltage at low charge condition. Hence more data points are
needed for low battery SOC voltage simulation. The battery SOC at the point of major
error was around 10%. Since we never expect to go below 15% SOC which is the
manufacturer‟s recommendation, the current model accuracy is sufficient for predicting
the energy consumption. The figure 25 below shows the battery pack validation results.
Figure 25. Battery pack model validation results
41
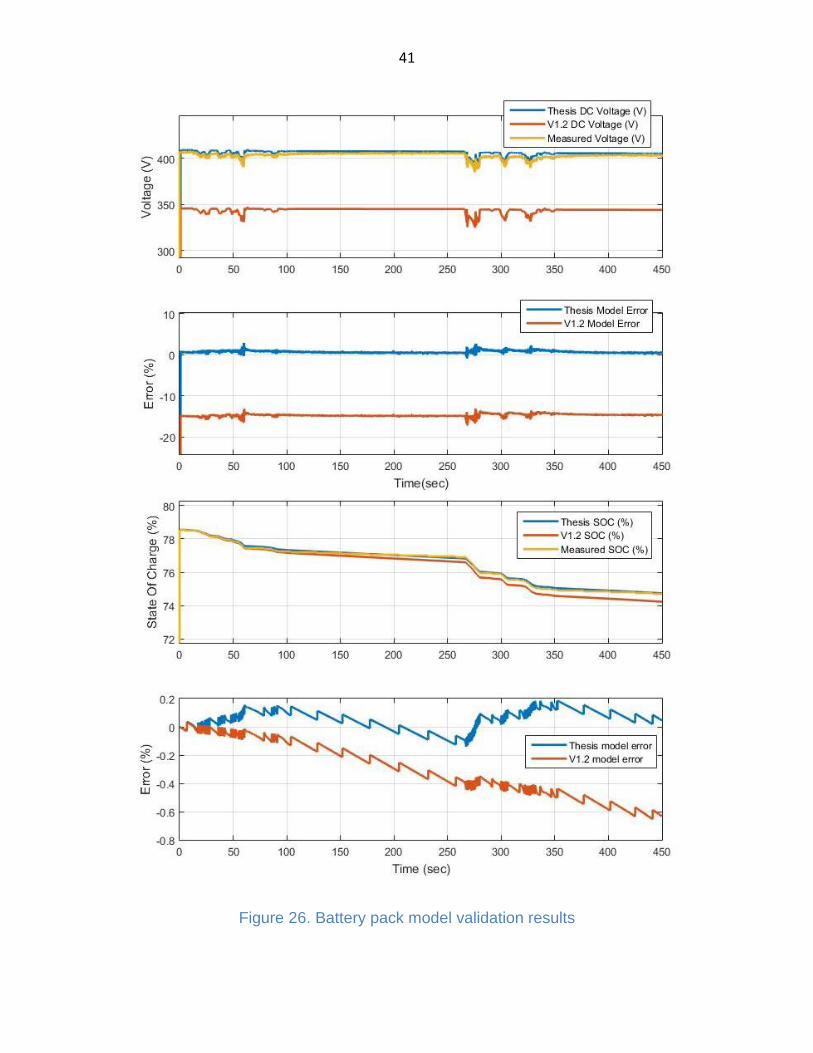
Figure 26. Battery pack model validation results

42
Figure 27. Battery pack model validation results
Significant improvement in the SOC and voltage prediction accuracy can be seen from
the previous model. SOC prediction error has been reduced to 0.2% peak for the given
drive cycle, whereas the previous model‟s accumulated error is around -0.6%. Voltage
prediction accuracy improved significantly because the V1.2 model was not
parameterized correctly and contained assumed parameters from another battery pack.
Also note that the voltage prediction directly impacts current consumption as the electric
machine model uses the voltage output of the battery to calculate the current
consumption and this is feedback directly. Therefore any inaccuracy in voltage
prediction will result in a huge difference in the overall energy consumption simulation.
43
5.6 ACCESSORY LOADS MODEL
Accessory load model includes AC Compressor, electrical actuators, Soft ECU loads
and LV electrical equipment such as the instrument cluster on the vehicle dashboard.
Due to insufficiency in time to test every individual electrical component and develop a
model, a constant accessory loads model is currently assumed. At present, the model
does not account for the AC compressor load. Though this is desirable, more testing is
needed before the AC compressor dynamic load model can be updated. Current
consumption of the DCDC converter has been assumed to 3A in the current model [12].
5.7 SOFT BMS MODEL
Lithium ion batteries have gained popularity over the past decade due to its superior
power ratings and capacities, when compared to the other popular battery chemistries.
Though Lithium ion batteries are used in many production EVs and HEVs, they still are
known for their unstable nature beyond the safe operating limits. To address the safety
concerns of the battery pack which may arise due to overcharge, over-discharge,
battery internal or external short circuit or ground fault the manufacturer has
implemented a Battery Management System (BMS) which continuously monitors the
pack and controls the pack output contactors based on the HSC request and charge or
discharge current limits. In order to develop the HSC code to control the BMS, it is ideal
to have a Soft BMS model with all the functionalities of interest.
The main functions of the BMS are: to monitor the battery SOC, terminal voltage,
current and temperature and check if these values are within limits; detect battery
internal failure or ground fault; and communicate the battery status to the other
components such as the HSC. The BMS continuously sends information about the

44
maximum dynamic charge and discharge current limits based on the battery‟s condition
over the CAN. It is essential to maintain the current consumption within this range. If the
battery output current exceeds this range the BMS will open contactors without further
notice as a safety measure to prevent significant damage to the battery and the user.
The dynamic charge limit is mapped by monitoring the current limit signal from the BMS
while charging the battery. The discharge limit is mapped based on data obtained
during on-road test.
Since details about the BMS behavior to the command signals are not provided, the
BMS was tested and the startup, shutdown and most of the safety critical functionalities
are studied and a moderate fidelity Soft BMS model has been developed based on the
component testing.
5.8 SOFT MCU AND SOFT BCM MODELS
These models have been retained from the V1.2 model developed during the previous
years. Except for a few minor changes such as inclusion of a saturation block in the
MCU to simulate the MCU‟s internal torque limit functionality which cannot be accessed
through CAN signals. Since the clutch model was removed during year 3, the clutch
model functionality which was modeled along with the MCU model by the previous team
members was removed. The peak torque and continuous torque maps were updated
with the latest data from the manufacturers.

45
CHAPTER 6 FULL VEHICLE MODEL VALIDATION
Data from hybrid electric vehicle testing has been used to validate the model simulation
accuracy. Since the drive cycle has to be long enough to estimate the model accuracy
level, the only two sets of test data are available to validate the model accuracy. The
newly developed thesis model simulation results clearly show significant improvements
in fuel consumption and State of Charge (SOC) prediction accuracy. Table below shows
the average prediction error values for the fuel consumption and state of charge
simulations.
Table 2. Full vehicle model validation results
Thesis model error V1.2 model error
Average fuel consumption
error
-5.5% -27.2%
Average State Of Charge
error
-2% -26.55%
Average distance travelled
error
-0.7% -0.4%
Despite significant improvements in the accuracy of the energy consumption simulation,
the model still has errors. As discussed earlier, the stock vehicle model has been
validated with stock vehicle test drive data. So, the possibility of increased vehicle
resistance due to modified powertrain and mechanical assembly issues are being
investigated. The brakes have not been calibrated recently and since we have had
significant number of Diagnostic Trouble Codes from the ABS system in the past,

46
calibration issues with the ABS is suspected. Moreover, misalignment in the Torque
Converter or coupling shaft can produce more resistance. A quick fix for this issue is to
recalibrate the model efficiency and losses to match the current powertrain. However,
this is undesirable and will be fixed before moving further.
6.1 HYBRID MODE VALIDATION RESULTS
The results of vehicle tests in Hybrid mode are used to validate the model. The HSC
was in charge sustaining mode during the test. Figure 28 shows the drive cycle, fuel
consumption and SOC simulation vs. test result plots for the drive cycle derived from
the CAN logs.

47
Figure 28. Full vehicle model CS mode validation results

48
Figure 29. Full vehicle model CS mode validation results
Since the HSC model keeps changing due to testing requirements, the command signal
sent from the HSC to the E-Machine or engine cannot be modeled very accurately
without the knowledge of the model used during testing. Hence one of the inputs is fed
to the model from the CAN logs. In this case, the Motor Torque command is fed from
the CAN signal from the Rinehart MCU recorded in the logs. Whereas, the Accelerator
Pedal Position Input to the Engine goes from the Driver model which is in a closed loop.

49
The simulated engine torque is lower than the measured engine torque for majority of
the time. Though the drivetrain losses model has been validated thoroughly based on
stock vehicle data, the modified vehicle losses are higher than the stock vehicle. Due to
this the engine torque needed to reach the vehicle speed is higher than in the stock
vehicle. Therefore the model has to be parameterized to account for the new
modifications made. The details of this issue are still being investigated and will be
studied in the future.
Similarly the deviation in the fuel consumption simulation accuracy is partly due to the
lower torque production in the engine. Since the fuel consumption map is based on
engine torque and the mass air flow rate calculated by the manifold dynamics model,
the reduction in APP request directly impacts the fuel consumption too.

50
6.2 ENGINE ONLY MODE VALIDATION RESULT
Figure 30. Engine-only mode validation results
During Engine-only mode the simulated results the SOC simulation accuracy in both
models are significantly comparable as the electrical losses are negligible. Again the
difference in the fuel consumption is due to the additional losses in the modified
powertrain, which was not witnessed earlier. This will be accounted for in the future.

51
CHAPTER 7 HIL SETUP
Economic and safety factors have been vital in promoting the use of HIL as a testing
platform for controls development. HIL validation reduces the testing time significantly
as the code reaches satisfactory level of maturity during HIL simulation, thereby
allowing us to do final code refinements and during vehicle testing. However, the model
fidelity is the determining factor in HIL simulation. Figure 31 below shows the HIL setup
for validating the EcoCAR3 team‟s Hybrid Supervisory controller functionalities.
Figure 31. HIL Setup
The HIL setup has been carefully designed in order to replicate the actual vehicle in
every possible aspect. Accuracy of the plant model and the HIL physical setup, which
are the two main factors governing the validity of the HIL simulation has been

52
considered and constantly improved as per testing requirements. Plant model accuracy
is improved by validating the individual component models with data obtained from
manufacturers and obtained through various component tests.
Figure 32. HIL Layout

53
7.1 HARDWARE AND SOFTWARE TOOLS
7.1.1 COMPONENTS UNDER TEST
ETAS ES910.3 is our HSC hardware in EC3 and consists of 2 CAN terminals. This
along with the 2 CAN terminals on ES921.1 CAN extension module makes up for the
four CAN terminals needed for the HSC. The ES930.1 consists of the analog and digital
I/Os which are controlled by the HSC. The HSC code for the module is developed using
the INTECRIO block set in Simulink and compiled. The compiled code in .a2l format is
then flashed to the device using INCA.
Figure 33. ETAS Modules and the Axiomatic output controller
Axiomatic Output Controller (additional IO expansion device): Axiomatic Output
Controller (AX021210) is used to simulate Digital IOs. The device which communicates
with the HSC using Low speed CAN at 250kbps, can be controlled using a CAN
message. Each signal bit of this message controls one digital output. The technical
document on the Axiomatic output controller is “TDAX021210.pdf”. The dbc file
containing the CAN message ID and output signals is “Axiomatic-output.dbc”.
ETAS INCA is the software tool used to configure the ETAS ES910.3 Rapid Prototyping
module. Axiomatic output controller does not need any software setup and just executes
the CAN signal commands sent through a particular message ID.

54
7.1.2 COMPONENTS SIMULATING THE VEHICLE
Figure 34. dSPACE Midsize Simulator (left); Vector VN8910A (right)
The dSPACE DS1006 processor based Mid-Size simulator in the EC3 garage is made
up of a DS2202 I/O board, which is a low cost alternative to the standard DS2211 I/O
board mentioned in most of the technical documents. Though there are minor
differences between the two I/O boards, the DS2202 is sufficient for the testing activities
performed by the team.
Vector VN8910 (with four CAN piggyback modules): This is a CAN measurement device
with standalone operation capability. The HSC uses four different CAN buses to
communicate with the real vehicle. The WSU EcoCAR3 team‟s HIL simulator has only
two CAN terminals. The VN8910A is used to gateway messages from the one CAN
terminal of dSPACE to two CAN terminals of the HSC.
ControlDesk and AutomationDesk were used to configure and load the plant model to
the dSPACE midsize HIL simulator. Vector CANoe is used to setup the VN8910A
gateway and measurement configuration successfully. Screenshots of the software
configuration windows can be found in the Appendix.

55
7.3 HIL SETUP CHALLENGES
The main challenges faced with the HIL setup are managing signal latency, message ID
conflict issues and bandwidth limitation issues while gatewaying messages from the
CAN2 bus output of dSPACE to the three CAN buses of the ETAS module using the
Vector VN8910A interface module. To reduce signal latency and increase the
bandwidth, the baud rate of the EBHVAD_CAN bus is increased to 1000kb/s. This way
the messages are transmitted in almost half the time to the Vector module and since
most of the messages are cyclic, the bus offered sufficient bandwidth for transmission of
triggered DTC messages. Figure 32 shows a schematic layout of the current HIL setup,
whereas the shows a detailed wiring diagram of our HIL setup, which will be used once
more functionalities are added to the current model.
Message ID conflicts which occurred due to queuing messages from two CAN channels
through EBHVAD_CAN are dealt by simulating the conflicting messages under different
IDs in EBHVAD_CAN and then gatewaying them with the respective original message
IDs in the EB_CAN and HV_CAN respectively. For example, the HSC transmits
messages with the same ID 0x3A6 on both EB_CAN as well as HV_CAN. One of these
two conflicting messages with the same ID is transmitted as 0x78E while merging the
two CAN channels on the EBHVAD_CAN, in order to avoid ID conflicts. ADAS_CAN is
not configured at this point, but a CAN port on the Vector module is allocated to add it in
the future.

56
7.3 MODEL PORTABILITY
MIL, SIL and HIL portability is an important aspect of any vehicle plant model that is
intended for use in software development. Simple factors such as model signal names,
data type conversions could matter a lot when changing platforms. The thesis model is
developed such that the model can be easily transferred between MIL and HIL
platforms. Since version control systems are not used by the team, the model has to be
updated manually and hence specific instructions are given to the team members on
updating the model. If a new signal is added the signal is added in HIL first and
transferred to the MIL model. New functionalities are added in MIL tested before
transferring to HIL. This way the model is made consistent across all platforms.
7.4 HSC DIAGNOSTICS TESTING IN HIL
The HIL system has been used extensively for testing the HSC functionality for several
possible fault scenarios that were identified through DFMEA. Once the appropriate fault
is inserted the Supervisory Controller‟s performance has been validated in MIL
environment, the model is transferred to the HIL platform. The HSC software is then
flashed in the ETAS and the plant model is compiled and loaded on the dSPACE and
the fault insertion control variables are controlled through INCA.
7.4.1 COMMON FAULT SCENARIOS
The fault scenarios tested in HIL can be broadly classified into:
1) Signal out of range fault: When the input signal is not in the logical range. This
can occur due to two reasons: 1) if there is a fault in the wiring, the external noise
can produce such issues, 2) if the component producing the signal is

57
malfunctioning. Example: pedal position out of range fault, shift lever position out
of range fault,
2) Signal redundancy check fault: For critical inputs from driver such as accelerator
pedal position, two sensors are used for redundancy checks. The signal
redundancy check is essential in order to see if the sensor wired to the HSC is
functioning properly.
3) Signal over limit fault: When the component signals are over the recommended
limits. This may be similar to out of range faults, except for the fact that the range
here is defined based on engineering knowledge and manufacturer
recommendation. Example: over voltage fault, over current fault, over
temperature fault, over speed fault and high voltage battery ground fault
detection.
4) Command and feedback mismatch fault: When a HSC request or command is
not acknowledged by the respective component. Example: Motor Torque
mismatch and Engine Torque Mismatch
These faults can occur due to multiple reasons. However the HIL system should be
capable of producing these faults in order to sufficiently test the Hybrid Supervisory
Controller functionalities under these scenarios.
7.4.2 FAULT INSERTION IN HIL
There are two ways to insert fault in the current HIL setup: 1) Hardware fault insertion
through the Fault Insertion Unit provided on the dSPACE HIL system and 2) Model fault
insertion using the fault insertion variables as done during MIL testing. The choice of
fault insertion method depends on the test performed. Model based fault insertion has

58
been used extensively and it is sufficient for testing the fault scenarios tested by the
team.
7.4.3 HSC DIAGNOSTICS HIL VALIDATION RESULTS
Below are the HIL testing results for over voltage fault detection and mitigation
functionality of the Hybrid Supervisory Controller.
Figure 35. HSC over volt fault diagnostics testing in HIL

59
The fault was inserted in the voltage output signal from the energy storage system
model using a fault insertion block. The fault values are set in HIL model using Simulink
and when the model is compiled and loaded on to ETAS the fault is triggered at a preset
time as modeled in the fault insertion lookup table. In this case the fault is inserted at
approximately 340sec from the start of the simulation. The fault can be inserted
manually using a variable in the ControlDesk environment too, but the former method is
preferred as it is easier for automation.
The current HSC mitigation strategy for over volt fault detection is to turn off the high
voltage system, which means the electric machine will not be functional anymore. It is
clear from the plot that the electric system status (E System Status) switches to zero as
soon as the Over-volt fault is detected. Therefore the HSC switches from the Hybrid
Charge Depleting mode of operation to Engine-only safe mode in order to ensure
safety. There are three levels of over volt fault and this is just the result of lowest level of
fault, wherein the battery voltage is within limits for safe operation of the battery, but the
voltage is higher than the recommended MCU input voltage. More HSC diagnostic
functionalities have been tested and some of these test results can be found in the
Appendix.

60
7.5 E and EC DRIVE CYCLE HIL TESTING RESULTS
The table and figure 36 below shows the screenshot of the E and EC drive cycle HIL
simulation results recorded using ControlDesk software.
Table 3. E and EC HIL Simulation Results
Vehicle Electric Energy Consumption, CD
mode
207.36 Wh/km
Vehicle Fuel Energy Consumption, CD mode 329.15 Wh/km
Vehicle Fuel Energy Consumption, CS mode 775.9Wh/km
Figure 36. E and EC HIL simulation results
CD mode
CS mode

61
Figure 37. E and EC HIL simulation results
Though the same models were used in both SIL and HIL simulations, it can be seen
that the Battery SOC keeps dropping even in the Charge Sustaining mode. This
behavior was not noticed in SIL and might be because of the CAN signal latency. This is
being investigated and will be resolved in the future. However, this issue unraveled a
flaw in the controls code, which helped us fix it before going to the final competition. The
Hybrid Supervisory Controller functionality to prevent battery discharge beyond 15%
was not modeled correctly. It was never noticed in MIL or SIL environments as this
issue never happened in those platforms. However in HIL after this issue happened the
software has been revised to account for this scenario.

62
CHAPTER 8 RECOMMENDATIONS BASED ON RESEARCH
8.1 CHARGE AND DISCHARGE CURRENT LIMITS (SOFT BMS)
Due to the lack of information on the battery pack behavior, the current model does not
contain accurate charge and discharge limits map. These are important in order to
simulate the BMS behavior while driving. Without enough details any hybrid strategy
that is developed based on these maps is unreliable. The hybrid supervisory controller
has been programmed to stay within the limits sent through the CAN signals from the
battery pack. In the real world if these limits are crossed, the BMS will open contactors
in order to prevent damage. Without having a better idea of these charge and discharge
maps, model based controls optimization is impossible. The results of a controls code
developed based on assumed values may differ significantly from real world testing
results.
8.2 DYNAMIC ACCESSORY MODELS
Accessory loads include cooling pump, AC compressor, component ECUs and other
stock vehicle electrical and electronic components that draw power from the 12V
battery. [12] shows that accessory loads contribute to a significant part of the energy
consumed in a HEV. Therefore model accuracy will significantly improve the Energy
consumption prediction of the model. Since on-road test data with the current thermal
loops and accessories was not available until recently, the accessory load models have
been assumed to consume constant power irrespective of the operating mode and the
cooling required. In the future more data will be available from test drive at the GM‟s
Milford Proving Ground, which can be used to develop and optimize a dynamic
63
accessory load model. Map based models offer sufficient fidelity for cooling pumps, AC
compressor and the Inverter.
8.3 SIMULATION STEP SIZE
The finalized code was tested with the same drive cycle, application and hardware
settings, but different solver configuration settings. Different Simulink solvers and time
steps are tested and the ODE1 solver with the fixed step size of 0.01sec is found to be
fast and accurate for simulating the thesis plant model.
8.4 EMISSIONS SIMULATION VALIDATION
The combined score for reducing criteria tailpipe emissions and well-to-wheel
greenhouse gas emissions has the highest impact in the emissions and energy
consumption event of EcoCAR3. However, there is no way to measure or validate the
emissions simulation accuracy before going to the final competition. Therefore it is
recommended that in the future team members may use the data from the year final
competition to validate this part.
8.5 TRANSMISSION CAN BASED SHIFTING MODEL
As per the manufacturers, the donated TCM is capable shifting when commanded using
a specific set of CAN signals which are provided by the manufacturers. However, this
functionality has not been realized to this day. Therefore the exact mechanism of CAN
based shifting is still not known. This is essential for controlling the shift pattern in order
to tap the maximum efficiency from the hybrid powertrain. Therefore it is recommended
that this be studied thoroughly and implemented in the future models.

64
8.6 ECM TORQUE REQUEST MODEL
The Torque request model is needed in order to realize direct torque control of the
engine. However, more details and testing is needed in order to develop a better model.
Without sufficient details the model functionality developed is meaningless. Future
teams may work towards realizing this functionality of the Engine Control Module. This
is also essential for the hybrid electric vehicle control strategy development.
8.7 REGRESSION TESTING SETUP
Currently the model has reached a decent level of maturity and the diagnostics will be
tested in the vehicle soon. It is recommended that the AutomationDesk for regression
testing be setup for the critical diagnostic functionalities of the HSC. It is estimated that
the majority of time in year 4 will be spent on software calibration and testing. Therefore
automating processes such as HIL testing will be beneficial.
65
CHAPTER 9 CONCLUSION
In this thesis the advancement and validation of the Pre-transmission Parallel Plug-In
Hybrid Electric Vehicle model for sufficiently testing the Hybrid Supervisory Controller‟s
energy management and diagnostic functionalities has been discussed. Model fidelity
and accuracy requirements were judged based on the test requirements and the
necessary improvements are made. The new model is then validated by comparing the
simulated results with the results from real world test drive data. The HIL setup and
testing activities are also discussed in detail, which was a major development during
year 3. Based on the research, recommendations have been made to the future team
members in order to add more functionality to the existing model and facilitate better
controls testing.

66
REFERENCES
1) Kumar, S., West, M., Conter, J., Cawley, M., Maady, R., & Mayyas,
A. (2015). Vehicle plant model and supervisory control development for a parallel
pre-trans plug-in hybrid electric Vehicle. IFAC-PapersOnLine, 28(15), 139-146.
DOI: 10.1016/j.ifacol.2015.10.020
2) Ward J., Jason, 2015, “Modeling and Simulating a Performance Hybrid Electric
Vehicle,” M.S. thesis, The Ohio State University, Ohio, USA.
3) Marquez, E., “Model and Control System Development For a Plug-In Parallel
Hybrid Electric Vehicle,” 2015, The Virginia Polytechnic Institute and State
University, Virginia, USA.
4) Lord, N., “Simulation Tools for Predicting Energy Consumption and Range of
Electric Two-wheelers”, M.S. thesis, 2016, The Ohio State University, Ohio, USA.
5) Hofman, T., van Leeuwen, D. and Steinbuch, M. (2011) „Analysis of modelling
and simulation methodologies for vehicular propulsion systems‟, Int. J.
Powertrains, Vol. 1, No. 2, pp.117–136.
6) Hendricks, E. and Sorenson, S., "Mean Value Modelling of Spark Ignition
Engines," SAE Technical Paper 900616, 1990, doi:10.4271/900616.
7) Onori, S., Serrao, L., Rizzoni, G., “Hybrid Electric Vehicles, Energy Management
Strategies”, Springer-Verlag London, 2016, doi: 10.1007/978-1-4471-6781-5, pp.
19-21.
8) He, H.; Xiong, R.; Fan, J. Evaluation of Lithium-Ion Battery Equivalent Circuit
Models for State of Charge Estimation by an Experimental
Approach. Energies 2011, 4, 582-598.
67
9) Wilhelm, T., Okuda, H., Levedahl, B., Suzuki, T., “Energy Consumption
Evaluation Based on a Personalized Driver-Vehicle Model”, IEEE Transactions
On Intelligent Transportation Systems, 2016, doi: 10.1109/TITS.2016.2608381.
10) Hendricks, E., Chevalier, A., Jensen, M., Sorenson, S. et al., "Modelling of the
Intake Manifold Filling Dynamics," SAE Technical Paper 960037, 1996,
doi:10.4271/960037.
11) Mean-Value Internal Combustion Engine Model with MapleSim:
www.maplesoft.com/view.aspx?SF=35158/0/Maplesim_mean_valu.pdf,
Accessed on: 5/3/2017.
12) Badin, F., Le Berr, F., Briki, H., Dabadie, J-C., Petit, M., Magand, S., Condemine,
E., “Evaluation of EVs energy consumption influencing factors, driving conditions,
auxiliaries use, driver‟s aggressiveness”, Electric Vehicle Symposium and
Exhibition (EVS27), 2013, Barcelona, Spain.
13) Arnett, M., “Modeling and Simulation of a Hybrid Electric Vehicle for the
Challenge X Competition”, 2005, The Ohio State University, Columbus, Ohio,
USA.
14) Snyder, L., K., “Advancement And Validation Of A Plug-In Hybrid Electric Vehicle
Model Utilizing Experimental Data From Vehicle Testing”, M.S. Thesis, 2015,
Wayne State University, Detroit, Michigan, USA.
15) Gao, W., D., Mi, C., Emadi, A., “Modeling and Simulation of Electric and Hybrid
Vehicles”, Proceedings of the IEEE, Vol. 95, No. 4, April, 2007, doi:
10.1109/JPROC.2006.890127.

68
16) Pukrushpan, T., J., Peng, H., Stefanpoulou, G., A., “Control-Oriented Modeling
and Analysis for Automotive Fuel Cell Systems”, Transactions of ASME, Vol.
126, March 2004, doi: 10.1115/1.1648308.
17) Wei, X., “MODELING AND CONTROL OF A HYBRID ELECTRIC DRIVETRAIN
FOR OPTIMUM FUEL ECONOMY, PERFORMANCE AND DRIVEABILITY”,
Dissertation, 2004, The Ohio State University, Ohio, USA.
18) Schwager, L., Tüysüz, A., Zwyssig, C., Kolar, W., J., “Modeling and Comparison
of Machine and Converter Losses for PWM and PAM in High-Speed Drives”,
IEEE Transactions on Industry Applications, Vol. 50, No. 2, pp. 995-1006, 2014,
doi: 10.1109/TIA.2013.2272711.
19) Mapelli, L., F., Tarsitano, D., Mauri, M., “Plug-In Hybrid Electric Vehicle:
Modeling, Prototype Realization, and Inverter Losses Reduction Analysis”, IEEE
Transactions On Industrial Electronics, Vol.57, No.2, 2010, doi:
10.1109/TIE.2009.2029520.
20) Schlegel, C., Hösl, A., Diel, S., “Detailed Loss Modeling of Vehicle Gearboxes”,
Proceedings 7th Modelica Conference, Sep. 20-22, 2009 Como, Italy.
21) Ni, D., Henclewood, D., “Simple Engine Models for VII-Enabled In-Vehicle
Applications”, 2007, University of Massachusetts, Amherst, Massachusetts, USA.
22) Shankar, R., Marco, J., Assadian, F., “The Novel Application of Optimization and
Charge Blended Energy Management Control for Component Downsizing within
a Plug-in Hybrid Electric Vehicle”, Energies, 2012, 5, 4892-4923;
doi:10.3390/en5124892

69
23) Wang, J., Besselink, I. J. M., & Nijmeijer, H. (2015). Electric vehicle energy
consumption modelling and prediction based on road information. 1-12. Paper
presented at 28th International Electric Vehicle Symposium and Exhibition (EVS
28), May 3-6, 2015, Goyang, Korea , Goyang, Korea, Republic of.
24) Horrein, L., Bouscayrol, A., Delarue, P., Verhille N., J., Mayet, C., “Forward and
Backward simulations of a power propulsion system”, L2EP, Universite Lille,
France.
25) Gao, Y., Ehsani, M., “Hybrid Electric Vehicle: Overview and State of the Art”,
IEEE International Symposium on Industrial Electronics, 2005, Dubrovnik,
Canada.

70
APPENDIX
Figure 38. New torque converter model
Figure 39. New tire rolling resistance model

71
Figure 40. Detailed MIL and HIL testing work plan
Figure 41. HSC APP mismatch diagnostics testing results in HIL

72
Figure 42. Thesis MIL model
Figure 43. Thesis HIL vehicle model

73
Figure 44. HSC software model for HIL testing
Figure 45. Inside the new plant model

74
Figure 46. Electric powertrain test bench
Figure 47. IC Engine test bench
Figure 48. Energy Storage System(ESS) single Li-ion cell test bench

75
Figure 49. Stock powertrain test bench
Figure 50. Full vehicle model test bench
76
ABSTRACT
MODEL ADVANCEMENT AND HIL SETUP FOR TESTING A P2 PHEV SUPERVISORY CONTROLLER
by
SAJJAN BALAKRISHNAN
May 2017
Advisor: Dr. Jerry Ku
Major: Mechanical Engineering
Degree: Master of Science
Teams participating in Advanced Vehicle Technology Competitions such as EcoCAR3
are often bound by limited time and resources. Moreover, vehicle and component
downtime due to mechanical and electrical issues reduce the time available for testing
activities demanded by the Controls/Systems Modeling and Simulation teams.
Therefore, the teams would benefit from identifying new approaches and being more
pragmatic and productive in order to achieve satisfactory progress in the competition.
This thesis summarizes the approach taken to improve the simulation accuracy of the
Wayne State University EcoCAR3 team‟s Pre-transmission Parallel Hybrid Electric
Vehicle plant model and HIL setup. Focus is on testing the Hybrid Supervisory
Controller energy management and diagnostic functionality to be successful in the
emissions and energy consumption event. After thorough literature research it is
determined that a varying fidelity forward dynamic HEV plant model can produce
accurate energy consumption simulation results. Initially, data obtained from

77
manufacturers is used to model the components such as IC Engine, Electric Machine,
Energy Storage System (ESS), transmission, differential, chassis and the ECUs. Later,
test benches are setup to optimize and refine the individual model parameters by
comparing the simulated results with the actual results obtained from component testing
and on-road vehicle testing. Finally, the total vehicle plant model is validated by
comparing the simulated results with the P2 PHEV on-road test data. The accuracy of
the plant model determines the ability to optimize the Hybrid Supervisory Controller
code to achieve maximum energy efficiency. Apart from model accuracy improvement,
the Hardware In Loop (HIL) test setup is also discussed. HIL system is essential for
validating the Hybrid Supervisory Controller‟s functionalities in real time. The challenges
during modeling and HIL setup are discussed and more improvements that can be done
during the final year are recommended based on the research.

78
AUTOBIOGRAPHICAL STATEMENT
Sajjan Balakrishnan is currently pursuing his graduate studies in Mechanical
Engineering at Wayne State University. He has a Bachelors degree in Mechatronics
Engineering from Anna University, India.
Sajjan was the Wayne State University EcoCAR3 team‟s Systems Modeling and
Simulation Co-Lead during the year 3 competition. He also has professional experience
as a Mechanical Design Engineer and developed several industrial automation solutions
for diverse applications. He is interested in product development, mechanical design,
systems modeling and simulation and controls development.