mn dps 2015 crash facts - pages · minnesota motor vehicle crash facts 2015 a summary of crashes...
TRANSCRIPT

Suggestions for Using Crash Facts
Crash Facts is designed to meet the needs of different audiences. If you are unfamiliar with this report,
here are some suggestions that may make it easier for you to find the information you are seeking.
Legislators:
Section II though IX focus on particular traffic safety sub-areas (alcohol, seat belts, crashes involving
motorcycles, pedestrians, and so on). Each section begins with a narrative that provides background,
mentions highlights for the years, and discusses some legislative history (where appropriate). The first
table in each section gives a ten-year history outlining key parameters of the problem.
Students studying traffic safety issues:
Of all age groups, teenagers and young adults pay the heaviest price in traffic safety (in terms of deaths and
injuries). Each section contains tables focusing on age of drivers and victims in crashes.
Law enforcement community:
There are over 500 city, county, and state law enforcement agencies in Minnesota. Each agency has access
to its own reports on traffic crashes, but the data are brought together here. Table 1.24 shows statistical
information arranged by county. Table 1.25 reports on the traffic crash experience of almost 200 cities
with populations over 2,500.
Public health:
Traffic crashes cause deaths and injuries; they are the leading cause of death to people from age 1 to 34
(people generally thought of as “too young to die”). Crash Facts contains many tables that show age and
gender of drivers and victims, and many tables focus on the contributing factors in crashes. Section II
contains tables relevant to chemical dependency issues, in particular, alcohol use and crash involvement.
City and county government agencies:
Information about your county will be found in Tables 1.24; your city’s statistics may be listed in Table
1.25. The Office of Traffic Safety can provide additional information on traffic crashes in your county or
city; just contact us at the address shown below.
Data availability:
This report presents a wide spectrum of information in more than 100 tables and figures, but it may not
answer every question. You may request additional data. Each response usually requires from one day to
two weeks, depending on the complexity of the request.
Such requests should be directed to:
Department of Public Safety
Office of Traffic Safety
445 Minnesota Street, Suite 150
St. Paul, MN 55101-5150
(651) 201-7081

MINNESOTA MOTOR VEHICLE
CRASH FACTS
2015
A summary of crashes occurring on Minnesota roadways based on crash reports submitted to the Minnesota Department of Public Safety by investigating police officers and drivers.
Produced by: Minnesota Department of Public Safety
445 Minnesota Street, Suite 150 St. Paul, MN 55101-5150
(651) 201-7081
[TTY (651) 282-6555]
dps.mn.gov
© 2016, Office of Traffic Safety
For additional copies contact: Office of Communications
Phone (651) 201-7575
Acknowledgements: Many thanks to the Crash Records Section of the Driver and Vehicle Services Division at
the Department of Public Safety for their excellent data quality control work. Thanks
also to the State Patrol, the Bureau of Criminal Apprehension, Sheriffs, Police Chiefs,
and Medical Examiners for their assistance regarding alcohol-related crashes. And many
thanks to all law enforcement officers who were on the scene of these traffic crashes.
Their hard work and data reporting skills make this book a valuable document to traffic
safety researchers, legislators, the media, and the public.
Note: The Minnesota Department of Public Safety is working to create an accessible electronic
version of this document that meets the State of Minnesota Accessibility Standard and
Minnesota State Statutes Section 16E.03. The most up-to-date version of this document is
posted on the Minnesota Department of Public Safety Website:
https://dps.mn.gov/divisions/ots/
Click on the “Reports and Statistics” tab.
This site also includes yearly archived Crash Facts reports back to 2004.

EQUAL OPPORTUNITY EMPLOYER
MINNESOTA DEPARTMENT OF PUBLIC SAFETY
Office of the Commissioner 445 Minnesota Street • Suite 1000 • Saint Paul, Minnesota 55101-5100
Phone: 651.201.7160 • Fax: 651.297.5728 • TTY: 651.282.6555
www.dps.mn.gov
Alcohol and Gambling Enforcement
Bureau of Criminal Apprehension
Driver and Vehicle
Services
Emergency Communication
Networks
Homeland Security and Emergency
Management
Minnesota State Patrol
Office of Communications
Office of Justice Programs
Office of Traffic Safety
State Fire Marshal
June 2016
A father and daughter killed by a distracted driver. Two teens killed by a suspected drunk
driver. Numerous motorists who died all because they weren’t wearing a seat belt. These are
just some of the stories behind Minnesota Motor Vehicle Crash Facts 2015.
Minnesota Motor Vehicle Crash Facts contains statistics and information that will be used by
our traffic safety partners, legislators, media and the motoring public. It is derived from law
enforcement reports and describes how and why crashes happened, where they occurred in our
state and who was involved.
Last year proved to be a challenging year on Minnesota roads, including for the families of 61
motorcyclists who lost their lives — the highest number of deaths since 2008. The 411 traffic
fatalities also marks the most people killed on Minnesota roads since 2010.
The title “Crash” Facts is chosen instead of the word “accident” because the majority of
traffic incidents are preventable. There are behaviors that drivers can control to prevent
tragedies such as: slowing down, paying attention, never driving drunk and always buckling
up.
The top four contributing factors in Minnesota road fatalities were:
Speed – 78 deaths were attributed to illegal/unsafe speed.
Distractions – 74 fatalities were linked to inattention.
Impaired driving – 95 traffic deaths were attributed to drunk driving.
Failing to buckle up - 91 motor vehicle occupants who were killed weren’t belted.
The Minnesota Department of Public Safety (DPS) will use this information to determine
future traffic safety initiatives that will lead to safer roads, more efficient safety programs
and changed driver behavior.
It’s difficult to imagine what could have been for those who should still be with us, and for the
families who will experience a lifetime of heartache knowing these tragedies could have been
prevented.
All of us can do our part in keeping our roads safe by speaking up when we see a dangerous
driver or driving habit. Together, we can save lives and move toward the goal of zero deaths
on Minnesota roads.
Sincerely,

Mona Dohman
Commissioner, Department of Public Safety

Minnesota Motor Vehicle Crash Facts, 2015 page i Department of Public Safety, Office of Traffic Safety
Minnesota Traffic Crashes in 2015
OVERVIEW
This edition of Minnesota Motor Vehicle Crash Facts summarizes the crashes, deaths and injuries that occurred
on Minnesota roadways during 2015. The information provided in this book will assist you in traveling our
roadways safely.
In 2015:
• 74,772 traffic crashes were reported to the Minnesota Department of Public Safety (DPS)
• 138,057 motor vehicles and 181,663 people were involved in these crashes
• 411 people died and 29,981 people were injured
• Estimated economic cost to Minnesota: $1,773,219,300
On an average day in 2015:
• 205 crashes
• 1 death and 82 injuries
• Average daily cost to Minnesota: $4,858,135
2015 known alcohol-related statistics:
• 3,634 crashes
• 137 deaths and 2,203 injuries
• Estimated economic cost to Minnesota: $285,118,600
Highlights from the 2015 Crash Facts edition
Traffic fatalities increase
In 2015, Minnesota experienced a total of 411 traffic fatalities, a 13.9 percent increase from the previous
year. This percentage increase is discouraging in light of the fact that traffic fatalities in Minnesota rose to
their highest levels since 2010 after decreasing sharply over the last decade. It indicates that traffic fatalities
in Minnesota remain at epidemic levels - serving as a call-to-action for all motorists to buckle up, drive at
safe speeds, pay attention and never drive impaired.
Safety belt use in Minnesota is 94 percent
An observational study in June, 2015 showed that belt use by front seat drivers and passengers was 94%.
Seat belts save lives. All motor vehicle occupants are urged to buckle up–every seat and every ride.
The fatality rate in Minnesota per 100 million vehicle miles traveled (VMT) remains low
The VMT-based fatality rate for 2015 is 0.70, one of the lowest in the nation. The VMT fatality rate has
shown dramatic improvement in the last two decades (it was 1.48 in 1994), however, in 2015 it rose to its
highest level since 2010.

Minnesota Motor Vehicle Crash Facts, 2015 page ii Department of Public Safety, Office of Traffic Safety
CRASH FACTS ORGANIZATION
Crash Facts has a wealth of statistical information about traffic crashes in Minnesota. Follow this basic user’s
guide to navigate the book.
Introduction
Beginning on page 1, you will find introductory information including the history, societal costs and general cause
of crashes. You can use this information to find:
How crash costs are estimated
Contributing factors in crashes
Historical analysis of traffic deaths over the last 35 to 40 years
Licensed drivers by age (Table 2)
Registered motor vehicles by category (Table 3)
Section I: All Crashes
Beginning on page 7, you will find the aggregate of all traffic crashes that occurred in Minnesota in 2015.
Information provided includes:
Historical information dating back to 1965 (Table 1.01)
Factors contributing to crashes (Tables 1.09, 1.10 and 1.17)
Holiday crashes, deaths and injuries (Table 1.28)
Section II: Alcohol-Related Crashes
Beginning on page 38, you will find data about impaired driving and traffic crashes. This section focuses on
crashes involving alcohol and spells out answers to commonly-raised questions, including:
Historical overview since 1990 (Table 2.02)
DWI arrest statistics (Tables 2.03, 2.04 and 2.05)
Persons killed and injured in alcohol-related crashes by age (Table 2.06)
Section III: Safety Equipment Use by Vehicle Occupants in Crashes
Beginning on page 55, you will find information on belt use by people in cars and trucks.
This section includes a table showing observational seat belt use rates since 1986 (Table 3.01)
Section IV: Motorcycle Crashes
Beginning on page 64, you will find information on crashes involving motorcycles.
Crashes involving all-terrain vehicles or mopeds are not included in this section
Section V: Truck Crashes
Beginning on page 73, you will find information on crashes that involved a heavy commercial vehicle.
Crashes involving pickup trucks are not included in this section
Section VI: Pedestrian Crashes
Beginning on page 81, you will find information on motor-vehicle/pedestrian crashes.
Crashes involving a pedestrian/train or pedestrian/bicycle are not included in this section
Section VII: Bicycle Crashes
Beginning on page 91, you will find information on motor-vehicle/bicycle crashes.
Bicycle crashes not on public highways and roadways are not included in this section
Bicycle crashes not involving a motor vehicle are not included in this section
Section VIII: School Bus Crashes
Beginning on page 96, you will find information pertaining to school bus crashes.
This section focuses on crashes that involved a school bus as a “contact vehicle”
Crashes where a school bus was indirectly involved are not included in this section
(Note: this data collection began in 2003; please see narrative for discussion)
Section IX: Motor Vehicle/Train Crashes
Beginning on page 101, you will find information pertaining to train crashes.
Crashes that do not involve a motor vehicle are not included in this section

Minnesota Motor Vehicle Crash Facts, 2015 page iii Department of Public Safety, Office of Traffic Safety
Section X: Motor Vehicle Teen Crashes
Beginning on page 105, you will find information pertaining to teen-involved traffic crashes.
This section focuses on drivers aged 15 through 19
Section XI: Motor Vehicle Senior Crashes
Beginning on page 110, you will find information pertaining to senior-involved traffic crashes.
This section focuses on drivers aged 65 and older

Minnesota Motor Vehicle Crash Facts, 2015 page iv Department of Public Safety, Office of Traffic Safety
TABLE OF CONTENTS
INTRODUCTION ................................................................................................................................... 1
FIGURE 1 VEHICLES, DRIVERS AND FATALITY RATE, 1970 - 2015 ............................................................. 3
TABLE 1 MINNESOTA TRAFFIC FATALITIES, 1910 - 2015 .......................................................................... 4
FIGURE 2 MINNESOTA TRAFFIC FATALITIES, 1910 - 2015 .......................................................................... 4
TABLE 2 DRIVER LICENSE* SUMMARY BY AGE, 2010 - 2015 ..................................................................... 5
TABLE 3 MOTOR VEHICLE REGISTRATIONS, 2010 - 2015 .......................................................................... 6
I. ALL CRASHES .................................................................................................................................. 7
TABLE 1.01 TRAFFIC SAFETY STATISTICS SUMMARY, 1965 - 2015 ............................................................... 9
TABLE 1.02 TRAFFIC CRASH TRENDS, 2010 - 2015 ........................................................................................ 10
TABLE 1.03 2015 FATALITIES BY TRAFFIC ROLE, GENDER AND AGE ....................................................... 11
TABLE 1.04 AGE AND GENDER OF PERSONS KILLED OR INJURED IN 2015 CRASHES .......................... 12
TABLE 1.05 AGE AND GENDER OF DRIVERS IN 2015 CRASHES .................................................................. 13
TABLE 1.06 LICENSED VERSUS CRASH-INVOLVED DRIVERS BY AGE, 2015 ............................................. 14
FIGURE 1.01 AGE AND GENDER OF PERSONS KILLED OR INJURED, 2015 ................................................ 15
FIGURE 1.02 LICENSED VERSUS CRASH-INVOLVED DRIVERS BY AGE, 2015 ............................................. 15
TABLE 1.07 PERCENTAGE OF DRIVERS IN 2015 CRASHES BY AGE AND FIRST HARMFUL EVENT ....... 16
TABLE 1.08 DRIVERS IN 2015 CRASHES BY PHYSICAL CONDITION ........................................................... 16
TABLE 1.09 SINGLE-VEHICLE CRASHES: CONTRIBUTING FACTORS, BY PERCENT,
WITHIN DRIVER AGE GROUPS, 2015 .......................................................................................... 17 TABLE 1.10
MULTIPLE-VEHICLE CRASHES: CONTRIBUTING FACTORS, BY PERCENT,
WITHIN DRIVER AGE GROUPS, 2015 .......................................................................................... 18 TABLE 1.11
PERSONS INVOLVED IN CRASHES BY TYPE OF VEHICLE OCCUPIED AND INJURY
SEVERITY, 2015 ............................................................................................................................... 19 TABLE 1.12
TYPES OF MOTOR VEHICLES IN 2015 CRASHES ....................................................................... 20 TABLE 1.13
2015 CRASHES BY FIRST HARMFUL EVENT ............................................................................... 21 TABLE 1.14
2015 "HIT-AND-RUN" CRASHES BY FIRST HARMFUL EVENT ................................................. 21

Minnesota Motor Vehicle Crash Facts, 2015 page v Department of Public Safety, Office of Traffic Safety
TABLE 1.15 2015 CRASHES BY TRAFFIC CONTROL DEVICE ........................................................................ 22
TABLE 1.16 2015 CRASHES BY WEATHER CONDITION ................................................................................. 22
TABLE 1.17 CONTRIBUTING FACTORS IN 2015 CRASHES ............................................................................ 23
TABLE 1.18 2015 CRASHES BY LIGHT CONDITION ........................................................................................ 24
TABLE 1.19 2015 CRASHES BY ROAD SURFACE CONDITION ...................................................................... 24
TABLE 1.20 2015 CRASHES BY ROAD DESIGN ................................................................................................ 24
TABLE 1.21 2015 CRASHES BY DIAGRAM ........................................................................................................ 25
TABLE 1.22 2015 CRASHES BY POPULATION OF AREA ................................................................................ 25
TABLE 1.23 2015 CRASHES BY TYPE OF ROADWAY....................................................................................... 26
TABLE 1.24 2015 COUNTY CRASH REPORT .................................................................................................... 27
TABLE 1.25 2015 CRASHES IN CITIES OF 2,500 OR MORE POPULATION .................................................. 30
TABLE 1.26 2015 CRASHES BY TIME AND DAY ............................................................................................... 35
FIGURE 1.03 TOTAL CRASHES VS FATAL CRASHES, BY TIME, 2015 ............................................................. 36
TABLE 1.27 2015 CRASHES, FATALITIES AND INJURIES BY MONTH .......................................................... 36
TABLE 1.28 HOLIDAY CRASH SUMMARY, 2010 - 2015 ................................................................................... 37
II: ALCOHOL-RELATED CRASHES ............................................................................................ 38
TABLE 2.01 OVERVIEW OF TRAFFIC SAFETY AND ALCOHOL STATISTICS, 1966 - 2015 .......................... 40
TABLE 2.02 ALCOHOL-RELATED FATAL CRASH SUMMARY, 1990 - 2015 ................................................... 41
TABLE 2.03 IMPAIRED DRIVING INCIDENTS (“DWIs”) BY GENDER AND BY AREA OF STATE
WHERE ARREST WAS MADE, 1996 - 2015 .................................................................................... 42 TABLE 2.04
IMPAIRED DRIVING INCIDENTS (“DWIs”) FOR SELECTED AGE GROUPS, 1996 - 2015 ..... 42 FIGURE 2.01
PERCENT OF IMPAIRED DRIVING INCIDENTS (“DWIs”) COMMITTED BY OFFENDERS
IN FOUR AGE GROUPS, 1996 - 2015 ............................................................................................ 43 TABLE 2.05
IMPAIRED DRIVING INCIDENTS (“DWIs”) BY AGE-GROUP, 1996 - 2015 .............................. 43 TABLE 2.06
AGE OF PERSONS KILLED AND INJURED IN ALL CRASHES AND IN
ALCOHOL-RELATED CRASHES, 2015 .......................................................................................... 44 TABLE 2.07
2015 ALCOHOL-RELATED FATALITIES' LEVEL OF ALCOHOL CONCENTRATION BY
TRAFFIC ROLE ............................................................................................................................... 45

Minnesota Motor Vehicle Crash Facts, 2015 page vi Department of Public Safety, Office of Traffic Safety
TABLE 2.08 PERCENT OF DEATHS, INJURIES and PROPERTY DAMAGE CRASHES DETERMINED
TO BE ALCOHOL-RELATED, 2006 - 2015 .................................................................................... 45 TABLE 2.09
FIRST HARMFUL EVENT IN ALCOHOL-RELATED FATAL CRASHES AND ALL
FATAL CRASHES, 2015 ................................................................................................................... 45 TABLE 2.10
TEST RESULTS OF DRIVERS KILLED, 2006 - 2015 ..................................................................... 46 TABLE 2.11
DRIVERS KILLED WHO TESTED .01 OR HIGHER, 2006 - 2015 ................................................. 46 TABLE 2.12
DRIVERS KILLED WHO TESTED OVER THE LEGAL LIMIT, 2006 - 2015 ................................. 46 FIGURE 2.02
KILLED DRIVERS TESTED FOR ALCOHOL: 1980 - 2015 ........................................................... 47 FIGURE 2.03
PERCENT OF DRIVERS KILLED WHO HAD BEEN DRINKING, BY AGE, 2015........................ 47 TABLE 2.13
2015 DRIVER FATALITIES' LEVEL OF ALCOHOL CONCENTRATION BY AGE ....................... 48 TABLE 2.14
2015 ALCOHOL-RELATED CRASHES BY MONTH ...................................................................... 49 TABLE 2.15
2015 ALCOHOL-RELATED CRASHES BY ROADWAY TYPE ....................................................... 49 FIGURE 2.04
2015 ALCOHOL-RELATED CRASHES BY TIME OF DAY ............................................................ 50 FIGURE 2.05
2015 ALCOHOL-RELATED CRASHES BY DAY OF WEEK........................................................... 50 TABLE 2.16
2015 ALCOHOL-RELATED CRASHES BY TIME OF DAY AND DAY OF WEEK ........................ 51 TABLE 2.17
2015 DRUNK DRIVING-RELATED CRASHES BY MONTH .......................................................... 52 TABLE 2.18
2015 DRUNK DRIVING-RELATED FATAL CRASHES BY ROADWAY TYPE .............................. 52 FIGURE 2.06
2015 DRUNK DRIVING-RELATED FATAL CRASHES BY TIME OF DAY ................................... 53 FIGURE 2.07
2015 DRUNK DRIVING-RELATED FATAL CRASHES BY DAY OF WEEK.................................. 53 TABLE 2.19
DRUNK DRIVING-RELATED FATALITES AND ALCOHOL-RELATED INJURIES BY
SEX AND PERSON TYPE, 2015 ...................................................................................................... 54
III: SAFETY EQUIPMENT USE BY VEHICLE OCCUPANTS IN 2015 CRASHES ................. 55
TABLE 3.01 PERCENT OF FRONT SEAT OCCUPANTS WEARING SAFETY BELTS, BY DATE OF
OBSERVATION STUDY ................................................................................................................... 49 TABLE 3.02
MOTOR VEHICLE OCCUPANTS KILLED OR INJURED BY EJECTION STATUS AND
INJURY SEVERITY, 2015 ................................................................................................................ 57 TABLE 3.03
MOTOR VEHICLE OCCUPANTS KILLED OR INJURED, BY AGE AND
INJURY SEVERITY, 2015 ................................................................................................................ 57 FIGURE 3.01
SAFETY EQUIPMENT USE AMONG MOTOR VEHICLE OCCUPANTS KILLED OR
INJURED, BY AGE, 2015 ................................................................................................................ 58

Minnesota Motor Vehicle Crash Facts, 2015 page vii Department of Public Safety, Office of Traffic Safety
TABLE 3.04 SAFETY EQUIPMENT USE BY VEHICLE OCCUPANTS, BY GENDER AND INJURY
SEVERITY, 2015 ............................................................................................................................... 58 TABLE 3.05
SAFETY EQUIPMENT USE BY VEHICLE OCCUPANTS KILLED OR INJURED, BY AGE
AND INJURY SEVERITY, 2015 ....................................................................................................... 59 TABLE 3.06
PERCENT OF KILLED OR INJURED MOTOR VEHICLE OCCUPANTS WHO USED
SAFETY EQUIPMENT, BY INJURY SEVERITY AND YEAR, 2006 - 2015 ..................................... 61 TABLE 3.07
SAFETY EQUIPMENT USE BY MOTOR VEHICLE OCCUPANTS KILLED OR INJURED,
BY ROADWAY TYPE, 2015 .............................................................................................................. 61 TABLE 3.08
SAFETY EQUIPMENT USE BY MOTOR VEHICLE OCCUPANTS KILLED OR INJURED,
BY REGION OF THE STATE, 2015 ................................................................................................. 62 TABLE 3.09
AIRBAG DEPLOYMENTS, 2008 - 2015 .......................................................................................... 63
IV: MOTORCYCLE CRASHES ........................................................................................................ 64
TABLE 4.01 MOTORCYCLE CRASH SUMMARY, 1981 - 2015 .......................................................................... 65
TABLE 4.02 2015 MOTORCYCLE CRASHES BY FIRST HARMFUL EVENT .................................................... 66
TABLE 4.03 2015 MOTORCYCLE CRASHES BY POPULATION OF AREA ..................................................... 66
TABLE 4.04 2015 MOTORCYCLE CRASHES BY MONTH ................................................................................. 67
FIGURE 4.01 2015 MOTORCYCLE CRASHES BY TIME OF DAY ....................................................................... 67
TABLE 4.05 2015 MOTORCYCLE CRASHES BY TIME AND DAY .................................................................... 68
TABLE 4.06 MOTORCYCLISTS KILLED OR INJURED BY AGE AND GENDER, 2015 ................................... 69
FIGURE 4.02 MOTORCYCLISTS KILLED OR INJURED BY AGE AND GENDER, 2015 ................................... 69
TABLE 4.07 HELMET USE BY MOTORCYCLISTS KILLED OR INJURED, 2006 - 2015 ................................. 70
TABLE 4.08 ENDORSEMENT STATUS OF MOTORCYCLE OPERATORS INVOLVED IN FATAL
CRASHES, 2006 - 2015 .................................................................................................................... 70 TABLE 4.09
ALCOHOL USE BY KILLED MOTORCYCLE DRIVERS, 2006 - 2015 .......................................... 71 TABLE 4.10
2015 MOTORCYCLE DRIVER FATALITIES' LEVEL OF ALCOHOL CONCENTRATION
BY AGE ............................................................................................................................................. 71 TABLE 4.11
CONTRIBUTING FACTORS IN 2015 MOTORCYCLE CRASHES ................................................. 72
V. TRUCK CRASHES ......................................................................................................................... 73
TABLE 5.01 TRUCK CRASH SUMMARY, 2006 - 2015 ....................................................................................... 74
TABLE 5.02 PERSONS KILLED OR INJURED IN 2015 TRUCK CRASHES BY VEHICLE OCCUPIED ......... 74

Minnesota Motor Vehicle Crash Facts, 2015 page viii Department of Public Safety, Office of Traffic Safety
TABLE 5.03 CONTRIBUTING FACTORS IN 2015 TRUCK CRASHES .............................................................. 75
TABLE 5.04 AGE OF TRUCK DRIVERS IN 2015 CRASHES .............................................................................. 76
TABLE 5.05 DRIVERS IN 2015 TRUCK CRASHES BY PHYSICAL CONDITION ............................................. 76
TABLE 5.06 2015 TRUCK CRASHES BY FIRST HARMFUL EVENT ................................................................. 77
TABLE 5.07 2015 TRUCK CRASHES BY MONTH .............................................................................................. 77
TABLE 5.08 2015 TRUCK CRASHES BY TIME AND DAY ................................................................................. 78
FIGURE 5.01 2015 TRUCK CRASHES BY TIME OF DAY .................................................................................... 78
TABLE 5.09 2015 TRUCK CRASHES BY ROAD SURFACE CONDITION......................................................... 79
TABLE 5.10 2015 TRUCK CRASHES BY WEATHER CONDITION ................................................................... 79
TABLE 5.11 2015 TRUCK CRASHES BY POPULATION OF AREA .................................................................. 80
TABLE 5.12 2015 TRUCK CRASHES BY TYPE OF ROADWAY ......................................................................... 80
VI: PEDESTRIAN CRASHES ........................................................................................................... 81
TABLE 6.01 PEDESTRIAN CRASH SUMMARY, 2006 - 2015 ............................................................................. 82
TABLE 6.02 PEDESTRIAN CRASHES BY ROUTE SYSTEM, 2006 - 2015 ......................................................... 82
TABLE 6.03 PEDESTRIANS KILLED OR INJURED BY AGE AND GENDER, 2015 ........................................ 83
FIGURE 6.01 PEDESTRIAN FATALITIES BY AGE GROUP, 2006 - 2015 COMBINED ..................................... 84
FIGURE 6.02 PEDESTRIANS KILLED OR INJURED BY AGE AND GENDER, 2015 ........................................ 84
TABLE 6.04 2015 PEDESTRIAN CRASHES BY MONTH.................................................................................... 85
TABLE 6.05 2015 PEDESTRIAN CRASHES BY POPULATION OF AREA ........................................................ 85
TABLE 6.06 2015 PEDESTRIAN CRASHES BY TIME AND DAY ....................................................................... 86
FIGURE 6.03 2015 PEDESTRIAN CRASHES BY TIME OF DAY ......................................................................... 86
TABLE 6.07 PRIOR ACTION OF VEHICLES IN 2015 PEDESTRIAN CRASHES .............................................. 87
TABLE 6.08 PRIOR ACTION OF PEDESTRIANS KILLED OR INJURED IN 2015 ........................................... 87
TABLE 6.09 CONTRIBUTING FACTORS IN 2015 PEDESTRIAN CRASHES ..........................................................88
TABLE 6.10 PEDESTRIAN FATALITIES' LEVEL OF ALCOHOL CONCENTRATION, 2005 - 2015 ............... 89
TABLE 6.11 2015 PEDESTRIAN FATALITIES' LEVEL OF ALCOHOL CONCENTRATION BY AGE ............. 89

Minnesota Motor Vehicle Crash Facts, 2015 page ix Department of Public Safety, Office of Traffic Safety
TABLE 6.12 2015 PEDESTRIAN FATALITIES' LEVEL OF ALCOHOL CONCENTRATION BY
TIME OF DAY .................................................................................................................................. 90
VII: BICYCLE CRASHES ................................................................................................................. 91
TABLE 7.01 BICYCLE CRASH SUMMARY, 2006 - 2015 .................................................................................... 92
TABLE 7.02 2015 BICYCLE CRASHES BY MONTH ........................................................................................... 92
FIGURE 7.01 2015 BICYCLE CRASHES BY TIME OF DAY ................................................................................. 92
TABLE 7.03 2015 BICYCLE CRASHES BY TIME AND DAY .............................................................................. 93
TABLE 7.04 2015 BICYCLE CRASHES BY POPULATION OF AREA ............................................................... 93
FIGURE 7.02 BICYCLISTS KILLED OR INJURED BY AGE AND GENDER, 2015 ............................................. 93
TABLE 7.05 BICYCLISTS KILLED OR INJURED BY AGE AND GENDER, 2015 ............................................. 94
TABLE 7.06 PRIOR ACTION OF BICYCLISTS INVOLVED IN 2015 CRASHES ............................................... 94
TABLE 7.07 CONTRIBUTING FACTORS IN 2015 BICYCLE CRASHES ........................................................... 95
VIII: SCHOOL BUS CRASHES ........................................................................................................ 96
TABLE 8.01 SCHOOL BUS CRASH SUMMARY, 2006 - 2015 ............................................................................ 97
TABLE 8.02 2015 SCHOOL BUS CRASHES BY TIME OF DAY ......................................................................... 97
TABLE 8.03 2015 SCHOOL BUS CRASHES BY MONTH ................................................................................... 97
TABLE 8.04 AGE AND GENDER OF PERSONS INJURED IN 2015 SCHOOL BUS CRASHES ....................... 98
TABLE 8.05 PERSONS KILLED OR INJURED IN 2015 SCHOOL BUS CRASHES BY POPULATION
OF AREA .......................................................................................................................................... 98 TABLE 8.06
2015 SCHOOL BUS CRASHES BY FIRST HARMFUL EVENT ...................................................... 99 TABLE 8.07
2015 SCHOOL BUS CRASHES BY TRAFFIC CONTROL DEVICE ............................................... 99 TABLE 8.08
CONTRIBUTING FACTORS IN 2015 SCHOOL BUS CRASHES ................................................. 100
IX: MOTOR VEHICLE/TRAIN CRASHES ................................................................................... 101
TABLE 9.01 MOTOR VEHICLE / TRAIN CRASH SUMMARY, 2006 – 2015 .................................................... 102
TABLE 9.02 2015 MOTOR VEHICLE / TRAIN CRASHES BY MONTH............................................................ 102
TABLE 9.03 2015 MOTOR VEHICLE / TRAIN CRASHES BY TIME AND DAY ............................................... 102
TABLE 9.04 2015 MOTOR VEHICLE / TRAIN CRASHES BY TRAFFIC CONTROL DEVICE ....................... 103

Minnesota Motor Vehicle Crash Facts, 2015 page x Department of Public Safety, Office of Traffic Safety
TABLE 9.05 2015 MOTOR VEHICLE / TRAIN CRASHES AGE OF PERSONS KILLED OR INJURED ......... 103
TABLE 9.06 2015 MOTOR VEHICLE / TRAIN CRASHES BY POPULATION OF AREA ................................ 104
TABLE 9.07 2015 MOTOR VEHICLE / TRAIN CRASHES MOTOR VEHICLE DRIVER
CONTRIBUTING FACTORS .......................................................................................................... 104
X: CRASHES INVOLVING TEEN DRIVERS .............................................................................. 105
TABLE 10.01 TEEN CRASH SUMMARY, 2009 - 2015 ........................................................................................ 106
TABLE 10.02 TEEN ‘MOTOR VEHICLE OCCUPANT’ DRIVER CRASH INVOLVEMENT, 2009 - 2015 ........ 106
TABLE 10.03 2015 TEEN-INVOLVED CRASHES BY MONTH .......................................................................... 107
TABLE 10.04 2015 TEEN-INVOLVED CRASHES BY DAY OF WEEK ............................................................... 107
TABLE 10.05 2015 TEEN-INVOLVED CRASHES BY TIME OF DAY ................................................................ 108
FIGURE 10.01 TOTAL TEEN-INVOLVED CRASHES, BY TIME, 2015 ................................................................ 108
TABLE 10.06 CONTRIBUTING FACTORS IN 2015 TEEN-INVOLVED CRASHES .......................................... 109
XI: CRASHES INVOLVING SENIOR DRIVERS ........................................................................ 110
TABLE 11.01 SENIOR CRASH SUMMARY, 2009 - 2015 .................................................................................... 111
TABLE 11.02 SENIOR ‘MOTOR VEHICLE OCCUPANT’ DRIVER CRASH INVOLVEMENT, 2009 - 2015 .... 111
TABLE 11.03 2015 SENIOR-INVOLVED CRASHES BY MONTH ...................................................................... 112
TABLE 11.04 2015 SENIOR-INVOLVED CRASHES BY DAY OF WEEK ........................................................... 112
TABLE 11.05 2015 SENIOR-INVOLVED CRASHES BY TIME OF DAY ............................................................ 113
FIGURE 11.01 TOTAL SENIOR-INVOLVED CRASHES, BY TIME, 2015 ............................................................ 113
TABLE 11.06 CONTRIBUTING FACTORS IN 2015 SENIOR-INVOLVED CRASHES ...................................... 114
DEFINITIONS .................................................................................................................................... 115

Minnesota Motor Vehicle Crash Facts, 2015 page 1 Department of Public Safety, Office of Traffic Safety
Introduction
At the end of the 2015 calendar year, 4,118,102
people held Minnesota driver licenses and 5,242,267
motor vehicles were registered in the state. Vehicles
traveled over 59 billion miles on public roadways.
There were 74,772 traffic crashes; 411 people died
and 29,981 people were injured in those crashes.
This report provides a statistical summary of those
crashes.
The purpose of Crash Facts is to provide summary
statistical information about the crashes reported to
the state each year. The term “crash” is used in
preference to “accident.” The latter term suggests
there is a random, unavoidable quality about the
events in question. In fact, the experience of the last
three decades strongly demonstrates that advances
in engineering and technology, coupled with
changes in public policy and individual human
behavior, can dramatically reduce the number and
severity of traffic crashes.
Cost of traffic crashes The use of motor vehicles for getting from one place
to another results in significant costs to society. The
National Safety Council reports that crashes (from
all causes) are the leading cause of death among
persons aged 1 to 34, the leading cause of
unintentional injury-related death for all ages
combined and the fifth leading cause of death
among all persons (Injury Facts, 2014 Edition, p.
12-13,16).
It is possible to estimate economic costs of traffic
crashes, although the results can vary depending on
definitions and estimating procedures. Many states
use cost figures released by the National Safety
Council, the most recent of which use 2014 data.
Based upon those, the total economic loss from
2015 traffic crashes in Minnesota was
$1,773,953,802, a figure that is calculated as
follows:
Cost of Motor Vehicle Crashes in 2015:
411 deaths @ $1,512,000 = $621,432,000 1,127 severe injuries @ $88,500 = $99,739,500
7,251 moderate injuries @ $25,600 = $185,625,600
21,603 minor injuries @ $21,000 = $454,397,502 98,276 PDO crashes1 @ $4,200 = $412,759,200
Total: $1,773,219,300
Factors affecting traffic crashes A single crash may have many contributing factors.
Cell phone use or playing with the radio may lead to
driver distraction, which together with wet, slippery
pavement and high traffic congestion at an
intersection causes a traffic crash.
In general, a handful of factors affect the majority of
traffic crashes. These can be organized into logical
groups, such as human behavior factors or vehicle
safety factors. The following paragraphs outline
some of the factors most frequently thought to affect
crash incidence and severity.
Vehicle Safety Factors: Engineering and design
standards for vehicle performance can help prevent
crashes from occurring. When there is a crash,
vehicles designed for safety can increase
survivability. For example, the design of windshield
glass and the location and durability of gas tanks can
increase safety. The “passenger packaging” inside a
vehicle can reduce injury severity through means
such as padded dashboards and collapsible steering
wheel columns. Passenger protection systems in
vehicles (airbags, safety belts, etc.), if used, can
eliminate injuries or reduce their severity.
1 Beginning in 2015, PDO crashes were calculated by the
National Safety Council on cost per vehicle. Before 2015, PDO
crashes were calculated on cost per crash and included non-
disabling injuries.

Minnesota Motor Vehicle Crash Facts, 2015 page 2 Department of Public Safety, Office of Traffic Safety
Behavior factors: For all crashes and fatal
crashes, the driver behaviors police cite most often
as contributing factors are, in order of frequency:
driver inattention or distraction, failure to yield
right of way and illegal or unsafe speed. Reducing
these behaviors would reduce crashes. Further,
when there is a crash, using seat belts will likely
reduce a crash’s severity.
Roadway characteristics: Limited access
highways carry about a fifth of the traffic volume
in Minnesota, yet account for only about a twelfth
of fatal accidents. They are built to high roadway
engineering standards and are very safe, relatively
speaking. In general, roadway characteristics
conducive to safety include wide lanes, clearly
visible striping, flared guardrails, wide shoulders
of good quality, shoulders and roadsides free of
obstacles, well-located crash attenuation devices,
well-planned use of traffic signals and effective
communication to roadway users through clear
and visible signage.
Environmental factors: Weather conditions affect
crash incidence and severity. Clear, dry roads are
conducive to high speeds; consequently, fatal
crashes have a pronounced seasonal variation,
peaking in the warm summer months and falling in
the winter months. The total number of crashes is
driven by the incidence of the less serious property
damage crashes, which tend to have the opposite
seasonal variation, peaking in the winter months.
Volume of traffic, or vehicle miles traveled
(VMT), is a predictor of crash incidence. All other
things being equal, as VMT increases, so will
traffic crashes. The relationship may not be
simple, however; after a point, increasing
congestion leads to reduced speeds, changing the
proportion of crashes that occur at different
severity levels.
The quality and availability of emergency medical
services might be classified as an environmental
factor. The first hour after a traumatic episode,
such as a traffic crash, has been called the “golden
hour.” Victims who receive emergency services
within that time have markedly improved chances
of survival.
The age structure of the population has a strong
effect on crash incidence, although it is not
generally thought about since demographic
changes are so gradual. In Minnesota, about one in
ten teenage drivers are involved in crashes each
year. The involvement rate drops off for
successive age groups. For example, it is about 1
in 14 for drivers in their 40s. The aging of the
‘baby boom’ has reduced crash incidence,
however, their children who are now driving may
cause an increase.
Historical perspective In 1966, there were 53,041 traffic fatalities in the
country, or 5.7 for every hundred million miles of
travel. In Minnesota in 1968, there were 1,060
traffic fatalities, or 5.3 per hundred million miles
of travel. Those were the worst years. Since then,
both the rate and the number of fatalities have
declined in a fairly steady pattern. In 2015, there
were about 32,675 traffic fatalities throughout the
country (based on the most recent available data
from 2014) and 411 in Minnesota. The respective
fatality rates per hundred million miles of travel
were 1.07 and 0.70. A dramatic benefit has been
achieved.
The benefit is in large part the result of conscious
decision-making on traffic safety issues. The
National Highway Traffic Safety Administration
(originally called the National Highway Safety
Bureau) was established in the US Department of
Transportation in 1967. Since then it has promoted
and Congress has passed, legislation mandating
the manufacture of safer cars. At the same time,
the federal interstate highway system has
expanded, contributing to a safer roadway
environment.
Simultaneously there has been an effort to change
human behavior factors. Minnesota was a leader
among the states in the development of innovative
drunk driving countermeasures. The Legislature
made significant amendments to the DWI law in
1971, 1976, 1978 and in almost every year of the
1980s. It also passed the child passenger
protection law in 1981 and the secondary seat belt
law in 1986. In 2009 the law was updated to
‘Primary.’ It subsequently amended those laws,
closing loopholes, broadening their scope and
strengthening penalties. The benefits of action in
these areas are clear. The graph shown in Figure 1
is one illustration. It shows a steady increase in the
number of drivers and vehicles, but a steady
decrease in the fatality rate per hundred million
miles of travel.
Legislative requirement
Minnesota Motor Vehicle Crash Facts is produced
annually by the Minnesota Department of Public

Minnesota Motor Vehicle Crash Facts, 2015 page 3 Department of Public Safety, Office of Traffic Safety
Safety Office of Traffic Safety, in accordance with
state law. Minnesota Statutes, Section 169.10,
requires that traffic crashes be reported to the
Department. Section 169.10 then requires the
Department to “…tabulate all crash reports and
publish annually statistical information based
thereon as to the number and circumstances of
traffic crashes…”
Section 169.09 specifies that a driver involved in a
crash that results in injury to or death of any
person or total property damage of $1,000 or more
must submit a report within ten days of the crash.
The law enforcement officer who investigates the
crash must also submit a report within ten days.
The minimum dollar amount for crashes involving
only property damage has changed over the years.
The first minimum was set at $50 in 1939. It was
raised to $100 in 1965, to $300 on August 1, 1977
and then to $500 on August 1, 1981. The current
minimum of $1,000 took effect August 1, 1994.
Crash Facts is divided into eleven sections. The
first section presents information on the aggregate
of all crashes reported to the state during the
preceding calendar year. The remaining ten
sections focus on specific areas of interest to
policy makers and the public. Section II deals
with alcohol-related crashes. Section III is about
the use of safety equipment by occupants of
vehicles required to be equipped with passenger
protection systems, including child safety seats
and safety belts. The following six sections focus
on crashes that involved motorcycles (section IV),
trucks (section V), pedestrians (section VI),
bicycles (section VII), school buses (section VIII)
and trains (section IX). Sections X and XI
summarize info on crashes involving teen and
senior drivers.
FIGURE 1
VEHICLES, DRIVERS AND FATALITY RATE, 1970 - 2015
0
1
2
3
4
5
6
19
701
971
19
721
973
19
741
975
19
761
977
19
781
979
19
801
981
19
821
983
19
841
985
19
861
987
19
881
989
19
901
991
19
921
993
19
941
995
19
961
997
19
981
999
20
002
001
20
022
003
20
042
005
20
062
007
20
082
009
20
102
011
20
122
013
20
142
015
Vehicles (Millions) Drivers (Millions) Fatality Rate (Per 100 Million Vehicle Miles Traveled)

Minnesota Motor Vehicle Crash Facts, 2015 page 4 Department of Public Safety, Office of Traffic Safety
TABLE 1
MINNESOTA TRAFFIC FATALITIES, 1910 - 2015 Since 1961: Vehicle Miles Traveled (Billions) and Fatality Rates (Per 100 Million VMT)
YEAR
(1)
Fatal-
ities
(2)
YEAR
(3)
Fatal-
ities
(4)
YEAR
(5)
Fatal-
ities
(6)
YEAR
(7)
Fatal-
ities
(8)
Vehicle
Miles
(9)
Fatal
Rate
(10)
YEAR
(11)
Fatal-
ities
(12)
Vehicle
Miles
(13)
Fatal
Rate
(14)
YEAR
(15)
Fatal-
ities
(16)
Vehicle
Miles
(17)
Fatal
Rate
(18)
1910 23 1929 505 1948 552 1961 724 14.5 4.99 1980 863 28.5 3.03 1999 626 50.7 1.24
1911 26 1930 561 1949 540 1962 692 15.1 4.58 1981 763 28.6 2.67 2000 625 52.4 1.19
1912 39 1931 622 1950 532 1963 798 15.3 5.22 1982 581 29.2 1.98 2001 568 53.2 1.07
1913 46 1932 486 1951 610 1964 841 16.2 5.19 1983 558 30.5 1.83 2002 657 54.4 1.21
1914 88 1933 525 1952 534 1965 875 16.8 5.21 1984 584 32.2 1.81 2003 655 55.4 1.18
1915 85 1934 641 1953 637 1966 977 17.7 5.52 1985 610 33.1 1.84 2004 567 56.5 1.00
1916 143 1935 596 1954 639 1967 965 18.7 5.16 1986 572 34.2 1.67 2005 559 56.5 0.99
1917 161 1936 649 1955 577 1968 1,060 19.9 5.33 1987 530 35.1 1.51 2006 494 56.6 0.87
1918 183 1937 630 1956 637 1969 988 20.8 4.75 1988 615 36.4 1.69 2007 510 57.4 0.89
1919 171 1938 609 1957 684 1970 987 22.4 4.41 1989 605 37.6 1.61 2008 455 57.3 0.79
1920 178 1939 576 1958 708 1971 1,024 23.4 4.38 1990 568 38.8 1.47 2009 421 56.9 0.74
1921 216 1940 577 1959 662 1972 1,031 24.9 4.14 1991 531 39.3 1.35 2010 411 56.8 0.72
1922 260 1941 626 1960 724 1973 1,024 25.2 4.06 1992 581 41.3 1.41 2011 368 56.7 0.65
1923 328 1942 439 1974 852 24.6 3.46 1993 538 42.3 1.27 2012 395 57.0 0.69
1924 366 1943 274 1975 777 25.6 3.04 1994 644 43.4 1.48 2013 387 57.0 0.68
1925 361 1944 356 1976 809 27.0 3.00 1995 597 44.1 1.35 2014 361 57.0 0.63
1926 326 1945 449 1977 856 28.1 3.05 1996 576 45.9 1.26 2015 411 59.1 0.70
1927 369 1946 536 1978 980 28.8 3.40 1997 600 46.9 1.28
1928 435 1947 572 1979 881 29.0 3.04 1998 650 48.5 1.34
NOTE: VMT data provided by the Minnesota Department of Transportation
FIGURE 2
MINNESOTA TRAFFIC FATALITIES, 1910 - 2015
0
1
2
3
4
5
6
7
0
200
400
600
800
1000
1200
11
19
15
19
23
27
31
19
35
39
43
47
51
19
55
59
63
67
71
19
75
79
83
87
91
19
95
99
'03
'07
11
15
Traffic Deaths Vehicle Miles Traveled Fatality Rate
Since 1961: Miles Traveled (in Ten Billions) and Fatality Rates (per 100 Million VMT)

Minnesota Motor Vehicle Crash Facts, 2015 page 5 Department of Public Safety, Office of Traffic Safety
TABLE 2
DRIVER LICENSE* SUMMARY BY AGE, 2010 - 2015
Age 2010 2011 2012 2013 2014 2015
15 28,020 25,422 25,946 25,324 26,393 30,120
16 49,634 48,260 47,801 48,013 48,263 49,306
17 55,885 54,781 54,489 53,744 54,190 54,818
18 61,526 59,722 59,220 58,706 58,202 58,766
19 66,272 63,997 63,212 62,642 62,349 61,692
20 69,495 67,176 65,539 64,972 64,503 63,314
Under 21 330,832 319,358 316,207 313,401 313,900 318,016
15 – 19 261,337 252,182 250,668 248,429 249,397 254,702
20 – 24 348,937 343,942 341,891 340,074 338,753 329,936
25 – 29 366,813 358,738 356,653 358,005 362,329 355,329
30 – 34 342,756 351,489 359,718 365,101 370,093 367,609
35 – 39 311,858 306,985 312,377 320,919 331,734 339,167
40 – 44 340,906 336,514 330,720 331,868 315,800 305,492
45 – 49 380,685 365,193 351,004 340,791 335,127 333,063
50 – 54 389,685 392,410 392,344 390,177 383,567 370,824
55 – 59 343,840 350,359 358,458 365,577 373,526 377,221
60 – 64 282,820 293,833 301,734 311,683 321,611 328,227
65 – 69 198,777 213,587 226,107 237,444 252,369 264,586
70 – 74 149,002 155,347 164,699 172,320 178,905 181,902
75 – 79 114,320 116,871 119,643 123,927 127,476 131,549
80 – 84 88,821 90,620 90,268 90,333 91,175 91,681
85 & Older 74,678 79,683 82,434 82,608 84,666 86,814
Total 3,995,235 4,007,753 4,038,718 4,069,256 4,116,528 4,118,102
* This information is provided by the Department of Public Safety, Driver and Vehicle Services Division (DVS). Counts of licensed drivers include drivers who only hold learner's permits.

Minnesota Motor Vehicle Crash Facts, 2015 page 6 Department of Public Safety, Office of Traffic Safety
TABLE 3
MOTOR VEHICLE REGISTRATIONS, 2010 - 2015
Type of Vehicle* 2010 2011 2012 2013 2014 2015
Passenger Vehicles 3,527,503 3,579,033 3,621,291 3,630,245 3,595,037 3,589,800
Pickup Trucks 828,305 832,463 829,965 882,136 966,978 1,062,344
Commercial Trucks 214,680 216,532 220,623 225,201 229,580 235,475
Recreational Vehicles 34,797 33,070 32,511 31,349 30,763 30,993
Motorcycles 229,912 232,274 237,278 235,909 236,040 238,243
Motorized Bicycles 15,682 16,016 16,378 16,035 15,956 15,932
School Buses 6,940 6,951 7,120 7,220 7,463 7,709
Other Buses 5,067 5,161 5,105 5,188 5,281 5,341
Van Pool 174 226 210 159 159 162
Tax Exempt Vehicles 52,061 53,420 53,175 54,682 54,508 56,268
Motor Vehicle Subtotal 4,915,121 4,975,146 5,023,656 5,088,124 5,141,765 5,242,267
Other Registrations*
Trailers 1,665,491 1,715,404 1,773,595 1,830,458 1,888,825 1,956,022
Classic Motor Vehicles 179,771 186,586 192,649 198,716 182,581 212,218
Classic Motorcycles 9,487 10,489 11,070 11,993 12,807 13,500
Other Subtotal 1,854,749 1,912,479 1,977,314 2,041,167 2,084,213 2,181,740
Total Registrations 6,769,870 6,887,625 7,000,970 7,129,291 7,225,978 7,424,007
* Information provided by Department of Public Safety, Driver and Vehicle Services Division.
Minnesota license plates on a vehicle signify that it has been registered with the state and that the owner has paid the
registration fee. The vehicle classification used for registration purposes is similar, but not identical, to the vehicle
classification (shown in Tables 1.11 and 1.12) police use in reporting accidents. Following are some notes on the registration
categories shown above:
Passenger Vehicles include cars, SUV’s and Vans (except for a "Van Pool," which is a Van used exclusively for car
pooling purposes).
Pickup Trucks are rated three-fourths ton or less.
Motorcycles have engines exceeding 50 cc; otherwise the vehicle is classified as a Motorized Bicycle (Moped).
Tax exempt Vehicles are vehicles owned by city, county, or state offices. They have license plates but no registration
fees are paid on them. (Police and fire department vehicles are tax exempt but are not included since they do not have
state license plates and are not registered.)
Trailers (such as utility trailers pulled by cars, or semi or twin trailers pulled by trucks) are pulled by motorized
vehicles and do not themselves have motors.
Classic Motor Vehicles and Classic Motorcycles must be at least 20 years old and cannot be used for normal
transportation purposes. They can only be driven, for example, to car shows.

Minnesota Motor Vehicle Crash Facts, 2015 page 7 Department of Public Safety, Office of Traffic Safety
I. ALL CRASHES
Overview of Traffic Crashes in Minnesota
If a traffic crash in Minnesota meets certain criteria, the law
states that data concerning that crash must be reported to the
Department of Public Safety. In the recent past, over 70,000
traffic crashes each year have been reported. Reducing the
number of traffic crashes remains a challenge each year for
public safety officials. By the end of calendar year 2015:
The population of Minnesota increased to 5.45 million
Over 5 million motor vehicles were registered
There were 4 million licensed drivers
Over 59 billion miles were driven in Minnesota
As these numbers steadily increase, the citizens of Minnesota
face an extreme challenge in reducing the number and severity
of traffic crashes.
Crashes decrease, fatalities increase in 2015
There were 74,772 traffic crashes reported to Public Safety in
2015, a decrease of 4.6% from 2014. There were 411 deaths
on Minnesota roads, a 13.9% increase from the previous year.
However, our roads are relatively safe. Traffic deaths in
Minnesota have decreased dramatically overall in the past
decade. There are many factors for the continued improvement
in traffic safety, but much can be credited to strengthened
traffic safety laws, enhanced enforcement, education and
outreach, engineering and emergency trauma care. These
elements are all part of the state’s Toward Zero Deaths (TZD)
initiative — a multidisciplinary program addressing traffic
issues at the local level.
Traffic Crashes in 2015
The following facts give an overall picture of 2015 traffic
crashes. In addition to the 411 killed:
29,981 people were injured
1,127 of these were severe injuries
7,251 of these were moderate injuries
21,603 of these were minor injuries
181,663 people were involved in crashes
138,057 motor vehicles were involved in crashes
898 crashes involved at least 1 bicyclist
911 crashes involved at least 1 pedestrian
One-third of all crashes involved just one vehicle
One in five fatalities were less than 25 years of age
3 of 4 fatalities occurred in rural areas (< 5,000 population)
7,425 crashes were classified as “hit-and-run”
The economic loss to Minnesota was over $1.7 billion
WHO was involved
Among drivers, young people and males are over-represented
in traffic crashes in Minnesota. There are 4,118,102 licensed
drivers in the state. People aged 15- 24 make up 14.2% of the
licensed drivers, yet they accounted for 23.4% of the crash-
involved drivers. Drivers aged 20-24 are the worst, from this
perspective. In 2015, they represented just 8.0% of the
licensed drivers, but 13.4% of all crash-involved drivers. By
contrast drivers over 65 made up 18.3% of the driving
population, but accounted for just 9.0% of the crash-involved
drivers. Crash-involved drivers are also more likely to be
males: 73.8% of drivers in fatal crashes were male; 54.4% of
drivers in all crashes were male. However, although fatal
crash-involved drivers are largely male, the number of female
drivers involved in fatal crashes increased at a higher rate than
males in 2015. One hundred forty-seven female drivers were
involved in fatal crashes last year, which represents a 15%
increase from the previous year. This compares with an 11%
increase in male driver involvement (437 males were involved
in fatal crashes).
Traffic crashes are a leading cause of death in young people.
In the state last year, 113 people under age 30 died in crashes,
representing 27% of all traffic deaths. As noted, the National
Safety Council reports that crashes (from all causes) are the
leading cause of death among persons aged 1 to 34.
Among people injured, young people especially pay the price.
There were 11,989 people under age 30 who were injured,
representing 40% of the total number of people injured.
WHY they happened
An officer at the scene will list zero, one or two contributing
factors for each ‘vehicle’ involved in a crash. The ‘cause’ of a
crash is sometimes not entirely clear as vehicular factors in a
crash may be listed alongside human factors. However,
vehicular factors are not cited as often as human factors.
About one-third of all crashes involve only one vehicle and
about two-thirds involve two or more vehicles. Single-vehicle
and multiple-vehicle crashes have different characteristics. In
single-vehicle crashes, illegal or unsafe speed is the
contributing factor cited most often for all drivers. For drivers
15-19 years old, driver inexperience and overcorrecting were
also among the most frequently cited factors. In multiple-
vehicle crashes, for drivers through age 64, driver inattention
or distraction is cited most often and failure to yield right of
way is cited second most often. After age 65, the pattern
reverses: failing to yield is most common and inattention or
distraction is second most common.
“Hit-and-run” crashes accounted for 7,425 (10%) of all
crashes. Fatal hit and run crashes are few. Only 12 occurred
in 2015; however, 10 (83%) of those involved pedestrians.

Minnesota Motor Vehicle Crash Facts, 2015 page 8 Department of Public Safety, Office of Traffic Safety
WHAT the conditions were
Victims of traffic crashes are mostly car, pickup, sport
utility vehicle (SUV) or van occupants. Of the 411 traffic
fatalities, 281 (65%) were from these 4 vehicle types. There
were also 41 pedestrians, 61 motorcyclists and 10 bicyclists
who died in traffic crashes. There were 10 deaths to ATV
riders, 4 deaths involving commercial motor vehicles and 2
deaths among farm equipment.
A collision with another vehicle is the leading crash type.
About 48% of the fatal crashes and 67% of all crashes
involve one vehicle colliding with another vehicle. In fatal
and injury crashes, collisions with fixed objects and
overturns are also common. For property damage crashes,
the other leading crash types are collision with fixed object
and collision with a parked motor vehicle.
Most crashes occur in good driving conditions. Over half of
fatal crashes and over two-thirds of nonfatal crashes
occurred during daylight hours. A majority of crashes occur
in good weather conditions. Nearly two-thirds of all crashes
occur during “clear” weather. Road surface conditions
where crashes occurred were usually good. For fatal
crashes, 81% were on dry roads, 10% were on wet roads and
7% were on snowy or icy roads.
WHERE they happened
Fatal crashes tend to occur on roads in rural areas that
permit high speeds and do not have interstate-type safety
designs. Last year, 262 (70%) fatal crashes occurred in rural
areas, which are defined as having a population of less than
5,000 people. Additionally, 125 (33%) of all fatal crashes
occurred on county state aid highways and 93 of those were
in rural areas. Injury and property damage crashes are more
common in urban areas. Over three-fourths happened inside
cities of 5,000 or more population. The seven county metro
area, with over half the state's population, accounted for
only 25% of the fatal crashes, but 63% of all crashes.
WHEN they occurred
A fatal traffic crash is most likely to occur during the
morning and afternoon rush-hour time periods (6:00-9:00
a.m. and 3:00-6:00 p.m.). This has changed since the early
1990s when most fatal crashes occurred at night during the
time period of 10:00 p.m.-2:00 a.m. This phenomenon may
be explained by the smarter deployment of law enforcement,
increased seat belt usage and the public’s awareness of the
dangers of drinking and driving. As for total crashes, the six
hour time period of 12:00-6:00 p.m. had the most. In that
time frame, 45% of all crashes occurred. This has not
changed over the years. Indeed, Figure 1.03 shows that the
afternoon time period is truly a dangerous time to be
driving.
Fridays, Saturdays and Sundays accounted for 168 of the
375 fatal crashes (45%). Total crashes are more evenly
distributed across days of the week, although Tuesdays had
the most (16%) and Sundays had the least (10%).
As a general rule, harsh winter weather results in more
traffic crashes. In other words, there are more ‘fender-
benders’ during icy and snowy conditions. January of 2015
followed this axiom. Because of severe weather, January
had the most crashes reported of any month (7,625). As a
general rule, warmer weather produces more fatalities. June
had the most with 46 fatalities. As mentioned earlier,
though, factors other than the weather are also involved.
These include speeding, drinking and driving, not wearing a
seat belt and not paying attention while driving.
Can traffic crashes be prevented?
On average over the past decade, about 420 people have
been killed and 30,000 injured every year on our roadways.
Minnesota is still experiencing a number of traffic crashes
that is cause for concern. In a public health sense, epidemics
that kill and injure fewer people are usually attacked
vigorously until they are no longer a threat to public safety.
The Department of Public Safety (DPS) uses the term
“crash” instead of “accident.” This is because a traffic crash
can be prevented. Coupled with enforcement, education,
engineering and emergency trauma solutions, changes in the
behavior of all drivers will surely help attack the public
threat of tragic roadway fatalities and injuries.
DPS implores the reader to spread the word: Driving is a
privilege; aggressive driving is not. Buckle up. Drive at safe
speeds. Pay attention. Never drive impaired.

Minnesota Motor Vehicle Crash Facts, 2015 page 9 Department of Public Safety, Office of Traffic Safety
TABLE 1.01
TRAFFIC SAFETY STATISTICS SUMMARY, 1965 - 2015
Year
(a)
Total
Crashes
(b)
Persons
Killed
(c)
Persons
Injured
(d)
Licensed
Drivers
(million)
(e)
Motor
Vehicles
(MV)
(million)
(f)
State
Popu-
lation
(million)
(g)
Vehicle
Miles
Traveled
(VMT)
(billion)
(h)
Crash
Rates
Per
100,000
MV
(i)
Crash
Rates
Per
100,000
Popu-
lation
(j)
Crash
Rates
Per 100
Mil
VMT
(k)
Fatality
Rates
Per
100,000
MV (l)
Fatality
Rates
Per
100,000
Popu-
lation (m)
Fatality
Rates
Per100
Mil
VMT (n)
1965 83,329 875 50,847 1.85 1.86 3.57 16.8 4,480 2,334 496 47.0 24.5 5.20
1970 99,404 987 38,538 2.05 2.24 3.80 22.4 4,438 2,616 444 44.1 26.0 4.40
1975 123,206 777 41,931 2.51 2.69 3.92 25.6 4,580 3,143 481 28.9 19.8 3.00
1980 103,612 863 45,227 2.77 3.01 4.08 28.5 3,446 2,546 364 28.7 21.2 3.03
1981 97,879 763 43,739 2.83 3.09 4.10 28.6 3,163 2,387 342 24.7 18.6 2.67
1982 89,443 581 38,692 2.87 3.01 4.13 29.2 2,972 2,181 304 19.3 14.2 1.98
1983 97,371 558 41,086 2.90 3.03 4.15 30.5 3,214 2,356 319 18.4 13.5 1.83
1984 93,741 584 41,808 2.91 3.13 4.16 32.2 2,995 2,262 291 18.7 14.1 1.81
1985 99,168 610 44,316 3.04 3.22 4.19 33.1 3,080 2,380 300 18.9 14.7 1.84
1986 95,460 572 42,130 3.07 3.25 4.21 34.2 2,937 2,266 279 17.6 13.6 1.67
1987 94,095 530 42,091 3.10 3.31 4.25 35.1 2,840 2,233 268 16.0 12.6 1.51
1988 102,094 615 44,415 3.13 3.39 4.31 36.4 3,012 2,371 280 18.1 14.3 1.69
1989 105,996 605 45,404 3.16 3.46 4.35 37.6 3,060 2,435 282 17.5 13.9 1.61
1990 99,236 568 44,634 3.18 3.52 4.38 38.8 2,817 2,268 256 16.1 13.0 1.47
1991 101,419 531 42,748 3.22 3.51 4.43 39.3 2,890 2,288 258 15.1 12.0 1.35
1992 96,808 581 43,249 3.27 3.55 4.48 41.3 2,730 2,161 235 16.4 13.0 1.41
1993 100,907 538 44,987 3.28 3.48 4.52 42.3 2,899 2,234 239 15.5 11.9 1.27
1994 99,701 644 46,403 3.34 3.67 4.57 43.4 2,720 2,183 230 17.6 14.1 1.48
1995 96,022 597 47,161 3.39 3.68 4.61 44.1 2,606 2,083 218 16.2 13.0 1.35
1996 105,332 576 48,963 3.46 3.70 4.66 45.9 2,845 2,261 230 15.6 12.4 1.26
1997 98,625 600 46,064 3.49 3.77 4.69 46.9 2,065 2,105 210 12.6 12.8 1.28
1998 92,926 650 45,115 3.53 3.90 4.74 48.5 2,380 1,962 192 16.6 13.7 1.34
1999 96,813 626 44,538 3.54 3.92 4.78 50.7 2,470 2,027 191 16.0 13.1 1.24
2000 103,591 625 44,740 3.65 4.20 4.92 52.4 2,469 2,106 198 14.9 12.7 1.19
2001 98,984 568 42,223 3.69 4.38 4.97 53.2 2,262 1,991 186 13.0 11.4 1.07
2002 94,969 657 40,677 3.76 4.49 5.02 54.4 2,115 1,892 175 14.6 13.1 1.21
2003 N/A 655 N/A 3.79 4.56 5.09 55.4 N/A N/A N/A 14.4 12.9 1.18
2004 91,274 567 40,073 3.85 4.63 5.14 56.5 1,971 1,774 162 12.2 11.0 1.00
2005 87,813 559 37,686 3.87 4.69 5.21 56.5 1,873 1,687 155 11.9 10.7 0.99
2006 78,745 494 35,025 3.87 4.76 5.23 56.6 1,654 1,505 139 10.4 9.4 0.87
2007 81,505 510 35,318 3.91 4.82 5.26 57.4 1,691 1,548 142 10.6 9.7 0.89
2008 79,095 455 33,379 3.94 4.86 5.29 57.3 1,628 1,494 138 9.4 8.6 0.79
2009 73,498 421 31,074 3.95 4.87 5.30 57.0 1,510 1,387 129 8.7 7.9 0.74
2010 74,073 411 31,176 4.00 4.92 5.30 56.8 1,507 1,397 130 8.4 7.5 0.72
2011 72,117 368 30,295 4.01 4.98 5.33 56.7 1,450 1,352 127 7.4 6.9 0.65
2012 69,236 395 29,314 4.04 5.02 5.37 57.0 1,378 1,290 122 7.9 7.4 0.69
2013 77,707 387 30,653 4.07 5.09 5.40 57.0 1,527 1,439 136 7.6 7.2 0.68
2014 78,396 361 29,439 4.12 5.14 5.42 57.0 1,525 1,446 138 7.0 6.7 0.63
2015 74,772 411 29,981 4.12 5.24 5.45 59.1 1,426 1,371 126 7.8 7.5 0.70
Note:
(1) By State statute, information on traffic crashes must be reported to the Department of Public Safety if the crashes involve motor
vehicles in transport on Minnesota roadways and have at least $1,000 in property damage, or a motor vehicle occupant,
pedestrian, or bicyclist is injured or killed.
(2) The numbers shown for licensed drivers includes those who have only permits.
(3) Vehicle miles traveled are provided by Minnesota Department of Transportation and estimated using a 3% growth rate
calculated from continuous count location data.
(4) Numbers of licensed drivers and registered motor vehicles are provided by the Driver and Vehicle Services Division, Minnesota
Department of Public Safety.

Minnesota Motor Vehicle Crash Facts, 2015 page 10 Department of Public Safety, Office of Traffic Safety
TABLE 1.02
TRAFFIC CRASH TRENDS 2010 - 2015
2010 2011 2012 2013 2014 2015 Record High
Fatal Crashes 364 334 349 357 324 375 878 (1973)
Injury Crashes 22,013 21,662 20,972 21,960 21,257 21,516 33,686 (1978)
Severe 974 954 1,044 981 862 932 5,109 (1984)1
Moderate 5,792 5,581 5,423 5,563 5,302 5,721 12,326 (1985)1
Minor 15,247 15,127 14,505 15,416 15,093 14,863 18,578 (1996)1
PDO Crashes 51,696 50,121 47,915 55,390 56,815 52,881 94,810 (1975)
Total Crashes 74,073 72,117 69,236 77,707 78,396 74,772 123,106 (1975)
Total Injuries 31,176 30,295 29,314 30,653 29,439 29,981 50,332 (1978)
Severe 1,191 1,159 1,268 1,216 1,044 1,127 6,573 (1984)1 Moderate 7,445 7,110 6,902 7,109 6,712 7,251 17,670 (1985)1 Minor 22,540 22,026 21,144 22,328 21,683 21,603 28,631 (1996)1
Total Fatalities 411 368 395 387 361 411 1,060 (1968)
Motor Vehicle Occupant 305 271 276 269 278 285 544 (2002)1 Motorcycle 45 42 55 60 46 61 121 (1980) Pedestrian 36 40 40 35 17 41 157 (1971) Bicycle 9 5 7 6 5 10 24 (1977) All Terrain Vehicle 8 8 9 7 7 10 10 (2008) Commercial Bus 3 0 1 2 4 1 9 (1984) Farm Equipment 2 2 2 5 1 2 N/A N/A Other Vehicle Type 3 0 5 3 3 1 N/A N/A
Minnesota Fatality Rate2 0.72 0.65 0.69 0.68 0.63 0.70 23.6 (1934)
U.S. Fatality Rate2 1.11 1.10 1.14 1.11 1.10 1.07 18.0 (1925)
Minnesota Economic Loss (millions) $1,477 $1,481 $1,514 $1,588 $1,604 $1,773 $1,773 (2015)3
1 The available records on which these categories "record highs" are based only go back to 1984. 2 Rate is based on 100 million vehicle miles of travel. 3 Economic cost estimates are based upon wage and productivity losses, medical expenses, administrative expenses, motor
vehicle damage and employers’ uninsured costs, among other factors.

Minnesota Motor Vehicle Crash Facts, 2015 page 11 Department of Public Safety, Office of Traffic Safety
TABLE 1.03
2015 FATALITIES BY TRAFFIC ROLE, GENDER AND AGE
Note: The vehicle types for the 14 fatalities in the ‘Other Motor Vehicle’ category consisted of:
ten ATVs, two farm equipment, one commercial bus and one other vehicle type.
Type of
Vehicle
Position in
Vehicle Gender
Age
0-9
Age
10-19
Age
20-29
Age
30-39
Age
40-49
Age
50-59
Age
60-69
Age 70
and
Older Total
Car Driver Male 0 5 24 15 5 11 11 14 85
Female 0 6 6 3 7 9 7 11 49
Passenger Male 1 5 1 0 2 1 1 1 12
Female 0 2 5 1 0 1 1 5 15
Pickup Driver Male 0 4 9 8 5 11 7 8 52
Female 0 0 0 1 0 1 0 0 2
Passenger Male 0 3 1 2 0 2 0 0 8
Female 1 1 1 0 0 1 1 0 5
SUV Driver Male 0 0 3 2 3 2 2 7 19
Female 0 1 3 1 2 0 1 0 8
Passenger Male 0 1 0 0 0 0 1 2 4
Female 0 2 0 0 1 0 0 5 8
Van Driver Male 0 0 1 0 1 3 0 2 7
Female 0 0 1 0 1 0 0 0 2
Passenger Male 0 0 0 0 1 0 0 1 2
Female 0 1 0 0 0 0 0 2 3
Truck Driver Male 0 0 0 1 1 0 0 2 4
Female 0 0 0 0 0 0 0 0 0
Passenger Male 0 0 0 0 0 0 0 0 0
Female 0 0 0 0 0 0 0 0 0
Motorcycle Driver Male 0 0 9 8 8 16 9 2 52
Female 0 0 0 0 0 0 0 0 0
Passenger Male 0 0 0 0 1 0 0 0 1
Female 0 0 0 2 3 2 1 0 8
Other Driver Male 0 0 1 2 0 2 2 2 9
Motor Female 0 0 0 0 0 0 0 0 0
Vehicle Passenger Male 0 1 1 0 0 1 1 0 4
Female 0 1 0 0 0 0 0 0 1
Bicyclist Male 0 0 2 0 2 2 1 1 8
Female 0 0 0 0 1 1 0 0 2
Pedestrian Male 2 1 4 4 4 5 2 6 28
Female 1 0 2 2 1 1 5 1 13
Total Male 3 20 56 42 33 56 37 48 295
Fatalities Female 2 14 18 10 16 16 16 24 116
Total 5 34 74 52 49 72 53 72 411

Minnesota Motor Vehicle Crash Facts, 2015 page 12 Department of Public Safety, Office of Traffic Safety
TABLE 1.04
AGE AND GENDER OF PERSONS KILLED OR INJURED IN 2015 CRASHES
Age
Group
Males
Killed
Females
Killed
Total
Killed
Males
Injured
Females
Injured
Unknown
Injured
Total
Injured
00 - 03 0 1 1 186 162 4 352
04 - 10 3 2 5 435 434 9 878
11 - 14 3 4 7 287 332 8 627
Total < 15: 6 7 13 908 928 21 1,857
15 2 0 2 131 162 1 294
16 1 4 5 308 401 2 711
17 3 0 3 332 382 2 716
18 6 1 7 387 396 4 787
19 5 4 9 381 348 1 730
20 9 1 10 373 403 0 776
Total
15-20: 26 10 36 1,912 2,092 10 4,014
Total < 21: 32 17 49 2,820 3,020 31 5,871
00 - 04 0 1 1 240 206 5 451
05 - 09 3 1 4 328 324 8 660
10 - 14 3 5 8 340 398 8 746
15 - 19 17 9 26 1,539 1,689 10 3,238
20 - 24 35 10 45 1,824 1,871 7 3,702
25 - 29 21 8 29 1,567 1,619 6 3,192
30 - 34 25 4 29 1,313 1,442 5 2,760
35 - 39 17 6 23 1,025 1,208 1 2,234
40 - 44 13 10 23 973 970 3 1,946
45 - 49 20 6 26 945 1,030 1 1,976
50 - 54 32 10 42 993 1,087 0 2,080
55 - 59 24 6 30 969 951 5 1,925
60 - 64 20 6 26 723 735 4 1,462
65 - 69 17 10 27 513 592 0 1,105
70 - 74 11 6 17 326 372 0 698
75 - 79 15 6 21 210 263 1 474
80 - 84 11 4 15 160 176 1 337
85 + 11 8 19 132 135 2 269
Unknown 0 0 0 190 201 335 726
Total: 295 116 411 14,310 15,269 402 29,981
See Figure 1.01 on page 15 for a graphical depiction of how many persons were killed and injured by age and gender
groups.

Minnesota Motor Vehicle Crash Facts, 2015 page 13 Department of Public Safety, Office of Traffic Safety
TABLE 1.05
AGE AND GENDER OF DRIVERS IN 2015 CRASHES
Age
Group
Male
Drivers
in Fatal
Crashes
Female
Drivers
in Fatal
Crashes
Driver
Gender
Not Stated
in Fatal
Crashes
Total in
Fatal
Crashes
Male
Drivers
in All
Crashes
Female
Drivers
in All
Crashes
Driver
Gender is
Not Stated
in All
Crashes
Total in
All
Crashes
<15 0 0 0 0 35 19 0 54
15 0 1 0 1 113 108 5 226
16 3 5 0 8 1,369 1,425 0 2,794
17 5 5 0 10 1,693 1,590 0 3,283
18 8 4 0 12 1,939 1,587 4 3,530
19 8 5 0 13 1,865 1,474 7 3,346
20 14 2 0 16 1,968 1,627 10 3,605
All <21 38 22 0 60 8,982 7,830 26 16,838
00 - 04 0 0 0 0 1 1 0 2
05 - 09 0 0 0 0 3 3 0 6
10 - 14 0 0 0 0 31 15 0 46
15 - 19 24 20 0 44 6,979 6,184 16 13,179
20 - 24 48 13 0 61 9,607 7,997 62 17,666
25 - 29 42 16 0 58 8,530 6,842 69 15,441
30 - 34 46 11 1 58 7,368 5,793 48 13,209
35 - 39 28 10 0 38 6,291 4,756 35 11,082
40 - 44 27 12 0 39 5,528 4,078 22 9,628
45 - 49 29 12 0 41 5,365 3,929 22 9,316
50 - 54 45 15 0 60 5,583 3,856 27 9,466
55 - 59 47 8 0 55 5,139 3,459 15 8,613
60 - 64 24 6 0 30 4,007 2,645 16 6,668
65 - 69 25 7 0 32 2,754 1,863 13 4,630
70 - 74 14 4 0 18 1,688 1,240 7 2,935
75 - 79 18 3 0 21 1,084 844 4 1,932
80 - 84 11 4 0 15 747 565 2 1,314
85+ 9 6 0 15 583 450 2 1,035
Unk 0 0 6 6 490 239 5,095 5,824
Total 437 147 7 591 71,778 54,759 5,455 131,992
Most crashes involve more than one driver, causing the total number of drivers to exceed the total number of crashes.
(Pedestrians and bicyclists are not counted in this table.)

Minnesota Motor Vehicle Crash Facts, 2015 page 14 Department of Public Safety, Office of Traffic Safety
TABLE 1.06
LICENSED VERSUS CRASH-INVOLVED DRIVERS BY AGE, 2015
Age Group
Percentage of
All Licensed
Drivers
Percentage of
Drivers in
Fatal Crashes
Percentage of
Drivers in
Injury
Crashes
Percentage of
Drivers in
Property
Damage
Crashes
Percentage of
Drivers in All
Crashes
14 & Younger 0.0% 0.0% 0.1% 0.0% 0.0%
15 0.7% 0.2% 0.2% 0.2% 0.2%
16 1.2% 1.4% 2.0% 2.2% 2.1%
17 1.3% 1.7% 2.3% 2.6% 2.5%
18 1.4% 2.0% 2.6% 2.7% 2.7%
19 1.5% 2.2% 2.5% 2.6% 2.5%
20 1.5% 2.7% 2.6% 2.8% 2.7%
Total < 21 7.7% 10.2% 12.4% 12.9% 12.8%
15 - 19 6.2% 7.4% 9.7% 10.1% 10.0%
20 - 24 8.0% 10.3% 13.1% 13.5% 13.4%
25 - 29 8.6% 9.8% 11.7% 11.7% 11.7%
30 - 34 8.9% 9.8% 10.1% 10.0% 10.0%
35 - 39 8.2% 6.4% 8.7% 8.3% 8.4%
40 - 44 7.4% 6.6% 7.5% 7.2% 7.3%
45 - 49 8.1% 6.9% 7.3% 6.9% 7.1%
50 - 54 9.0% 10.2% 7.6% 7.0% 7.2%
55 - 59 9.2% 9.3% 6.8% 6.4% 6.5%
60 - 64 8.0% 5.1% 5.4% 4.9% 5.1%
65 - 69 6.4% 5.4% 3.9% 3.4% 3.5%
70 - 74 4.4% 3.1% 2.4% 2.2% 2.2%
75 - 79 3.2% 3.6% 1.6% 1.4% 1.5%
80 - 84 2.2% 2.5% 1.1% 1.0% 1.0%
85 & Older 2.1% 2.5% 0.8% 0.8% 0.8%
Age Not Stated 0.0% 1.0% 2.4% 5.3% 4.4%
Total Percent 100% 100% 100% 100% 100%
Total Number 4,118,102
See Figure 1.02 on page 15 for a graphical depiction of crash-involved drivers compared to
licensed drivers by age group.

Minnesota Motor Vehicle Crash Facts, 2015 page 15 Department of Public Safety, Office of Traffic Safety
FIGURE 1.01
AGE AND GENDER OF PERSONS KILLED OR INJURED, 2015
FIGURE 1.02
LICENSED VERSUS CRASH-INVOLVED DRIVERS BY AGE, 2015
2000
1800
1600
1400Female Male
Nu
mb
er
1200
1000
800
600
400
200
0-4
5-9
10
-14
0
15
-19
20
-24
25
-29
30
-34
35
-39
40
-44
45
-49
50
-54
55
-59
60
-64
65
-69
70
-74
75
-79
80
-84
85
+
Age Group
0%
2%
4%
6%
8%
10%
12%
14%
16%
0-1
4
15
-19
20
-24
25
-29
30
-34
35
-39
40
-44
45
-49
50
-54
55
-59
60
-64
65
-69
70
-74
75
-79
80
-84
85
+
Pe
rce
nt
Age Group
Percent of All Drivers in Population
Percent of All Drivers in Crashes

Minnesota Motor Vehicle Crash Facts, 2015 page 16 Department of Public Safety, Office of Traffic Safety
TABLE 1.07
PERCENTAGE OF DRIVERS IN 2015 CRASHES BY AGE AND FIRST HARMFUL EVENT*
First Harmful Event
Age
Group
15-19
Age
Group
20-24
Age
Group
25-29
Age
Group
30-34
Age
Group
35-64
Age
Group
65-79
Age
Group
80 +
All
Ages
Collision With:
Other Motor Vehicle 76.5% 78.4% 80.8% 82.5% 83.9% 83.6% 81.8% 80.5%
Parked Motor Vehicle 3.8% 3.4% 3.3% 2.9% 2.8% 3.3% 4.8% 4.3%
Bicycle 0.3% 0.5% 0.6% 0.6% 0.7% 0.8% 1.3% 0.7%
Pedestrian 0.4% 0.5% 0.7% 0.6% 0.6% 0.9% 1.4% 0.7%
Deer 0.8% 1.2% 1.2% 1.5% 2.2% 2.4% 0.9% 1.6%
Other Animal 0.1% 0.1% 0.1% 0.2% 0.2% 0.1% 0.0% 0.1%
Railroad Train 0.0% 0.1% 0.0% 0.1% 0.0% 0.0% 0.1% 0.0%
Fixed Object 12.9% 11.8% 10.0% 8.8% 6.7% 6.1% 7.6% 8.7%
Other Object 0.2% 0.3% 0.3% 0.3% 0.3% 0.3% 0.4% 0.3%
Non-Collision:
Overturn 3.8% 2.7% 1.9% 1.6% 1.5% 1.3% 0.7% 1.9%
Other Non-Collision 0.2% 0.3% 0.3% 0.3% 0.3% 0.3% 0.1% 0.3%
Other or Unknown 0.8% 0.8% 0.8% 0.7% 0.8% 0.9% 0.9% 0.8%
Total Percent 100.0% 100.0% 100.0% 100.0% 100.0% 100.0% 100.0% 100.0%
Total Drivers 13,179 17,666 15,441 13,209 54,773 9,497 2,352 131,992
*Percentages are based on the number of crash-involved drivers in each age group (some driver ages are not
available). Bicyclists and pedestrians are not counted as drivers in this table.
TABLE 1.08 DRIVERS IN 2015 CRASHES BY PHYSICAL CONDITION*
Physical Condition
Drivers in
Fatal
Crashes
Drivers in
Injury
Crashes
Drivers in
Property
Damage
Crashes Drivers in
All Crashes
Normal 339 32,743 76,448 109,530
Under the Influence 36 1,107 1,505 2,648
Had Been Drinking 29 416 424 869
Commercial Driver .04+ 0 0 1 1
Had Been Using Drugs 5 99 91 195
Aggressive 1 11 36 48
Fatigued/Asleep 1 198 283 482
Physical Disability 0 37 37 74
Ill 1 68 43 112
Other 8 165 143 316
Unknown 171 3,608 13,938 17,717
Total 591 38,452 92,949 131,992
* As noted by police officer on accident report. Note that in the absence of alcohol or drug test results
(not usually available at the time the crash report is completed), officers are conservative in reporting
impairment. Compare these figures with those from Section II. Pedestrians and bicyclists are
excluded from this table.

Minnesota Motor Vehicle Crash Facts, 2015 page 17 Department of Public Safety, Office of Traffic Safety
TABLE 1.09
SINGLE-VEHICLE CRASHES: CONTRIBUTING FACTORS, BY PERCENT, WITHIN DRIVER AGE GROUPS, 2015
Contributing Factor
Age
Group
15-19
Age
Group
20-24
Age
Group
25-29
Age
Group
30-34
Age
Group
35-64
Age
Group
65-79
Age
Group
80+
All
Ages
Human Factors
Illegal/Unsafe Speed 22.1% 24.6% 24.2% 22.7% 19.8% 13.3% 7.6% 21.8%
Driver Inattention or Distraction 13.9% 14.2% 14.5% 12.4% 13.3% 18.7% 23.6% 14.0%
Chemical Impairment 3.4% 11.3% 11.8% 11.6% 9.4% 2.7% 0.0% 8.7%
Overcorrecting 11.7% 9.5% 8.0% 8.1% 7.3% 6.6% 4.9% 8.6%
Driver Inexperience 15.5% 3.7% 2.5% 1.8% 1.4% 0.5% 0.4% 4.6%
Improper/Unsafe Lane Use 1.8% 2.3% 3.4% 3.3% 3.0% 4.6% 2.7% 3.0%
Improper Turn 0.7% 1.0% 0.5% 0.9% 1.5% 2.3% 2.2% 1.2%
Disregard for Traffic Control Device 0.6% 0.7% 0.3% 0.7% 0.8% 0.9% 1.8% 0.7%
Following Too Closely 0.3% 0.7% 0.5% 0.6% 0.7% 0.6% 0.0% 0.6%
Driving Left of Center (not passing) 0.4% 0.6% 0.5% 0.5% 0.7% 0.7% 2.7% 0.6%
Vison Obscured 0.5% 0.3% 0.2% 0.8% 0.7% 1.1% 2.2% 0.5%
Unsafe Backing 0.3% 0.2% 0.2% 0.3% 0.3% 0.5% 0.9% 0.3%
Failure to Yield Right of Way 0.3% 0.2% 0.2% 0.3% 0.4% 0.5% 0.9% 0.3%
Improper Passing/Overtaking 0.4% 0.4% 0.4% 0.3% 0.2% 0.0% 0.9% 0.3%
Driver on Phone/CB/Radio 0.1% 0.3% 0.2% 0.1% 0.2% 0.0% 0.4% 0.2%
Improper Park/Stop/Start 0.2% 0.0% 0.0% 0.1% 0.3% 0.0% 0.9% 0.2%
Impeding Traffic 0.1% 0.0% 0.2% 0.0% 0.1% 0.0% 0.0% 0.1%
Failure to Use Lights 0.0% 0.0% 0.0% 0.2% 0.0% 0.0% 0.0% 0.0%
Improper/No Signal 0.0% 0.0% 0.0% 0.0% 0.0% 0.0% 0.0% 0.0%
Other Human Factor 4.0% 5.4% 6.1% 5.5% 7.1% 14.9% 22.2% 6.4%
Vehicular Factors
Skidding 7.3% 6.2% 7.0% 7.4% 7.5% 7.7% 4.4% 7.1%
Defective Breaks 1.2% 1.7% 1.4% 2.1% 2.1% 1.5% 1.3% 1.7%
Other Vehicle Factor 0.8% 0.9% 1.3% 0.9% 1.5% 1.8% 1.3% 1.1%
Miscellaneous Factors
Weather 10.3% 10.3% 11.5% 13.0% 13.2% 13.0% 8.0% 11.6%
Other 4.3% 5.5% 5.3% 6.8% 8.6% 8.3% 10.7% 6.8%
Total Percent 100.0% 100.0% 100.0% 100.0% 100.0% 100.0% 100.0% 100.0%
Total Contributing Factors Cited 3,197 3,491 2,453 1,769 5,734 854 225 18,048
Drivers for Whom There Was
"No Clear Contributing Factor" 210 310 265 241 1,182 174 27 2,449
Total Number of Drivers 2,375 2,870 2,091 1,635 5,948 969 221 16,849
Percentages are based on all contributing factors cited within each age group (some driver ages are not available).
Zero, one, or two contributing factors may be associated with each driver. The percentages may not sum to 100%
due to rounding. Contributing factors for bicyclists and pedestrians are excluded.
For contributing factors in multiple-vehicle crashes, see Table 1.10. For contributing factors in crashes at different
levels of severity, see Table 1.17.

Minnesota Motor Vehicle Crash Facts, 2015 page 18 Department of Public Safety, Office of Traffic Safety
TABLE 1.10
MULTIPLE-VEHICLE CRASHES: CONTRIBUTING FACTORS, BY PERCENT, WITHIN DRIVER AGE GROUPS, 2015
Contributing Factor
Age
Group
15-19
Age
Group
20-24
Age
Group
25-29
Age
Group
30-34
Age
Group
35-64
Age
Group
65-79
Age
Group
80 + All Ages
Human Factors
Driver Inattention or Distraction 25.0% 25.4% 23.6% 23.7% 21.8% 19.5% 17.1% 22.7%
Failure to Yield Right of Way 19.6% 17.5% 17.3% 16.5% 19.5% 30.1% 37.0% 19.8%
Following Too Closely 14.9% 16.6% 16.0% 15.8% 14.0% 8.6% 5.7% 14.2%
Improper/Unsafe Lane Use 3.7% 5.1% 5.4% 6.0% 6.6% 6.6% 7.0% 6.1%
Illegal/Unsafe Speed 6.2% 7.5% 7.1% 6.6% 5.3% 3.2% 1.7% 6.0%
Disregard for Traffic Control Device 4.2% 4.7% 5.3% 5.0% 5.0% 6.1% 7.0% 5.1%
Improper Turn 2.0% 2.0% 1.9% 1.7% 2.5% 3.4% 3.7% 2.3%
Chemical Impairment 0.6% 2.0% 3.1% 2.5% 2.2% 1.0% 0.1% 1.9%
Improper Passing or Overtaking 1.0% 1.2% 1.3% 1.5% 1.8% 1.9% 0.8% 1.6%
Vision Obscured 1.8% 1.3% 1.1% 1.3% 1.8% 2.4% 2.9% 1.6%
Driver Inexperience 7.0% 1.5% 0.9% 0.8% 0.4% 0.1% 0.2% 1.6%
Unsafe Backing 1.1% 0.8% 0.8% 1.4% 1.8% 1.8% 2.0% 1.5%
Improper Parking, Starting, Stopping 0.1% 1.0% 1.4% 1.1% 1.4% 1.4% 2.2% 1.3%
Driving Left of Center (Not Passing) 0.4% 0.6% 0.7% 1.0% 0.6% 0.8% 0.8% 0.7%
Overcorrecting 0.8% 0.8% 0.6% 0.6% 0.6% 0.5% 0.4% 0.6%
Impeding Traffic 0.3% 0.3% 0.3% 0.4% 0.3% 0.3% 0.2% 0.3%
Improper/No Signal 0.2% 0.1% 0.1% 0.1% 0.2% 0.2% 0.4% 0.2%
Driver on Phone/CB/Radio 0.3% 0.2% 0.2% 0.1% 0.1% 0.0% 0.1% 0.2%
Failure to Use Lights 0.1% 0.1% 0.1% 0.1% 0.1% 0.0% 0.0% 0.1%
Other Human Factor 1.6% 2.0% 1.8% 2.5% 2.4% 3.2% 5.0% 2.3%
Vehicular Factors
Skidding 2.2% 1.9% 2.1% 2.3% 2.1% 1.3% 0.4% 2.0%
Defective Equipment 1.0% 1.0% 0.9% 0.7% 0.8% 0.6% 0.3% 0.8%
Other Vehicular Factor 0.4% 0.6% 0.7% 0.5% 0.7% 0.5% 0.2% 0.6%
Miscellaneous Factors
Weather 3.3% 3.3% 3.7% 3.9% 3.8% 2.7% 1.1% 3.4%
Other 1.8% 2.8% 3.8% 3.8% 4.0% 3.9% 3.7% 3.4%
Total Percent 100.0% 100.0% 100.0% 100.0% 100.0% 100.0% 100.0% 100.0%
Total Contributing Factors Cited 9,599 10,903 8,343 6,356 24,301 4,832 1,683 68,463
Drivers for Whom There Was 3,185 5,490 5,998 5,822 26,345 3,991 622 51,962
"No Clear Contributing Factor"
Total Number of Drivers 10,804 14,792 13,342 11,570 48,803 8,526 2,129 115,304
Percentages are based on all contributing factors cited within each age group (some driver ages are not available). Zero, one,
or two contributing factors may be associated with each driver. The percentages may not sum to 100% due to rounding.
Contributing factors for bicyclists and pedestrians are excluded.
For contributing factors in single-vehicle crashes, see Table 1.09. For contributing factors in crashes at different levels of
severity, see Table 1.17.

Minnesota Motor Vehicle Crash Facts, 2015 page 19 Department of Public Safety, Office of Traffic Safety
TABLE 1.11
PERSONS INVOLVED IN CRASHES BY TYPE OF VEHICLE OCCUPIED AND INJURY SEVERITY, 2015
Vehicle Type Killed
Severely
Injured
Moderately
Injured
Minor
Injured
Total
Injured
Not
Injured
Total
Persons
Automobile 161 422 3,524 11,697 15,643 76,841 92,645
Pickup Truck 67 117 603 1,604 2,324 15,382 17,773
Sport Utility Vehicle 39 131 1,198 4,338 5,667 31,467 37,173
Van 14 60 446 1,743 2,249 11,980 14,243
Motor Home/Camper 0 0 2 5 7 86 93
Limousine 0 0 3 7 10 75 85
Taxi Cab 0 1 21 128 150 742 892
Police Vehicle 0 1 28 70 99 474 573
Fire Department Vehicle 0 0 2 1 3 69 72
School Bus 0 0 9 87 96 3,324 3,420
Other Bus 1 1 13 103 117 932 1,050
Ambulance 0 0 5 10 15 102 117
Military Vehicle 0 0 1 0 1 19 20
Snowmobile 0 2 0 0 2 2 4
All-Terrain Vehicle 10 9 25 12 46 25 81
Farm Tractor or Equipment 2 1 5 17 23 110 135
Motorcycle 61 203 593 388 1,184 241 1,486
Motor Scooter/Motorbike* 0 2 25 20 47 11 58
Motorized Bicycle (Moped) 0 6 21 19 46 8 54
Hit and Run Vehicle 0 3 24 89 116 3,013 3,129
Road Maintenance Vehicle 0 0 10 28 38 527 565
Other Public Owned Vehicle 0 1 3 20 24 209 233
Single Truck (2-axle, 6 tire) 1 3 16 31 50 799 850
Single Truck (3 or more axles) 1 2 18 17 37 348 386
Single Truck with Trailer 0 0 4 11 15 334 349
Truck Tractor with No Trailer 0 0 2 4 6 75 81
Truck Tractor with Semi Trailer 2 4 52 91 147 2,085 2,234
Truck Tractor with Double Trailers 0 0 0 0 0 30 30
Other or Unknown Truck Type 0 0 3 8 11 272 283
Other Vehicle Type 1 0 5 18 23 227 251
Unknown Vehicle Type 0 0 1 7 8 1,401 1,409
Bicycle 10 45 277 551 873 31 914
Pedestrian 41 113 312 479 904 30 975
Total 411 1,127 7,251 21,603 29,981 151,271 181,663
* On the accident report form, police may show that a vehicle is a "motorcycle," a "motor scooter/motorbike,"
or a "moped or motorized bicycle." Since 1986, however, the law recognizes just two categories. If the
vehicle has an engine capacity of more than 50 cc, it is classified as a motorcycle; if it has 50 cc or smaller
engine capacity, it is classified as a motorized bicycle. The term moped is short for motorized pedal cycle,
which is the same as motorized bicycle. (Section 4 of this book now combines “motorcycle” and “motor
scooter/motorbike”).

Minnesota Motor Vehicle Crash Facts, 2015 page 20 Department of Public Safety, Office of Traffic Safety
TABLE 1.12
TYPES OF MOTOR VEHICLES IN 2015 CRASHES
Motor Vehicle Type*
Vehicles in
Fatal
Crashes
Vehicles in
Injury
Crashes
Vehicles in
Property
Damage
Crashes
Vehicles in
All Crashes
Automobile 235 20,958 52,632 73,825
Pickup Truck 114 3,855 10,390 14,359
Sport Utility Vehicle 73 7,874 19,168 27,115
Van 29 2,839 6,344 9,212
Motor Home/Camper 1 22 45 68
Limousine 0 17 38 55
Taxi Cab 0 215 440 655
Police Vehicle 0 131 407 538
Fire Department Vehicle 0 6 35 41
School Bus 1 145 554 700
Other Bus 4 136 385 525
Ambulance 0 14 41 55
Military Vehicle 0 4 12 16
Snowmobile* 0 2 2 4
All-Terrain Vehicle* 9 35 17 61
Farm Tractor or Equipment 3 48 81 132
Motorcycle 61 1,088 186 1,335
Motor Scooter/Motorbike** 0 48 7 55
Motorized Bicycle (Moped) 0 45 6 51
Hit and Run Vehicle 4 477 2,471 2,952
Road Maintenance Vehicle 2 114 417 533
Other Public Owned Vehicle 0 44 150 194
Single Truck (2-axle, 6-tire) 10 179 553 742
Single Truck (3 or more axles) 10 105 262 377
Single Truck with Trailer 4 67 234 305
Truck Tractor with No Trailer 1 15 62 78
Truck Tractor with Semi Trailer 33 518 1,600 2,151
Truck Tractor with Double Trailers 0 3 26 29
Other or Unknown Truck Type 1 61 202 264
Other Vehicle Type 2 54 174 230
Unknown Vehicle Type 1 114 1,285 1,400
Total*** 598 39,233 98,226 138,057
* Snowmobiles and ATVs in crashes are not counted in this table unless the crash occurred on a
public roadway.
** On the accident report form, police may show that a vehicle is a "motorcycle," a "motor
scooter/motorbike," or a "moped or motorized bicycle." Since 1986, however, the law recognizes
just two categories. If the vehicle has an engine capacity of more than 50 cc, it is classified as a
motorcycle; if it has 50 cc or smaller engine capacity, it is classified as a motorized bicycle. The
term moped is short for motorized pedal cycle, which is the same as motorized bicycle. (Section 4
of this book now combines “motorcycle” and “motor scooter/motorbike”).
*** Most crashes involve more than one vehicle, causing total vehicles to exceed total crashes.
Bicyclists and pedestrians are excluded from this table.

Minnesota Motor Vehicle Crash Facts, 2015 page 21 Department of Public Safety, Office of Traffic Safety
TABLE 1.13 2015 CRASHES BY FIRST HARMFUL EVENT
First Harmful Event
Fatal
Crashes
Personal
Injury
Crashes
Property
Damage
Crashes
Total
Crashes Killed Injured
Fatality Rate
Per 1,000
Crashes
Collision With:
Another Motor Vehicle 179 14,012 36,180 50,371 206 21,038 4.1
Parked Motor Vehicle 0 556 4,515 5,071 0 727 0.0
Bicycle 10 861 22 893 10 887 11.2
Pedestrian 41 849 17 907 41 908 45.2
Deer 6 289 1,846 2,141 6 345 2.8
Other Animal 1 54 117 172 1 61 5.8
Railroad Train 2 15 31 48 3 19 62.5
Fixed Object 69 2,988 8,244 11,301 73 3,547 6.5
Non-Fixed Object 0 53 223 276 0 69 0.0
Other Collision Type 6 168 242 416 6 220 14.4
Unk Collision Type 0 7 14 21 0 11 0.0
Non-Collision:
Overturn 55 1,379 1,036 2,470 58 1,805 23.5
Submersion 0 18 33 51 0 20 0.0
Fire/Explosion 0 2 27 29 0 2 0.0
Other Non-Collision 3 116 143 262 3 142 11.5
Unknown Crash Type: 3 149 191 343 4 180 11.7
Total 375 21,516 52,881 74,772 411 29,981 5.5
TABLE 1.14 2015 "HIT-AND-RUN" CRASHES BY FIRST HARMFUL EVENT
First Harmful Event
Fatal
Crashes
Personal
Injury
Crashes
Property
Damage
Crashes
Total
Crashes Killed Injured
Collision With:
Other Motor Vehicle 2 777 3,024 3,803 2 1,126
Parked Motor Vehicle 0 76 2,083 2,159 0 101
Bicycle 0 106 6 112 0 113
Pedestrian 10 160 3 173 10 165
Deer 0 2 2 4 0 2
Other Animal 0 0 0 0 0 0
Railroad Train 0 0 3 3 0 0
Fixed Object 0 131 898 1,029 0 158
Non-Fixed Object 0 1 26 27 0 1
Other Collision Type 0 14 30 44 0 21
Unk Collision Type 0 0 2 2 0 0
Non-Collision:
Overturn 0 13 18 31 0 16
Submersion 0 0 1 1 0 0
Other Non-Collision 0 0 3 3 0 0
Unknown Crash Type 0 15 19 34 0 19
Total 12 1,295 6,118 7,425 12 1,722

Minnesota Motor Vehicle Crash Facts, 2015 page 22 Department of Public Safety, Office of Traffic Safety
TABLE 1.15
2015 CRASHES BY TRAFFIC CONTROL DEVICE
Traffic Control Device
Fatal
Crashes
Personal
Injury
Crashes
Property
Damage
Crashes
Total
Crashes Killed Injured
Traffic Signal 26 5,879 12,602 18,507 29 8,294
Overhead Flashers 0 13 39 52 0 15
Stop Sign-All Approaches 4 482 1,128 1,614 4 687
Other Stop Sign 63 3,160 6,200 9,423 71 4,689
Yield Sign 4 331 903 1,238 5 481
Flagman, Officer, School Patrol 1 13 40 54 1 20
School Bus Stop Arm 0 8 17 25 0 12
School Zone Sign 0 4 6 10 0 6
No Passing Zone 4 97 116 217 5 143
RR Crossing Gate 1 10 29 40 1 11
RR Flashing Lights 1 7 11 19 2 13
RR Crossing Stop Sign 0 6 8 14 0 13
RR Overhead Flashing Lights 0 1 2 3 0 2
RR Overhead Lights and Gate 0 9 19 28 0 10
RR Crossbuck 0 3 10 13 0 3
Other Device 3 239 634 876 3 319
Not Applicable 264 11,136 30,679 42,078 286 15,104
Unknown 4 118 439 561 4 159
Total 375 21,516 52,881 74,772 411 29,981
TABLE 1.16
2015 CRASHES BY WEATHER CONDITION
Weather Condition
Fatal
Crashes
Personal
Injury
Crashes
Property
Damage
Crashes
Total
Crashes Killed Injured
Clear 256 14,196 32,612 47,064 279 19,943
Cloudy 80 4,458 11,159 15,697 86 6,184
Rain 15 1,316 3,393 4,724 17 1,819
Snow 10 1,008 3,880 4,898 13 1,329
Sleet/Hail/Freezing Rain 0 197 519 716 0 260
Fog/Smog/Smoke 2 43 98 143 2 57
Blowing Sand/Dust/Snow 2 105 375 482 2 139
Severe Crosswinds 0 22 51 73 0 32
Other 1 40 94 135 1 56
Not Stated/Unknown 9 131 700 840 11 162
Total 375 21,516 52,881 74,772 411 29,981

Minnesota Motor Vehicle Crash Facts, 2015 page 23 Department of Public Safety, Office of Traffic Safety
TABLE 1.17
CONTRIBUTING FACTORS IN 2015 CRASHES
Percent of Factors Cited in
Crashes by Severity of Crash
Number of Crashes in which
the Factor was Cited
Number of People
Affected
Contributing Factors
Fatal
Crashes
Injury
Crashes
Property
Damage
Crashes
Fatal
Crashes
Injury
Crashes
Property
Damage
Crashes Killed Injured
Human Factors
Driver Inattention/Distraction 14.3% 20.4% 20.7% 71 5,387 11,934 74 7,666
Failure to Yield Right of Way 13.7% 17.9% 14.7% 67 4,629 8,279 76 6,963
Following Too Closely 1.0% 9.4% 12.2% 5 2,373 6,760 5 3,343
Illegal/Unsafe Speed 14.7% 9.1% 9.2% 72 2,428 5,363 78 3,495
Disregard Traffic Cntl Device 6.4% 6.1% 3.4% 32 1,602 1,946 37 2,595
Chemical Impairment 6.8% 4.6% 2.7% 33 1,212 1,547 38 1,632
Improper/Unsafe Lane Use 6.0% 3.4% 6.4% 29 918 3,642 34 1,329
Overcorrecting 4.8% 2.7% 2.0% 23 743 1,173 25 996
Driver Inexperience 2.2% 2.2% 2.2% 11 598 1,288 11 875
Improper Turn 0.8% 1.5% 2.3% 4 403 1,349 5 580
Vision Obscured 0.4% 1.4% 1.4% 2 367 759 2 462
Improper Passing/Overtaking 1.4% 0.9% 1.6% 7 230 901 7 332
Driving Left of Ctr (Not Passing) 8.4% 0.9% 0.5% 39 240 279 46 464
Improper Park/Start/Stop 0.2% 0.8% 1.3% 1 207 720 1 280
Non-Motorist Error 1.8% 0.7% 0.1% 9 176 59 9 193
Impeding Traffic 0.0% 0.3% 0.2% 0 82 141 0 122
Unsafe Backing 0.6% 0.2% 1.7% 3 52 950 3 59
Driver on Phone/CB/Radio 0.4% 0.2% 0.1% 2 61 71 2 94
Improper/No Signal 0.2% 0.1% 0.2% 1 27 91 1 39
Failure to Use Lights 0.0% 0.1% 0.1% 0 30 39 0 39
Other Human Factor 5.0% 4.1% 2.8% 22 1,042 1,573 25 1,341
Vehicular Factors
Skidding 1.8% 2.6% 3.1% 9 686 1,791 9 905
Defective Equipment 0.4% 0.9% 0.9% 2 229 531 2 317
Other Vehicular Factor 0.4% 0.7% 0.9% 2 165 483 3 234
Miscellaneous Factors
Weather 1.6% 4.1% 5.6% 8 947 2,955 11 1,228
Other 6.6% 4.9% 4.0% 31 1,140 2,050 33 1,520
Total Percent 100.0% 100.0% 100.0%
Total Contributing Factors 498 27,507 59,930
Vehicles Where There Was
“No Clear Contributing
Factor"
251 17,885 40,713
Total Number of Vehicles 649 41,013 98,276
Zero, one, or two contributing factors may be associated with a vehicle, causing the number of factors cited to vary from the number
of crashes, vehicles and persons affected by the factors. Note that in the absence of alcohol or drug test results (not usually available
at the time the crash report is completed); officers are conservative in reporting impairment. Compare these figures with those from
Section II. Bicyclists and pedestrians are considered as vehicles in this table and factors associated with them are included. For
contributing factors by age of drivers, see tables 1.09 and 1.10.

Minnesota Motor Vehicle Crash Facts, 2015 page 24 Department of Public Safety, Office of Traffic Safety
TABLE 1.18
2015 CRASHES BY LIGHT CONDITION
Light Condition
Fatal
Crashes
Personal
Injury
Crashes
Property
Damage
Crashes
Total
Crashes Killed Injured
Daylight 215 15,317 36,655 52,187 236 21,482
Dawn (Morning) 13 451 1,323 1,787 14 578
Dusk (Evening) 16 599 1,347 1,962 17 847
Dark/Street Lights On 50 3,414 9,143 12,607 54 4,693
Dark/No Street Lights 74 1,637 3,770 5,481 82 2,260
Other/Unknown 7 98 643 748 8 121
Total 375 21,516 52,881 74,772 411 29,981
TABLE 1.19
2015 CRASHES BY ROAD SURFACE CONDITION
Road Surface
Condition
Fatal
Crashes
Personal
Injury
Crashes
Property
Damage
Crashes
Total
Crashes Killed Injured
Dry 302 16,106 36,574 52,982 332 22,663
Wet 37 2,719 6,995 9,751 40 3,792
Snow/Slush 9 1,011 3,935 4,955 12 1,324
Ice or Packed Snow 18 1,426 4,617 6,061 18 1,883
Other 4 174 329 507 4 226
Not Stated/Unknown 5 80 431 516 5 93
Total 375 21,516 52,881 74,772 411 29,981
TABLE 1.20
2015 CRASHES BY ROAD DESIGN
Road Design
Fatal
Crashes
Personal
Injury
Crashes
Property
Damage
Crashes
Total
Crashes Killed Injured
Freeway (Including Ramps) 31 3,574 11,110 14,715 34 4,826
Other Divided Highway 44 3,112 6,371 9,527 51 4,583
One-Way Street 1 524 1,260 1,785 1 751
4-6 Lanes Undivided 25 4,258 9,934 14,217 26 5,953
3 Lanes Undivided 6 266 584 856 6 398
2 Lane – 1 Each Way 255 8,030 17,535 25,820 280 11,221
Alley 2 57 203 262 2 64
Other Road Design 8 875 1,943 2,826 8 1,162
Not Stated/Unknown 3 820 3,941 4,764 3 1,023
Total 375 21,516 52,881 74,772 411 29,981
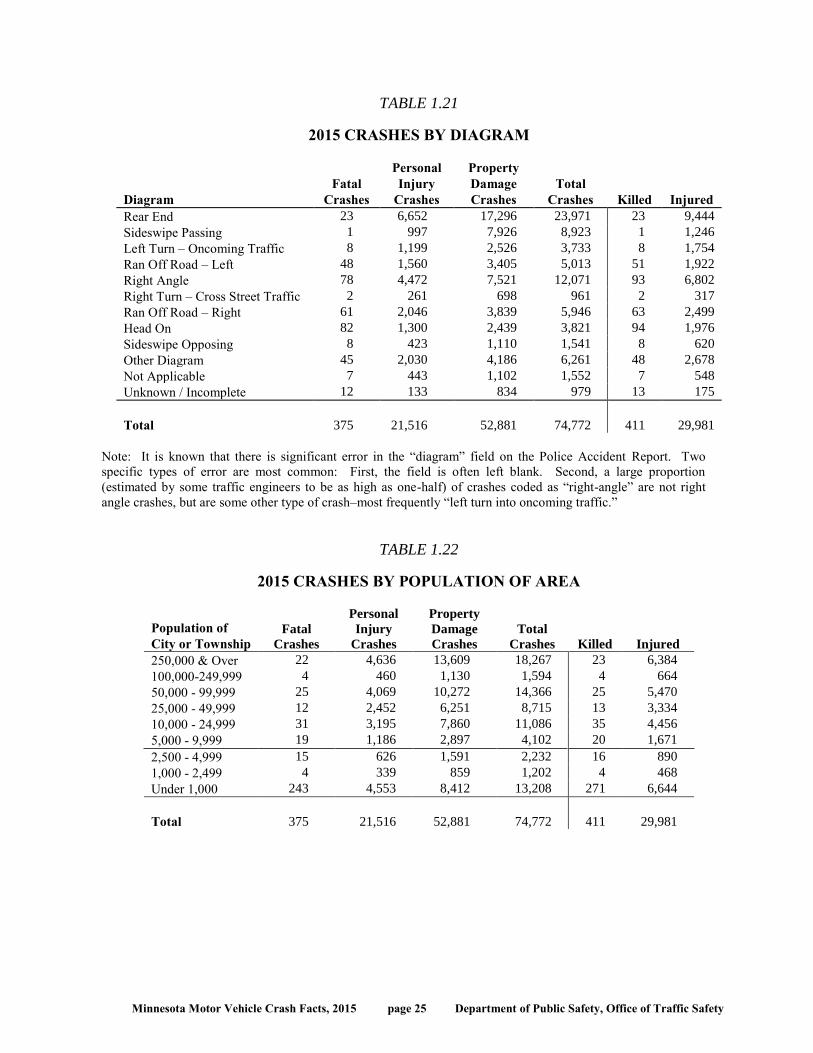
Minnesota Motor Vehicle Crash Facts, 2015 page 25 Department of Public Safety, Office of Traffic Safety
TABLE 1.21
2015 CRASHES BY DIAGRAM
Diagram
Fatal
Crashes
Personal
Injury
Crashes
Property
Damage
Crashes
Total
Crashes Killed Injured
Rear End 23 6,652 17,296 23,971 23 9,444
Sideswipe Passing 1 997 7,926 8,923 1 1,246
Left Turn – Oncoming Traffic 8 1,199 2,526 3,733 8 1,754
Ran Off Road – Left 48 1,560 3,405 5,013 51 1,922
Right Angle 78 4,472 7,521 12,071 93 6,802
Right Turn – Cross Street Traffic 2 261 698 961 2 317
Ran Off Road – Right 61 2,046 3,839 5,946 63 2,499
Head On 82 1,300 2,439 3,821 94 1,976
Sideswipe Opposing 8 423 1,110 1,541 8 620
Other Diagram 45 2,030 4,186 6,261 48 2,678
Not Applicable 7 443 1,102 1,552 7 548
Unknown / Incomplete 12 133 834 979 13 175
Total 375 21,516 52,881 74,772 411 29,981
Note: It is known that there is significant error in the “diagram” field on the Police Accident Report. Two
specific types of error are most common: First, the field is often left blank. Second, a large proportion
(estimated by some traffic engineers to be as high as one-half) of crashes coded as “right-angle” are not right
angle crashes, but are some other type of crash–most frequently “left turn into oncoming traffic.”
TABLE 1.22
2015 CRASHES BY POPULATION OF AREA
Population of
City or Township
Fatal
Crashes
Personal
Injury
Crashes
Property
Damage
Crashes
Total
Crashes Killed Injured
250,000 & Over 22 4,636 13,609 18,267 23 6,384
100,000-249,999 4 460 1,130 1,594 4 664
50,000 - 99,999 25 4,069 10,272 14,366 25 5,470
25,000 - 49,999 12 2,452 6,251 8,715 13 3,334
10,000 - 24,999 31 3,195 7,860 11,086 35 4,456
5,000 - 9,999 19 1,186 2,897 4,102 20 1,671
2,500 - 4,999 15 626 1,591 2,232 16 890
1,000 - 2,499 4 339 859 1,202 4 468
Under 1,000 243 4,553 8,412 13,208 271 6,644
Total 375 21,516 52,881 74,772 411 29,981

Minnesota Motor Vehicle Crash Facts, 2015 page 26 Department of Public Safety, Office of Traffic Safety
TABLE 1.23
2015 CRASHES BY TYPE OF ROADWAY
Type of Roadway
Fatal
Crashes
Personal
Injury
Crashes
Property
Damage
Crashes
Total
Crashes Killed Injured
Urban
Interstate 13 2,307 7,066 9,386 13 3,080
US Trunk Hwy 16 1,153 3,333 4,502 17 1,612
MN Trunk Hwy 22 2,128 5,376 7,526 25 3,067
County State Aid Hwy 32 4,187 9,329 13,548 34 5,861
County Road 2 93 205 300 2 137
Township Road 0 0 1 1 0 0
Municipal State Aid Hwy 15 3,859 9,413 13,287 16 5,220
Municipal Street 13 2,229 6,980 9,222 13 2,951
Other Road 0 42 316 358 0 51
Urban Total 113 15,998 42,019 58,130 120 21,979
Rural
Interstate 12 468 1,625 2,105 14 657
US Trunk Hwy 39 1,005 1,962 3,006 43 1,479
MN Trunk Hwy 81 1,249 2,383 3,713 96 1,910
County State Aid Hwy 93 1,662 2,763 4,518 99 2,347
County Road 14 293 381 688 15 437
Township Road 18 550 749 1,317 19 783
Municipal State Aid Hwy 0 2 4 6 0 2
Municipal Street 1 268 898 1,167 1 357
Other Road 4 21 97 122 4 30
Rural Total 262 5,518 10,862 16,642 291 8,002
All Roadways
Interstate 25 2,775 8,691 11,491 27 3,737
US Trunk Hwy 55 2,158 5,295 7,508 60 3,091
MN Trunk Hwy 103 3,377 7,759 11,239 121 4,977
County State Aid Hwy 125 5,849 12,092 18,066 133 8,208
County Road 16 386 586 988 17 574
Township Road 18 550 750 1,318 19 783
Municipal State Aid Hwy 15 3,861 9,417 13,293 16 5,222
Municipal Street 14 2,497 7,878 10,389 14 3,308
Other Road 4 63 413 480 4 81
Total 375 21,516 52,881 74,772 411 29,981
("Urban" refers to an area having a population of 5,000 or more; "rural" refers to an area of less than 5,000.)

Minnesota Motor Vehicle Crash Facts, 2015 page 27 Department of Public Safety, Office of Traffic Safety
TABLE 1.24
2015 COUNTY CRASH REPORT
County
2015
Fatal
Crashes
2015
Injury
Crashes
2015
Property
Damage
Crashes
2015
Total
Crashes
2014
Total
Crashes
2015
Number
Killed
2014
Number
Killed
2015
Number
Injured
2014
Number
Injured
Aitkin 3 44 127 174 170 6 4 80 86
Anoka 10 1,114 2,005 3,129 3,413 11 16 1,556 1,666
Becker 1 113 189 303 289 1 3 167 154
Beltrami 6 121 249 376 370 6 6 172 159
Benton 6 156 387 549 615 7 1 224 223
Big Stone 1 16 15 32 41 1 0 22 29
Blue Earth 10 303 861 1,174 1,169 12 3 415 394
Brown 2 71 158 231 260 2 7 107 96
Carlton 7 108 236 351 319 9 1 163 130
Carver 4 292 766 1,062 1,038 5 10 413 364
Cass 4 106 165 275 222 4 6 164 152
Chippewa 3 29 70 102 113 4 5 63 55
Chisago 4 188 388 580 627 4 8 256 284
Clay 2 214 437 653 707 3 4 291 282
Clearwater 2 10 29 41 41 2 1 21 11
Cook 0 28 51 79 55 0 1 37 17
Cottonwood 5 30 53 88 97 6 1 56 44
Crow Wing 5 285 532 822 806 5 10 428 393
Dakota 10 1,516 3,777 5,303 5,499 11 10 2,085 1,946
Dodge 2 63 127 192 209 2 3 82 53
Douglas 2 167 332 501 472 2 6 236 179
Faribault 4 49 79 132 127 4 2 63 75
Fillmore 2 53 121 176 199 2 2 84 67
Freeborn 2 116 330 448 512 2 3 158 193
Goodhue 7 204 491 702 850 8 10 293 265
Grant 0 28 45 73 73 0 3 32 31
Hennepin 31 6,640 16,125 22,796 23,075 33 34 9,063 8,675
Houston 4 35 121 160 172 5 0 47 46
Hubbard 3 70 79 152 157 3 4 86 83
Isanti 12 113 227 352 352 15 8 192 150
Itasca 5 167 285 457 529 6 2 227 190
Jackson 5 31 66 102 125 6 1 45 47
Kanabec 2 44 44 90 126 2 1 68 77
Kandiyohi 7 163 419 589 665 8 12 240 248

Minnesota Motor Vehicle Crash Facts, 2015 page 28 Department of Public Safety, Office of Traffic Safety
TABLE 1.24 CONTINUED
2015 COUNTY CRASH REPORT
County
2015
Fatal
Crashes
2015
Injury
Crashes
2015
Property
Damage
Crashes
2015
Total
Crashes
2014
Total
Crashes
2015
Number
Killed
2014
Number
Killed
2015
Number
Injured
2014
Number
Injured
Kittson 0 5 5 10 13 0 0 7 7
Koochiching 1 35 54 90 80 1 0 46 41
Lac qui Parle 2 15 14 31 44 2 1 18 27
Lake 2 35 67 104 108 3 0 55 49
Lake of the Woods 0 7 6 13 11 0 1 9 7
Le Sueur 5 113 200 318 335 6 1 157 168
Lincoln 0 9 36 45 70 0 1 14 21
Lyon 3 67 148 218 285 3 5 107 125
McLeod 4 119 252 375 479 4 2 170 224
Mahnomen 1 11 17 29 30 1 1 19 16
Marshall 1 13 19 33 28 1 1 19 20
Martin 1 57 153 211 234 1 0 76 97
Meeker 3 58 109 170 216 4 2 85 101
Mille Lacs 3 92 136 231 216 4 8 150 138
Morrison 7 101 140 248 269 9 8 145 138
Mower 2 116 260 378 470 2 1 161 172
Murray 1 19 34 54 64 1 2 20 39
Nicollet 2 101 324 427 405 2 6 151 143
Nobles 2 84 190 276 325 3 2 128 136
Norman 2 17 26 45 47 3 0 23 21
Olmsted 14 635 1,483 2,132 2,189 14 8 905 929
Otter Tail 8 200 409 617 642 9 3 274 267
Pennington 3 57 57 117 91 3 1 86 63
Pine 9 114 223 346 359 9 4 164 160
Pipestone 2 22 16 40 53 2 0 36 39
Polk 4 91 192 287 359 4 3 132 123
Pope 0 28 56 84 110 0 0 34 39
Ramsey 18 2,334 8,597 10,949 11,355 18 12 3,114 3,108
Red Lake 0 7 4 11 19 0 0 13 18
Redwood 2 41 65 108 127 2 1 65 64
Renville 2 54 78 134 157 2 4 92 77
Rice 4 212 356 572 588 5 6 285 253
Rock 0 32 70 102 151 0 5 40 57

Minnesota Motor Vehicle Crash Facts, 2015 page 29 Department of Public Safety, Office of Traffic Safety
TABLE 1.24 CONTINUED
2015 COUNTY CRASH REPORT
County
2015
Fatal
Crashes
2015
Injury
Crashes
2015
Property
Damage
Crashes
2015
Total
Crashes
2014
Total
Crashes
2015
Number
Killed
2014
Number
Killed
2015
Number
Injured
2014
Number
Injured
Roseau 0 23 25 48 80 0 6 43 38
St. Louis 16 657 2,184 2,857 3,277 16 8 888 928
Scott 7 423 883 1,313 1,255 7 5 643 584
Sherburne 10 262 690 962 1,074 11 2 402 388
Sibley 6 36 89 131 154 6 2 50 84
Stearns 12 688 1,668 2,368 2,640 12 9 969 985
Steele 4 130 363 497 561 4 6 174 173
Stevens 1 33 64 98 78 1 0 45 32
Swift 3 23 36 62 69 3 2 26 26
Todd 2 88 122 212 212 2 3 124 126
Traverse 0 9 26 35 19 0 0 10 7
Wabasha 3 63 114 180 227 3 4 82 106
Wadena 4 43 71 118 110 4 3 58 74
Waseca 1 46 110 157 197 1 2 73 68
Washington 12 744 1,874 2,630 2,777 12 8 1,034 1,153
Watonwan 1 36 66 103 100 1 1 47 38
Wilkin 0 29 82 111 115 0 0 32 36
Winona 1 179 328 508 553 1 6 225 221
Wright 8 395 860 1,263 1,389 8 16 587 589
Yellow Medicine 3 21 44 68 86 4 1 33 32
Minnesota Totals 375 21,516 52,881 74,772
78,396 411
361 29,981
29,439

Minnesota Motor Vehicle Crash Facts, 2015 page 30 Department of Public Safety, Office of Traffic Safety
TABLE 1.25
2015 CRASHES IN CITIES OF 2,500 OR MORE POPULATION
City
Fatal
Crashes
Injury
Crashes
PDO
Crashes
Total
Crashes
Persons
Killed
Persons
Injured
Afton 0 11 29 40 0 17
Albany 0 5 17 22 0 5
Albert Lea 1 56 174 231 1 75
Albertville 1 25 61 87 1 41
Alexandria 0 82 109 191 0 118
Andover 1 43 53 97 2 62
Annandale 0 2 3 5 0 4
Anoka 0 102 324 426 0 137
Apple Valley 2 163 371 536 2 204
Arden Hills 2 96 409 507 2 124
Austin 0 62 189 251 0 85
Barnesville 0 1 6 7 0 1
Baxter 0 59 142 201 0 92
Bayport 0 4 15 19 0 5
Becker 1 15 28 44 1 21
Belle Plaine 1 4 25 30 1 7
Bemidji 0 59 102 161 0 81
Benson 0 2 9 11 0 2
Big Lake 0 16 28 44 0 24
Blaine 0 199 286 485 0 271
Bloomington 2 466 1,082 1,550 2 590
Blue Earth 0 9 26 35 0 10
Brainerd 1 67 187 255 1 94
Breckenridge 0 5 14 19 0 5
Brooklyn Center 1 251 449 701 1 369
Brooklyn Park 2 271 419 692 2 383
Buffalo 1 41 99 141 1 61
Burnsville 1 317 725 1,043 1 447
Byron 0 7 21 28 0 8
Caledonia 1 4 15 20 1 7
Cambridge 0 33 79 112 0 51
Cannon Falls 0 11 36 47 0 14
Carver 0 9 11 20 0 12
Centerville 0 2 9 11 0 2
Champlin 1 32 75 108 1 47
Chanhassen 1 64 230 295 1 87
Chaska 0 65 134 199 0 89
Chatfield 0 2 11 13 0 5
Chisago City 0 23 45 68 0 28
Chisholm 0 6 32 38 0 11
Circle Pines 0 7 15 22 0 10
Cloquet 3 51 68 122 5 80
Cohasset 0 10 11 21 0 16
Cokato 0 2 5 7 0 2
Cold Spring 0 9 21 30 0 12
Columbia Heights 0 67 95 162 0 97
Columbus 0 20 49 69 0 29
Coon Rapids 2 296 536 834 2 402
Corcoran 2 27 47 76 2 36
Cottage Grove 1 63 254 318 1 82

Minnesota Motor Vehicle Crash Facts, 2015 page 31 Department of Public Safety, Office of Traffic Safety
TABLE 1.25 CONTINUED
2015 CRASHES IN CITIES OF 2,500 OR MORE POPULATION
City
Fatal
Crashes
Injury
Crashes
PDO
Crashes
Total
Crashes
Persons
Killed
Persons
Injured
Crookston 0 17 60 77 0 25
Crystal 0 71 160 231 0 94
Dayton 0 20 46 66 0 25
Deephaven 0 2 12 14 0 2
Delano 0 13 30 43 0 20
Detroit Lakes 0 41 74 115 0 60
Dilworth 0 6 21 27 0 7
Dodge Center 0 2 4 6 0 4
Duluth 3 315 1,420 1,738 3 411
Eagan 2 217 612 831 2 308
Eagle Lake 0 2 6 8 0 2
East Bethel 0 29 19 48 0 44
East Grand Forks 0 21 62 83 0 27
Eden Prairie 3 184 559 746 3 249
Edina 0 172 475 647 0 227
Elko/New Market 0 6 5 11 0 12
Elk River 2 77 252 331 2 121
Ely 0 4 17 21 0 6
Eveleth 0 7 24 31 0 7
Fairmont 0 21 100 121 0 32
Falcon Heights 1 15 42 58 1 23
Faribault 1 84 135 220 1 105
Farmington 0 33 88 121 0 42
Fergus Falls 2 45 132 179 2 56
Foley 0 3 6 9 0 3
Forest Lake 1 90 180 271 1 130
Fridley 3 126 218 347 3 196
Glencoe 0 14 22 36 0 20
Glenwood 0 4 12 16 0 6
Golden Valley 1 167 421 589 1 221
Goodview 1 4 6 11 1 9
Grand Rapids 1 55 133 189 1 70
Granite Falls 0 4 16 20 0 13
Grant 1 13 20 34 1 18
Greenfield 0 14 23 37 0 22
Ham Lake 0 28 21 49 0 43
Hanover 0 2 12 14 0 3
Hastings 0 62 148 210 0 82
Hermantown 2 33 67 102 2 48
Hibbing 0 59 143 202 0 81
Hopkins 1 78 175 254 1 101
Hugo 2 26 43 71 2 40
Hutchinson 0 42 98 140 0 59
Independence 2 14 45 61 2 20
International Falls 0 19 23 42 0 23
Inver Grove Heights 1 98 299 398 1 125
Isanti 0 14 36 50 0 26
Jackson 1 0 14 15 2 1
Jordan 1 21 56 78 1 40
Kasson 0 12 37 49 0 15

Minnesota Motor Vehicle Crash Facts, 2015 page 32 Department of Public Safety, Office of Traffic Safety
TABLE 1.25 CONTINUED
2015 CRASHES IN CITIES OF 2,500 OR MORE POPULATION
City
Fatal
Crashes
Injury
Crashes
PDO
Crashes
Total
Crashes
Persons
Killed
Persons
Injured
La Crescent 0 3 24 27 0 6
Lake City 0 11 30 41 0 17
Lake Crystal 0 2 17 19 0 3
Lake Elmo 1 49 90 140 1 66
Lakeville 0 180 509 689 0 246
Le Center 0 0 5 5 0 0
Le Sueur 0 8 29 37 0 11
Lindstrom 0 7 30 37 0 10
Lino Lakes 0 61 195 256 0 79
Litchfield 0 18 39 57 0 22
Little Canada 0 65 169 234 0 90
Little Falls 0 24 42 66 0 35
Long Prairie 0 5 15 20 0 7
Lonsdale 0 3 4 7 0 3
Luverne 0 5 23 28 0 5
Mahtomedi 0 7 22 29 0 7
Mankato 1 226 710 937 1 304
Maple Grove 0 240 658 898 0 313
Maplewood 1 201 543 745 1 282
Marshall 2 37 78 117 2 61
Medina 1 24 75 100 1 37
Melrose 0 5 34 39 0 7
Mendota Heights 0 69 188 257 0 79
Milaca 0 5 19 24 0 6
Minneapolis 11 3,360 8,150 11,521 12 4,693
Minnetonka 0 151 367 518 0 193
Minnetrista 0 17 47 64 0 27
Montevideo 0 12 34 46 0 17
Montgomery 0 4 7 11 0 4
Monticello 0 48 131 179 0 65
Montrose 0 8 11 19 0 10
Moorhead 0 140 240 380 0 188
Moose Lake 0 3 9 12 0 3
Mora 0 14 12 26 0 24
Morris 0 15 36 51 0 19
Mound 0 11 33 44 0 17
Mounds View 0 25 93 118 0 35
Mountain Iron 1 18 43 62 1 33
New Brighton 0 84 213 297 0 105
New Hope 0 32 90 122 0 43
Newport 0 23 77 100 0 33
New Prague 0 13 13 26 0 14
New Ulm 0 39 92 131 0 61
North Branch 0 34 67 101 0 49
Northfield 0 30 49 79 0 44
North Mankato 0 33 88 121 0 50
North Oaks 0 3 9 12 0 3
North St. Paul 1 42 78 121 1 62
Norwood 0 4 17 21 0 4
Nowthen 0 14 12 26 0 18

Minnesota Motor Vehicle Crash Facts, 2015 page 33 Department of Public Safety, Office of Traffic Safety
TABLE 1.25 CONTINUED
2015 CRASHES IN CITIES OF 2,500 OR MORE POPULATION
City
Fatal
Crashes
Injury
Crashes
PDO
Crashes
Total
Crashes
Persons
Killed
Persons
Injured
Oakdale 0 95 268 363 0 124
Oak Grove 1 17 19 37 1 22
Oak Park Heights 1 34 91 126 1 52
Orono 1 42 55 98 2 53
Osseo 0 14 15 29 0 19
Otsego 0 40 71 111 0 69
Owatonna 1 68 221 290 1 85
Park Rapids 0 11 10 21 0 15
Perham 0 3 12 15 0 4
Pine City 0 12 17 29 0 21
Pine Island 0 5 17 22 0 8
Pipestone 0 6 4 10 0 8
Plainview 0 3 7 10 0 3
Plymouth 1 217 728 946 1 276
Princeton 1 9 22 32 1 10
Prior Lake 0 50 42 92 0 78
Proctor 0 4 9 13 0 5
Ramsey 0 46 87 133 0 57
Red Wing 0 63 213 276 0 95
Redwood Falls 0 19 25 44 0 29
Richfield 0 230 457 687 0 305
Robbinsdale 0 44 136 180 0 61
Rochester 4 460 1,130 1,594 4 664
Rockford 0 6 13 19 0 9
Rockville 0 11 30 41 0 16
Rogers 0 49 177 226 0 70
Roseau 0 5 8 13 0 11
Rosemount 2 63 155 220 2 95
Roseville 0 210 752 962 0 286
Rush City 1 5 10 16 1 5
St. Anthony 0 24 46 70 0 28
St. Augusta 0 11 20 31 0 14
St. Charles 0 2 8 10 0 2
St. Cloud 7 409 905 1,321 7 573
St. Francis 1 10 9 20 1 13
St. James 0 9 29 38 0 10
St. Joseph 1 10 27 38 1 12
St. Louis Park 0 257 609 866 0 327
St. Michael 1 48 111 160 1 71
St. Paul 11 1,276 5,459 6,746 11 1,691
St. Paul Park 0 8 18 26 0 9
St. Peter 0 33 92 125 0 47
Sandstone 0 3 11 14 0 7
Sartell 0 18 74 92 0 29
Sauk Center 0 11 42 53 0 13
Sauk Rapids 1 31 72 104 2 45
Savage 0 71 215 286 0 98
Scandia 0 11 21 32 0 16
Shakopee 2 132 348 482 2 182
Shoreview 0 47 162 209 0 59

Minnesota Motor Vehicle Crash Facts, 2015 page 34 Department of Public Safety, Office of Traffic Safety
TABLE 1.25 CONTINUED
2015 CRASHES IN CITIES OF 2,500 OR MORE POPULATION
City
Fatal
Crashes
Injury
Crashes
PDO
Crashes
Total
Crashes
Persons
Killed
Persons
Injured
Shorewood 1 28 59 88 1 35
Sleepy Eye 0 6 16 22 0 7
South St. Paul 0 83 192 275 0 113
Spring Lake Park 0 31 47 78 0 48
Staples 0 9 14 23 0 16
Stewartville 0 11 29 40 0 13
Stillwater 2 23 92 117 2 32
Thief River Falls 0 30 37 67 0 49
Two Harbors 0 7 21 28 0 12
Vadnais Heights 1 58 201 260 1 74
Victoria 0 24 54 78 0 29
Virginia 0 19 110 129 0 24
Wabasha 1 5 7 13 1 6
Waconia 0 25 76 101 0 45
Wadena 3 21 22 46 3 26
Waite Park 1 53 158 212 1 70
Waseca 0 23 32 55 0 36
Watertown 0 7 24 31 0 8
Wayzata 0 32 108 140 0 41
West St. Paul 0 94 201 295 0 128
White Bear Lake 1 167 369 537 1 225
Willmar 0 79 285 364 0 103
Windom 0 12 19 31 0 23
Winona 0 67 130 197 0 86
Woodbury 0 217 488 705 0 311
Worthington 1 43 113 157 2 64
Wyoming 0 28 63 91 0 44
Zimmerman 1 20 39 60 1 33
Zumbrota 0 4 18 22 0 5

Minnesota Motor Vehicle Crash Facts, 2015 page 35 Department of Public Safety, Office of Traffic Safety
TABLE 1.26
2015 CRASHES BY TIME AND DAY
Hour
Beginning
All
Days
Total
All
Days
Fatal
Sun.
Total
Sun.
Fatal
Mon.
Total
Mon.
Fatal
Tues.
Total
Tues.
Fatal
Wed.
Total
Wed.
Fatal
Thurs.
Total
Thurs.
Fatal
Fri.
Total
Fri.
Fatal
Sat.
Total
Sat.
Fatal
Midnight 1,047 9 247 1 113 0 120 0 108 2 114 3 133 0 212 3
1 am 926 7 217 2 84 1 112 0 98 1 108 1 99 1 208 1
2 am 934 4 235 0 79 0 95 0 92 2 90 0 110 0 233 2
3 am 607 11 157 4 55 0 53 1 52 1 57 0 77 3 156 2
4 am 588 5 110 0 65 0 59 1 75 1 94 2 90 0 95 1
5 am 1,036 13 117 2 181 4 188 5 160 1 125 0 140 0 125 1
6 am 2,253 14 127 2 449 2 427 2 396 4 355 1 335 2 164 1
7 am 4,603 13 153 2 810 5 966 2 905 1 802 1 721 2 246 0
8 am 4,135 14 229 1 657 0 894 2 776 4 716 0 537 2 326 5
9 am 3,301 18 282 4 492 2 622 3 547 2 536 3 434 0 388 4
10 am 3,293 11 348 1 434 2 555 2 466 2 478 0 511 3 501 1
11 am 3,611 13 408 2 448 4 568 1 512 2 525 1 560 1 590 2
Noon 4,169 15 520 1 509 5 609 1 539 1 688 2 703 3 601 2
1 pm 4,269 15 481 2 560 2 628 1 576 0 675 4 692 1 657 5
2 pm 4,951 26 535 5 634 3 705 4 726 3 788 3 945 6 618 2
3 pm 6,178 35 547 5 854 4 1,030 6 943 8 1,065 5 1,161 2 578 5
4 pm 6,686 20 507 5 985 2 1,147 0 1,198 2 1,160 5 1,148 3 541 3
5 pm 7,078 20 523 2 1,089 5 1,270 1 1,177 2 1,240 4 1,199 2 580 4
6 pm 4,341 25 437 7 652 5 690 4 684 3 724 4 693 1 461 1
7 pm 2,946 22 411 2 398 3 438 1 414 4 408 5 493 4 384 3
8 pm 2,363 15 334 3 281 3 351 2 330 3 349 2 348 1 370 1
9 pm 2,231 21 275 3 312 1 310 2 304 3 308 2 359 5 363 5
10 pm 1,718 16 193 1 201 1 231 1 214 1 241 3 315 4 323 5
11 pm 1,291 13 131 0 174 1 149 4 162 0 183 2 232 2 260 4
Unk 217 0 29 0 27 0 35 0 29 0 23 0 40 0 34 0
Total 74,772 375 7,553 57 10,543 55 12,252 46 11,483 53 11,852 53 12,075 48 9,014 63

Minnesota Motor Vehicle Crash Facts, 2015 page 36 Department of Public Safety, Office of Traffic Safety
FIGURE 1.03
TOTAL CRASHES VS FATAL CRASHES, BY TIME, 2015
TABLE 1.27
2015 CRASHES, FATALITIES AND INJURIES BY MONTH
Month
Fatal
Crashes
Injury
Crashes
Property
Damage
Crashes
Total
Crashes Killed Injured
January 14 1,843 5,768 7,625 14 2,532
February 16 1,602 4,806 6,424 19 2,134
March 28 1,433 3,681 5,142 31 1,981
April 34 1,472 3,300 4,806 36 2,022
May 38 1,882 4,059 5,979 40 2,735
June 43 1,954 4,248 6,245 46 2,708
July 30 1,976 4,023 6,029 37 2,802
August 34 1,921 4,063 6,018 38 2,688
September 37 1,874 4,087 5,998 41 2,681
October 39 1,942 4,561 6,542 41 2,703
November 30 1,866 5,060 6,956 32 2,580
December 32 1,751 5,225 7,008 36 2,415
Total 375 21,516 52,881 74,772 411 29,981
0
5
10
15
20
25
30
35
40
45
50
0
1,000
2,000
3,000
4,000
5,000
6,000
7,000
8,000
9,000
Mid
nig
ht
1:0
0
2:0
0
3:0
0
4:0
0
5:0
0
6:0
0
7:0
0
8:0
0
9:0
0
10
:00
11
:00
Noo
n
1:0
0
2:0
0
3:0
0
4:0
0
5:0
0
6:0
0
7:0
0
8:0
0
9:0
0
10
:00
11
:00
Fa
tal
Cra
shes
To
tal
Cra
shes
Time of Day
Total Crashes Fatal Crashes

Minnesota Motor Vehicle Crash Facts, 2015 page 37 Department of Public Safety, Office of Traffic Safety
TABLE 1.28
HOLIDAY CRASH SUMMARY, 2010 - 2015
Holiday Period Year Hours*
Fatal
Crashes
Injury
Crashes
PDO
Crashes
Total
Crashes Killed Injured
Memorial Day 2010 78 8 167 244 419 9 245
(In 2015, the holiday 2011 78 0 130 258 388 0 189
period was 6 pm Fri, 2012 78 3 170 278 451 4 239
May 22- midnight 2013 78 5 111 250 366 5 154
Monday, May 25) 2014 78 4 158 263 425 4 233
2015 78 4 148 334 486 4 216
July 4th 2010 78 4 165 268 437 5 246
(In 2015, the holiday 2011 78 4 170 268 442 6 255
period was 6pm 2012 30 0 79 80 159 0 119
Thursday, 2013 102 6 222 334 562 7 332
July 2-midnight 2014 78 6 154 281 441 7 211
Sunday, July 5) 2015 78 1 179 274 454 1 258
Labor Day 2010 78 5 143 265 413 5 228
(In 2015, the holiday 2011 78 6 138 209 353 6 207
period was 6 pm Fri, 2012 78 5 145 241 391 6 221
Sept 4-midnight 2013 78 4 159 248 411 4 231
Monday, Sept 7) 2014 78 3 142 253 398 3 193
2015 78 5 163 283 451 6 286
Thanksgiving 2010 102 4 201 589 794 4 281
(In 2015, the holiday 2011 102 2 161 334 497 2 232
period was 6pm Wed 2012 102 1 191 599 791 1 269
Nov 25- midnight 2013 102 3 195 366 564 3 297
Sunday, Nov 29) 2014 102 3 198 658 859 3 293
2015 102 5 195 466 666 5 278
Christmas 2010 78 0 135 555 690 0 197
(In 2015, the holiday 2011 78 3 125 206 334 3 186
period was 2012 102 1 115 436 552 1 180
6 pm Thurs, 2013 30 0 70 309 379 0 102
Dec 24-midnight 2014 102 7 221 754 982 9 325
Sun, Dec 27) 2015 78 1 137 454 592 4 208
New Year’s 2010/11 78 1 221 671 893 1 308
(In 2015, the 2011/12 78 3 153 478 634 4 212
holiday period was 2012/13 102 5 165 489 549 7 240
6 pm Thurs, Dec 31 2013/14 30 0 61 179 240 0 76
-Midnight Sun, 2014/15 102 3 165 573 741 3 242
January 3, 2016) 2015/16 78 2 82 337 421 2 118
*Holiday period hours vary depending on the day of the week on which the holiday falls.

Minnesota Motor Vehicle Crash Facts, 2015 page 38 Department of Public Safety, Office of Traffic Safety
II: ALCOHOL-RELATED CRASHES BACKGROUND AND DEFINITIONS
Impaired driving incidents
As used here, an “impaired driving incident” is one
where there was an arrest for driving while under the
influence of alcohol or drugs and a violation from that
incident was subsequently entered on the person’s
driving record. In prior years, tables in this section
reported “DWI Arrests.” “DWI” is an older term that
usually connotes intoxication by alcohol. “Impaired
driving” is a broader and thus more descriptive term and
it conforms better to current Minnesota law. Law
enforcement agencies and courts report violations to
Driver Licensing, making driver license records the most
complete centralized source of data for statistics on
impaired driving. Additionally, since it is almost
impossible for a person, once arrested, to evade all of the
criminal charges and administrative actions the law calls
for, the number of impaired driving incidents on record
is almost the same as the number of arrests.
Alcohol-related crashes
While the term “impaired driving” covers many possible
types of impairment, the term “alcohol-related” is
restrictive: only alcohol-related crashes are counted. For
example, if a driver tests positive for cocaine, but
negative for alcohol, the crash will not be counted in this
section. A crash is classified as “alcohol-related” if any
driver, pedestrian, or bicyclist is shown by a chemical
test to be positive for alcohol. Thus, alcohol at the .01-
or-higher level makes the crash alcohol-related. In the
absence of test data, if the officer reports that he or she
believes the person had been drinking, or was under the
influence, the crash is also classified as alcohol-related.
Though rare, an officer sometimes reports he or she
believed a person had been drinking or was under the
influence, but the alcohol test is negative. In these cases,
the test result takes priority over the officer’s perception
and the crash is not classified as alcohol-related. Once a
crash is so classified, no matter whether it was a driver,
pedestrian, or bicyclist that was drinking, then every
fatality and injury in the crash is classified as alcohol-
related.
Drunk driving-related crashes
The term “drunk driving-related” is a more restrictive
term than “alcohol-related.” A crash is classified as
“drunk driving-related” if a motor vehicle driver in a
fatal crash tested positive for alcohol at the .08% level or
above. Pedestrians, bicyclists and officer perception are
not included. Once a crash is so classified, every fatality
in the crash is classified as drunk-driving related.
Officers’ reported perceptions are conservative
Officers are conservative in reporting drinking and
driving. Officer cautiousness is less a factor in fatal
crashes because every effort is made to obtain alcohol
test results. For less severe crashes, though, the officer’s
judgment is all that is available. Therefore, alcohol-
related non-fatal crashes are almost certain to be
considerably underestimated.
Important caveats to the definition
Not all alcohol-related traffic fatalities are due to driving
while intoxicated. If a drinking pedestrian or bicyclist is
in a crash and then he or she (or anyone in the crash)
dies, the death is an alcohol-related traffic death. For
example, in 2015, ten drinking pedestrians in separate
incidents died after colliding with a vehicle driven by a
non-drinking driver. Additionally, the definition given
above makes an assumption that the person drinking
caused, or contributed significantly to the crash. Experts
who study fatal traffic crashes in detail confirm that this
is almost always true, but it is important to recognize that
the assumption is not invariably true. There will be
exceptions to the rule. Sometimes a crash is alcohol-
related, but is not classified as such due to inadequate
data. For example, a drunk driver may die in a fiery crash
and the body may be incinerated. In this case, there may
be no evidence remaining that the crash involved
alcohol. Or a driver may die and lose all his or her blood
from wounds received in the crash, which likewise
prevents alcohol tests from being performed.
“Known” versus “estimated” alcohol-related deaths.
Testing drivers for alcohol is the key to accurately
classifying crashes. Minnesota is much better at testing
than most states. Because many drivers are still not
tested, the National Highway Traffic Safety
Administration (NHTSA) developed a sophisticated
statistical procedure that estimates how many fatalities
really were alcohol-related. The idea that a computerized
statistical procedure can accurately make such estimates
initially invites skepticism. However, NHTSA developed
the procedure with the greatest care over many years.
Tests of the procedure, performed by having it make
estimates for datasets from which critical data was
removed and then comparing the estimates against the
true parameters (putting back in the data that has been
removed), show that the procedure is accurate to within
about plus or minus one percentage point. Tables 2.02
and 2.08 show alcohol-related fatalities for Minnesota
using the two procedures (NHTSA’s estimating
procedure and the state’s procedure based on known
data). NHTSA’s estimate of the true percentage of
alcohol-related fatalities is always higher than, but very
close to, the state’s numbers. The reason the two
numbers are so close is that Minnesota does a good job

Minnesota Motor Vehicle Crash Facts, 2015 page 39 Department of Public Safety, Office of Traffic Safety
of collecting test results on drivers, pedestrians and
bicyclists in fatal crashes.
Alcohol-related crashes in Minnesota 2015 Drinking and driving remains a serious problem in
Minnesota and across the nation. For 2015, the National
Safety Council has made a conservative estimate of $285
million as the cost of alcohol-related crashes in
Minnesota. Predictably, there is a strong positive
relationship between alcohol use and crash severity. That
is, as crash severity increases, alcohol is more likely to
have been a factor in the crash. In 2015, 6% of minor
injuries, 11% of moderate injuries, 19% of severe
injuries and 33% of deaths were alcohol-related,
including 23% of deaths that were drunk driving-related.
In all, 137 known people died, which represents a 23%
increase from 2014 when 111 known people died. 2,203
known people were injured in crashes classified as
alcohol-related which is an 8% increase from 2014.
(NHTSA estimates will be higher).
Impaired driving incidents (DWIs) decrease
In 2015, there were 25,027 impaired driving incidents in
Minnesota. This number represents a 1% decrease from
the previous year. Anecdotal evidence suggests many
enforcement agencies have had problems filling
vacancies due to retirements. This could explain the
decrease in arrests.
Males and young people
When gender was stated, males made up 72% of the
DWI offenders last year, however, females are making
up a growing percentage of arrests. In 2015, they
accounted for 28% of the offenders. (10 years ago, they
were 24% of the offenders.) Impaired driving is
especially a problem among young adults. A person can
legally buy alcohol at age 21 (raised from 19 in 1986)
and drinking and driving too often follows that. Last
year, 21-to-34 year-olds committed 51% of the DWI
incidents on record. Drivers under age 21 accounted for
5%.
Drinking drivers themselves pay the price
Young people may have better reflexes than their elders,
but as drivers they take more risks and have less
experience than older people. They pay a clear price for
this. Drivers aged 15-34 accounted for 31% of all traffic
deaths and for fully 39% of the alcohol-related deaths. It
is also the drinkers themselves who are more likely to
pay the price for their dangerous behavior. Last year, 113
(82%) of the 137 people who died in alcohol-related
crashes were themselves the people whose drinking
behavior was a main factor which lead to the crash to be
classified as alcohol-related. In short, drinking drivers,
pedestrians and bicyclists mostly kill and injure
themselves. The remaining 24 people who died in the
alcohol crashes were non-drinking drivers, pedestrians,
or bicyclists, or were drinking or non-drinking vehicle
passengers.
When the crashes occur: weekends, late night
Most alcohol-related crashes occur on Fridays, Saturdays
and Sundays. Combined, these three days accounted for
38% of all traffic crashes, but 58% of the alcohol-related
crashes. The late night hours 9 p.m.-3 a.m. accounted for
11% of all crashes, but 44% of the alcohol-related
crashes. In addition, 43 (31%) of all fatal alcohol-related
crashes occurred on county state aid highways.
Fatal alcohol crashes usually involve just one vehicle
Of the 125 alcohol-related fatal crashes in 2015, 85
(68%) involved just one motor vehicle in transport. Of
the 125 alcohol-related fatal crashes: 31 involved a
single vehicle colliding with a fixed object and 31
involved a single vehicle losing control and overturning.
Test results for killed drivers
Minnesota is consistently at or near the top among the
states in the proportion of drivers in fatal crashes who are
tested for alcohol. Also, NHTSA developed a procedure
(explained on page 38) that compensates for missing
data. In 2015, there were 289 motor vehicle drivers who
were killed. (Note that this total does not include
pedestrians or bicyclists). Of the 289 killed drivers, the
Department of Public Safety was able to obtain alcohol
test results for 239 (83%). Of the 239 tested, 139 (58%)
tested negative, 22 (9%) tested between .01 and .07, 6
(3%) tested between .08 and .09 and 72 (30%) tested .10
or greater.
Majority of alcohol-related fatalities test above the
legal limit
The 137 alcohol-related fatalities in 2015 consisted of 80
car or truck drivers, 11 car or truck passengers, 23
motorcycle drivers, 3 motorcycle passengers, 5 ATV
drivers, 11 pedestrians, 3 bicyclists and 1 other vehicle.
Of the 137, the Department of Public Safety was able to
obtain alcohol test results for 128. Of these, 93 (73%)
had a result above the legal limit of .08.
Success story in Minnesota
In reality, the percentage of alcohol-related traffic
fatalities in Minnesota has steadily decreased in the past
half-century. In the 1960’s, around 60% of all traffic
deaths per year were alcohol-related. Today, this
percentage hovers around 33%. This is a great success
story for Minnesota and the nation as a whole. It is also
proof that as drivers change their behavior less tragedy
occurs on our roadways.

Minnesota Motor Vehicle Crash Facts, 2015 page 40 Department of Public Safety, Office of Traffic Safety
TABLE 2.01
OVERVIEW OF TRAFFIC SAFETY AND ALCOHOL STATISTICS, 1966 - 2015
Year
(1)
Total
Deaths
(2)
DWI
Arrests
(3)
Deaths
‘Any’
Alcohol
(4)
% of
Col (2)
(5)
Deaths
.08% +
Alcohol
(6)
% of
Col (2)
(7)
Deaths
Drunk
Driving
(.08%+
Alcohol)
(8)
% of
Col (2) (9)
1996 576 30,927 205 36% 169 29% 157 27%
1997 600 31,384 178 30% 151 25% 142 24%
1998 650 32,429 273 42% 222 34% 206 32%
1999 626 34,569 195 31% 156 25% 147 24%
2000 625 35,018 245 39% 212 34% 203 33%
2001 568 33,546 211 37% 167 29% 157 28%
2002 657 33,160 239 36% 185 28% 174 27%
2003 655 32,355 255 39% 205 31% 196 30%
2004 567 34,359 177 31% 155 27% 143 25%
2005 559 37,078 197 35% 164 29% 150 27%
2006 494 42,007 166 34% 141 29% 134 27%
2007 510 38,765 190 37% 170 33% 164 32%
2008 455 35,869 163 36% 137 30% 129 28%
2009 421 32,995 141 34% 112 27% 101 24%
2010 411 30,099 131 32% 121 29% 112 27%
2011 368 29,504 136 37% 111 30% 103 28%
2012 395 28,658 131 33% 104 26% 95 24%
2013 387 26,032 117 30% 95 25% 81 21%
2014 361 25,386 111 31% 91 25% 88 24%
2015 411 25,027 137 33% 107 26% 95 23%
Note: Column (4) lists the number of alcohol-related deaths resulting from fatal crashes where at least one driver, pedestrian or
bicyclist was suspected to be drinking or tested positive for alcohol at the .01% level or above. Column (6) lists the number of
impaired-related deaths resulting from fatal crashes where at least one driver, pedestrian or bicyclist tested positive for alcohol
at the .08% level or above. Column (8) lists the number of drunk driving-related deaths resulting from fatal crashes where at
least one driver tested positive for alcohol at the .08% level or above.

Minnesota Motor Vehicle Crash Facts, 2015 page 41 Department of Public Safety, Office of Traffic Safety
TABLE 2.02
ALCOHOL-RELATED FATAL CRASH SUMMARY, 1990 - 2015
Year
Alcohol Test Results on Killed Drivers All Traffic Fatalities Drivers Killed Results on Drivers Tested Alcohol-Related Fatalities
Tested for
Alcohol
Negative for
Alcohol
.01 to .07
Alcohol
.08 to .09
Alcohol
.10 or Higher
Alcohol Known* Estimated**
Total N
% of
Total N
% of
Tested N
% of
Tested N
% of
Tested N
% of
Tested Total N
% of
Total N
% of
Total
1990 334 260 78 129 50 19 7 4 2 108 41 568 235 41 258 46
1991 327 242 74 135 56 20 8 2 1 85 35 531 212 40 233 44
1992 344 237 69 135 57 9 3 6 2 89 38 581 229 39 240 41
1993 355 283 80 174 61 14 5 5 2 90 32 538 196 36 216 40
1994 377 303 80 183 60 16 5 7 3 97 32 644 226 35 250 39
1995 383 343 90 198 58 22 7 8 2 115 34 597 246 41 269 45
1996 359 314 87 209 67 16 5 6 2 83 26 576 205 36 222 38
1997 384 345 90 226 66 15 5 4 1 100 29 600 178 30 197 33
1998 406 369 91 218 59 23 6 6 2 122 33 650 273 42 285 44
1999 426 370 87 254 69 9 2 7 2 100 27 626 195 31 206 33
2000 403 375 93 226 60 16 4 6 2 127 34 625 245 39 258 41
2001 361 322 89 198 62 17 5 6 2 101 31 568 211 37 226 40
2002 430 365 85 223 61 21 6 3 1 118 32 657 239 36 255 39
2003 435 376 86 219 58 18 5 5 1 134 36 655 255 39 267 41
2004 389 337 87 219 65 11 3 4 1 103 31 567 177 31 184 32
2005 379 348 92 213 61 17 5 5 1 113 33 559 197 35 201 36
2006 346 321 93 207 64 15 5 5 2 94 29 494 166 34 183 37
2007 381 336 88 207 62 15 4 7 2 107 32 510 190 37 198 39
2008 316 286 90 176 62 15 5 6 2 89 31 455 163 36 168 38
2009 266 236 89 160 68 13 5 4 2 59 25 421 141 34 152 36
2010 270 237 88 156 66 6 3 2 1 73 31 411 131 32 146 36
2011 243 220 91 137 62 11 5 6 3 66 30 368 136 37 146 40
2012 262 206 79 130 63 5 2 2 1 69 34 395 131 33 148 37
Year
Alcohol Test Results on Killed Drivers All Traffic Fatalities Drivers Killed Results on Drivers Tested Impaired-Related
Fatalities**
Tested for
Alcohol
Negative for
Alcohol
.01 to .07
Alcohol
.08 to .09
Alcohol
.10 or Higher
Alcohol Known* Estimated**
Total N
% of
Total N
% of
Tested N
% of
Tested N
% of
Tested N
% of
Tested Total N
% of
Total N
% of
Total
2013 259 219 85 151 69 10 5 3 1 55 25 387 81 21 114 29
2014 248 200 81 129 65 8 4 3 2 60 30 361 88 24 121 33%
2015 289 239 83 139 58 22 9 6 3 72 30 411 95 23 n/a n/a
* For explanation of the difference between “known” and “estimated” alcohol-related fatalities, see page 38.
** NHTSA recently improved its method of estimating the true percentage of alcohol-related fatalities for each year.
The above table reflects these changes back to the year 1982. Starting in 2013, NHTSA began estimating the
true percentage of based on impaired-related fatalities and excluding pedestrians and bicyclists.

Minnesota Motor Vehicle Crash Facts, 2015 page 42 Department of Public Safety, Office of Traffic Safety
TABLE 2.03 IMPAIRED DRIVING INCIDENTS (“DWIs”) BY GENDER
AND BY AREA OF STATE WHERE ARREST WAS MADE, 1996 - 2015
Male Female Not Stated Area: Metro
Area: Non-
Metro
Year Total Number Percent Number Percent Number Percent Number Percent Number Percent
1996 30,927 23,982 77.5% 5,466 17.7% 1,479 4.8% 15,947 51.6% 14,980 48.4%
1997 31,384 24,116 76.8% 5,833 18.6% 1,435 4.6% 16,148 51.5% 15,236 48.6%
1998 32,429 24,649 76.0% 6,152 19.0% 1,628 5.0% 16,718 51.6% 15,711 48.5%
1999 34,569 26,116 75.6% 6,551 19.0% 1,902 5.5% 17,136 49.6% 17,433 50.4%
2000 35,018 26,077 74.5% 6,846 19.6% 2,095 6.0% 16,816 48.0% 18,202 52.0%
2001 33,546 24,849 74.1% 6,597 19.7% 2,100 6.3% 16,351 48.7% 17,195 51.3%
2002 33,160 24,285 73.2% 6,655 20.1% 2,220 6.7% 16,211 48.9% 16,949 51.1%
2003 32,355 23,468 72.5% 6,630 20.5% 2,257 7.0% 16,041 49.6% 16,314 50.4%
2004 34,359 24,683 71.8% 7,312 21.3% 2,364 6.9% 16,776 48.8% 17,583 51.2%
2005 37,078 26,354 71.1% 8,165 22.0% 2,559 6.9% 17,875 48.2% 19,203 51.8%
2006 42,007 29,380 69.9% 9,475 22.6% 3,152 7.5% 20,534 48.9% 21,473 51.1%
2007 38,765 26,889 69.4% 8,984 23.2% 2,892 7.5% 18,797 48.5% 19,968 51.5%
2008 35,869 24,633 68.7% 8,594 24.0% 2,642 7.4% 17,825 49.7% 18,044 50.3%
2009 32,995 22,611 68.5% 8,070 24.5% 2,314 7.0% 16,348 49.6% 16,647 50.5%
2010 30,009 20,402 67.8% 7,555 25.1% 2,142 7.1% 15,213 50.5% 14,886 49.5%
2011 29,504 20,300 68.8% 7,427 25.2% 1,777 6.0% 14,966 50.7% 14,538 49.3%
2012 28,658 19,399 67.7% 7,287 25.4% 1,972 6.9% 14,764 51.5% 13,894 48.5%
2013 26,032 17,519 67.3% 6,631 25.5% 1,882 7.2% 13,431 51.6% 12,601 48.4%
2014 25,386 17,092 67.3% 6,267 24.7% 2,027 8.0% 13,281 52.3% 12,105 47.7%
2015 25,027 16,422 65.6% 6,368 25.4% 2,237 8.9% 12,959 51.8% 12,068 48.2%
* Note: The table above creates the impression that the proportion of violators with gender “not stated” is increasing over
time. This is not so. If a person arrested for impaired driving does not have a Minnesota driver’s license, then a record is
created, but the new record does not show the person’s gender. As years pass, many of these violators do eventually get a
Minnesota driver’s license, which does record gender. Thus, as time passes, the gender of more and more past violators
becomes known. The table above merely uses current information that was not available at the time of the original violation.
TABLE 2.04 IMPAIRED DRIVING INCIDENTS (“DWIs”) FOR SELECTED AGE GROUPS, 1996 - 2015
Year Total Age
0-14
Age
15
Age
16
Age
17
Age
18
Age
19
Age
20
Total
< 21
Age
21-34
Age
35-49
Age
50+
1996 30,927 2 13 138 306 615 798 838 2,708 16,021 9,902 2,294
1997 31,384 4 18 106 278 639 768 895 2,704 15,732 10,441 2,503
1998 32,429 2 18 105 301 679 892 930 2,925 15,839 11,116 2,547
1999 34,569 4 18 116 289 744 1,003 1,047 3,217 17,114 11,480 2,754
2000 35,018 4 10 127 327 711 991 1,119 3,285 17,329 11,547 2,853
2001 33,546 1 16 123 277 645 925 1,046 3,032 16,888 10,825 2,800
2002 33,160 7 12 124 308 661 861 1,097 3,063 16,706 10,433 2,951
2003 32,355 3 21 118 281 697 920 1,078 3,115 16,602 9,765 2,870
2004 34,359 3 13 108 302 685 903 1,018 3,029 17,905 10,225 3,196
2005 37,078 5 16 122 344 710 1,037 1,238 3,467 19,621 10,607 3,378
2006 42,007 4 24 138 391 870 1,291 1,351 4,065 22,557 11,524 3,856
2007 38,765 4 11 126 327 720 1,066 1,218 3,468 20,588 10,770 3,935
2008 35,869 4 15 105 269 638 885 1,049 2,961 19,014 9,890 4,000
2009 32,995 4 7 75 197 536 805 911 2,531 17,297 9,251 3,911
2010 30,099 4 9 57 142 434 676 816 2,134 15,812 8,188 3,961
2011 29,504 2 6 56 160 379 591 757 1,949 15,604 7,900 4,049
2012 28,658 4 10 44 114 341 629 674 1,812 15,240 7,577 4,025
2013 26,032 1 10 42 103 289 443 618 1,505 13,810 6,871 3,845
2014 25,386 0 5 22 105 266 399 541 1,338 13,067 6,885 4,096
2015 25,027 0 3 27 84 271 402 487 1,274 12,855 6,779 4,117

Minnesota Motor Vehicle Crash Facts, 2015 page 43 Department of Public Safety, Office of Traffic Safety
FIGURE 2.01
PERCENT OF IMPAIRED DRIVING INCIDENTS (“DWIs”) COMMITTED BY OFFENDERS IN FOUR AGE GROUPS, 1996 - 2015
TABLE 2.05
IMPAIRED DRIVING INCIDENTS (“DWIs”) BY AGE-GROUP, 1996 - 2015
Year of
Incident
Age
0-14
Age
15-19
Age
20-24
Age
25-29
Age
30-34
Age
35-39
Age
40-44
Age
45-49
Age
50-54
Age
55-59
Age
60-64
Age
65-69
Age
70-74
Age
75-79
Age
80-84
Age
85+ Total
1996 2 1,870 5,809 5,588 5,462 4,792 3,181 1,929 1,009 595 318 215 97 43 16 1 30,927
1997 4 1,809 5,824 5,720 5,083 4,969 3,361 2,111 1,172 621 341 206 97 50 14 2 31,384
1998 2 1,995 6,261 5,596 4,912 5,223 3,631 2,262 1,155 677 340 195 103 57 18 2 32,429
1999 4 2,170 7,398 5,850 4,913 5,255 3,853 2,372 1,331 672 403 192 96 45 12 3 34,569
2000 4 2,166 7,780 5,843 4,825 5,122 3,943 2,482 1,400 696 372 194 119 54 18 0 35,018
2001 1 1,986 7,918 5,451 4,565 4,450 3,910 2,465 1,457 651 339 192 100 43 14 4 33,546
2002 7 1,966 8,148 5,283 4,372 4,060 3,876 2,497 1,456 752 358 197 105 60 18 5 33,160
2003 3 2,037 8,248 5,420 4,012 3,643 3,653 2,469 1,382 753 384 188 96 47 19 1 32,355
2004 3 2,011 8,739 5,923 4,261 3,667 3,846 2,712 1,654 791 425 166 92 38 27 3 34,359
2005 5 2,229 9,633 6,845 4,381 3,802 3,867 2,938 1,676 923 411 215 92 46 10 5 37,078
2006 4 2,714 11,057 8,073 4,778 4,161 4,027 3,336 1,984 1,029 449 226 109 37 18 4 42,007
2007 4 2,250 9,907 7,407 4,492 3,960 3,637 3,173 1,919 1,101 492 263 94 51 13 2 38,765
2008 4 1,912 8,624 6,908 4,531 3,600 3,282 3,008 1,947 1,104 555 229 101 46 12 6 35,869
2009 4 1,620 7,637 6,442 4,129 3,385 2,971 2,895 1,899 1,063 539 233 120 37 13 7 32,995
2010 4 1,318 6,857 5,802 3,969 2,932 2,678 2,578 1,928 1,090 546 237 99 41 18 2 30,099
2011 2 1,192 6,553 5,874 3,934 2,807 2,686 2,407 1,921 1,084 618 232 121 46 22 5 29,504
2012 4 1,138 6,452 5,478 3,984 2,657 2,688 2,232 1,843 1,096 612 276 137 39 16 6 28,658
2013 1 887 5,531 5,077 3,820 2,627 2,271 1,973 1,794 1,059 565 249 109 42 23 4 26,032
2014 0 797 5,138 4,853 3,617 2,727 2,283 1,875 1,800 1,178 614 318 115 53 15 3 25,386
2015 0 787 4,908 4,881 3,553 2,789 2,117 1,873 1,797 1,226 609 290 121 51 19 4 25,027
0%
10%
20%
30%
40%
50%
60%
70%
19
96
19
97
19
98
19
99
20
00
20
01
20
02
20
03
20
04
20
05
20
06
20
07
20
08
20
09
20
10
20
11
20
12
20
13
20
14
20
15
Under 21 21-34 35-49 50 +

Minnesota Motor Vehicle Crash Facts, 2015 page 44 Department of Public Safety, Office of Traffic Safety
TABLE 2.06
AGE OF PERSONS KILLED AND INJURED IN ALL CRASHES AND IN ALCOHOL-RELATED CRASHES, 2015
Age
Group Killed
Alcohol
Related1
Severe
Injuries
Alcohol
Related2
Moderate
Injuries
Alcohol
Related2
Minor
Injuries
Alcohol
Related2
Total
Injured
Alcohol
Related2
00 - 04 1 0 14 1 50 4 387 14 451 19
05 - 09 4 0 15 1 131 12 514 17 660 30
10 - 14 8 0 21 1 137 9 588 19 746 29
15 2 0 16 2 72 2 206 5 294 9
16 5 1 30 1 156 15 525 11 711 27
17 3 1 23 4 159 10 534 22 716 36
18 7 0 26 4 214 20 547 27 787 51
19 9 2 23 3 188 23 519 36 730 62
20 10 3 24 5 224 26 528 30 776 61
< 21: 49 7 192 22 1,331 121 4,348 181 5,871 324
00 - 14 13 0 50 3 318 25 1,489 50 1,857 78
15 - 19 26 4 118 14 789 70 2,331 101 3,238 185
20 - 24 45 21 136 38 988 135 2,578 231 3,702 404
25 - 29 29 17 119 39 782 134 2,291 197 3,192 370
30 - 34 29 12 111 26 640 97 2,009 124 2,760 247
35 - 39 23 14 73 20 551 65 1,610 98 2,234 183
40 - 44 23 12 80 17 471 54 1,395 78 1,946 149
45 - 49 26 14 80 21 481 58 1,415 69 1,976 148
50 - 54 42 18 80 11 506 43 1,494 75 2,080 129
55 - 59 30 7 91 10 491 49 1,343 58 1,925 117
60 - 64 26 7 64 5 368 34 1,030 42 1,462 81
65 - 69 27 2 38 5 278 18 789 19 1,105 42
70 - 74 17 4 25 3 207 9 466 16 698 28
75 - 79 21 1 18 0 136 3 320 4 474 7
80 - 84 15 3 22 0 76 1 239 5 337 6
85 + 19 1 9 0 77 3 183 1 269 4
Unk 0 0 13 0 92 5 621 20 726 25
Total 411 137 1,127 212 7,251 803 21,603 1,188 29,981 2,203
1 Based on alcohol test results plus officer's perception of possible alcohol involvement as noted on crash report. 2 Based only on officer's perception of possible alcohol involvement as noted on crash report.
Note As shown, there were 137 alcohol-related traffic fatalities in the year 2015. Eleven of those deaths were to pedestrians and
ten of them were drinking. None of the motor vehicle drivers involved was drinking. Three bicyclists were also among the
alcohol related fatalities in 2015. All three bicyclists had been drinking and one of the motor vehicle drivers involved was
drinking.

Minnesota Motor Vehicle Crash Facts, 2015 page 45 Department of Public Safety, Office of Traffic Safety
TABLE 2.07
2015 ALCOHOL-RELATED FATALITIES' LEVEL OF ALCOHOL CONCENTRATION BY TRAFFIC ROLE
Traffic Role Killed Tested .00 .01 - .07 .08 - .09 .10 +
Car or Truck Driver 80 79 7 11 6 55
Car or Truck Passenger 11 3 1 2 0 0
Motorcycle Driver 23 23 1 9 0 13
Motorcycle Passenger 3 3 0 1 1 1
ATV Driver 5 5 0 1 0 4
Pedestrian 11 11 1 0 0 10
Bicyclist 3 3 0 0 0 3
Other Vehicle 1 1 0 1 0 0
Total 137 128 10 25 7 86
TABLE 2.08
PERCENT OF DEATHS, INJURIES and PROPERTY DAMAGE CRASHES DETERMINED TO BE ALCOHOL-RELATED, 2006 - 2015
2006 2007 2008 2009 2010 2011 2012 2013 2014 2015
Deaths* (Known) 34% 37% 36% 34% 32% 37% 33% 30% 31% 33%
(Estimated)** 37% 39% 38% 36% 36% 40% 37% 24% 33% n/a
Injuries*** 10% 9% 9% 8% 8% 8% 9% 8% 7% 7%
PDO Crashes**** 4% 4% 4% 4% 4% 4% 4% 4% 3% 4%
* Based on alcohol test results plus officer's perception of possible alcohol involvement as noted on crash report.
**Beginning in 2013, estimations are based on impaired-related fatalities and excluding pedestrians and bicyclists.
*** Based on alcohol test results plus officer's perception of possible alcohol involvement as noted on crash report.
**** Based only on police officer's perception of possible alcohol involvement. (PDO = Property Damage Only).
TABLE 2.09 FIRST HARMFUL EVENT IN ALCOHOL-RELATED FATAL CRASHES AND ALL FATAL CRASHES, 2015
First Harmful Event
Number of
All Fatal
Crashes
% of Fatal
Crashes
Number of
Alcohol-
Related Fatal
Crashes
% of Alcohol-
Related Fatal
Crashes
Collison with:
Another Motor Vehicle 179 47.7% 40 32.0%
Fixed Object 69 18.4% 31 24.8%
Pedestrian 41 10.9% 11 8.8%
Train 2 0.5% 1 0.8%
Bicyclist 10 2.7% 3 2.4%
Deer/Other Animal 7 1.9% 3 2.4%
Other Collision Type 6 1.6% 3 2.4%
Non-Collision:
Overturn 55 14.7% 31 24.8%
Other Type Non-Collision 3 0.8% 1 0.8%
Unknown 3 0.8% 1 0.8%
Total 375 100.0% 125 100.0%

Minnesota Motor Vehicle Crash Facts, 2015 page 46 Department of Public Safety, Office of Traffic Safety
TABLE 2.10 TEST RESULTS OF DRIVERS KILLED, 2006 - 2015
Year Killed Tested .00 .01 - .07 .08 - .09 .10 +
2006 346 321 207 (64%) 15 (5%) 5 (2%) 94 (29%)
2007 381 336 207 (62%) 15 (4%) 7 (2%) 107 (32%)
2008 316 286 176 (62%) 15 (5%) 6 (2%) 89 (31%)
2009 266 236 160 (68%) 13 (5%) 4 (2%) 59 (25%)
2010 270 237 156 (66%) 6 (3%) 2 (1%) 73 (31%)
2011 243 220 137 (62%) 11 (5%) 6 (3%) 66 (30%)
2012 262 206 130 (63%) 5 (2%) 2 (1%) 69 (34%)
2013 259 219 151 (69%) 10 (5%) 3 (1%) 55 (25%)
2014 248 200 129 (65%) 8 (4%) 3 (2%) 60 (30%)
2015 289 239 139 (58%) 22 (9%) 6 (3%) 72 (30%)
Percents based on drivers tested.
TABLE 2.11 DRIVERS KILLED WHO TESTED .01 OR HIGHER, 2006 - 2015
("Any Alcohol")
Year Total Male Female
Occurred Between
Midnight - 3 AM
Under
Legal Age
2006 114 95 (83%) 19 (17%) 34 (30%) 14 (12%)
2007 129 110 (85%) 19 (15%) 28 (22%) 11 (9%)
2008 110 91 (83%) 19 (17%) 31 (28%) 9 (8%)
2009 76 63 (83%) 13 (17%) 12 (16%) 7 (9%)
2010 81 63 (78%) 18 (22%) 12 (15%) 7 (9%)
2011 83 70 (84%) 13 (16%) 24 (29%) 9 (11%)
2012 76 66 (87%) 10 (13%) 13 (17%) 6 (8%)
2013 68 59 (87%) 9 (13%) 20 (29%) 3 (4%)
2014 71 63 (89%) 8 (11%) 15 (21%) 3 (4%)
2015 100 88 (88%) 12 (12%) 15 (15%) 4 (4%)
TABLE 2.12 DRIVERS KILLED WHO TESTED OVER THE LEGAL LIMIT, 2006 - 2015
(The legal limit in Minnesota was lowered to .08 in mid-2005)
Year Total Male Female
Occurred Between
Midnight - 3 AM
Under
Legal Age
2006 99 84 (85%) 15 (15%) 32 (32%) 13 (13%)
2007 114 98 (86%) 16 (14%) 27 (24%) 10 (9%)
2008 95 81 (85%) 14 (15%) 31 (33%) 8 (8%)
2009 63 53 (84%) 10 (16%) 11 (17%) 6 (10%)
2010 75 58 (77%) 17 (23%) 12 (16%) 6 (8%)
2011 72 62 (86%) 10 (14%) 21 (29%) 8 (11%)
2012 71 62 (87%) 9 (13%) 12 (29%) 8 (11%)
2013 58 49 (85%) 9 (16%) 18 (31%) 2 (4%)
2014 63 56 (89%) 7 (11%) 14 (22%) 2 (3%)
2015 78 71 (91%) 7 (9%) 15 (19%) 3 (4%)

Minnesota Motor Vehicle Crash Facts, 2015 page 47 Department of Public Safety, Office of Traffic Safety
FIGURE 2.02
KILLED DRIVERS TESTED FOR ALCOHOL: 1980 - 2015
Percent Over .01 Alcohol Level and Percent Over Legal Limit (The legal limit in Minnesota was lowered to .08 in 2005)
FIGURE 2.03
PERCENT OF DRIVERS KILLED WHO HAD BEEN DRINKING, BY AGE, 2015
0%
10%
20%
30%
40%
50%
60%
70%
80%
19
80
19
81
19
82
19
83
19
84
19
85
19
86
19
87
19
88
19
89
19
90
19
91
19
92
19
93
19
94
19
95
19
96
19
97
19
98
19
99
20
00
20
01
20
02
20
03
20
04
20
05
20
06
20
07
20
08
20
09
20
10
20
11
20
12
20
13
20
14
20
15
Percent over .01 Percent over legal limit
0%
10%
20%
30%
40%
50%
60%
70%
15
-19
20
-24
25
-29
30
-34
35
-39
40
-44
45
-49
50
-54
55
-59
60
-64
65
-69
70
-74
75
-79
80
-84
85
+
Age-Group

Minnesota Motor Vehicle Crash Facts, 2015 page 48 Department of Public Safety, Office of Traffic Safety
TABLE 2.13
2015 DRIVER FATALITIES' LEVEL OF ALCOHOL CONCENTRATION BY AGE
Alcohol Concentration
.00 .01 - .07 .08 - .09 .10+ Alcohol Concentration
Age Killed Tested
num-
ber
per-
cent
num-
ber
per-
cent
num
-ber
per-
cent
num-
ber
per-
cent
.00
.01-
.04
.05-
.09
.10-
.14
.15-
.19
.20-
.24 .25+
00 – 14 0 0 0 0 0 0 0 0 0 0 0 0 0
15 0 0 0 0 0 0 0 0 0 0 0 0 0
16 4 4 4 0 0 0 4 0 0 0 0 0 0
17 2 2 2 0 0 0 2 0 0 0 0 0 0
18 4 4 4 0 0 0 4 0 0 0 0 0 0
19 6 5 4 0 0 1 4 0 0 0 0 0 1
20 10 10 7 1 1 1 7 1 1 1 0 0 0
< 21 26 25 21 1 1 2 21 1 1 1 0 0 1
00 - 14 0 0 0 0.0% 0 0.0% 0 0.0% 0 0.0% 0 0 0 0 0 0 0
15 - 19 16 15 14 93.3% 0 0.0% 0 0.0% 1 6.7% 14 0 0 0 0 0 1 20 - 24 35 31 17 54.8% 2 6.5% 1 3.2% 11 35.5% 17 2 1 3 2 3 3 25 - 29 22 22 9 40.9% 2 9.1% 0 0.0% 11 50.0% 9 1 1 1 3 3 4 30 - 34 26 20 11 55.0% 0 0.0% 0 0.0% 9 45.0% 11 0 0 0 3 4 2 35 - 39 15 15 6 40.0% 1 6.7% 0 0.0% 8 53.3% 6 1 0 1 5 1 1 40 - 44 16 14 6 42.9% 1 7.1% 1 7.1% 6 42.9% 6 1 1 0 1 2 3 45 - 49 17 16 7 43.8% 2 12.5% 0 0.0% 7 43.8% 7 1 1 2 3 1 1 50 - 54 33 31 14 45.2% 3 9.7% 3 9.7% 11 35.5% 14 2 4 1 4 2 4 55 - 59 22 16 12 75.0% 1 6.3% 0 0.0% 3 18.8% 12 1 0 1 0 0 2 60 - 64 18 14 7 50.0% 5 35.7% 0 0.0% 2 14.3% 7 3 2 1 0 0 1 65 - 69 21 14 12 85.7% 1 7.1% 0 0.0% 1 7.1% 12 1 0 1 0 0 0 70 - 74 13 10 8 80.0% 1 10.0% 0 0.0% 1 10.0% 8 1 0 0 0 1 0 75 - 79 12 7 6 85.7% 1 14.3% 0 0.0% 0 0.0% 6 0 1 0 0 0 0 80 - 84 11 6 3 50.0% 2 33.3% 0 0.0% 1 16.7% 3 1 1 0 0 1 0 85+ 12 8 7 87.5% 0 0.0% 1 12.5% 0 0.0% 7 0 1 0 0 0 0
Total 289 239 139 58.2% 22 9.2% 6 2.5% 72 30.1% 139 15 13 11 21 18 22
NOTE: Percentages, based on drivers tested, may not add to 100.0% due to rounding.

Minnesota Motor Vehicle Crash Facts, 2015 page 49 Department of Public Safety, Office of Traffic Safety
TABLE 2.14
2015 ALCOHOL-RELATED CRASHES BY MONTH
Month
Fatal
Crashes
Injury
Crashes
Property
Damage
Total
Crashes Killed Injured
January 3 104 188 295 3 147
February 8 110 169 287 9 171
March 14 113 147 274 16 157
April 12 125 122 259 12 159
May 11 152 170 333 12 213
June 21 124 158 303 21 170
July 9 155 161 325 12 216
August 12 168 156 336 14 236
September 11 149 154 314 12 208
October 9 144 189 342 10 189
November 8 138 157 303 9 192
December 7 105 151 263 7 145
Total 125 1,587 1,922 3,634 137 2,203
TABLE 2.15
2015 ALCOHOL-RELATED CRASHES BY ROADWAY TYPE
Roadway Type
Fatal
Crashes
Injury
Crashes
Property
Damage
Crashes Total
Crashes Killed Injured
Urban Interstate 6 131 249 386 6 167
Rural Interstate 3 36 53 92 3 46
Urban US Trunk Hwy 5 82 105 192 5 118
Rural US Trunk Hwy 9 79 60 148 10 115
Urban MN Trunk Hwy 10 106 174 290 12 173
Rural MN Trunk Hwy 23 111 98 232 29 160
County State Aid Hwy 40 473 395 908 43 640
County Road 6 60 35 101 6 87
Township Road 11 86 56 153 11 120
Mun State Aid Hwy 4 207 297 508 4 284
Municipal Street 6 209 384 599 6 282
Other 2 7 16 25 2 11
Total 125 1,587 1,922 3,634 137 2,203

Minnesota Motor Vehicle Crash Facts, 2015 page 50 Department of Public Safety, Office of Traffic Safety
FIGURE 2.04
2015 ALCOHOL-RELATED CRASHES BY TIME OF DAY
FIGURE 2.05
2015 ALCOHOL-RELATED CRASHES BY DAY OF WEEK
0
50
100
150
200
250
300
350
12
:00
AM
1:0
0 A
M
2:0
0 A
M
3:0
0 A
M
4:0
0 A
M
5:0
0 A
M
6:0
0 A
M
7:0
0 A
M
8:0
0 A
M
9:0
0 A
M
10
:00
AM
11
:00
AM
12
:00
PM
1:0
0 P
M
2:0
0 P
M
3:0
0 P
M
4:0
0 P
M
5:0
0 P
M
6:0
0 P
M
7:0
0 P
M
8:0
0 P
M
9:0
0 P
M
10
:00
PM
11
:00
PM
Un
kno
wn
Nu
mb
er
of
Cra
she
s
Time of Day
Sunday, 20%
Monday, 10%
Tuesday, 10%
Wednesday, 11%Thursday, 12%
Friday, 16%
Saturday, 22%

Minnesota Motor Vehicle Crash Facts, 2015 page 51 Department of Public Safety, Office of Traffic Safety
TABLE 2.16
2015 ALCOHOL-RELATED CRASHES BY TIME OF DAY AND DAY OF WEEK
Hour
Beginning Sunday Monday Tuesday
Wednes-
day
Thurs-
day Friday Saturday
Total
Crashes
Total
Killed
Total
Injured
Midnight 70 14 23 28 24 42 64 265 9 139
1:00 AM 86 24 24 21 34 30 62 281 6 151
2:00 AM 86 22 22 21 30 42 78 301 4 169
3:00 AM 60 13 9 6 21 24 59 192 10 111
4:00 AM 33 3 7 8 13 13 29 106 4 58
5:00 AM 21 8 4 8 11 11 23 86 5 57
6:00 AM 21 7 9 4 9 10 20 80 6 71
7:00 AM 14 6 1 4 3 7 11 46 2 26
8:00 AM 8 4 5 6 6 3 16 48 2 23
9:00 AM 7 5 8 4 5 4 9 42 1 20
10:00 AM 9 6 6 5 6 9 9 50 1 28
11:00 AM 11 5 8 7 7 10 10 58 1 45
Noon 10 6 5 6 10 7 11 55 2 30
1:00 PM 16 9 7 6 12 11 16 77 3 71
2:00 PM 14 8 13 10 10 14 19 88 3 69
3:00 PM 21 12 13 13 22 18 23 122 8 68
4:00 PM 19 22 21 18 11 25 28 144 4 80
5:00 PM 26 17 27 28 25 44 38 205 6 112
6:00 PM 34 29 19 28 22 38 40 210 9 168
7:00 PM 29 14 23 32 21 45 36 200 6 140
8:00 PM 40 26 26 30 26 35 51 234 8 148
9:00 PM 29 32 29 33 30 43 48 244 12 134
10:00 PM 27 21 36 27 36 48 47 242 11 156
11:00 PM 22 32 30 29 30 50 63 256 14 129
Unknown 1 0 0 0 0 0 1 2 0 0
Total 714 345 375 382 424 583 811 3,634 137 2,203

Minnesota Motor Vehicle Crash Facts, 2015 page 52 Department of Public Safety, Office of Traffic Safety
TABLE 2.17
2015 DRUNK DRIVING-RELATED CRASHES BY MONTH
Month
Fatal
Crashes Killed
January 1 1
February 6 7
March 11 13
April 10 10
May 6 6
June 14 14
July 7 10
August 7 8
September 7 8
October 7 8
November 5 5
December 5 5
Total 86 95
TABLE 2.18
2015 DRUNK DRIVING-RELATED FATAL CRASHES BY ROADWAY TYPE
Roadway Type
Fatal
Crashes Killed
Urban Interstate 3 3
Rural Interstate 2 2
Urban US Trunk Hwy 3 3
Rural US Trunk Hwy 5 6
Urban MN Trunk Hwy 4 6
Rural MN Trunk Hwy 20 24
County State Aid Hwy 26 28
County Road 6 6
Township Road 8 8
Mun State Aid Hwy 3 3
Municipal Street 4 4
Other 2 2
Total 86 95

Minnesota Motor Vehicle Crash Facts, 2015 page 53 Department of Public Safety, Office of Traffic Safety
FIGURE 2.06
2015 DRUNK DRIVING-RELATED FATAL CRASHES BY TIME OF DAY
FIGURE 2.07
2015 DRUNK DRIVING-RELATED FATAL CRASHES BY DAY OF WEEK
0
1
2
3
4
5
6
7
8
9
10
12
:00
AM
1:0
0 A
M
2:0
0 A
M
3:0
0 A
M
4:0
0 A
M
5:0
0 A
M
6:0
0 A
M
7:0
0 A
M
8:0
0 A
M
9:0
0 A
M
10
:00
AM
11
:00
AM
12
:00
PM
1:0
0 P
M
2:0
0 P
M
3:0
0 P
M
4:0
0 P
M
5:0
0 P
M
6:0
0 P
M
7:0
0 P
M
8:0
0 P
M
9:0
0 P
M
10
:00
PM
11
:00
PM
Nu
mb
er
of
Cra
she
s
Time of Day
Sunday, 22%
Monday, 10%
Tuesday, 8%
Wednesday, 12%
Thursday, 14%
Friday, 10%
Saturday, 23%

Minnesota Motor Vehicle Crash Facts, 2015 page 54 Department of Public Safety, Office of Traffic Safety
TABLE 2.19
DRUNK DRIVING-RELATED FATALITES AND ALCOHOL-RELATED INJURIES BY SEX AND PERSON TYPE, 2015
Females
Killed
Males
Killed
Total
Killed
Females
Severely
Injured
Males
Severely
Injured
Females
Moderately
Injured
Males
Moderately
Injured
Females-
Minor
Injuries
Males-
Minor
Injuries
Total
Injuries
Driver 10 74 84 26 123 167 404 277 570 1,568
Passenger 4 6 10 22 23 98 86 124 153 517
Non-Motorist Occupant 0 0 0 0 0 0 0 2 3 5
Bicyclist 0 1 1 0 3 2 12 2 12 31
Pedestrian 0 0 0 3 10 9 21 11 19 74
Unknown 0 0 0 0 1 0 1 2 4 8
Total 14 81 95 51 160 276 524 418 761 2,203
Note: Gender was not reported for 12 persons injured, causing the “Total” to be 12 greater than the sum of the
“severe,” “moderate,” and “minor” injury columns.

Minnesota Motor Vehicle Crash Facts, 2015 page 55 Department of Public Safety, Office of Traffic Safety
III: SAFETY EQUIPMENT USE BY
VEHICLE OCCUPANTS IN 2015 CRASHES
A brief history of restraint legislation
Studies estimate that using safety restraint devices
reduces the risk of death and serious injury by 40% to
60%. In view of this, the Minnesota Legislature
enacted laws mandating safety equipment use. The
Child Passenger Protection Act took effect in 1982
and was amended in 1983 and 1987. It requires
children under the age of four to be properly
restrained in a federally approved child car seat. The
state's safety belt law went into effect in 1986 and
was amended in 1988 and 1991. The law requires all
front seat occupants (and children ages four through
ten, regardless of seating position) to be restrained.
The 1986 belt law was ‘Secondary’ in nature. Thus,
an officer could not issue a citation for non-belt use
unless there was another moving violation. In 2009
the law was updated to ‘Primary’. In addition,
children aged four through seven must now be
properly restrained in a ‘booster seat’.
Tables in this section focus on restraint use by people
in crashes who were occupants of motor vehicles
normally equipped with seat belts. The data pose one
problem in that restraint use was reported as
“unknown” for 14.4% of the persons killed and
11.6% of the persons injured in 2015.
Restraint use responds to legislation
Observational surveys of safety belt use conducted
annually at random sites around Minnesota show that
legislation affects safety belt wearing behavior, thus,
saving lives and preventing injuries. In June 1986,
before the first safety belt law took effect, 20% of
front seat vehicle occupants used belts. The usage
rate jumped to 33% after the 1986 law took effect; to
47% after a $10 fine was added in 1988; and to 55%
after the fine was increased to $25 in 1991. In 1993
the fine for a child safety seat violation was raised to
$50 which also helped increase the overall seat belt
usage rate. Minnesota’s ‘Primary’ seat belt law took
effect on June 9th, 2009. In June 2015, the
observational seat belt study revealed a 94.0% usage
rate.
Occupant fatalities and injuries in 2015
In 2015, 285 motor vehicle occupants were killed in
traffic crashes, a 3% increase from the previous year.
Only 6% of Minnesotans do not use a seat belt, yet
those who were known to be unbelted represent 32%
(91) of the motor vehicle occupants killed in 2015.
This over-representation of unbelted occupants
among those killed clearly demonstrates the
increased risk of death when seat belts are not used.
The number of vehicle occupants injured (26,583)
increased 1% from 2014. These figures actually
reveal a beneficial trend that started in the mid-1980s.
Specifically, fatalities and severe injuries have been
“trading off” with moderate and minor injuries. They
are steadily declining due to the seat belt legislation
of the mid-1980s. In 1987, 4,176 motor vehicle
occupants suffered severe injuries. In 2015, that
number decreased to 745. This is encouraging news.
By definition, minor (or “possible”) and moderate (or
“non-incapacitating”) injuries do not produce long-
term and severe suffering, while severe injuries often
cause such suffering, including consequences such as
permanent brain damage and dismemberment.
Regional differences/Township roads
Among the motor vehicle occupants that were killed
or injured in the Northwest region of Minnesota, only
73% were known to be using a restraint. This is the
lowest rate of use of any region. The Southwest
region was the second lowest: 77%. Concerning
types of roadway, ‘Township Roads’ had the lowest
percentage of seat belt use (70%).
Ejection update: always wear your seat belt
Of the 285 occupants killed in 2015, nearly one in
four were ejected or partially ejected from the
vehicles they were riding in. And, 77% of these
ejected fatalities were not wearing a seat belt.
Airbag deployment update
In 2015, airbag deployment was reported 18,152
times when the occupant was also wearing a seat belt.
Fifty-six percent of these incidents resulted in no
apparent injury. Airbags deployed 808 times when
occupants were not wearing seat belts. Only 34% of
these cases resulted in no apparent injury. The
message is clear, always wear your seat belt.

Minnesota Motor Vehicle Crash Facts, 2015 page 49 Department of Public Safety, Office of Traffic Safety
TABLE 3.01
PERCENT OF FRONT SEAT OCCUPANTS WEARING SAFETY BELTS, BY DATE OF OBSERVATION STUDY
Area of State Class of Roadway
Date of Survey Overall Metro
Non-
Metro
Major
Roads
Local
Roads
August 1986 33% 43% 26% 35% 31%
August 1987 32% 40% 28% 35% 29%
August 1988 47% 51% 45% 48% 46%
August 1989 44% 52% 40% 44% 45%
August 1990 47% 54% 42% 49% 46%
August 1991 53% 62% 47% 53% 52%
August 1992 51% 62% 46% 55% 48%
August 1993 55% 59% 52% 57% 53%
August 1994* 57% 58% 54% 65% 54%
August 1995 65% 68% 56% 68% 64%
August 1996 64% 67% 58% 68% 62%
August 1997 65% 67% 59% 69% 63%
August 1998 64% 67% 56% 68% 63%
August 1999 72% 73% 68% 72% 68%
August 2000 73% 74% 69% 75% 71%
August 2001 74% 75% 72% 75% 69%
August 2002 80% 83% 72% 81% 76%
Vehicle Type Gender
Date of Survey Overall Car SUV Van Pickup Male Female
August 2003 79.4% 82% 79% 83% 69% 76% 83%
August 2004 82.1% 83% 87% 87% 71% 78% 88%
August 2005 83.9% 86% 87% 83% 75% 80% 89%
August 2006 83.3% 83% 87% 88% 76% 79% 88%
August 2007** 87.8% 89% 90% 90% 81% 84% 92%
August 2008 86.7% 88% 92% 88% 76% 83% 92%
August 2009 90.2% 91% 91% 95% 84% 89% 92%
August 2010 92.3% 94% 94% 95% 83% 89% 96%
August 2011 92.7% 94% 92% 96% 88% 90% 95%
August 2012 93.6% 94% 96% 93% 87% 92% 96%
August 2013 94.8% 96% 97% 97% 87% 93% 98%
August 2014 94.7% 97% 97% 97% 85% 93% 97%
August 2015 94.0% 94% 98% 94% 90% 92% 97%
*A new survey design was initiated in August 1994. In 2003 the survey was completely
redesigned and collected more information on vehicle occupants.
** The 2007 observational study was conducted after the 35W bridge collapse.

Minnesota Motor Vehicle Crash Facts, 2015 page 57 Department of Public Safety, Office of Traffic Safety
TABLE 3.02
MOTOR VEHICLE OCCUPANTS KILLED OR INJURED BY EJECTION STATUS AND INJURY SEVERITY, 2015
Killed Severe Injury Moderate Injury Minor Injury
Total Killed or
Injured
Ejection Status Number Row % Number Row % Number Row % Number Row % Number Total %
Not Ejected 215 0.9% 641 2.5% 5,688 22.4% 18,885 74.3% 25,429 100%
Partly Ejected 13 34.2% 6 15.8% 14 36.8% 5 13.2% 38 100%
Ejected 52 18.8% 65 23.5% 87 31.4% 73 26.4% 277 100%
Not Stated 5 0.4% 33 2.9% 166 14.8% 920 81.9% 1,124 100%
Total 285 1.1% 745 2.8% 5,955 22.2% 19,883 74.0% 26,868 100%
TABLE 3.03
MOTOR VEHICLE OCCUPANTS KILLED OR INJURED, BY AGE AND INJURY SEVERITY, 2015
Age Group Killed
Severe
Injury
Moderate
Injury
Minor
Injury
Total
Injuries
00 - 04 0 10 42 362 414
05 - 09 2 9 87 446 542
10 - 14 7 11 81 460 552
15 - 19 24 93 708 2,149 2,950
20 - 24 36 104 836 2,393 3,333
25 - 29 19 91 647 2,114 2,852
30 - 34 22 77 535 1,846 2,458
35 - 39 12 54 458 1,517 2,029
40 - 44 14 45 385 1,285 1,715
45 - 49 15 42 374 1,304 1,720
50 - 54 25 39 377 1,357 1,773
55 - 59 17 45 383 1,221 1,649
60 - 64 14 33 292 961 1,286
65 - 69 18 26 230 748 1,004
70 - 74 13 19 178 444 641
75 - 79 16 15 121 310 446
80 - 84 13 17 71 231 319
85 & Older 18 6 73 181 260
Not Stated 0 9 77 554 640
Total 285 745 5,955 19,883 26,583

Minnesota Motor Vehicle Crash Facts, 2015 page 58 Department of Public Safety, Office of Traffic Safety
FIGURE 3.01
SAFETY EQUIPMENT USE AMONG MOTOR VEHICLE OCCUPANTS KILLED OR INJURED, BY AGE, 2015
TABLE 3.04
SAFETY EQUIPMENT USE BY VEHICLE OCCUPANTS, BY GENDER AND INJURY SEVERITY, 2015
Females
Killed
Males
Killed
Total
Killed
Females
Severely
Injured
Males
Severely
Injured
Females
Moderately
Injured
Males
Moderately
Injured
Females-
Minor
Injuries
Males-
Minor
Injuries
Total
Injuries
Used 57 96 153 222 203 2,581 2,126 9,547 7,173 22,024
Not Used 24 67 91 56 118 184 316 360 417 1,470
Unknown 11 30 41 36 104 295 407 986 1,088 3,089
Total 92 193 285 314 425 3,060 2,849 10,893 8,678 26,583
Note: Gender was not reported for 364 persons injured (mostly those with minor injuries), causing the “Total” to be 364
greater than the sum of the “severe,” “moderate,” and “minor” injury columns.
0%
10%
20%
30%
40%
50%
60%
70%
80%
90%
100%0
-4
5-9
10
-14
15
-19
20
-24
25
-29
30
-34
35
-39
40
-44
45
-49
50
-54
55
-59
60
-64
65
-69
70
-74
75
+
Unknown
Not Used
Used

Minnesota Motor Vehicle Crash Facts, 2015 page 59 Department of Public Safety, Office of Traffic Safety
TABLE 3.05
SAFETY EQUIPMENT USE BY VEHICLE OCCUPANTS KILLED OR INJURED, BY AGE AND INJURY SEVERITY, 2015
Killed Severe Injuries Moderate Injuries Minor Injuries Total Injured
Age
Group
Restraint
Use N % N % N % N % N %
00 - 03
Years
Used 0 0.0% 5 62.5% 19 59.4% 229 79.8% 253 77.4%
Not Used 0 0.0% 2 25.0% 6 18.8% 30 10.5% 38 11.6%
Unknown 0 0.0% 1 12.5% 7 21.9% 28 9.8% 36 11.0%
Subtotal 0 100.0% 8 100.0% 32 100.0% 287 100.0% 327 100.0%
04 - 07
Years
Used 0 0.0% 5 62.5% 29 45.3% 195 56.9% 229 55.2%
Not Used 0 0.0% 2 25.0% 26 40.6% 111 32.4% 139 33.5%
Unknown 1 100% 1 12.5% 9 14.1% 37 10.8% 47 11.3%
Subtotal 1 100.0% 8 100.0% 64 100.0% 343 100.0% 415 100.0%
Total
00 - 07
Years
Used 0 0.0% 10 62.5% 48 50.0% 424 67.3% 482 65.0%
Not Used 0 0.0% 4 25.0% 32 33.3% 141 22.4% 177 23.9%
Unknown 1 100.0% 2 12.5% 16 16.7% 65 10.3% 83 11.2%
Subtotal 1 100.0% 16 100.0% 96 100.0% 630 100.0% 742 100.0%
00 - 04
Years
Used 0 0.0% 6 60.0% 25 59.5% 280 77.4% 311 75.1%
Not Used 0 0.0% 2 20.0% 8 19.1% 47 13.0% 57 13.8%
Unknown 0 0.0% 2 20.0% 9 21.4% 35 9.7% 46 11.1%
Subtotal 0 100.0% 10 100.0% 42 100.0% 362 100.0% 414 100.0%
05 - 09
Years
Used 1 50.0% 5 55.6% 51 58.6% 294 65.9% 350 64.6%
Not Used 0 0.0% 4 44.4% 28 32.2% 106 23.8% 138 25.5%
Unknown 1 50.0% 0 0.0% 8 9.2% 46 10.3% 54 10.0%
Subtotal 2 100.0% 9 100.0% 87 100.0% 446 100.0% 542 100.0%
10 - 14
Years
Used 5 71.4% 5 45.5% 66 81.5% 387 84.1% 458 83.0%
Not Used 2 28.6% 3 27.3% 10 12.4% 24 5.2% 37 6.7%
Unknown 0 0.0% 3 27.3% 5 6.2% 49 10.7% 57 10.3%
Subtotal 7 100.0% 11 100.0% 81 100.0% 460 100.0% 552 100.0%
15 - 19
Years
Used 11 45.8% 52 55.9% 548 77.4% 1,823 84.8% 2,423 82.1%
Not Used 8 33.3% 30 32.3% 85 12.0% 120 5.6% 235 8.0%
Unknown 5 20.8% 11 11.8% 75 10.6% 206 9.6% 292 9.9%
Subtotal 24 100.0% 93 100.0% 708 100.0% 2,149 100.0% 2,950 100.0%
20 - 24
Years
Used 19 52.8% 55 52.9% 635 76.0% 1,982 82.8% 2,672 80.2%
Not Used 15 41.7% 21 20.2% 87 10.4% 109 4.6% 217 6.5%
Unknown 2 5.6% 28 26.9% 114 13.6% 302 12.6% 444 13.3%
Subtotal 36 100.0% 104 100.0% 836 100.0% 2,393 100.0% 3,333 100.0%
25 - 29
Years
Used 4 21.1% 43 47.3% 479 74.0% 1,742 82.4% 2,264 79.4%
Not Used 10 52.6% 28 30.8% 67 10.4% 85 4.0% 180 6.3%
Unknown 5 26.3% 20 22.0% 101 15.6% 287 13.6% 408 14.3%
Subtotal 19 100.0% 91 100.0% 647 100.0% 2,114 100.0% 2,852 100.0%
30 - 34
Years
Used 6 27.3% 38 49.4% 420 78.5% 1,577 85.4% 2,035 82.8%
Not Used 13 59.1% 20 26.0% 41 7.7% 60 3.3% 121 4.9%
Unknown 3 13.6% 19 24.7% 74 13.8% 209 11.3% 302 12.3%
Subtotal 22 100.0% 77 100.0% 535 100.0% 1,846 100.0% 2,458 100.0%
35 - 39
Years
Used 4 33.3% 31 57.4% 365 79.7% 1,310 86.4% 1,706 84.1%
Not Used 5 41.7% 13 24.1% 27 5.9% 45 3.0% 85 4.2%
Unknown 3 25.0% 10 18.5% 66 14.4% 162 10.7% 238 11.7%
Subtotal 12 100.0% 54 100.0% 458 100.0% 1,517 100.0% 2,029 100.0%

Minnesota Motor Vehicle Crash Facts, 2015 page 60 Department of Public Safety, Office of Traffic Safety
TABLE 3.05 CONTINUED
SAFETY EQUIPMENT USE BY VEHICLE OCCUPANTS KILLED OR INJURED, BY AGE AND INJURY SEVERITY, 2015
Killed Severe Injuries Moderate Injuries Minor Injuries Total Injured
Age
Group
Restraint
Use N % N % N % N % N %
40 - 44
Years
Used 3 21.4% 27 60.0% 313 81.3% 1,117 86.9% 1,457 85.0%
Not Used 9 64.3% 7 15.6% 25 6.5% 32 2.5% 64 3.7%
Unknown 2 14.3% 11 24.4% 47 12.2% 136 10.6% 194 11.3%
Subtotal 14 100.0% 45 100.0% 385 100.0% 1,285 100.0% 1,715 100.0%
45 - 49
Years
Used 11 73.3% 27 64.3% 310 82.9% 1,145 87.8% 1,482 86.2%
Not Used 4 26.7% 10 23.8% 24 6.4% 25 1.9% 59 3.4%
Unknown 0 0.0% 5 11.9% 40 10.7% 134 10.3% 179 10.4%
Subtotal 15 100.0% 42 100.0% 374 100.0% 1,304 100.0% 1,720 100.0%
50 - 54
Years
Used 10 40.0% 28 71.8% 311 82.5% 1,209 89.1% 1,548 87.3%
Not Used 10 40.0% 5 12.8% 25 6.6% 26 1.9% 56 3.2%
Unknown 5 20.0% 6 15.4% 41 10.9% 122 9.0% 169 9.5%
Subtotal 25 100.0% 39 100.0% 377 100.0% 1,357 100.0% 1,773 100.0%
55 - 59
Years
Used 10 58.8% 29 64.4% 318 83.0% 1,077 88.2% 1,424 86.4%
Not Used 4 23.5% 8 17.8% 30 7.8% 29 2.4% 67 4.1%
Unknown 3 17.7% 8 17.8% 35 9.1% 115 9.4% 158 9.6%
Subtotal 17 100.0% 45 100.0% 383 100.0% 1,221 100.0% 1,649 100.0%
60 - 64
Years
Used 12 85.7% 20 60.6% 244 83.6% 860 89.5% 1,124 87.4%
Not Used 1 7.1% 10 30.3% 17 5.8% 19 2.0% 46 3.6%
Unknown 1 7.1% 3 9.1% 31 10.6% 82 8.5% 116 9.0%
Subtotal 14 100.0% 33 100.0% 292 100.0% 961 100.0% 1,286 100.0%
65 - 69
Years
Used 13 72.2% 22 84.6% 200 87.0% 682 91.2% 904 90.0%
Not Used 2 11.1% 3 11.5% 7 3.0% 13 1.7% 23 2.3%
Unknown 3 16.7% 1 3.9% 23 10.0% 53 7.1% 77 7.7%
Subtotal 18 100.0% 26 100.0% 230 100.0% 748 100.0% 1,004 100.0%
70 - 74
Years
Used 10 76.9% 11 57.9% 160 89.9% 407 91.7% 578 90.2%
Not Used 2 15.4% 4 21.1% 6 3.4% 14 3.2% 24 3.7%
Unknown 1 7.7% 4 21.1% 12 6.7% 23 5.2% 39 6.1%
Subtotal 13 100.0% 19 100.0% 178 100.0% 444 100.0% 641 100.0%
75 &
Older
Used 34 72.3% 27 71.1% 236 89.1% 653 90.4% 916 89.4%
Not Used 6 12.8% 4 10.5% 13 4.9% 13 1.8% 30 2.9%
Unknown 7 14.9% 7 18.4% 16 6.0% 56 7.8% 79 7.7%
Subtotal 47 100.0% 38 100.0% 265 100.0% 722 100.0% 1,025 100.0%
Age
Not
Stated
Used 0 0.0% 1 11.1% 52 67.5% 319 57.6% 372 58.1%
Not Used 0 0.0% 4 44.4% 3 3.9% 24 4.3% 31 4.8%
Unknown 0 0.0% 4 44.4% 22 28.6% 211 38.1% 237 37.0%
Subtotal 0 100.0% 9 100.0% 77 100.0% 554 100.0% 640 100.0%
All
Ages
Used 153 53.7% 427 57.3% 4,733 79.5% 16,864 84.8% 22,024 82.9%
Not Used 91 31.9% 176 23.6% 503 8.5% 791 4.0% 1,470 5.5%
Unknown 41 14.4% 142 19.1% 719 12.1% 2,228 11.2% 3,089 11.6%
Total 285 100.0% 745 100.0% 5,955 100.0% 19,883 100.0% 26,583 100.0%
Percentages may not sum to 100.0% due to rounding. Persons aged 0 through 3 and 4 through 7 years old are categorized separately because Minnesota
law makes special provisions for these age groups.

Minnesota Motor Vehicle Crash Facts, 2015 page 61 Department of Public Safety, Office of Traffic Safety
TABLE 3.06
PERCENT OF KILLED OR INJURED MOTOR VEHICLE OCCUPANTS WHO USED SAFETY EQUIPMENT, BY INJURY SEVERITY AND YEAR, 2006 - 2015
2006 2007 2008 2009 2010 2011 2012 2013 2014 2015
Killed
Used 40.0% 41.4% 45.2% 42.4% 48.5% 46.5% 46.7% 53.9% 54.7% 53.7%
Not Used 52.0% 48.9% 46.2% 43.7% 41.0% 44.3% 42.0% 34.9% 38.1% 31.9%
Unknown 8.0% 9.8% 8.6% 13.9% 10.5% 9.2% 11.2% 11.2% 7.2% 14.4%
Injured
Severe Injuries
Used 49.9% 52.2% 51.4% 55.2% 58.3% 59.2% 57.8% 57.2% 60.8% 57.3%
Not Used 32.8% 31.6% 29.8% 27.9% 27.2% 29.0% 25.8% 28.0% 21.6% 23.6%
Unknown 17.3% 16.2% 18.8% 16.9% 14.5% 11.8% 16.3% 14.8% 17.7% 19.1%
Moderate Injuries
Used 69.0% 71.6% 72.4% 74.6% 79.1% 79.1% 79.4% 81.0% 81.7% 79.5%
Not Used 16.8% 15.4% 14.8% 12.8% 10.8% 10.4% 10.1% 9.7% 8.3% 8.5%
Unknown 14.2% 13.0% 12.8% 12.6% 10.1% 10.5% 10.6% 9.3% 10.0% 12.1%
Minor Injuries
Used 80.2% 81.6% 81.8% 83.0% 84.7% 85.4% 85.1% 85.8% 86.0% 84.8%
Not Used 8.6% 7.6% 7.4% 6.5% 5.5% 5.1% 5.1% 4.1% 4.0% 4.0%
Unknown 11.3% 10.8% 10.8% 10.4% 9.8% 9.5% 9.9% 10.1% 10.0% 11.2%
Total Injured
Used 76.1% 78.0% 78.5% 80.1% 82.7% 83.3% 82.9% 83.9% 84.3% 82.9%
Not Used 11.6% 10.4% 10.0% 8.7% 7.3% 7.0% 6.8% 6.1% 5.4% 5.5%
Unknown 12.3% 11.6% 11.6% 11.2% 10.0% 9.7% 10.2% 10.0% 10.3% 11.6%
TABLE 3.07
SAFETY EQUIPMENT USE BY MOTOR VEHICLE OCCUPANTS KILLED OR INJURED, BY ROADWAY TYPE, 2015
Used Not Used Unknown Total
Roadway Type Number Percent Number Percent Number Percent Number Percent
Interstate 3,264 90.6% 144 4.0% 195 5.4% 3,603 100.0%
US Trunk Hwy 2,584 87.6% 184 6.2% 183 6.2% 2,951 100.0%
MN Trunk Hwy 4,026 86.3% 261 5.6% 377 8.1% 4,664 100.0%
CSAH 5,885 80.2% 439 6.0% 1,014 13.8% 7,338 100.0%
County Road 400 76.2% 50 9.5% 75 14.3% 525 100.0%
Township Road 503 69.7% 110 15.2% 109 15.1% 722 100.0%
MSAH 3,459 80.1% 198 4.6% 661 15.3% 4,318 100.0%
Municipal Street 2,025 75.4% 160 6.0% 500 18.6% 2,685 100.0%
Other Road 31 50.0% 15 24.2% 16 25.8% 62 100.0%
Total 22,177 82.5% 1,561 5.8% 3,130 11.7% 26,868 100.0%
CSAH = County State Aid Highway. MSAH = Municipal State Aid Highway
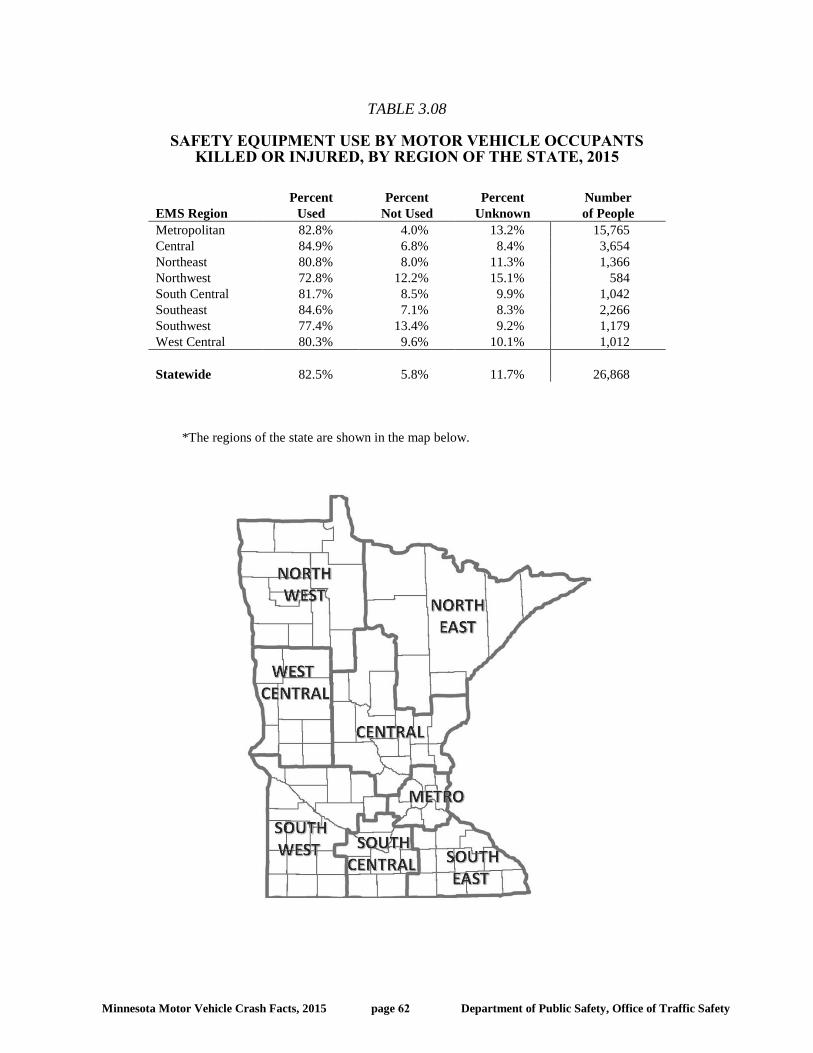
Minnesota Motor Vehicle Crash Facts, 2015 page 62 Department of Public Safety, Office of Traffic Safety
TABLE 3.08
SAFETY EQUIPMENT USE BY MOTOR VEHICLE OCCUPANTS KILLED OR INJURED, BY REGION OF THE STATE, 2015
EMS Region
Percent
Used
Percent
Not Used
Percent
Unknown
Number
of People
Metropolitan 82.8% 4.0% 13.2% 15,765
Central 84.9% 6.8% 8.4% 3,654
Northeast 80.8% 8.0% 11.3% 1,366
Northwest 72.8% 12.2% 15.1% 584
South Central 81.7% 8.5% 9.9% 1,042
Southeast 84.6% 7.1% 8.3% 2,266
Southwest 77.4% 13.4% 9.2% 1,179
West Central 80.3% 9.6% 10.1% 1,012
Statewide 82.5% 5.8% 11.7% 26,868
*The regions of the state are shown in the map below.

Minnesota Motor Vehicle Crash Facts, 2015 page 63 Department of Public Safety, Office of Traffic Safety
TABLE 3.09 AIRBAG DEPLOYMENTS, 2008 - 2015
Year Injury Severity
Airbag
Deployed
Belt Used
Airbag
Deployed
Belt Not Used
Deployment
Not Indicated
Belt Used
Deployment
Not Indicated
Belt Not Used
Belt Use
Unknown Total
2008
Killed 81 46 66 104 28 325
Severe Injury 278 113 290 216 207 1,104
Moderate Injury 1,851 297 3,128 718 879 6,873
Minor Injury 4,233 341 13,504 1,267 2,345 21,690
No Apparent Injury 7,594 323 102,417 3,345 36,239 149,918
Total 14,037 1,120 119,405 5,650 39,698 179,910
2009
Killed 73 57 55 75 42 302
Severe Injury 251 96 255 160 155 917
Moderate Injury 1,767 271 3,023 553 809 6,423
Minor Injury 4,076 272 12,702 1,045 2,111 20,206
No Apparent Injury 7,318 270 98,055 3,308 31,781 140,732
Total 13,485 966 114,090 5,141 34,898 168,580
2010
Killed 95 46 53 79 32 305
Severe Injury 248 76 240 152 121 837
Moderate Injury 1,807 176 3,096 492 624 6,195
Minor Injury 4,241 226 13,347 917 2,027 20,758
No Apparent Injury 7,620 210 101,735 3,055 30,979 143,599
Total 14,011 734 118,471 4,695 33,783 171,694
2011
Killed 83 51 43 69 25 271
Severe Injury 268 100 203 131 94 796
Moderate Injury 1,763 190 2,855 416 613 5,837
Minor Injury 4,332 234 12,978 799 1,915 20,258
No Apparent Injury 7,860 243 99,608 2,716 28,078 138,505
Total 14,306 818 115,687 4,131 30,725 165,667
2012
Killed 80 50 49 66 31 276
Severe Injury 297 91 202 132 141 863
Moderate Injury 1,869 201 2,581 364 592 5,607
Minor Injury 4,637 256 11,761 721 1,904 19,279
No Apparent Injury 8,093 229 94,519 2,390 27,092 132,323
Total 14,976 827 109,112 3,673 29,760 158,348
2013
Killed 92 39 53 55 30 269
Severe Injury 287 100 213 145 129 874
Moderate Injury 2,003 189 2,774 382 548 5,896
Minor Injury 4,988 228 12,680 624 2,072 20,592
No Apparent Injury 9,075 226 106,392 2,586 30,084 148,363
Total 16,445 782 122,112 3,792 32,863 175,994
2014
Killed 109 48 43 58 20 278
Severe Injury 261 77 190 83 131 742
Moderate Injury 1,958 161 2,575 298 558 5,550
Minor Injury 4,935 219 12,279 579 2,013 20,025
No Apparent Injury 9,351 263 108,546 2,507 30,738 151,405
Total 16,614 768 123,633 3,525 33,460 178,000
2015
Killed 106 47 47 44 41 285
Severe Injury 274 77 153 99 142 745
Moderate Injury 2,296 189 2,437 314 719 5,955
Minor Injury 5,298 218 11,566 573 2,228 19,883
No Apparent Injury 10,178 277 101,132 2,299 30,236 144,122
Total 18,152 808 115,335 3,329 33,366 170,990
Note: "Belt use" is used as a shorthand term for safety restraint use. Safety restraint devices are normally lap and shoulder
belts, but they can also be child safety seats or booster seats.

Minnesota Motor Vehicle Crash Facts, 2015 page 64 Department of Public Safety, Office of Traffic Safety
IV: MOTORCYCLE CRASHES
2015 motorcycle crash summary
In the past decade many older people have returned
to motorcycling. By the end of the calendar year
2015, the number of licensed motorcycle operators in
Minnesota had reached the highest level in history.
As a result, motorcyclist crash involvement remains
very worrisome to traffic safety officials. In 2015,
there were 1,352 crashes that involved at least one
motorcycle. This represents a 13% increase from the
previous year.
Motorcyclist fatalities in 2015 increased 33% from
2014 (from 46 to 61). Of the 61 killed, 52 were
drivers and 9 were passengers. Injuries to
motorcyclists increased 10% as well (from 1,117 to
1,232). Sixty-nine percent of all motorcyclists killed
or injured in 2015 were people aged 40 and over.
Alcohol use among drivers remains high
State law requires that drivers who die in traffic
crashes be tested for blood alcohol level. In 2015, 52
motorcycle drivers were killed and 47 of them were
tested. Twenty-two (47%) of the 47 drivers tested
positive for alcohol and 13 of the 47 (28%) tested at
.08% or greater.
Greater crash severity
When a motorcycle is involved in a traffic crash, the
chances for a fatality are greatly increased. In fact,
4.3 out of every 100 motorcycle crashes in 2015 was
a fatal crash. For all crashes in Minnesota, only 0.5
out of every 100 crashes is a fatal crash.
Helmet use
Currently, Minnesota does not have a mandatory
helmet use law for motorcyclists 18 or older. Laws
may be debated, but the benefits helmets offer are
clear; they protect the head in the event of a crash. In
2015, only seventeen (28%) of the 61 motorcycle
riders killed were known to be wearing a helmet. Of
the 1,232 motorcyclists injured, only 480 (39%) were
known to be wearing a helmet.
Operator training is essential
In addition to the newly endorsed younger drivers
each year, a large number of middle-aged people are
returning to motorcycling. Motorcycle and motorized
bicycle registrations have increased four percent
since 2010. The crash data indicates the importance
proper operator training. In 2015, one out of seven
motorcycle operators that were involved in a fatal
crash did not have a valid endorsement to drive a
motorcycle. These facts surely indicate that further
training is needed for a large segment of the
motorcycle driver population.
Males are most often victims
The motorcycle crash experience in Minnesota
remains largely a male one. In 2015, 53 of the 61
motorcyclists killed and 1,014 of the 1,232 injured
were male. Males account for 83% of all
motorcyclists killed or injured.
Contributing factors for motorcyclists
In 2015, two in five (39%) motorcycle crashes were
single-vehicle crashes. In these crashes, the factors
that reporting officers list most often are illegal or
unsafe speed (19%), chemical impairment (11%) and
driver inexperience (11%). In crashes that involve
another motor vehicle, the reporting officers list
driver inattention or distraction (22%) and following
too closely (21%) most often for the motorcyclists.
Contributing factors for the other drivers
In motorcycle crashes that involve another vehicle,
the reporting officers more often associate
contributing factors with the other driver than with
the motorcyclist. For the other drivers, failure to yield
right of way (42%) and driver inattention or
distraction (17%) are listed most frequently. This
demonstrates the need for programming to help
motor vehicle drivers and motorcyclists share the
road safely.

Minnesota Motor Vehicle Crash Facts, 2015 page 65 Department of Public Safety, Office of Traffic Safety
TABLE 4.01
MOTORCYCLE CRASH SUMMARY, 1981 - 2015
Motorcycle Crashes Killed Injured
Mcy
Deaths
per
10,000
Reg.
Mcy
Fatal Crash
Rate Per 100
Crashes
Year Fatal Injury PDO* Total Mcy Other Mcy Other
Licensed
Operators
Registered
Motorcycles
For
Mcy
For All
Crashes
1981 92 2,516 455 3,063 96 0 2,874 196 238,926 166,151 5.8 3.0 0.7
1982 72 2,115 331 2,518 70 6 2,381 189 264,134 159,345 4.4 2.9 0.6
1983 70 2,377 364 2,811 73 0 2,678 191 252,808 155,502 4.7 2.5 0.5
1984 59 2,302 407 2,768 62 1 2,590 207 256,836 153,851 4.0 2.2 0.5
1985 75 2,238 435 2,748 77 1 2,500 204 272,317 151,449 5.1 2.7 0.5
1986 63 1,891 364 2,318 66 0 2,152 142 282,087 141,261 4.7 2.7 0.5
1987 51 1,692 378 2,121 51 3 1,853 145 288,424 134,590 3.8 2.4 0.5
1988 57 1,628 284 1,969 58 4 1,817 126 293,347 128,956 4.5 2.9 0.5
1989 37 1,463 248 1,748 37 0 1,617 104 290,000 123,308 3.0 2.1 0.5
1990 46 1,446 243 1,735 50 2 1,605 126 292,074 120,081 4.2 2.7 0.5
1991 38 1,198 225 1,461 40 0 1,357 104 296,624 117,492 3.4 2.6 0.5
1992 29 1,133 199 1,361 28 3 1,288 60 290,722 116,124 2.4 2.1 0.5
1993 33 1,022 190 1,245 34 3 1,151 104 291,756 114,548 3.0 2.7 0.5
1994 41 1,151 189 1,381 43 0 1,324 66 293,164 113,337 3.8 3.0 0.6
1995 32 941 153 1,126 35 2 1,063 76 295,849 113,981 3.1 2.8 0.5
1996 39 934 158 1,131 42 0 1,046 71 297,102 112,551 3.7 3.4 0.5
1997 23 821 127 971 24 1 916 65 298,863 113,443 2.1 2.4 0.5
1998 41 883 141 1,065 40 1 987 69 301,992 118,275 3.4 3.8 0.6
1999 30 867 127 1,024 29 2 991 64 307,009 122,676 2.4 2.9 0.6
2000 34 935 166 1,135 35 1 1,039 45 311,825 132,352 2.6 3.0 0.5
2001 41 997 175 1,213 42 1 1,094 54 317,421 142,882 2.9 3.4 0.5
2002 47 943 178 1,168 47 0 1,071 46 327,604 149,360 3.1 4.0 0.6
2003 58 NA NA NA 62 1 NA NA 335,862 161,793 3.8 NA NA
2004 50 1,112 182 1,344 50 1 1,251 67 346,169 174,195 2.9 3.7 0.6
2005 61 1,201 169 1,431 59 4 1,319 72 353,460 185,087 3.2 4.3 0.6
2006 70 1,279 147 1,496 70 0 1,413 79 360,143 197,735 3.5 4.7 0.6
2007 60 1,368 195 1,623 61 0 1,498 67 369,623 209,591 2.9 3.7 0.6
2008 71 1,350 212 1,633 72 0 1,505 62 380,232 224,625 3.2 4.3 0.5
2009 47 1,089 193 1,329 53 0 1,200 53 387,159 226,675 2.3 3.5 0.5
2010 44 1,168 165 1,377 45 2 1,296 58 394,083 229,912 2.0 3.2 0.5
2011 43 1,130 136 1,309 42 2 1,248 45 398,092 232,274 1.8 3.3 0.5
2012 51 1,320 192 1,563 55 0 1,454 68 404,967 237,278 2.3 3.3 0.5
2013 59 1,047 160 1,266 60 2 1,143 52 409,943 235,909 2.5 4.7 0.5
2014 44 1,005 152 1,201 46 1 1,117 44 414,346 236,040 1.9 3.7 0.4
2015 58 1,103 191 1,352 61 1 1,232 81 414,782 238,243 2.6 4.3 0.5
Record
High*
112 2,728 537 3,308 121 9 3,359 207 414,782 238,243 7.7 4.7 0.8
(year) (1980) (1980) (1976) (1980) (1980) (1975) (1980) (1984) (2015) (2015) (1980) (2013) (1970)
* Notes: The abbreviation PDO stands for “property damage only” — a crash in which no one is killed or injured. The
abbreviation Mcy stands for “motorcyclists” or for “motorcycle.” The record high shown is for the period of time back to
year 1970. For registered classic motorcycles, see Table 3 on page 6.

Minnesota Motor Vehicle Crash Facts, 2015 page 66 Department of Public Safety, Office of Traffic Safety
TABLE 4.02
2015 MOTORCYCLE CRASHES BY FIRST HARMFUL EVENT
First Harmful Event
Fatal
Crashes
Injury
Crashes
Property
Damage
Crashes
Total
Crashes
Motor-
cyclists
Killed
Motor-
cyclists
Injured
Collision With:
Other Motor Vehicle 25 500 121 646 28 556
Parked Vehicle 0 14 28 42 0 12
Pedestrian 0 3 0 3 0 2
Bicyclist 1 1 0 2 0 0
Deer 6 65 9 80 6 78
Other Animal 0 15 0 15 0 18
Fixed Object 14 160 10 184 15 170
Non-Collision:
Overturn/Rollover 8 148 4 160 8 170
Fire/Explosion 0 1 0 1 0 1
Other / Unknown 4 196 19 219 4 225
Total 58 1,103 191 1,352 61 1,232
TABLE 4.03
2015 MOTORCYCLE CRASHES BY POPULATION OF AREA
Population of
City or
Township
Fatal
Crashes
Injury
Crashes
Property
Damage
Crashes
Total
Crashes
Motor-
cyclists
Killed
Motor-
cyclists
Injured
250,000 and Over 3 166 52 221 2 170
100,000 - 249,999 1 12 2 15 1 13
50,000 - 99,999 4 206 31 241 4 226
25,000 - 49,999 2 87 22 111 2 92
10,000 - 24,999 5 150 26 181 5 166
5,000 - 9,999 4 58 13 75 4 58
2,500 - 4,999 4 52 7 63 5 65
1,000 - 2,499 1 18 6 25 1 21
Under 1,000 34 354 32 420 37 421
Total 58 1,103 191 1,352 61
1,232

Minnesota Motor Vehicle Crash Facts, 2015 page 67 Department of Public Safety, Office of Traffic Safety
TABLE 4.04
2015 MOTORCYCLE CRASHES BY MONTH
Month
Fatal
Crashes
Injury
Crashes
Property
Damage
Crashes
Total
Crashes
Motor-
cyclists
Killed
Motor-
cyclists
Injured
January 0 1 2 3 0 1
February 0 0 2 2 0 0
March 1 26 5 32 1 28
April 5 92 18 115 6 100
May 11 131 27 169 12 138
June 15 187 30 232 15 215
July 6 209 31 246 7 235
August 6 168 37 211 6 187
September 6 175 20 201 6 203
October 7 88 13 108 7 97
November 1 25 4 30 1 27
December 0 1 2 3 0 1
Total 58 1,103 191 1,352 61 1,232
FIGURE 4.01
2015 MOTORCYCLE CRASHES BY TIME OF DAY
0
20
40
60
80
100
120
140
160
Mid
nig
ht
1:0
0
2:0
0
3:0
0
4:0
0
5:0
0
6:0
0
7:0
0
8:0
0
9:0
0
10
:00
11
:00
No
on
1:0
0
2:0
0
3:0
0
4:0
0
5:0
0
6:0
0
7:0
0
8:0
0
9:0
0
10
:00
11
:00
un
k
Nu
mb
er
Time of Day

Minnesota Motor Vehicle Crash Facts, 2015 page 68 Department of Public Safety, Office of Traffic Safety
TABLE 4.05
2015 MOTORCYCLE CRASHES BY TIME AND DAY
Hour Crashes Sunday Monday Tuesday Wednesday Thursday Friday Saturday
Beginning Total Fatal All Fatal All Fatal All Fatal All Fatal All Fatal All Fatal All Fatal
12 am 12 2 1 0 1 0 0 0 1 0 3 1 2 0 4 1
1:00 16 2 2 0 2 0 0 0 2 0 4 1 3 0 3 1
2:00 11 0 4 0 1 0 0 0 0 0 0 0 3 0 3 0
3:00 5 0 1 0 0 0 0 0 1 0 0 0 1 0 2 0
4:00 6 0 1 0 0 0 1 0 1 0 0 0 2 0 1 0
5:00 9 1 0 0 3 0 1 0 1 0 3 0 0 0 1 1
6:00 20 0 1 0 3 7 8 0 2 0 4 0 1 0 1 0
7:00 33 0 1 0 1 0 7 0 6 0 10 0 5 0 3 0
8:00 34 0 3 0 6 0 7 0 2 0 4 0 6 0 6 0
9:00 46 2 5 1 7 0 3 0 6 0 4 0 10 0 11 1
10:00 43 1 9 1 4 0 5 0 1 0 10 0 8 0 6 0
11:00 53 1 7 1 6 0 5 0 6 0 8 0 7 0 14 0
Noon 76 6 13 1 11 2 5 0 10 1 6 1 13 1 18 0
1:00 109 4 16 0 12 0 15 0 13 0 12 2 11 0 30 2
2:00 110 4 31 2 10 0 9 0 8 0 7 0 14 0 31 2
3:00 117 5 28 2 11 0 9 0 9 0 14 0 15 0 31 3
4:00 134 6 18 3 17 1 18 0 14 0 20 1 15 0 32 1
5:00 135 0 21 0 20 0 16 0 10 0 19 0 19 0 30 0
6:00 98 9 17 3 16 2 16 2 14 0 10 1 12 0 13 1
7:00 95 5 13 1 10 1 12 0 12 1 7 0 20 1 21 1
8:00 74 2 9 0 8 0 7 0 14 1 4 0 11 0 21 1
9:00 44 3 3 1 4 0 3 0 7 0 9 1 9 0 9 1
10:00 43 4 4 0 1 0 2 0 7 1 7 1 6 1 16 1
11:00 25 1 2 0 0 0 3 1 1 0 5 0 8 0 6 0
Unk 4 0 1 0 0 0 0 0 1 0 0 0 1 0 1 0
Total 1,352 58 211 16 154 6 152 3 149 4 170 9 202 3 314 17

Minnesota Motor Vehicle Crash Facts, 2015 page 69 Department of Public Safety, Office of Traffic Safety
TABLE 4.06
MOTORCYCLISTS KILLED OR INJURED BY AGE AND GENDER, 2015
Injured
Killed Severe Moderate Minor Total Injured
Age Group M F Total M F Total M F Total M F Total M F Total
00 - 04 0 0 0 0 0 0 0 0 0 0 0 0 0 0 0
05 - 09 0 0 0 0 0 0 0 0 0 0 1 1 0 1 1
10 - 14 0 0 0 0 0 0 4 0 4 0 0 0 4 0 4
15 - 19 0 0 0 3 1 4 21 2 23 15 0 15 39 3 42
20 - 24 5 0 5 15 1 16 64 9 73 43 3 46 122 13 135
25 - 29 4 0 4 11 3 14 61 13 74 47 8 55 119 24 143
30 - 34 4 1 5 21 1 22 37 12 49 44 8 52 102 21 123
35 - 39 4 1 5 8 1 9 41 11 52 16 3 19 65 15 80
40 - 44 4 1 5 14 7 21 35 16 51 29 7 36 78 30 108
45 - 49 5 2 7 17 6 23 43 16 59 34 4 38 94 26 120
50 - 54 9 0 9 19 8 27 56 14 70 39 12 51 114 34 148
55 - 59 7 2 9 30 5 35 57 10 67 29 14 43 116 29 145
60 - 64 5 0 5 21 3 24 43 8 51 21 1 22 85 12 97
65 - 69 4 1 5 7 0 7 23 4 27 14 1 15 44 5 49
70 & Older 2 0 2 2 0 2 15 3 18 9 1 10 26 4 30
Not Stated 0 0 0 0 1 1 1 0 1 5 0 5 6 1 7
Total 53 8 61 168 37 205 501 118 619 345 63 408 1,014 218 1,232
FIGURE 4.02
MOTORCYCLISTS KILLED OR INJURED BY AGE AND GENDER, 2015
0
20
40
60
80
100
120
140
0-4
5-9
10-1
4
15-1
9
20-2
4
25-2
9
30-3
4
35-3
9
40-4
4
45-4
9
50-5
4
55-5
9
60-6
4
65-6
9
70+
Unk
no
wn
Nu
mb
er
Age Group
Male
Female

Minnesota Motor Vehicle Crash Facts, 2015 page 70 Department of Public Safety, Office of Traffic Safety
TABLE 4.07 HELMET USE BY MOTORCYCLISTS KILLED OR INJURED, 2006 - 2015
Helmet Used Helmet Not Used Unknown Helmet Use Total
Year Number Percent Number Percent Number Percent Number Percent
Killed 2006 15 21.4% 53 75.7% 2 2.9% 70 100.0%
2007 11 18.0% 45 73.8% 5 8.2% 61 100.0%
2008 12 16.7% 53 73.6% 7 9.7% 72 100.0%
2009 11 20.8% 37 69.8% 5 9.4% 53 100.0%
2010 12 26.7% 26 57.8% 7 15.6% 45 100.0%
2011 13 31.0% 23 54.8% 6 14.3% 42 100.0%
2012 11 20.0% 38 69.1% 6 10.9% 55 100.0%
2013 14 23.3% 34 56.7% 12 20.0% 60 100.0%
2014 9 19.6% 28 60.9% 9 19.6% 46 100.0%
2015 17 27.9% 37 60.7% 7 11.5% 61 100.0%
Helmet Used Helmet Not Used Unknown Helmet Use Total
Year Number Percent Number Percent Number Percent Number Percent
Injured 2006 481 34.0% 544 38.5% 388 27.5% 1,413 100.0%
2007 554 37.0% 520 34.7% 424 28.3% 1,498 100.0%
2008 539 35.8% 569 37.8% 397 26.4% 1,505 100.0%
2009 452 37.7% 432 36.0% 316 26.3% 1,200 100.0%
2010 483 37.3% 468 36.1% 345 26.6% 1,296 100.0%
2011 488 39.1% 447 35.8% 313 25.1% 1,248 100.0%
2012 523 36.0% 549 37.8% 382 26.3% 1,454 100.0%
2013 389 34.0% 424 37.1% 330 28.9% 1,143 100.0%
2014 423 37.9% 369 33.0% 325 29.1% 1,117 100.0%
2015 480 39.0% 417 33.9% 335 27.2% 1,232 100.0%
TABLE 4.08 ENDORSEMENT STATUS OF MOTORCYCLE OPERATORS
INVOLVED IN FATAL CRASHES, 2006 - 2015
Valid Endorsement Permit Only
Canceled,
Suspended, Revoked No Endorsement* Total** for Year
Year Number Percent Number Percent Number Percent Number Percent Number Percent
2006 59 83.1% 1 1.4% 3 4.2% 4 5.6% 71 100.0%
2007 49 81.7% 0 0.0% 4 6.7% 5 8.3% 60 100.0%
2008 57 79.2% 0 0.0% 5 6.9% 8 11.1% 72 100.0%
2009 39 29.6% 0 0.0% 1 2.0% 8 16.3% 49 100.0%
2010 38 77.6% 0 0.0% 5 10.2% 5 10.2% 49 100.0%
2011 38 84.4% 0 0.0% 3 6.7% 4 8.9% 45 100.0%
2012 41 78.8% 0 0.0% 0 0.0% 10 19.2% 52 100.0%
2013 41 69.5% 0 0.0% 0 0.0% 10 16.9% 59 100.0%
2014 37 77.1% 2 4.2% 1 2.1% 5 10.4% 45 100.0%
2015 47 75.8% 5 8.1% 3 4.8% 6 14.5% 62 100.0%
* A valid endorsement means that the driver's license has been "endorsed" to permit operation of a motorcycle. ** Rows may not add to total due to the unknown status of some motorcycle operators. In addition, totals can include non-motorcyclists killed in motorcycle-related crashes.

Minnesota Motor Vehicle Crash Facts, 2015 page 71 Department of Public Safety, Office of Traffic Safety
TABLE 4.09
ALCOHOL USE BY KILLED MOTORCYCLE DRIVERS, 2006 - 2015
Alcohol Concentration
Year Killed Tested (.00) (.01 - .07) (.08 - .09) (.10 or more)
2006 66 61 42 (69%) 1 (2%) 1 (2%) 17 (28%)
2007 58 52 34 (65%) 3 (6%) 1 (2%) 14 (27%)
2008 65 59 31 (53%) 3 (5%) 2 (3%) 23 (39%)
2009 45 42 25 (60%) 6 (14%) 2 (5%) 9 (21%)
2010 42 40 25 (63%) 1 (2%) 1 (2%) 13 (32%)
2011 34 29 21 (72%) 2 (7%) 1 (3%) 5 (17%)
2012 47 38 26 (68%) 2 (5%) 1 (3%) 9 (24%)
2013 53 43 27 (63%) 2 (5%) 2 (5%) 12 (28%)
2014 41 35 25 (71%) 3 (9%) 0 (0%) 7 (20%)
2015 61 47 25 (53%) 9 (19%) 0 (0%) 13 (28%)
Percentages are based on those motorcycle drivers tested.
TABLE 4.10
2015 MOTORCYCLE DRIVER FATALITIES' LEVEL OF ALCOHOL CONCENTRATION BY AGE
Alcohol Concentration
Age Killed Tested .01-.07 .08-.09 .10+ .00
.01-
.04
.05-
.09
.10-
.14
.15-
.19
.20-
.24
.25
and
Over
14 & Younger 0 0 0 0 0 0 0 0 0 0 0 0
15 0 0 0 0 0 0 0 0 0 0 0 0
16 0 0 0 0 0 0 0 0 0 0 0 0
17 0 0 0 0 0 0 0 0 0 0 0 0
18 0 0 0 0 0 0 0 0 0 0 0 0
19 0 0 0 0 0 0 0 0 0 0 0 0
20 1 1 0 0 0 1 0 0 0 0 0 0
Under 21 1 1 0 0 0 1 0 0 0 0 0 0
14 & Younger 0 0 0 0 0 0 0 0 0 0 0 0
15 - 19 0 0 0 0 0 0 0 0 0 0 0 0
20 - 24 5 5 0 0 2 3 0 0 0 0 1 1
25 - 29 4 4 1 0 1 2 1 0 0 0 1 0
30 - 34 4 3 0 0 0 3 0 0 0 0 0 0
35 - 39 4 4 0 0 3 1 0 0 1 2 0 0
40 - 44 3 3 1 0 1 1 1 0 0 1 0 0
45 - 49 5 4 1 0 3 0 1 0 1 1 1 0
50 - 54 9 8 2 0 3 3 2 0 1 1 1 0
55 - 59 7 7 1 0 0 6 1 0 0 0 0 0
60 & Older 11 9 3 0 0 6 2 1 0 0 0 0
Total 52 47 9 0 13 25 8 1 3 5 4 1

Minnesota Motor Vehicle Crash Facts, 2015 page 72 Department of Public Safety, Office of Traffic Safety
TABLE 4.11
CONTRIBUTING FACTORS IN 2015 MOTORCYCLE CRASHES
Single Vehicle Crashes Multi-Vehicle Crashes
Attributed to
Motorcycle Drivers
Attributed to
Motorcycle Drivers
Attributed to
Other Drivers
Contributing Factors Number Percent Number Percent Number Percent
Human Factors:
Illegal/Unsafe Speed 121 19.1% 37 10.0% 8 1.6%
Chemical Impairment 70 11.0% 6 1.6% 8 1.6%
Driver Inexperience 69 10.9% 9 2.4% 3 0.6%
Driver Inattention or Distraction 48 7.6% 82 22.2% 86 17.3%
Overcorrecting 43 6.8% 0 0.0% 2 0.4%
Improper/Unsafe Lane Use 19 3.0% 19 5.1% 27 5.4%
Following Too Closely 15 2.4% 76 20.5% 38 7.6%
Improper Turn 8 1.3% 5 1.4% 22 4.4%
Improper Passing/Overtaking 7 1.1% 21 5.7% 4 0.8%
Improper Park/Stop/Start 4 0.6% 1 0.3% 10 2.0%
Failure to Yield Right of Way 3 0.5% 39 10.5% 209 42.1%
Driving Left of Center (no passing) 3 0.5% 4 1.1% 6 1.2%
Disregard for Traffic Control Device 2 0.3% 14 3.8% 15 3.0%
Non-Motorist Error 2 0.3% 0 0.0% 0 0.0%
Vison Obscured-Sunlight 2 0.3% 0 0.0% 10 2.0%
Impeding Traffic 1 0.2% 2 0.5% 3 0.6%
Driver on Phone/CB/Radio 1 0.2% 0 0.0% 3 0.6%
Other Vision Related Factor 1 0.2% 3 0.8% 9 1.8%
Unsafe Backing 0 0.0% 0 0.0% 6 1.2%
Improper/No Signal 0 0.0% 0 0.0% 4 0.8%
Vision Obscured-Windshield 0 0.0% 1 0.3% 1 0.2%
Other Human Factor 30 4.7% 12 3.2% 8 1.6%
Vehicular Factors:
Skidding 56 8.8% 11 3.0% 1 0.2%
Defective/Failed Tire 7 1.1% 1 0.3% 0 0.0%
Defective Brakes 5 0.8% 1 0.3% 0 0.0%
Defective Lights 0 0.0% 1 0.3% 0 0.0%
Other Vehicular Factor 16 2.5% 2 0.5% 0 0.0%
Miscellaneous Factors:
Weather 13 2.0% 2 0.5% 0 0.0%
Other Factor 89 14.0% 21 5.7% 14 2.8%
Total 635 100.0% 370 100.0% 497 100.0%
Vehicles for Which There Was
“No Clear Cont. Factor” 202
362
254
Total Number of Drivers 713
679
649
Zero, one, or two contributing factors may be attributed to a single driver. This may cause the sum of the factors cited to differ from the
number of drivers. Percentages are based on all contributing factors cited. They may not sum to 100 due to rounding.

Minnesota Motor Vehicle Crash Facts, 2015 page 73 Department of Public Safety, Office of Traffic Safety
V. TRUCK CRASHES
This section summarizes data on crashes involving
trucks, also known as commercial motor vehicles
(CMVs). On the crash report form, commercial motor
vehicles are identified as any of the following eight
types of trucks: (1) two-axle, six-tire single unit
truck or stepvan, (2) three-or-more-axle single unit
truck, (3) single-unit truck with trailer, (4) truck
tractor with no trailer, (5) truck tractor with semi-
trailer, (6) truck tractor with double trailers, (7) truck
tractor with triple trailers, (8) heavy truck of other or
unknown type. A crash involving any of these
vehicles is classified as a truck crash. Pickup trucks
and vans are not counted as trucks in this section.
Truck crashes decrease
In 2015, there were 4,226 truck-involved traffic
crashes reported to the Department of Public Safety.
This represents a 16% decrease from the previous
year. There were 57 fatal truck crashes, killing a total
of 62 people. In addition, there were 1,316 people
injured in truck-related crashes.
Fatalities and injuries are mostly in other vehicles
In two-vehicle collisions, heavier vehicles have the
clear safety advantage. Only 4 of the 62 people killed
in truck-involved crashes were in trucks. The other
58 deaths included two pedestrians, one motorcyclist,
one bicyclist and 54 persons in cars, SUVs, pickups,
or vans. Of the 1,316 people injured, only 266 (20%)
were truck occupants.
Contributing factors in truck crashes
Table 5.03 in this Section reveals that contributing
factors listed by officers are very similar for truck
and non-truck drivers. For example, driver inattention
or distraction was most frequently cited for truck
drivers (18% of the time) as well as for non-truck
drivers (17% of the time). However, non-truck
drivers drive too fast and fail to yield more often than
truck drivers. Illegal or unsafe speed was reported for
10% of the other vehicles but only 8% of the trucks.
And, failure to yield was reported for 15% of the
other vehicles but only 10% of the trucks. For the
other motorists and even more so for the truck
drivers, it is quite rare that officers report the
presence of any type of chemical impairment such as
the use of alcohol or drugs. Less than one quarter of a
percent of the truckers and 1.6% of the drivers of
other vehicles were reported as having some such
impairment.
Truck crashes are workday occurrences
Truck crashes are strongly tied to the workday. In
2015, only 364 (9%) of truck crashes occurred on
either a Saturday or Sunday. And, Figure 5.01 in this
Section reveals that a vast majority of truck crashes
occur during daytime work hours.
Driving conditions
Driving conditions can vary from day to day in
Minnesota, but most truck crashes occurred on dry
roads in clear weather. However, 21% of the fatal
crashes and 27% of the injury crashes occurred on
road surfaces reported to be wet, or to be covered
with snow or slush, or with ice or packed snow.
Crash severity increases in rural areas For this report, “rural” is defined as an area that has a
population of less than 5,000. Probably because high
speeds are more often possible in the rural open
countryside, crashes there are more severe. Ninety
percent of fatal and 44% of truck-related injury
crashes occurred in the rural areas of Minnesota.

Minnesota Motor Vehicle Crash Facts, 2015 page 74 Department of Public Safety, Office of Traffic Safety
TABLE 5.01
TRUCK CRASH SUMMARY, 2006 - 2015
2006 2007 2008 2009 2010 2011 2012 2013 2014 2015
Total Crashes 4,558 4,631 4,344 3,653 4,181 4,025 3,789 4,741 5,023 4,226
Fatal Crashes 62 71 64 47 77 48 50 62 57 57
Persons Killed 65 90 74 58 93 51 56 67 63 62
Injury Crashes 1,156 1,144 1,056 889 1,005 916 870 1,042 1,047 982
Severe 89 83 72 68 71 59 70 55 61 58
Moderate 323 334 295 288 270 265 273 315 321 307
Minor 744 727 689 533 664 592 527 672 665 617
Persons Injured 1,544 1,745 1,425 1,162 1,385 1,219 1,178 1,425 1,387 1,316
Severe 104 130 89 88 90 70 86 80 76 75
Moderate 415 508 388 359 358 323 355 419 409 379
Minor 1,025 1,107 948 715 937 826 737 926 902 862
PDO Crashes 3,340 3,416 3,224 2,717 3,099 3,061 2,869 3,637 3,919 3,187
TABLE 5.02
PERSONS KILLED OR INJURED IN 2015 TRUCK CRASHES BY VEHICLE OCCUPIED
Vehicle Type Killed
Severely
Injured
Moderately
Injured
Minor
Injuries
Total
Injured
Automobile 35 23 153 376 552 Pickup Truck 13 9 41 65 115 SUV 4 14 56 141 211 Van 2 12 18 65 95 Pedestrian 2 3 1 3 7 Bicycle 1 1 4 2 7 Motorcycle 1 2 1 4 7 Motorscooter/Motorbike 0 0 1 1 2 Snowmobile 0 1 0 0 1 Ambulance 0 0 1 8 9 Police/Fire Vehicle 0 0 1 1 2 Roadway Maintenance Vehicle 0 0 4 13 17 Other Public Owned Vehicle 0 1 1 5 7 Farm Equipment 0 0 1 0 1 Taxicab 0 0 0 4 4 School Bus 0 0 0 7 7 Bus-Non School 0 0 0 2 2 Hit and Run 0 0 0 2 2 Two-Axle, Six-Tire, Single Unit Truck 1 3 16 31 50 Three or More Axle Single Unit Truck 1 2 18 17 37 Single Unit Truck with Trailer 0 0 4 11 15 Truck Tractor with No Trailer 0 0 2 4 6 Truck Tractor with Semi Trailer 2 4 52 91 147 Heavy Truck—Other or Unknown Type 0 0 3 8 11 Other or Unknown Vehicle Type 0 0 1 1 2
Total 62 75 379 862 1,316

Minnesota Motor Vehicle Crash Facts, 2015 page 75 Department of Public Safety, Office of Traffic Safety
TABLE 5.03
CONTRIBUTING FACTORS IN 2015 TRUCK CRASHES
Attributed to Truck
Vehicles
Attributed to Non-Truck
Vehicles
Contributing Factors Number Percent Number Percent
Human Factors
Driver Inattention or Distraction 517 17.7% 442 17.1%
Improper/Unsafe Lane Use 339 11.6% 297 11.5%
Failure to Yield Right of Way 301 10.3% 396 15.3%
Following Too Closely 236 8.1% 202 7.8%
Illegal/Unsafe Speed 235 8.0% 258 10.0%
Improper Turn 177 6.0% 43 1.7%
Unsafe Backing 137 4.7% 19 0.7%
Disregarding Traffic Control Device 62 2.1% 70 2.7%
Overcorrecting 52 1.8% 35 1.4%
Improper Passing or Overtaking 49 1.7% 123 4.7%
Vision Obscured-Windshield 43 1.5% 38 1.5%
Driver Inexperience 37 1.3% 49 1.9%
Improper Parking, Starting, or Stopping 29 1.0% 21 0.8%
Driving Left of Center (no passing) 22 0.8% 49 1.9%
Improper/No Signal 11 0.4% 7 0.3%
Impeding Traffic 9 0.3% 16 0.6%
Chemical Impairment 6 0.2% 42 1.6%
Driver on Phone/CB/Radio 3 0.1% 1 0.0%
Failure to Use Lights 1 0.0% 1 0.0%
Non-Motorist Error 0 0.0% 5 0.2%
Other Human Factors 107 3.7% 75 2.9%
Vehicular Factors
Skidding 66 2.3% 91 3.5%
Defective Brakes 54 1.8% 18 0.7%
Oversize/Overweight Vehicle 45 1.5% 1 0.0%
Other Vehicular Factor 66 2.3% 15 0.6%
Miscellaneous Factors
Weather 152 5.2% 168 6.5%
Other 171 5.8% 110 4.2%
Total Contributing Factors Cited 2,927 100.0% 2,592 100.0%
Vehicles for Which There Was
"No Clear Contributing Factor" 1,924 1,766
Total Number of Vehicles 4,421 3,836
Zero, one, or two contributing factors may be associated with each vehicle. This may result in the
sum of the factors cited to differ from the number of vehicles. Percentages are based on all
contributing factors cited. They may not sum to 100 due to rounding. Bicyclists and pedestrians are
included in the "non-truck vehicles" columns in this table.

Minnesota Motor Vehicle Crash Facts, 2015 page 76 Department of Public Safety, Office of Traffic Safety
TABLE 5.04
AGE OF TRUCK DRIVERS IN 2015 CRASHES
Driver Age
Truck or
Truck
Tractor
Truck
with Semi-
Trailer
Truck
with Twin
Trailer
Truck
with
Other
Trailer Total
14 & younger 0 0 0 0 0
15 - 19 18 5 0 6 29
20 - 24 128 97 0 20 245
25 - 29 188 167 2 29 386
30 - 34 197 181 3 38 419
35 - 39 186 209 1 37 433
40 - 44 185 234 3 33 455
45 - 49 179 237 5 36 457
50 - 54 220 333 5 41 599
55 - 59 216 308 2 33 559
60 - 64 114 195 6 27 342
65 & Older 77 143 1 19 240
Not Stated 48 81 0 12 141
Total* 1,756 2,190 28 331 4,305
* There were 4,421 trucks involved in 2015 crashes. Table 5.04 tabulates the ages of drivers for the 4,305
trucks where it was possible to identify a driver.
TABLE 5.05
DRIVERS IN 2015 TRUCK CRASHES BY PHYSICAL CONDITION*
Truck Drivers Other Drivers
Physical Condition Number Percent Number Percent
Normal 4,014 93.2% 3,338 92.3%
Under the Influence 5 0.1% 37 1.0%
Had Been Drinking 3 0.1% 11 0.3%
Had Been Using Drugs 3 0.1% 6 0.2%
Aggressive 0 0.0% 1 0.0%
Fatigued/Asleep 8 0.2% 16 0.4%
Physical Disability 3 0.1% 2 0.1%
Ill 5 0.1% 3 0.1%
Other 6 0.1% 15 0.4%
Unknown 258 6.0% 189 5.0%
Total ** 4,305 100.0% 3,618 100.0%
* As noted by police officer on accident report.
** There were 4,421 trucks involved in 2015 crashes. This table tabulates the apparent
physical condition of drivers for the 4,305 trucks where it was possible to identify a driver.
Similarly, there were 3,836 non-truck motor vehicles involved in 2015 truck crashes. The
condition of the identifiable 3,618 non-truck drivers is presented here.

Minnesota Motor Vehicle Crash Facts, 2015 page 77 Department of Public Safety, Office of Traffic Safety
TABLE 5.06
2015 TRUCK CRASHES BY FIRST HARMFUL EVENT
First Harmful Event
Fatal
Crashes
Injury
Crashes
Property
Damage
Crashes
Total
Crashes Killed Injured
Collision With:
Other Motor Vehicle 48 776 2,355 3,179 52 1,088
Parked Motor Vehicle 0 29 227 256 0 44
Train 0 3 7 10 0 3
Bicycle 1 7 0 8 1 7
Pedestrian 2 7 0 9 2 8
Deer 0 0 8 8 0 0
Other Animal 0 3 8 11 0 3
Fixed Object 2 58 373 433 2 60
Non-Collision:
Overturn 2 78 89 169 2 80
Fire or Explosion 0 0 2 2 0 0
Jackknife 0 2 45 47 0 2
Other Non-Collision 0 6 15 21 0 6
Other/Unknown 2 13 58 73 3 15
Total 57 982 3,187 4,226 62 1,316
TABLE 5.07
2015 TRUCK CRASHES BY MONTH
Month
Fatal
Crashes
Injury
Crashes
Property
Damage
Crashes
Total
Crashes Killed Injured
January 4 94 308 406 4 132
February 3 72 262 337 4 85
March 7 63 212 282 9 97
April 6 54 183 243 6 71
May 4 64 215 283 4 86
June 4 107 296 407 4 144
July 4 90 271 365 4 130
August 3 102 289 394 3 132
September 5 84 274 363 6 112
October 7 94 318 419 8 123
November 5 67 277 349 5 86
December 5 91 282 378 5 118
Total 57 982 3,187 4,226 62 1,316

Minnesota Motor Vehicle Crash Facts, 2015 page 78 Department of Public Safety, Office of Traffic Safety
TABLE 5.08
2015 TRUCK CRASHES BY TIME AND DAY
Time of Day Sunday Monday Tuesday Wednesday Thursday Friday Saturday Total
Midnight - 2:59 AM 5 4 25 15 14 12 10 85
3:00 - 5:59 AM 4 20 19 20 26 24 15 128
6:00 - 8:59 AM 10 151 182 137 119 129 42 770
9:00 - 11:59 AM 22 179 206 181 152 145 68 953
Noon - 2:59 PM 17 197 187 171 195 171 47 985
3:00 - 5:59 PM 35 155 182 158 156 141 29 856
6:00 - 8:59 PM 25 49 61 47 48 57 15 302
9:00 - 11:59 PM 8 20 26 28 29 19 12 142
Unknown 0 1 1 2 0 1 0 5
Total 126 776 889 759 739 699 238 4,226
FIGURE 5.01
2015 TRUCK CRASHES BY TIME OF DAY
0
50
100
150
200
250
300
350
400
450
500
Mid
nig
ht
1:0
0
2:0
0
3:0
0
4:0
0
5:0
0
6:0
0
7:0
0
8:0
0
9:0
0
10
:00
11
:00
Noo
n
1:0
0
2:0
0
3:0
0
4:0
0
5:0
0
6:0
0
7:0
0
8:0
0
9:0
0
10
:00
11
:00
Unk
now
n
Nu
mb
er
Time of Day

Minnesota Motor Vehicle Crash Facts, 2015 page 79 Department of Public Safety, Office of Traffic Safety
TABLE 5.09
2015 TRUCK CRASHES BY ROAD SURFACE CONDITION
Road Surface Condition
Fatal
Crashes
Injury
Crashes
Property
Damage
Crashes
Total
Crashes Killed Injured
Dry 45 710 2,241 2,996 50 954
Wet 5 117 391 513 5 161
Snow 1 54 224 279 1 73
Slush 1 10 29 40 1 15
Ice or Packed Snow 5 84 278 367 5 106
Muddy 0 5 1 6 0 5
Debris 0 0 1 1 0 0
Other 0 2 11 13 0 2
Unknown 0 0 11 11 0 0
Total 57 982 3,187 4,226 62 1,316
TABLE 5.10
2015 TRUCK CRASHES BY WEATHER CONDITION
Weather Condition Fatal
Crashes
Injury
Crashes
Property
Damage
Crashes
Total
Crashes Killed Injured
Clear 32 595 1,880 2,507 36 801
Cloudy 19 217 729 965 20 283
Rain 2 56 195 253 2 74
Snow 3 77 265 345 3 109
Sleet/Hail/Freezing Rain 0 15 38 53 0 16
Fog/Smog/Smoke 0 3 8 11 0 4
Blowing Sand/Dust/Snow 0 10 46 56 0 16
Severe Cross Winds 0 6 6 12 0 8
Other 1 2 7 10 1 4
Unknown 0 1 13 14 0 1
Total 57 982 3,187 4,226 62 1,316

Minnesota Motor Vehicle Crash Facts, 2015 page 80 Department of Public Safety, Office of Traffic Safety
TABLE 5.11
2015 TRUCK CRASHES BY POPULATION OF AREA
Population of City
or Township
Fatal
Crashes
Injury
Crashes
Property
Damage
Crashes
Total
Crashes Killed Injured
250,000 & Over 1 132 652 785 1 173
100,000 - 249,999 0 19 43 62 0 23
50,000 - 99,999 0 143 546 689 0 188
25,000 - 49,999 1 83 328 412 1 112
10,000 - 24,999 2 124 453 579 2 159
5,000 - 9,999 2 47 185 234 2 73
2,500 - 4,999 2 26 132 160 2 34
1,000 - 2,499 1 29 63 93 1 32
Under 1,000 48 379 785 1,212 53 522
Total 57 982 3,187 4,226 62 1,316
TABLE 5.12
2015 TRUCK CRASHES BY TYPE OF ROADWAY
Roadway Type
Fatal
Crashes
Injury
Crashes
Property
Damage
Crashes
Total
Crashes Killed Injured
Interstate Highway 4 240 882 1,126 4 311
US Trunk Highway 14 183 430 627 15 246
State Trunk Highway 24 192 504 720 27 276
County State-Aid Highway 14 200 563 777 15 264
County Road 0 16 29 45 0 19
Township Road 1 33 43 77 1 42
Local Street 0 118 708 826 0 158
Other Road 0 0 28 28 0 0
Total 57 982 3,187 4,226 62 1,316

Minnesota Motor Vehicle Crash Facts, 2015 page 81 Department of Public Safety, Office of Traffic Safety
VI: PEDESTRIAN CRASHES
This section deals with motor vehicle crashes that
injure or kill pedestrians. Prior to 1984, a crash
was defined as a pedestrian crash only if the
pedestrian was the first "object" struck by a motor
vehicle. Since 1984, a pedestrian crash is defined
as any crash where a pedestrian is struck and
injured or killed.
Overall, pedestrian crashes increase
In 2015, there were 911 crashes in which at least
one pedestrian was injured or killed by a motor
vehicle. This represents an 11 percent increase
from the previous year. Pedestrian crashes were at
their highest level since 2008.
Deaths and injuries increase
In 2015, 41 pedestrians were killed, 24 more than
in 2014. In addition, 904 pedestrians were injured,
an 8 percent increase from the previous year.
Nearly five percent of all pedestrian crashes
resulted in a death, compared to one-half of 1% of
all traffic crashes resulting in a death.
Males at greater risk
In 2015, persons less than 25 years of age
accounted for 15% of the pedestrians killed and
35% of pedestrians injured. Male pedestrians were
more likely than females to be killed or injured:
males accounted for 68% of all pedestrian
fatalities and 53% of all pedestrian injuries.
Urban/rural areas and time of day
In 2015, 92% of pedestrian crashes occurred in
urban areas (defined as areas with populations
over 5,000). About one-third (33%) of pedestrian
crashes occurred during the weekday rush hour
driving time periods - the rush hour driving time
period is defined as Monday through Friday 6:00-
9:00 a.m. and 3:00-6:00 p.m. One out of every
four (24%) pedestrian fatal crashes occurred
during the late night hours 9:00 p.m.-3:00 a.m.
Prior actions of vehicles
Nearly half (48%) of all motor vehicles involved
in pedestrian injury crashes and four in five (79%)
involved in fatal pedestrian crashes in 2015 were
going straight ahead on the roadway prior to the
crash. One-third (31%) of all motor vehicles
involved in pedestrian crashes were making a right
or left turn.
Prior actions of pedestrians
Thirty-two percent of pedestrians killed and 26%
of pedestrians injured were trying to cross a road
at an area with no crosswalk and no signal.
However, only 13% of pedestrians injured were
crossing the road at a signaled intersection and
were crossing with the signal.
Contributing factors
For 38% of all motor vehicle drivers and 16% of
pedestrians in all pedestrian crashes, the reporting
officer indicated that driver failure to yield right of
way was a contributing factor. The second most
cited contributing factor for motor vehicle drivers
was driver inattention or distraction (21%).
Obscured vision was a factor for motor vehicle
drivers in 9% of all pedestrian crashes.
Drinking pedestrian fatalities
Of the 41 pedestrians killed, 30 were tested for the
presence of alcohol in their blood system. Of those
tested, one third (10) tested positive for alcohol.
All ten of these killed pedestrians had BACs of .10
or higher.
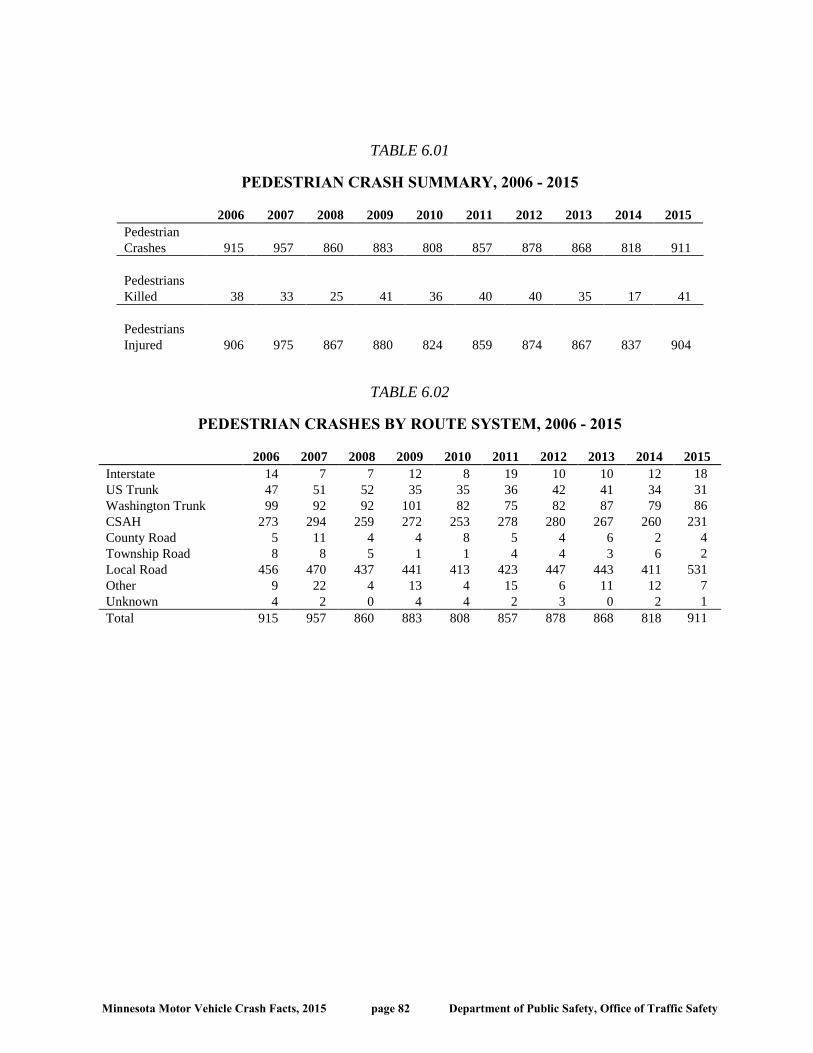
Minnesota Motor Vehicle Crash Facts, 2015 page 82 Department of Public Safety, Office of Traffic Safety
TABLE 6.01
PEDESTRIAN CRASH SUMMARY, 2006 - 2015
2006 2007 2008 2009 2010 2011 2012 2013 2014 2015
Pedestrian
Crashes 915 957 860 883 808 857 878 868 818 911
Pedestrians
Killed 38 33 25 41 36 40 40 35 17 41
Pedestrians
Injured 906 975 867 880 824 859 874 867 837 904
TABLE 6.02
PEDESTRIAN CRASHES BY ROUTE SYSTEM, 2006 - 2015
2006 2007 2008 2009 2010 2011 2012 2013 2014 2015
Interstate 14 7 7 12 8 19 10 10 12 18
US Trunk 47 51 52 35 35 36 42 41 34 31
Washington Trunk 99 92 92 101 82 75 82 87 79 86
CSAH 273 294 259 272 253 278 280 267 260 231
County Road 5 11 4 4 8 5 4 6 2 4
Township Road 8 8 5 1 1 4 4 3 6 2
Local Road 456 470 437 441 413 423 447 443 411 531
Other 9 22 4 13 4 15 6 11 12 7
Unknown 4 2 0 4 4 2 3 0 2 1
Total 915 957 860 883 808 857 878 868 818 911

Minnesota Motor Vehicle Crash Facts, 2015 page 83 Department of Public Safety, Office of Traffic Safety
TABLE 6.03
PEDESTRIANS KILLED OR INJURED BY AGE AND GENDER, 2015
Killed Severe Injuries Moderate Injuries Minor Injuries Total Injuries
Age Group M F Total M F Total M F Total M F Total M F Total*
00 - 04 0 1 1 2 2 4 2 3 5 4 10 14 8 15 23
05 - 09 2 0 2 6 0 6 13 7 20 15 10 25 34 17 51
10 - 14 0 0 0 2 4 6 10 10 20 19 14 33 31 28 59
15 - 19 1 0 1 7 7 14 16 7 23 30 25 55 53 39 92
20 - 24 1 1 2 10 1 11 17 13 30 25 25 50 52 39 91
25 - 29 3 1 4 6 3 9 12 11 23 19 19 38 37 33 70
30 - 34 1 0 1 2 3 5 9 18 27 21 26 47 32 47 79
35 - 39 3 2 5 2 0 2 9 8 17 20 17 37 31 25 56
40 - 44 2 0 2 5 3 8 7 7 14 11 13 24 23 23 46
45 - 49 2 1 3 6 3 9 13 9 22 11 16 27 30 28 58
50 - 54 1 1 2 6 4 10 15 15 30 18 9 27 39 28 67
55 - 59 4 0 4 1 3 4 14 9 23 21 10 31 36 22 58
60 - 64 2 2 4 2 4 6 5 6 11 11 10 21 18 20 38
65 - 69 0 3 3 1 3 4 5 9 14 11 5 16 17 17 34
70 - 74 1 1 2 1 2 3 6 3 9 4 3 7 11 8 19
75 - 79 4 0 4 2 1 3 6 2 8 2 3 5 10 6 16
80 - 84 0 0 0 2 3 5 1 2 3 2 4 6 5 9 14
85 & Older 1 0 1 1 1 2 2 1 3 0 0 0 3 2 5
Not Stated 0 0 0 1 1 2 3 3 10 2 5 16 6 9 28
Total 28 13 41 65 48 113 165 143 312 246 224 479 476 415 904
* Within column categories, where rows do not add across, gender was not stated on crash report.

Minnesota Motor Vehicle Crash Facts, 2015 page 84 Department of Public Safety, Office of Traffic Safety
FIGURE 6.01
PEDESTRIAN FATALITIES BY AGE GROUP, 2006 - 2015 COMBINED
FIGURE 6.02
PEDESTRIANS KILLED OR INJURED BY AGE AND GENDER, 2015
0
0.5
1
1.5
2
2.5
3
3.5
4
4.5
0-4
5-9
10-1
4
15-1
9
20-2
4
25-2
9
30-3
4
35-3
9
40-4
4
45-4
9
50-5
4
55-5
9
60-6
4
65-6
9
70-7
4
75-7
9
80-8
4
85+
Unk
no
wn
Nu
mb
er
Age Group
Male
Female
0
10
20
30
40
50
60
0-4
5-9
10-1
4
15-1
9
20-2
4
25-2
9
30-3
4
35-3
9
40-4
4
45-4
9
50-5
4
55-5
9
60-6
4
65-6
9
70-7
4
75-7
9
80-8
4
85+
Unk
no
wn
Nu
mb
er
Age Group

Minnesota Motor Vehicle Crash Facts, 2015 page 85 Department of Public Safety, Office of Traffic Safety
TABLE 6.04
2015 PEDESTRIAN CRASHES BY MONTH
Month
Fatal
Crashes
Injury
Crashes
Total
Crashes Killed Injured
January 4 68 72 4 72
February 1 52 53 1 55
March 3 73 76 3 75
April 2 66 68 2 68
May 1 63 64 1 70
June 3 55 58 3 54
July 3 67 70 3 71
August 1 59 60 1 61
September 6 82 88 6 84
October 7 108 115 7 113
November 5 88 93 5 90
December 5 89 94 5 91
Total 41 870 911 41 904
TABLE 6.05
2015 PEDESTRIAN CRASHES BY POPULATION OF AREA
Population of City
or Township
Fatal
Crashes
Injury
Crashes Total
Crashes
Pedestrians
Killed
Pedestrians
Injured
250,000 and Over 12 457 469 12 480
100,000 - 249,999 1 20 21 1 22
50,000 - 99,999 10 93 103 10 92
25,000 - 49,999 1 87 88 1 90
10,000 - 24,999 4 122 126 4 126
5,000 - 9,999 2 31 33 2 31
2,500 - 4,999 1 29 30 1 31
1,000 - 2,499 0 11 11 0 11
Under 1,000 10 20 30 10 21
Total 41 870 911 41 904
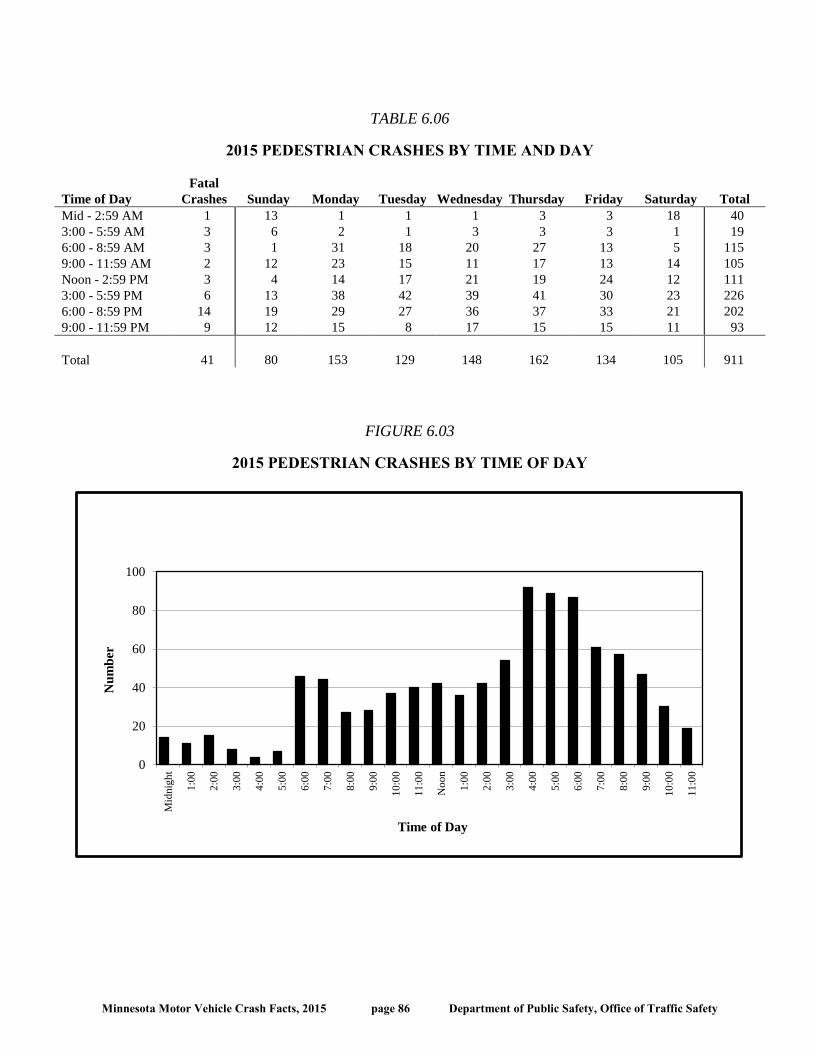
Minnesota Motor Vehicle Crash Facts, 2015 page 86 Department of Public Safety, Office of Traffic Safety
TABLE 6.06
2015 PEDESTRIAN CRASHES BY TIME AND DAY
Time of Day
Fatal
Crashes Sunday Monday Tuesday Wednesday Thursday Friday Saturday Total
Mid - 2:59 AM 1 13 1 1 1 3 3 18 40
3:00 - 5:59 AM 3 6 2 1 3 3 3 1 19
6:00 - 8:59 AM 3 1 31 18 20 27 13 5 115
9:00 - 11:59 AM 2 12 23 15 11 17 13 14 105
Noon - 2:59 PM 3 4 14 17 21 19 24 12 111
3:00 - 5:59 PM 6 13 38 42 39 41 30 23 226
6:00 - 8:59 PM 14 19 29 27 36 37 33 21 202
9:00 - 11:59 PM 9 12 15 8 17 15 15 11 93
Total 41 80 153 129 148 162 134 105 911
FIGURE 6.03
2015 PEDESTRIAN CRASHES BY TIME OF DAY
0
20
40
60
80
100
Mid
nig
ht
1:0
0
2:0
0
3:0
0
4:0
0
5:0
0
6:0
0
7:0
0
8:0
0
9:0
0
10
:00
11
:00
No
on
1:0
0
2:0
0
3:0
0
4:0
0
5:0
0
6:0
0
7:0
0
8:0
0
9:0
0
10
:00
11
:00
Nu
mb
er
Time of Day

Minnesota Motor Vehicle Crash Facts, 2015 page 87 Department of Public Safety, Office of Traffic Safety
TABLE 6.07
PRIOR ACTION OF VEHICLES IN 2015 PEDESTRIAN CRASHES
Action
Vehicles in
Fatal
Crashes
Vehicles in
Injury
Crashes
Vehicles in
All Crashes
Going Straight 37 433 470
Wrong Way Opposing Traffic 0 1 1
Turning Right on Red 1 22 23
Turning Left on Red 0 2 2
Turning Right 1 70 71
Turning Left 1 222 223
Making U Turn 0 2 2
Starting From Parked 0 7 7
Starting in Traffic 0 11 11
Slowing in Traffic 0 2 2
Parking 0 4 4
Avoiding Object in Road 1 7 8
Changing Lanes 1 1 2
Passing 0 1 1
Backing 0 22 22
All Others 4 71 75
Unknown 1 21 22
Total* 47 899 946
* The number of vehicles in total crashes exceeds the number of crashes
because some crashes involved more than one vehicle.
TABLE 6.08
PRIOR ACTION OF PEDESTRIANS KILLED OR INJURED IN 2015
Action
Number
Pedestrians
Killed
Percent
Pedestrians
Killed
Number
Pedestrians
Injured
Percent
Pedestrians
Injured
Crossing Road (No Crosswalk and No Signal) 13 31.7% 233 25.8%
Crossing Against Signal 1 2.4% 43 4.8%
Crossing With Signal 1 2.4% 118 13.1%
Crossing In Crosswalk (No Signal) 4 9.8% 178 19.7%
Walking In Road With Traffic 8 19.5% 57 6.3%
Walking In Road Against Traffic 1 2.4% 18 2.0%
Standing In Road 0 0.0% 28 3.1%
Emerging Front/Behind Parked Vehicle 0 0.0% 0 0.0%
Child Getting On/Off School Bus 0 0.0% 0 0.0%
Pushing/Working on Vehicle 0 0.0% 0 0.0%
Working In Road 0 0.0% 2 0.2%
Getting On/Off Vehicle 0 0.0% 7 0.8%
Playing In Road 0 0.0% 6 0.7%
Not In Road 1 2.4% 24 2.7%
Other Pedestrian Action 2 4.9% 51 5.6%
Unknown 10 24.4% 139 15.4%
Total* 41 100.0% 904 100.0%
* Percent totals may not sum to 100% due to rounding.
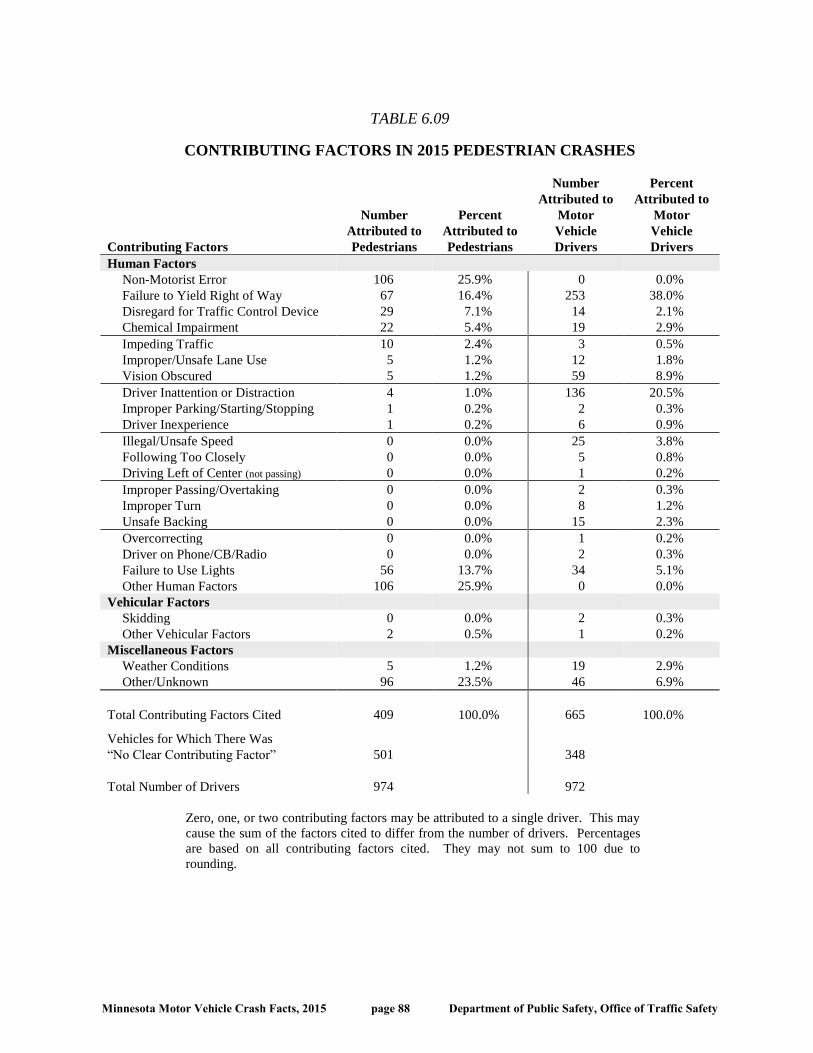
Minnesota Motor Vehicle Crash Facts, 2015 page 88 Department of Public Safety, Office of Traffic Safety
TABLE 6.09
CONTRIBUTING FACTORS IN 2015 PEDESTRIAN CRASHES
Contributing Factors
Number
Attributed to
Pedestrians
Percent
Attributed to
Pedestrians
Number
Attributed to
Motor
Vehicle
Drivers
Percent
Attributed to
Motor
Vehicle
Drivers
Human Factors
Non-Motorist Error 106 25.9% 0 0.0%
Failure to Yield Right of Way 67 16.4% 253 38.0%
Disregard for Traffic Control Device 29 7.1% 14 2.1%
Chemical Impairment 22 5.4% 19 2.9%
Impeding Traffic 10 2.4% 3 0.5%
Improper/Unsafe Lane Use 5 1.2% 12 1.8%
Vision Obscured 5 1.2% 59 8.9%
Driver Inattention or Distraction 4 1.0% 136 20.5%
Improper Parking/Starting/Stopping 1 0.2% 2 0.3%
Driver Inexperience 1 0.2% 6 0.9%
Illegal/Unsafe Speed 0 0.0% 25 3.8%
Following Too Closely 0 0.0% 5 0.8%
Driving Left of Center (not passing) 0 0.0% 1 0.2%
Improper Passing/Overtaking 0 0.0% 2 0.3%
Improper Turn 0 0.0% 8 1.2%
Unsafe Backing 0 0.0% 15 2.3%
Overcorrecting 0 0.0% 1 0.2%
Driver on Phone/CB/Radio 0 0.0% 2 0.3%
Failure to Use Lights 56 13.7% 34 5.1%
Other Human Factors 106 25.9% 0 0.0%
Vehicular Factors
Skidding 0 0.0% 2 0.3%
Other Vehicular Factors 2 0.5% 1 0.2%
Miscellaneous Factors
Weather Conditions 5 1.2% 19 2.9%
Other/Unknown 96 23.5% 46 6.9%
Total Contributing Factors Cited 409 100.0% 665 100.0%
Vehicles for Which There Was
“No Clear Contributing Factor” 501 348
Total Number of Drivers 974 972
Zero, one, or two contributing factors may be attributed to a single driver. This may
cause the sum of the factors cited to differ from the number of drivers. Percentages
are based on all contributing factors cited. They may not sum to 100 due to
rounding.

Minnesota Motor Vehicle Crash Facts, 2015 page 89 Department of Public Safety, Office of Traffic Safety
TABLE 6.10
PEDESTRIAN FATALITIES' LEVEL OF ALCOHOL CONCENTRATION, 2005 - 2015
Alcohol Concentration*
Year Killed Tested (.00) (.01 - .07) (.08 - .09) (.10 or more)
2005 44 34 18 (53%) 1 (3%) 2 (6%) 13 (38%)
2006 38 31 22 (71%) 1 (3%) 0 (0%) 8 (26%)
2007 33 18 9 (50%) 1 (6%) 0 (0%) 8 (44%)
2008 25 20 11 (55%) 0 (0%) 0 (0%) 9 (45%)
2009 41 33 22 (67%) 0 (0%) 1 (3%) 10 (30%)
2010 36 29 19 (66%) 0 (0%) 0 (0%) 10 (34%)
2011 40 33 21 (64%) 3 (9%) 0 (0%) 9 (27%)
2012 40 22 16 (73%) 0 (0%) 0 (0%) 6 (27%)
2013 35 31 15 (48%) 3 (10%) 0 (0%) 13 (42%)
2014 17 10 6 (60%) 0 (0%) 0 (0%) 4 (40%)
2015 41 30 20 (67%) 0 (0%) 0 (0%) 10 (33%)
* The percentage figures shown are based on the number of fatally injured pedestrians who were tested for alcohol concentration. (The law requires testing of all drivers and pedestrians, 16 years of age or older, who die within four hours as a result of a motor vehicle crash.)
TABLE 6.11
2015 PEDESTRIAN FATALITIES' LEVEL OF ALCOHOL CONCENTRATION BY AGE
Alcohol Concentration
Age Group Killed Tested (.00) (.01 - .07) (.08 - .09) (.10 or more)
< 15 3 1 1 0 0 0
15 - 19 1 1 1 0 0 0
20 - 24 2 2 1 0 0 1
25 - 29 4 4 2 0 0 2
30 - 34 1 1 0 0 0 1
35 - 39 5 4 2 0 0 2
40 - 44 2 2 1 0 0 1
45 - 49 3 2 2 0 0 0
50 - 54 2 1 1 0 0 0
55 - 59 4 4 1 0 0 3
60 - 64 4 2 2 0 0 0
65 - 69 3 1 1 0 0 0
70 - 74 2 2 2 0 0 0
75 - 79 4 2 2 0 0 0
80 - 84 0 0 0 0 0 0
85 & Older 1 1 1 0 0 0
Total 41 30 20 0 0 10

Minnesota Motor Vehicle Crash Facts, 2015 page 90 Department of Public Safety, Office of Traffic Safety
TABLE 6.12
2015 PEDESTRIAN FATALITIES' LEVEL OF ALCOHOL CONCENTRATION BY TIME OF DAY
Alcohol Concentration
Time of Day Killed Tested (.00) (.01 - .07) (.08 - .09) (.10 or more)
Mid - 2:59 AM 1 1 0 0 0 1
3:00 - 5:59 AM 3 3 1 0 0 2
6:00 - 8:59 AM 3 2 2 0 0 0
9:00 - 11:59 AM 2 0 0 0 0 0
Noon - 2:59 PM 3 1 1 0 0 0
3:00 - 5:59 PM 6 4 4 0 0 0
6:00 - 8:59 PM 14 12 8 0 0 4
9:00 - 11:59 PM 9 7 4 0 0 3
Total 41 30 20 0 0 10
Minnesota Motor Vehicle Crash Facts, 2015 page 91 Department of Public Safety, Office of Traffic Safety
VII: BICYCLE CRASHES
Bicycles are subject to the same traffic laws as motor
vehicles, but bicycle crashes are reported to the
Minnesota Department of Public Safety only if they
involve collision with a motor vehicle. Therefore, this
section represents only a portion of the total number
of bicycle crashes.
Bicycle crashes increase
In 2015, there was a 16% increase in bicycle crashes
from the previous year - there were 898 bicycle
crashes in 2015, compared to 776 bicycle crashes in
2014.
Fatalities and injuries increase
In 2015, 873 bicyclists were injured compared to 755
injured bicyclists in 2014, a 16% increase. Bicyclist
fatalities doubled from 5 in 2014 to 10 in 2015.
Warm weather
Bicycle crashes are mostly a warm weather
occurrence. In 2015, all ten fatalities and 757 of the
873 injuries (87%) occurred during the six-month
period April-October.
Time of day One-third (32%) of all weekday bicycle crashes
occurred during the afternoon rush hours 3:00-
6:00pm. About one out of four (26%) weekend
bicycle crashes occurred during the same period.
Big cities
Generally, traffic crashes involving a bicycle and a
motor vehicle tend to occur in areas with larger
populations. Over nine out of ten (95%) bicycle
crashes and 60% of fatal bicycle crashes occurred in
cities where the population was over 5,000 people.
Males injured most often
Males were nearly three times more likely than
females to be injured in a bicycle crash. In 2015, 674
male bicyclists (76%) were injured compared with
202 female bicyclists (23%).
Age
Of the 873 bicyclists injured in 2015, over two in five
(44%) were less than 25 years of age.
Prior action of bicyclists Nearly half (49%) of bicyclists in all crashes were
riding with traffic. Only 4% of all crash involved
bicyclists were riding against traffic.
Contributing factors
Failure to yield the right of way was listed most often
by officers for both the bicyclists and other motor
vehicle drivers. Failure to yield right of way was
attributed to (28%) of the bicyclists and (44%) of the
other drivers. For bicyclists, disregard for traffic
control device and non-motorist error (a violation
committed by the bicyclist separate from those listed)
were listed the next most often. Driver inattention or
distraction was the second contributing factor cited
most often for other drivers.

Minnesota Motor Vehicle Crash Facts, 2015 page 92 Department of Public Safety, Office of Traffic Safety
TABLE 7.01
BICYCLE CRASH SUMMARY, 2006 - 2015
2006 2007 2008 2009 2010 2011 2012 2013 2014 2015
Bicycle Crashes 944 1,020 981 957 898 963 920 862 776 898
Bicyclists Killed 8 4 13 10 9 5 7 6 5 10
Bicyclists Injured 908 979 942 963 882 937 875 822 755 873
TABLE 7.02
2015 BICYCLE CRASHES BY MONTH
Month
Fatal
Crashes
Injury
Crashes
Property
Damage
Crashes
Total
Crashes Killed Injured
January 0 10 0 10 0 10
February 0 8 0 8 0 8
March 0 34 0 34 0 35
April 1 64 2 67 1 63
May 0 99 1 100 0 104
June 1 136 2 139 1 137
July 2 129 6 137 2 129
August 1 126 3 130 1 127
September 4 114 3 121 4 113
October 1 82 4 87 1 84
November 0 54 2 56 0 54
December 0 9 0 9 0 9
Total 10 865 23 898 10 873
FIGURE 7.01
2015 BICYCLE CRASHES BY TIME OF DAY
0
20
40
60
80
100
120
140
Mid
nig
ht
1:0
0
2:0
0
3:0
0
4:0
0
5:0
0
6:0
0
7:0
0
8:0
0
9:0
0
10
:00
11
:00
Noo
n
1:0
0
2:0
0
3:0
0
4:0
0
5:0
0
6:0
0
7:0
0
8:0
0
9:0
0
10
:00
11
:00
un
k
Nu
mb
er
Time of Day

Minnesota Motor Vehicle Crash Facts, 2015 page 93 Department of Public Safety, Office of Traffic Safety
TABLE 7.03 2015 BICYCLE CRASHES BY TIME AND DAY
Time of Day Sunday Monday Tuesday Wednesday Thursday Friday Saturday Total
Mid - 2:59 AM 6 2 1 4 0 1 8 22
3:00 - 5:59 AM 1 0 2 2 1 1 0 7
6:00 - 8:59 AM 2 22 18 14 17 14 2 89
9:00 - 11:59 AM 15 9 11 19 17 5 14 90
Noon - 2:59 PM 20 12 27 27 18 30 17 151
3:00 - 5:59 PM 27 31 54 53 41 44 26 276
6:00 - 8:59 PM 21 29 28 35 24 24 23 184
9:00 - 11:59 PM 8 10 10 13 6 15 13 75
Unknown 2 1 1 0 0 0 0 4
Total 102 116 152 167 124 134 103 898
TABLE 7.04 2015 BICYCLE CRASHES BY POPULATION OF AREA
Population of
City or Township
Fatal
Crashes
Injury
Crashes
Property
Damage
Crashes
Total
Crashes
Bicyclists
Killed
Bicyclists
Injured
250,000 and Over 2 381 14 397 2 387
100,000 - 249,999 0 25 1 26 0 25
50,000 - 99,999 0 157 4 161 0 160
25,000 - 49,999 2 109 0 111 2 109
10,000 - 24,999 1 119 3 123 1 119
5,000 - 9,999 1 35 1 37 1 34
2,500 - 4,999 0 15 0 15 0 15
1,000 - 2,499 1 10 0 11 1 10
Under 1,000 3 14 0 17 3 14
Total 10 865 23 898 10 873
FIGURE 7.02 BICYCLISTS KILLED OR INJURED BY AGE AND GENDER, 2015
0
10
20
30
40
50
60
70
80
90
100
0-4
5-9
10-1
4
15-1
9
20-2
4
25-2
9
30-3
4
35-3
9
40-4
4
45-4
9
50-5
4
55-5
9
60-6
4
65-6
9
70-7
4
75+
Nu
mb
er
Age Group
Male Female

Minnesota Motor Vehicle Crash Facts, 2015 page 94 Department of Public Safety, Office of Traffic Safety
TABLE 7.05
BICYCLISTS KILLED OR INJURED BY AGE AND GENDER, 2015
Killed Severe Injuries Moderate Injuries Minor Injuries Total Injuries
Age Group M F Total* M F Total* M F Total* M F Total* M F Total*
00 - 04 0 0 0 0 0 0 2 0 2 0 0 0 2 0 2
05 - 09 0 0 0 0 0 0 11 5 16 23 7 30 34 12 46
10 - 14 0 0 0 2 1 3 19 7 26 55 13 68 76 21 97
15 - 19 0 0 0 4 2 6 18 7 25 69 21 90 91 30 121
20 - 24 1 0 1 2 1 3 26 14 40 47 27 74 75 42 117
25 - 29 1 0 1 3 1 4 22 11 33 49 14 64 74 26 101
30 - 34 0 0 0 4 0 4 16 5 21 38 9 47 58 14 72
35 - 39 0 0 0 6 0 6 13 7 20 15 9 24 34 16 50
40 - 44 1 1 2 2 1 3 13 1 14 17 4 21 32 6 38
45 - 49 1 0 1 2 2 4 17 4 21 27 4 31 46 10 56
50 - 54 2 1 3 1 1 2 18 5 23 25 4 29 44 10 54
55 - 59 0 0 0 6 1 7 12 2 14 23 1 24 41 4 45
60 - 64 1 0 1 1 0 1 7 2 9 12 4 16 20 6 26
65 - 69 0 0 0 0 0 0 4 0 4 4 0 4 8 0 8
70 - 74 0 0 0 1 0 1 4 0 4 3 0 3 8 0 8
75 & Older 1 0 1 0 0 0 2 0 2 3 0 3 5 0 5
Not Stated 0 0 0 1 0 1 2 1 3 15 2 23 18 3 27
Total 8 2 10 35 10 45 206 71 277 425 119 551 666 200 873
* Within columns, where numbers do not add across to total, gender was not stated on the accident report.
TABLE 7.06
PRIOR ACTION OF BICYCLISTS INVOLVED IN 2015 CRASHES
Prior Action
Bicyclists
in Fatal
Crashes
Bicyclists
in Injury
Crashes
Bicyclists in
Property
Damage
Crashes
Bicyclists
in All
Crashes*
Riding With Traffic 6 421 16 443
Riding Against Traffic 1 31 2 34
Making Right Turn 0 11 0 11
Making Left Turn 0 21 0 21
Making U Turn 0 2 0 2
Riding Across Road 1 38 3 42
Slowing/Stopping/Starting 0 5 0 5
Other/Unknown 2 344 10 356
Total 10 873 31 914
* The total number of bicyclist actions may exceed the number of bicycle crashes
because some crashes involved more than one bicycle.

Minnesota Motor Vehicle Crash Facts, 2015 page 95 Department of Public Safety, Office of Traffic Safety
TABLE 7.07
CONTRIBUTING FACTORS IN 2015 BICYCLE CRASHES
Contributing Factors
Number
Attributed to
Bicyclists
Percent
Attributed to
Bicyclists
Number
Attributed to
Motor Vehicle
Drivers
Percent
Attributed to
Motor Vehicle
Drivers
Human Factors
Failure to Yield Right of Way 123 28.3% 241 43.8%
Disregard for Traffic Control Device 73 16.8% 24 4.4%
Non-Motorist Error 65 14.9% 0 0.0%
Driver Inattention or Distraction 24 5.5% 109 19.8%
Failure to Use Lights 19 4.4% 0 0.0%
Improper/Unsafe Lane Use 15 3.4% 12 2.2%
Vision Obscured 9 2.1% 45 8.2%
Illegal/Unsafe Speed 4 0.9% 7 1.3%
Driver Inexperience 4 0.9% 1 0.2%
Chemical Impairment 4 0.9% 4 0.7%
Improper Passing/Overtaking 3 0.7% 8 1.5%
Improper Turn 3 0.7% 6 1.1%
Following Too Closely 2 0.5% 1 0.2%
Improper Park/Start/Stop 2 0.5% 4 0.7%
Impeding Traffic 2 0.5% 0 0.0%
Driver on Phone/CB/Radio 1 0.2% 1 0.2%
Driving Left of Center (not passing) 1 0.2% 2 0.4%
Unsafe Backing 0 0.0% 4 0.7%
Improper/No Signal 0 0.0% 2 0.4%
Other Human Factors 20 4.6% 22 4.0%
Vehicular Factors
Defective Brakes 4 0.9% 0 0.0%
Skidding 0 0.0% 0 0.0%
Other Vehicular Factor 2 0.5% 2 0.4%
Miscellaneous Factors
Weather Conditions 9 2.1% 11 2.0%
Other 46 10.6% 44 8.0%
Total 435 100.0% 550 100.0%
Vehicles for Which There Was
“No Clear Contributing Factor” 416 362
Total Number of Bicyclists/Drivers 907 907
Zero, one, or two contributing factors may be attributed to a single driver or bicyclist. This may cause the sum of
the factors cited to differ from the number of drivers or bicyclists. Percentages are based on all contributing
factors cited. They may not sum to 100 due to rounding.

Minnesota Motor Vehicle Crash Facts, 2015 page 96 Department of Public Safety, Office of Traffic Safety
VIII: SCHOOL BUS CRASHES
As a general rule, school bus travel is very safe.
The school bus is a large and heavy vehicle that
provides good protection for its occupants.
However, since buses can carry many passengers,
serious crashes could potentially cause many
injuries.
Crashes included in this section are those in which
at least one school bus was physically involved.
Note that in some cases, a crash could be seen as
involving a school bus (albeit indirectly), yet not
be counted as a school bus crash. For example,
one such case would be a crash in which a person
gets off the bus, crosses a street and is struck by
another vehicle. Such a case could be called an
indirect school bus crash.
Indirect bus crashes
Changes in the crash reporting system in 2003
now make it possible to identify crashes in which
a school bus was indirectly involved. In 2015,
there were 151 crashes resulting in 70 injuries in
which a school bus was indirectly involved.
Number of crashes increase
In 2015, school bus crashes increased by 14%.
There were 690 traffic crashes directly involving
at least one school bus, compared to 806 crashes
in 2014.
One death in 2015 In 2015, there was one fatal school bus crash
resulting in one death. This fatality was a driver
from the other motor vehicle.
Morning and afternoon rush hours
Seven in ten (70%) school bus crashes and three
in four school bus crash injuries (75%) in 2015
occurred during the time periods of 6-9 a.m. and
3-6 p.m. Over nine out of ten (92%) of school bus
crashes occurred during school year months
September through May.
School bus stop arm Less than 1% of all school bus crashes occurred
when the school bus stop arm was deployed. Only
two injuries occurred in school bus crashes where
the school bus stop arm was in use, down from 17
in 2014.
Contributing factors
In 2015, there were 690 traffic crashes where at
least one school bus was involved. In all there
were 704 school buses directly involved in these
crashes. For half (51%) of the school bus drivers,
officer reports showed there was “no clear
contributing factor.” The two contributing factors
cited most often were driver inattention or
distraction (19%) and failure to yield right of way
(15%). The third most frequently cited
contributing factor was following too closely
(9%). The most commonly cited contributing
factors attributed to drivers of other vehicles in
school bus crashes were driver inattention or
distraction (21%), failure to yield right of way
(15%) and following too closely (11%).

Minnesota Motor Vehicle Crash Facts, 2015 page 97 Department of Public Safety, Office of Traffic Safety
TABLE 8.01
SCHOOL BUS CRASH SUMMARY, 2006 - 2015
2006 2007 2008 2009 2010 2011 2012 2013 2014 2015
Total Crashes 625 680 663 670 611 615 553 732 806 690
Fatal Crashes 1 7 1 4 4 1 4 3 1 1
Persons Killed 1 8 4 4 4 1 7 3 1 1
Injury Crashes 137 126 107 144 116 112 113 132 117 142
Persons Injured 241 243 188 233 215 214 211 237 238 234
Property Damage Crashes 487 547 555 522 491 502 436 597 688 547
School Buses Directly Involved 631 690 670 675 615 621 554 736 820 700
TABLE 8.02
2015 SCHOOL BUS CRASHES BY TIME OF DAY
Time of Day
Fatal
Crashes
Injury
Crashes
Property
Damage
Crashes
Total
Crashes Killed Injured
Midnight - 2:59 AM 0 1 0 1 0 1
3:00 - 5:59 AM 0 0 0 0 0 0
6:00 - 8:59 AM 1 58 212 271 1 105
9:00 - 11:59 AM 0 12 65 77 0 24
Noon - 2:59 PM 0 21 83 104 0 29
3:00 - 5:59 PM 0 47 167 214 0 70
6:00 - 8:59 PM 0 3 16 19 0 5
9:00 - 11:59 PM 0 0 2 2 0 0
Unknown 0 0 2 2 0 0
Total 1 142 547 690 1 234
TABLE 8.03
2015 SCHOOL BUS CRASHES BY MONTH
Month
Fatal
Crashes
Injury
Crashes
Property
Damage
Crashes
Total
Crashes Killed Injured
January 0 15 78 93 0 21
February 0 19 86 105 0 30
March 0 9 35 44 0 18
April 0 13 36 49 0 23
May 0 18 54 72 0 23
June 0 6 21 27 0 6
July 0 6 12 18 0 23
August 0 0 8 8 0 0
September 0 17 45 62 0 24
October 0 13 54 67 0 18
November 0 16 63 79 0 27
December 1 10 55 66 1 21
Total 1 142 547 690 1 234

Minnesota Motor Vehicle Crash Facts, 2015 page 98 Department of Public Safety, Office of Traffic Safety
TABLE 8.04
AGE AND GENDER OF PERSONS INJURED IN 2015 SCHOOL BUS CRASHES
Age Group In Bus Pedestrian
In Other
Vehicle Male Female Total*
00 - 04 11 0 3 8 6 14
05 - 09 14 0 5 11 7 19
10 - 14 22 1 4 21 6 27
15 - 19 8 1 21 16 14 30
20 - 24 1 0 15 7 9 16
25 - 29 3 0 18 12 9 21
30 - 34 4 2 11 7 10 17
35 - 39 3 0 7 4 6 10
40 - 44 3 0 10 8 5 13
45 - 49 2 0 9 6 5 11
50 - 54 4 0 4 2 6 8
55 - 59 5 0 7 8 4 12
60 - 64 2 0 4 5 1 6
65 & Older 4 1 12 11 6 17
Unknown 10 1 2 7 5 13
Total 96 6 132 133 99 234
*There were two cases where the gender of the person was not recorded on the crash form.
TABLE 8.05
PERSONS KILLED OR INJURED IN 2015 SCHOOL BUS CRASHES BY POPULATION OF AREA
Population of City
or Township Killed
Severely
Injured
Moderately
Injured
Minor
Injuries Total
250,000 and Over 0 1 10 49 60
100,000 - 249,999 0 1 1 5 7
50,000 - 99,999 0 0 4 35 39
25,000 - 49,999 0 0 3 7 10
10,000 - 24,999 0 0 9 29 38
5,000 - 9,999 0 0 1 21 22
2,500 - 4,999 0 0 3 4 7
1,000 - 2,499 0 0 4 2 6
Under 1,000 1 1 5 39 45
Total 1 3 40 191 234
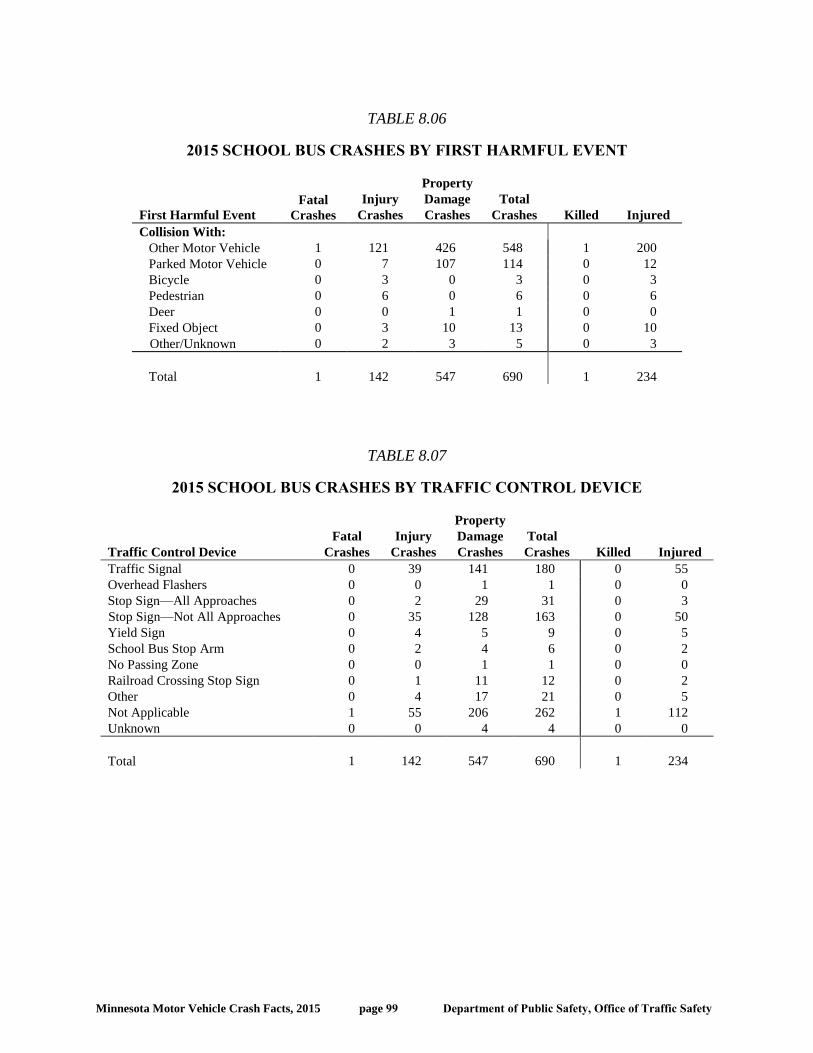
Minnesota Motor Vehicle Crash Facts, 2015 page 99 Department of Public Safety, Office of Traffic Safety
TABLE 8.06
2015 SCHOOL BUS CRASHES BY FIRST HARMFUL EVENT
First Harmful Event
Fatal
Crashes
Injury
Crashes
Property
Damage
Crashes
Total
Crashes Killed Injured
Collision With:
Other Motor Vehicle 1 121 426 548 1 200
Parked Motor Vehicle 0 7 107 114 0 12
Bicycle 0 3 0 3 0 3
Pedestrian 0 6 0 6 0 6
Deer 0 0 1 1 0 0
Fixed Object 0 3 10 13 0 10
Other/Unknown 0 2 3 5 0 3
Total 1 142 547 690 1 234
TABLE 8.07
2015 SCHOOL BUS CRASHES BY TRAFFIC CONTROL DEVICE
Traffic Control Device
Fatal
Crashes
Injury
Crashes
Property
Damage
Crashes
Total
Crashes Killed Injured
Traffic Signal 0 39 141 180 0 55
Overhead Flashers 0 0 1 1 0 0
Stop Sign—All Approaches 0 2 29 31 0 3
Stop Sign—Not All Approaches 0 35 128 163 0 50
Yield Sign 0 4 5 9 0 5
School Bus Stop Arm 0 2 4 6 0 2
No Passing Zone 0 0 1 1 0 0
Railroad Crossing Stop Sign 0 1 11 12 0 2
Other 0 4 17 21 0 5
Not Applicable 1 55 206 262 1 112
Unknown 0 0 4 4 0 0
Total 1 142 547 690 1 234

Minnesota Motor Vehicle Crash Facts, 2015 page 100 Department of Public Safety, Office of Traffic Safety
TABLE 8.08
CONTRIBUTING FACTORS IN 2015 SCHOOL BUS CRASHES
Contributing Factors
Number
Attributed to
School Bus
Drivers
Percent
Attributed to
School Bus
Drivers
Number
Attributed to
Drivers of
Other
Vehicles
Percent
Attributed to
Drivers of
Other
Vehicles
Human Factors
Driver Inattention or Distraction 56 18.6% 100 20.7%
Failure to Yield Right of Way 46 15.3% 71 14.7%
Following Too Closely 26 8.6% 51 10.5%
Improper Turn 25 8.3% 7 1.4%
Improper/Unsafe Lane Use 20 6.6% 27 5.6%
Unsafe Backing 20 6.6% 8 1.7%
Improper Passing/Overtaking 12 4.0% 9 1.9%
Improper Park/Start/Stop 12 4.0% 14 2.9%
Driver Inexperience 7 2.3% 12 2.5%
Disregard for Traffic Control Device 6 2.0% 25 5.2%
Vision Obscured 6 2.0% 10 2.1%
Illegal/Unsafe Speed 4 1.3% 34 7.0%
Driving Left of Center (not passing) 1 0.3% 3 0.6%
Overcorrecting 1 0.3% 1 0.2%
Impeding Traffic 1 0.3% 2 0.4%
Non-Motorist Error 1 0.3% 1 0.2%
Improper/No Signal 0 0.0% 2 0.4%
Chemical Impairment 0 0.0% 3 0.6%
Driver on Phone/CB/Radio 0 0.0% 1 0.2%
Failure to Use Lights 0 0.0% 0 0.0%
Other Human Factors 8 2.7% 13 2.7%
Vehicular Factors
Skidding 7 2.3% 29 6.0%
Defective Brakes 1 0.3% 4 0.8%
Other Vehicular Factors 1 0.3% 4 0.8%
Miscellaneous Factors
Weather Conditions 20 6.6% 43 8.9%
Other 20 6.6% 10 2.1%
Total 301 100.0% 484 100.0%
Vehicles for Which There Was
“No Clear Contributing Factor” 360 261
Total Number of Drivers 704 722
Zero, one, or two contributing factors may be attributed to a single driver. This may cause the sum of the
factors cited to differ from the number of drivers. Percentages are based on all contributing factors cited. They
may not sum to 100 due to rounding. Bicyclists and pedestrians are included as other drivers in this table.

Minnesota Motor Vehicle Crash Facts, 2015 page 101 Department of Public Safety, Office of Traffic Safety
IX: MOTOR VEHICLE/TRAIN CRASHES
Each crash reported in this section involves a
motor vehicle and a train. Train collisions with
pedestrians or bicyclists are not counted as traffic
crashes in this publication.
Statewide, one-half of one percent of all motor
vehicle crashes result in a fatality. Generally,
motor-vehicle/train crashes are few in number,
but they are more likely to be serious. In 2015,
there were two motor vehicle/train crashes that
resulted in a fatality, representing 6% of all
motor-vehicle/train crashes in Minnesota.
Number of train crashes decreased in 2015
In the past decade, the number of motor-
vehicle/train crashes in Minnesota has been
declining. In 2015, there were 48 vehicle/train
crashes, 15 fewer crashes than were reported in
the previous year.
Fatalities and injuries decrease Both fatalities and injuries in motor vehicle/train
crashes decreased. Three people were killed in
2015 compared with eight in 2014. Nineteen
people were injured in 2015 compared with 25 in
2014.
Railroad crossings with flashing lights or gates
Railroad crossings without some type of flashing
lights or gates are very dangerous. No fatalities
occurred at a railroad crossing without flashing
lights or gates. Only three crashes occurred
where there was a railroad crossing gate present.
Most crashes occurred in rural areas
Motor vehicle crashes involving a train are a
predominantly rural phenomenon, defined as an
area with a population of less than 5,000. In
2015, 19 of the 48 total crashes and one of the
three fatalities occurred in rural areas.
Contributing factors
For motor vehicle drivers involved in train
crashes, failure to yield right of way (34%),
disregard of traffic control device (25%) and
improper turn were the three contributing factors
listed most often by officers.

Minnesota Motor Vehicle Crash Facts, 2015 page 102 Department of Public Safety, Office of Traffic Safety
TABLE 9.01
MOTOR VEHICLE / TRAIN CRASH SUMMARY, 2006 - 2015
2006 2007 2008 2009 2010 2011 2012 2013 2014 2015
Total Crashes 51 56 40 37 33 48 25 51 63 48
Fatal Crashes 8 2 3 4 1 4 3 5 6 2
Persons Killed 9 2 4 5 1 4 3 5 8 3
Injury Crashes 10 16 17 11 17 16 12 17 25 15
Persons Injured 15 20 20 15 21 18 15 20 33 19
Property Damage Crashes 33 38 20 22 15 28 10 29 32 31
TABLE 9.02
2015 MOTOR VEHICLE / TRAIN CRASHES BY MONTH
Month
Fatal
Crashes
Injury
Crashes
PDO
Crashes Total Killed Injured
January 0 0 2 2 0 0
February 0 1 6 7 0 1
March 0 1 1 2 0 2
April 0 0 5 5 0 0
May 1 4 1 6 1 5
June 0 1 2 3 0 2
July 0 1 1 2 0 1
August 0 2 3 5 0 2
September 0 0 3 3 0 0
October 0 1 4 5 0 1
November 1 4 1 6 2 5
December 0 0 2 2 0 0
Total 2 15 31 48 3 19
TABLE 9.03
2015 MOTOR VEHICLE / TRAIN CRASHES BY TIME AND DAY
Time of Day Sunday Monday Tuesday Wednesday Thursday Friday Saturday Total
Midnight - 2:59 AM 0 0 0 2 0 0 0 2
3:00 - 5:59 AM 0 0 0 0 0 0 0 0
6:00 - 8:59 AM 0 2 1 1 3 0 1 8
9:00 - 11:59 AM 0 3 0 2 1 1 1 8
Noon - 2:59 PM 1 2 1 1 1 1 1 8
3:00 - 5:59 PM 3 2 1 3 0 2 1 12
6:00 - 8:59 PM 1 2 1 2 1 0 1 8
9:00 - 11:59 PM 0 0 1 0 1 0 0 2
Total 5 11 5 11 7 4 5 48

Minnesota Motor Vehicle Crash Facts, 2015 page 103 Department of Public Safety, Office of Traffic Safety
TABLE 9.04
2015 MOTOR VEHICLE / TRAIN CRASHES BY TRAFFIC CONTROL DEVICE
Traffic Control Device
Fatal
Crashes
Injury
Crashes
Property
Damage
Crashes
Total
Crashes Killed Injured
Stop Sign All Approaches 0 2 3 5 0 3
RR Crossing Gate 1 0 0 1 1 0
RR Crossing Flashing Lights 1 1 1 3 2 2
RR Crossing Stop Sign 0 3 6 9 0 3
RR Overhead Lights/Gate 0 2 0 2 0 3
RR Crossbuck 0 1 0 1 0 1
Other Device 0 6 18 24 0 7
Not Applicable 0 0 3 3 0 0
Total 2 15 31 48 3 19
TABLE 9.05
2015 MOTOR VEHICLE / TRAIN CRASHES AGE OF PERSONS KILLED OR INJURED
Age Group Killed
Severe
Injuries
Moderate
Injuries
Minor
Injuries
Total
Injuries
00 - 04 0 0 0 0 0
05 - 09 0 0 0 0 0
10 - 14 0 0 0 0 0
15 - 19 0 0 0 0 0
20 - 24 1 1 0 0 1
25 - 29 0 0 1 1 2
30 - 34 0 0 1 0 1
35 - 39 0 0 1 1 2
40 - 44 0 0 0 1 1
45 - 49 0 0 0 2 2
50 - 54 0 0 0 3 3
55 - 59 1 0 0 2 2
60 - 64 0 0 0 2 2
65 - 69 0 0 0 0 0
70 - 74 0 0 0 0 0
75 - 79 0 0 0 1 1
80 & Older 1 0 2 0 2
Total 3 1 5 13 19

Minnesota Motor Vehicle Crash Facts, 2015 page 104 Department of Public Safety, Office of Traffic Safety
TABLE 9.06
2015 MOTOR VEHICLE / TRAIN CRASHES BY POPULATION OF AREA
Population of
City or Township
Fatal
Crashes
Injury
Crashes
Property
Damage
Crashes
Total
Crashes Killed Injured
250,000 and Over 0 6 17 23 0 7
100,000 - 249,999 0 0 0 0 0 0
50,000 - 99,999 0 0 0 0 0 0
25,000 - 49,999 0 1 1 2 0 1
10,000 - 24,999 1 0 1 2 2 1
5,000 - 9,999 0 1 1 2 0 2
2,500 - 4,999 0 0 0 0 0 0
1,000 - 2,499 0 2 0 2 0 2
Under 1,000 1 5 11 17 1 6
Total 2 15 31 48 3 19
TABLE 9.07
2015 MOTOR VEHICLE / TRAIN CRASHES MOTOR VEHICLE DRIVER CONTRIBUTING FACTORS
Contributing Factor Number Percent
Human Factors
Failure to Yield Right of Way 25 34.2%
Disregard for Traffic Control 18 24.7%
Driver Inattention or Distraction 8 11.0%
Improper Turn 7 9.6%
Illegal/Unsafe Speed 2 2.7%
Improper/Unsafe Lane Use 2 2.7%
Improper Passing/Overtaking 1 1.4%
Chemical Impairment 1 1.4%
Vision Obscured 1 1.4%
Other Human Factor 2 2.7%
Vehicular Factors
Skidding 2 2.7%
Other
Weather 2 2.7%
Other Contributing Factor 2 2.7%
Total 73 100.0%
Vehicles for Which There Was “No Clear Contributing Factor” 4
Number of Drivers 51
Zero, one, or two contributing factors may be attributed to a single driver.
This may cause the sum of the factors cited to differ from the number of
drivers. Percentages are based on all contributing factors cited. They may
not sum to 100 due to rounding. No contributing factors are cited for train
operators.

Minnesota Motor Vehicle Crash Facts, 2015 page 105 Department of Public Safety, Office of Traffic Safety
X: CRASHES INVOLVING TEEN DRIVERS
Minnesota teen drivers continue to be overrepresented
in traffic crashes due to driver inexperience,
distractions, speeding/risk-taking and seat belt non-
use. The greatest crash risk occurs during the first
months of independent driving. The good news is that
progress has been made. Laws such as no cell phone
use, no texting, primary seat belt and nighttime and
passenger limitations have helped reduce teen traffic
deaths and injuries.
Parents play a vital role in developing safe teen
drivers. Teens need to gain experience in a variety of
road types and environments — day, night, city, rural,
rain, snow — while supervised by an experienced
licensed driver. Even after a teen is licensed, they
continue to need training and monitoring.
Programming is available through driver educators to
assist parents in learning more about graduated driver
licensing, as well as tips for helping their teens
become safer drivers.
Teen involvement in traffic crashes
This Section provides a short summary regarding teen
drivers (ages 15-19) who were involved in crashes.
However, more information concerning teens can be
found in other Sections of this Crash Facts report:
Table 1.04: Age/Gender of teens killed or injured
Table 1.05: Age/Gender of teen drivers involved
Table 1.06: Licensed vs. Crash involved drivers
Table 1.07: Teen driver crash type
Table 1.09: Single-vehicle crash contributing factors
Table 1.10: Multi-vehicle crash contributing factors
Table 2.03: DWI’s issued to underage drivers
Table 2.05: Alcohol related teens killed or injured
Table 2.12: Teen driver alcohol concentration
Table 3.03: Teen vehicle occupants killed or injured
Table 3.05: Teen occupant seat belt use
Table 4.06: Teen motorcyclists killed or injured
Table 6.03: Teen pedestrians killed or injured
Table 7.05: Teen bicyclists killed or injured
Table 8.04: Teen school bus riders killed or injured
Teen crash involvement is decreasing
Table 10.01 indicates that the numbers of teen-
involved traffic crashes have been decreasing. The
definition of a teen-involved crash used here is any
crash with at least one teen driver (ages 15-19) of any
motor vehicle involved (no teen pedestrians or
bicyclists used). In 2009, 19.2% of all traffic crashes
in Minnesota were teen-related. In 2015, that
percentage dropped to 16.4%.
Teen (ages 13-19) fatalities and injuries have also
decreased. In 2009, 10% of all traffic fatalities in
Minnesota were teens. In 2015, that percentage has
dropped to 8%. In 2006, 15% of all traffic injuries in
Minnesota were teens. In 2015, that percentage
dropped to 12%.
Rate per licensed teen driver decreasing
Table 10.02 indicates that the number of teen motor
vehicle occupant (MVO) drivers (ages 15-19) who
were involved in crashes is also decreasing. That is,
only teens that were driving vehicles normally
equipped with seat belts are counted in this table. In
2009, 57.4 teen MVO drivers were involved in crashes
for every 1,000 licensed teen drivers. In 2015, that rate
has dropped to 51.4.
Colder weather
Teen involved crashes are rather evenly distributed
throughout the year; however, there is an uptick during
the colder months. In 2015, one out of every five
(19%) teen-involved crashes occurred during the
months of January and December.
Afternoons are dangerous As can be seen from Table 10.05 and Figure 10.01, a
large number of teen-involved crashes happen during
the afternoon period of 2:00 - 6:00 p.m. During that
four-hour time period in 2015, 38% of all teen-
involved crashes occurred. On the other hand, less
than 4% of all teen involved crashes occurred during
the five-hour nighttime period of 12:00 a.m. - 5:00
a.m.
Contributing factors
For teen drivers of any vehicle who were involved in
crashes, driver distraction was listed most often (22%)
by officers at the scene. Next was failure to yield the
right of way (15%) and then following too closely
(11%). For the ‘other’ motor vehicle drivers involved,
failure to yield the right of way was listed most often
(24%), next was driver distraction (18%) and
following too closely (15%). Only 6% of the ‘other’
drivers were listed as illegal or unsafe speed.

Minnesota Motor Vehicle Crash Facts, 2015 page 106 Department of Public Safety, Office of Traffic Safety
TABLE 10.01
TEEN CRASH SUMMARY, 2009 - 2015
Category 2009 2010 2011 2012 2013 2014 2015
Crashes with at least one Teen (15-19) Driver* 14,142 13,611 12,139 11,804 12,384 12,247 12,268
All Traffic Crashes in Minnesota 73,498 74,073 72,117 69,236 77,707 78,396 74,772
-Teen (15-19) Driver* Crash % 19.2% 18.4% 16.8% 17.0% 15.9% 15.6% 16.4%
Teen (13-19) Traffic Fatalities 40 47 39 40 33 21 31
All Traffic Fatalities in Minnesota 421 411 368 395 387 361 411
-Teen (13-19) Fatality % 9.5% 11.4% 10.6% 10.1% 8.5% 5.8% 7.5%
Teen (13-19) Traffic Injuries 4,648 4,391 3,921 3,844 3,662 3,417 3,600
All Traffic Injuries in Minnesota 31,074 31,176 30,295 29,314 30,653 29,439 29,981
-Teen (13-19) Injury % 15.0% 14.1% 12.9% 13.1% 11.9% 11.6% 12.0%
*Driver of any motor vehicle.
TABLE 10.02
TEEN ‘MOTOR VEHICLE OCCUPANT’ DRIVER CRASH INVOLVEMENT, 2009 - 2015
Age of Teen MVO* Driver 2009 2010 2011 2012 2013 2014 2015
Age 15 MVO* Drivers involved in Crashes 159 187 181 156 152 172 218
Age 15 Licensed Drivers** 28,126 28,020 25,422 25,946 25,324 26,393 30,120
-Rate per 1,000 Licensed Drivers: 5.7 6.7 7.1 6.0 6.0 6.5 7.2
Age 16 MVO* Drivers involved in Crashes 3,160 2,897 2,567 2,645 2,772 2,669 2,780
Age 16 Licensed Drivers** 49,884 49,634 48,260 47,801 48,013 48,263 49,306
-Rate per 1,000 Licensed Drivers: 63.3 58.4 53.2 55.3 57.7 55.3 56.4
Age 17 MVO* Drivers involved in Crashes 3,888 3,580 3,251 3,205 3,268 3,327 3,273
Age 17 Licensed Drivers** 56,554 55,885 54,781 54,489 53,744 54,190 54,818
-Rate per 1,000 Licensed Drivers: 68.7 64.1 59.3 58.8 60.8 61.4 59.7
Age 18 MVO* Drivers involved in Crashes 4,024 4,014 3,504 3,364 3,430 3,389 3,506
Age 18 Licensed Drivers** 62,707 61,526 59,722 59,220 58,706 58,202 58,766
-Rate per 1,000 Licensed Drivers: 64.2 65.2 58.7 56.8 58.4 58.2 59.7
Age 19 MVO* Drivers involved in Crashes 3,971 3,900 3,450 3,261 3,532 3,424 3,312
Age 19 Licensed Drivers** 67,701 66,272 63,997 63,212 62,642 62,349 61,692
-Rate per 1,000 Licensed Drivers: 58.7 58.8 53.9 51.6 56.4 54.9 53.7
All 15-19 MVO* Drivers involved in Crashes 15,202 14,578 12,953 12,631 13,154 12,981 13,089
All 15-19 Licensed Drivers** 264,972 261,337 252,182 250,668 248,429 249,397 254,702
-Rate per 1,000 Licensed Drivers: 57.4 55.8 51.4 50.4 52.9 52.0 51.4
*MVO = Motor Vehicle Occupant. Only teen drivers in vehicles equipped with Seat-Belts are included in Table 10.02.
**Licensed Driver totals include Permits.

Minnesota Motor Vehicle Crash Facts, 2015 page 107 Department of Public Safety, Office of Traffic Safety
TABLE 10.03
2015 TEEN-INVOLVED CRASHES* BY MONTH (*Crashes involving at least one Teen Driver (15-19) of any vehicle)
Month Fatal
Crashes
A-Injury
Crashes
B-Injury
Crashes
C-Injury
Crashes PDO
Crashes
Total
Crashes
January 4 7 66 217 904 1,198
February 4 8 70 190 766 1,038
March 1 5 46 170 551 773
April 5 14 78 160 542 799
May 3 9 80 232 686 1,010
June 5 14 64 225 776 1,084
July 5 8 86 207 669 975
August 4 14 86 242 713 1,059
September 4 12 60 219 690 985
October 3 8 69 221 752 1,053
November 1 7 90 229 819 1,146
December 4 10 71 196 867 1,148
Total 43 116 866 2,508 8,735 12,268
TABLE 10.04
2015 TEEN-INVOLVED CRASHES* BY DAY OF WEEK (*Crashes involving at least one Teen Driver (15-19) of any vehicle)
Day
Fatal
Crashes
A-Injury
Crashes
B-Injury
Crashes
C-Injury
Crashes
PDO
Crashes
Total
Crashes
Sunday 3 9 120 278 904 1,314
Monday 6 15 127 326 1,166 1,640
Tuesday 6 16 104 392 1,408 1,926
Wednesday 7 14 118 371 1,405 1,915
Thursday 7 19 127 373 1,388 1,914
Friday 8 20 140 435 1,422 2,025
Saturday 6 23 130 333 1,042 1,534
Total 43 116 866 2,508 8,735 12,268

Minnesota Motor Vehicle Crash Facts, 2015 page 108 Department of Public Safety, Office of Traffic Safety
TABLE 10.05 2015 TEEN-INVOLVED CRASHES* BY TIME OF DAY
(*Crashes involving at least one Teen Driver (15-19) of any vehicle)
Hour Fatal
Crashes
A-Injury
Crashes
B-Injury
Crashes
C-Injury
Crashes PDO
Crashes
Total
Crashes
Midnight 0 3 13 25 85 126
1:00 2 2 11 27 79 121
2:00 0 3 7 18 56 84
3:00 1 3 8 31 39 82
4:00 0 2 8 5 23 38
5:00 2 5 8 12 41 68
6:00 1 3 12 39 125 180
7:00 2 4 41 173 623 843
8:00 1 4 28 99 454 586
9:00 2 1 25 79 297 404
10:00 0 4 25 89 286 404
11:00 2 5 25 107 362 501
Noon 4 5 49 147 463 668
1:00 1 0 44 131 419 595
2:00 4 11 62 161 613 851
3:00 2 8 88 261 955 1,314
4:00 3 10 92 257 886 1,248
5:00 3 5 78 253 910 1,249
6:00 3 6 58 164 581 812
7:00 2 10 45 116 399 572
8:00 2 3 28 103 315 451
9:00 1 6 47 100 325 479
10:00 3 12 36 66 239 356
11:00 2 1 28 43 142 216
Unknown 0 0 0 2 18 20
Total 43 116 866 2,508 8,735 12,268
FIGURE 10.01 TOTAL TEEN-INVOLVED CRASHES, BY TIME, 2015
0
200
400
600
800
1000
1200
1400
1600
Mid
nig
ht
1:0
0
2:0
0
3:0
0
4:0
0
5:0
0
6:0
0
7:0
0
8:0
0
9:0
0
10
:00
11
:00
No
on
1:0
0
2:0
0
3:0
0
4:0
0
5:0
0
6:0
0
7:0
0
8:0
0
9:0
0
10
:00
11
:00
Un
kTo
tal
Tee
n C
rash
es
Time of Day

Minnesota Motor Vehicle Crash Facts, 2015 page 109 Department of Public Safety, Office of Traffic Safety
TABLE 10.06
CONTRIBUTING FACTORS IN 2015 TEEN-INVOLVED CRASHES
Contributing Factors
Number
Attributed to
Teen Drivers*
Percent
Attributed to
Teen Drivers*
Number
Attributed to
Other Vehicle
Drivers*
Percent
Attributed to
Other Vehicle
Drivers*
Human Factors
Driver Inattention or Distraction 2,840 22.2% 649 18.1%
Failure to Yield Right of Way 1,886 14.7% 862 24.1%
Following Too Closely 1,438 11.2% 536 15.0%
Illegal/Unsafe Speed 1,299 10.2% 197 5.5%
Driver Inexperience 1,169 9.1% 18 0.5%
Overcorrecting 449 3.5% 22 0.6%
Disregard for Traffic Control Device 422 3.3% 183 5.1%
Improper/Unsafe Lane Use 412 3.2% 179 5.0%
Improper Turn 209 1.6% 77 2.2%
Vision Obscured 183 1.4% 62 1.7%
Chemical Impairment 163 1.3% 52 1.5%
Unsafe Backing 114 0.9% 38 1.1%
Improper Passing/Overtaking 111 0.9% 56 1.6%
Improper Park/Start/Stop 90 0.7% 42 1.2%
Driving Left of Center (not passing) 53 0.4% 26 0.7%
Impeding Traffic 33 0.3% 17 0.5%
Driver On Phone/CB/Radio 28 0.2% 4 0.1%
Improper/No Signal 17 0.1% 15 0.4%
Failure to Use Lights 6 0.0% 3 0.1%
Non-Motorist Error 0 0.0% 19 0.5%
Other Human Factor 280 2.2% 83 2.3%
Vehicular Factors
Skidding 439 3.4% 67 1.9%
Defective Brakes 130 1.0% 18 0.5%
Oversize/Overweight Vehicle 2 0.0% 1 0.0%
Other Vehicular Factor 63 0.5% 39 1.1%
Miscellaneous Factors
Weather Conditions 647 5.1% 151 4.2%
Other 313 2.4% 161 4.5%
Total Contributing Factors 12,796 100.0% 3,577 100.0%
Vehicles for Which There Was
“No Clear Contributing Factor” 3,395 6,659
Total Number of Drivers 13,179 10,089
*The term ‘Drivers’ refers to a driver of any motor vehicle. Contributing factor data for the ‘Other Vehicle
Drivers’ includes pedestrians and bicyclists. Pedestrians and bicyclists are not included in the ‘Teen Driver’
data.
Zero, one, or two contributing factors may be attributed to each vehicle, pedestrian, or bicyclist involved in a
crash. This may cause the sum of the factors cited to differ from the number of drivers, pedestrians, or
bicyclists. Percentages are based on all contributing factors listed. They may not sum to 100 due to
rounding.

Minnesota Motor Vehicle Crash Facts, 2015 page 110 Department of Public Safety, Office of Traffic Safety
XI: CRASHES INVOLVING SENIOR DRIVERS
Between 2000 and 2030, the population of
Minnesotans aged 65 and older will increase to over
24 percent of the total population. Age alone does not
determine a person’s ability to drive safely; each of us
ages differently. There are safe and unsafe drivers at
every age. National research suggests that crash rates
for older drivers are actually decreasing due to better
health, vehicles with helpful technologies, more
driving experience and safer roadways. As people get
older, their driving schedules change due to
retirement, different activities and fewer required trips.
Older drivers generally drive fewer miles than younger
ones. In addition, many older drivers self-regulate by
avoiding driving at night or on particularly challenging
roadways. While the average driver is older than in the
past, this has not caused the large increase in crashes
and deaths on our roadways that was initially
predicted.
Senior involvement in traffic crashes
This Section provides a short summary regarding
senior drivers (ages 65 and above) who were involved
in crashes. However, more information concerning
seniors can be found in other Sections of this Crash
Facts report:
Table 1.04: Age/Gender of seniors killed or injured
Table 1.05: Age/Gender of senior drivers involved
Table 1.06: Licensed vs. Crash involved drivers
Table 1.07: Senior driver crash type
Table 1.09: Single-vehicle crash contributing factors
Table 1.10: Multi-vehicle crash contributing factors
Table 2.05: Alcohol related seniors killed or injured
Table 2.12: Senior driver alcohol concentration
Table 3.03: Senior vehicle occupants killed or
injured
Table 3.05: Senior occupant seat belt use
Table 4.06: Senior motorcyclists killed or injured
Table 6.03: Senior pedestrians killed or injured
Table 7.05: Senior bicyclists killed or injured
Senior crash involvement remains steady
Table 11.01 indicates that the number of senior-
involved traffic crashes is increasing. The definition of
a senior-involved crash used here is any crash with at
least one senior driver (ages 65 and above) of any
motor vehicle (no senior pedestrians or bicyclists
used). In 2009, 13% of all traffic crashes in Minnesota
were senior-related. In 2015, that percentage was 15%.
As the senior population in Minnesota increases,
senior traffic fatalities are expected to increase. In
2009, 20% of all traffic fatalities in Minnesota were
seniors. In 2015, that percentage has risen to 24%.
Senior (ages 65 and older) injuries have also
increased. In 2009, 8% of all traffic injuries in
Minnesota were seniors. In 2015, that percentage rose
to 10%.
MVO rate per licensed senior driver also steady
Table 11.02 indicates that the number of senior motor
vehicle occupant (MVO) drivers who were involved in
crashes decreased slightly. That is, only seniors that
were driving vehicles normally equipped with seat
belts are counted in this table. In 2009, 15.9 senior
MVO drivers were involved in crashes for every 1,000
licensed senior drivers. In 2015, that rate dropped to
15.2.
Cold Weather
Senior-involved crashes are rather evenly distributed
throughout the year; however, there is an uptick during
the colder months. In 2015, one out of every four
(26%) senior involved crashes occurred during the
months of November, December, and January.
Afternoons are dangerous As can be seen from Table 11.05 and Figure 11.01, a
large number of senior involved crashes happen during
the afternoon period of noon - 5:00 p.m. During that
five-hour time-period in 2015, 46% of all senior
involved crashes occurred. On the other hand, less
than 1% of all senior involved crashes occurred during
the five-hour nighttime period of 12:00 a.m. - 5:00
a.m.
Contributing factors
For senior drivers of any vehicle who were involved in
crashes, failure to yield right of way was listed most
often (27%) by officers at the scene. Next was driver
inattention/distraction (19%). For the other motor
vehicle drivers involved, driver inattention/distraction
was listed most often (23%), next was failure to yield
right of way (20%) and following too closely (15%).

Minnesota Motor Vehicle Crash Facts, 2015 page 111 Department of Public Safety, Office of Traffic Safety
TABLE 11.01
SENIOR CRASH SUMMARY, 2009 - 2015
Category 2009 2010 2011 2012 2013 2014 2015
Crashes with at least one Senior (65+) Driver* 9,453 9,657 9,511 9,687 10,630 11,162 11,184
All Traffic Crashes in Minnesota 73,498 74,073 72,117 69,236 77,707 78,396 74,772
-Senior (65+) Driver* Crash % 12.9% 13.0% 13.2% 14.0% 13.7% 14.2% 15.0%
Senior (65+) Traffic Fatalities 84 72 76 81 86 82 99
All Traffic Fatalities in Minnesota 421 411 368 395 387 361 411
-Senior (65+) Fatality % 20.0% 17.5% 20.7% 20.5% 22.2% 22.7% 24.1%
Senior (65+) Traffic Injuries 2,477 2,523 2,496 2,654 2,712 2,698 2,883
All Traffic Injuries in Minnesota 31,074 31,176 30,295 29,314 30,653 29,439 29,981
-Senior (65+) Injury % 8.0% 8.1% 8.2% 9.1% 8.8% 9.1% 9.6%
*Driver of any motor vehicle.
TABLE 11.02
SENIOR ‘MOTOR VEHICLE OCCUPANT’ DRIVER CRASH INVOLVEMENT, 2009 - 2015
Age of Senior MVO* Driver 2009 2010 2011 2012 2013 2014 2015
Age 65-69 MVO* Drivers involved in Crashes 3,345 3,511 3,451 3,630 3,980 4,447 4,439
Age 65-69 Licensed Drivers 193,513 198,777 213,587 226,107 237,444 252,369 264,586
-Rate per 1,000 Licensed Drivers: 17.3 17.7 16.2 16.1 16.8 17.6 16.8
Age 70-74 MVO* Drivers involved in Crashes 2,210 2,326 2,332 2,311 2,616 2,777 2,821
Age 70-74 Licensed Drivers 143,738 149,002 155,347 164,699 172,320 178,905 181,902
-Rate per 1,000 Licensed Drivers: 15.4 15.6 15.0 14.0 15.2 15.5 15.5
Age 75-79 MVO* Drivers involved in Crashes 1,828 1,791 1,743 1,744 1,912 1,972 1,885
Age 75-79 Licensed Drivers 113,517 114,320 116,871 119,643 123,927 127,476 131,549
-Rate per 1,000 Licensed Drivers: 16.1 15.7 14.9 14.6 15.4 15.5 14.3
Age 80-84 MVO* Drivers involved in Crashes 1,389 1,382 1,327 1,392 1,382 1,320 1,294
Age 80-84 Licensed Drivers 87,672 88,821 90,620 90,268 90,333 91,175 91,681
-Rate per 1,000 Licensed Drivers: 15.8 15.6 14.6 15.4 15.3 14.5 14.1
Age 85+ MVO* Drivers involved in Crashes 931 967 955 955 1,069 997 1,027
Age 85+ Licensed Drivers 71,997 74,678 79,683 82,434 82,608 84,666 86,814
-Rate per 1,000 Licensed Drivers: 12.9 12.9 12.0 11.6 12.9 11.8 11.8
All 65+ MVO* Drivers involved in Crashes 9,703 9,977 9,808 10,032 10,959 11,513 11,466
All 65+ Licensed Drivers 610,437 625,598 656,108 683,151 706,632 734,591 756,532
-Rate per 1,000 Licensed Drivers: 15.9 15.9 14.9 14.7 15.5 15.7 15.2
*MVO = Motor Vehicle Occupant.
Only senior drivers in vehicles equipped with seatbelts are included in Table 11.02.

Minnesota Motor Vehicle Crash Facts, 2015 page 112 Department of Public Safety, Office of Traffic Safety
TABLE 11.03
2015 SENIOR-INVOLVED CRASHES* BY MONTH (*Crashes involving at least one Senior Driver (65+) of any vehicle)
Month
Fatal
Crashes
A-Injury
Crashes
B-Injury
Crashes
C-Injury
Crashes
PDO
Crashes
Total
Crashes
January 3 6 51 222 672 954
February 5 5 44 183 569 806
March 6 7 64 160 493 730
April 3 7 67 147 507 731
May 11 14 112 188 633 958
June 10 11 91 231 714 1,057
July 10 23 102 226 609 970
August 9 16 89 200 637 951
September 11 15 91 219 608 944
October 8 13 78 253 734 1,086
November 10 11 73 208 705 1,007
December 8 6 76 192 708 990
Total 94 134 938 2,429 7,589 11,184
TABLE 11.04
2015 SENIOR-INVOLVED CRASHES* BY DAY OF WEEK (*Crashes involving at least one Senior Driver (65+) of any vehicle)
Day
Fatal
Crashes
A-Injury
Crashes
B-Injury
Crashes
C-Injury
Crashes
PDO
Crashes
Total
Crashes
Sunday 17 10 98 222 644 991
Monday 15 21 133 353 1,067 1,589
Tuesday 12 19 136 360 1,265 1,792
Wednesday 14 24 143 389 1,284 1,854
Thursday 14 28 151 385 1,265 1,843
Friday 11 14 145 442 1,265 1,877
Saturday 11 18 132 278 799 1,238
Total 94 134 938 2,429 7,589 11,184

Minnesota Motor Vehicle Crash Facts, 2015 page 113 Department of Public Safety, Office of Traffic Safety
TABLE 11.05 2015 SENIOR-INVOLVED CRASHES* BY TIME OF DAY
(*Crashes involving at least one Senior Driver (65+) of any vehicle)
Hour Fatal
Crashes
A-Injury
Crashes
B-Injury
Crashes
C-Injury
Crashes PDO
Crashes
Total
Crashes
Midnight 1 0 1 7 21 30
1:00 0 0 4 4 15 23
2:00 0 0 0 1 7 8
3:00 0 1 2 1 13 17
4:00 0 0 3 6 14 23
5:00 2 2 9 8 36 57
6:00 4 1 15 29 95 144
7:00 4 3 38 85 252 382
8:00 6 3 48 115 388 560
9:00 7 6 56 125 439 633
10:00 4 11 75 174 550 814
11:00 5 10 65 183 604 867
Noon 6 7 66 205 641 925
1:00 3 16 75 206 682 982
2:00 10 19 68 235 718 1,050
3:00 8 12 85 271 778 1,154
4:00 8 11 98 239 676 1,032
5:00 8 14 92 218 630 962
6:00 4 5 57 116 362 544
7:00 2 1 31 76 217 327
8:00 4 5 20 45 184 258
9:00 6 3 12 41 111 173
10:00 0 2 9 25 84 120
11:00 2 2 8 10 35 57
Unknown 0 0 1 4 37 42
Total 94 134 938 2,429 7,589 11,184
FIGURE 11.01 TOTAL SENIOR-INVOLVED CRASHES, BY TIME, 2015
0
200
400
600
800
1000
1200
1400
1600
Mid
nig
ht
1:0
0
2:0
0
3:0
0
4:0
0
5:0
0
6:0
0
7:0
0
8:0
0
9:0
0
10
:00
11
:00
No
on
1:0
0
2:0
0
3:0
0
4:0
0
5:0
0
6:0
0
7:0
0
8:0
0
9:0
0
10
:00
11
:00
un
kTo
tal
Sen
ior
Cra
shes
Time of Day

Minnesota Motor Vehicle Crash Facts, 2015 page 114 Department of Public Safety, Office of Traffic Safety
TABLE 11.06
CONTRIBUTING FACTORS IN 2015 SENIOR-INVOLVED CRASHES
Contributing Factors
Number
Attributed to
Senior
Drivers*
Percent
Attributed to
Senior
Drivers*
Number
Attributed to
Other Vehicle
Drivers*
Percent
Attributed to
Other Vehicle
Drivers*
Human Factors
Failure to Yield Right of Way 2,083 27.4% 1,132 20.1%
Driver Inattention or Distraction 1,442 19.0% 1,310 23.2%
Following Too Closely 514 6.8% 823 14.6%
Improper/Unsafe Lane Use 482 6.3% 278 4.9%
Disregard for Traffic Control Device 424 5.6% 367 6.5%
Illegal/Unsafe Speed 314 4.1% 343 6.1%
Improper Turn 252 3.3% 100 1.8%
Vision Obscured 180 2.4% 92 1.6%
Unsafe Backing 124 1.6% 52 0.9%
Improper Passing/Overtaking 107 1.4% 92 1.6%
Improper Park/Start/Stop 106 1.4% 54 1.0%
Overcorrecting 100 1.3% 22 0.4%
Chemical Impairment 74 1.0% 79 1.4%
Driving Left of Center (no passing) 61 0.8% 39 0.7%
Improper/No Signal 17 0.2% 12 0.2%
Impeding Traffic 15 0.2% 18 0.3%
Driver Inexperience 12 0.2% 99 1.8%
Driver On Phone/CB/Radio 3 0.0% 8 0.1%
Failure to Use Lights 1 0.0% 10 0.2%
Non-Motorist Error 0 0.0% 29 0.5%
Other Human Factor 415 5.5% 130 2.3%
Vehicular Factors
Skidding 146 1.9% 114 2.0%
Defective Brakes 46 0.6% 41 0.7%
Oversize/Overweight Vehicle 4 0.1% 2 0.0%
Other Vehicular Factor 48 0.6% 33 0.6%
Miscellaneous Factors
Weather Conditions 280 3.7% 173 3.1%
Other 345 4.5% 192 3.4%
Total Contributing Factors 7,595 100.0% 5,644 100.0%
Vehicles for Which There Was
“No Clear Contributing Factor” 4,816 5,088
Total Number of Drivers 11,848 10,298
*The term ‘Drivers’ refers to a driver of any motor vehicle.
Contributing factor data for the ‘Other Vehicle Drivers’ includes pedestrians and bicyclists. Pedestrians
and bicyclists are not included in the ‘Senior Driver’ data.
Zero, one, or two contributing factors may be attributed to each vehicle, pedestrian, or bicyclist involved
in a crash. This may cause the sum of the factors cited to differ from the number of drivers, pedestrians,
or bicyclists. Percentages are based on all contributing factors listed. They may not sum to 100 due to
rounding.
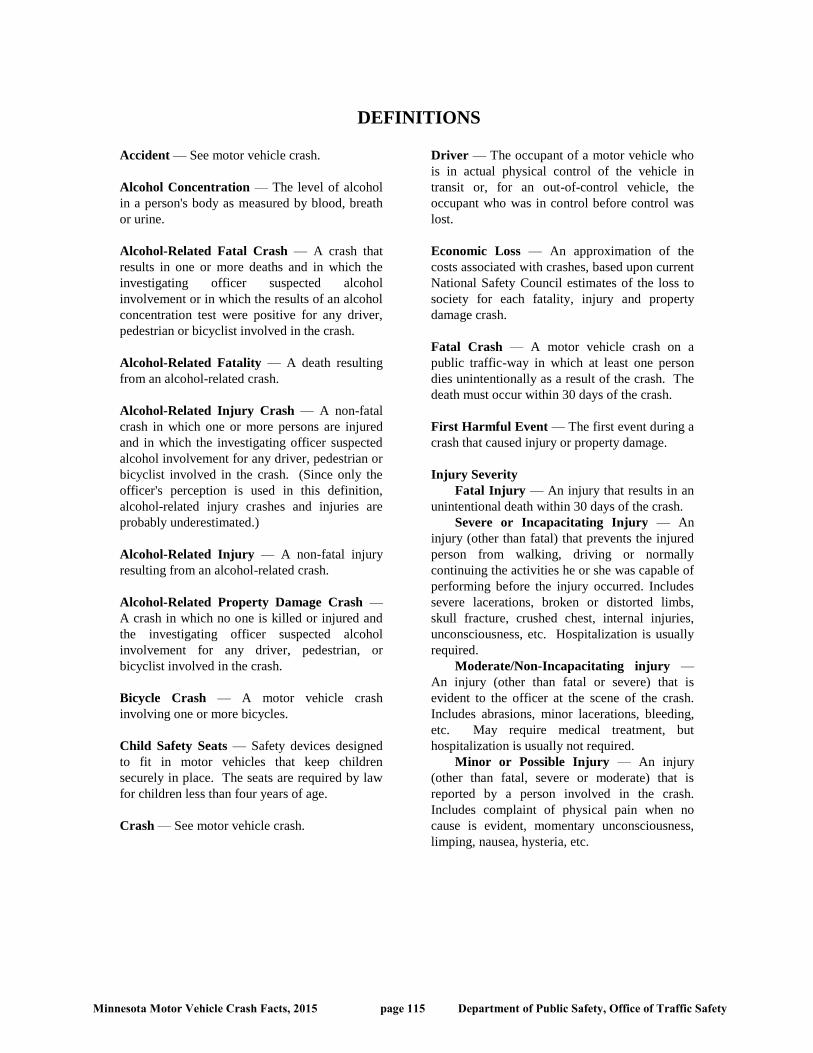
Minnesota Motor Vehicle Crash Facts, 2015 page 115 Department of Public Safety, Office of Traffic Safety
DEFINITIONS
Accident — See motor vehicle crash.
Alcohol Concentration — The level of alcohol
in a person's body as measured by blood, breath
or urine.
Alcohol-Related Fatal Crash — A crash that
results in one or more deaths and in which the
investigating officer suspected alcohol
involvement or in which the results of an alcohol
concentration test were positive for any driver,
pedestrian or bicyclist involved in the crash.
Alcohol-Related Fatality — A death resulting
from an alcohol-related crash.
Alcohol-Related Injury Crash — A non-fatal
crash in which one or more persons are injured
and in which the investigating officer suspected
alcohol involvement for any driver, pedestrian or
bicyclist involved in the crash. (Since only the
officer's perception is used in this definition,
alcohol-related injury crashes and injuries are
probably underestimated.)
Alcohol-Related Injury — A non-fatal injury
resulting from an alcohol-related crash.
Alcohol-Related Property Damage Crash —
A crash in which no one is killed or injured and
the investigating officer suspected alcohol
involvement for any driver, pedestrian, or
bicyclist involved in the crash.
Bicycle Crash — A motor vehicle crash
involving one or more bicycles.
Child Safety Seats — Safety devices designed
to fit in motor vehicles that keep children
securely in place. The seats are required by law
for children less than four years of age.
Crash — See motor vehicle crash.
Driver — The occupant of a motor vehicle who
is in actual physical control of the vehicle in
transit or, for an out-of-control vehicle, the
occupant who was in control before control was
lost.
Economic Loss — An approximation of the
costs associated with crashes, based upon current
National Safety Council estimates of the loss to
society for each fatality, injury and property
damage crash.
Fatal Crash — A motor vehicle crash on a
public traffic-way in which at least one person
dies unintentionally as a result of the crash. The
death must occur within 30 days of the crash.
First Harmful Event — The first event during a
crash that caused injury or property damage.
Injury Severity
Fatal Injury — An injury that results in an
unintentional death within 30 days of the crash.
Severe or Incapacitating Injury — An
injury (other than fatal) that prevents the injured
person from walking, driving or normally
continuing the activities he or she was capable of
performing before the injury occurred. Includes
severe lacerations, broken or distorted limbs,
skull fracture, crushed chest, internal injuries,
unconsciousness, etc. Hospitalization is usually
required.
Moderate/Non-Incapacitating injury —
An injury (other than fatal or severe) that is
evident to the officer at the scene of the crash.
Includes abrasions, minor lacerations, bleeding,
etc. May require medical treatment, but
hospitalization is usually not required.
Minor or Possible Injury — An injury
(other than fatal, severe or moderate) that is
reported by a person involved in the crash.
Includes complaint of physical pain when no
cause is evident, momentary unconsciousness,
limping, nausea, hysteria, etc.

Minnesota Motor Vehicle Crash Facts, 2015 page 116 Department of Public Safety, Office of Traffic Safety
Motorcycle — A two-wheeled or three-wheeled motor
vehicle having one or more riding saddles and having an
engine of more than 50 cc. If it has a 50 cc or smaller
engine, it is classified as a motorized bicycle or motor
scooter/motorbike.
Motorcycle Crash — A motor vehicle crash involving
one or more motorcycles.
Motor Vehicle — A self-propelled vehicle, including
attached trailers and semi trailers designed for use with
such vehicles.
Motor Vehicle Crash — A crash that involves a motor
vehicle in transport on a public traffic-way in Minnesota
and results in injury, death or at least $1,000.00 in property
damage.
Occupant — Any person who is in or on a vehicle,
including the driver, passenger and persons riding on the
outside of the vehicle.
Occupant Restraints — Protective devices used in motor
vehicles to keep the driver and passengers in their seats
and prevent them from being ejected from the motor
vehicle in a crash. Restraint devices include lap belts,
lap/shoulder harness combinations, air bags and child
safety seats.
Passenger — Any occupant of a motor vehicle other than
the driver.
Pedestrian — Any person not in or on a motor vehicle or
other vehicle (e.g., a bicycle).
Pedestrian Crash — A motor vehicle crash involving one
or more pedestrians.
Restraint Usage — An occupant's use of available vehicle
restraints including lap belt, lap/shoulder combination
harness, or child safety seats.
Rural — Having a population of fewer than 5,000.
School Bus Crash — A crash involving one or more
school buses. The school bus must collide with another
vehicle, or pedestrian or object, for the crash to be
classified as a school bus crash.
Trafficway — Any land way open to the public as a
matter of right or custom for moving persons or property
from one place to another.
Train/Motor Vehicle Crash — A motor vehicle crash
involving a motor vehicle in transport and a railway train.
Presently, the only crashes classified as train crashes are
those in which the first harmful event is collision with a
train.
Truck Crash — A motor vehicle crash involving one or
more vehicles of the following types: (1) 2-axle, 6-tire
single unit truck or step van, (2) 3-or-more-axle single unit
truck, (3) single-unit truck with trailer, (4) truck tractor
with no trailer, (5) truck tractor with semi-trailer, (6) truck
tractor with double trailers, (7) truck tractor with triple
trailers, (8) heavy truck of other or unknown type. Pickup
trucks and vans are not counted as trucks.
Urban — Having a population of 5,000 or more.