mmp13 and isg15 are potential driver genes in oral...
TRANSCRIPT
i
MMP13 AND ISG15 ARE POTENTIAL DRIVER
GENES IN ORAL SQUAMOUS CELL CARCINOMA
VINCENT CHONG VUI KING
THESIS SUBMITTED IN FULFILMENT OF THE
REQUIREMENTS FOR THE DEGREE OF DOCTOR
OF PHILOSOPHY
FACULTY OF DENTISTRY
UNIVERSITY OF MALAYA
KUALA LUMPUR
2016

ii
UNIVERSITY OF MALAYA
ORIGINAL LITERARY WORK DECLARATION
Name of Candidate: Vincent Chong Vui King I.C/Passport No: 841014-13-5229
Registration/Matric No: DHA120008
Name of Degree: Doctor of Philopshy (Oral Oncology)
Title of Project Paper/Research Report/Dissertation/Thesis (“this Work”): MMP13
and ISG15 are potential driver genes in oral squamous cell carcinoma
Field of Study:
I do solemnly and sincerely declare that:
(1) I am the sole author/writer of this Work;
(2) This Work is original;
(3) Any use of any work in which copyright exists was done by way of fair
dealing and for permitted purposes and any excerpt or extract from, or
reference to or reproduction of any copyright work has been disclosed
expressly and sufficiently and the title of the Work and its authorship have
been acknowledged in this Work;
(4) I do not have any actual knowledge nor do I ought reasonably to know that
the making of this work constitutes an infringement of any copyright work;
(5) I hereby assign all and every rights in the copyright to this Work to the
University of Malaya (“UM”), who henceforth shall be owner of the
copyright in this Work and that any reproduction or use in any form or by any
means whatsoever is prohibited without the written consent of UM having
been first had and obtained;
(6) I am fully aware that if in the course of making this Work I have infringed
any copyright whether intentionally or otherwise, I may be subject to legal
action or any other action as may be determined by UM.
Candidate’s Signature Date:
Subscribed and solemnly declared before,
Witness’s Signature Date:
Name:
Designation:

iii
ABSTRACT
Background: Oral squamous cell carcinoma (OSCC) is an exceptionally aggressive
disease with poor prognosis. A major drawback in diagnosis and treatment of OSCC is
the lack of knowledge relating to how genetic instability in oral cancer genomes affects
oral tumorigenesis. Objectives: This current study aimed to determine the copy number
alterations (CNAs) in OSCC using array comparative genomic hybridization (array
CGH) and to determine the expression of candidate genes. Putative candidate gene was
identified and further elucidated to explore its potential role(s) in oral tumorigenesis.
Materials and Methods: Genome-wide profiling was performed on 75 OSCCs using
array CGH. The copy number alterations (CNAs) associated genes that mapped to the
amplified and deleted regions were subjected to pathway and network functional
analysis using the Ingenuity Pathway Analysis software. The selected putative
amplified genes involved in oncogenic networks were further subjected to gene
expression analysis using qPCR. The protein expression of the selected putative
amplified genes was determined using immunohistochemistry (IHC) technique in the
non-cancer oral mucosa, oral epithelial dysplasia (OED) and OSCC samples.
Knockdown of the putative amplified gene was performed using small interfering RNA
(siRNA) technology in OSCC cell lines and the roles of the gene in cell proliferation,
apoptosis, migration and invasion were evaluated. Results: In this study, the frequent
CNAs were observed on multiple genomic regions, including amplifications on
chromosome 1p, 3q, 5p, 7p, 8q, 9q, 10p, 11q, and deletions on 3p and 8p. Apart from
that, this study also demonstrated the significant association between amplification of
chromosome 8q, 11q, 7p and 9p and deletion of 8p with clinico-pathological parameters
such as tumour size, lymph node metastasis (LNM) and tumour staging. This study also
identified novel candidate genes namely matrix metallopeptidase 13 (MMP13) and

iv
interferon stimulated gene 15 (ISG15) that linked between cell death and survival,
cellular movement and cellular development oncogenic network. Furthermore, this
study also demonstrated over-expression of MMP13 (chromosome 11q22.2) and ISG15
(chromosome 1p36.33) as prognostic markers in OSCC. Silencing of ISG15 in OSCC
cell lines decreased the tumour cell proliferation, migration, invasion, induced apoptosis
and increased the cisplatin sensitivity in oral tumourigenesis. Conclusion: This current
study has identified multiple CNAs including amplifications on chromosome 1p, 3q, 5p,
7p, 8q, 9q, 10p, 11q and deletions on 3p and 8p. This study also showed that
amplification of the chromosome 7p, 8q, 9p, 11q and genetic signature (+7p8q9p11q) as
well as deletion of chromosome 8p was associated with clinico-pathological parameters
and poor survival. Apart from that, through the network analysis, the putative amplified
genes namely ISG15 and MMP13 were found to be associated with the top oncogenic
network namely cell death and survival, cellular movement, cellular development
network signalling. This study also has demonstrated the over-expression of MMP13
and ISG15 were associated with lymph node metastasis, tumour staging and poor
prognosis. Through the siRNA knockdown of the ISG15 expression inhibited the
tumour cell proliferation, migration, invasion and induced cell death in oral
tumorigenesis.
v
ABSTRAK
Latar Belakang: Kanser mulut jenis karsinoma sel skuamus (OSCC) merupakan
penyakit yang sangat agresif dengan prognosis yang buruk. Kesulitan utama dalam
diagnosis dan rawatan OSCC adalah kekurangan pengetahuan berkaitan dengan
ketidakstabilan genetik dalam genom kanser mulut yang mempengaruhi perkembangan
kanser. Objektif: Tujuan kajian ini adalah untuk menentukan perubahan bilangan
salinan (CNAs) dalam OSCC dengan mengunakan tatasusunan penghibridan
tatasusunan genomik perbandingan (array CGH) dan untuk menyiasatkan
pengekspresan calon-calon gen dalam perkembangan kanser mulut. Bahan dan
kaedah: Pemprofilan genom dilakukan ke atas 75 sampel OSCC mengunakan array
CGH. Gen-gen yang terpeta dalam linkungan amplifikasi dan deletasi kemudiannya
dianalisis dengan menggunakan perisian Ingenuity Pathway Analysis. Bagi gen-gen
yang mengalami amplifikasi dan terlibat dalam rangkaian onkogenik kemudiannya
dinilai semula dengan menggunakan analisis pengeksperesi secara qPCR.
Pengekspresan protein bagi gen-gen tersebut kemudian dinilai dengan menggunakan
teknik imunohistokimia ke atas sampel-sampel mukosa yang jenis bukan kanser mulut,
displasia epitelium oral (OED) dan OSCC. Penyekatan (knockdown) gen yang dipilih
dijalankan dengan menggunakan teknologi siRNA ke atas titisan sel OSCC dan peranan
gen tersebut dalam proliferasi, apoptosis, migrasi dan invasi dinilaikan. Hasil kajian:
Dalam kajian ini, CNA yang kerap didapati dalam linkungan genomik berbilang
merangkumi amplifikasi pada kromosom 1p, 3q, 5p, 7p, 8q, 9q, 10p, 11q, dan deletasi
pada kromosom 3p dan 8p. Di samping itu, kajian ini juga menunjukkan perhubungan
signifikan di antara amplifikasi kromosom pada 8q, 11q, 7p dan 9p dan deletasi pada 8p
dengan parameter kliniko-patologi seperti saiz tumor, metastasis nodus limfa dan
peringkat tumor. Kajian ini juga menemui calon gen novel iaitu interferon stimulated

vi
gene 15 (ISG15) dan matriks metallopeptidase 13 (MMP13) yang mempunyai hubung
kait dengan kematian, kelangsungan sel, pergerakan sel dan perkembangan selular
dalam proses onkogenik. Selain daripada itu, kajian ini juga menunjukkan
pengekspresan berlebihan ISG15 (kromosom 1p36.33) dan MMP13 (kromosom
11q22.2), membolehkan kedua-dua gen ini dijadikan sebagai penanda prognostik untuk
OSCC. Penyekatan (silencing) ISG15 dalam titisan sel OSCC telah mengurangkan
proliferasi, migrasi, invasi sel kanser, malah ia mengaruhkan apoptosis dan
meningkatkan kepekaan sel-sel OSCC terhadap rawatan cisplatin dalam tumorigenesis.
Kesimpulan: Kajian ini telah mengenal pasti pelbagai CNA termasuk amplifikasi pada
kromosom 1p, 3q, 5p, 7p, 8q, 9q, 10p, 11q dan deletasi pada 3p dan 8p. Kajian ini juga
menunjukkan amplifikasi pada kromosom 7p, 8q, 9p, 11q dan pengenalan genetik
(+7p8q9p11q) serta deletasi pada kromosom 8p berhubung kait dengan parameter
kliniko-patologi dan prognosis yang buruk. Selain itu, kajian ini juga telah mengenal
pasti pelbagai laluan biologi, fungsi dan rangkaian biologi yang memainkan peranan
penting dalam tumorigenesis. Melalui analisis rangkaian, gen ISG15 dan MMP13 yang
teramplifikasi mempunyai hubungan dengan puncak rangkaian onkogenik iaitu
kematian dan kelangsungan sel, pergerakan sel, perkembangan sel dalam rangkaian
signal. Hasil kajian ini juga menunjukkan pengekspresan berlebihan MMP13 dan
ISG15 berhubungkait dengan metastasis nodus limfa, peingkat tumor dan prognosis
yang buruk. Melalui penyekatan siRNA pada pengekspresan ISG15, ianya telah
menghalang proses proliferasi, migrasi, invasi sel tumour, dan malah ia mengaruhkan
kematian sel dalam perkembangan kanser mulut.

vii
ACKNOWLEDGEMENTS
Writing a thesis is long and arduous with extensive research and the process of
earning a doctorate is certainly not easy and immeasurable. First and foremost thanks to
God for the strengths and His blessings, grace and wisdom that have enabled me to
complete this thesis successfully.
My deepest appreciation and gratitude to Prof Dr. Rosnah Binti Zain and Prof Dr.
Cheong Sok Ching, for their supervision and constant support, advice, guidance,
valuable comments, suggestions and provisions that benefited me in the completion and
success of this study. Sharing in their knowledge has helped me in the experimental
design for this study.
Many thanks to the Head of Oral Cancer Research and Coordinating Center
(OCRCC), Assoc. Prof Dr. Jennifer Geraldine Doss and former head, Prof Dr. Rosnah
Binti Zain, for allowing me to extract data and samples from Malaysia Oral Cancer
Database and Tissue Bank System (MOCDTBS). I am fortunate enough to get the
assistance and persistent help from the experienced research officers, Puan Wan Maria
Nabillah Binti Wan Abd Ghani and Puan Karen Ng Lee Peng during my Ph.D. journey.
I am indebted to all OCRCC members and fellow colleagues, Helen-Ng, Lee Chia
Ee, Suzzane, Carmen, Wong Gou Rean, Zachary Yong, Li Ann, Rohinee, Anis, Sutha,
Yin Ling, Puan Sutati Ginen (Mak Su), Judy, Margaret, Oral Pathology Diagnostic and
Research Laboratory staffs especially Puan Rusnani Bt Kamal Puan Siti Nurull Huda Bt
Ariffin En. Richee Rudeen Bin Yasib Pn. Nor Hasilah Bt Mokhtar, Mrs Khoo Koi Sim,
Mr Siew Koi Kheong as well as Craniofacial and Molecular Biology Research
Laboratory especially Puan Junaidah and Puan Intan for their kind assistance and

viii
endless supports. Apart from that, I also would like to thank University of Malaya for
providing the first class quality of lab instruments and facilities.
I would also like to thank my lab colleagues, Sathya Narayanan and Nareshwaran
Gnanasegaran for their technical guidance and advise in terms of cell culture work and
staying back in the wee hours when the lab lights were off. I will treasure the times we
had together while working in the lab.
I would like to express my appreciation to Assoc. Prof. Dr. Thomas George and Dr.
Anand Ramanathan for their clinical expertise in oral pathology work by mentoring my
results and their early insights which contributed to my thesis preparation.
Last but not least, my deepest heartfelt gratitude to my mom, my siblings, nephews
for their endless love, prayers towards me during times of triumph and melancholy have
been a source of encouragement for me for the whole course of this study. Also not
forgetting my beloved partner Prof Dr. Duleep Deosthale for the love, care and value to
me only grow with age. To those who indirectly contributed this research means a lot to
me. Thank you very much.
I am grateful to Ministry of Higher Education (MOHE) Malaysia High Impact
Research Grant (UM.C/625/1/HIR/MOHE/DENT/08) and Bright Sparks Scheme for
the financial assistance provided during my study.
ix
TABLE OF CONTENTS
ABSTRACT .................................................................................................................. III
ABSTRAK ...................................................................................................................... V
ACKNOWLEDGEMENTS ....................................................................................... VII
TABLE OF CONTENTS ............................................................................................. IX
LIST OF FIGURES ................................................................................................... XIV
LIST OF TABLES ..................................................................................................... XVI
LIST OF SYMBOLS AND ABBREVIATIONS .................................................. XVIII
LIST OF APPENDICES ........................................................................................ XXIV
CHAPTER 1: INTRODUCTION .................................................................................. 1
1.1 Introduction ............................................................................................................. 1
1.2 Aims .................................................................................................................... 6
1.3 Specific objectives ................................................................................................... 6
LITERATURE REVIEW ...................................................................... 7 CHAPTER 2:
2.1 Oral cancer ............................................................................................................... 7
2.1.1 Definition of oral cancer ......................................................................... 7
2.2 Epidemiology of oral cancer.................................................................................... 8
2.2.1 Incidence, mortality and survival ............................................................ 8
2.2.2 Gender, ethnic and age distribution ........................................................ 9
2.3 Clinical and histopathological spectrum of oral potentially malignant disorders
(OPMDs) ............................................................................................................... 11
2.3.1 Clinical appearance of OPMDs and oral cancer ................................... 11
2.3.2 Histological appearance of OED and OSCC ........................................ 13
2.4 Etiological factors .................................................................................................. 14
2.4.1 Smokeless and smoking tobacco .......................................................... 14
2.4.2 Excessive alcohol consumption ............................................................ 15

x
2.4.3 Betel quid chewing ............................................................................... 16
2.4.4 Human Papillomaviruses Virus (HPV) ................................................. 17
2.4.5 Genetic susceptibility ............................................................................ 18
2.4.6 Diet and nutrition .................................................................................. 19
2.4.7 Mouthwash ............................................................................................ 20
2.5 Prognostic factors .................................................................................................. 21
2.5.1 TNM staging ......................................................................................... 22
2.5.2 Tumour sizes ......................................................................................... 25
2.5.3 Lymph node status ................................................................................ 26
2.5.4 Primary tumour site ............................................................................... 27
2.5.5 Histological grading .............................................................................. 28
2.5.6 Pattern of invasion ................................................................................ 29
2.6 Oral cancer management ....................................................................................... 30
2.6.1 Treatment of early stage oral cancer ..................................................... 30
2.6.2 Treatment of advanced oral cancer ....................................................... 31
2.6.3 Molecular targeted gene therapy in OSCC ........................................... 33
2.7 Carcinogenesis ....................................................................................................... 35
2.7.1 Oncogene and tumour suppressor gene ................................................ 36
2.7.1.1 Oncogenes ................................................................. 37
2.7.1.2 Tumour suppressor genes .......................................... 38
2.8 Hallmarks of cancer ............................................................................................... 40
2.8.1 Self-sufficiency of growth signals ........................................................ 40
2.8.2 Insensitivity of growth-inhibitory signals ............................................. 41
2.8.3 Evasion of programmed cell death........................................................ 42
2.8.4 Immortality or unlimited replicative potential ...................................... 42
2.8.5 Sustained angiogenesis ......................................................................... 43
2.8.6 Tissue invasion and metastasis ............................................................. 43
2.8.7 Reprogramming energy metabolism ..................................................... 44
2.8.8 Evading immune destruction ................................................................ 45
2.9 Genetic Instability ................................................................................................. 45
2.9.1 Chromosomal instability ....................................................................... 46
2.9.2 Driver and passenger mutation ............................................................. 47

xi
2.10 Model of OSCC ..................................................................................................... 49
2.11 “Omic” profiling .................................................................................................... 53
2.11.1 Array CGH ............................................................................................ 54
2.11.2 OSCC associated CNAs ........................................................................ 55
METHODOLOGY ............................................................................... 62 CHAPTER 3:
3.1 Study design .......................................................................................................... 62
3.2 Sample types .......................................................................................................... 64
3.3 Sample selection criteria ........................................................................................ 65
3.4 Laboratory procedures ........................................................................................... 66
3.4.1 DNA and RNA extraction from tissue samples .................................... 66
3.4.2 Array CGH ............................................................................................ 67
3.4.3 Functional analysis ................................................................................ 69
3.4.4 Copy number analysis by the TaqMan PCR assay ............................... 70
3.4.5 Real time quantitative PCR assay for gene expression ......................... 71
3.4.6 Tissue microarray .................................................................................. 72
3.4.7 Immunohistochemistry and scoring system .......................................... 72
3.4.7.1 Immunohistochemistry staining ................................ 72
3.4.7.2 Scoring of immunohistologically stained samples .... 73
3.4.7.3 Selection of cut-off score for ISG15 and MMP13
protein expression ..................................................... 74
3.5 Cell culture and siRNA transfection ...................................................................... 75
3.6 Protein extraction and western blot analysis ......................................................... 76
3.7 In vitro functional assay ........................................................................................ 77
3.7.1 Cell proliferation assay using MTT assay............................................. 77
3.7.2 Cell proliferation assay using impedance measurement with the
xCELLigence System ....................................................................... 77
3.7.3 Cisplatin sensitivity assay ..................................................................... 78
3.7.4 Apoptosis detection using Caspase-3/7 ................................................ 79
3.7.5 Wound healing assay ............................................................................ 80
3.7.6 Transwell migration assay .................................................................... 81
3.7.7 Transwell invasion assay ...................................................................... 82

xii
3.8 Statistical analysis ................................................................................................. 83
RESULTS ............................................................................................. 84 CHAPTER 4:
4.1 Copy number alterations (CNAs) .......................................................................... 84
4.1.1 Association of the copy number alterations with clinico-pathological
parameters ......................................................................................... 85
4.1.2 Association of the copy number alterations with survival .................... 92
4.1.3 TaqMan copy number assay of LRP12, TPM2, EGFR, FSCN1,
CCND1, CLPTM1L, CHL1 and CSMD1 ...................................... 102
4.2 Biological process analysis .................................................................................. 107
4.3 Copy number, mRNA and protein expression of candidate genes in OSCC ...... 116
4.3.1 MMP13 ............................................................................................... 116
4.3.1.1 MMP13 gene copy number, mRNA and protein
expression in OSCC ................................................ 116
4.3.1.2 Association of MMP13 mRNA expression with
clinico-pathologic parameters and survival ............ 119
4.3.1.3 Definition of Cut-off Score for MMP13 protein
expression in OSCC ................................................ 122
4.3.1.4 Association of MMP13 protein expression (IHC)
with clinico-pathologic parameters and survival .... 123
4.3.2 ISG15 ................................................................................................. 127
4.3.2.1 ISG15 gene copy number, mRNA and protein
expression in OSCC ................................................ 127
4.3.2.2 Association of ISG15 mRNA expression with
clinico-pathologic parameters and survival ............ 130
4.3.2.3 Definition of cut-off score for ISG15 protein
expression in OSCC ................................................ 130
4.3.2.4 Association of ISG15 protein expression with
clinico-pathologic parameters and survival ............ 131
4.4 Roles of a putative cancer gene using RNA interference (RNAi) technique in
OSCC cell lines model ........................................................................................ 136
4.4.1 Knockdown of ISG15 in oral cancer cell line ORL-48T, ORL-188T
and ORL-204T ................................................................................ 136
4.4.2 In vitro functional assays to determine the effects of ISG15
expression in oral cancer cells ........................................................ 138
4.4.2.1 The role of ISG15 in cell proliferation .................... 138
4.4.2.2 Effect of the combination of chemotherapeutic agent
with ISG15 silencing on Caspase 3/7 activation ..... 140

xiii
4.4.2.3 Effect of ISG15 on cell migration and invasion...... 142
DISCUSSION ..................................................................................... 145 CHAPTER 5:
5.1 Determining and validating the CNAs of OSCC using array CGH and qPCR
copy number assay .............................................................................................. 145
5.1.1 Copy number alterations of OSCC identified using array CGH ......... 145
5.1.2 TaqMan copy number assay of LRP12, TPM2, EGFR, FSCN1,
CCND1, CLPTM1L, CHL1 and CSMD1 ...................................... 154
5.2 Determining pathways and networks implicated in OSCC pathogenesis ........... 155
5.3 Identifying and determining the mRNA and protein expression of candidate
gene and their correlation with clinical and socio-demographic parameters and
as survival of patients .......................................................................................... 159
5.3.1 Matrix Metallopeptidase 13 (MMP13) ............................................... 159
5.4 Investigating the functional roles of a putative cancer gene using RNAi
technique in OSCC cell lines model .................................................................... 161
5.4.1 Interferon Stimulated Gene (ISG15) ................................................... 161
CONCLUSIONS ................................................................................ 168 CHAPTER 6:
6.1 Summary and conclusion of study ...................................................................... 168
6.2 Study limitations and recommendations ............................................................. 170
REFERENCES ............................................................................................................ 173
LIST OF PUBLICATIONS AND PAPERS PRESENTED .................................... 202
APPENDIX .................................................................................................................. 204

xiv
LIST OF FIGURES
Figure 2.1: Hypothetical model of oral carcinogenesis. ................................................. 52
Figure 3.1: Project workflow. ......................................................................................... 63
Figure 4.1: The ideogram of amplifications and deletions and the association with
clinico-pathological parameters identified in this study using array CGH. ................... 91
Figure 4.2: Overall survival curves for amplification chr 7p, 8q, 11q, 9p, (7p8q11q9p)
and deletion of chr 8p using Kaplan-Meier estimate with log-rank test. ........................ 92
Figure 4.3: Copy number analysis for LRP12 (chr 8q), CCND1 (chr 11q), TPM2 (chr
9p), FSCN1 (chr 7p), EGFR (chr 7p), CLPTM1L (chr 5p) and deletion of CHL1 (chr
3p) and CSMD1 (chr 8p) using qPCR .......................................................................... 104
Figure 4.4: Overall survival curves were analyzed according to the 4 combined genetic
marker (EGFR+CCND1+TPM2+LRP12) using Kaplan-Meier estimate with log-rank
test. ................................................................................................................................ 105
Figure 4.5: The top significant network was related to cell death and survival, cellular
movement, cellular development. ................................................................................. 115
Figure 4.6: MMP13 mRNA expression ........................................................................ 117
Figure 4.7: MMP13 protein expression ........................................................................ 118
Figure 4.8: Overall survival curves were analyzed according to MMP13 mRNA
expression using Kaplan-Meier estimate with log-rank test. ........................................ 120
Figure 4.9: Overall survival curves were analyzed according to MMP13 protein
expression (IHC) using Kaplan-Meier estimate with log-rank test. ............................. 125
Figure 4.10: ISG15 mRNA expression ......................................................................... 128
Figure 4.11: ISG15 protein expression ......................................................................... 129
Figure 4.12: Overall survival curves were analyzed according to ISG15 protein
expression using Kaplan-Meier estimate with log-rank test. ........................................ 132
Figure 4.13: Western blot analysis of effect siRNA on ISG15 protein expression in
ORL-48T, ORL-188T and ORL-204T OSCC cells compared with non-targeting
negative control siRNA. ................................................................................................ 137
Figure 4.14: Effect of ISG15 on proliferation of OSCC cells. ..................................... 139

xv
Figure 4.15: Effect of ISG15 silencing with cisplatin treatment on cell viability and
caspase 3/7 activation of OSCC cells. .......................................................................... 141
Figure 4.16: Effect of ISG15 on migration of OSCC cells using wound healing assay.
....................................................................................................................................... 143
Figure 4.17: Effect of ISG15 on migration and invasion of OSCC cells using Transwell
migration and invasion assays. ..................................................................................... 144

xvi
LIST OF TABLES
Table 2.1: Details of the clinical TNM staging system of oral cancer............................ 24
Table 2.2: Frequent CNAs (amplifications and deletions) in OSCC. ............................. 59
Table 4.1: The socio-demographical and clinico-pathological parameters of the 75
OSCCs that involved in array CGH study. ..................................................................... 86
Table 4.2: The amplified and deleted regions detected in 75 OSCC samples. ............... 87
Table 4.3: Association of chromosome 7p, 8q, 9p, 11q, 8p and the combination of
chromosome 7p, 8q, 9p, 11q with clinico-pathological parameters in OSCC. ............... 89
Table 4.4: Multivariate Cox regression model analysis of chromosome 8q in OSCC
overall survival. ............................................................................................................... 96
Table 4.5: Multivariate Cox regression model analysis of chromosome 11q in OSCC
overall survival. ............................................................................................................... 97
Table 4.6: Multivariate Cox regression model analysis of chromosome 9p in OSCC
overall survival. ............................................................................................................... 98
Table 4.7: Multivariate Cox regression model analysis of chromosome 7p in OSCC
overall survival. ............................................................................................................... 99
Table 4.8: Multivariate Cox regression model analysis of chromosome 8p in OSCC
overall survival. ............................................................................................................. 100
Table 4.9: Multivariate Cox regression model analysis of the combination of
chromosome 7p, 8q, 9p and 11q in OSCC overall survival. ......................................... 101
Table 4.10: Multivariate Cox regression model analysis of four combined genetic
marker consisting of EGFR, TPM2, CCND1 and LRP12 in OSCC overall survival... 106
Table 4.11: Top significant pathways that associated with CNAs associated genes .... 108
Table 4.12: Top significant molecular and cellular functions associated with CNAs
associated genes. ........................................................................................................... 110
Table 4.13: Top significant networks and the associated network functions that linked
with CNAs associated genes. ........................................................................................ 114
Table 4.14: Multivariate Cox regression model analysis of MMP13 mRNA expression
in OSCC overall survival. ............................................................................................. 121

xvii
Table 4.15: Area under the receiver operating characteristic curve (AUC) of MMP13
for each clinico-pathological feature............................................................................. 122
Table 4.16: Association of MMP13 protein expression (IHC) with clinico-pathological
parameters. .................................................................................................................... 124
Table 4.17: Multivariate Cox regression model analysis of MMP13 protein expression
in OSCC overall survival. ............................................................................................. 126
Table 4.18: Area under the receiver operating characteristic curve (AUC) of ISG15 for
each clinico-pathological feature. ................................................................................. 130
Table 4.19: Association of ISG15 protein expression with clinico-pathological
parameters. .................................................................................................................... 133
Table 4.20: Multivariate Cox regression model analysis of ISG15 protein expression in
OSCC overall survival. ................................................................................................. 134

xviii
LIST OF SYMBOLS AND ABBREVIATIONS
: Infinity
% : Percentage
< : Less than
= : equal
> : More than
≤ : Less than or equal
≥ : More than or equal
2-ΔΔCT : 2 delta delta cycle threshold
ANOI : Anoctamin 1
ASR : age standardized rate
AUC : area under curve
AURKA : aurora kinase A
BCL-2 : B-cell lymphoma 2
BIRC2 : baculoviral IAP repeat containing 2
BRCA : Breast Cancer 1, Early Onset
CA9 : carbonic anhydrase IX
CCND1 : Cyclin D1
CCNL1 : Cyclin L1
CDK : cyclin-dependent kinase
CDKN2A : cyclin-dependent kinase inhibitor 2A
cDNA : Complementary Deoxyribonucleic Acid
CGH : comparative genomic hybridization
CHL1 : Cell Adhesion Molecule L1
CIN : Chromosomal instability

xix
CLPTM1L : Cleft lip and palate transmembrane protein 1
cm : centimeter
CNA : Copy number alteration
COX-2 : cyclooxygenase-2
CSMD1 : CUB And Sushi Multiple Domains 1
CT : computerized tomography
CTHRC1 : Collagen triple helix repeat containing 1
CTTN : cortactin
DCTN3 : dynactin subunit 3
DMEM : Dulbecco's Modified Eagle Medium
DNA : Deoxyribonucleic Acid
ECM : Extracellular matrix
EGFR : Epidermal growth factor receptor
EMT : epithelial mesenchyme transition
FADD : Fas-Associated protein with Death Domain
FBS : Fetal bovine serum
FFPE : formalin fixed paraffin embedded
FGF : Fibroblast growth factors
FHIT : Fragile Histidine Triad
FOM : Floor of mouth
FOS : FBJ Murine Osteosarcoma Viral Oncogene Homolog
FSCN1 : Fascin 1
gDNA : Genomic Deoxyribonucleic Acid
GST : glutathione S-transferases
H&E : haematoxylin and eosin
HCl : Hydrochloric acid

xx
Hg19/GRCh37 : Human genome 19/ Genome Reference Consortium 37
HNSCC : Head and neck squamous cell carcinoma
HPV : Human Papillomaviruses Virus
HRR : Hazard risk ratio
h-TERT : Human telomerase reverse transcriptase
i.e : id est
IARC : International Agency for Research on Cancer
ICD : International Classification of Diseases
ICGC : International Cancer Genome Consortium
IFG : invasive front grading
IHC : Immunohistochemistry
ISG15 : Interferon stimulated gene 15
Jak : Janus kinase
kDa : kilodalton
LNM : Lymph node metastasis
LOH : loss of heterozygosity
LRP12 : Low Density Lipoprotein Receptor-Related Protein 12
LY6K : Lymphocyte Antigen 6 Complex, Locus K
mA : milliampere
MAPK : mitogen-activated protein kinase
mm : milimeter
mM : milimolar
MMP13 : Matrix metallopeptidase 13
MNCR : Malaysia National Cancer Registry
MRI : magnetic resonance imaging
mRNA : Messenger Ribonucleic acid

xxi
mTOR : mechanistic target of rapamycin
MTT : 3-[4,5-dimethylthiazol-2-yl]-2,5-diphenyl-tetrazolium
bromide
MUC13 : Mucin 13
myc : myelocytomatosis
N- : Negative node
N+ : Positive node
NF-κB : nuclear factor kappa-light-chain
ng/μl : Nanogram per microliter
nM : nonomolar
nm : nanometer
NNK : 4-(methylnitrosoamino)-1-(3-pyridyl)-1 butanone
NNN : nitroso-nor-nicotine
º : Degree
OED : oral epithelial dysplasia
OPMD : oral potentially malignant disorders
ORAOV1 : Oral Cancer Overexpressed 1
OSCC : Oral squamous cell carcinoma
p : Long arm
P53 : Protein 53
P63 : Protein 63
PAH : polycyclic aromatic hydrocarbons
PBST : phosphate-buffered saline and Tween 20
PI3K : phosphatidylinositol 3-kinase
PKC : protein kinase C
PPARγ : peroxisome proliferator-activated receptor gamma

xxii
PR : progesterone receptor
PTK2 : protein tyrosine kinase 2
PVDF : Polyvinylidene fluoride
q : Short arm
qPCR : Quantitative polymerase chain reaction.
RAS : rat sarcoma viral oncogene homolog
RB1 : retinoblastoma 1
RELA : V-Rel Avian Reticuloendotheliosis Viral Oncogene Homolog A
RIN : Ribonucleic acid integrity number
RIPA : Radioimmunoprecipitation assay
RNAi : RNA interference
ROC : Receiver operating characteristic
ROS : reactive oxygen species
rpm : Revolutions per minute
RQ : Relative quantification
rRNA : Ribosomal Ribonucleic acid
SDS PAGE : sodium dodecyl sulfate polyacrylamide gel electrophoresis
siRNA : small interfering RNA
SKIL : SKI-like proto-oncogene
ß : Beta
STAT : signal transducer and activator of transcription
STOML2 : stomatin like 2
TBST : Tris-Buffered Saline and Tween 20
TCGA : The cancer genome atlas
TGF-ß : Transforming growth factor beta
TMA : Tissue microarray

xxiii
TNM : Tumour node metastasis classification system
TPM2 : Tropomyosin 2
TSG : Tumour suppressor gene
UICC : Union for International Cancer Control
USA : United States of America
VCP : Valosin Containing Protein
VEGF : Vascular endothelial growth factor
volt : voltage
WHO : World Health Organization
YAP1 : Yes associated protein 1
µg : microgram
μg/ml : Microgram per mililiter
μl : microliter
μM : micromolar
xxiv
LIST OF APPENDICES
APPENDIX A: DETAIL OF DNEASY BLOOD AND TISSUE KIT EXTRACTION
(QIAGEN GMBH GERMANY) PROTOCOL
APPENDIX B: DETAIL OF RNEASY MINI KIT EXTRACTION (QIAGEN GMBH
GERMANY) PROTOCOL
APPENDIX C: CLINICO-PATHOLOGICAL PARAMETERS AND SOCIO-
DEMOGRAPHIC DATA OF THE 75 PATIENTS FOR ARRAY CGH STUDY
APPENDIX D: CLINICO-PATHOLOGICAL PARAMETERS AND SOCIO-
DEMOGRAPHIC DATA OF THE 66 PATIENTS FOR TAQMAN PCR ASSAY
APPENDIX E: CLINICO-PATHOLOGICAL PARAMETERS AND SOCIO-
DEMOGRAPHIC DATA OF THE 68 PATIENTS FOR MMP13 GENE EXPRESSION
QPCR STUDY
APPENDIX F: CLINICO-PATHOLOGICAL PARAMETERS AND SOCIO-
DEMOGRAPHIC DATA OF THE 68 PATIENTS FOR ISG15 GENE EXPRESSION
QPCR STUDY
APPENDIX G: DETAIL OF REVERSE TRANSCRIPTION CDNA SYNTHESIS
PROTOCOL
APPENDIX H: CLINICO-PATHOLOGICAL PARAMETERS AND SOCIO-
DEMOGRAPHIC DATA OF THE OSCC PATIENTS FOR MMP13 PROTEIN
EXPRESSION IHC STUDY
APPENDIX I: CLINICO-PATHOLOGICAL PARAMETERS AND SOCIO-
DEMOGRAPHIC DATA OF THE OSCC PATIENTS FOR ISG15 PROTEIN
EXPRESSION IHC STUDY

xxv
APPENDIX J: DEMOGRAPHICS AND CLINICO-PATHOLOGICAL
CHARACTERISTICS OF PATIENTS FROM WHICH THE CELL LINES USED IN
THIS STUDY WERE DERIVED.
APPENDIX K: ASSOCIATION OF ISG15 MRNA EXPRESSION WITH SOCIO-
DEMOGRAPHIC AND CLINICO-PATHOLOGICAL PARAMETERS
APPENDIX L: ASSOCIATION OF ISG15 MRNA EXPRESSION WITH SURVIVAL
IN OSCC PATIENT

1
CHAPTER 1: INTRODUCTION
1.1 Introduction
Oral cancer (including lip) is the 15th most common cancer worldwide, with an
estimated 300,000 new cases in 2012 (2.1% of the total cancer cases globally), and the
14th most common cause of death from cancer with an estimated 145,000 deaths (1.8%
of the total death due to globally) (Ferlay et al., 2015). More than 90% of oral cancers
are oral squamous cell carcinoma (OSCC) and is known to develop at various
anatomical subsites which include lip (C00), tongue (C01-02), gum (C03), floor of the
mouth (C04), palate (C05) and other and unspecified parts of the mouth (C06) (Neville
& Day, 2002). The established risk factors for OSCC are tobacco smoking, alcohol
consumption and betel quid chewing (Warnakulasuriya, 2009a). Despite the advances in
diagnosis and therapeutic approaches in this lethal disease, the mortality and morbidity
rates have not improved over the past decades (Silverman, 2001). The lack of
improvement in patient clinical outcomes indicates the lack of knowledge relating to
how genetic instability in oral cancer genomes affects oral carcinogenesis (Choi &
Myers, 2008; Viet & Schmidt, 2010).
In the year 2007, oral cancer was ranked as the 21st most common cancer in
Malaysia (National Cancer Registry Report Malaysia Cancer Statistics) (Omar &
Tamin, 2011). Although oral cancer is not amongst the top ten cancers in Malaysia, it
was ranked the 3rd most common cancer amongst males [age standardized rate (ASR) =
5.6] and females (ASR = 10.0) of Indian origin. Apart from that, a study conducted on
oral cancer patients in Malaysia found that, among those patients, more than 70% of
them are diagnosed in their advanced stage with poor survival (data from Malaysian

2
Oral Cancer Database and Tumour Bank System). Moreover, extensive studies have
been reported regarding the significant difference between clinical outcomes with
different stages of oral cancer and thus revealing the molecular heterogeneity (Mendez
et al., 2009). Therefore, additional predictors and biomarkers are being extensively
investigated with newer technologies such as microarray with an aim for better patient
management and for the provision of other treatment modalities such as radiotherapy
and chemotherapy (Ludwig & Weinstein, 2005; Mishra & Verma, 2010).
In the past, the conventional cytogenetic method such as karyotyping is the ideal
technique to identify chromosomal aberrations in genetic disorders (Mitelman et al.,
1997). However, the completion of the human genome project in 2011 has enabled the
development of new molecular cytogenetic technique namely array based comparative
genomic hybridization (array CGH) that could detect the aberrations within the entire
genome in a single rapid assay (Nagaraj, 2009). The emergence of this high throughput
technology helps to overcome the limitation of the resolution associated with the
conventional karyotyping method in diagnosis (Lockwood et al., 2006). For example,
the Cancer Genome Atlas (TCGA) (TCGA, 2015) research network and other cancer
genome consortiums, such as the International Cancer Genome Consortium (ICGC)
(ICGC, 2013), have created large amounts of array and sequencing data at multiple
levels for a large number of human cancers. This gives a great opportunity to study the
differences and commonalities systematically across different cancer types. These 2
consortiums (India Project Team of the ICGC and TCGA) had identified common
mutations in TP53, NOTCH1, CASP8, FAT1, CDKN2A and HRAS in the head and
neck cancer (ICGC, 2013; TCGA, 2015). These DNA mutations provide
comprehensive set of mutational landscape in the head and neck tumorigenesis and to

3
promote the discovery of cancer targets, drugs and therapeutic strategies, clinical tests
and biomarker development in this cancer.
Oral carcinogenesis is a complex process which results from a multistep pathway
involving the accumulation of genetic and copy number alterations (Choi & Myers,
2008). The copy number alterations in terms of amplification and deletions could result
in activation of proto-oncogenes and inactivation of tumour suppressor genes (TSGs)
that would eventually lead to tumour progression (Pinkel & Albertson, 2005).
Development of the genomic profiling analysis emerges as an advance tool to discover
potential biomarkers with a clinical value that linked with predictive, prognostic and
diagnostic approaches (Ludwig & Weinstein, 2005; Dienstmann et al., 2015). The
pattern of CNAs as biomarkers give remarkable significance due to their great impact
related with diseases and personalized medicine (Ludwig & Weinstein, 2005).
Therefore, the identification of the effective biomarkers for prognosis and diagnosis is
an early step in the plan for molecular sub-classification that underlies the
pathophysiology of the disease. These specific molecular classifications may have the
potential to predict the early stages of the diseases and for the decision making in
patient’s treatment (prognosis) and personalized medicine (targeted gene therapy)
(Ludwig & Weinstein, 2005). The advancement of array CGH enables the identification
of candidate CNAs associated genes that could be implicated in tumourigenesis
(Lockwood et al., 2006). Apart from that, high resolution array CGH such as
oligonucleotide platform enables to detect micro-CNAs as compared to lower resolution
array CGH (Przybytkowski et al., 2011). To date, the application of array CGH for
identifying Deoxyribonucleic acid (DNA) aberrations has been carried out in oral
cancer in order to provide insight into the process of oral tumourigenesis (Viet &
Schmidt, 2010). However, the genomic profiles of oral cancer are often diverse due to
the influence of various risk factors and ethnicity (Ambatipudi et al., 2011).
4
To date, conventional treatments for OSCC include surgery, radiotherapy and
chemotherapy. Surgery combined with chemotherapy (cisplatin) and radiotherapy can
improve overall survival especially in advanced oral cancer patients (da Silva et al.,
2012). However, this surgical management often led to severe morbidity due to the
disfiguring and functional side effects (Furness et al., 2011). Novel therapeutic
alternatives to standard therapy need to be established to improve the prognosis for
patients with advanced oral cancer. With the evolvement of RNA interference (RNAi)
therapy, one of the molecular targeted therapies approach, it can efficiently overcome
some of the major adversities thus associated with the treatment methodologies as
RNAi directly targets the cancerous cells at molecular scale (Resnier et al., 2013). By
understanding the mechanisms by which RNAi regulates gene expression, this powerful
tool can be exploited as an adjunct to the multimodality therapy of various cancers
including oral cancer. Research on small interfering RNA (siRNA) demonstrated that
combination of the siRNA-directed gene silencing with cisplatin constitutes a valuable
and safe approach for the treatment of solid tumours.
It is widely accepted that CNAs are major drivers of genetic instability in cancer
(Negrini et al., 2010). The amplification and deletion of chromosomes in cancer can
involve the activation or inactivation of oncogenes and tumour suppressor genes,
respectively (Pinkel & Albertson, 2005). Therefore, precise mapping of amplified and
deleted regions could enable identification of candidate oncogenes and tumour
suppressor genes, respectively, that could be responsible for tumour growth (Albertson,
2006). It has been revealed that gene amplification is one way to identify novel
oncogenes as it represents selection for expression of gene(s) that promote growth of
the tumor (Snijders et al., 2005). Hence, genes mapping within amplicons are candidate
oncogenes. On top of that, genome-wide profiling can also be done via high throughput
5
array CGH to detect even small amplicons that that are particularly informative for
identifying candidate oncogenes or pathways (or both). Furthermore, it has been
hypothesized that even rarely occurring amplicons would be informative regarding
genes crucial in tumor development as the expression may be altered by either copy
number changes or other mechanisms by disrupting the upstream or downstream genes
in different mechanisms that control a particular pathway (Snijders et al., 2005). Thus,
gene mapping in amplicons narrows down the candidate pathways likely to be
deregulated in tumors. Furthermore, this approach makes use of identifying the
candidate pathways by selection through the regions amplified in cancer rather than
focusing on definitive identification of the driver genes for particular amplicons.
(Snijders et al., 2005). Nevertheless, further works are required to investigate the
function of the candidate oncogene in promoting tumor formation for confirmation.
Among the genetic alterations, CNAs can be found in almost all human malignancies.
Several attempts have been made to identify CNAs by searching for new genes that are
causative for oral tumourigenesis. In fact, frequent copy number amplification at
chromosomes 5p, 14q, 11q, 7p, 17q, 20q, 8q and 3q and frequent copy number deletions
at 3p, 8p, 6p, 18q and 4q have been identified in OSCC using array CGH (Ambatipudi
et al., 2011; Uchida et al., 2011; Chen et al., 2015; Vincent-Chong et al., 2016).
However, the roles of these CNAs in the pathogenesis of OSCC have yet to be
elucidated.
Given these facts, the purpose of the current study was to identify novel OSCC
related genes by investigating CNAs in the whole genome using array CGH, and by
focusing on specific genes included in the CNA region. Furthermore, by performing
functional assays of the identified genes, this study aimed to elucidate the role of the
6
genes in the pathogenesis and progression of OSCC, and to clarify whether the genes
have the potential to be new therapeutic targets.
1.2 Aims
The aim of this study was to determine CNAs in OSCC using array CGH and to
determine the expression of candidate genes. Putative candidate gene was identified and
further elucidated to explore its potential role(s) in oral tumourigenesis.
1.3 Specific objectives
The specific objectives of this study are:
1. To determine and validate the copy number alterations (CNAs) of OSCC using
array based comparative genomic hybridization and qPCR copy number assay.
2. To identify the pathways and networks implicated in OSCC pathogenesis.
3. To identify and determine the mRNA and protein expression of candidate genes
and their correlation with clinical and socio-demographic parameters as well as
survival of patients.
4. To investigate the functional roles of a putative cancer gene using RNAi
technique in OSCC cell lines model

7
LITERATURE REVIEW CHAPTER 2:
2.1 Oral cancer
2.1.1 Definition of oral cancer
World Health Organization (WHO) has documented cancer as a group of disease in
which the cells grow uncontrollably and are able to invade to other parts of the body and
eventually leading to metastasis (http://www.who.int/topics/cancer/en/). According to
National Cancer Institute, any cancer occurring within the oral cavity is known as oral
cancer (http://www.ncbi.nlm.nih.gov/pubmedhealth/PMH0002030/). The World Health
Organizations (WHO) International Classification of Disease 10th
Revision (ICD-10)
Version 2007 has classified the sub-site of oral cancer based on the coding system which
comprises of the lip (C00), other and unspecified parts of tongue (C02), gum (C03), floor
of mouth (C04), palate (C05) and other and unspecified parts of the mouth (C06) (Johnson
2003).

8
2.2 Epidemiology of oral cancer
2.2.1 Incidence, mortality and survival
Oral cancer (including lip) is ranked as the 15th
most common malignancy in the world
(Ferlay et al., 2015). There were 300,000 new cases of oral cancer and 145,000 deaths
worldwide in 2012 according to Global Burden of Cancer (GLOBACAN) (Ferlay et al.,
2015). In United States of America, oral cancers accounted for 49,200 cases and 12,800
deaths, representing almost 0.3% of all cancer (Ferlay et al., 2015), whereas 61,400 new
cases of oral cancers were reported in European Union countries (Ferlay et al., 2015).
Developing countries account for almost two-thirds of total oral cancer cases and account
for an average of 112,000 deaths (Ferlay et al., 2015). Areas characterized by high incident
cases for oral cancer are found in Asia, especially South-Central Asia (Sri Lanka, India,
Pakistan), followed by Eastern Asia, specifically Taiwan. Incidence is also high in parts of
Europe especially in the Central and Eastern Europe (Hungary, Slovakia and Slovenia) and
Western Europe (France). Within The Americas, approximately 18,9000 cases of oral
cancer were reported in Northern of America, whereas 10,100 cases were reported from
South America (Warnakulasuriya, 2014b; Ferlay et al., 2015). In the United States, five-
year oral cancer survival have been improved from 2011 (11%) to 2006 (65%) (Howlader
et al., 2010). This is followed by Europe where the five-year oral cancer survival is
approximately 50 % (Sant et al., 2009). In other countries such as India, China, the
Republic of Korea, Pakistan, Singapore, and Thailand, the five-year oral cancer survival is
ranges between 32 and 54 % (Sankaranarayanan et al., 2011; Swaminathan et al., 2011). In
Malaysia, the five-year oral cancer survival is lesser than 50% (data from Malaysian Oral
Cancer Database and Tumour Bank System).

9
The Malaysian National Cancer Registry (MNCR) has categorized oral cavity cancers
into three distinct groups; namely mouth, tongue and lip cancers (Omar & Tamin, 2011).
The combination of these three groups increase the incidence of oral cancer which is 353
cases which comprising lip (n = 9), tongue (n = 93) and mouth (n = 69) (Omar & Tamin,
2011).
2.2.2 Gender, ethnic and age distribution
Oral cancer is more common in men than women with a ratio of 2:1 worldwide (Ferlay
et al., 2015). Similarly, in South and Southeast Asian countries such as India, Sri Lanka,
Pakistan and Taiwan, the incidence of oral cancer is higher in men compared to women
(Warnakulasuriya, 2014b; Ferlay et al., 2015). In Malaysia, the MNCR reported that for
year 2007, oral cancer incident cases comprise of 171 males and 182 females with a ratio
1:1 (Omar & Tamin, 2011).
In the United States of America (USA), the Surveillance Epidemiology and End Results
(SEER) for oral and pharynx cancer (2009-2013) reported that the age-adjusted incidence
rate for blacks and white males were 14.4 cases/million and 17.4 cases/million respectively
whereas for blacks and white females were 5.2 cases/million and 6.4 cases/million
respectively (www.seer.cancer.gov). Sharp incidence and mortality rate increment were
also reported among the non-whites in Germany, Denmark, Scotland, Central and Eastern
Europe, Japan, Australia, New Zealand and USA (Kleihues & Stewart, 2003). Interestingly,
in Malaysia a marked variation in the incidence of oral cancer was observed among the
different ethnic groups that make up the Malaysian population. Although oral cancer was
not ranked as the top ten most common cancer overall, it was ranked as the 3rd most

10
common cancer for both Indian with females having a higher ASR (10.0) compared to
males (ASR = 5.6). The Chinese females (ASR = 0.8) have a lower rate than Chinese males
(ASR = 1.9), whereas the distribution of cases is almost equal for both sexes among the
Malays. These findings confirm the results of a previous study which indicated that the
ethnic Indian group has the highest risk for oral cancer amongst the Malaysian population
(Zain et al., 1997).
Incidence of oral cancer increases with increasing age throughout the world
(Warnakulasuriya, 2009b). Approximately more than 95% of oral cancer cases are reported
in people older than 40 years old (Warnakulasuriya, 2009b). In 2009, the database of
National Cancer Institute's Surveillance, Epidemiology and the End Results (SEER)
reported that the median age of being diagnosed with oral cancer was 62 in USA (Horner et
al., 2009). However, there is a gradual increasing trend of incidence and mortality among
young adults in USA and European countries (Macfarlane et al., 1994; Shiboski et al.,
2005). According to a study by the British Dental Association (2000), approximately 6% of
oral cancers were diagnosed in younger patients aged less than 45 years old. In the Indian
subcontinent which has one of the highest oral cancer prevalence in the world, oral cancer
usually occurs prior to the age of 35 which is mainly due to the practice of tobacco chewing
(Johnson, 1991). In Malaysia, a gradually increase of oral cancer prevalence were observed
with age more than 40 years old for both male and female (Omar & Tamin, 2011).

11
2.3 Clinical and histopathological spectrum of oral potentially malignant disorders
(OPMDs)
2.3.1 Clinical appearance of OPMDs and oral cancer
Some oral squamous cell carcinomas (OSCC) may be preceded by oral potentially
malignant disorders (OPMDs). Although not all OPMDs transform into OSCC, they all
belong to a family of disorders characterized by certain genetic and morphological
alterations amongst which some have an increased potential for malignant transformation.
The presence of an OPMD is an indicator of a future risk of epithelial malignancies
(Warnakulasuriya et al., 2007). Leukoplakia, erythroplakia, oral lichen planus and oral
submucous fibrosis, are the more common OPMDs. Leukoplakia is a term used to
recognize white plaques of questionable risk having excluded other known diseases or
disorders that carry no increased risk of cancer (Warnakulasuriya et al., 2007). The
incidence and prevalence of leukoplakia varies according to geographic region and study
criteria. In 2001, Banoczy et al. (2001) reported that the prevalence of oral leukoplakia
varies between 1.1% and 11.7% while the malignant transformation ranges between 2%
and 3% according to various studies. According to SEER-Medicare subcohort reported that
approximately 0.3% of the US population had a leukoplakia diagnosis (Yanik et al., 2015).
In 2003, the estimated reported prevalence of leukoplakia worldwide is approximately 2%
(Petti, 2003). The risk of malignant transformation in an oral leukoplakia is dependent on
certain factors such as presence of epithelial dysplasia, clinical type and location of the
lesion (Petti, 2003). Erythroplakia is defined as a fiery red patch that cannot be categorized
clinically or pathologically as any other definable disease. Majority of the erythroplakias
undergo malignant transformation but there is a dearth of documented series to calculate a
reliable malignant transformation rate (van der Waal, 2009). Histopathologic assessment

12
for the presence of oral epithelial dysplasia (OED) is considered the current gold standard
for predicting malignant transformation of OPMDs. In OED, cells of the normal oral
epithelium are replaced by cells showing immature or inappropriate differentiation with a
resemblance to cells usually seen in malignancy. Dysplastic features of a stratified
squamous epithelium are characterized by cellular atypia and loss of normal maturation and
stratification. There is support for the view that in an individual lesion, the more severe the
dysplasia the greater the likelihood is of progression to malignancy. However, non-
dysplastic lesions may also transform. The latest WHO classification has recommended an
objective grading of OED that takes into account the levels of the involved epithelium
(Speight, 2007).
OSCC in its early stages may manifest as a white patch (leukoplakia), red patch
(erythroplakia) or a mixed red and white lesion (erythroleukoplakia) (Bagan et al., 2010).
With progression surface mucosal ulceration or an exophytic mass may develop (Scully &
Bagan, 2009). Ulcerated lesions are characterized by raised and rolled margins while
exophytic masses may have a fungating or papillary surface (Bagan et al., 2010). With
advanced stage disease overt symptoms such as pain, loosening of teeth, dysphagia,
trismus, parasthesia and neck masses usually manifest (Bagan et al., 2010).

13
2.3.2 Histological appearance of OED and OSCC
Traditionally OED has been graded into mild, moderate and severe dysplasia by taking
into account a combination of microscopic features that include cytological and
architectural changes of the involved epithelium. In grading dysplasia, the thickness
(height) to which the cellular and tissue changes extend is also taken into account. In mild
forms of dysplasia, recognizable changes are limited to the parabasal layers (lower third);
in moderate dysplasia they extend to middle third; and in severe dysplasia, the changes
extend to the upper layers (Warnakulasuriya et al., 2008). Accurate histological diagnosis
and grading of oral epithelial dysplasia also presents an enormous challenge to the
histopathologist. Transformation rates by grade of dysplasia are difficult to establish. One
major limitation of using existing histological criteria for dysplasia to predict neoplastic
transformation potential is the inherent subjectivity of the grading system itself. Multiple
studies have demonstrated low-to-moderate interexaminer consensus for dysplasia grade
among experienced oral pathologists. At a workshop coordinated by the World Health
Organization (WHO) Collaborating Centre for Oral Cancer and Precancer in the UK on
issues related to OPMDs, a two-class classification (no/questionable/mild–low risk;
moderate/severe–high risk) system for grading OED was proposed. This was suggested
taking into account that reducing the inherent subjectivity in grading dysplasia may
increase the likelihood of agreement between pathologists. Kujan et al. (2007) tested the
new binary system of grading oral dysplasia, and supported this view. However, the
biological significance of this system needs to be investigated in longitudinal studies to
explore its value in the prediction of malignant transformation risk of OPMDs.

14
More than 90% of oral cancers are squamous in origin thus termed “oral squamous cell
carcinoma”, where it is derived from the surface epithelium. Since the basement
membranes are being penetrated, the carcinoma will invade the underlying connective
tissues (Eversole, 2001; Nagpal & Das, 2003).
2.4 Etiological factors
The DNA mutation of oral keratinocytes from the consistent exposure of oral mucosa to
mutagen agents such as chemical, physical, and microbial elements often contributes to oral
cancer (Scully & Bagan, 2009). The use of tobacco products, excessive alcohol
consumption, and chewing betel quid are among the etiological factors that have been
shown to cause oral cancers by themselves or synergistically (Warnakulasuriya, 2009a).
2.4.1 Smokeless and smoking tobacco
Consumed in combination with betel quid or their substitutes and oral snuff (or guktha,
nass, naswar, khaini, mawa, mishri and gudakhu), cigarette smoking is one of the
independent risk factor that increases chances of contracting oral cancer by 2-15 times
(IARC, 2004b; Rodu & Jansson, 2004; IARC, 2007). Globally, it has been shown that oral
cancer risks for smokers are ten times higher than for non-smokers (Warnakulasuriya et al.,
2005) while a case-control study showed that the odds for heavy smokers getting oral
cancers stood at a ratio of 20.7 (Rodriguez et al., 2004). Other studies document that
tobacco smoking heightens that risk by between two to ten fold in men and women
respectively (IARC, 2004b).

15
Among the reasons why tobacco smoking may lead to oral cancer is the presence of
more than 300 different carcinogens in tobacco smoke, the major contributory ones being
polycyclic aromatic hydrocarbons (PAH), benzo-α-pyrene, tobacco specific nitrosamines
including nitroso-nor-nicotine (NNN) and 4-(methylnitrosoamino)-1-(3-pyridyl)-1
butanone (NNK). These carcinogens act as DNA adducts that stimulate oral mucosa
epithelium which harm chromosomes and lead to DNA mutations (IARC, 2004b).
2.4.2 Excessive alcohol consumption
Findings from studies by the International Agency for Research on Cancer, regular and
excessive alcohol consumption increases the risk of oral cancer by a factor of between two
and six (IARC, 2010). When combined, alcohol intake and tobacco smoking increase the
risk of contracting oral cancer by 48 times, and account for more than 75% of oral cancer
cases reported in developed countries (IARC, 2004b; Rodriguez et al., 2004). Alcohol has
the ability to eliminate the lipid content on the membrane of oral mucosa making it more
receptive to the infusion of tobacco carcinogens that act as a DNA adduct thereby
facilitating oral carcinogenesis (Ogden & Wight, 1998).
According to a study by Mufti (1992), excessive alcohol consumption contributes to an
increased occurrence of chromatid breakage in DNA which suggests that alcohol upsets the
repair mechanisms of mutated DNA. It has also been reported that heavy consumption of
alcohol increases by between five to nine times the possibility to get tongue SCC (Herity et
al., 1981). In fact, alcohol drinkers in Asian populations are more at risk of getting oral
cancers due possibly to their inactive aldehyde dehydrogenase enzyme which acts as a

16
detoxifying agent for acetaldehyde which is a known carcinogenic agent (DNA adducts) for
oral mucosa (Petti, 2009).
2.4.3 Betel quid chewing
Besides the above, studies from Asian countries particularly in India and Taiwan
revealed the risk factor in getting oral cancers from betel quid chewing which is widely
practiced in these regions and is labelled as a type 1 carcinogen according to the IARC
(2004a). In Malaysia, betel quid chewing is commonly practised by the Indian community,
elderly Malays, and the indigenous people from peninsular and east Malaysia, but is less
common amongst the young and urban city (Zain et al., 1997).
How the carcinogenicity of betel quid chewing works is still unclear but there are two
possibilities. One is the production of potentially carcinogenic nitrosamine in the betel quid
chewer’s oral cavity and the other is the generation of reactive oxygen species from the
auto-oxidation of polyphenols in the areca nut that is enhanced by the alkaline pH of the
slaked lime. Both act as contributory factors in increasing the risk exposure of the oral
mucosa to these carcinogens (Nair et al., 1985; IARC, 2004a). Besides that, the
carcinogenic reactive oxygen species (ROS) and DNA adduct also lead to genetic
instability and initiate tumourigenesis through structural changes in the oral mucosa which
allow other betel quid compounds to penetrate it (Nair et al., 1985). According to a meta-
analysis by Gupta and Johnson (2014), chewing tobacco had a significant and independent
correlation with higher risk of OSCC, increasing the possibility of contracting oral cancer
by seven times.
17
2.4.4 Human Papillomaviruses Virus (HPV)
Zur Hausen (1996) notes that HPV is among the most common virus studied in head and
neck tumours. HPV types are classified into mucosal or cutaneous depending on their
specific lesion sites, with the most common and high risk types being HPV16 and 18 which
encode the main viral oncoproteins of E6 and E7. These oncoproteins will further bind to
p53 and pRb, thus neutralising tumour suppressor genes which play a role in turning off
cell divisions which cause DNA damage. This condition could lead to genomic instability
and accumulation of genetic changes and thus lead to malignant progression (Wilczynski et
al., 1998).
Till now, the malignant potential of HPV in OSCC has been suspected but not
confirmed. Studies on HPV incidence and oral cancer risk have produced widely disparate
results ranging from 0 and 100% which could be attributed to geographic differences in
population, types of specimens, and HPV detection methods (Kozomara et al., 2005). An
IARC case control study identified DNA of HPV in a small subgroup of oral cancers
(Herrero et al., 2003). However, a 2008 case study revealed that no HPV was detected in
OSCC for non-smoking and non-drinking patients (Siebers et al., 2008). Also, studies have
shown that the expression of E6/E7 in HPV DNA positive OSCC was detected in only 6%
to 7% cases (Lingen et al., 2013; Reuschenbach et al., 2013) leading to the possibility that
HPV infection is not biologically active in most OSCC patients.

18
2.4.5 Genetic susceptibility
There is a positive correlation between the genetic risk for head and neck cancer and
polymorphisms of drug-metabolizing enzymes (Hahn et al., 2002). These enzymes could
affect a person’s susceptibility to chemical carcinogenesis such as cytochromes P450
(CYPs) that could metabolize polycyclic aromatic hydrocarbons (PAHs) and glutathione S-
transferases (GSTs) that are involved in the detoxification of activated metabolites (Hahn et
al., 2002). Nevertheless, the three most studied genes for polymorphism in oral cancers are
GSTM1, GSTT1, and CYP1A1.
A study among Indian patients with GSTM1 null (deletion) genotype showed an odd
ratio (OR) of 1.3 (95% CI 0.37-4.82) (Sreelekha et al., 2001) while that for Japanese
patients showed a significant 2.2 chance of risk increase (95% CI 1.4-3.6) for those with
null genotype (Sato et al., 1999). Another study among Thais revealed a 2.6-times higher
risk (95% CI 1.04-6.5) (Kietthubthew et al., 2001). The situation among Western
populations showed contradictory outcomes where a study among the French by
Jourenkova-Mironova et al. (1999) noted no association between GSTM1 null genotype
and the risk of oropharyngeal cancer (OR 0.9, 95% CI 0.5-1.5).
The study by Sreelekha et al. (2001) demonstrated that GSTT1 null also imposed an
increased risk of 2.5 (95% CI 0.28-21.71) among Indians although Katoh et al. (1999)
found no association among the null genotype with oral cancer in the Japanese (OR 0.68,
95% CI 0.38-1.22), a finding that is supported by Kietthubthew et al. (2001) in their study
among such patients in Thailand.
19
CYP1A1 polymorphism were found to result in an OR of 5.3 (95% CI 1.03-26.28)
among Indians (Sreelekha et al., 2001). This finding is supported in other studies which
reported a significant 2.6-fold increase in the risk factor (95% CI 1.2-5.7) among Caucasian
oral cancer patients (Park et al., 1997) and a 2.3-fold increase (95% CI 1.1-4.7) among their
Japanese counterparts (Sato et al., 1999).
However, a preliminary study on 81 oral cancer patients in Jakarta lacked evidence to
support any association between polymorphisms of GSTM1, GSTT1, or CYP1A1 and oral
cancer occurrence (Amtha et al., 2009).
2.4.6 Diet and nutrition
In 1997, studies by La Vecchia et al. (1997) estimated that approximately 15% of oral
cancer was caused by imbalances or dietary deficiencies in the European population. This
is further demonstrated in Petridou et al. (2002) study that vegetables, fruits, micronutrient,
dairy product and olive oil plays an important role in protecting against oral cancer with
high consumption of riboflavin, iron and magnesium. Meanwhile, Rowland (1991)
suggests that Vitamin A could act as a potential protective source from carcinogenesis and
lack of them in the diet could possibly lead to cancer metastasis. This is because Vitamin A
has the ability to arrest DNA synthesis and can suppress epidermal growth factor receptor
(EGFR) which is highly expressed in oral tumourigenesis. Another animal model and
laboratory studies by Garewal (1995) mentioned that antioxidant nutrient such as β
carotene and vitamin E could play an important role against oral cancer risk. A recent study
done by Helen-Ng et al. (2012) has indicated that diet plays an important role in oral cancer

20
prevention where a significant reduced risk of oral cancer was found for consumption of
fruit and vegetables in Malaysia population.
2.4.7 Mouthwash
There is also controversy as to the association between the uses of mouthwash
containing alcohol with oral cancer (Warnakulasuriya, 2009a). Studies by Winn et al.
(1991) show that frequent use of mouthwash having concentrations of alcohol exceeding
25% resulted in a higher risk of getting oral and pharyngeal cancer while that by
McCullough and Farah (2008) note that such mouthwashes also contribute to oral
carcinogenesis. However, a meta-analysis research by La Vecchia (2009) and Gandini et al.
(2012) confirms that there is no excess oral cancer risks associated with using mouthwash
either containing or not having ethanol.

21
2.5 Prognostic factors
Prognosis is originally derived from a Greek word with term “gignosko” with the
meaning “to know”. According to National Cancer Institute, prognosis factor is defined as
a situation or condition of a patient that can be used to estimate the chance of recovery
from a disease or recurrences (http://www.cancer.gov/publications/dictionaries/cancer-
terms?cdrid=44246). In years, the histopathological assessment of the surgical resection
specimen provide information that is essential to determining the post-operative treatment
needs and prognosis for oral squamous cell carcinoma patients (Woolgar, 2006). It has also
been recommended the idea of the combination between the histological grading and
clinical assessment might provide a more precise measure for predicting the outcome of the
malignancy and deciding the best treatment for the patient (Anneroth et al., 1987). The
prognosis of the oral cancer patient depend largely with clinico-pathological factors such as
anatomic location of the lesion, tumour size, nodal involvement, TNM tumour staging,
pattern of invasion and histologic differentiation (Massano et al., 2006; Woolgar, 2006;
Warnakulasuriya, 2014b).

22
2.5.1 TNM staging
The tumour-node-metastasis (TNM) system as developed by International Union
Against Cancer has been widely accepted and applied in clinical practice to assess the
patient’s prognosis (Patel & Shah, 2005). This TNM staging systems also used as an
international standards for cancer reporting, prognosis evaluation, formulation of treatment
strategy, and comparison of treatment results (Sobin et al., 2011). Clinically, the growth
potential of the tumour defined by TNM staging includes T, the extent of primary tumour;
N, the presence or absence of regional lymph nodes; and M, the presence or absence of
distant metastasis (Patel & Shah, 2005). Details of the clinical TNM staging system of oral
cancer are shown in Table 2.1. Union for International Cancer Control (UICC) has
proposed TNM staging into two classifications which is clinical and pathological
classification (Sobin et al., 2011). Clinical classification which is known as the pre-
treatment clinical assessment is designated as cTNM and is acquired before treatment
planning like physical examination, imaging, endoscopy, biopsy, surgical exploration, and
other relevant examinations (basic for the choice of treatment) (Sobin et al., 2011). As for
pathological classification or post-surgical histopathological assessment which is
designated pTNM, is based on evidence acquired before treatment and supplemented or
modified by additional evidence acquired from surgery and from pathological examination
that provides additional data to estimate prognosis of the patient treatment (basic for
prognosticator or treatment outcome) (Sobin et al., 2011).

23
In years, the TNM staging system has been utilized to predict the clinical behaviour and
appropriate treatment for OSCC (Lindenblatt Rde et al., 2012). Moreover, TNM staging
system has also been facilitated in assessment of patient clinical response to therapy and
clinical outcomes (Sobin et al., 2011; Lindenblatt Rde et al., 2012). However, this TNM
staging system does not efficiently predict patient clinical outcomes due to it does not take
into consideration of the tumoural biology, molecular characteristics, the depth of the lesion
and histopathologic grade (Broumand et al., 2006; Oliveira et al., 2008). Apart from that,
the TNM tumour staging system has been reported to be inadequate in predicting response
to non-surgical therapy (Patel & Shah, 2005). Although the cTNM staging of oral cancer
can be different from what is found after excision and histopathological examination
(termed pTNM) but this tumour staging system remained as the main prognostic factor in
OSCC (Macluskey & Ogden, 2000). A review by Warnakulasuriya (2014a) indicated that
the TNM classification of OSCC remained to be a reliable criteria for the planning of
treatment and to determine patient’s prognosis. It is well documented that early stage of
OSCC which has not metastases have better prognosis than the late stage of OSCC (Scully
& Bagan, 2009). In Malaysia, there were about 64.6% of oral cancer patients who were
diagnosed at a late stage (stage 3 and stage 4) (Omar & Tamin, 2011).

24
Table 2.1: Details of the clinical TNM staging system of oral cancer. Adapted from
(Sobin et al., 2011).
Stage Tumour size (T) Nodal status (N) Metastasis (M)
0 Tis N0 M0
I T1 N0 M0
II T2 N0 M0
III T3
T1
T2
T3
N0
N1
N1
N1
M0
M0
M0
M0
IV Any T Any N M1
T represents tumour size, where Tis = carcinoma in situ;
T1 = < 2 cm in greatest diameter,
T2 = 2-4 cm;
T3 = > 4 cm and
T4 tumour with extension to involve adjacent structures, eg. Bone, extrinsic muscles of
tongue.
N0 = no clinically detectable enlarged nodes;
N1 = enlarged ipsilateral nodes present ≤ 3 cm
N2 = ipsilateral single > 3-6 cm or ipsilateral multiple ≤ 6 cm;
N3 = any palpable node > 6 cm
M0 = absent metastasis;
M1 = detected distant (blood-borne) metastasis.
25
2.5.2 Tumour sizes
Tumour size has been documented as the most reliable clinical prognosticator in OSCC
and has been widely used for decades in the UICC TNM staging system (Omar, 2013). The
prognosis of the OSCC patient has been reported to vary according to tumour size where
sizes of T1/T2 (T1- tumour sizes less or equal to 2 cm, T2- tumour sizes more than 2 cm
but less than 4 cm) are commonly referred to as “low-risk tumours” whereas T3/T4 (T3-
tumour sizes more than 4 cm, T4- tumour invades adjacent structures) are commonly
referred to as “high-risk tumours” (Omar, 2013). This is further supported by the recent
study by Sawazaki-Calone et al. (2015) to determine the prognostic value of tumour sizes
in OSCC where their study also revealed that the Cox proportional hazard model confirmed
the T size is an independent marker for reduced disease-free survival with a hazard risk
ratio (HRR) of 1.40 (95% CI 1.02-1.92, p = 0.030). Furthermore, earlier studies conducted
by Arduino et al. (2008) had shown the influence of tumour sizes (T1/T2 vs T3/T4) as a
prognostic factor in OSCC. This study had assessed 334 patients where the authors found
that the T3/T4 tumour size is an independent factor in predicting survival of OSCC patients
(Arduino et al., 2008). This implies that primary tumour size (T classification) is a reliable
prognosticator which influences the patient’s outcome with high T sizes indicating a poorer
prognosis than those with lower T classification. However, tumour sizes (diameter) alone
may not be the best prognostic factor to examine the extent of cancer invasion, response to
treatment, and prognosis. Therefore, tumour thickness has been reported to be an important
prognostic factor in head and neck cancers. A study conducted by Yuen et al. (2000)
demonstrated that tumour thickness with up to 3 mm thickness and up to 9 mm of the oral
cancer has poorer prognosis revealed that tumour thickness with longer diameter should be
considered in the oral cancer management for appropriate treatment.
26
2.5.3 Lymph node status
It is well documented that OSCC has a high propensity of cervical micrometastases and
metastasizes contralaterally because of the rich lymphatic intercommunications relative to
submucosal plexus of oral cavity that freely communicate across the midline that facilitate
the spread of cancer cells to any area of the neck consequently (Shah, 1990). The role of
lymph nodes is known to filter the harmful substances such as dead bacteria, viruses and
other dead tissues from the lymphatic fluid and eliminate them from the body (Elmore,
2006). The spreading of cancer cells via the lymphatic circulation system and move into
lymph node causing the affected lymph nodes to filter out the cancer cells (Elmore, 2006).
However, some cancer cells might survive and causing the enlargement and hardening of
lymph node that resulted from the metastasis of cancer from primary tumour (Parisi &
Glick, 2005). The presence of the enlargement and hardening of lymph node clinically is
associated with poor prognosis in OSCC (Shah, 1990). Therefore, the presence of nodal
metastasis is the most important prognostic factors for oral cancer (Woolgar, 2006). A
study by Woolgar et al. (1995) confirmed that lymph node metastases (LNM) displayed
profound effects on survival. Furthermore the accurate removal of positive lymph nodes is
an important factor in treating OSCC patients. Therefore, the ability to predict LN
metastasis at the first biopsy of the primary tumour will significantly improve the
management of patients with OSCC (van Hooff et al., 2012). It is highly plausible that
LNM helps in the prediction of prognosis and also facilitates in a more effective and
appropriate treatment by clinicians. However limited sensitivity of postoperative histology
examinations lead to false-positive and false-negative results in patients leading to adverse
side effects related to overtreatment and severe risk of fatalities due to overlooked
metastases (van Hooff et al., 2012). In a study by Tankere et al. (2000), they showed that

27
the overall survival rate of OSCC patients were 42.8% and 17.5% in the negative node (N-)
and positive node (N+) groups, respectively. Contralateral neck metastasis may be
associated with higher distant metastasis as spread of tumour across the midline confirms
aggressive behaviour.
2.5.4 Primary tumour site
It is widely accepted that the anatomical site of the oral cancer has a prognostic
influence in clinical outcomes of the OSCC patients. The plausible factors that influence
the prognosis of the sub-site of the oral cancer lesion are the association between the
tumour sub-site with the involvement of nodal metastasis, tumour staging, histological
grade and pattern of invasion (Woolgar, 2006). The incidence of the involvement of nodal
metastases is histologically diagnosed differently among the tumour subsite. For example,
the OSCC that form in tongue and retromolar area was highly seen compared to buccal
mucosa and gingival/alveolar SCC. The prognosis is also poorer seen in patient with lateral
tongue SCC, floor of mouth (FOM) and buccal tumours compared to retromolar SCC
patients (Woolgar et al., 1999). This is further supported by other studies also have
demonstrated that tongue and FOM OSCC patient have high propensity towards lymph
node metastasis due to these regions are known to have a rich and bilateral lymphatic
drainage pattern exhibit a higher risk of contralateral metastases compared to other subsite
tumours such as lip, retromolar, palate and buccal mucosa SCC (Kowalski et al., 1993;
Kowalski et al., 1999). Study conducted by Zelefsky et al. (1990) has demonstrated that the
treatment results from postoperative radiotherapy of different anatomical sites of advanced
OSCC were significant differences in terms of response to combined surgery and
radiotherapy. This implies the importance of taking the anatomical site of the oral cancer

28
into the account for the decision making of appropriate treatment for the different subsite in
OSCC.
2.5.5 Histological grading
The histological grading system that initially developed by Broders in 1920 have been
proposed by WHO to assess the degree of keratinization, cellular and nuclear
pleomorphism and mitotic activity (Pindborg, 1997). The biological activity of OSCC is
evaluated and descriptively categorized into well, moderately and poorly differentiated.
The modified Broder’s classification of well differentiated OSCC has the histological and
cytological features closely resemble those of squamous epithelial lining of the oral
mucosa. There are varying proportions of basal and squamous cells with intercellular
bridges; keratinization is prominent feature; mitotic figures are seen and atypical mitoses or
multinucleated epithelial cells are extremely rare; nuclear and cellular pleomorphism is
minimal. For the moderately differentiated OSCC is described as less keratinization and
more nuclear and cellular pleomorphism and there are more mitotic figures and some are
subnormal in form with intercellular bridges being less conspicuous. The poorly
differentiated OSCC is described as the histological and cytological features showed only
slight resemblance to the normal stratified squamous epithelium of the oral mucosa.
Keratinization is rarely present and intercellular bridges are extremely scarce, there is
frequent mitotic activity and atypical mitoses can readily be found with obvious cellular
and nuclear pleomorphism and multinucleated cells may be present (Pindborg, 1997).
There is consistent evidence of the value of tumour histological grade in determining
prognosis and have shown that poorly differentiate OSCC was associated to poor prognosis
in OSCC patient (Arthur & Farr, 1972; Langdon et al., 1977). However, there were other

29
studies have showed that Broders’ histological grading is no longer have prognostic impact
in OSCC (Pindborg, 1997; O-Charoenrat et al., 2003). The plausible reasons are due the
histological heterogeneity and inadequate sampling, reliance on structural characteristics of
the tumour cells and evaluation of tumour cells in isolation from the supporting stroma and
host tissues.
2.5.6 Pattern of invasion
Clinical assessment by the TNM tumour staging system is widely and routinely used to
determine the prognosis and treatment options for patients with OSCC (Sawair et al.,
2003). However, the major drawback of this tumour staging system is that it overlooks the
histological characteristics of tumours (Anneroth et al., 1987). Therefore, in 1989, Bryne
has developed a malignancy grading system focusing only on the invasive front of the
tumour. Typically, this invasive front grading (IFG) system are graded and assigned points
from 1 to 4, the score for each variable is summed to provide a total malignancy score for
each tumour. The observation of tumour cell at the most invasive part of the tumour believe
to have a more aggressive behaviour compared to the central or superficial tumour cell
suggesting that the invasive front of the tumour cell have the ability to invade to the
surrounding tissue structures, including vessels, and lead to metastasise (Bankfalvi &
Piffko, 2000). Several studies have been demonstrated the prognostic impact of this
invasive front as a prognostic factor that may influence the treatment of OSCC (Sudbo et
al., 2000; Chang et al., 2010; Almangush et al., 2014).

30
2.6 Oral cancer management
Oral cancer is diagnosed by physical examination of the oral cavity and neck as well as
computerized tomography (CT) and magnetic resonance imaging (MRI) imaging to
evaluate the participation of adjacent structures, such as bones and soft tissues
(Sankaranarayanan et al., 2015). Although surgery and radiotherapy are the common
treatment given for oral cancer patients, these modalities can lead to severe morbidity due
to disfiguring and functional side effects (Furness et al., 2011).
2.6.1 Treatment of early stage oral cancer
Diagnosis of early oral cancer lesions are often followed by surgery and/or radiotherapy
(Sankaranarayanan et al., 2015). Treatment are catered based on the tumour location,
cosmetic and functional consequences, age of the patient, presence of other diseases,
patient’s preference, and the availability of expertise (Sankaranarayanan et al., 2015).
Majority of the early stage oral cancers can be locally excised or treated with
radiotherapy, often with no or minimal functional and physical damage. For patients with
stage I tongue cancer and stage II cancers at other oral sites, who may be at high risk of
microscopic involvement of the neck nodes, elective neck dissection to remove lymph
nodes may be considered (Woolgar, 2006; El-Naaj et al., 2011; Vijayakumar et al., 2011).

31
External beam radiotherapy and brachytherapy which is using radioactive sources
implanted in the tumour- either alone or in combination, is an alternative to surgery for
early stage oral cancers (Sankaranarayanan et al., 2015). These treatment modalities have
been reported to have improved the clinical outcome of oral cancers (Fujita et al., 1999;
Marsiglia et al., 2002). However, brachytherapy alone, which does not treat regional nodes
sufficiently, is not endorsed for deep infiltrative cancers due to their nature to spread to
regional lymph nodes. More advanced recent techniques, such as three-dimensional
conformal radiotherapy and intensity modulated radiotherapy, can reduce the side effects of
conventional radiotherapy by improving the dose and delivery of radiotherapy, but these
treatments require much sophisticated equipment and they generally are more expensive
(Sankaranarayanan et al., 2015).
2.6.2 Treatment of advanced oral cancer
Locally advanced cancers are aggressive tumours with high locoregional treatment
failure rates. Therefore, a combined modality strategy integrating surgery, radiotherapy
and/or chemotherapy is often preferred for the management of the disease, although the
treatment option is largely influenced by factors such as functional and cosmetic outcomes
and the available expertise (Sankaranarayanan et al., 2015). Surgery followed by
postoperative radiotherapy is the preferred modality for patients with deep infiltrative
tumours and those with bone infiltration (Lundahl et al., 1998). For patients with surgical
margins with malignant characteristics indicating incomplete excision of the tumour,
postoperative concurrent chemoradiation is often given (Bernier et al., 2004; Cooper et al.,
2004). The use of chemotherapy prior to surgery can be beneficial as it may eliminate the
need to remove the mandible (Licitra et al., 2003).

32
Primary radiotherapy, either as single modality or in combination with chemotherapy, is
also a sensible option for locally advanced tumours without bone involvement as well as
for patients with unresectable tumour, who are medically unfit for surgery, or who are
likely to have unfavorable functional and cosmetic outcomes with surgery
(Sankaranarayanan et al., 2015). Incorporating chemotherapy with surgery or radiotherapy
is beneficial in younger patients with good health condition (Blanchard et al., 2011).
The use of chemoradiotherapy seems to be favorable in unresectable late stage (III/IV)
OSCCs (Argiris et al., 2008), although its use in distant metastasis may not be as useful,
due to the complications of treatment such as mucositis, dermatitis, and myelosuppression
(Argiris et al., 2008). In addition, radiotherapy and chemotherapy, or either as single
modality or combined, can confer long-term side effects that may aggravate the quality of
life of the patients. Therefore, much precise understanding of OSCC is imperative for
future treatments (Sankaranarayanan et al., 2015).

33
2.6.3 Molecular targeted gene therapy in OSCC
Despite much advancement in the multidisciplinary treatment comprising surgery,
chemotherapy, and/or radiation, the overall survival rate of OSCC patients has not
improved significantly. Thus, new therapeutic alternatives are crucial to improve the
prognosis of patients, especially those with advanced disease (Hamakawa et al., 2008).
Targeted therapies might be a good solution for this problem as they are becoming popular
in cancer research. This modality uses drugs or other substances that specifically target a
molecule involved in the growth, progression, and spread of cancer, thereby reducing
tumour growth and metastasis (Hamakawa et al., 2008). In the recent years, many different
targeted therapies have been approved for the use of cancer management, including
hormone therapies, signal transduction inhibitors, gene expression modulators, apoptosis
inducers, angiogenesis inhibitors, immunotherapies, and toxin delivery molecules
(Hamakawa et al., 2008). The generally agreed strategy to identify potential targets for this
therapy is to compare the amounts of selected proteins, usually with a role in cell growth,
survival, motility or angiogenesis, between the non-disease and cancer cells (Hamakawa et
al., 2008). Proteins that are abundantly expressed in cancer cells compared to normal cells
would be good candidate targets. Alternatively, mutant proteins with functional
significance, which can drive tumourigenesis, can also be potential targets for therapy. In
addition, identifying cancer-specific abnormalities in chromosomes can also lead to the
development of targeted therapy (http://www.cancer.gov/about-
cancer/treatment/types/targeted-therapies/targeted-therapies-fact-sheet).
Over the years, many molecular targeted therapies have been proposed and shown to
have promising anticancer effects. Those targets which are much investigated in OSCC,
34
includes the epidermal growth factor receptor (EGFR), cyclooxygenase-2 (COX-2),
peroxisome proliferator-activated receptor γ (PPARγ), and the progesterone receptor (PR)
(Hamakawa et al., 2008). Gefitinib ("Iressa," ZD1839) is a small molecule EGFR tyrosine
kinase inhibitor which can inhibit the proliferation of OSCC cell lines in both in vitro and
in vivo models. The agent also showed improved outcome when given after radiotherapy
(Hamakawa et al., 2008). This was due to the effect of the gefitinib/ radiotherapy
combination on the downstream survival regulator, p38 mitogen-activated protein kinase
(MAPK) and MAP kinase (MEK) 1/2 autophosphorylation (Hamakawa et al., 2008).
Treatment with celecoxib, a COX-2 selective inhibitor, enhanced the radiosensitivity of
HSC-2 cells, which constitutively expressed COX-2 (Hamakawa et al., 2008). Apart from
EGFR and COX-2, another promising molecular target is the PPARγ, which is a member of
the nuclear receptor superfamily of ligand-activated transcription factors. Recent findings
have shown that PPARγ ligands induce cellular differentiation and inhibit cell growth in
multiple malignancies, thereby hinting the potential use of synthetic PPARγ ligands for
molecular targeting of oral cancer (Hamakawa et al., 2008). Another promising targeted
gene therapy known as RNA interference (RNAi) based gene therapy. This approach is
using either small interfering RNA (siRNA) or plasmid or viral vector mediated delivery of
short hairpin RNA to inhibit the expression of the particular oncogenes (MYC, FOS and
RAS) which enable to reduce the tumour growth in oral tumourigenesis and thus act as a
powerful anti-tumour agent with minimum toxicity (Bertrand et al., 2002; Xi & Grandis,
2003).
35
2.7 Carcinogenesis
Certain enzymes, upon undergoing genetic instability, accelerate the pathogenic
pathways that are involved in carcinogenesis. For examples, DNA replication and
repairing, chromosomal instability, apoptosis and cell cycle regulation are often disrupted
as a result of DNA damage (Beckman & Loeb, 2005). In oral carcinogenesis, the multistep
process involves the accumulation of genetic changes such as chromosomal aberrations,
DNA mutations and epigenetic alterations impede the normal cellular processes and lead to
abnormal amplification of centrosomes, defects in DNA repair mechanism, uncontrolled
cell proliferation and reduction of apoptosis (Scully et al., 2000; Weinstein, 2002; Choi &
Myers, 2008). As a consequence of these events, different phenotypic changes occur and
result in elevated malignancy and aggressive behaviour of the oral tumour cells.
Cancer can be defined as a disease caused by the unregulated DNA replication, cell
growth, cell division and survival which differs the tumour cells from their normal
counterparts (Evan & Vousden, 2001). Hence, cancer is the condition where the normal co-
operative cell behaviours that facilitate the multicellularity functions are lost (Abbott et al.,
2006). In another word, cancer cells become unresponsive to the usual controls on
proliferation and follow their own agenda for reproduction instead, which is beyond the
constraints of normal cells (Weinberg, 1996).
The three main steps that are needed for the development of cancer are described to be
the initiation, promotion and progression (Farber, 1984). Starting with the initiation process
when there are irreversible cellular changes or mutations that cause both the irreversible or
reversible DNA damages. This step can arise spontaneously or be induced by exposure to a

36
specific carcinogen. In fact, the initiated cells are still not characterized as tumour cells
because they have not acquired the autonomy of growth yet. Besides, the DNA instability
may remain undetected throughout life (Okey et al., 1998). During the promotion stage, it
is generally characterized with further unchecked proliferation of the mutated cells from the
initiation phase. This results in a rapid increase of the tumour size (Farber, 1984) and the
process can be enhanced by chronic exposure to carcinogenic stimuli which causes the
changes of the initiated cells, leading to neoplastic transformation to favor tumour growth
(Okey et al., 1998). Lastly, the final stage of cancer development is the progression stage
where successive mutations will give rise to increasingly malignant sub-populations. The
pre-neoplastic cells will tend to become more committed to malignant development and
this whole process involves accumulation of further gene mutations leading to
heterogeneity in cell population (Farber, 1984). Overall, the cells lose their adherence
property and detach from the tumour mass to invade the neighbouring tissues or enter the
circulating blood and lymph to be transported to other tissues or organs as the tumour
progression advances. Once the tumour cells move away from the primary sites, distant
metastases occur and they form the secondary tumours (Okey et al., 1998).
2.7.1 Oncogene and tumour suppressor gene
Both the events of gene amplification and deletion lead to tumourigenesis. Gene
amplification in tumourigenesis is often associated with oncogene activation (Coleman &
Tsongalis, 2002) while the loss of chromosomal contents is linked to the inactivation of the
tumour suppressor genes (TSG) (Fröhling & Döhner, 2008). In general, the progression and
pathogenesis of OSCC results from a list of genetic events related to the activation and
inactivation of oncogenes and TSG respectively (Argiris et al., 2008).

37
2.7.1.1 Oncogenes
Oncogenes are derived from the gain of functions in cellular proto-oncogenes, which
occur through the alteration of a few common mechanisms such as mutation, chromosomal
rearrangement (translocations and inversions), and gene amplifications (Croce, 2008).
There are a total of six functional groups of oncogenes which are further categorized into
different subgroups, which are the transcription factors, growth factors, growth factor
receptors, chromatin remodelers, signal transducers and apoptosis regulators (anti-apoptotic
regulators) (Croce, 2008). According to Field (1995), amplification of oncogenes is more
prominent during tumour progression which is enhanced by certain encoded proteins
through checkpoint dys-regulation of the cell cycle. C-myc, int-2, hst-1, CCND1 and EGFR
are among the oncogenes associated with oral carcinogenesis (Todd et al., 1997).
Previous studies have indicated the amplification and over-expression of EGFR in oral
cancers (Ishitoya et al., 1989; Chen et al., 2003). In normal conditions, EGFR genes are
involved in transmembrane tyrosine-specific phosphokinase activity. The binding of EGFR
to their ligands leads to phosphorylation of EGFR tyrosine residues to dimerization and
activation. Therefore, amplification of this gene would lead to the continuous activation of
important kinase pathways. This subsequently favours unceasing cell growth and
proliferation, invasion, metastasis and angiogenesis in oral cancer (Yano et al., 2003;
Ciardiello et al., 2004; Kalyankrishna & Grandis, 2006).
Moreover, another popular oncogene in oral cancer is the v-erb-b2 erythroblastic
leukemia viral oncogene homolog 2 (ERBB2) gene (Xia et al., 1997), which is activated

38
through heterodimerzation with other receptors. Then, the MAPK or phosphatidylinositol
3-kinase (PI3K)-AKT activated pathways are activated, which play a role in enhancing
tumour invasion, cell proliferation, differentiation, adhesion and cell migration in cancer
(Olayioye et al., 2000).
The association between the amplification of CCND1 with tumour aggressiveness for
head and neck carcinoma has also been previously reported (Callender et al., 1994).
Generally, the CCND1 is responsible for the cell proliferation promoter in G1 phase of the
cell cycle under normal conditions. However, when over-expressed as a result of gene
amplification, cancer progression in tumourigenesis will be greatly enhanced (Hunter &
Pines, 1991).
2.7.1.2 Tumour suppressor genes
On the other hand, the inactivation or deletion of tumour suppressor genes (TSG) is
responsible for initiating cancer progression (Cooper, 2000) as this group of genes are the
negative growth regulators. Thus, they regulate cellular trafficking, DNA damage response
and apoptosis in a recessive fashion. Generally, TSG is defined as a genetic element whose
loss or inactivation allows a cell to display one or the other phenotype of neoplastic growth
deregulation (Weinberg, 1991). Therefore, one of the major events during carcinogenesis is
inclusive of the loss of function of TSG (Munger, 2002). While it is common to find a few
different inactivated TSG in the same tumour, it is also not a surprise to find the same TSG
being inactivated in different types of tumours. Loss of these genes basically promotes cell
cycle proliferation, signal transduction, angiogenesis and tumour growth (Sager, 1989).

39
Since TSG are recessive, they require two mutated alleles for tumour formation and it was
reported in a two-hit mechanism/theory that stated both the alleles needed to be inactivated
in order to promote malignant growth proposed by Knudson’s review paper (Knudson,
1971, 2001).
As a matter of fact, TSG has been categorized into 2 groups which were “gatekeepers”
or ”caretakers” (Kinzler & Vogelstein, 1997) and “landscapers” (Kinzler & Vogelstein,
1998). The “gatekeeper” genes’ main functions are to inhibit the tumour growth, suppress
neoplasia and promote cell death. Hence, the loss of these genes is rate-limiting in multi-
stage tumourigenesis (Kinzler & Vogelstein, 1997). Examples for these genes are the RB1
and TP53. On the contrary, “caretaker” genes work as DNA maintenance genes to suppress
growth by ensuring the fidelity of the DNA code through effective repair of DNA damage
and maintain genome integrity (Kinzler & Vogelstein, 1997; Russo et al., 2006). Examples
for this group of genes include the breast cancer 1 (BRCA1) and breast cancer 2 (BRCA2).
Meanwhile, “landscaper” genes actually work through a less direct mechanism by affecting
tumour microenvironment in which tumour cells grow such as extracellular matrix (ECM)
protein, cell surface markers, adhesion proteins and survival factors. Therefore,
malignancies follow upon the loss of “landscaper” genes’ functions (Kinzler & Vogelstein,
1998). Consequently, Thiery (2002) reported that the loss of E-cadherin and alpha-catenin
in epithelial cell junction and epithelial stromal cell interaction induce epithelial
mesenchyme transition (EMT) in carcinoma progression.
The loss of function of FHIT, RB1, TP53 and CDKN2A genes has been previously
reported in the head and neck cancer, particularly the SCC cases (Virgilio et al., 1996;

40
Koontongkaew et al., 2000). Basically, a particular TSG can undergo biallelic inactivation
through chromosomal allelic loss. Examples of such event include the loss of
heterozygosity (LOH)-allelic deletion, point mutation and deletion of both alleles
(Knudson, 2001). Biallelic inactivation is able to unmask recessive mutations which, in a
way are able to bring about changes on the cell phenotype (Yokota & Sugimura, 1993).
2.8 Hallmarks of cancer
Hanahan and Weinberg (2000) have identified six hallmarks for distinguishing cancer
cells from their normal counterpart, which include the self-sufficiency of growth signals,
insensitivity to growth-inhibitory signals, evasion of programmed cell death, immortality or
unlimited replicative potential, sustained angiogenesis, and tissue invasion and metastasis.
However, as cancer research advanced significantly, Hanahan and Weinberg (2011) added
two new emerging hallmark capabilities, which are the reprogramming of energy
metabolism and evading immune destruction into the present list.
2.8.1 Self-sufficiency of growth signals
Under normal conditions, cells require soluble and membrane bound growth factors
which function like a signal for the inert cells to be transformed into proliferative cells
(Hanahan & Weinberg, 2000). Basically, these growth signals are like the ligands of
receptors that are transduced from the cell surface to activate specific intracellular signaling
pathways which increases cell proliferation activities (Aaronson, 1991; Hanahan &
Weinberg, 2000). The dys-regulation and increased expression of these growth signals
form the hyper-responsive tumour cells and subsequently become one of the most
important drivers of self-sufficiency growth in oral cancer (Todd et al., 1991). Examples of

41
intracellular growth signalling transducing proteins include EGFR, CCND1 and RAS. They
play the same role as downstream mediators of growth factor signaling in OSCC.
EGFR encodes a membrane-bound receptor tyrosine kinase, in which the
autophosphorylation of its receptors will result in a series of intracellular signal cascading
events that includes the activation of the RAS/Raf/MAPK, phosphatidylinositol-3-kinase
(PI3K), mechanistic target of rapamycin (mTOR), Janus kinase (Jak), signal transducer and
activator of transcription (STAT), and protein kinase C (PKC) pathways (Rogers et al.,
2005; Kalyankrishna & Grandis, 2006). These pathways are well known to be involved in
the cell proliferation, survival, invasion, metastasis and angiogenesis in tumourigenesis
(Reuter et al., 2007). Secondly, the Ras encodes protein p21 via mutation that leads to
tumour cell growth regulation and mitogenic cell signaling transduction from cell surface to
nucleus. Meanwhile, the proto-oncogene, CCND1 encodes a positive regulator in cell cycle
that initiates DNA synthesis. Therefore, the activation of CCND1 results in uncontrollable
cell proliferation in tumourigenesis.
2.8.2 Insensitivity of growth-inhibitory signals
Hunter and Pines (1994) discovered that when the tumour suppressor genes undergo the
loss of expression in cell cycle inhibitory protein (which in turn, is controlled by the growth
inhibitory signals such as p53 and pRB), it will lead to an increased cell proliferation rate.
This particular hallmark may be observed in the dys-regulated interactions between the
growth inhibitory signals and cyclin dependent kinase (CDK) in cancer. As a result of this,
the cell cycle progression of cancer patients is relatively higher and faster (Serrano et al.,
1993).

42
2.8.3 Evasion of programmed cell death
Additionally, Hanahan and Weinberg (2000) stated that not only does uncontrolled cell
proliferation induces tumour growth but also the ability of tumour cells to maintain cell
proliferation and prevent senescence via apoptosis. Oren (1992) as well as Manning and
Patierno (1996) reported that cancer cells have increased survival rate and evade apoptosis,
unlike the normal counterparts. This event is achieved in various ways in oral cancer. One
form is the over-expression of B-cell lymphoma 2 (Bcl-2) which is an anti-apoptotic
regulatory protein in cancer (Pezzella et al., 1993). It has been suggested that Bcl-xL
inhibition can be an effective treatment for OSCC patients who develop resistancy towards
cisplatin (Oliver et al., 2004).
2.8.4 Immortality or unlimited replicative potential
The chromosomal telomere shortens each time after every cell cycle decreases the life
span of the cells (Hanahan & Weinberg, 2000). But cancer cells are immortal with infinite
lifespan due to their ability to replicate indefinitely by increasing the length of telomeres
(Hayflick, 1997). Cancer patients tend to have upregulated telomerase enzyme which
protects the tumour cells against telomerase shortening. The enzymes work by extending
the end of telomere via reverse transcription (Shay & Wright, 2006) to increase the
cancerous cells’ life span. In fact, several studies have found that the over-expression of
human telomerase catalytic subunit gene (hTERT) was significantly associated with poor
prognosis in oral cancer (Kannan et al., 1997; Gordon et al., 2003).

43
2.8.5 Sustained angiogenesis
The onset of angiogenesis was reported to be associated with tumour growth and
metastasis (Folkman, 1990). In a study by Folkman (2006), sufficient blood supply is said
to provide nutrients to tumours via the angiogenic mechanism which promotes tumour
growth and development. Furthermore, Hanahan and Folkman (1996) described the role of
angiogenic switch in tumour progression, which is dependent on the balance mechanism
between the pro-angiogenic signals and anti-angiogenic signals. The pro-angiogenic state is
favoured in tumourigenesis as it produces new blood vessels for cancer tissues. The role of
angiogenic switch has been well reported in a study by Udagawa et al. (2002) which
showed that the increase in the expression of vascular endothelial growth factor (VEFG)
through transfection was linked to the expansion of tumour in mice. In fact, it has been
shown that the expression of VEGF is higher than normal oral mucosa tissues in an oral
cancer study (Denhart et al., 1997). This suggests that tumour angiogenesis is correlated
with tumour progression and aggressiveness in the oral mucosa.
2.8.6 Tissue invasion and metastasis
Above all the vital cancer hallmarks, the most important characteristic that differentiates
cancer cells from their normal counterpart is their ability to form metastasis and invade into
the surrounding tissues. These events associated with poor prognosis of cancer patients
(Liotta, 1986; Sporn, 1996; Hanahan & Weinberg, 2000), and contributing to tumour
invasion are not fully understood. Nevertheless, it has been reported by Liotta (1986) that
cancer cells interact with the surrounding matrix at various stages in its metastatic cascade
through a series of complex processes such as involving intravasation through
angiogenesis, extravasation and growth into surrounding tissues, survival in the
44
bloodstream and new organ (secondary organ), cytoskeleton remodeling, initiation and
maintenance of growth and neo-angiogenesis in the metastatic tumour (Chambers et al.,
2002).
In addition, Thiery (2002) found that metastasis was actually associated with EMT. This
finding was also supported by Gumbiner (1996) which reported that loss of E-cadherin
expression during EMT led to increased cell motility and invasion. In general, there was a
set of transcriptional factors involved in EMT and related migratory processes such as
Snail, Slug, Twist, Zeb 1 and Zeb 2. They were often displayed as the important invasion
programmers in carcinoma formation (Thiery, 2002).
2.8.7 Reprogramming energy metabolism
Chronic and uncontrolled cell proliferation represents the main element of neoplastic
disease which involves not only the dys-regulated control of cell proliferation but also the
corresponding adjustments of energy metabolism to support cell growth and development.
One of the characteristics of malignant cells include the increased glycolytic metabolism,
which is associated with the activation of oncogenes such as RAS, MYC and the
deactivation of tumour suppressor genes like TP53 in tumour cells. These genes were
selected in identifying the hallmark capabilities of cell proliferation, avoidance of cytostatic
controls, and attenuation of apoptosis (DeBerardinis et al., 2008; Jones & Thompson,
2009).

45
2.8.8 Evading immune destruction
According to Hanahan and Weinberg (2011), they have characterized that tumour cells
are capable of escape from the immune defence system or have minimized magnitude of
immunological killing. Therefore, the tumour cells are able to avoid eradication and this
has been characterized into one of the cancer hallmarks. Among the mechanisms involved
in the evasion of immune attack is the selection of tumour variants resistant to immune
effectors, and progressive formation of an immune suppressive environment within the
tumour. Cancer cells that are vulnerable to immunology attack present tumour antigens that
can be recognized and eliminated by the immune system, but constant cell division as a
result of genetic instability tends to decrease immunogenicity.
2.9 Genetic Instability
Chromosomal instability (CIN) is among the most common forms of genomic
instabilities (Loeb, 2001; Negrini et al., 2010). Hence, being one of the distinctive
hallmarks of most cancers, CIN is characterized by changes in chromosomal structure –
which includes inversions, point mutations and translocations (Albertson et al., 2003) and
numerical aberrations such as amplification and deletions, which consequently are able to
cause uncontrolled cell proliferation, altered cell morphology and tumour progression
(Lengauer et al., 1998; Gollin, 2005). Basically, balanced (reciprocal) and unbalanced
(non-reciprocal) are the two categories of structural aberrations, in which, reciprocal
alteration is said to be the exchange of chromosome parts of non-homologous
chromosomes and results in no genetic content to be lost or gained, whereas, in non-
reciprocal alteration, the exchange is unequal, causing extra or missing copies of genes and
chromosomal regions (Albertson et al., 2003).

46
2.9.1 Chromosomal instability
Chromosomal instability (CIN) occurs in cells that have increased amount of unstable
chromosome content, which includes features like DNA translocation, aneuploidy
(loss/gain of whole or portions of chromosome) changes in gene copy number
(amplification and deletion) and chromosomal rearrangement (Lobo, 2008), that are
aroused from the event of abnormal mitosis (Loeb, 2001).
Oral cancer, just like all human cancer types – undergoes chromosomal and genetic
aberrations (Reshmi & Gollin, 2005). It has been reported that CIN contributes to tumour
initiation and progression and is the central issue in cancer biology. The normal cellular
processes - such as cell signaling, replication, and apoptosis will be negatively affected by
chromosomal abbreviations. This subsequently may result in uncontrollable cell
proliferations and defects in DNA repair mechanisms which are often the key factors for
tumourigenesis (Loeb et al., 2003). Furthermore, Katayama et al. (2003) has also reported
that over-expression of aurora kinase A (AURKA) gene in cancer may lead to failure in
maintaining stable chromosomal contents due to defective centrosome maturation, bipolar
spindle assembly and mitotic entry. Moreover, defective functioning of mitotic checkpoint
machineries such as centrosomes, microtubules, kinetochores, loss of spindle check point,
abnormalities of double strand break repair and telomere dysfunction in mitosis are
primarily caused by the failure in separation of sister chromatids, before the attachment of
microtubules during cell division (Schvartzman et al., 2010). Such defects are reported to
have contributed to changes in chromosomal numbers and structures which generally result
in CIN (Reshmi & Gollin, 2005; Schvartzman et al., 2010).

47
According to Saunders et al. (2000) and Gisselsson et al. (2002), the involvement of
extrinsic cytoskeletal aberrations such as multipolar spindles and alterations in centrosome
number were detected in few oral cancer studies. Both events were said to be responsible
for CIN. For instance, Saunders et al. (2000) had successfully observed various degrees of
multipolar spindles from OSCC cell lines (for examples, different level of chromosomal
capture and alignment) while Gisselsson et al. (2002) had shown the alterations of
centrosome number in oral cancer and suggested that it was the internuclear connection that
caused the prevention of cytokinesis and lead to the duplication of both chromosome and
centrosome number.
2.9.2 Driver and passenger mutation
Cancer is a progressive event that occurs from the process of multiple somatic
mutations. The changes in somatic cells, which include base substitutions, deletions,
insertions and rearrangements, are usually caused by the frequent exposure of mutagens
from both internal and external environments, result in permanent alteration of DNA
sequences (Vogelstein et al., 2013). For every somatic mutation that can be found in the
human cancer genome, it can be further classified into two different categories – which are
the driver gene mutation and passenger gene mutation. They are basically distinguished by
their roles in the development of cancer respectively. Generally, driver gene mutations are
characterized by their selective growth advantages and contribution in tumourigenesis (Pon
& Marra, 2015). Hence, they are also known as the cancer genes. The number of driver
gene mutations present in a tumour may also be associated with cancer development and
treatment complications. Meanwhile, passenger gene mutations are often biologically inert
or have little impact on cell function. In fact, it has been reported that passenger gene
48
mutations are most likely already present in cells before the acquisition of the driver gene
mutations (Stratton et al., 2009).
To this day, the complexity and uncertainties underlying the cancer genome remains as
the biggest challenge for researchers to differentiate between the two types of mutations. In
addition, there are also papers outlining that driver genes may also contain passenger gene
mutation and on the other hand, passenger genes can be converted into driver genes under
environmental changes following cancer treatments (Stratton et al., 2009; Vogelstein et al.,
2013). By far, large-scale sequencing studies comprising a huge set of samples are the most
promising approach to discover and explore driver gene involvement in different types of
cancers. Besides, as each individual tumour has its unique set of genetic mutational
landscape, a combination of different methods including both genetic and functional
analyses are crucial to precisely identify true driver gene mutations (Haber & Settleman,
2007).
One of the approaches to explore the genetic mutational landscape of HNSCC is using
the exome sequencing technology. The recent study conducted by Agrawal et al. (2011)
had significantly found more mutations occurred in HPV negative or tobacco-associated
OSCC compared to HPV positive related oropharyngeal cancer (Agrawal et al., 2011).
Taken together with Stransky et al. (2011) study, these two genetic mutational landscape
studies revealed a two- to five-fold increase in mutation rates in the mutated genes namely
TP53, CDKN2A, PIK3CA, HRAS and NOTCH1 in HNSCC with HPV negative compared
to HPV positive related HNSCC suggesting that the subtypes have distinct genetic
mutational landscape. In 2013, an integrative genomic analysis of OSCC conducted by

49
Pickering et al. (2013) had identified a frequent mutation of CASP8 with few CNAs
suggesting this inverse correlation may give an understanding to the mechanisms that
induce the genomic instability in oral tumorigenesis.
2.10 Model of OSCC
A recent study that conducted in Oral Cancer Research and Coordinating Center
(OCRCC), Faculty of Dentistry in University of Malaya had successfully determined a list
of common genomic copy number alterations that were involved in oral cancer progression
through the analysis of accumulation of genetic changes that took place from the oral
precursor lesion stage to the development of invasive tumour (Salahshourifar et al., 2014).
It has been reported that even though many OSCC emerge from OPMDs, OSCC generally
experienced greater genomic gains and losses compared to OPMDs (Mortazavi et al., 2014;
Salahshourifar et al., 2014). The hypothetical model of oral carcinogenesis is illustrated in
Figure 2.1.
In the study conducted by Oral Cancer Research and Coordinating Center
(OCRCC), Faculty of Dentistry in University of Malaya has identified the deletions of
tumour suppressor genes were linked to the initial events in carcinogenesis as the loss of
3p14.2 and 9p21 were observed in low grade dysplasia and some cases of histologically
normal epithelial cells (Salahshourifar et al., 2014). FHIT gene that sits on 3p14.2 is a
putative tumour suppressor gene that plays a role in the regulation of apoptosis and cell
cycle (Croce et al., 1999). Oral premalignant lesions with a deletion at 3p14.2 have always
been categorized as high risk lesions, and the loss of heterozygosity in this gene is usually
more prominent in patients that are exposed to environmental carcinogens (Croce et al.,
1999; Zhang et al., 2012). On the other hand, 9p21 contains the CDKN2A suppressor gene

50
that encodes p16 and p14 proteins that in turn, regulate the p53 and RB1 cell cycle
pathways (Pacifico & Leone, 2007). Though p53 is over-expressed in the early stage of
dysplasia due to the inactivation of CDKN2A, this gene was found to be downregulated
instead, as a result of genetic mutations in the later stage when OSCC develops. Therefore,
inactivation of p53 could only be found in OSCC samples but not the corresponding
dysplastic tissues (Shahnavaz et al., 2000; Hsieh et al., 2001).
In mild dysplasia to OSCC, gains in 8q22-q23 are common, while gains in the
whole 8q arm may be an indicator of invasive OSCC (Noutomi et al., 2006; Garnis et al.,
2009). Apart from this, one of the hotspot regions for high grade dysplasia is also inclusive
of 8q24, which accommodates the myelocytomatosis (MYC) oncogene and other genes like
Protein Tyrosine Kinase 2 (PTK2) and Lymphocyte Antigen 6 Complex, Locus K (LY6K),
as well as 8q22 that contains the Low Density Lipoprotein Receptor-Related Protein 12
(LRP12) gene (Garnis et al., 2004b). Besides chromosome 8, gain in 11q13 was also
reported as a result from the literature by Salahsourifar et al. (2014). CCDN1 gene is also
located in this region. Moreover, over-expression of EGFR as a result of amplification of
7p11.2 was also detected and had been said to be connected to the poor prognosis of OSCC
as this alteration could only been found in high grade dysplasia (Sheu et al., 2009; Ribeiro
et al., 2012). The next frequent alteration found was the gain in 3q which carries several
genes related to the tumourigenesis such as TP63 and PIK3CA genes. Subsequently, over-
expression of these genes increases the risk of cancer progression as they are responsible
for regulation of cell cycle, apoptosis and metastasis (Melino, 2011; Su et al., 2013).

51
In addition, when comparing with other study, it has been shown that deletions in
the short arm of chromosome 3 is a potential biomarker for oral cancer progression as the
non-progressive low grade dysplasia demonstrated 3p25.1-3p25.3 deletion whereas the
progressive low and high grade dysplasia exhibited deletions in regions 3p25.3-p26.1,
3p25.1-p25.3, 3p24.1, 3p21.31-p22.3, 3p14.2 and 3p14.1 (Tsui et al., 2009). Meanwhile,
OSCC patients showed more than 90% of deletions in the previous chromosomal locations
stated and the complete loss of the 3p arm indicated advanced tumour stage (Tsui et al.,
2009). Significant CNAs detected in lymph node metastatic tumours include high copy
numbers in 7p12 (EGFR), 11q13 (FGF3/FGF4, CCND1, EMS1), 17q11.2 (THRA) and
20q12 (AIB1) (Chen et al., 2004). In another study by Liu et al. (2006), 3q26.3 (PIK3CA)
and 11q13 (FGF4) showed gain within the metastatic samples, but not with matched
primary tumours.

52
Figure 2.1: Hypothetical model of oral carcinogenesis. Putative sequence of genetic
alterations that drive OSCC from normal appearing epithelial cells. The image is
reprinted with kind permission of the publisher, (Salahshourifar et al., 2014).
53
2.11 “Omic” profiling
In 2001, the International Human Genome Sequencing Consortium (2004) successfully
identified a total of 20,000 to 25,000 protein-coding genes. The completion of the human
genome sequencing project resulted in the advancement of high throughput technologies
for “omic” profiling. This profiling technique allows large scale discovery of aberrant
genes and molecular pathways in cancer, thus contributing to a better understanding of
cancer pathogenesis (Baak et al., 2003; Nagaraj, 2009). With the introduction of high
throughput technologies combined with sophisticated bioinformatic tools for complex data
analysis, comprehensive and systematic “omic” profiling has been developed to examine
candidate genes interaction within biological pathways and networks in cancer (Martin &
Nelson, 2001). Due to the complex nature of cancer, “omic” technologies such as genomics
(the study of the human genome), transcriptomics (gene expression) and proteomics (the
analysis of the protein complement of the genome) take a central place in discovering new
biomarkers pivotal for developing new diagnostic and therapeutic strategies (Garnis et al.,
2004a). In addition, specific cellular functions and their interaction to produce cancer
phenotypes can be predicted or interpreted based on results from high throughput analysis
(Nagaraj, 2009). One of the genomic technologies is the array CGH as this technology
allows screening of copy number alterations in a single experiment (Marquis-Nicholson et
al., 2010).
54
2.11.1 Array CGH
Array comparative genomic hybridization is a high throughput array which the array is
spotted with elements produced by DNA sequences that were used to replace the
metaphase chromosomes of the conventional CGH technique as the target for analysis
(Lucito et al., 2003). This technology provides new information on genomic copy number
alterations which is valuable in classifying cancer subtypes (Kallioniemi, 2008). In this
technique, genome database is used to design probes/clones sequence to be spotted onto
glass microscope slides (array) to detect alterations in specific genes. Therefore, this
technique is being increasingly utilized to determine and pinpoint candidate genes that are
drivers of cancer and genetic disease pathogenesis (Inazawa et al., 2004; Lockwood et al.,
2006).
Array CGH can overcome various limitations reported for conventional CGH (Inazawa
et al., 2004; Pinkel & Albertson, 2005; Kallioniemi, 2008). The superiority of the current
array CGH in cytogenetic methods includes higher resolution, higher throughput,
possibilities for automation, robustness, simplicity, high reproducibility and precise
mapping of alterations (Inazawa et al., 2004; Pinkel & Albertson, 2005; Kallioniemi, 2008).
The higher resolution of array CGH can be ascribed to the usage of smaller sized DNA
probes while the level of resolution is determined by the size of nucleic acid targets and the
density of coverage over the genome (Bejjani & Shaffer, 2006). In cancer research, the
ultimate goal of array CGH analyses is to allow precise localization of specific genetic
modifications associated with tumour progression, therapy response, or patient
prognosis. This method facilitates the discovery of predictive and prognostic biomarkers
for tumour progression in cancer (Kallioniemi, 2008; Shinawi & Cheung, 2008). On the

55
other hand, the limitations of array CGH include high cost as well as the inability of the
technique to detect balanced rearrangements in translocations and inversions, as only copy
number imbalances relative to other DNA regions can be detected.
2.11.2 OSCC associated CNAs
Array comparative genomic hybridization identifies common CNAs and their frequency
in OSCC samples as described by Salahshourifar et al. (2014). This study incorporates
previous studies on OSCC tumours using array CGH, where the tumour sites contained
only in the oral cavity from tongue, gum, hard palate, soft palate, floor of mouth and buccal
mucosa and excludes studies on cell lines, Single nucleotide polymorphisms (SNPs) and
customized array CGH (Table 2.2). Based on intensive literature review, the most
commonly reported CNAs were as follows: gains 3q, 5p, 7p, 8q, 11q and 20q; and losses
3p, 8p and 18q whereby CNA of gain in 8q as the most commonly reported amongst all
OSCCs. Further study revealed that genes in 8q24: PTK2, LY6K and MYC and 8q22:
LRP12 may be related to tumour inducing genes in oral cancer.
The second most common CNA was detected in the gain in 11q13 which harbors genes
that are actively involved in tumour progression, invasion and metastasis. In the 11q13
region, CCND1 was found to be over-expressed in clinical samples with high grade
dysplasia and was associated with patient survival (Garnis et al., 2004a; Tsui et al., 2009).
CCND1 is amplified in various cancers, is over-expressed in oral epithelial dysplasia in
transgenic mice, and was discovered to be a proto-oncogene controlling the G1/S transition
in cell cycle (Wilkey et al., 2009; Musgrove et al., 2011). Furthermore, CCND1 is highly
involved in tumourigenesis along with other cancer genes such as EMS1 and ORAOV1 in

56
the 11q13 region (Huang et al., 2006). Apart from these regions, amplification in 7p11.2
was high in OSCCs leading to over-expression of EFGR which was highly expressed in
high grade dysplasia cases associated with poor prognosis (Sheu et al., 2009; Ribeiro et al.,
2012). High rate of transformation from OPMD to OSCC was associated with high EFGR
copy number (Taoudi Benchekroun et al., 2010). Therefore, it was concluded that the over-
expression of both CCND1 and EFGR was highly associated with the development of
OSCC and high risk OPMDs (Tsui et al., 2009).
The second most common chromosome aberration was also detected in the gain in 3q
region which consisted of TP63, located specifically in 3q26. TP63 gene is a tumour
protein highly associated in the transformation of epithelial dysplasia to OSCC and is
significantly linked to poor prognosis in patients (Matsubara et al., 2011). TP63 is usually
expressed in normal epithelial tissues, however over-expression of this gene exhibits severe
dysplasia (Das et al., 2010; Su et al., 2013). The gain in 3q leads to the subsequent over-
expression of TP63 and PIK3CA, whereby higher copy number is highly associated with
increased prognosis. The tumour suppressor role of TP63 involves in cell cycle regulation,
apoptosis, metastasis and tumourigenesis with the interaction with p53 is well defined
(Melino, 2011; Su et al., 2013).
Next, the high losses were observed in the 3p, 8p and 9p regions, but losses in 3p and 9p
were associated with early tumourigenesis. Advanced stages of OSCC were based on the
chromosomal instability that extends to the whole chromosome arm and genetic
heterogeneity (Salahshourifar et al., 2014).

57
In 2011, in order to complement the exome sequencing data, Agrawal et al. (2011) had
performed a genome wide profiling using the SNP microarray on 42 HNSCC that
corresponded to the 25 samples involved in the exome sequencing study. The integration
between these data revealed that most of the frequently mutated genes that undergone LOH
mutation like TP53, CDKN2A and NOTCH1 were found to be deleted in chromosome
17p13.1, 9p21.3 and 9q34.3 respectively. Apart from that, the genome wide profiling from
this study also identified chromosome 11q, 3q and 7p were found to be amplified in the
HNSCC samples and the identified oncogenes that mapped in these regions were CCND1,
P1K3CA and EGFR, respectively. Another genome wide profiling using similar microarray
technology in Pickering et al. (2013) study has identified more than 50% (n = 40) of OSCC
samples were experienced chromosome amplification in 8q, 3q and chromosome deletion
in 3p, 8p and 18p. Deletion of chromosome 8p in this study was found to be associated
with extracapsular spread and poor prognosis. Besides, the integrative analysis with gene
expression data revealed that amplification of chromosome 11q13 was associated with
over-expression of CCND1.
Recently, the cancer genome atlas consortium (TCGA) (2015) and International Cancer
Genome Consortium (ICGC) (2013) has identified the most frequent amplifications were
found in chromosome 3q, 5p, 7p, 8q and 11q whereas the most frequent deletions were
found in chromosome 3p and 8p in OSCC patients. In TCGA, this consortium has
identified the dual amplification of chromosome 11q13 and 11q22 as one of the CNAs that
characterized HPV negative OSCC with the genes harboured in this loci being CCND1,

58
FADD and CTTN and BIRC2, YAP1 and MMP family genes implicated in cell death/NF-
kB and Hippo pathways (TCGA, 2015).
These CNAs also identified in Vincent-Chong et al. (2013) studies that using an ultra-
dense array CGH technology with array slides contains 974,016 probes for discovering
CNAs within 45 OSCC samples in Malaysia. This study has have identified that the most
frequently amplified region, 8p11.23-p11.22 contained several ADAM family genes
(ADAM9, ADAM5P and ADAM32). Interestingly, almost the entire p-arm of chromosome
8 was amplified. The second most frequently amplified CNA, was a novel genomic
amplification on chromosome 7q34, and contains the MGAM gene, which was present in
78% of OSCC samples. This study has identified significant regions in the OSCC genome
that were amplified which results in consequent over-expression of MGAM and ADAM9
genes. Combining the finding of the precision, incidence (correlating to selective retention
pressure of the CNA) and increase gene expression, MGAM could be a significant gene
that drives OSCC development that may be utilized as biological markers for oral cancers.

59
Table 2.2: Frequent CNAs (amplifications and deletions) in OSCC. Adapted from
(Salahshourifar et al., 2014)
Gain/Loss Chromosomal region CNAs associated genes
Gain 3q27-q29
3q26
3q29
3q27.2-3q27.3
3q24-q29
3q24-q25
3q26-qter
3q25.31-q36.3
3q21.3-q29
TP63, TERC, ZASC1, EPHB3,BCL6,
TM4SF1, SOX2, CLDN1, SCCRO,
PIK3CA
Gain 5p13
5p15.33
5p13.1-p13.2
5p15
5p15.33-p11
5p13.2
5p13.1-p15
5p15.33
TERT, RAD1, SKP2, SEC6L1
Gain 7p12.3-p12.1
7p11
7p22.3-p11.1
7p11.2
7p12-p11.2
7p21.1
7p22.3
7p12.3-p12.1
7p11.2-22.3
FSCN1, IL6, EGFR, GNA12
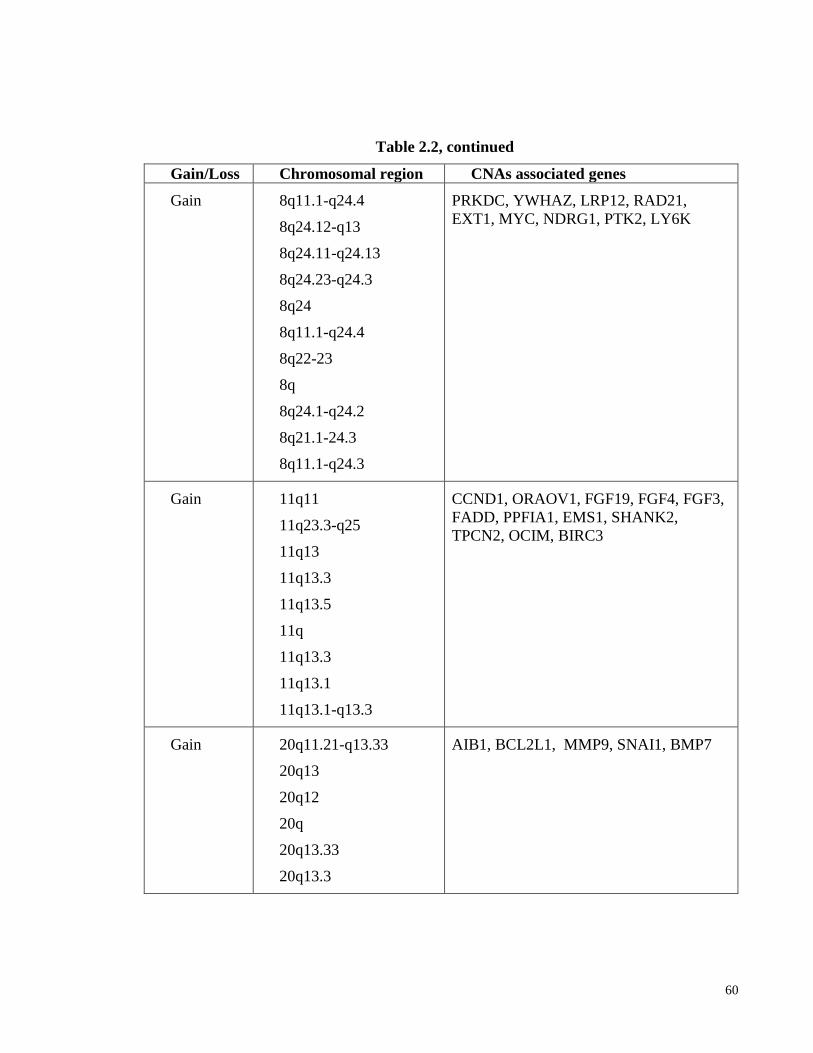
60
Table 2.2, continued
Gain/Loss Chromosomal region CNAs associated genes
Gain 8q11.1-q24.4
8q24.12-q13
8q24.11-q24.13
8q24.23-q24.3
8q24
8q11.1-q24.4
8q22-23
8q
8q24.1-q24.2
8q21.1-24.3
8q11.1-q24.3
PRKDC, YWHAZ, LRP12, RAD21,
EXT1, MYC, NDRG1, PTK2, LY6K
Gain 11q11
11q23.3-q25
11q13
11q13.3
11q13.5
11q
11q13.3
11q13.1
11q13.1-q13.3
CCND1, ORAOV1, FGF19, FGF4, FGF3,
FADD, PPFIA1, EMS1, SHANK2,
TPCN2, OCIM, BIRC3
Gain 20q11.21-q13.33
20q13
20q12
20q
20q13.33
20q13.3
AIB1, BCL2L1, MMP9, SNAI1, BMP7

61
Table 2.2, continued
Gain/Loss Chromosomal region CNAs associated genes
Loss 3p14.2
3p12-p13
3p24.3
3p24.2-p24.3
3p21-3p12
3p14.2
3p14-p21
3p
3p21.3
3p22
3p14
3p26.3
3p11.1-3p26.3
FANCD2, VHL, TIMP4, PPARG, XPC,
RARB,TGFBR2, MLH1,DLEC1, CSRNP1,
CTNNB1, RASSF1, WNT5A, FHIT
Loss 8p23.2
8p32
8p
8p11.23-p23.2
PCM1, CSMD1, LZTS1
Loss 9p21.3
9p21
9p
9p21.3
CDKN2A, MTAP, CDKN2B

62
METHODOLOGY CHAPTER 3:
3.1 Study design
A cross-sectional study was conducted where genome-wide profiling of 75 cases of
OSCC was carried out using array CGH and 66 OSCC samples which overlapped with 75
array CGH samples was carried out using qPCR copy number assay to determine and
validate the CNAs of OSCC. The samples for array CGH and qPCR consisted of gDNA of
fresh-frozen OSCC tissues.
The gene(s) that mapped within the frequently amplified and deleted regions were
subjected to pathway and network analysis using Ingenuity Pathway Analysis (IPA)
software. The mRNA of the identified putative amplified genes involved with network
signalling associated with cancer were determined using qPCR using cDNA from fresh-
frozen OSCC and non-cancer oral mucosal tissues.
Protein expression of the identified amplified genes was determined using
immunohistochemistry (IHC) staining of formalin fixed paraffin embedded (FFPE) tissues
of non-cancer oral mucosa, OSCC and oral epithelial dysplasia (OED). The FFPE tissues
were from tissue microarray (TMA) blocks consisting of five non-cancer or non-dysplasia,
15 OEDs and 103 OSCCs. The roles of the putative candidate gene in terms of cell
proliferation, apoptosis, migration and invasion was investigated using the siRNA
technique in three different OSCC cell lines derived from tongue, cheek and gum SCC

63
using MTT assay, caspase 3/7 luciferase assay, wound healing assay, transwell migration
and transwell invasion assay. The workflow of this study is illustrated in Figure 3.1.
Figure 3.1: Project workflow.

64
3.2 Sample types
Three types of sample were involved in this study namely:
1. Fresh-frozen tissues obtained from the Malaysian Oral Cancer Database and
Tumour Bank System (Zain et al., 2013) coordinated by Oral Cancer Research and
Coordinating Centre (OCRCC).
2. FFPE tissues arranged as tissue microarrays (TMAs) obtained from OCRCC
archives of TMA blocks.
3. Oral cancer cell lines (from Cancer Research Malaysia) derived from OSCC tissues.
The OSCC site was classified according to the anatomical subsites of the
International Classification of Disease (ICD-10), a coding system that was developed
by World Health Organization (WHO). The anatomic subsites of the oral cavity are
lips, floor of mouth, oral tongue (anterior two-thirds of tongue and excluding base of
tongue), buccal mucosa, gingivae, hard palate, and retromolar trigone. In this current
study, the tongue cancers were grouped as a single entity due to tongue cancers had the
highest prevalence at 220 per 100,000 population compared to other subsites within the
oral cavity in Malaysia (Omar & Tamin, 2011). Apart from that, tongue cancers are
characterized by a more aggressive biological phenotype, with a high-propensity of
cervical lymph node metastasis that might be reflected at their mutational and
molecular level (Thangaraj et al., 2016). The American Joint Committee on cancer
staging criteria was used for tumour staging (Sobin et al., 2011). All the OSCC samples
that were included in this study were histologically confirmed OSCCs, where patients
had not received prior therapies and the non-cancer individuals, were those who did not
have a history of any other cancers including oral cancer. This study was approved by

65
the Medical Ethics Committee (MEC), Faculty of Dentistry, University of Malaya with
the MEC code no: DF0306/ 001/(L) and DF OS1007/0048(P).
3.3 Sample selection criteria
Sample selection for all specimens was based on the following inclusion and exclusion
criteria below -
Inclusion criteria:
1. Samples (fresh-frozen and FFPE tissues) histologically confirmed to be OSCC
and non-cancerous oral mucosa for control.
2. Fresh-frozen tissues of the primary tumour consisting of epithelial tumour cells
with evidence of more than 70% of OSCC tumour cells.
3. Fresh-frozen tissues of the non-cancer oral mucosa consisting of more than 70%
non-cancer surface epithelial cells (most of the underlying connective tissue was
macro-dissected to achieve this).
Exclusion criteria:
1. Oral cancers (for both fresh-frozen and FFPE tissues) which are pathologically
diagnosed as other cancers (not OSCC).
2. Fresh-frozen tissues < 70% OSCC tumour cells.
3. Fresh-frozen tissues < 70% non-cancer surface epithelial cells.

66
3.4 Laboratory procedures
3.4.1 DNA and RNA extraction from tissue samples
Frozen tissue specimens were mounted in optimal cutting temperature (OCT), sectioned
and stained with haematoxylin and eosin (H&E) for histological assessment where the
diagnosis was confirmed. The percentage of tumour cells was gauged under the microscope
by oral pathologists (Prof Rosnah Zain, Dr Thomas Kallarakkal, and Dr Anand
Ramanathan). For any tissues that did not reach a 70% tumour content, macro-dissection of
the OCT embedded tissue was carried out to obtain ≥ 70% tumour tissues for DNA and
RNA extraction. All tumour tissues for test genomic DNA (gDNA) and RNA were isolated
by using DNeasy Blood & Tissue Kit (Qiagen, Hilden, Germany) and RNeasy micro kit
(Qiagen, Hilden, Germany), respectively according to the manufacturer’s instructions. The
quality (A260/A280) and quantity (ng/µl) of gDNA were determined using a
spectrophotometer (Nanodrop ND-2000, Thermo Scientific, MA, USA). The integrity of
RNA was accessed using the Agilent Bioanalyzer-2100 (Agilent Technologies, CA, USA)
to determine the quality of the extracted RNA from the samples. The Agilent Bioanalyzer-
2100 software (Agilent Technologies, CA, USA) can detect the ratio of the 18S and 28S
ribosomal RNA (rRNA) and generate the RNA integrity number (RIN). This RIN is
classified from 1 to 10, with 1 being the most degraded total RNA and 10 being the most
intact total RNA. Detailed protocols used for DNA and RNA extraction are included in
Appendix A and B, respectively.

67
3.4.2 Array CGH
A total of 75 cases of OSCC cases were selected from the MOCDTBS for array CGH
study. Detailed information on the OSCC frozen tissues used for array CGH is attached in
Appendix C. Genome-wide screening with customizing oligonucleotide array CGH
(8x60k) (Agilent Technologies, CA, USA) was performed according to the manufacturer's
instructions (version 5.0, June 2007) by Oxford Gene Technology, Oxford, UK. Enzymatic
digestion was replaced with a heat defragmentation step during sample preparation. This
was followed by sample labelling, probe purification, microarray hybridization, washing
and scanning (samples were processed by Oxford Gene Technology). For each array CGH
experiment, 1.5 µg of DNA (gDNA) from each fresh-frozen tumour sample (test sample)
and commercially gender matched pooled blood gDNA sample (Promega Corporation, WI,
USA) were taken and then labelled with fluorescence Cy5 and Cy3 dyes in dye-swap
experiments using the CytoSure Genomic DNA labelling kit (Oxford Gene Technology,
Oxford, UK), respectively. Once the labelling reaction was completed, labelled test and
reference test samples were purified and concentrated using Microcon YM-30 filters
(Merck Millipore, MA, USA) and then mixed together. This mixture was then subjected to
probe denaturation and pre-annealing with Cot-1 DNA. Hybridization was performed at 65o
C for 40 hours with a constant rotation at 20 rpm. After hybridization, slides were washed
according to the manufacturer’s instructions and scanned immediately using a DNA
Microarray Scanner (Agilent Technologies, CA, USA). The signal intensities were
generated using Feature Extraction software, version 10.7.3.1 (Agilent Technologies, CA,
USA) to produce a text file per array. The data from the text file were segmented using a
modified Circular Binary Segmentation (CBS) algorithm (Venkatraman & Olshen, 2007).
The CNAs were identified using CytoSure Interpret software version 4.2.5 (Oxford Gene

68
Technology, Oxford, UK) by applying log2 intensity ratios of sample to reference
(Cy3/Cy5: log2-ratios above 0.3 for amplifications and below -0.6 for deletions). Data
obtained was extracted from the scanned images. The start and end points of the CNAs
were analyzed against the version of the human genome assembly (hg19/GRCh37). The
result was an integrated dataset consisting of a list of cytobands with median start and end
positions according to the latest human genome assembly database. Classification of the
CNAs was conducted without any limit in size. Therefore, the CNA regions that are gene-
rich, most likely would be pathogenic containing a specific region of interest. Overlapping
regions were resolved by utilizing the lowest start and highest end position. The numbers of
amplifications and/or deletions were calculated by quantifying the number of redundant
and overlapping regions for each cytoband. Finally, the frequency was calculated, and
cytobands were ranked according to their amplification and/deletion percentages. An
arbitrary frequency threshold of 5% was used to define if a CNA could be of importance
and genes in regions altered in at least 5% of specimens were used for pathway and
network analysis as described below.

69
3.4.3 Functional analysis
The gene that mapped within the regions of the CNAs that were altered in at least 5% of
the specimens were subjected to gene networks and significant biological functions
(diseases, molecular and cellular functions) analysis using IPA software (Ingenuity
Systems, CA, USA). In the IPA software, the default setting was set to map CNA
associated genes to the knowledge base which is a reference set of direct and indirect
relationships. Next, relevant input to the gene list such as the molecular networks and
biological functions were generated by the software algorithm. The p-value which indicates
the probability of the genes in a network generated based on random chance and ranking by
available networks in the Ingenuity database. The significance of each biological function
was determined with right-tailed Fisher’s exact test with p < 0.05 significance. From the
generated network signalling, putative novel oncogenes, namely MMP13 and ISG15 were
prioritized for further evaluation and characterization in OSCC by quantification of mRNA
and protein expression levels as their clinical impact in oral cancer is poorly understood
and literature suggests a high probability of involvement in tumourigenesis. These genes
were found to harbor rare amplicons (chromosome 1p36.33 and 11q22.2), however, it has
been hypothesized that even rare amplicons would be informative regarding genes crucial
in tumor development as the expression may be altered by either copy number changes or
other mechanisms by disrupting the upstream or downstream genes in different
mechanisms that control a particular pathway (Snijders et al., 2005). Therefore, in order to
test this hypothesis whether ISG15 is a driver gene in OSCC (as MMP13 roles in oral
tumorigenesis has been studied previously). Therefore, ISG15 was selected for further
downstream analysis which is to determine its gene and protein expression in OSCC
samples as well as its functional roles via in vitro study using OSCC cell line models based

70
on its involvement in the oncogenic network (cell death and survival, cellular movement,
cellular development).
3.4.4 Copy number analysis by the TaqMan PCR assay
DNA was extracted from normal samples/tumour tissues with ≥ 70% tumour cell
content using DNeasy Blood & Tissue kit (Qiagen, Hilden, Germany) according to the
manufacturers’ protocol (Appendix A). Copy number analysis was performed on 66
OSCCs according to the manufacturer’s protocol. The detail information on the OSCC
frozen tissues used for Taqman PCR assay is attached in Appendix D. Briefly, each gDNA
was analyzed in triplicates by duplex TaqMan real-time polymerase chain reaction assays.
The commercially male and female pooled blood gDNA sample (Promega Corporation,
WI, USA) served as calibrator controls. Copy number analysis was done using TaqMan
Copy Number Assay: LRP12 (Hs01987319_cn), FSCN1 (Hs03631914_cn), EGFR
(Hs02309320_cn), CCND1 (Hs02226007_cn), CHL1 (Hs02163529_cn), TPM2
(Hs01060645_cn), CLPTM1L (Hs01133209_cn), CSMD1 (Hs03683117_cn) (Applied
Biosystems, Foster City, CA, USA). PCR was done in a total volume of 20 µl consisting of
4 µl of genomic DNA(5 ng/µl), 10 µl of 2× TaqMan® Genotyping Master Mix (Applied
Biosystems, CA, USA), 1 µl of 20X TaqMan Copy number assay, 1 µl of 20X TaqMan
copy number reference assay (RNAse P) and 4 µl of nuclease free water. Quantitative PCR
was performed on an ABI 7500 Fast Real Time PCR System (Applied Biosystems, CA,
USA) using the manufacturer’s PCR conditions as follows: initial denaturation at 95°C for
10 minutes followed by 40 cycles of denaturation for 15 seconds at 95°C and annealing for
60 seconds at 60°C.

71
The values of copy number for each sample were normalized using RNAase P as a
reference control with 2 copies in the human genome. Copy number was quantified using
the equation 2 x (2−ΔΔCt
), comparative CT (ΔΔCT) relative quantitation method (Livak &
Schmittgen, 2001). Target and reference assays that were used for copy number calculation
were derived from the mean of triplicate, RNase P and the calibrator samples. The
calculated relative quantity was multiplied by a base copy number of 2 to obtain the copy
number value. The values less than one and more than 2.0 were considered as deletion and
amplification, respectively (Bronstad et al., 2011; Lopez-Nieva et al., 2012).
3.4.5 Real time quantitative PCR assay for gene expression
Selected identified genes (MMP13 and ISG15) based on network analysis were
validated with an independent set of 68 OSCC samples for MMP13 and 64 OSCC samples
for ISG15 using qPCR. The detailed information on the OSCC frozen tissues used for gene
expression qPCR study of MMP13 and ISG15 are attached in Appendix E and F,
respectively. Total RNA was reverse transcribed using the High Capacity cDNA reverse
transcription kit (Applied Biosystems, CA, USA). A detailed protocol used for High
Capacity cDNA reverse transcription kit (Applied Biosystems, CA, USA) is included in
Appendix G. Quantitative-PCR was performed on a 7500 Fast Real-Time PCR System
(Applied Biosystems, CA, USA) in triplicate on cDNA of the samples using TaqMan Fast
Universal PCR master mixture (Applied Biosystems, CA, USA). The TaqMan Gene
Expression Assays (Applied Biosystems, Foster City, CA) used were MMP13
(Hs00233992_m1) and ISG15 (Hs00192713_m1). All qPCRs were carried out according to
the manufacturer’s protocol (Applied Biosystems). The relative quantification or fold
change (RQ) of all genes was calculated using the 2-ΔΔCT
method using 7500 Fast System

72
SDS Software 1.3.1 (Applied Biosystems, CA, USA). The housekeeping gene (GAPDH)
was used as an endogenous control while the cDNA from normal oral mucosa tissue which
was used to normalize test samples (OSCC).
3.4.6 Tissue microarray
Tissue microarray (TMA) of 1.0 mm core size had been constructed as described
previously (Kononen et al., 1998) using a semi-automatic Tissue Arrayer Minicore
(Alphelys, SAS, France). All OSCC FFPE blocks and the respective 5 µm H&E stained
slides were reviewed to identify and mark out the representative tumour areas by oral
pathologists. Approximately, three to six cores from the selected areas of donor blocks
were transferred to the recipient paraffin blocks. The completed recipient paraffin blocks
also known as TMA were incubated overnight at 37°C and 4 μm thick sections were
sectioned using rotary microtome and placed onto the poly-L-lysine slides.
3.4.7 Immunohistochemistry and scoring system
3.4.7.1 Immunohistochemistry staining
The immunohistochemistry (IHC) was performed on 4 µm thick FFPE sections
using the Dako Real EnVision Detection System and Peroxidase/DAB+ (Dako
Corporation, CA, USA) according to the manufacturer’s protocol. Briefly, FFPE sections
were deparaffinized in xylene and rehydrated in ethanol series increasing from absolute
ethanol, 80% ethanol and 70% ethanol. Antigen retrieval was carried out using an electric
pressure cooker (110ºC, 20 minutes) in 10 mM citrate buffer (pH 6.0). The sections were
immersed in blocking solution (Dako Corporation, CA, USA) for blocking the endogenous
peroxidase activity for 10 minutes at room temperature followed by washing with

73
phosphate-buffered saline (PBS) (pH 7.4) plus 0.1% Tween 20. Sections were then
incubated with the optimized concentration of 8 µg/ml of monoclonal anti-MMP13
(MAB511, R&D Systems, Inc, Heidelberg, Germany) overnight at 4°C and polyclonal
rabbit antibody anti-ISG15 (HPA004627, Sigma-Alrich, MO, USA) at the optimized
dilution factor of 1:100 for 60 minutes at room temperature. After washing with PBS
buffer, sections were incubated with the peroxidase labeled secondary antibody from the
Envision kit for 45 minutes for the immunoreactivity performances. Finally, sections were
stained with 3’3 diaminobenzidine substrate chromogen, (Dako Corporation, CA, USA)
counterstained with Mayer’s haematoxylin, dehydrated and mounted with a xylene-based
mounting medium. Ovarian and hepatocellular cancer tissue were used as positive control
for MMP13 and ISG15, respectively. Negative control was performed using the same
condition; except that the primary antibody was replaced with PBS on OSCC section that
was known to stain positively with MMP13 and ISG15 primary antibodies. The detail
information on the FFPE OSCC used for IHC protein expression study of MMP13 and
ISG15 are attached in Appendix H and I, respectively.
3.4.7.2 Scoring of immunohistologically stained samples
Digitized immunostained TMA spots were analyzed and scored by two oral
pathologists (Dr Anand Ramanathan and Dr Thomas George Kallarakkal) independently
based on a semi-quantitative scoring system using TMA software module 1.15.2
(3DHISTECH, Budapest, Hungary). The intensity scores were quantified using the
following scores: negative = 0; weak = 1; moderate = 2 and strong = 3. The proportion of
immune-positive cells was quantified as follows: 0 = negative; 1 = ≤10%; 2 = 11-50%; 3 =
51-80% and 4 = ≥ 80% of positive cells. The final immune-reactive score was determined

74
by multiplying the intensity and the proportion scores of the stained cells to obtain an
immune-reactive score ranging from 0 to 12 (Bektas et al., 2008; Liao et al., 2009). Cores
with discrepant scores were discussed by both pathologists to achieve a consensus to derive
the final score. The mean of consolidated immune-reactive scores for each case was
recorded.
3.4.7.3 Selection of cut-off score for ISG15 and MMP13 protein expression
The clinico-pathological parameters were first dichotomized as following: lymph node
metastasis (no vs yes), tumour staging (early vs advanced), tumour sizes (T1 and T2 vs T3
and T4) and survival status (alive vs dead). Receiver operating characteristic (ROC) curve
analysis was used to determine the best cut-off score for MMP13 and ISG15 protein
expression to each of dichotomized clinico-pathological parameters using 0, 1 criterion
(Zlobec et al., 2007). For MMP13 and ISG15 immunoreactive scoring, the sensitivity and
specificity of each score were plotted to generate various ROC curves against with clinico-
pathological parameters. The score which was closest to the point with maximum
sensitivity and specificity was selected as the cut-off value. The immune-reactive scores
were divided into high and low MMP13 and ISG15 expression where low expression was
the scores below or equal to the cut-off value, while high expression were the scores above
the cut-off value.
75
3.5 Cell culture and siRNA transfection
The OSCC cell lines (ORL-48T, ORL-188T and ORL-204T) were cultured in
Dulbecco's Modified Eagle's Medium (DMEM) F12 (Gibco, Life Technologies, NY, USA)
supplemented with 10% fetal bovine serum (FBS) (Gibco, Life Technologies, NY, USA) in
a humidified atmosphere of 5% CO2 at 37°C. Detailed information of the OSCC cell lines
used for the in vitro study is attached in Appendix J.
For transfection, cells were seeded in 6 well plates at 2.0 × 10⁵ cells per well at the time
of standard transfection. Knockdown of ISG15 genes was established by a standard
transfection using ON-TARGET plus SMARTpool siRNAs that directed against ISG15
according to the manufacture’s protocol (Dharmacon, PA, USA) using DharmaFECT 1
siRNA Transfection reagent, with final siRNA concentration for 48 hours. ISG15 gene was
targeted with a SMARTpool that comprised four different siRNAs. The four different
targeting sequence are ON-TARGETplus SMARTpool siRNA J-004235-21, ISG15 (Target
Sequence: GCGCAGAUCACCCAGAAGA); ON-TARGETplus SMARTpool siRNA J-
004235-22, ISG15 (Target Sequence: GCAACGAAUUCCAGGUGUC); ON-
TARGETplus SMARTpool siRNA J-004235-23, ISG15 (Target Sequence:
GGCUGACCUUCGAGGGGAA) and ON-TARGETplus SMARTpool siRNA J-004235-
24, ISG15 (AAAGGCUGUUGUAAAGAGA). To ensure the transfection process and
reagent does not alter gene expression level and phenotype, the non-targeting control
siRNA is used. As the negative control (siRNA-NC), D-001810-01-05, ON-TARGET plus
non-targeting control siRNA was used. The optimized final concentration used for the
siRNA for ISG15 knockdown of ORL-48T, ORL-188T and ORL-204T is 25 nM, 25 nM
and 50 nM respectively. The knockdown effect was checked by Western blotting.

76
3.6 Protein extraction and western blot analysis
Cell pellets were lysed in radioimmunoprecipitation assay (RIPA) buffer (89900, Pierce
Protein Biology, CA, USA) supplemented with a protease/phosphatase inhibitor cocktail
(1861281, Pierce Protein Biology, LA, CA, USA). Protein concentrations were determined
via Bradford assay (Biorad, CA, USA). Approximately 50 ug of protein was mixed with 5x
Laemmli buffer and heated in 95°C for 15 minutes prior to resolution on 12% SDS PAGE
using the Bio-Rad mini gel electrophoresis apparatus for an hour in transfer buffer (25 mM
Tris base, 192 mM glycine and 20% methanol, pH 8.3). The resolved proteins were
electrophoretically transferred to polyvinylidene fluoride membrane (PVDF) (Merck
Millipore, MA, USA) in wet condition at 400 mA for an hour using the Bio-Rad mini gel
transfer system. Membrane was then blocked with 5% skimmed milk/TBST (Tris-Buffered
Saline and Tween 20) to prevent non-specific binding of antibodies to the membrane for an
hour. The PVDF membrane was incubated with primary antibody of rabbit anti-human
ISG15 (HPA004627, Sigma-Aldrich, MO, USA) at 1:1000 dilution. The PVDF membrane
was then probed with the respective secondary antibodies conjugated with horseradish
peroxidase (Rabbit anti-mouse IgG H&L (HRP), ab6728, Abcam, Cambridge, United
Kingdom and Goat anti-rabbit IgG H&L (HRP), ab97051, Abcam, Cambridge, United
Kingdom) at room temperature for an hour. Antibody binding was visualized using
enhanced chemiluminescence (Merck Millipore, MA , USA). The membrane was scanned
using the Odyssey scanner (LICOR, NE, USA). To normalize for loading, the PVDF
membrane was probed with mouse anti-β-Actin antibody (1:5000; Sigma-Aldrich, MO,
USA) monoclonal antibody for an hour at room temperature and processed as described
above. Images were acquired on the ODYSSEY Sa Infrared Imaging System (LICOR,
Nebraska, USA).

77
3.7 In vitro functional assay
3.7.1 Cell proliferation assay using MTT assay
In order to assess the effect of ISG15 knockdown on cell viability, an MTT assay was
performed. All three OSCC cell lines namely ORL-48T, ORL-204T and ORL-188T,
transfected either with non-targeting siRNA control or ISG15 siRNA were suspended (4.0
× 103 cells) in 500 μl of medium supplemented with 10% FBS, plated in 24-well
microplates and cultured for 24, 48, 72, 96, 120 and 144 hours. Fifty microliters (µl) of
5mg/ml MTT (Calbiochem, CA, USA) was added and incubation was carried out to form
formazan crystals. After 4 hours of incubation, 500 μl of each detergent agent (0.01M HCL
of 10% SDS) was added in each of the well in 24-well plate. The absorbance was measured
at 570 nm (A570) and reference absorbance was 670 nm (A670) using the Tecan Infinite
M200 (Tecan, Zürich, Switzerland) plate reader. The cell viability is proportional to A570-
A670.
3.7.2 Cell proliferation assay using impedance measurement with the xCELLigence
System
Cell proliferation (cell index) was measured by the xCELLigence Real-Time Cell
Analyzer (RTCA) instrument according to the instructions of the supplier (Roche Applied
Science and ACEA Biosciences). OSCC cells transfected either with non-targeting siRNA
control or ISG15 siRNA were seeded in triplicate at 1.0 × 10⁴
cells/well into 100 μl of
media in the E-Plate 16 (Roche, cat# 05469830001, Basel, Switzerland) after baseline
measurement. Each of the 16 wells on the E-Plate 16 contains an integral sensor electrode
array, so that cells inside each well can be monitored and assayed. The attachment,
spreading and proliferation of cells in terms of the cell index (arbitrary unit reflecting the

78
cell censor impedance) were measured every 30 minutes using the RTCA software 1.2
(Roche, Basel, Switzerland). Cell proliferation was monitored for 30 hours in triplicate.
The cell doubling time was calculated from the exponential phase of the growth curve
using the RTCA software 1.2 (Roche, Basel, Switzerland).
3.7.3 Cisplatin sensitivity assay
The MTT cell proliferation assay (Calbiochem, CA, USA) was used to measure the cell
growth inhibition effects of cisplatin (Tocris Bioscience, MO, USA) in the OSCC cells.
Briefly, OSCC cell suspensions (at 1.0 × 10⁵ cells/ml) were transferred to 96-well plates in
triplicate and incubated for 48 hours with different cisplatin (Tocris Bioscience, MO, USA)
concentrations (ranging between 0 and 100 µM). Then, 20 µl of 3-[4,5-dimethylthiazol-2-
yl]-2,5-diphenyl-tetrazolium bromide (MTT, 5 mg/ml) was added to each well and
incubated for 4 hours. Fifty microliters of each detergent agent (0.01M HCl of 10% SDS)
were added in each well of the 96-well plate to resolve the crystals. The absorbance was
measured at 570 nm (A570) and reference absorbance was 670 nm (A670) using the Tecan
Infinite M200 plate reader (Tecan, Zürich, Switzerland). The cell viability is proportional
to A570-A670. The IC50 of the OSCC cells were determined from absorbance versus
concentration curve using Compusyn software (www.combosyn.com). The half maximal
inhibitory concentration (IC50) determined was used for the subsequent treatments for the
OSCC cell lines.
In order to investigate the role of ISG15 in affecting the cisplatin sensitivity of OSCC
cells, similar MTT assay experiments were performed using non-targeting siRNA control
or ISG15 siRNA transfected OSCC cell suspensions. Briefly, 1.0 × 10⁵ cells/ml were
transferred to 96-well plates in triplicates and incubated for 48 hours with cisplatin in

79
complete medium with their respective IC50 for 48 hours. Then, 20 µl of 3-[4,5-
dimethylthiazol-2-yl]-2,5-diphenyl-tetrazolium bromide (MTT, 5 mg/ml) was added to
each well and incubated for 4 hours. Fifty microliters of each detergent agent (0.01M HCl
of 10% SDS) was added to each well to resolve the crystals. The absorbance was measured
at 570 nm (A570) and reference absorbance was 670 nm (A670) using the Tecan Infinite
M200 plate reader (Tecan, Zürich, Switzerland). The difference in absorbance by the
cisplatin was used as the measurement of cell viability, normalized to non-targeting control,
which was considered 100% viable.
3.7.4 Apoptosis detection using Caspase-3/7
ORL-48T, ORL-204T and ORL-188T cells transfected either with non-targeting siRNA
control or ISG15 siRNA were seeded at a density of 1.0 x 10⁴
cells/well into a 96-well plate
in triplicate and treated/non-treated with cisplatin in complete medium with their respective
IC50 for 48 hours. Caspase-3/7 activities were measured using a luminescent Caspase-Glo
3/7, assay kit (Promega Corporation, WI, USA) following the manufacturer’s instructions.
Caspase reagents were added to triplicate in the 96-wells and incubated for an hour. The
caspase activities were measured using luminescent detector from Tecan Infinite M200
plate reader (Tecan, Zürich, Switzerland).

80
3.7.5 Wound healing assay
Wound healing migration assay was performed using a 35 mm μ-Dish (ibidi GmbH,
Munich, Germany). A total of 70 μl of 35,000 cells (ORL-48T, ORL-204T or ORL-188T)
transfected either with non-targeting siRNA control or ISG15 siRNA were seeded into each
chamber of the cell culture insert overnight. The next day, cells were treated with 10 µg/ml
of Mitomycin-C (Nacalai Tesque Inc, Kyoto, Japan) for 2 hours at 37°C before the cell
culture insert was gently removed with sterile forceps. The cultures were washed twice
with PBS, then, a medium supplemented with 5% FBS was added into the 35 mm μ-Dish.
The cells that migrated into the denuded area were captured with Leica DMI3000B light
microscope after optimized wound closure duration (Leica Microsystems GmbH, Wetzlar,
Germany) at 50x magnification. The areas were analyzed using the Wimasis WimScratch
software (ibidi GmbH, Munich, Germany). Wimasis WimScratch is a new generation web-
based image tool for cell migration analysis. Edge detection techniques can easily
recognize the leading edge and the gap area. The results were expressed as percentages of
scratched areas. The average percentage scratched areas of siRNA transfected cells were
used for the measurement of cell migration, normalized to non-targeting control, which was
considered 100% migration.

81
3.7.6 Transwell migration assay
Transfected OSCC cells either with non-targeting siRNA control or ISG15 siRNA were
tested in transwell migration assay using cell culture inserts with PET membrane of 8 µm
pore sizes, according to the manufacturer’s protocol (BD Biosciences, MA, USA). Briefly,
OSCC cells were cultured and serum starved for 24 hours. Cells were then harvested and
suspended in serum free DMEM F12 media at a concentration of 3.0 x 10⁵ cells/ml (ORL-
204T and ORL-48T) and 5.0 x 10⁵ cells/ml for ORL-188T. In the 24-well plate, inserts
were placed into wells containing 500 µl of DMEM F12 with 10% FBS media that acted as
a chemoattractant, and followed by 200 ul of serum starved cells were seeded onto the
insert for 24 hours. Post 24 hour incubation, the non-migrated cells were first eliminated by
scraping with wet cotton swabs, while the bottom of the membrane was fixed and stained
with 0.1% crystal violet (Biocalchem, Darmstadt, Germany) in 20% methanol for 2 hours
at room temperature. Membranes were washed with water to remove excessive stained and
air dried. The membrane was then viewed and captured under the Leica DMI3000B
microscope (Leica Microsystems GmbH, Wetzlar, Germany) at 100x magnification. The
number of stained cells were counted in four randomly chosen microscopic fields and
averaged. The average number of stained siRNA transfected cells were used for the
measurement of cell migration, normalized to non-targeting control, which was considered
100% migration.
82
3.7.7 Transwell invasion assay
Experiments were carried out in the similar manner as described in the transwell
migration assay except that the inserts used were pre-coated with matrigel basement matrix
from Biocoat Matrigel 24-well invasion chamber (BD, Biosciences, MA, USA). Briefly,
OSCC cells were cultured and serum starved for 24 hours. Cells were then harvested and
suspended in serum free DMEM F12 media at a concentration of 5.0 x 10⁵ cells/ml (ORL-
204T and ORL-48T) and 8.0 x 10⁵ cells/ml for ORL-188T. In the 24-well plate, inserts
were rehydrated with serum free DMEM F12 media for 2 hours before they were placed
into wells containing 750 ul of DMEM F12 with 10% FBS media that acted as
chemoattractant. This is followed by seeding 500 ul of serum starved cells onto the insert
for 24 hours. Post 24 hour incubation, non-migrated cells were scraped by wet cotton swab,
while the bottom of the membrane was fixed and stained with 0.1% crystal violet
(Biocalchem, Darmstadt, Germany) in 20% methanol for 2 hours at room temperature.
Membranes were washed with water to remove excessive stained and air dried. The
membrane was then viewed and captured under the Leica DMI3000B microscope (Leica
Microsystems GmbH, Wetzlar, Germany) at 100x magnification. The number of stained
cells were counted in four randomly chosen microscopic fields and averaged. The average
number of stained siRNA transfected cells were used for the measurement of cell invasion,
normalized to non-targeting control, which was considered 100% invasion.

83
3.8 Statistical analysis
The association between selected CNAs and clinico-pathological parameters were
analyzed by chi-square test (or Fisher exact test where appropriate). The CNAs, mRNA and
protein expression level of candidate genes were compared between OSCC and non-cancer
tissues using the Mann-Whitney U test. The copy number of selected CNAs associated
genes was classified into three groups, deletion (< 1.0), amplification (> 2.0 copies) and no
change (> 1.0 and ≤ 2.0 copies). Using the best cut-off point based on the immunoreactive
scores of the MMP13 and ISG15 for specificity and sensitivity as mentioned in section
3.4.7.3, the association between the protein expression of MMP13 and ISG15 with the
clinico-pathological parameters were analyzed by chi-square test (or Fisher exact test
where appropriate). Survival curves were plotted and compared by the log-rank tests using
the Kaplan-Meier analysis. In addition, Cox regression analysis was conducted to evaluate
the MMP13 and ISG15 expression as an independent prognostic factor. The significant
differences between the non-targeting siRNA control and the siRNA ISG15 were
determined by the two-tailed multiple Student’s t-tests with Bonferroni correction
following the Dunnett’s test. All data from cell culture functional assays were represented
as average ± standard error of the mean (SEM) of three independent experiments each
performed with duplicate/ triplicate wells. All statistical analyzes were performed using the
SPSS statistical package (SPSS version 12.0, IL, USA) and the p-values < 0.05 was
considered significant.

84
RESULTS CHAPTER 4:
This study aimed to determine the CNAs in OSCC using array CGH and to determine
the expression of candidate genes. A putative candidate gene was identified and further
elucidated to explore its potential role(s) in oral tumourigenesis. The results are presented
in accordance with the specific objectives.
Objective 1: To determine and validate the CNAs of OSCC using array CGH and qPCR
copy number assay.
4.1 Copy number alterations (CNAs)
A total of 75 OSCCs samples was subjected to array CGH to determine CNAs. The
socio-demographic and clinico-pathological parameters of the OSCC samples are listed in
Table 4.1. Amplification and deletions were observed in 28 and 3 chromosomal regions
respectively (Table 4.2). The frequency, size and genomic start and end points of the CNAs
are shown in Table 4.2. Numbers of chromosomal regions with amplifications were more
frequently observed than deletions in the entire dataset. The frequent CNAs were observed
on multiple genomic regions, including amplifications on chromosome 1p, 3q, 5p, 7p, 8q,
9q, 10p, 11q, and deletions on chromosome 3p and 8p. Amplification in chromosome
8q22.3-q23.1 was the most common and was found in 18.7% of OSCCs (n = 75) whereas
deletion in 3p21.31 was the most common and was found in 9.3% of all samples (9 out of
75 OSCCs) (Table 4.2). Chromosomes 3q, 8q and 11q had the highest number of changes

85
in copy number at different regions across the entire length of the chromosome (Table 4.2
and Figure 4.1A).
4.1.1 Association of the copy number alterations with clinico-pathological parameters
To determine whether any of the frequent CNAs was associated with clinico-
pathological parameters (tumour subsites, tumour sizes, LNM and tumour staging), chi-
square analysis was performed. Results showed that amplification of chromosome 7p was
significantly associated with tumour sizes (T1-T2: 31.1% vs T3-T4: 70%, p = 0.001) and
tumour staging (early stages: 26.9% vs advanced stages: 57.1%, p = 0.013). Similarly,
amplification of chromosome 8q, 11q and loss of 8p were found to be significantly
associated with tumour staging (early stage: 15.4% vs advanced stages: 51.1%, p = 0.003),
(early stages: 7.7% vs advanced stages: 28.6%, p = 0.036) and (early stages: 11.5% vs
advanced stages: 38.8%, p = 0.014), respectively. There were also greater amplifications of
chromosome 9p in OSCC patient with lymph node metastasis and the relationship was
found to be statistically significant (LNM negative: 5.3% vs LNM positive: 24.3%, p =
0.020). As amplifications of chromosome 7p, 8q, 9p and 11q were significantly associated
with clinico-pathological parameters, therefore the combination of these CNAs
(chr7p+8q+9p+11q) was formulated as a genetic signature. Interestingly, the amplification
of ≥ 1 of these CNAs within the genetic signature were found to be associated with tumour
sizes (T1-T2: 55.6% vs T3-T4: 83.3%, p = 0.012), lymph node metastasis (LNM negative:
52.6% vs LNM positive: 81.1%, p = 0.009) and tumour staging (early stages: 42.3% vs
advanced stages: 79.6%, p = 0.001) (Table 4.3 and Figure 4.1B).

86
Table 4.1: The socio-demographical and clinico-pathological parameters of the 75
OSCCs that involved in array CGH study.
Variables Category No. of patients (%)
Total 75
Gender Male 26 (34.7)
Female 49 (65.3)
Age (years) < 45 12 (16.0)
≥ 45 63 (84.0)
Smoking No 52 (69.3)
Yes 23 (30.7)
Drinking No 64 (85.3)
Yes 11 (14.7)
Betel quid chewing No 40 (53.3)
Yes 35 (46.7)
Tumour site Tongue 24 (32.0)
Non-tongue* 51 (68.0)
Tumour size T1-T2 45 (60.0)
T3-T4 30 (40.0)
Lymph node metastasis Negative 38 (50.7)
Positive 37 (49.3)
pTNM Staging Early stage 26 (34.7)
Advanced stage 49 (65.3)
Overall survival Range 1-114 months
Median 21.0 months
Mean 26.24 months
*Buccal mucosa, gingiva, lip, floor of mouth, palate

87
Table 4.2: The amplified and deleted regions detected in 75 OSCC samples.
Cytoband Median start
position
Median end
position
CNAs
(AMP/DEL)
Number of
sample
Percentage %
(n=75)
8q22.3-q23.1 102681371 109392898 AMP 14 18.7
7p11.2 54033427 56399307 AMP 12 16
8q12.1 57356305 61290015 AMP 11 14.7
5p13.2-p13.1 34263518 42496863 AMP 11 14.7
9p21.1-p13.3 30940311 35689407 AMP 11 14.7
8q21.13-q21.2 48435432 57172822 AMP 10 13.3
7p22.1-p11.2 7091279 55728080 AMP 9 12
8q11.21-q12.1 48435432 102647978 AMP 9 12
5p13.3-p13.2 31085740 34171734 AMP 9 12
11q13.1-q13.2 63411714 67465752 AMP 9 12
8q23.1-q24.11 48435432 51961330.5 AMP 9 12
8q24.13 48435432 146301585 AMP 8 10.7
8q24.3 49084980 54788562 AMP 8 10.7
3q13.32-q21.2 117659990 125404921 AMP 7 9.3
8q21.2-q21.3 49084980 52283007 AMP 7 9.3
7p22.3-p22.1 16324 5554669 AMP 7 9.3
5p13.1 38651455 40760663 AMP 7 9.3
11q13.3-q13.4 69592775 71296836 AMP 7 9.3
3q25.31-q26.1 156865802 162501514 AMP 7 9.3
3q27.3-q28 186822642 189711307 AMP 7 9.3
8q24.12-q24.13 57804398 61290015 AMP 6 8
11q13.3 68889918 69589223.5 AMP 6 8
11q13.4 71627053 74357770 AMP 6 8
10p13-p12.2 17275747.5 22617571 AMP 6 8
3q21.2-q26.1 125683802 162501514 AMP 6 8
3q26.1-q26.31 164035254 174942968.5 AMP 6 8

88
Table 4.2, continued
Cytoband Median start
position
Median end
position
CNAs
(AMP/DEL)
Number of
sample
Percentage %
(n=75)
1q22.2 102112312 102885548 AMP 4 5.33
1p36.33 937332 941105 AMP 4 5.33
3p21.31 47076499 49558487 DEL 7 9.3
3p26.3-p26.1 64052 5256910 DEL 7 9.3
8p23.2 3680600 3841195 DEL 6 8
Abbreviation Amp = Amplification; Del = Deletion

89
Table 4.3: Association of chromosome 7p, 8q, 9p, 11q, 8p and the combination of chromosome 7p, 8q, 9p, 11q with
clinico-pathological parameters in OSCC.
Variables Category
No. of
patients
(%)
7p
8q
11q
9p
(chr 7p+8q+9p+11q)
8p
No
change Gain
P
value
No
change Gain
P
value
No
change Gain
P
value
No
change Gain
P
value
No
marker
≥1
marker
P
value
No
change Loss
P
value
Total
75 40 35
46 29
59 16
64 11
25 50
26 49
Gender
Male 26 (34.7) 17
(65.4)
9
(34.6)
0.128
14
(53.8)
12
(46.2)
0.332
18
(69.2)
8
(30.8)
0.146
22
(84.6)
4
(15.4)
1.000
9 (34.6) 17
(65.4)
0.864
15
(57.7)
11
(42.3)
0.072
Female 49 (65.3) 23
(46.9)
26
(53.1)
32
(65.3)
17
(34.7)
41
(83.7)
8
(16.3)
42
(85.7)
7
(14.3) 16 (32.7) 33 (67.3)
38
(77.6)
11
(22.4)
Age
(years)
< 45 12 (16.0) 5 (41.7) 7
(58.3)
0.377
6
(50.0)
6
(50.0)
0.519
8 (66.7) 4
(33.3)
0.271
9 (75.0) 3
(25.0)
0.368
3 (25.0) 9 (75.0)
0.74
8 (66.7) 4(33.3)
0.739
≥ 45 63 (84.0) 35
(55.6)
28
(44.4)
40
(63.5)
23
(36.5)
51
(81.0)
12
(19.0)
55
(87.3)
8
(12.7) 22 (34.9)
41
(65.1)
45
(71.4)
18
(28.6)
Smoking
No 52 (69.3) 27
(51.9)
25
(48.1)
0.713
33
(63.5)
19
(36.5)
0.569
41
(78.8)
11
(21.2)
1.000
41
(78.8)
11
(21.2)
0.015*
17 (32.7) 35
(67.3)
0.859
38
(73.1)
14
(26.9)
0.491
Yes 23 (30.7) 13
(56.5)
10
(43.5)
13
(56.5)
10
(43.5)
18
(78.3)
5
(21.7)
23
(100.0)
0
(0.0)
8
(34.8)
15
(65.2)
15
(65.2)
8
(34.8)
Drinking
No 64 (85.3) 35
(54.7)
29
(45.3)
0.571
37
(57.8)
27
(42.2)
0.186
51
(79.7)
13
(20.3)
0.692
53
(82.8)
11
(17.2)
0.351
20
(31.3)
44
(68.8)
0.49
45
(70.3)
19
(29.7)
1.000
Yes 11 (14.7) 5 (45.5) 6
(54.5) 9 (81.8)
2
(18.2) 8 (72.7)
3
(27.3)
11
(100.0)
0
(0.0)
5
(45.5)
6
(54.5) 8 (72.7)
3
(27.3)
Betel
quid
chewing
No 40 (53.3) 21
(52.5)
19
(47.5)
0.877
23
(57.5)
17
(42.5)
0.466
31
(77.5)
9
(22.5)
0.792
34
(85.0)
6
(15.0)
0.93
11 (27.5) 29
(72.5)
0.252
27
(67.5)
13
(32.5)
0.520
Yes 35 (46.7) 19
(54.3)
16
(45.7)
23
(65.7)
12
(34.3)
28
(80.0)
7
(20.0)
30
(85.7)
5
(14.3)
14
(40.0)
21
(60.0)
26
(74.3)
9
(25.7)
89

90
Table 4.3, continued
Variables Category
No. of
patients
(%)
7p
8q
11q
9p
(chr 7p+8q+9p+11q)
8p
No
change Gain
P
value
No
change Gain
P
value
No
change Gain
P
value
No
change Gain
P
value
No
marker
≥1
marker
P
value
No
change Loss
P
value
Total
75 40 35
46 29
59 16
64 11
25 50
26 49
Tumour
site
Tongue 24 (32.0) 14
(58.3)
10
41.7)
0.552
12
(50.0)
12
(50.0)
0.167
20
(83.3)
4
(16.7)
0.499
22
(91.7)
2
(8.3)
0.486
6
(25.0)
18
(75.0)
0.294
18
(75.0)
6
(25.0)
0.572
Non-
tongue** 51 (68.0)
26
(51.0)
25
(49.0)
34
(66.7)
17
(33.3)
39
(76.5)
12
(23.5)
42
(82.4)
9
(17.6)
19
(37.3)
32
(62.7)
35
(68.6)
16
(31.4)
Tumour
size
T1-T2 45 (60.0) 31
(68.9)
14
(31.1)
0.001*
32
(71.1)
13
(28.9)
0.033*
38
(84.4)
7
(15.6)
0.135
40
(88.9)
5
(11.1)
0.330
20
(44.4)
25
(55.6)
0.012*
35
(77.8)
10
(22.2)
0.098
T3-T4 30 (40.0) 9 (30.0) 21
(70.0)
14
(46.7)
16
(53.3)
21
(70.0)
9
(30.0)
24
(80.0)
6
(20.0)
5
(16.7)
25
(83.3)
18
(60.0)
12
(40.0)
Lymph
node
metastasis
Negative 38 (50.7) 24
(63.2)
14
(36.8)
0.084
27
(71.1)
11
(28.9)
0.080
33
(86.8)
5
(13.2)
0.080
36
(94.7)
2
(5.3)
0.020*
18
(47.4)
20
(52.6)
0.009*
30
(78.9)
8
(21.1)
0.110
Positive 37 (49.3) 16
(43.2)
21
(56.8)
19
(51.4)
18
(48.6)
26
(70.3)
11
(29.7)
28
(75.7)
9
(24.3)
7
(18.9)
30
(81.1)
23
(62.2)
14
(37.8)
pTNM
Staging
Early
stage 26 (34.7)
19
(73.1)
7
(26.9)
0.013*
22
(84.6)
4
(15.4)
0.003*
24
(92.3)
2
(7.7)
0.036*
25
(96.2)
1
(3.8)
0.085
15
(57.7)
11
(42.3)
0.001*
23
(88.5)
3
(11.5)
0.014*
Advanced
stage 49 (65.3)
21
(42.9)
58
(57.1)
24
(49.0)
25
(51.1)
35
(71.4)
14
(28.6)
39
(79.6)
10
(20.4)
10
(20.4)
39
(79.6)
30
(61.2)
19
(38.8)
*Significant p - value were highlighted in bold and asterisked **Buccal mucosa, gingiva, lip, floor of mouth, palate
90

91
Figure 4.1: The ideogram of amplifications and deletions (A) and the association
with clinico-pathological parameters (B) identified in this study using array CGH.

92
4.1.2 Association of the copy number alterations with survival
To determine whether the CNAs were associated with clinical outcomes, Kaplan-Meier
survival analysis was conducted. The overall survival curves of chromosome 7p, 8q, 9p and
11q and the combination of chromosome 7p, 8q, 9p and 11q (amplification ≥ 1 marker vs
no amplification) were illustrated in Figure 4.2.
Figure 4.2: Overall survival curves were analyzed according to amplification of
chromosome 7p, 8q, 9p, 11q and deletion of chromosome 8p and the combination of
chromosome 7p, 8q, 9p, 11q using Kaplan-Meier estimate with log-rank test.

93
The 3-year survival rates for the amplification and non-amplification of chromosome 8q
were 34.48% and 66.13%, respectively. Univariate analysis showed a significant
association between amplification of chromosome 8q and poor prognosis (p < 0.050).
However, the multivariate Cox regression model analysis revealed that amplification of
chromosome 8q was not significantly associated with poor prognosis (HRR = 1.677, 95%
C1 0.807-3.485, p = 0.166) after adjustment for selected socio-demographic (age, gender
and risk habits) and clinico-pathological parameters (tumour sizes, lymph node status and
tumour staging) of OSCC (Table 4.4), thus, chromosome 8q cannot be considered as an
independent prognostic marker.
The 3-year survival rates for the amplification and non-amplification of chromosome
11q were 25.0% and 61.86%, respectively. Univariate (p < 0.050) and multivariate Cox
regression model analysis revealed that amplification of chromosome 11q was significantly
associated with poor prognosis (HRR = 3.211, 95% C1 1.417-7.275, p = 0.005) after
adjustment for selected socio-demographic (age, gender and risk habits) and clinico-
pathological parameters (tumour sizes, lymph node status and tumour staging) of OSCC
(Table 4.5), and thus, chromosome 11q remained as an independent prognostic marker.
The 3-year survival rates for the amplification and non-amplification of chromosome 9p
were 45.45% and 55.52%, respectively. Similar to chromosome 8q, the amplification of
chromosome 9p was significantly associated with poor prognosis in univariate analysis (p <
0.050) while the multivariate Cox regression model analysis revealed that amplification of
chromosome 9p was not significantly associated with poor prognosis (HRR = 1.378, 95%
C1 0.528-3.596, p = 0.512) after adjustment for selected socio-demographic (age, gender

94
and risk habits) and clinico-pathological parameters (tumour sizes, lymph node status and
tumour staging) of OSCC (Table 4.6). Thus, chromosome 9p cannot be considered as an
independent prognostic marker.
The 3-year survival rates for the amplification and non-amplification of chromosome 7p
were 32.35% and 72.93%, respectively. Similar to chromosome 8q and 9p, the
amplification of chromosome 7p was significantly related to poor prognosis in univariate
analysis (p < 0.050). However, the multivariate Cox regression model analysis revealed
that amplification of chromosome 7p was not significantly associated with poor prognosis
(HRR = 2.022, 95% C1 0.904-4.524, p = 0.087) after adjustment for selected socio-
demographic (age, gender, and risk habits) and clinico-pathological parameters (tumour
sizes, lymph node status and tumour staging) of OSCC (Table 4.7). Therefore,
amplification of chromosome 7p is not an independent prognostic marker.
The 3-year survival rates for the deletion and non-deletion of chromosome 8p were
31.82% and 63.10%, respectively. Both univariate analysis (p < 0.050) and multivariate
Cox regression model analysis revealed that deletion of chromosome 8p was significantly
associated with poor prognosis (HRR = 3.088, 95% C1 1.426-6.689, p = 0.004) after
adjustment for selected socio-demographic (age, gender and risk habits) and clinico-
pathological parameters (tumour sizes, lymph node status and tumour staging) of OSCC
(Table 4.8). Deletion of chromosome 8p thus remained as an independent prognostic
marker.
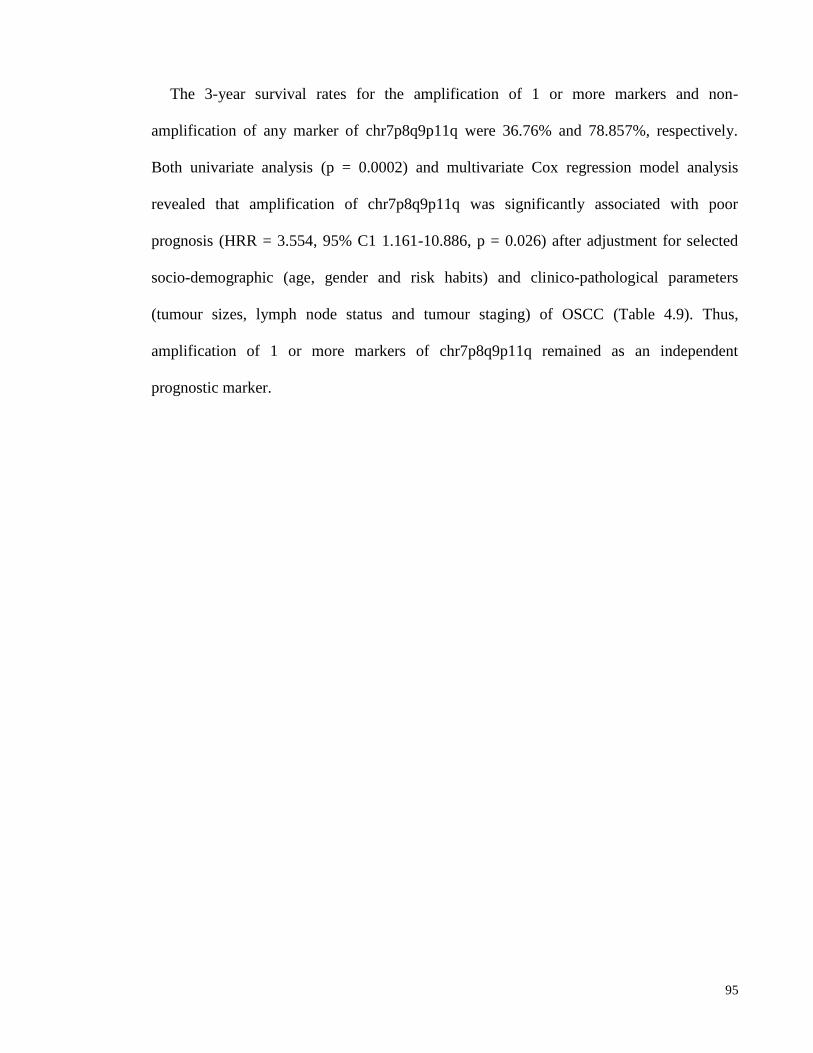
95
The 3-year survival rates for the amplification of 1 or more markers and non-
amplification of any marker of chr7p8q9p11q were 36.76% and 78.857%, respectively.
Both univariate analysis (p = 0.0002) and multivariate Cox regression model analysis
revealed that amplification of chr7p8q9p11q was significantly associated with poor
prognosis (HRR = 3.554, 95% C1 1.161-10.886, p = 0.026) after adjustment for selected
socio-demographic (age, gender and risk habits) and clinico-pathological parameters
(tumour sizes, lymph node status and tumour staging) of OSCC (Table 4.9). Thus,
amplification of 1 or more markers of chr7p8q9p11q remained as an independent
prognostic marker.
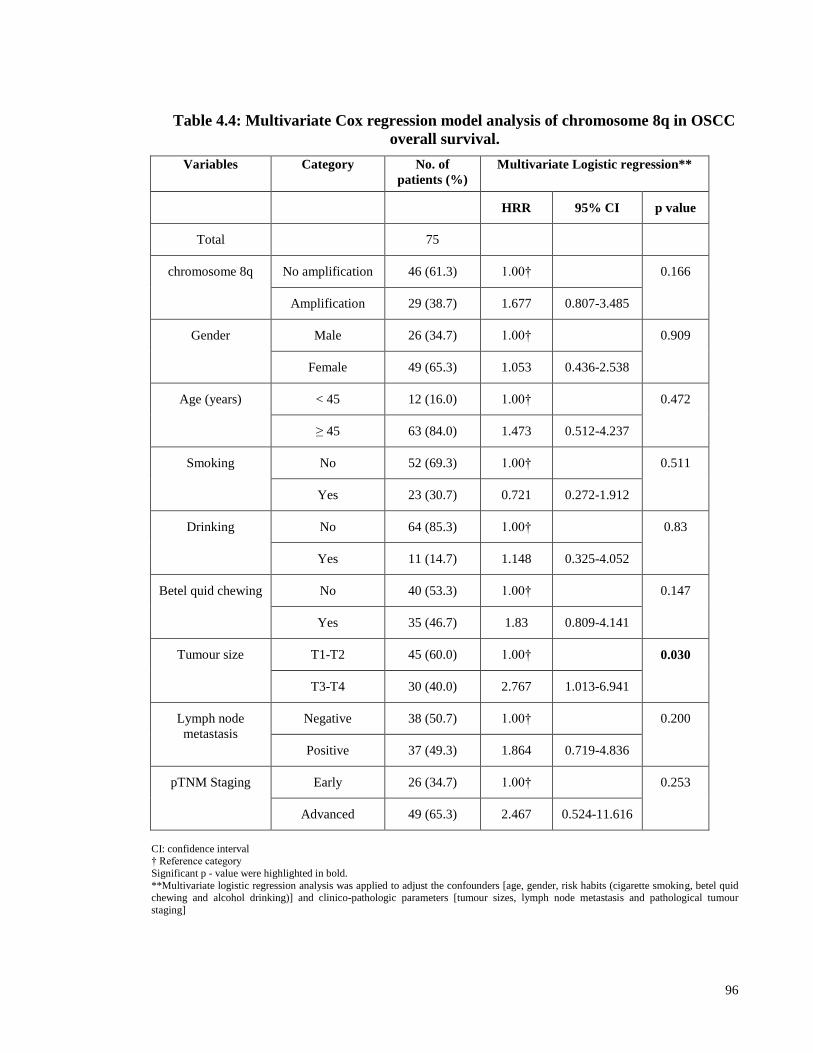
96
Table 4.4: Multivariate Cox regression model analysis of chromosome 8q in OSCC
overall survival.
Variables Category No. of
patients (%)
Multivariate Logistic regression**
HRR 95% CI p value
Total 75
chromosome 8q No amplification 46 (61.3) 1.00† 0.166
Amplification 29 (38.7) 1.677 0.807-3.485
Gender Male 26 (34.7) 1.00† 0.909
Female 49 (65.3) 1.053 0.436-2.538
Age (years) < 45 12 (16.0) 1.00† 0.472
≥ 45 63 (84.0) 1.473 0.512-4.237
Smoking No 52 (69.3) 1.00† 0.511
Yes 23 (30.7) 0.721 0.272-1.912
Drinking No 64 (85.3) 1.00† 0.83
Yes 11 (14.7) 1.148 0.325-4.052
Betel quid chewing No 40 (53.3) 1.00† 0.147
Yes 35 (46.7) 1.83 0.809-4.141
Tumour size T1-T2 45 (60.0) 1.00† 0.030
T3-T4 30 (40.0) 2.767 1.013-6.941
Lymph node
metastasis
Negative 38 (50.7) 1.00† 0.200
Positive 37 (49.3) 1.864 0.719-4.836
pTNM Staging Early 26 (34.7) 1.00† 0.253
Advanced 49 (65.3) 2.467 0.524-11.616
CI: confidence interval † Reference category
Significant p - value were highlighted in bold.
**Multivariate logistic regression analysis was applied to adjust the confounders [age, gender, risk habits (cigarette smoking, betel quid chewing and alcohol drinking)] and clinico-pathologic parameters [tumour sizes, lymph node metastasis and pathological tumour
staging]
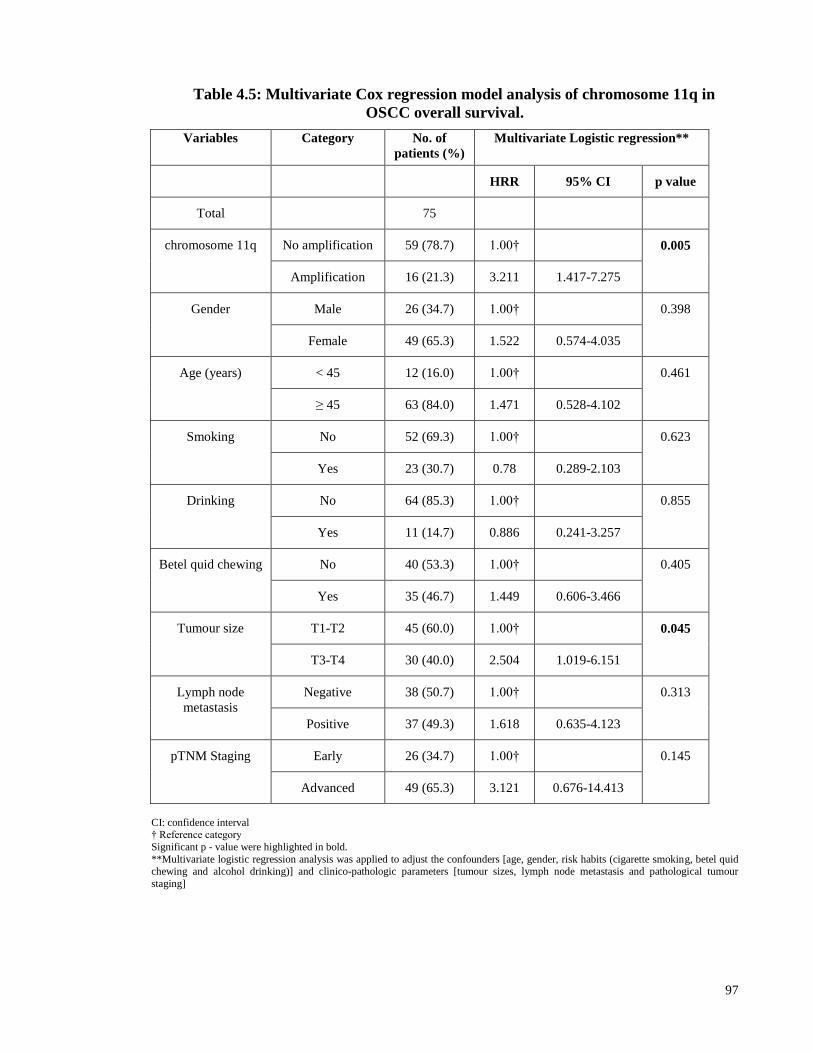
97
Table 4.5: Multivariate Cox regression model analysis of chromosome 11q in
OSCC overall survival.
Variables Category No. of
patients (%)
Multivariate Logistic regression**
HRR 95% CI p value
Total 75
chromosome 11q No amplification 59 (78.7) 1.00† 0.005
Amplification 16 (21.3) 3.211 1.417-7.275
Gender Male 26 (34.7) 1.00† 0.398
Female 49 (65.3) 1.522 0.574-4.035
Age (years) < 45 12 (16.0) 1.00† 0.461
≥ 45 63 (84.0) 1.471 0.528-4.102
Smoking No 52 (69.3) 1.00† 0.623
Yes 23 (30.7) 0.78 0.289-2.103
Drinking No 64 (85.3) 1.00† 0.855
Yes 11 (14.7) 0.886 0.241-3.257
Betel quid chewing No 40 (53.3) 1.00† 0.405
Yes 35 (46.7) 1.449 0.606-3.466
Tumour size T1-T2 45 (60.0) 1.00† 0.045
T3-T4 30 (40.0) 2.504 1.019-6.151
Lymph node
metastasis
Negative 38 (50.7) 1.00† 0.313
Positive 37 (49.3) 1.618 0.635-4.123
pTNM Staging Early 26 (34.7) 1.00† 0.145
Advanced 49 (65.3) 3.121 0.676-14.413
CI: confidence interval † Reference category
Significant p - value were highlighted in bold.
**Multivariate logistic regression analysis was applied to adjust the confounders [age, gender, risk habits (cigarette smoking, betel quid chewing and alcohol drinking)] and clinico-pathologic parameters [tumour sizes, lymph node metastasis and pathological tumour
staging]

98
Table 4.6: Multivariate Cox regression model analysis of chromosome 9p in OSCC
overall survival.
Variables Category No. of
patients (%)
Multivariate Logistic regression**
HRR 95% CI p value
Total 75
chromosome 9p No amplification 64 (85.3) 1.00† 0.512
Amplification 11 (14.7) 1.378 0.528-3.596
Gender Male 26 (34.7) 1.00† 0.895
Female 49 (65.3) 1.063 0.431-2.620
Age (years) < 45 12 (16.0) 1.00† 0.568
≥ 45 63 (84.0) 1.371 0.465-4.042
Smoking No 52 (69.3) 1.00† 0.659
Yes 23 (30.7) 0.793 0.283-2.223
Drinking No 64 (85.3) 1.00† 0.926
Yes 11 (14.7) 1.061 0.302-3.725
Betel quid chewing No 40 (53.3) 1.00† 0.161
Yes 35 (46.7) 1.829 0.787-4.249
Tumour size T1-T2 45 (60.0) 1.00† 0.023
T3-T4 30 (40.0) 2.963 1.158-7.578
Lymph node
metastasis
Negative 38 (50.7) 1.00† 0.374
Positive 37 (49.3) 1.568 0.582-4.225
pTNM Staging Early 26 (34.7) 1.00† 0.154
Advanced 49 (65.3) 3.058 0.657-14.220
CI: confidence interval † Reference category
Significant p - value were highlighted in bold.
**Multivariate logistic regression analysis was applied to adjust the confounders [age, gender, risk habits (cigarette smoking, betel quid chewing and alcohol drinking)] and clinico-pathologic parameters [tumour sizes, lymph node metastasis and pathological tumour
staging]
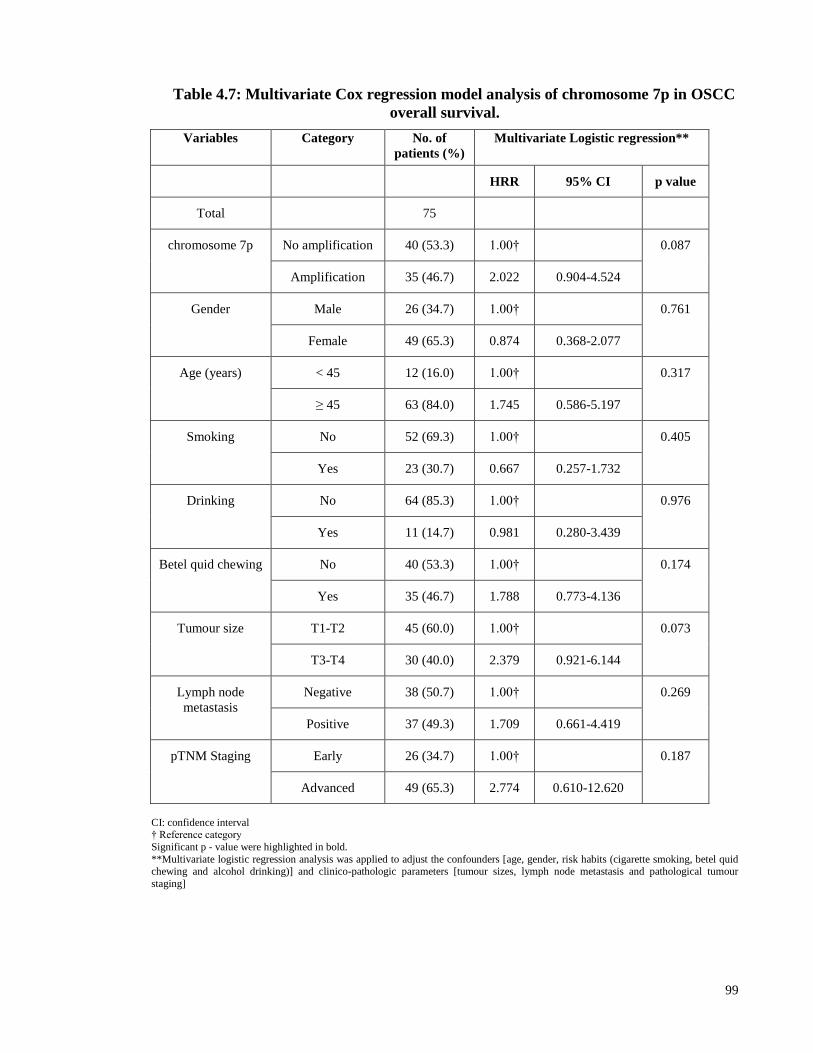
99
Table 4.7: Multivariate Cox regression model analysis of chromosome 7p in OSCC
overall survival.
Variables Category No. of
patients (%)
Multivariate Logistic regression**
HRR 95% CI p value
Total 75
chromosome 7p No amplification 40 (53.3) 1.00† 0.087
Amplification 35 (46.7) 2.022 0.904-4.524
Gender Male 26 (34.7) 1.00† 0.761
Female 49 (65.3) 0.874 0.368-2.077
Age (years) < 45 12 (16.0) 1.00† 0.317
≥ 45 63 (84.0) 1.745 0.586-5.197
Smoking No 52 (69.3) 1.00† 0.405
Yes 23 (30.7) 0.667 0.257-1.732
Drinking No 64 (85.3) 1.00† 0.976
Yes 11 (14.7) 0.981 0.280-3.439
Betel quid chewing No 40 (53.3) 1.00† 0.174
Yes 35 (46.7) 1.788 0.773-4.136
Tumour size T1-T2 45 (60.0) 1.00† 0.073
T3-T4 30 (40.0) 2.379 0.921-6.144
Lymph node
metastasis
Negative 38 (50.7) 1.00† 0.269
Positive 37 (49.3) 1.709 0.661-4.419
pTNM Staging Early 26 (34.7) 1.00† 0.187
Advanced 49 (65.3) 2.774 0.610-12.620
CI: confidence interval † Reference category
Significant p - value were highlighted in bold.
**Multivariate logistic regression analysis was applied to adjust the confounders [age, gender, risk habits (cigarette smoking, betel quid chewing and alcohol drinking)] and clinico-pathologic parameters [tumour sizes, lymph node metastasis and pathological tumour
staging]

100
Table 4.8: Multivariate Cox regression model analysis of chromosome 8p in OSCC
overall survival.
Variables Category No. of
patients (%)
Multivariate Logistic
regression**
HRR 95% CI p value
Total 75
chromosome 8p No deletion 53 (70.7) 1.00†
0.004 Deletion 22 (29.3) 3.088 1.426-6.689
Gender Male 26 (34.7) 1.00† 0.380
Female 49 (65.3) 1.535 0.589-4.001
Age (years) < 45 12 (16.0) 1.00† 0.348
≥ 45 63 (84.0) 1.666 0.573-4.839
Smoking No 52 (69.3) 1.00† 0.298
Yes 23 (30.7) 0.596 0.224-1.580
Drinking No 64 (85.3) 1.00† 0.768
Yes 11 (14.7) 1.215 0.333-4.430
Betel quid chewing No 40 (53.3) 1.00† 0.224
Yes 35 (46.7) 1.68 0.728-3.875
Tumour size T1-T2 45 (60.0) 1.00† 0.017
T3-T4 30 (40.0) 3.04 1.217-7.594
Lymph node
metastasis
Negative 38 (50.7) 1.00† 0.182
Positive 37 (49.3) 1.906 0.739-4.913
pTNM Staging Early 26 (34.7) 1.00† 0.209
Advanced 49 (65.3) 2.67 0.577-12.355
CI: confidence interval † Reference category
Significant p - value were highlighted in bold.
**Multivariate logistic regression analysis was applied to adjust the confounders [age, gender, risk habits (cigarette smoking, betel quid chewing and alcohol drinking)] and clinico-pathologic parameters [tumour sizes, lymph node metastasis and pathological tumour
staging]

101
Table 4.9: Multivariate Cox regression model analysis of the combination of
chromosome 7p, 8q, 9p and 11q in OSCC overall survival.
Variables Category No. of
patients
(%)
Multivariate Logistic regression**
HRR 95% CI p value
Total 75
chr7p8q9p11q
No amplification 24 (32.0) 1.00† 0.026
Amplification ≥ 1
marker
51 (68.0) 3.554 1.161-10.886
Gender Male 26 (34.7) 1.00† 0.969
Female 49 (65.3) 1.017 0.446-2.316
Age (years) < 45 12 (16.0) 1.00† 0.432
≥ 45 63 (84.0) 1.525 0.532-4.370
Smoking No 52 (69.3) 1.00† 0.490
Yes 23 (30.7) 0.719 0.281-1.838
Drinking No 64 (85.3) 1.00† 0.668
Yes 11 (14.7) 1.314 0.377-4.583
Betel quid chewing No 40 (53.3) 1.00† 0.074
Yes 35 (46.7) 2.078 0.931-4.640
Tumour size T1-T2 45 (60.0) 1.00† 0.061
T3-T4 30 (40.0) 2.385 0.960-5.924
Lymph node
metastasis
Negative 38 (50.7) 1.00† 0.319
Positive 37 (49.3) 1.615 0.630-4.141
pTNM Staging Early 26 (34.7) 1.00† 0.214
Advanced 49 (65.3) 2.652 0.569-12.363
CI: confidence interval † Reference category
Significant p - value were highlighted in bold.
**Multivariate logistic regression analysis was applied to adjust the confounders [age, gender, risk habits (cigarette smoking, betel quid chewing and alcohol drinking)] and clinico-pathologic parameters [tumour sizes, lymph node metastasis and pathological tumour
staging]
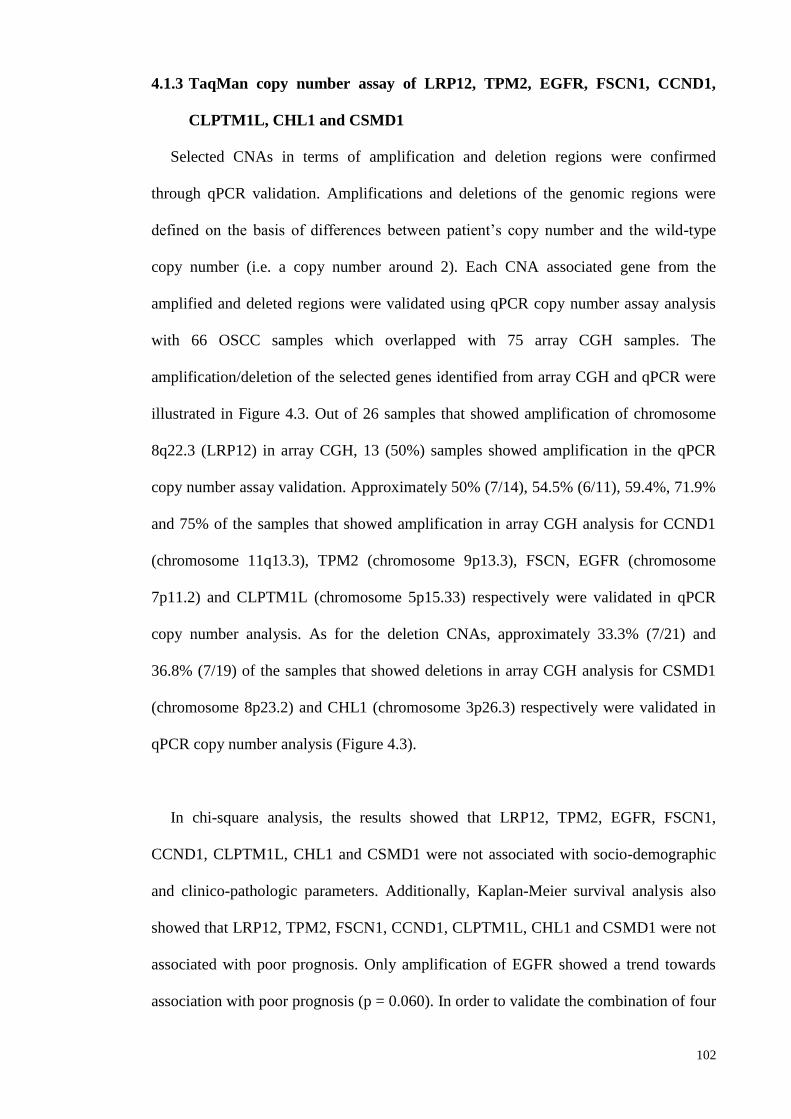
102
4.1.3 TaqMan copy number assay of LRP12, TPM2, EGFR, FSCN1, CCND1,
CLPTM1L, CHL1 and CSMD1
Selected CNAs in terms of amplification and deletion regions were confirmed
through qPCR validation. Amplifications and deletions of the genomic regions were
defined on the basis of differences between patient’s copy number and the wild-type
copy number (i.e. a copy number around 2). Each CNA associated gene from the
amplified and deleted regions were validated using qPCR copy number assay analysis
with 66 OSCC samples which overlapped with 75 array CGH samples. The
amplification/deletion of the selected genes identified from array CGH and qPCR were
illustrated in Figure 4.3. Out of 26 samples that showed amplification of chromosome
8q22.3 (LRP12) in array CGH, 13 (50%) samples showed amplification in the qPCR
copy number assay validation. Approximately 50% (7/14), 54.5% (6/11), 59.4%, 71.9%
and 75% of the samples that showed amplification in array CGH analysis for CCND1
(chromosome 11q13.3), TPM2 (chromosome 9p13.3), FSCN, EGFR (chromosome
7p11.2) and CLPTM1L (chromosome 5p15.33) respectively were validated in qPCR
copy number analysis. As for the deletion CNAs, approximately 33.3% (7/21) and
36.8% (7/19) of the samples that showed deletions in array CGH analysis for CSMD1
(chromosome 8p23.2) and CHL1 (chromosome 3p26.3) respectively were validated in
qPCR copy number analysis (Figure 4.3).
In chi-square analysis, the results showed that LRP12, TPM2, EGFR, FSCN1,
CCND1, CLPTM1L, CHL1 and CSMD1 were not associated with socio-demographic
and clinico-pathologic parameters. Additionally, Kaplan-Meier survival analysis also
showed that LRP12, TPM2, FSCN1, CCND1, CLPTM1L, CHL1 and CSMD1 were not
associated with poor prognosis. Only amplification of EGFR showed a trend towards
association with poor prognosis (p = 0.060). In order to validate the combination of four
103
chromosomes (chr7p8q9p11q) that was reported previously, the candidate genes that
harboured within this combination of 4 amplified chromosomes (chr7p8q9p11q)
namely EGFR (7p), LRP12 (8q), TPM2 (9p) and CCND1 (11q) were subjected to
statistical analysis. In addition, this study also tested whether the combination of the
four genetic markers (CCND1, EGFR, TPM2 and LRP12) could further increase the
sensitivity and specificity as a prognostic marker in OSCC samples. The combined
AUC for all the markers was 0.621 which is higher than the single markers of the
genetic markers. The OSCC patients were divided into those who have a cumulative
score of 0 markers (group 1) versus those with a cumulative score of 1, 2, 3, or 4
markers (group 2). The Kaplan-Meier survival curves showed a significant survival
probability difference between patients in groups 1 and 2 (p = 0.045) (Figure 4.4).
Furthermore, the Cox regression multivariate model revealed that the 4 combined
genetic marker remained as an independent prognostic factor with hazard risk ratio
(HRR = 2.34) towards death in patients with amplification of 1 or more markers after
adjustment for age, gender, risk habits and clinico-pathologic parameters (tumour sizes,
lymph node metastasis, tumour staging and tumour differentiation) (Table 4.10).
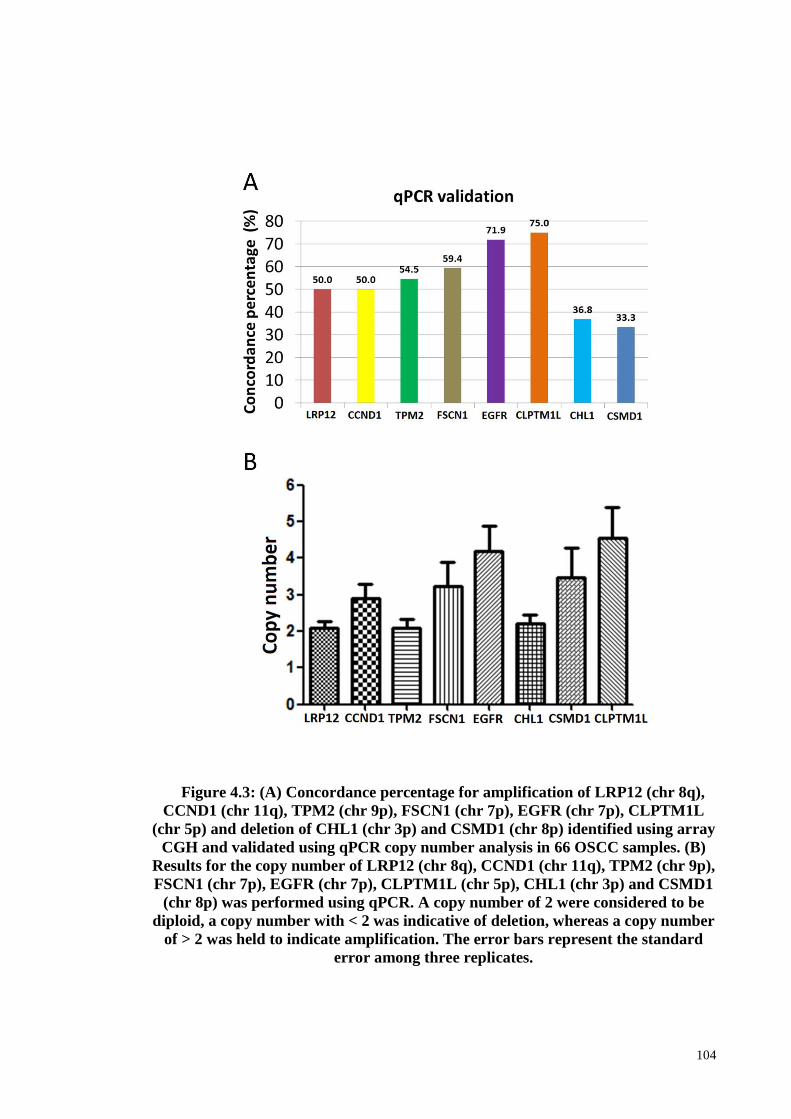
104
Figure 4.3: (A) Concordance percentage for amplification of LRP12 (chr 8q),
CCND1 (chr 11q), TPM2 (chr 9p), FSCN1 (chr 7p), EGFR (chr 7p), CLPTM1L
(chr 5p) and deletion of CHL1 (chr 3p) and CSMD1 (chr 8p) identified using array
CGH and validated using qPCR copy number analysis in 66 OSCC samples. (B)
Results for the copy number of LRP12 (chr 8q), CCND1 (chr 11q), TPM2 (chr 9p),
FSCN1 (chr 7p), EGFR (chr 7p), CLPTM1L (chr 5p), CHL1 (chr 3p) and CSMD1
(chr 8p) was performed using qPCR. A copy number of 2 were considered to be
diploid, a copy number with < 2 was indicative of deletion, whereas a copy number
of > 2 was held to indicate amplification. The error bars represent the standard
error among three replicates.

105
Figure 4.4: Overall survival curves were analyzed according to the 4 combined
genetic marker (EGFR+CCND1+TPM2+LRP12) using Kaplan-Meier estimate
with log-rank test.

106
Table 4.10: Multivariate Cox regression model analysis of four combined
genetic marker consisting of EGFR, TPM2, CCND1 and LRP12 in OSCC overall
survival.
Variables Category No. of
patients (%)
Multivariate Logistic regression**
Total 66 HRR 95% CI p value
Four combined genetic
marker
no marker 40 (60.6) 1.00† 0.038
≥ 1 marker 26 (39.4) 2.343 1.047-5.244
Gender Male 24 (36.4) 1.00† 0.508
Female 42 (63.6) 1.4 0.517-3.794
Age (years) < 45 12 (18.2) 1.00† 0.977
≥ 45 54 (81.8) 1.016 0.331-3.119
Smoking No 45 (68.2) 1.00† 0.589
Yes 21 (31.8) 0.744 0.254-2.178
Drinking No 57 (86.4) 1.00† 0.398
Yes 9 (13.6) 1.899 0.429-8.406
Betel quid chewing No 35 (53.0) 1.00† 0.107
Yes 31 (47.0) 2.089 0.852-5.122
Tumour size T1-T2 37 (56.1) 1.00† 0.018
T3-T4 29 (43.9) 3.36 1.23-9.177
Lymph node metastasis Negative 33 (50.0) 1.00† 0.228
Positive 33 (50.0) 1.843 0.682-4.983
pTNM Staging Early 22 (33.3) 1.00† 0.322
Advanced 44 (66.7) 2.27 0.449-11.484
Differentiation Well 27 (40.9) 1.00† 0.299
Moderate and
poor
39 (59.1) 1.526 0.687-3.388
CI: confidence interval
† Reference category Significant p - value were highlighted in bold.
**Multivariate logistic regression analysis was applied to adjust the confounders [age, gender, risk habits (cigarette smoking, betel
quid chewing and alcohol drinking)] and clinico-pathologic parameters [tumour sizes, lymph node metastasis and pathological tumour staging]

107
Objective 2: To identify the pathways and networks implicated in OSCC pathogenesis.
4.2 Biological process analysis
This study aimed to present the results in accordance with the specific objectives as
such the first objective is to determine and validate the CNAs of OSCC using array
CGH and qPCR copy number assay.
To explore the potential effects of the chromosomal alterations implicated in the
molecular mechanism of oral tumourigenesis, the biological functions annotations and
biological network that were associated with CNAs were further analyzed. The top
significant signalling pathways were identified as integrin-linked kinase signalling
pathway (Table 4.11). The molecular and cellular functions were categorized into five
different groups including cell death and survival, cellular function and maintenance,
cellular development, cellular growth and proliferation, and cellular movement. The
associated top five molecular and cellular functions of these categories were listed in
Table 4.12. The top molecular and cellular functions were reported as cell death and
survival, cellular function and maintenance which is mostly associated with colony
survival of cells (p = 8.72E-05) through contributing of ATR, CA9, CCND1, FANCG,
RAD21, RB1CC1, TERC and TNFSF10 genes. The category of diseases was reported
as related to head and neck squamous cell cancer with 26 genes associated with this
cancer. These 26 genes were MALAT1, MRC1, POLQ, CCND1, SOX17, LIFR, FGF4,
mir-15, FGF3, SHANK2, RAD21, EGFR, FGF19, PPFIA1, TPCN2, MECOM, ANO1,
ORAOV1, FADD, DDX58, EPPK1, LYN, ATR, SETD2, MYEOV and CTTN.

108
Table 4.11: Top significant pathways that associated with CNAs associated
genes
Ingenuity Canonical
Pathways
-log (p-
value)
Molecules
ILK Signaling 3.26E00 RELA,SNAI2,CFL1,ACTB,PPP2R5B,ACTN3,VEGFB,
VIM,PIK3R4,RICTOR,PPP1R14B,CCND1,PPP2R3A,R
HOD,RHOA,PPM1L,RPS6KA4,PIK3CB,GSK3B,TESK
1,ITGB5,MYL3
mTOR Signaling 3.23E00 EIF3H,PPP2R5B,RAC1,VEGFB,EIF3E,PIK3R4,RICTO
R,PLD1,FAU,PRKCI,RPS20,EIF3B,PPP2R3A,RHOD,R
HOA,PPM1L,PRKAA1,MRAS,RPS6KB2,PIK3CB,RPS
6KA4,RPS3
Tight Junction Signaling 2.59E00 RELA,CLDN11,ACTB,HSF1,PPP2R5B,CLDN18,MAR
K2,CPSF1,RAC1,PRKAR2A,MYLK,GPAA1,PRKCI,P
PP2R3A,CLDN1,RHOA,PPM1L,PRKAR1B,MYL3
Role of CHK Proteins in Cell
Cycle Checkpoint Control
2.47E00 PPP2R3A,RAD9A,PPP2R5B,PPM1L,E2F5,ATR,NBN,
RAD1,CDC25A
UVA-Induced MAPK
Signaling
2.47E00 TIPARP,PARP15,PARP10,RPS6KB2,MRAS,PLCB3,PI
K3CB,RPS6KA4,PIK3R4,PARP9,EGFR,PARP14
NRF2-mediated Oxidative
Stress Response
2.28E00 DNAJB8,ACTB,DNAJC13,DNAJC1,PIK3R4,MAFK,D
NAJA1,DNAJB13,DNAJC21,PRKCI,DNAJC4,STIP1,V
CP,MRAS,FOSL1,PIK3CB,GSK3B,GSTP1,DNAJB5
p70S6K Signaling 2.19E00 BAD,PPP2R5B,PIK3R4,PLD1,GNAI2,PRKCI,PPP2R3
A,PPM1L,MRAS,LYN,PLCB3,PIK3CB,AGTR1,EGFR
HIPPO signaling 2.1E00 YAP1,PPP2R3A,WWTR1,PPP2R5B,PPM1L,SCRIB,M
ST1,PPP1CA,PPP1R14B,RASSF1,SKP2

109
Table 4.11, continued
Ingenuity Canonical
Pathways
-log(p-
value)
Molecules
p53 Signaling 2.05E00 PRKDC,SNAI2,TP63,TOPBP1,STAG1,ADGRB1,ATR,
PIK3CB,GSK3B,PIK3R4,CCND1,GML
Death Receptor Signaling 1.88E00 FADD,RELA,TIPARP,PARP15,PARP10,ACTB,TNFSF
10,PARP9,BIRC3,BIRC2,PARP14

110
Table 4.12: Top significant molecular and cellular functions associated with
CNAs associated genes.
Molecular and Cellular
Functions
Function
annotation
p values Molecule Genes
Cell Death and Survival colony survival of
cells
1.89E-04 ATR,CA9,CCND1,FANCG,RA
D21,RB1CC1,TERC,TNFSF10
colony survival of
tumour cell lines
9.17E-04 CA9,CCND1,FANCG,RAD21,R
B1CC1,TERC,TNFSF10
cell viability of
fibroblast cell lines
1.07E-03 ATR,CEBPD,FANCG,MUS81,N
BN,RAD9A
apoptosis of kidney
cell lines
1.67E-03 ADRBK1,BAD,BCL6,BIRC2,BI
RC3,CALB1,CASR,CHMP5,FA
DD,FGF19,GSK3B,ITPR1,LYN,
PRKAA1,RAC1,RAD21,RNF13,
RNF216,SYVN1,TNFSF10,TRP
S1,UNC13B,VOPP1,YAP1
cell death of kidney
cell lines
2.95E-03 ADRBK1,BAD,BCL6,BIRC2,BI
RC3,CALB1,CASR,CHMP5,FA
DD,FGF19,GSK3B,GSTP1,IP6K
2,ITPR1,LYN,NMNAT3,PRKA
A1,PRKDC,RAC1,RAD21,RAS
SF1,RNF13,RNF216,SYVN1,TN
FSF10,TRPS1,UNC13B,VOPP1,
YAP1
Cellular Function and
Maintenance
colony survival of
cells
1.89E-04 ATR,CA9,CCND1,FANCG,RA
D21,RB1CC1,TERC,TNFSF10
colony survival of
tumour cell lines
9.17E-04 CA9,CCND1,FANCG,RAD21,R
B1CC1,TERC,TNFSF10
autophagy of
epithelial cells
3.16E-03 FADD,TNFSF10
colony survival of
breast cancer cell
lines
3.16E-03 CA9,RB1CC1
uptake of bacteria 5.24E-03 OTUB1,RAC1,RHOA

111
Table 4.12, continued
Molecular and Cellular
Functions
Function
annotation
p values Molecule Genes
Cellular Development proliferation of lung
cancer cell lines
4.46E-04 ALDH1L1,BAD,BOP1,CAMP,C
CND1,CDCA5,COPB2,ECT2,E
GFR,FOSL1,GOLPH3,ITPR1,mi
r-15,mir-191,mir-192,mir-
194,MMP1,MST1R,PIK3CB,PL
S1,POLD4,PRKCI,RAC1,RASS
F1,RELA,SEMA3B,SKP2,TNFS
F10,TP63,TRPC1,TUSC2,YAP1
proliferation of
breast cell lines
2.24E-03 CCND1,EGFR,EIF3E,NUDT1,P
GR,PRLR,RAC1,RELA,RHOA,
RICTOR,TP63,TRAIP,WWTR1,
YAP1
maturation of
mononuclear
leukocytes
3.16E-03 NCK1,TNFSF10
epithelial-
mesenchymal
transition of bladder
cancer cell lines
9.14E-03 MALAT1,TP63
proliferation of
keratinocytes
9.55E-03 CASR,EGFR,SNAI2,TERC,TP6
3,TRH,YAP1
Cellular Growth and
Proliferation
proliferation of lung
cancer cell lines
4.46E-04 ALDH1L1,BAD,BOP1,CAMP,C
CND1,CDCA5,COPB2,ECT2,E
GFR,FOSL1,GOLPH3,ITPR1,mi
r-15,mir-191,mir-192,mir-
194,MMP1,MST1R,PIK3CB,PL
S1,POLD4,PRKCI,RAC1,RASS
F1,RELA,SEMA3B,SKP2,TNFS
F10,TP63,TRPC1,TUSC2,YAP1
proliferation of
breast cell lines
2.24E-03 CCND1,EGFR,EIF3E,NUDT1,P
GR,PRLR,RAC1,RELA,RHOA,
RICTOR,TP63,TRAIP,WWTR1,
YAP1
proliferation of
epithelial cells
9.46E-03 CASR,CCND1,EGFR,GOLPH3,
MST1R,SKP2,SNAI2,TERC,TP
63,TRH,YAP1
proliferation of
keratinocytes
9.55E-03 CASR,EGFR,SNAI2,TERC,TP6
3,TRH,YAP1
colony formation of
bone cancer cell
lines
1.32E-02 DROSHA,MAD1L1,mir-
192,YAP1

112
Table 4.12, continued
Molecular and Cellular
Functions
Function
annotation
p values Molecule Genes
Cellular Movement migration of
carcinoma cell lines
6.85E-04 BRMS1,CAMP,CTTN,DDX58,E
GFR,LYN,MEN1,mir-15,mir-
612,MMP1,MMP3,MMP7,PRK
CI,RAC1,RASSF1,RHOA,SNAI
2,TP63,TRH,VIM,VPS28
migration of tumour
cell lines
1.65E-03 ARRB1,BAG1,BRMS1,CA9,CA
MP,CCL19,CCND1,CST6,CTT
N,DAB2,DDX58,DROSHA,E2F
5,ECT2,EGFR,ESRRA,FOSL1,F
SCN1,GDNF,GNA12,GOLPH3,
GPER1,GRINA,GSK3B,IP6K2,I
TGB5,ITPR1,LYN,MALAT1,M
EN1,mir-15,mir-326,mir-
612,MME,MMP1,MMP3,MMP7
,MRAS,MST1,MST1R,NDUFA
F3,P2RY2,PDGFA,PGR,PLD1,P
LXNA1,PLXNB1,PPFIA1,PRK
CI,PTGER4,PTP4A3,RAC1,RA
D9A,RARRES1,RASSF1,RELA,
RHOA,RICTOR,RUVBL1,SDC
BP,SNAI2,SST,TNFSF10,TP63,
TRH,VCP,VEGFB,VIM,VPS28,
WWTR1
cell movement of
lung cancer cell
lines
2.36E-03 BRMS1,CAMP,EGFR,FOSL1,M
EN1,MMP1,MMP7,PRKCI,RAC
1,RASSF1,RHOA,TP63,TRH,VI
M,VPS28
cell movement of
carcinoma cell lines
2.36E-03 BRMS1,CAMP,CTTN,DDX58,E
GFR,FOSL1,LY6D,LYN,MEN1,
mir-15,mir-
612,MMP1,MMP3,MMP7,PRK
CI,RAC1,RASSF1,RHOA,SNAI
2,TP63,TRH,VIM,VPS28
migration of lung
cancer cell lines
2.52E-03 BRMS1,CAMP,EGFR,MEN1,M
MP1,MMP7,PRKCI,RAC1,RAS
SF1,RHOA,TRH,VIM,VPS28

113
Results of network analysis of 1427 CNA associated genes have been summarized in
Table 4.13. The most significant network was linked to cell death and survival, cellular
movement, cellular development. Top significant network harbours 73 genes and
among which the major cores CCND1, RELA, TP63 and EGFR were hub nodes in the
network, and formed interconnected auto-regulatory and feed forward circuitry (Figure
4.5). The associated network functions analysis revealed that the core-bound genes are
mostly relevant to the growth of tumour proliferation, evade apoptosis signal to promote
cell survival and metastasis. Apart from that, this analysis also revealed putative novel
oncogenes, namely ISG15 and MMP13 involved in the network signalling that linked
with cell death and survival, cellular movement, cellular development. These genes
were prioritized for further evaluation and characterization in OSCC by quantification
of mRNA and protein expression levels as their clinical impact in oral cancer is poorly
understood and literature suggests a high probability of involvement in tumourigenesis.
These genes were found to harbor in rare amplicons (chromosome 1p36.33 and
11q22.2), however, it has been hypothesized that even rare amplicons would be
informative regarding genes crucial in tumor development as the expression may be
altered by either copy number changes or other mechanisms by disrupting the upstream
or downstream genes in different mechanisms that control a particular pathway
(Snijders et al., 2005). Therefore, in order to test this hypothesis whether ISG15 is a
driver gene in OSCC (as MMP13 roles in oral tumorigenesis has been studied
previously). Therefore, ISG15 was selected for further downstream analysis which is to
determine its gene and protein expression in OSCC samples as well as its functional
roles via in vitro study using OSCC cell line models based on its involvement in the
oncogenic network (cell death and survival, cellular movement, cellular development).

114
Table 4.13: Top significant networks and the associated network functions that
linked with CNAs associated genes.
No Top Diseases and
Functions
Score Focus
Molecules
Molecules in Network
1 Cell Death and
Survival, Cellular
Movement, Cellular
Development
73 87 14-3-3,26s
Proteasome,ADRBK1,AIP,ANGPT1,A
RRB1,ATR,Actin,Akt,Ap1,BAD,BAG1
,BCR(complex),BIRC2,BIRC3,CAMP,
CARD11,CARD6,CASR,CCND1,CD3,
CD86,CDC25A,CEBPD,CORO1B,CP
NE4,CPT1A,CYP11B2,Caspase3/7,Cdk
,Creb,CyclinA,CyclinE,DAB2,DDX58,
EGFR,ERK,ERK1/2,FActin,FADD,FO
SL1,FSCN1,Focaladhesionkinase,GDN
F,GPER1,GSK3B,Gsk3,Hdac,Histoneh
3,Histoneh4,Hsp27,Hsp70,Hsp90,IFNB
eta,IKK(complex),ISG15,IgG,Interferon
alpha,Jnk,KAT5,LY6E,LY6K,LYN,M
AP2K1/2,MAP3K11,MAP4K2,MBD4,
MMP1,MMP13,MST1R,MTORC1,MT
ORC2,MUS81,MYLK,Mek,Mmp,NEU
3,NFkB(complex),Nfat(family),OVOL1
,P2RY2,P2RY6,P38MAPK,PARP,PDG
FBB,PELI3,PGR,PI3K(complex),PI3K(
family),PIK3CB,PLD1,PLSCR1,PRKC
I,PRKDC,PRLR,PTGER4,PTP4A3,Pkc
(s),Pld,RAC1,RASSF1,RELA,RHOA,R
ICTOR,RIPK2,RNF216,RPS3,RUSC2,
Rac,Ras,Rashomolog,Rock,SCRIB,SD
CBP,SEMA3B,SHARPIN,SKIL,SKP2,
SNAI2,Shc,Smad2/3,TCR,TNFSF10,TP
63,TRAIP,TRPC1,TRPC6,UBA7,USP1
9,VCP,VEGFB,VIM,VOPP1,Vegf,WW
TR1,YAP1,caspase,estrogenreceptor,mi
r-506,p85 (pik3r)

115
Figure 4.5: The top significant network was related to cell death and survival,
cellular movement, cellular development. Top significant network harbours 73
genes among which the major cores CCND1, RELA, TP63 and EGFR (located in
the red circle) were hub nodes in the network, and formed interconnected auto-
regulatory and feed forward circuitry.

116
Objective 3: To identify and determine the mRNA and protein expression of candidate
genes and their correlation with clinical and socio-demographic parameters as well as
the survival of patients.
4.3 Copy number, mRNA and protein expression of candidate genes in OSCC
4.3.1 MMP13
4.3.1.1 MMP13 gene copy number, mRNA and protein expression in OSCC
Amplification of MMP13 was identified in 5.33% of the OSCC samples (4 out of 75)
in chromosome 11q22.2 using array CGH (Table 4.2). In line with this, the MMP13
mRNA was found to be expressed significantly at a high level in 95.59% of the OSCC
samples (65 out of 68) with an average gene expression fold change of 276.28
compared to the non-cancer oral mucosa samples with fold change of 1 (p = 0.002)
(Figure 4.6). In the current study, protein expression of MMP13 was examined by IHC
analysis. Ovarian cancer tissue was used as the positive control for
immunohistochemistry of MMP13 protein expression. The positive control tissue
demonstrated strong staining in the cytoplasm of tumour cells (Figure 4.7). Moreover,
the negative control (OSCC tissue) for immunohistochemistry showed an absence of
cytoplasmic and nuclear staining (Figure 4.7). MMP13 was expressed in all of the
OSCC and OED samples. IHC analysis clearly demonstrated that MMP13 protein
expression was specifically detected in OED and OSCC indicating that this gene is
likely to be associated with both OED and OSCC. In IHC analysis of MMP13 protein,
the epithelial cells of non-cancer oral mucosal tissues showed a negative staining. Weak
to moderate staining was seen in the cytoplasm of epithelial cells of the basal and
spinous layers in OED. More than 75% of OSCCs displayed strong staining in the
cytoplasm of epithelial tumour cells. All the non-cancer, OED and OSCC tissue
samples demonstrated moderate MMP13 immunostaining of the stromal compartment

117
including the inflammatory cells. There was no MMP13 protein expression was found
innon-cancer oral mucosal tissues whereas MMP13 was over-expressed in OED and
OSCC, respectively. A representative haematoxylin and eosin (H&E) and IHC stained
image for protein expression group of MMP13 is shown in Figure 4.7.
Figure 4.6: Average gene expression fold change of MMP13 in OSCC (n = 68)
compared to normal oral mucosa sample (n = 5). Gene expression fold change of
MMP13 was 276.28 while the gene expression between OSCC and non-cancer oral
mucosa was statistically different (p < 0.005). The RQ for non-cancer oral mucosa
of MMP13 was 1 and used for normalization.
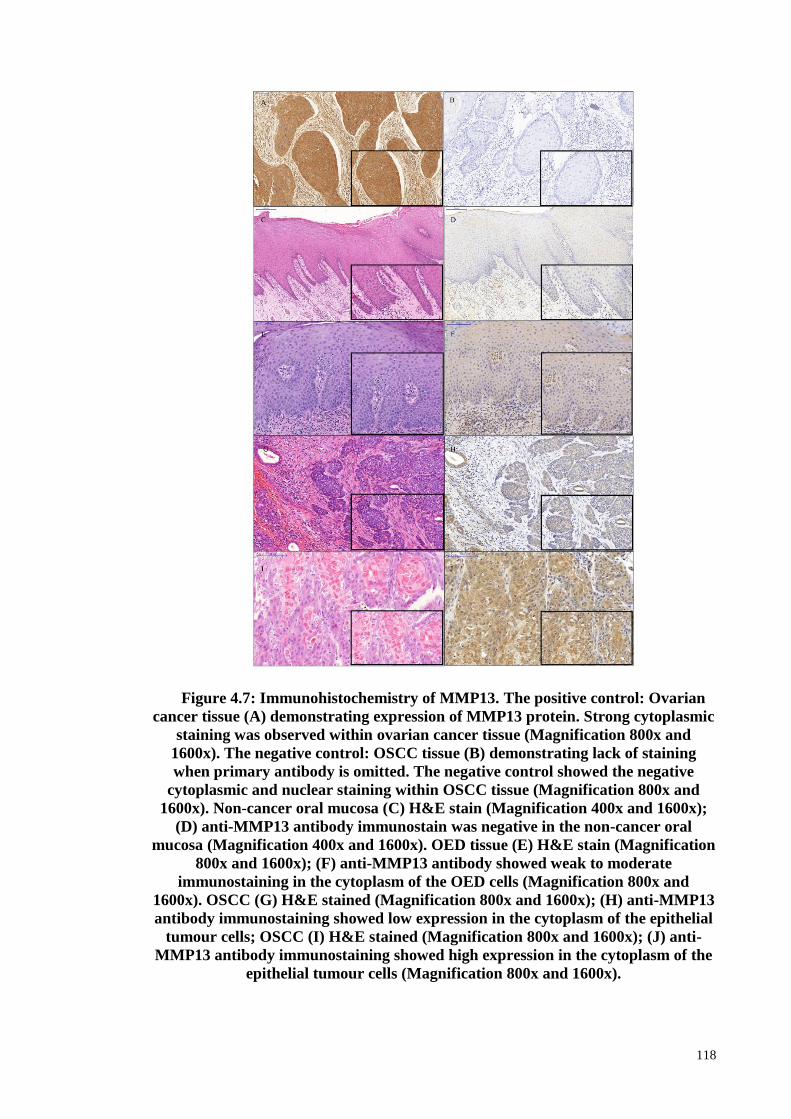
118
Figure 4.7: Immunohistochemistry of MMP13. The positive control: Ovarian
cancer tissue (A) demonstrating expression of MMP13 protein. Strong cytoplasmic
staining was observed within ovarian cancer tissue (Magnification 800x and
1600x). The negative control: OSCC tissue (B) demonstrating lack of staining
when primary antibody is omitted. The negative control showed the negative
cytoplasmic and nuclear staining within OSCC tissue (Magnification 800x and
1600x). Non-cancer oral mucosa (C) H&E stain (Magnification 400x and 1600x);
(D) anti-MMP13 antibody immunostain was negative in the non-cancer oral
mucosa (Magnification 400x and 1600x). OED tissue (E) H&E stain (Magnification
800x and 1600x); (F) anti-MMP13 antibody showed weak to moderate
immunostaining in the cytoplasm of the OED cells (Magnification 800x and
1600x). OSCC (G) H&E stained (Magnification 800x and 1600x); (H) anti-MMP13
antibody immunostaining showed low expression in the cytoplasm of the epithelial
tumour cells; OSCC (I) H&E stained (Magnification 800x and 1600x); (J) anti-
MMP13 antibody immunostaining showed high expression in the cytoplasm of the
epithelial tumour cells (Magnification 800x and 1600x).

119
4.3.1.2 Association of MMP13 mRNA expression with clinico-pathologic
parameters and survival
Expression of MMP13 mRNA was significantly higher in OSCCs compared with
non-cancer oral mucosa samples (p < 0.005), but it had no significant association with
clinico-pathologic factors. The follow-up time for patients that were used for analysis of
MMP13 mRNA expression ranged from 1 to 52 months (mean: 17.71 months, median:
13.0 months). Three-year survival rates for low and high mRNA expression of MMP13
were 57.76% and 17.45%, respectively. The MMP13 mRNA expression showed
significant correlation with poor prognosis (p = 0.016) in Kaplan-Meier analysis (Figure
4.8). In multivariate Cox regression analysis, the expression of MMP13 mRNA
remained as a significant prognostic factor for survival after adjustment for age, gender,
risk habits and clinico-pathologic parameters (tumour sites, lymph node metastasis and
tumour staging) which are the common confounding factors in OSCC (HRR = 2.23,
95% CI 1.015-4.896, p = 0.046) (Table 4.14 ).

120
Figure 4.8: Overall survival curves were analyzed according to MMP13 mRNA
expression using Kaplan-Meier estimate with log-rank test.

121
Table 4.14: Multivariate Cox regression model analysis of MMP13 mRNA
expression in OSCC overall survival.
Variables Category No. of patients
(%)
Multivariate Logistic
regression**
HRR 95% CI p value
Total 68
mRNA
expression of
MMP13
Low 50 (73.5) 1.00† 1.015-4.896 0.046
High 18 (26.5) 2.23
Gender Male 24 (35.3) 1.00† 0.388-2.806 0.933
Female 44 (64.7) 1.043
Age (years) < 45 12 (17.6) 1.00† 0.397-3.009 0.864
≥ 45 56 (82.4) 1.092
Smoking No 44 (64.7) 1.00† 0.240-2.071 0.524
Yes 24 (35.3) 0.704
Drinking No 51 (75.0) 1.00† 0.391-2.341 0.922
Yes 17 (25.0) 0.956
Betel quid
chewing
No 40 (58.8) 1.00† 0.652-3.718 0.319
Yes 28 (41.2) 1.557
Tumour site Non-
tongue*
38 (55.9) 1.00† 0.516-2.933 0.640
Tongue 30 (44.1) 1.230
Lymph node
metastasis
Negative 33 (48.5) 1.00† 1.028-20.275 0.046
Positive 35 (51.5) 4.565
pTNM
Staging
Early 22 (32.4) 1.00† 0.339-13.469 0.419
Advanced 46 (67.6) 2.137
CI: confidence interval
*Buccal mucosa, gingiva, lip, floor of mouth, palate † Reference category Significant p - value were highlighted in bold. **Multivariate logistic regression analysis was applied to adjust the confounders [age, gender, risk habits (cigarette
smoking, betel quid chewing and alcohol drinking)] and clinico-pathologic parameters [tumour sites, lymph node
metastasis and pathological tumour staging]

122
4.3.1.3 Definition of Cut-off Score for MMP13 protein expression in OSCC
Receiver operating characteristic (ROC) curve analysis was performed based on the
results of IHC evaluation. Results showed that ROC curve analysis for tumour staging
has the shortest distance from the curve to the point (0.0, 1.0) (Table 4.15). Hence, the
cut-off value for tumour staging was selected. The cut-off score for low MMP13 protein
expression was set to < 3.50 and the counterpart as a high MMP13 protein expression.
Table 4.15: Area under the receiver operating characteristic curve (AUC) of
MMP13 for each clinico-pathological feature.
Clinico-pathological parameters AUC (95% CI) p value
Lymph node metastasis (Yes vs. No) 0.565 (0.453-0.677) 0.264
Tumour staging (Advanced vs. Early) 0.606 (0.486-0.725) 0.076
Tumour sizes (T1 and T2 vs. T3 and T4) 0.552 (0.439-0.664) 0.378
Survival (death vs. alive) 0.525 (0.409-0.642) 0.658

123
4.3.1.4 Association of MMP13 protein expression (IHC) with clinico-pathologic
parameters and survival
A total of 103 OSCC samples were subjected to IHC. Results showed that high level
of MMP13 protein expression was significantly associated with lymph node metastasis
(LNM positive: 90.90% vs LNM negative: 70.2%, p = 0.011) and tumour staging
(Advanced stage: 88.9% vs Early stage: 63.2%, p = 0.002) (Table 4.16). For MMP13
protein expression, the follow-up time for patients ranged from 1 to 92 months (mean:
29.13 months, median: 20.5 months). Three-year survival rate for the high and low
expression of MMP13 protein was 34.73% and 72.38%, respectively. Results of the
overall survival rate analysis demonstrated a significant association between positive
MMP13 protein expression and poor prognosis (p = 0.005) (Figure 4.9). High MMP13
protein expression showed a considerable trend as an independent prognostic factor
towards unfavourable overall survival after adjustment with other clinico-pathological
parameters such as tumour subsites, lymph node metastasis, tumour staging, the pattern
of invasion and tumour differentiation (HRR = 2.84, 95% CI 0.922-8.768, p = 0.069)
(Table 4.17).

124
Table 4.16: Association of MMP13 protein expression (IHC) with clinico-
pathological parameters.
Variables Category No. of patients (%) MMP13 expression (n, %)
Low level of
expression
High level of
expression
p value
103 21 (20.4) 82 (79.6)
Total
Gender Male 35 (34.0) 10 (28.6) 25 (71.4) 0.139
Female 68 (66.0) 11 (16.2) 57 (83.8)
Age (years) < 45 11 (10.7) 3 (27.3) 8 (72.7) 0.691
≥ 45 92 (89.3) 18 (19.6) 74 (80.4)
Smoking No 81 (78.6) 15 (18.5) 66 (81.5) 0.380
Yes 22 (21.4) 6 (27.3) 16 (72.7)
Drinking No 71 (68.9) 13 (18.3) 58 (81.7) 0.435
Yes 32 (31.1) 8 (25.0) 24 (75.0)
Betel quid chewing No 49 (47.6) 10 (20.4) 39 (79.6) 0.996
Yes 54 (52.4) 11 (20.4) 43 (79.6)
Tumour site Non-tongue* 68 (66.0) 14 (20.6) 54 (79.4) 0.944
Tongue 35 (34.0) 7 (20.0) 28 (80.0)
Tumour size** T1-T2 59 (58.4) 16 (27.1) 43 (72.9) 0.063
T3-T4 42 (41.6) 5 (11.9) 37 (88.1)
Lymph node
metastasis**
Negative 57 (56.4) 17 (29.8) 10 (70.2) 0.011
Positive 44 (43.6) 4 (9.1) 40 (90.9)
pTNM Staging** Early stage 38 (37.6) 14 (36.8) 24 (63.2) 0.002
Advanced stage 63 (62.4) 7 (11.1) 56 (88.9)
Pattern of invasion** Cohesive 13 (15.5) 5 (38.5) 8 (61.5) 0.140
Non-cohesive 71 (84.5) 13 (18.3) 58 (81.7)
Differentiation** Well 45 (44.1) 11 (24.4) 34 (75.6) 0.392
Poor and
Moderate
57 (55.9) 10 (17.5) 47 (82.5)
*Buccal mucosa, gingiva, lip, floor of mouth, palate
** Data missing Significant p - values are highlighted in bold.

125
Figure 4.9: Overall survival curves were analyzed according to MMP13 protein
expression (IHC) using Kaplan-Meier estimate with log-rank test.
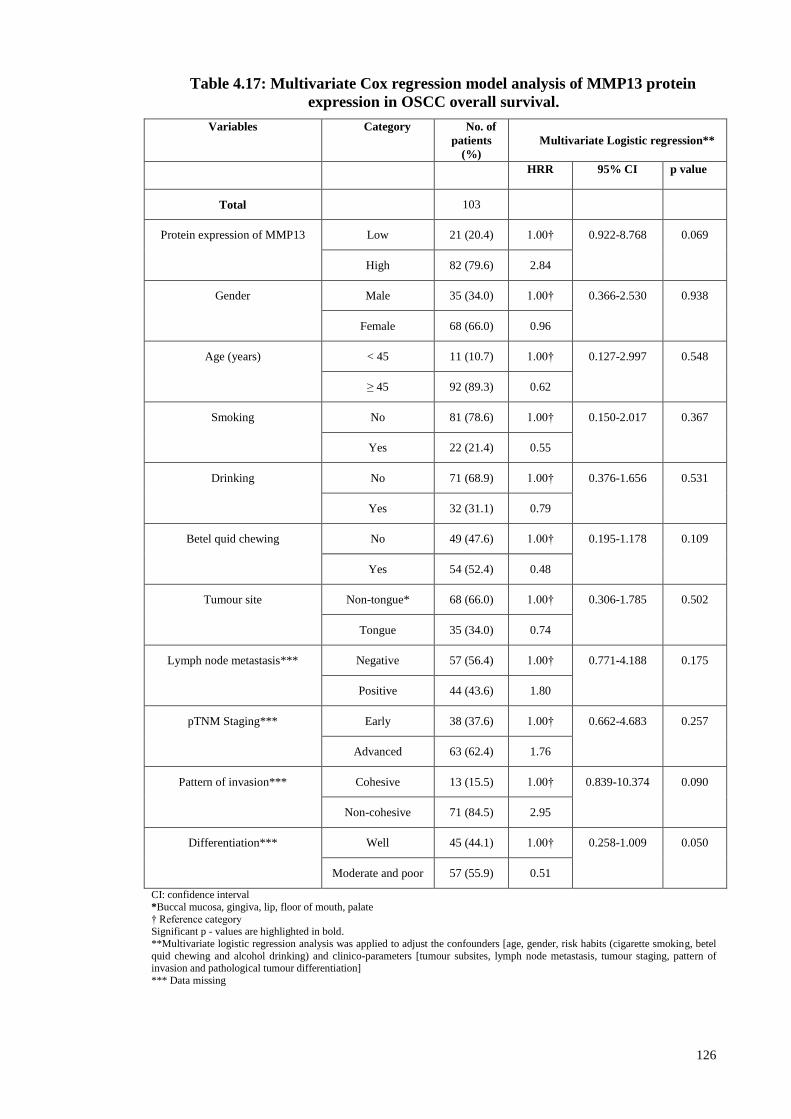
126
Table 4.17: Multivariate Cox regression model analysis of MMP13 protein
expression in OSCC overall survival.
Variables Category No. of
patients
(%)
Multivariate Logistic regression**
HRR 95% CI p value
Total 103
Protein expression of MMP13 Low 21 (20.4) 1.00† 0.922-8.768 0.069
High 82 (79.6) 2.84
Gender Male 35 (34.0) 1.00† 0.366-2.530 0.938
Female 68 (66.0) 0.96
Age (years) < 45 11 (10.7) 1.00† 0.127-2.997 0.548
≥ 45 92 (89.3) 0.62
Smoking No 81 (78.6) 1.00† 0.150-2.017 0.367
Yes 22 (21.4) 0.55
Drinking No 71 (68.9) 1.00† 0.376-1.656 0.531
Yes 32 (31.1) 0.79
Betel quid chewing No 49 (47.6) 1.00† 0.195-1.178 0.109
Yes 54 (52.4) 0.48
Tumour site Non-tongue* 68 (66.0) 1.00† 0.306-1.785 0.502
Tongue 35 (34.0) 0.74
Lymph node metastasis*** Negative 57 (56.4) 1.00† 0.771-4.188 0.175
Positive 44 (43.6) 1.80
pTNM Staging*** Early 38 (37.6) 1.00† 0.662-4.683 0.257
Advanced 63 (62.4) 1.76
Pattern of invasion*** Cohesive 13 (15.5) 1.00† 0.839-10.374 0.090
Non-cohesive 71 (84.5) 2.95
Differentiation*** Well 45 (44.1) 1.00† 0.258-1.009 0.050
Moderate and poor 57 (55.9) 0.51
CI: confidence interval
*Buccal mucosa, gingiva, lip, floor of mouth, palate
† Reference category Significant p - values are highlighted in bold.
**Multivariate logistic regression analysis was applied to adjust the confounders [age, gender, risk habits (cigarette smoking, betel
quid chewing and alcohol drinking) and clinico-parameters [tumour subsites, lymph node metastasis, tumour staging, pattern of invasion and pathological tumour differentiation]
*** Data missing

127
4.3.2 ISG15
4.3.2.1 ISG15 gene copy number, mRNA and protein expression in OSCC
Amplification of ISG15 was identified in 5.33% of the OSCC samples (4 out of 75)
in chromosome 1p36.33 using array CGH (Table 4.2). In line with this, the ISG15
mRNA was found to be expressed significantly at a high level in 87.5% of the OSCC
samples (56 out of 64 samples) with an average gene expression fold change of 46.03
compared to the non-cancer oral mucosa samples with fold change of 1 (p = 0.001)
(Figure 4.10). In the current study, protein expression of ISG15 was examined by IHC
analysis. Hepatocellular cancer tissue was used as the positive control for
immunohistochemistry of ISG15 protein expression. The positive control tissue
demonstrated a strong nuclear and cytoplasmic staining of the tumour cells (Figure
4.11). Moreover, the negative control (OSCC tissue) for immunohistochemistry showed
an absence of cytoplasmic and nuclear staining (Figure 4.11). ISG15 was expressed in
all OSCC and OED samples. IHC analysis clearly demonstrated that ISG15 protein
expression was specifically detected in OED and OSCC indicating that this gene is
likely to be associated with both OED and OSCC. In IHC analysis of ISG15 protein, the
epithelial cells of non-cancer oral mucosal tissues showed a negative staining. A strong
nuclear and cytoplasmic expression of anti-ISG15 antibody was observed in all layers
of the OED epithelium. More than 40% of OSCCs displayed a strong nuclear and
cytoplasmic staining of the epithelial tumour cells. The expression of ISG15 protein
was statistically different between OSCC and non-cancer oral mucosal tissues (p <
0.05) in contrast to OSCCs and OEDs. A representative haematoxylin and eosin (H&E)
and IHC stained image for protein expression group of ISG15 is shown in Figure 4.11.
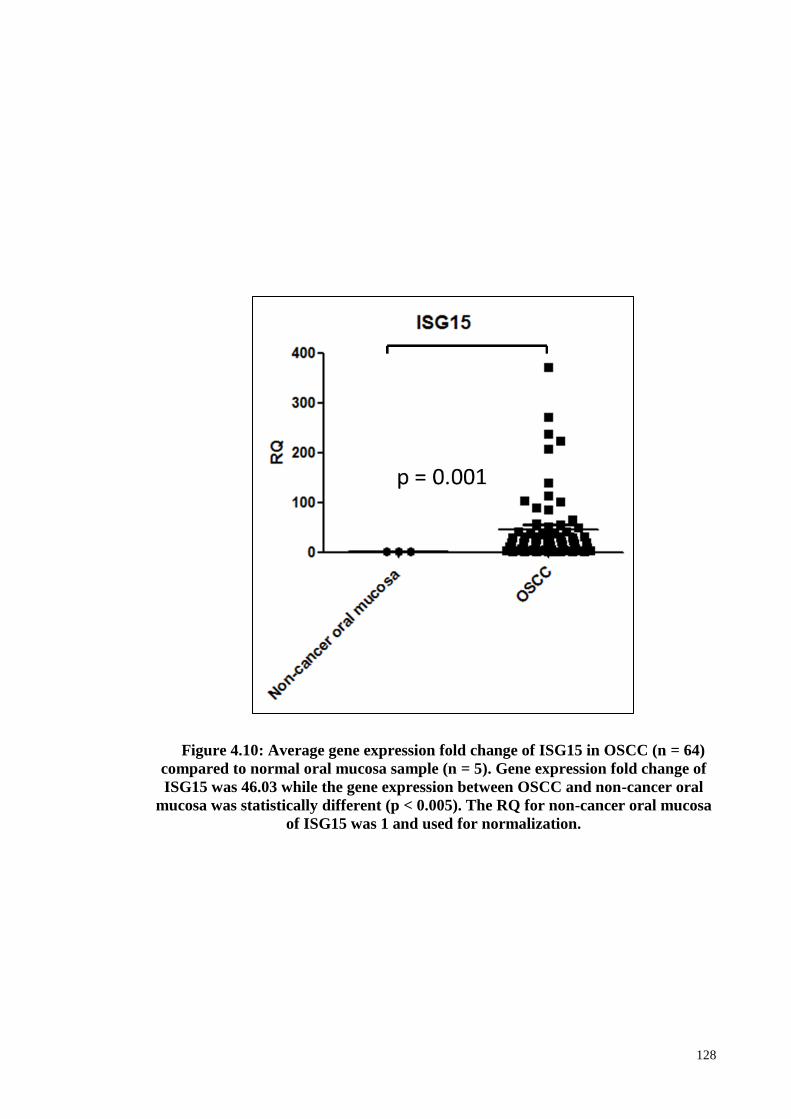
128
Figure 4.10: Average gene expression fold change of ISG15 in OSCC (n = 64)
compared to normal oral mucosa sample (n = 5). Gene expression fold change of
ISG15 was 46.03 while the gene expression between OSCC and non-cancer oral
mucosa was statistically different (p < 0.005). The RQ for non-cancer oral mucosa
of ISG15 was 1 and used for normalization.

129
Figure 4.11: Immunohistochemistry of ISG15. The positive control:
Hepatocellular cancer tissue (A) demonstrating expression of ISG15 protein.
Strong cytoplasmic and nuclear staining was observed within hepatocellular
cancer tissue (Magnification 800x and 1600x). The negative control: OSCC tissue
(B) demonstrating lack of staining when primary antibody is omitted. The negative
control showed the negative cytoplasmic and nuclear staining within OSCC tissue
(Magnification 800x and 1600x). Non-cancer oral mucosa (C) H&E stain
(Magnification 400x and 1600x); (D) anti-ISG15 antibody immunostain was
negative in the non-cancer oral mucosa (Magnification 400x and 1600x). OED
tissue (E) H&E stain (Magnification 800x and 1600x); (F) anti-ISG15 antibody
showed strong nuclear and cytoplasmic expression of anti-ISG15 antibody all
layers of the OED epithelium (Magnification 800x and 1600x). OSCC (G) H&E
stained (Magnification 800x and 1600x); (H) anti-ISG15 antibody immunostaining
showed weak cytoplasmic expression of anti-ISG15 antibody in the epithelial
tumour cells (Magnification 800x and 1600x); (I) H&E stained (Magnification 800x
and 1600x); (J) anti-ISG15 antibody immunostaining showed strong nuclear and
cytoplasmic expression of anti-ISG15 antibody in the epithelial tumour cells
(Magnification 800x and 1600x).

130
4.3.2.2 Association of ISG15 mRNA expression with clinico-pathologic parameters
and survival
Expression of ISG15 mRNA was significantly higher in OSCCs (n = 64) compared
with non-cancer oral mucosa samples (n = 5) (p < 0.005), but it had no significant
association with clinico-pathologic factors and prognosis. The association between
ISG15 expression with clinico-pathological parameters and survival are included in
Appendix K and L, respectively.
4.3.2.3 Definition of cut-off score for ISG15 protein expression in OSCC
ROC curve analysis was performed based on the results of IHC evaluation. Results
showed that ROC curve analysis for tumour staging has the shortest distance from the
curve to the point (0.0, 1.0) (Table 4.18). Hence, the cut-off value for tumour staging
was selected. The cut-off score for low ISG15 protein expression was set to < 4.0 and
the counterpart as a high ISG15 protein expression.
Table 4.18: Area under the receiver operating characteristic curve (AUC) of
ISG15 for each clinico-pathological feature.
Clinico-pathological parameters AUC (95% CI) p value
Lymph node metastasis (Yes vs. No) 0.627 (0.471-0.783) 0.118
Tumour staging (Advanced vs. Early) 0.637 (0.463-0.810) 0.106
Tumour sizes (T1 and T2 vs. T3 and T4) 0.499 (0.339-0.658) 0.986
Survival (death vs. alive) 0.615 (0.456-0.774) 0.153

131
4.3.2.4 Association of ISG15 protein expression with clinico-pathologic parameters
and survival
Results showed that high level of ISG15 expression was significantly associated with
gender (Female: 76.9% vs Male: 23.1%, p = 0.031), alcohol drinking habit (Yes: 19.2%
vs No: 80.8%, p = 0.026), lymph node metastasis (LNM positive: 61.5% vs LNM
negative: 38.5%, p = 0.004) and tumour staging (Advanced stage: 84.6% vs Early stage:
15.4%, p = 0.005) (Table 4.19). The follow-up time for the patients ranged from 3 to 93
months (mean: 36.7 months, median: 24.0 months). The 3- and 5- years survival rates
for the high level of ISG15 expression were 38.5% and 25.2%, respectively whereas for
the low level of ISG15 expression, it was 67.3% and 55.6%, respectively. Using the
Kaplan-Meier survival curve analysis, it was demonstrated that the high level of ISG15
expression seems to be a significant predictor of poor overall survival (p = 0.029),
Figure 4.12. To investigate whether ISG15 protein expression could predict the poor
outcome of OSCC, multivariate Cox regression analysis were conducted to examine the
effect of ISG15 in OSCC by additionally adjusting for age, gender, risk habits, and
clinico-pathological parameters such as tumour site, tumour sizes, lymph node status,
tumour staging, pattern of invasion and differentiation (Table 4.20). The analysis
showed over-expression of ISG15 was not an independent prognostic factor. However,
the hazard risk of protein expression of ISG15 in OSCC is 1.5 fold towards death (HRR
= 1.475; 95% CI 0.484-4.491; p = 0.494).

132
Figure 4.12: Overall survival curves were analyzed according to ISG15 protein
expression using Kaplan-Meier estimate with log-rank test.

133
Table 4.19: Association of ISG15 protein expression with clinico-pathological
parameters.
Variables Category No. of
samples (%)
Low
expression of
ISG15
High
expression of
ISG15
No. of
samples (%)
No. of samples
(%)
p value
Total 53
Gender Male 20 (37.7) 14 (51.9) 6 (23.1) 0.031
Female 33 (62.3) 13 (48.1) 20 (76.9)
Age (years) < 45 4 (7.5) 3 (11.1) 1 (3.8) 0.610
≥ 45 49 (92.5) 24 (88.9) 25 (96.2)
Smoking No 42 (79.2) 20 (74.1) 22 (84.6) 0.344
Yes 11 (20.8) 7 (25.9) 4 (15.4)
Drinking No 35 (66.0) 14 (51.9) 21 (80.8) 0.026
Yes 18 (34.0) 13 (48.1) 5 (19.2)
Betel quid
chewing
No 23 (43.4) 15 (55.6) 8 (30.8) 0.069
Yes 30 (56.6) 12 (44.4) 18 (69.2)
Tumour site Tongue 19 (35.8) 10 (37.0) 9 (34.6) 0.854
Non-tongue* 34 (64.2) 17 (63.0) 17 (65.4)
Tumour sizes T1-T2 28 (52.8) 16 (59.3) 12 (46.2) 0.339
T3-T4 25 (47.2) 11 (40.7) 14 (53.8)
Lymph node
status
Negative 31 (58.5) 21 (77.8) 10 (38.5) 0.004
Positive 22 (41.5) 6 (22.2) 16 (61.5)
pTNM Staging Early stage 18 (34.0) 14 (51.9) 4 (15.4) 0.005
Advanced
stage
35 (66.0) 13 (48.1) 22 (84.6)
Differentiation Poor and
Moderate
32 (60.4) 14 (51.9) 18 (69.2) 0.196
Well 21 (39.6) 13 (48.1) 8 (30.8)
*Buccal mucosa, gingiva, lip, floor of mouth, palate Significant p - value were highlighted in bold.

134
Table 4.20: Multivariate Cox regression model analysis of ISG15 protein
expression in OSCC overall survival.
Variables Category No. of patients (%)
Multivariate Logistic regression**
HRR 95% CI p value
Total 103
Protein expression of
ISG15
Low 27 (48.2) 1.00† 0.494
High 26 (41.8) 1.475 0.484-4.491
Gender Male 20 (37.7) 1.00† 0.625
Female 33 (62.3) 0.730 0.206-2.581
Age (years) < 45 4 (7.5) 1.00† 0.632
≥ 45 49 (92.5) 0.638 0.101-4.013
Smoking No 42 (79.2) 1.00† 0.159
Yes 11 (20.8) 0.301 0.057-1.598
Drinking No 35 (66.0) 1.00† 0.289
Yes 18 (34.0) 0.589 0.222-1.567
Betel quid chewing No 23 (43.4) 1.00† 0.035
Yes 30 (56.6) 0.276 0.083-0.915
Tumour site Non-tongue* 34 (64.2) 1.00† 0.547
Tongue 19 (35.8) 0.715 0.240-2.128
Tumour sizes T1-T2 28 (52.8) 1.00† 0.276
T3-T4 25 (47.2) 1.854 0.610-5.634
Lymph node metastasis Negative 31 (58.5) 1.00† 0.059
Positive 22 (41.5) 3.104 0.956-10.076
pTNM Staging Early 18 (34.0) 1.00† 0.969
Advanced 35 (66.0) 1.033 0.204-5.231
Pattern of invasion Cohesive 6 (11.3) 1.00† 0.142
Non-cohesive 47 (88.7) 5.656 0.559-57.177
Differentiation Well 32 (60.4) 1.00† 0.063
Moderate and poor 21 (39.6) 0.426 0.173-1.047

135
CI: confidence interval
*Buccal mucosa, gingiva, lip, floor of mouth, palate † Reference category Significant p - value were highlighted in bold.
**Multivariate logistic regression analysis was applied to adjust the confounders [age, gender, risk habits (cigarette smoking, betel quid chewing and alcohol drinking)] and clinico-pathologic parameters [tumour sites, lymph node metastasis and pathological
tumour staging, pattern of invasion and differentiation]

136
Objective 4: To investigate the functional roles of a putative cancer gene using RNAi
technique in OSCC cell lines.
4.4 Roles of a putative cancer gene using RNA interference (RNAi) technique
in OSCC cell lines model
Network analysis using IPA software revealed a putative novel gene, namely ISG15
involved in network signalling that linked with cell death and survival, cellular
movement, cellular development. This gene was prioritized for further evaluation and
characterization in OSCC by quantification of mRNA and protein expression levels as
well as in vitro functional analysis. ISG15 was selected on the basis of that its role in
oral cancer was poorly understood and literature suggested a high probability of
involvement in tumourigenesis.
4.4.1 Knockdown of ISG15 in oral cancer cell line ORL-48T, ORL-188T and
ORL-204T
Initially, ISG15 expression at the protein level was evaluated in OSCC cells.
Western blot showed ISG15 to be well-expressed in OSCC cells. To explore the role of
ISG15 on oncogenic activities and treatment response in OSCC cells, siRNA was
employed to inhibit endogenous ISG15 expression in OSCC cell lines. ISG15 protein
expression was reduced by ISG15 siRNA in OSCC cells compared with cells treated
with non-targeting siRNA control in all three OSCC cell lines namely ORL-48T, ORL-
204T and ORL-188T (Figure 4.13). Taken together, these results showed successful
knockdown of ISG15 in these three OSCC cell lines.

137
Figure 4.13: ISG15 protein was reduced by ISG15 siRNA in ORL-48T, ORL-
188T and ORL-204T OSCC cells compared with non-targeting negative control
siRNA.

138
4.4.2 In vitro functional assays to determine the effects of ISG15 expression in oral
cancer cells
4.4.2.1 The role of ISG15 in cell proliferation
The role of ISG15 in promoting cell proliferation was determined using MTT cell
proliferation assay on all three cell lines namely ORL-48T, ORL-204T and ORL-188T,
cells transfected either with non-targeting siRNA control or ISG15 siRNA. The assay
was conducted three times in triplicate to confirm the results. Proliferating cells, as
determined by absorbance, were significantly decreased in all three cell lines with
siISG15 transfection, as compared with negative control cells (p = 0.0001) at 24, 48, 72,
96, 120 and 144 hours (Figure 4.14). This observation was further supported by another
proliferation assay using RTCA technology. The ISG15 gene knockdown in three
OSCC cell lines demonstrated a decrease in the number of viable adherent cells
(represented by cell index), compared to the non-targeting siRNA control cells in 30
hours. The doubling time for ORL-48T, transfected with non-targeting siRNA control
and ISG15 siRNA were 10.79 ± 0.45 hours and 16.74 ± 1.29 hours, respectively. As for
ORL-204T, the doubling time for the non-targeting siRNA control and ISG15 siRNA
were 15.54 ± 0.68 hours and 23.11 ± 2.19 hours, respectively. Lastly, the doubling time
for the non-targeting siRNA control and ISG15 siRNA transfected ORL-188T cells
were 16.40 ± 0.64 hours and 26.20 ± 1.77 hours, respectively (Figure 4.14).
.

139
Figure 4.14: Effect of ISG15 on proliferation of OSCC cells. There was a
significant difference in the cell proliferation among the non-targeting siRNA
control and siRNA targeting ISG15 in (A) ORL-48T, (B) ORL-204T (C) ORL-
188T cells. The doubling time was observed significantly different among the non-
targeting siRNA control and siRNA targeting ISG15 in (D) ORL-48T, (E) ORL-
204T (F) ORL-188T cells. The growth curve between the non-targeting siRNA
control and siRNA targeting ISG15 obtained from RTCA was shown in Figure
4.15 (G). Data are expressed as mean ± SEM; *p < 0.05 compared to non-targeting
siRNA control. Assays were carried out in triplicate.

140
4.4.2.2 Effect of the combination of chemotherapeutic agent with ISG15 silencing
on Caspase 3/7 activation
The IC50 of cisplatin in ORL-48T, ORL-204T and ORL-188T was identified using
MTT assay and there were 16 µM, 35 µM and 10 µM, respectively. The respective IC50
of the cisplatin were used for subsequent treatments. In order to gain insight into the
mechanism by which ISG15 silencing enhanced drug cytotoxicity, the activity of the
effector caspase 3 and 7, crucial components of the apoptotic cell death was determined.
In this study, MTT cell cytotoxicity assay and luminescent intensity for the caspase
3/7 activity was measured in OSCC cells after 48 hours of siRNA transfection of ISG15
followed by 48 hours of cisplatin treatment. The MTT assay showed that the
combination of the ISG15 silencing and cisplatin treatment resulted in a reduction of
cell viability compared with the non-targeting siRNA control OSCC cell lines treated
with cisplatin alone (Figure 4.15) which was statistically significant, indicating that
silencing of ISG15 with enhanced cisplatin induced cell death in OSCC cells. However,
the reduction of the cell viability is more obvious particularly in ORL-188T compared
to ORL-48T and ORL-204T. Comparing caspase 3/7 activity in cells treated with
cisplatin, cells with reduced ISG15 by siRNA treatment also had increased activity
significantly suggesting that cell death was measured with the MTT assay is likely to be
apoptosis in OSCC cells (Figure 4.15).
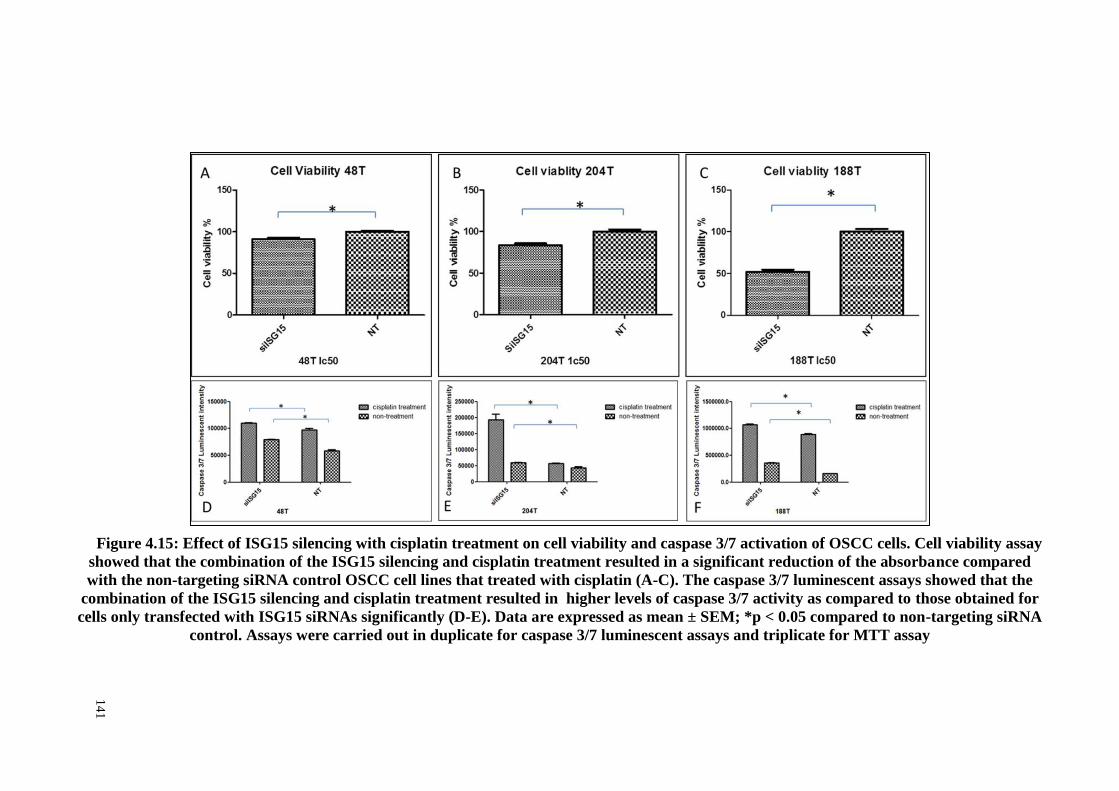
141
Figure 4.15: Effect of ISG15 silencing with cisplatin treatment on cell viability and caspase 3/7 activation of OSCC cells. Cell viability assay
showed that the combination of the ISG15 silencing and cisplatin treatment resulted in a significant reduction of the absorbance compared
with the non-targeting siRNA control OSCC cell lines that treated with cisplatin (A-C). The caspase 3/7 luminescent assays showed that the
combination of the ISG15 silencing and cisplatin treatment resulted in higher levels of caspase 3/7 activity as compared to those obtained for
cells only transfected with ISG15 siRNAs significantly (D-E). Data are expressed as mean ± SEM; *p < 0.05 compared to non-targeting siRNA
control. Assays were carried out in duplicate for caspase 3/7 luminescent assays and triplicate for MTT assay
14
1

142
4.4.2.3 Effect of ISG15 on cell migration and invasion
The migratory effect of ISG15 on oral cancer cell was evaluated using wound
healing assay and transwell migration method. Compared to the migratory ability of the
control group in the cell migration assay (wound healing assay), the migratory activity
of the ORL-48T, ORL-204T and ORL-188T cells were inhibited significantly after
ISG15-siRNA transfection (Figure 4.16). In transwell migration assay, ORL-48T, ORL-
204T and ORL-188T cells with siISG15 transfection exhibited a significant reduction in
cell migration compared to the non-targeting control cells. Similarly, ORL-48T, ORL-
204T and ORL-188T cells with siISG15 transfection exhibited a significant reduction in
cell invasion compared to the non-targeting siRNA control cells (Figure 4.17). The
transwell migration and invasion assays were conducted three times in triplicate and
duplicate, respectively to confirm the results.

143
Figure 4.16: Effect of ISG15 on migration of OSCC cells using wound healing assay. Cellular migration was determined by wound healing
scratch assay and analyzed by the Wimasis WimScratch software. The migratory ability of ORL-48T, ORL-204T and ORL-188T cells was
reduced significantly with ISG15-siRNA transfection. Data are expressed as mean ± SEM; *p < 0.05 compared to non-targeting siRNA
control. Assays were carried out in duplicate.
14
3

144
Figure 4.17: Effect of ISG15 on migration and invasion of OSCC cells using Transwell migration (A-C) and invasion assays (D-E). The
results showed that there was a positive correlation between ISG15 expression and OSCC cell migration and invasion in ORL-48T, ORL-204T
and ORL-188T cells lines. Data are expressed as mean ± SEM; *p < 0.05 compared to non-targeting siRNA control. Assays were carried out in
triplicate for transwell migration assay and duplicate for transwell invasion assay.
14
4

145
DISCUSSION CHAPTER 5:
5.1 Determining and validating the CNAs of OSCC using array CGH and qPCR
copy number assay
5.1.1 Copy number alterations of OSCC identified using array CGH
To the best of our knowledge, the TCGA consortium (TCGA, 2015) conducted the
largest genome-wide profiling study on 172 OSCC samples including oral tongue,
buccal mucosa, alveolar ridge, lip, floor of mouth and hard palate using array CGH
technology followed by this study which detected wide CNA event among 75 OSCC
samples. Due to high intra-tumoural and genetic heterogeneity of squamous cell
carcinoma of the head and neck (HNSCC), only samples from oral cavities such as the
tongue (excluding the base), buccal mucosa, alveolar ridge, retromolar trigone, hard
palate, and floor of mouth were included. As such, the identified recurrent CNAs from
this unique oral cavity SCC could provide new insights into the etiological basis of oral
tumourigenesis.
CNAs can lead to the disruption of proto-oncogenes or tumour suppressor genes, as
they have been determined to be the major determinant of poor prognosis in oral cancer
(Ambatipudi et al., 2011; Uchida et al., 2011; Chen et al., 2015). In this study, 28
amplifications and 3 deletions with a frequency of ≥ 5% (n = 75) were identified. Gains
were more frequent than losses and were detected in chromosomes 8q, 7p, 5p, 11q, 3q,
10p and 1p while losses were observed in chromosomes 3p and 8p. This study confirms
and adds to the earlier evidence of frequent CNAs that have been reported in the TCGA
of oral cancer meta-analysis array CGH OSCC study and the International Cancer
Genome Consortium (ICGC) which forms the most comprehensive integrative genomic

146
analysis of OSCC (ICGC, 2013; TCGA, 2015). In view of this, CNAs and the
associated genes provide new insights into oral cancer biology and prognosis suggesting
that shared and unique alterations of the CNAs accelerated progress involving
prevention and therapy in OSCC.
The identification of high-frequency CNAs in chromosomes 3, 8, and 11 in this
study reflects the existence of oncogenes and tumour suppressor genes that could be
associated with poor prognosis in oral cancer (Bockmuhl et al., 2000; Wreesmann et al.,
2004; Chen et al., 2015). As such, further investigations on these chromosomes could
provide enhanced prognosis predictions and anticancer strategies for OSCC patients. In
this study, an amplification of 8q22.3-q23.1 was found to be the most frequent event,
being present in 18.70% (n = 75) of all OSCCs. Genomic alterations in chromosome 8q
have been frequently reported in OSCC, especially at an amplification of 8q22.3-q23.1,
which is associated with disease-specific survival in human cancers such as OSCC and
bladder cancer (Peng et al., 2011). In addition, an amplification of chromosome 8q was
found to be associated significantly with advanced stages in OSCC patients. This
amplicon contains various proto-oncogenes including LRP12 and CTHRC1. The
LRP12 gene belongs to the LDLR superfamily and according to Garnis et al. (2004b)
suggest that this gene is more likely to behave like proto-oncogenes in oral
tumourigenesis. Collagen triple helix repeat containing 1 (CTHRC1), a pro-migratory
protein associated with tumour metastasis, was found to be over-expressed in several
solid tumours, such as breast cancer and melanoma (Tang et al., 2006). In this study,
CTHRC1 was identified in the amplification of chromosome 8q22 and this observation
is in agreement with the studies by Liu et al. (2013) and Tameda et al. (2014) who
demonstrated that N-glycosylated CTHRC1 enhanced tumour cell migration and
metastasis in oral tumourigenesis in an in vitro study. As such, the oncogenic

147
characteristic of this gene provides some basis for using this gene in cancer gene
therapy in oral cancer management.
Losses in 3p26.3-3p26.1 and 3p21.31 were found to be the most frequent
observations in the CNAs and the deletion of this region has been identified as a
prognostic factor in OSCC patients. This region harbors the potential tumour
suppressive related gene namely cell adhesion molecule with homology to L1CAM1
(CHL1), contactin 4 (CNTN4), and contactin 6 (CNTN6) as also evident in the recent
OSCC genome-wide profiling study conducted by Chen et al. (2015). CHL1 is a
member of the family of L1 neural cell adhesion molecules. It has been suggested that
the loss of this gene in the early stages of cancer contributes to the growth and
metastasis of human cancers (Senchenko et al., 2011). Functional studies show that
CHL1 is able to suppress the proliferation and invasion of tumour cells both in vitro and
in vivo in breast tumourigenesis (He et al., 2013). In combination with our results, these
observations suggest that CHL1 is a candidate for the tumour suppressor gene
associated with aggressiveness of OSCC. CNTN4 and CNTN6 were reported to be the
cancer candidate gene for breast and colorectal cancer, respectively via somatic
mutations screening using PCR in breast and colorectal cancer samples (Sjoblom et al.,
2006). Sjöblom et al. (2006) also reported that these genes were found to be involved in
cellular adhesion and motility activities in tumourigenesis. Similarly, Chen et al. (2015)
recently reported that CHL1, CNTN4, and CNTN6 were deleted in OSCC genome, and
this has provided new options for diagnostic and therapeutic interventions in oral
cancer.

148
In this study, the highest number of CNAs was observed on both arms of
chromosomes 3 and 8, and both amplifications and deletions were detected on them. In
fact, there were several oncogenes identified in chromosomes 3q and 8q and tumour
suppressor genes in the 3p and 8p arm in oral cancers (Vincent-Chong et al., 2016).
These genes may play a role in oral tumourigenesis and can potentially be used in
diagnosis and prognosis. Remarkably, the loss in 8p23.32 was one of the most frequent
CNAs on the short arm of chromosome 8 (Vincent-Chong et al., 2016). In this study,
the deletion of chromosome 8p was found to be associated with advanced staging in
OSCC. The focal region of 8p23.32, which harbors the CUB and sushi multiple domain
protein 1 (CSMD1) genes, could be a region of interest for further investigation.
CSMD1 is a candidate for the tumour suppressor gene that encodes a transmembrane
protein that is involved in signal transduction in tumourigenesis (Kirkitadze & Barlow,
2001). Studies show that deletions and loss expressions of this gene were associated
with poor survival and clinico-pathological parameters such as lymph node metastasis
and tumour staging in several cancers (Tang et al., 2012). The plausible reasons
attributed to this tumour suppressive characteristic are its ability to inhibit tumour cell
proliferation and migration and to induce apoptosis in tumourigenesis as demonstrated
in in vitro and in vivo melanoma models. This provides the insight into the mechanism
of oncogenesis and therapeutically actionable CNAs especially in this region for oral
cancer.

149
Somatic CNAs in terms of amplification of chromosome 3q and deletions of
chromosome 3p are well documented (Rowley et al., 1996; Roz et al., 1996). It appears
that 3p26.3 is the target of deletion and that 3q27.1 is the target of amplification.
Among these chromosomal regions, 3p26.3 on the short arm and 3q27.1 on the long
arm appear to be regions of interest. In contrast to chromosome 8, it appears that copy
number alterations on this chromosome are associated with tumour initiation and
progression towards invasive cancers (Heselmeyer et al., 1996; Salahshourifar et al.,
2014). A systematic review study that lead by Professor Rosnah and her team in Oral
Cancer Research and Coordinating Center, Faculty of Dentistry, University of Malaya
reported that segmental 3p deletions have been identified in oral potentially malignant
diseases (OPMDs) and early stages of OSCC, whereas multiple segmental or broad 3p
deletions have been detected in advanced stage tumours (Salahshourifar et al., 2014). In
addition, amplification of 3q was reported to be associated with advanced stages of
OSCC, indicating that alterations in this region could be an important transition event in
tumour progression to invasive OSCC (Oga et al., 2001). The amplification of 3q13.32-
q21.2 (MUC13), 3q25.31-q26.1 (CCNL1), 3q27.3-q28 (TP63), and 3q26.1-q26.31
(SKIL) were observed in this study and have been implicated in cancers (Yang et al.,
1999; Reed et al., 2005; Sticht et al., 2005; Chauhan et al., 2009). Mucin 13 (MUC13)
encodes a transmembrane mucin and studies have demonstrated over-expression of
MUC13 gene enhanced tumour cell proliferation, migration, and invasion in in vivo and
in vitro pancreatic and ovarian cancer models (Chauhan et al., 2009; Chauhan et al.,
2012). Cyclin L1 (CCNL1) encodes a key regulator of pre-mRNA processing and is
involved in G0 to G1 transition during the cell cycle (Iyer et al., 1999; Berke et al.,
2001). Previous studies have shown that CCNL1 was highly amplified in a tongue SCC
cell line and over-expressed in HNSCC primary samples (Redon et al., 2002). In 2005,
Sticht et al. (2005) noted that the amplification of CCNL1 acted as a clinical predictor

150
for advanced OSCC patients with lymph node metastasis and the fact that it remained as
an independent prognosticator in OSCC suggests its potential role as a putative
oncogene in head and neck cancers. P63 encodes a transcription factor, which plays an
essential role in the development of epithelial tumourigenesis (Yang et al., 1999).
Studies have shown that the amplification of this gene has been identified in cervical
cancer cell lines using array CGH technology. Apart from that, Lo Muzio et al. (2005)
demonstrated that over-expression of the p63 protein was associated significantly with
poor differentiation of OSCC and poor survival rates. SKIL is known as a negative
regulator of TGF-beta signaling in tumourigenesis (Deheuninck & Luo, 2009). This
amplified gene was reported in several cancers including head and neck cancers
(Deheuninck & Luo, 2009). Studies show that reduced expression of this gene arrests
tumour growth both in vitro and in vivo in lung and breast cancers (Zhu et al., 2007).
Similarly, SKIL can also function as a transcriptional activator, target the β-catenin
pathway and enhance tumour cell survival, migration, and invasion in melanoma
tumourigenesis (Reed et al., 2005).
In this study, the co-amplification of chromosome 11q13.3 and 11q22.2 was found to
be associated with advanced tumour staging in OSCC. The TCGA consortium showed
co-amplification of the regions 11q13 and 11q22 in OSCC (TCGA, 2015). It is well
known that the long arm of chromosome 11 harbors cancer-related genes that play an
important role in pathogenesis and tumour development (Roh et al., 2000; Beroukhim et
al., 2010). Several candidate oncogenes, such as CCND1, CTTN, ORAOV1, ANO1,
and FADD, have been reported to promote tumour cell proliferation and evade tumour
cell apoptosis, invasion, and migration in tumourigenesis (Hinds et al., 1994; Patel et
al., 1998; Chen et al., 2005; Jiang et al., 2008; Ruiz et al., 2012). The amplification of
11q13 was correlated with poor prognosis (Akervall et al., 1995) and lymph node

151
metastasis in HNSCC (Rodrigo et al., 2000), which implies that these driver gene
candidates might be valuable as biomarkers in the prognosis and treatment planning for
oral cancers. The results also show that the amplification of chromosome 11q22.2 and
the genes that were mapped on this amplicon include BIRC2 and YAP1 and many
MMPs (MMP-1, -3, -7, -8, -10, -12, -13, -20, and -27) suggesting the essential function
of metalloproteinases in OSCC progression. As such, it seems that the aberration in
chromosomes 11q is associated with the invasive behavior of tumours and poor
prognosis.
The amplification of chromosome 7p12-22 has been identified in about 30% of
OSCC and more than 40% of HNSCC samples from TCGA using SNP array CGH
technology (Sheu et al., 2009; TCGA, 2015). In this study, the amplification of
chromosome 7p was associated with tumour sizes (T3-T4) and advanced tumour
staging in OSCC. The candidate oncogenes harbored in this amplicon include EGFR,
TWIST1, and HOXA genes. Among these oncogenes, EGFR has a high level of
amplification in the OSCC TCGA sample (TCGA, 2015). EGFR is a transmembrane
glycoprotein that includes an intracellular tyrosine kinase domain (Herbst, 2004). The
activation of EGFR promotes tumour cell proliferation and evades apoptotic signals in
tumourigenesis (Herbst, 2004). The amplification of TWIST1 and several of HOXA
genes were identified in chromosome 7p22.3 in this study. TWIST1 is a transcription
factor in which the high expression of this gene was associated with advanced stage and
lymph node metastasis in OSCC with poor clinical outcomes. The inhibition of this
gene suppressed cell metastasis ability in OSCC in vitro and in vivo using an orthotropic
mouse model of metastatic OSCC (da Silva et al., 2014). The implication of TWIST1 in
cell migration is attributed primarily to its ability to contribute towards epithelial to
mesenchymal transition (EMT) in oral tumourigenesis (da Silva et al., 2014). HOX

152
genes encode homeodomain-containing transcription factors involved in the regulation
of cellular proliferation and differentiation during embryogenesis. Bitu et al. (2012)
reported that the inhibition of HOXA1 in oral squamous cell carcinoma (OSCC)
induced a potent inhibition of cell proliferation in an in vitro OSCC model, and over-
expression of HOXA1 remained as an independent prognosticator in OSCC. This
highlights the need for further elucidation of the role of other members of the HOX
family in OSCC.
In this study, the amplification of chromosome 9p21.1-13.3 was identified in 14.7%
of OSCC samples recruited for genome-wide profiling using array CGH. The
amplification of chromosome 9p especially 9p13 has been frequently reported in OSCC
and is vital to the early stages of oral tumourigenesis (Snijders et al., 2005; Ambatipudi
et al., 2011; Towle et al., 2014). In this study, the amplification of chromosome 9p was
associated significantly with lymph node metastasis, and this might be driven by the
proto-oncogenes including CA9, VCP, DCTN3, and STOML2 harboured in this
amplicon. Carbonic anhydrase 9 (CA9) is a glycoprotein and its activation plays an
important role in a hypoxic microenvironment which allows tumour cell proliferation
(Ivanov et al., 1998). Previous studies demonstrate that CA9 expression was associated
with poor survival in OSCC suggesting that this gene plays an important role in OSCC
progression (Brockton et al., 2012). VCP (p97) is a member of the ATPases associated
with various cellular activities (AAA) super-families and is known to activate NF-ĸB
signaling which enhances tumour cell proliferation and promotes tumour survival by
evading apoptosis signals in tumourigenesis (Asai et al., 2002; Yamamoto et al., 2004).
Stomatin-like protein 2 (STOML2), a member of the stomatin family, has been reported
to be over-expressed in several types of human cancers (Song et al., 2012). Song et al.
(2012) demonstrated that this gene might play an important role in glioma invasion and

153
in modulation of the NF-κB signalling pathway. This has prompted studies on the
potential of this gene as a therapeutic agent in the treatment of other cancers. Towle et
al. (2014) demonstrated that the inhibition of these putative genes in OSCC cell lines
suppressed tumour cell proliferation and suggested that the amplification of 9p13 is
more likely to contribute to the aggressiveness of multiple oncogene candidates in oral
tumourigenesis.

154
5.1.2 TaqMan copy number assay of LRP12, TPM2, EGFR, FSCN1, CCND1,
CLPTM1L, CHL1 and CSMD1
CNAs identified from array CGH were further validated using the qPCR method. In
this study, qPCR copy number analysis on LRP12, TPM2, EGFR, FSCN1, CCND1,
CLPTM1L, CHL1 and CSMD1 genes was carried out. It identified a “genetic
signature” consisting of the LRP12, CCND1, EGFR and TPM2 genes that could predict
clinical outcomes and may ultimately facilitate patient-tailored selection of therapeutic
strategies in oral cancer management.
The identification of this ‘genetic signature’ as a prognosticator for patients may
have the potential to facilitate treatment decisions and allows for comprehensive
approaches to be taken for patients with poor prognoses. This approach basically relies
on the presence or absence of this genetic signature in patients in order to establish a
personalized medicine strategy to be used in clinical application. This finding
demonstrates that these genetic markers may be a useful tool in the clinical management
of OSCC patients.
The genetic signatures identified in this study provide prognostic information beyond
routine clinical utility by shedding light on the molecular mechanisms underlying
aggressiveness in OSCC that could be targeted for cancer treatment. EGFR is a member
of the epidermal growth factor family and has been shown to be associated with poor
patient survival outcome as its downstream signalling contributes to tumor growth and
metastasis (Zimmermann et al., 2006; Tsui et al., 2009). Aberrant expression of LRP12,
an LDL receptor related protein, has also been found to over-express in OSCC,
suggesting its role as a proto-oncogene in oral tumourigenesis (Garnis et al., 2004b). In
addition, TPM2, a member of the Tropomyosins superfamily, plays a major role in the

155
control of stress fibers of human epithelial cells and the differences in its expression has
been demonstrated in malignant breast epithelial cell lines compared to 'normal' breast
cell lines (Dube et al., 2016). It is well documented that over-expression of CCND1 was
an important oncongenic event in various cancer, including oral cancer. Over-
expression of this gene was found to be associated with poor prognosis, lymph node
metastasis and tumor staging (Lam et al., 2000; Zhao et al., 2014). CCND1
overexpression also promotes tumor cell proliferation through the downstream
activation of the cyclin-dependent kinases (CDKs) CDK4 and CDK6 mechanisms,
which serves to be a potential therapeutic target (Musgrove et al., 2011).
5.2 Determining pathways and networks implicated in OSCC pathogenesis
Previously, pathway and network analyzes have been applied in various studies to
filter the driver genes involve in the signalling pathways and to identify key regulators
of cancer-related gene networks from the robust cancer data sets (Xu et al., 2010; Li et
al., 2014b; Mutation Consequences and Pathway Analysis working group of the
International Cancer Genome, 2015). In this study, several oncogenic signalling
pathways were identified using the IPA pathway analysis, and the most significant
signalling pathway was associated with Integrin-linked kinase (ILK) signalling.
Integrin-linked kinase, a candidate oncogene, acts as a multifunctional serine/threonine
kinase and its activation is involved in the regulation of cell proliferation, apoptosis,
differentiation, migration, and epithelial-mesenchymal transition (EMT) (Que et al.,
2016). In this signalling pathway, the activated SNAI (8q11.2) identified in this
genome-wide profiling study plays a role in the activation of the RhoGTPases and
enhanced tumour cell motility via the cytoskeletal remodeling mechanism (Nieto,
2002). In this signalling pathway, the downstream effect of the phosphorylation
activation of Akt suppresses the apoptosis signal and promotes tumour cell survival by

156
inhibiting Caspase-3/9 activities while inducing the over-expression of CCND1
(11q13.3) which promotes cell proliferation in tumourigenesis (Cordes & van
Beuningen, 2003). This downstream target of VEGFB (11q13.3) in this signalling
process also binds to PI3K and is therefore implicated in the regulation of anchorage-
dependent cell growth and survival, cell-cycle progression EMT, invasion and
migration, and cell metastasis in tumourigenesis (Legate et al., 2006). Recently, Que et
al. (2016) showed that targeting the ILK signalling pathway would suppress tumour cell
proliferation, the adhesion and invasion ability in oral tumourigenesis and inhibit
tumour growth, invasion, and metastasis in the in vivo model. These findings highlight
that the ILK signalling pathway plays a novel role in oral tumourigenesis by regulating
EMT associated genes and other downstream targets in this pathway. Thus, this
signalling could be a promising targeted pathway for therapeutic intervention in oral
cancer.
In this study, IPA also shows that the biological functions related to the CNAs
associated genes included cell death and survival, cellular functions and maintenance,
cellular development, cellular growth and proliferation, and cellular movement. These
functions are basically involved in sustaining proliferative signalling, evading growth
suppressors, resisting cell death, enabling replicative immortality, and activating
invasion and metastasis. All these hallmark cancer-associated functions are well-
documented by Douglas Hanahan and Robert Weinberg in their review paper (Hanahan
& Weinberg, 2000). The identification of the CCND1, an amplified gene harboured in
11q13.3 was involved in all of the findings and implies that its over-expression would
lead to the characteristics of cancers by promoting the proliferation, migration, and
invasion of tumour cells and the evasion of apoptosis signals in oral tumourigenesis.
Cyclin D1 enhances tumour cell proliferation, migration, and invasion, and evades

157
apoptosis by the dys-regulation of CDK4/CDK6 activity, RB phosphorylation, and
activation of E2F via the cyclin D–RB–E2F pathway in tumourigenesis (Musgrove et
al., 2011).
In this study, the IPA analysis of the CNAs associated genes revealed a number of
significant biological annotations that related to tumour cell proliferation and evade
apoptosis signals to promote cell survival and metastasis in tumourigenesis. Of these,
the amplification of CCND1, RELA, TP63, and EGFR genes, which are in turn located
on 11q13.3, 11q13.1, 3q28, and 7p11.2 was identified as having a central role in tumour
cell proliferation, immortalization, and metastasis in oral tumourigenesis. The
downstream effects of the recurrent CNAs in cancer cells could include a disruption of
the oncogenes and tumour suppressor genes in the dys-regulated cell signalling
pathways/networks. The interaction network between these four candidate oncogenes
namely CCND1, RELA, TP63, and EGFR have been associated with several oncogenic
pathways which are the PI3 Kinase/Akt signalling, NF-ĸB signalling, cell cycle control
signalling, and MAPK/Erk ingrowth and differentiation signalling. The active growth
factor (EGF) activated the EGFR through the binding of its extracellular domain leading
to the downstream cascade activation of STAT 1 and 3, phosphatidylinositol 3-kinase
PI3 Kinase/Akt and the RAS-MAPk/Erk signalling pathway which in turn lead to the
translocation of NF-ĸB into the nucleus and induced CCND1 transcription (Bazley &
Gullick, 2005; Song et al., 2005; Williams, 2010). Apart from that, the binding of the
RELA gene to NF-ĸB eventually induced the CCND1 expression which promotes
tumour cell immortalization, proliferation, and metastasis in tumourigenesis. The
activation of ERK by phosphorylated EGFR also enables the activation of RAS or MEK
in order to induce the expression of CCND1 (Zhang & Liu, 2002). Overall, these
oncogenic pathways cross-regulate each other and are regulated by EGFR, ERK, and

158
Akt phosphorylation, forming an important network that enables the promotion of
tumour cells to evade senescence and the acceleration of cell immortalization,
proliferation, and metastasis in tumourigenesis. Therefore, this study highlights the
importance of this network as it may serve as a promising subject for therapeutic
development efforts and their associated biological functions and networks along with
other common oncogenic pathways in tumourigenesis. In other words, the suppressor
involved in targeting this network, especially the EGFR, could be combined with
cytotoxic chemotherapeutic drugs or radiation therapy in affecting a cancer patient’s
prognosis. Interestingly, this network analysis also revealed putative novel oncogenes,
namely ISG15 and MMP13 involved in the network signalling that linked with cell
death and survival, cellular movement, cellular development. These genes were
prioritized for further evaluation and characterization in OSCC by quantification of
mRNA and protein expression levels as their clinical impact in oral cancer is poorly
understood and literature suggests a high probability of involvement in tumourigenesis.
These genes were found to harbor in rare amplicons (chromosome 1p36.33 and
11q22.2), however, it has been hypothesized that even rare amplicons would be
informative regarding genes crucial in tumor development as the expression may be
altered by either copy number changes or other mechanisms by disrupting the upstream
or downstream genes in different mechanisms that control a particular pathway
(Snijders et al., 2005). Therefore, in order to test this hypothesis whether ISG15 is a
driver gene in OSCC (as MMP13 roles in oral tumorigenesis has been studied
previously). Therefore, ISG15 was selected for further downstream analysis which is to
determine its gene and protein expression in OSCC samples as well as its functional
roles via in vitro study using OSCC cell line models based on its involvement in the
oncogenic network (cell death and survival, cellular movement, cellular development).

159
5.3 Identifying and determining the mRNA and protein expression of candidate
gene and their correlation with clinical and socio-demographic parameters
and as survival of patients
5.3.1 Matrix Metallopeptidase 13 (MMP13)
To date, few studies have demonstrated the over-expression of MMP13 mRNA and
protein expression among OSCCs and head and neck SCCs (Johansson et al., 1997;
Cazorla et al., 1998; Etoh et al., 2000; P et al., 2001; Culhaci et al., 2004; Dunne et al.,
2005; Chiang et al., 2006; Luukkaa et al., 2006; Makinen et al., 2012), although their
role in oral tumourigenesis remains elusive. CNAs are widely documented as among the
major drivers in cancer cases essentially through the process of altering the gene
transcription levels (Albertson, 2006). In this study, the amplification of chromosome
11q22.2 was identified in 4 out of 75 OSCC samples that were subjected to array CGH
analysis. Further identification of this amplicon revealed a candidate oncogene namely
MMP13 that is involved in tumourigenesis with its metastasis ability. The identification
of the four samples enabled the determination of the role of this gene in oral
tumourigenesis using an independent set of samples at mRNA and protein levels and
provides a stronger conclusion for the discovery of biomarkers in cancers (Hewitt et al.,
2004).
Although there is a lack of significant association between mRNA expressions of
MMP13 with clinico-pathologic parameters, the over-expression of MMP13 mRNA
was associated with poor prognosis. A similar observation has been reported on
esophageal SCC (Etoh et al., 2000). The literature review shows that, to date, only two
investigations have been conducted on the prognostic value of MMP13 in OSCCs. The
first study, by (Chiang et al., 2006), did not observe any association between over-
expression of MMP13 and clinical outcome as well as poor survival while the second,

160
which mainly focused on oral tongue SCC, found a significant role for MMP13 as a
prognostic marker (Makinen et al., 2012). In this study, the over-expression of MMP13
protein showed a significant association with advanced stage and lymph node
metastasis. This observation reveals the proteolytic activity of MMP13 in the
degradation of the extracellular matrix and basement membrane which enhances tumour
progression and invasion in oral tumourigenesis. To the best of our knowledge, no
extensive study has been conducted on the relationship between MMP13 protein
expression and lymph node metastasis in OSCC, and these findings provide further
support that MMP13 is involved in OSCC invasion and metastasis. In addition, it shows
an association with poor prognosis. However, when adjusted for lymph node status and
tumour staging, MMP13 was not shown to be an independent prognostic factor. This
implies that the significance of using MMP13 as a prognostic marker may be more
pronounced after taking into account the patient’s lymph node status and tumour stage.
Taken together, the over-expression of MMP13 has been identified as an
independent prognostic marker for OSCC at the mRNA level. In addition, increased
expressions of MMP13 protein in OEDs and OSCC as compared to normal oral
mucosa, and its correlation with advanced stage and lymph node metastasis of OSCC
provide further evidence of its role in the genesis and progression of OSCC. Further
investigations on the interaction of MMP13 with other potential genes or environmental
risk factors would shed light on the complex role of this gene in oral tumourigenesis.

161
In this study, MMP13 protein was found to be highly expressed in the epithelial cells
of OSCCs as compared to normal oral mucosal epithelial cells. In addition, the
increased expressions of MMP13 protein from the epithelial cells of normal mucosa as
compared to OSCC reflect the important role of this gene in the progression to OSCC.
These current results are consistent with previously reported evidence conducted on
OEDs and OSCCs (Chiang et al., 2006). Hence, MMP13 protein might be considered as
a useful predictive marker for OEDs with a risk of malignant transformation. However,
as the sample size of OEDs was too small to draw any strong conclusions, further
investigations are warranted.
5.4 Investigating the functional roles of a putative cancer gene using RNAi
technique in OSCC cell lines model
5.4.1 Interferon Stimulated Gene (ISG15)
In this study, the amplification of the ISG15 was identified in chromosome 1p36.33
in 4 out of 75 OSCC samples using array CGH, and its mRNA and protein expressions
were significantly over-expressed in OSCC compared to non-cancer oral mucosa
samples and OEDs. Further, the high level of ISG15 expressions was shown to
associate with gender, LNM, and pathological staging as well as poor prognosis in
OSCC. To the best of our knowledge, this is the first attempt to use siRNA treatment to
silence the ISG15 gene and to further characterize its oncogenic role in oral
tumorigenesis. Although Duex et al. (2011) had transfected siRNA that targeted against
ISG15 in the tongue SCC, glioma, and Hela cell lines, only the Hela and Glioma cell
lines that were treated with siRNA of ISG15 were reported as having inhibited cell
proliferation and induction of apoptosis. There was no further data that demonstrated
this finding in the tongue SCC cell line employed in their study for the oncogenic roles
of this gene in oral tumourigenesis.

162
ISG15 is an interferon regulated gene induced as a primary response with regard to
various microbial and cell stress stimuli and encodes a 15kDA interferon inducible
ubiquitin-like protein (Andersen & Hassel, 2006). As an ubiquitin-like protein, ISG15 is
conjugated to cellular proteins via an enzymatic pathway comprising the E1, E2, and E3
enzymes that are not different from the ubiquitination mechanism (Pickart, 2001; Jeon
et al., 2010; Zhang & Zhang, 2011). However, the post-translational modification by
ISG15 does not result in a proteasome-dependent degradation of ISG15 conjugates
protein (ISGylation) which is not seen in ubiquitination (Zhang & Zhang, 2011). In
ISGylation mechanism, the conjugation of ISG15 with protein substrates provides a tag
that either marks the labelled protein for degradation or modulates its function and,
therefore, disrupts the ubiquitination and alters the function of cellular proteins in
cancer (Jeon et al., 2010; Zhang & Zhang, 2011).
Andersen and Hassel (2006) indicate that the appropriate unperturbed regulation of
ISG15 gives rise to a tumour suppressive effect. However, the dys-regulated over-
expression of ISG15 in tumour cells results in an oncogenic effect that enhances tumour
progression and is correlated with the malignant phenotype in tumorigenesis. In this
study, the over-expression of ISG15 in its mRNA level was observed using qPCR in
OSCC samples. The IHC analysis displayed an over-expression of ISG15 protein in
OEDs with increasing grades of severity to OSCC indicating the involvement of this
gene in the transformation from OEDs to invasive OSCC. These findings in the current
study supported the study by Sumino et al. (2013) who found similar results in both
OEDs and OSCC. Thus, this gene can be used to improve the diagnosis and early
detection of oral cancer. In this way, improved diagnosis and early detection of oral
cancer can contribute to the administration of appropriate management approaches to
patients in terms of surgery, radiotherapy, or chemotherapy. To date, this study is the
163
first to significantly demonstrate the association of ISG15 expression with LNM and
pathological staging in OSCC. These findings were also reported in hepatocellular
carcinoma, breast and bladder cancer (Andersen et al., 2006; Bektas et al., 2008; Li et
al., 2014a). Apart from that, the over-expression of this gene has been reported to be
associated with poorer prognosis in several types of cancers such as bladder, breast, and
prostate cancers (Andersen et al., 2006; Bektas et al., 2008; Kiessling et al., 2009). This
study also demonstrates that the over-expression of this gene is associated with poor
prognosis as evidenced by the Kaplan-Meier analysis. These findings further strengthen
the value of ISG15 as a prognostic marker in OSCC which is in agreement with Sumino
et al. (2013). These results may be translated into the possibility of potentially using
ISG15 as a prognostic biomarker in OSCC patients. This may assist the surgeons or
oncology team in making decisions as to the need to be more or less radical in planning
the treatment for the OSCC patients. For example, surgeons may modify treatment
procedures in OSCC patients with low-expressed ISG15, which may predict better
survival, to avoid disfigurement and morbidity that may arise from overtreatment.
Another explanation of perceiving this gene as a poor prognostic marker in OSCC
patients might be due to its adverse response towards chemotherapeutic agents such as
paclitaxel and 5-fluorouracil in the therapy of OSCC which were also reported in
ovarian carcinoma xenograft and esophageal SCC (Bani et al., 2004; Matsumura et al.,
2005).

164
It is well documented that the ISG15 protein exists in both free (intracellular) and
conjugated form within the cells (ISGylation) with different cellular functions in
tumourigenesis (Andersen & Hassel, 2006). In this study, the Western blot analysis
showed that the OSCC cell lines expressed only the free form of ISG15. This
observation was identified in hepatocellular and bladder cancer where the over-
expression of the free form of the ISG15 but not its conjugates plays an important role
in tumourigenesis (Andersen et al., 2006; Li et al., 2014a). However, a contrasting
finding was reported by Desai (2015) who showed that free ISG15 was down-regulated
and had an anti-tumour function and its conjugate form had a pro-tumour function in
breast cancer. Although the amplification and over-expression of ISG15 has been
reported in oral cancer (Vincent-Chong et al., 2012; Sumino et al., 2013), the
mechanism of this gene in oral tumourigenesis remains unclear and as such, further
downstream analysis should be performed to clarify its role in this area.
Chi et al. (2009) identified the ISG15 protein as over-expressed in OSCC lesions at
different subsites within the oral cavity mainly in the tongue, cheeks, and gums. They
also demonstrated that IFN-beta treatment in the OC3 cheek SCC cell line induced
ISG15 expression and enhanced cell migration ability. However, the migration ability
caused by ISG15 remains unknown as it may be driven by the IFN-beta treatment.
Therefore, in this study, three OSCC cell lines derived from the gums, cheeks, and
tongue SCC were employed as OSCC in the in vitro model to investigate the functional
role(s) of ISG15 in oral tumorigenesis.

165
In this study, a knockdown of ISG15 suppressed cell proliferation and suggested to
induce apoptosis in oral tumourigenesis, indicating that it might promote tumour cell
survival and tumour growth in OSCC cells. Furthermore, the knockdown of the ISG15
might induce apoptosis, which is associated with the modulation of caspases 3 and
caspases 7 that are known apoptosis related proteins. However, this notion requires
experimental verification via apoptosis assay assessed by Annexin-V fluorescein
isothiocyanate (FITC) and propidium iodide (PI) double staining to discriminate
apoptotic cells from live cells and necrotic cells. The inhibition of ISG15 also
suppressed tumour cell proliferation via MTT assay and increased the doubling time of
oral cancer cells. The plausible mechanism driving this phenomenon could be the
interaction with CCND1 and EGFR obtained from the network analysis that identified
in this current study. The inhibition of ISG15 may reduce the expression of CCND1 and
induce cell cycle arrest (Musgrove et al., 2011). Apart from that, the role of EGFR in
promoting tumour cell proliferation and tumour survival via various oncogenic
pathways in cancer is well documented (Mendelsohn & Baselga, 2006). Therefore,
ISG15 may exert its anti-apoptotic function by directly inhibiting caspase activities and
up-regulating proliferative proteins, thus contributing to oral tumorigenesis.
In tumourigenesis, the resistance of tumour cells to apoptosis is an important
characteristic in cancer development (Igney & Krammer, 2002) and resolving this
resistance in cancer cells is crucial as it can lead to improvements in tumour treatment
responses. This study also suggests that the anti-apoptotic function of ISG15 induced
resistance to anti-cancer treatment such as cisplatin. The recent review by da Silva et al.
(2012) indicated that cisplatin is one of the most common chemotherapy drugs used for
primary or adjuvant treatment for locally advanced OSCC. Studies also showed that
cisplatin-based induction chemotherapy has been reported to improve 5-year survival

166
rates in HNSCC cancer patients with locally advanced disease (Merlano et al., 1996;
Adelstein et al., 2002). In this study, the knockdown of ISG15 enhanced cisplatin-
induced cell death in OSCC cells and was further supported by elevated levels of
cleaved caspases 3 and caspases 7 in ISG15 siRNA OSCC cells after cisplatin
treatment. However, the reduction of the cell viability is more obvious particularly in
ORL-188 compared to ORL-48 and ORL-204. The mechanism that lead to this
observation is unclear due to the ISG15 protein expression for all cell lines were in
similar level (refer to western blot result, Figure 4.13). Therefore, the mechanism that
caused this event requires further study for confirmation. Overall, these results
suggested that ISG15 inhibits cisplatin-induced cell death and contributes to cisplatin
resistance in OSCC cells. Our findings suggest that ISG15 can serve as a specific
predictor for response to cisplatin in OSCC. Further, a therapy targeting ISG15 in
combination with cisplatin may overcome apoptotic resistance and improve responses
in OSCC.
Oral cancer metastasis is a complex process involving the detachment of cells from
tumour tissue, regulation of cell motility and invasion, and proliferation and invasion
through the lymphatic system or blood vessels (Noguti et al., 2012). Understanding the
molecular mechanisms that mediate tumour invasion and metastasis may facilitate the
identification of novel therapeutic targets for the management of tumour dissemination.
In this study, over-expression of ISG15 was significantly associated with lymph node
metastasis and advanced stages of OSCC. These findings suggest that ISG15 may have
a role in driving disease spread. With this in mind, the role of ISG15 in increasing
migratory and invasion potential was examined with the wound healing assay, transwell
migration and invasion assays. Through these assays, it was evident that the knockdown
of ISG15 suppressed tumour cell migration and invasion in OSCC cells. Therefore, this

167
study showed that ISG15 could promote cell migration and invasion and is likely to be
involved in mechanisms of disease spread, which is consistent with the association of its
expression with lymph node metastases and advanced stages of OSCC. Although the
mechanism by which ISG15 could drive metastasis is still unclear, ISG15 could
contribute to this phenotype by disrupting the cytoskeletal architecture and stabilizing
the protein by inhibiting the ubiquitin/26S proteasome pathway which could affect cell
motility (Desai et al., 2012).

168
CONCLUSIONS CHAPTER 6:
6.1 Summary and conclusion of study
The primary objective of the current research was to determine CNAs in OSCC
using array CGH. The genome-wide profiling results revealed multiple genomic
regions, including amplifications on 1p, 3q, 5p, 7p, 8q, 9q, 10p, 11q, and deletions on
3p and 8p. The most frequently amplified CNAs were located on chromosome 8q22.3-
q23.1 whereas the most frequently deleted CNAs were located on chromosome
3p21.31. The study also has identified chromosomes 3q, 8q and 11q had the highest
number of changes in copy number at different regions across the entire length of the
chromosome. Amplification of chromosome 7p was significantly associated with
tumour size and tumour staging whereas amplification of chromosome 8q, 11q and loss
of chromosome 8p were found to be significantly associated with tumour staging.
Greater amplifications of chromosome 9p show a significant relationship in OSCC
patients with lymph node metastasis (p < 0.05). Amplification of chromosome 8q, 11q,
7p, 9p and deletion of chromosome 8p were significantly associated with poor
prognosis (p < 0.05). Amplification of chromosome 11q, 7p, 9p and deletion of
chromosome 8p remained as an independent prognostic marker after adjustment for
selected socio-demographic (age, gender, and risk habits) and clinico-pathologic
parameters (tumour subsite, lymph node status and tumour staging) were made for
OSCC. Amplification of a combination of chromosomes 7p8q9p11q considered as a
‘genetic signature’ remained as an independent prognostic marker after adjustment for
selected socio-demographic (age, gender, and risk habits) and clinico-pathological
parameters (tumour subsite, lymph node status and tumour staging) of OSCC. More
than 50% of the selected amplified genes validated in the OSCC samples employed in
169
the genome-wide profiling study. The qPCR copy number analysis showed a similar
pattern of the genetic signature (chromosome 7p8q9p11q) and their respective amplified
gene namely EGFR, LRP12, TPM2 and CCND1, grouping together as a four amplified
genes ‘genetic signature’ were found to be an independent prognostic marker after
adjustment for selected socio-demographic (age, gender and risk habits) and clinico-
pathological parameters (tumour subsite, lymph node status and tumour staging) of
OSCC.
The second objective of this study was to identify the pathways, biological
annotations and networks implicated in OSCC pathogenesis. The top most significant
signalling pathway identified was integrin-linked kinase signalling pathway. The
biological annotations associated with the CNAs include cell death and survival,
cellular function and maintenance, cellular development, cellular growth and
proliferation, and cellular movement. The most significant network was linked to cell
death and survival, cellular movement, cellular development. The top most significant
network harbours 73 genes among which the major core genes CCND1, RELA, TP63
and EGFR were hub nodes in the network, and formed interconnected auto-regulatory
and feed forward circuitry.
The third objective of this study was to identify and to determine the mRNA and
protein expression of the selected candidate genes and their correlation with clinical and
socio-demographic parameters as well as the survival of patients. In this study, the
expression of MMP13 and ISG15 were validated in Malaysian oral cancer patients. To
the best of our knowledge, this is the largest study to demonstrate mRNA and protein
expression using OSCC samples. The mRNA and protein expression levels were
confirmed to be over-expressed significantly in OSCC in comparison to the non-cancer
170
oral mucosa samples for both the genes. Statistical analysis of both genes was
associated with lymph node metastasis and tumour staging. Kaplan-Meier analysis
revealed that over-expression of MMP13 and ISG15 genes were associated with poor
prognosis. However, multivariate Cox regression model analysis for the over-
expression of MMP13 and ISG15 genes do not support these genes to be independent
prognostic markers in OSCC.
The last objective was to investigate the functional roles of the putative cancer gene
using RNAi technique in OSCC cell lines model. In this study, the gene expression of
ISG15 was reduced using siRNA that targeted ISG15 in oral cancer cell lines. In vitro
experiments showed that reduced expression of ISG15 by siRNA inhibited cancer cell
proliferation, migration, invasion and was more resistant to cell death compared to the
non-targeting control. Reduced expression of ISG15 also resulted in an increase in
susceptibility to cisplatin-induced cell death, as indicated by the increase in Caspase3/7
activation. Taken together, ISG15 drives cell proliferation and migration suggesting it
may be driver gene in oral tumorigenesis, thus could be a potential therapeutic target for
OSCC patients. Further, over-expression of ISG15 could also be novel clinical and
prognostic biomarkers in OSCC and the inhibition of this gene could be a potential
therapeutic target for OSCC patients.
6.2 Study limitations and recommendations
A limitation in this current study was that the copy number alterations were not
analyzed parallel to the gene expression level. This can be achieved by integrating the
copy number alterations with gene expression data derived from a public database such
as the recent TCGA consortium exome sequencing and RNA sequencing data to
171
identify specific target genes that altered the gene dosage caused by the chromosomal
alterations. Secondly, this in vitro functional study demonstrated that reduced
expression of ISG15 enabled suppression of tumour cell proliferation, migration,
invasion and were more resistant to apoptosis in oral carcinogenesis. However, this
study did not verify that the inhibition of ISG15 gene expression prevents tumour
growth and metastasis in oral cancer in vivo.
In the future, the findings from the high-resolution array CGH can be validated using
a larger number of samples on lower resolution array CGH. This is proposed to reduce
cost and to improve the probability of detecting recurrent segmental copy number
alteration and other mechanisms such as epigenetic changes and mutations at the
sequence level, which can contribute to specific gene deregulation. The present study
identified genes residing in recurrent chromosomal regions of oral cancer. Therefore, in
order to obtain a comprehensive picture of oral cancer, future efforts can be made to
combine the array CGH approaches with transcriptomic and proteomic technologies.
This can be done by integrating the copy number data with public expression datasets
such as the recent TCGA consortium exome sequencing and RNA sequencing data in
order to identify specific target genes that altere the gene dosage caused by the
chromosomal alterations.
In the current study, gene knockdown of ISG15 was applied to three cell lines
namely ORL-48T, ORL-188T and ORL-204T. These three cell lines may not represent
all the different subsite of OSCC cells, and therefore, the study of ISG15 ideally should
be repeated with OSCC cell lines from other oral cavity subsites and in other types of
human cancers.

172
Gene targeting therapy has been suggested as a novel therapeutic that are likely to
improve the prognosis for advanced cancer patients. ISG15 gene is ideal for gene
therapy research as it is found to be over-expressed in OSCC cancer cell but not in the
non-cancer oral mucosa tissue. However further investigation on the knockdown effect
of the gene and its application in vivo will facilitate the development of ISG15-targeted
OSCC treatment for clinical application. Apart from that, the ISG15 protein is involved
in various pathways and cell types, therefore, future studies on the signalling
mechanism including the use of specific inhibitors or neutralizing antibodies to
particular signalling molecules, to elucidate the ISG15-related genes and pathways
would be essential to consolidate the ISG15 signalling mechanism.
On the other hand, ISG15 is a secretory protein that can be detected in the
bloodstream of patients; its potential as a prognostic or diagnostic marker should be a
point of interest for future OSCC cases, and for that reason the ISG15 level in different
cohorts of patients, as well as healthy individuals, should be studied to provide a clear
reference for the application of ISG15 as a marker for OSCC detection.

173
REFERENCES
Aaronson, S. A. (1991). Growth factors and cancer. Science, 254(5035), 1146-1153.
Abbott, R. G., Forrest, S., & Pienta, K. J. (2006). Simulating the hallmarks of cancer.
Artif Life, 12(4), 617-634.
Adelstein, D. J., Saxton, J. P., Lavertu, P., Rybicki, L. A., Esclamado, R. M., Wood, B.
G., Strome, M., & Carroll, M. A. (2002). Maximizing local control and organ
preservation in stage IV squamous cell head and neck cancer With
hyperfractionated radiation and concurrent chemotherapy. J Clin Oncol, 20(5),
1405-1410.
Agrawal, N., Frederick, M. J., Pickering, C. R., Bettegowda, C., Chang, K., Li, R. J.,
Fakhry, C., Xie, T. X., Zhang, J., Wang, J., Zhang, N., El-Naggar, A. K., Jasser,
S. A., Weinstein, J. N., Trevino, L., Drummond, J. A., Muzny, D. M., Wu, Y.,
Wood, L. D., Hruban, R. H., Westra, W. H., Koch, W. M., Califano, J. A.,
Gibbs, R. A., Sidransky, D., Vogelstein, B., Velculescu, V. E., Papadopoulos,
N., Wheeler, D. A., Kinzler, K. W., & Myers, J. N. (2011). Exome sequencing
of head and neck squamous cell carcinoma reveals inactivating mutations in
NOTCH1. Science, 333(6046), 1154-1157.
Akervall, J. A., Jin, Y., Wennerberg, J. P., Zatterstrom, U. K., Kjellen, E., Mertens, F.,
Willen, R., Mandahl, N., Heim, S., & Mitelman, F. (1995). Chromosomal
abnormalities involving 11q13 are associated with poor prognosis in patients
with squamous cell carcinoma of the head and neck. Cancer, 76(5), 853-859.
Albertson, D. G. (2006). Gene amplification in cancer. Trends Genet, 22(8), 447-455.
Albertson, D. G., Collins, C., McCormick, F., & Gray, J. W. (2003). Chromosome
aberrations in solid tumors. Nat Genet, 34(4), 369-376.
Almangush, A., Bello, I. O., Keski-Santti, H., Makinen, L. K., Kauppila, J. H., Pukkila,
M., Hagstrom, J., Laranne, J., Tommola, S., Nieminen, O., Soini, Y., Kosma, V.
M., Koivunen, P., Grenman, R., Leivo, I., & Salo, T. (2014). Depth of invasion,
tumor budding, and worst pattern of invasion: prognostic indicators in early-
stage oral tongue cancer. Head Neck, 36(6), 811-818.
Ambatipudi, S., Gerstung, M., Gowda, R., Pai, P., Borges, A. M., Schaffer, A. A.,
Beerenwinkel, N., & Mahimkar, M. B. (2011). Genomic profiling of advanced-
stage oral cancers reveals chromosome 11q alterations as markers of poor
clinical outcome. PLoS One, 6(2), e17250.
Amtha, R., Ching, C. S., Zain, R., Razak, I. A., Basuki, B., Roeslan, B. O., Gautama,
W., & Purwanto, D. (2009). GSTM1, GSTT1 and CYP1A1 polymorphisms and
risk of oral cancer: a case-control study in Jakarta, Indonesia. Asian Pac J
Cancer Prev, 10(1), 21-26.
Andersen, J. B., Aaboe, M., Borden, E. C., Goloubeva, O. G., Hassel, B. A., & Orntoft,
T. F. (2006). Stage-associated overexpression of the ubiquitin-like protein,
ISG15, in bladder cancer. Br J Cancer, 94(10), 1465-1471.

174
Andersen, J. B., & Hassel, B. A. (2006). The interferon regulated ubiquitin-like protein,
ISG15, in tumorigenesis: friend or foe? Cytokine Growth Factor Rev, 17(6),
411-421.
Anneroth, G., Batsakis, J., & Luna, M. (1987). Review of the literature and a
recommended system of malignancy grading in oral squamous cell carcinomas.
Scand J Dent Res, 95(3), 229-249.
Arduino, P. G., Carrozzo, M., Chiecchio, A., Broccoletti, R., Tirone, F., Borra, E.,
Bertolusso, G., & Gandolfo, S. (2008). Clinical and histopathologic independent
prognostic factors in oral squamous cell carcinoma: a retrospective study of 334
cases. J Oral Maxillofac Surg, 66(8), 1570-1579.
Argiris, A., Karamouzis, M. V., Raben, D., & Ferris, R. L. (2008). Head and neck
cancer. Lancet, 371(9625), 1695-1709.
Arthur, K., & Farr, H. W. (1972). Prognostic significance of histologic grade in
epidermoid carcinoma of the mouth and pharynx. Am J Surg, 124(4), 489-492.
Asai, T., Tomita, Y., Nakatsuka, S., Hoshida, Y., Myoui, A., Yoshikawa, H., & Aozasa,
K. (2002). VCP (p97) regulates NFkappaB signaling pathway, which is
important for metastasis of osteosarcoma cell line. Jpn J Cancer Res, 93(3),
296-304.
Baak, J. P., Path, F. R., Hermsen, M. A., Meijer, G., Schmidt, J., & Janssen, E. A.
(2003). Genomics and proteomics in cancer. Eur J Cancer, 39(9), 1199-1215.
Bagan, J., Sarrion, G., & Jimenez, Y. (2010). Oral cancer: clinical features. Oral Oncol,
46(6), 414-417.
Bani, M. R., Nicoletti, M. I., Alkharouf, N. W., Ghilardi, C., Petersen, D., Erba, E.,
Sausville, E. A., Liu, E. T., & Giavazzi, R. (2004). Gene expression correlating
with response to paclitaxel in ovarian carcinoma xenografts. Mol Cancer Ther,
3(2), 111-121.
Bankfalvi, A., & Piffko, J. (2000). Prognostic and predictive factors in oral cancer: the
role of the invasive tumour front. J Oral Pathol Med, 29(7), 291-298.
Banoczy, J., Gintner, Z., & Dombi, C. (2001). Tobacco use and oral leukoplakia. J Dent
Educ, 65(4), 322-327.
Bazley, L. A., & Gullick, W. J. (2005). The epidermal growth factor receptor family.
Endocr Relat Cancer, 12 Suppl 1, S17-27.
Beckman, R. A., & Loeb, L. A. (2005). Genetic instability in cancer: theory and
experiment. Semin Cancer Biol, 15(6), 423-435.
Bejjani, B. A., & Shaffer, L. G. (2006). Application of array-based comparative
genomic hybridization to clinical diagnostics. J Mol Diagn, 8(5), 528-533.

175
Bektas, N., Noetzel, E., Veeck, J., Press, M. F., Kristiansen, G., Naami, A., Hartmann,
A., Dimmler, A., Beckmann, M. W., Knuchel, R., Fasching, P. A., & Dahl, E.
(2008). The ubiquitin-like molecule interferon-stimulated gene 15 (ISG15) is a
potential prognostic marker in human breast cancer. Breast Cancer Res, 10(4),
R58.
Berke, J. D., Sgambato, V., Zhu, P. P., Lavoie, B., Vincent, M., Krause, M., & Hyman,
S. E. (2001). Dopamine and glutamate induce distinct striatal splice forms of
Ania-6, an RNA polymerase II-associated cyclin. Neuron, 32(2), 277-287.
Bernier, J., Domenge, C., Ozsahin, M., Matuszewska, K., Lefebvre, J. L., Greiner, R.
H., Giralt, J., Maingon, P., Rolland, F., Bolla, M., Cognetti, F., Bourhis, J.,
Kirkpatrick, A., van Glabbeke, M., European Organization for, R., & Treatment
of Cancer, T. (2004). Postoperative irradiation with or without concomitant
chemotherapy for locally advanced head and neck cancer. N Engl J Med,
350(19), 1945-1952.
Beroukhim, R., Mermel, C. H., Porter, D., Wei, G., Raychaudhuri, S., Donovan, J.,
Barretina, J., Boehm, J. S., Dobson, J., Urashima, M., Mc Henry, K. T.,
Pinchback, R. M., Ligon, A. H., Cho, Y. J., Haery, L., Greulich, H., Reich, M.,
Winckler, W., Lawrence, M. S., Weir, B. A., Tanaka, K. E., Chiang, D. Y.,
Bass, A. J., Loo, A., Hoffman, C., Prensner, J., Liefeld, T., Gao, Q., Yecies, D.,
Signoretti, S., Maher, E., Kaye, F. J., Sasaki, H., Tepper, J. E., Fletcher, J. A.,
Tabernero, J., Baselga, J., Tsao, M. S., Demichelis, F., Rubin, M. A., Janne, P.
A., Daly, M. J., Nucera, C., Levine, R. L., Ebert, B. L., Gabriel, S., Rustgi, A.
K., Antonescu, C. R., Ladanyi, M., Letai, A., Garraway, L. A., Loda, M., Beer,
D. G., True, L. D., Okamoto, A., Pomeroy, S. L., Singer, S., Golub, T. R.,
Lander, E. S., Getz, G., Sellers, W. R., & Meyerson, M. (2010). The landscape
of somatic copy-number alteration across human cancers. Nature, 463(7283),
899-905.
Bertrand, J. R., Pottier, M., Vekris, A., Opolon, P., Maksimenko, A., & Malvy, C.
(2002). Comparison of antisense oligonucleotides and siRNAs in cell culture
and in vivo. Biochem Biophys Res Commun, 296(4), 1000-1004.
Bitu, C. C., Destro, M. F., Carrera, M., da Silva, S. D., Graner, E., Kowalski, L. P.,
Soares, F. A., & Coletta, R. D. (2012). HOXA1 is overexpressed in oral
squamous cell carcinomas and its expression is correlated with poor prognosis.
BMC Cancer, 12, 146.
Blanchard, P., Baujat, B., Holostenco, V., Bourredjem, A., Baey, C., Bourhis, J.,
Pignon, J. P., & group, M.-C. C. (2011). Meta-analysis of chemotherapy in head
and neck cancer (MACH-NC): a comprehensive analysis by tumour site.
Radiother Oncol, 100(1), 33-40.
Bockmuhl, U., Schluns, K., Kuchler, I., Petersen, S., & Petersen, I. (2000). Genetic
imbalances with impact on survival in head and neck cancer patients. Am J
Pathol, 157(2), 369-375.
British, D. A. (2000). Opportunistic oral cancer screening. BDA Occasional Paper,
6(1), 1-36.
176
Brockton, N. T., Klimowicz, A. C., Bose, P., Petrillo, S. K., Konno, M., Rudmik, L.,
Dean, M., Nakoneshny, S. C., Matthews, T. W., Chandarana, S., Lau, H. Y.,
Magliocco, A. M., & Dort, J. C. (2012). High stromal carbonic anhydrase IX
expression is associated with nodal metastasis and decreased survival in patients
with surgically-treated oral cavity squamous cell carcinoma. Oral Oncol, 48(7),
615-622.
Bronstad, I., Wolff, A. S., Lovas, K., Knappskog, P. M., & Husebye, E. S. (2011).
Genome-wide copy number variation (CNV) in patients with autoimmune
Addison's disease. BMC Med Genet, 12, 111.
Broumand, V., Lozano, T. E., & Gomez, J. A. (2006). Evaluation and staging of oral
cancer. Oral Maxillofac Surg Clin North Am, 18(4), 435-444.
Callender, T., el-Naggar, A. K., Lee, M. S., Frankenthaler, R., Luna, M. A., & Batsakis,
J. G. (1994). PRAD-1 (CCND1)/cyclin D1 oncogene amplification in primary
head and neck squamous cell carcinoma. Cancer, 74(1), 152-158.
Cazorla, M., Hernandez, L., Nadal, A., Balbin, M., Lopez, J. M., Vizoso, F., Fernandez,
P. L., Iwata, K., Cardesa, A., Lopez-Otin, C., & Campo, E. (1998). Collagenase-
3 expression is associated with advanced local invasion in human squamous cell
carcinomas of the larynx. J Pathol, 186(2), 144-150.
Chambers, A. F., Groom, A. C., & MacDonald, I. C. (2002). Dissemination and growth
of cancer cells in metastatic sites. Nat Rev Cancer, 2(8), 563-572.
Chang, Y. C., Nieh, S., Chen, S. F., Jao, S. W., Lin, Y. L., & Fu, E. (2010). Invasive
pattern grading score designed as an independent prognostic indicator in oral
squamous cell carcinoma. Histopathology, 57(2), 295-303.
Chauhan, S. C., Ebeling, M. C., Maher, D. M., Koch, M. D., Watanabe, A., Aburatani,
H., Lio, Y., & Jaggi, M. (2012). MUC13 mucin augments pancreatic
tumorigenesis. Mol Cancer Ther, 11(1), 24-33.
Chauhan, S. C., Vannatta, K., Ebeling, M. C., Vinayek, N., Watanabe, A., Pandey, K.
K., Bell, M. C., Koch, M. D., Aburatani, H., Lio, Y., & Jaggi, M. (2009).
Expression and functions of transmembrane mucin MUC13 in ovarian cancer.
Cancer Res, 69(3), 765-774.
Chen, C., Zhang, Y., Loomis, M. M., Upton, M. P., Lohavanichbutr, P., Houck, J. R.,
Doody, D. R., Mendez, E., Futran, N., Schwartz, S. M., & Wang, P. (2015).
Genome-Wide Loss of Heterozygosity and DNA Copy Number Aberration in
HPV-Negative Oral Squamous Cell Carcinoma and Their Associations with
Disease-Specific Survival. PLoS One, 10(8), e0135074.
Chen, G., Bhojani, M. S., Heaford, A. C., Chang, D. C., Laxman, B., Thomas, D. G.,
Griffin, L. B., Yu, J., Coppola, J. M., Giordano, T. J., Lin, L., Adams, D.,
Orringer, M. B., Ross, B. D., Beer, D. G., & Rehemtulla, A. (2005).
Phosphorylated FADD induces NF-kappaB, perturbs cell cycle, and is
associated with poor outcome in lung adenocarcinomas. Proc Natl Acad Sci U S
A, 102(35), 12507-12512.

177
Chen, I. H., Chang, J. T., Liao, C. T., Wang, H. M., Hsieh, L. L., & Cheng, A. J. (2003).
Prognostic significance of EGFR and Her-2 in oral cavity cancer in betel quid
prevalent area cancer prognosis. Br J Cancer, 89(4), 681-686.
Chen, Y. J., Lin, S. C., Kao, T., Chang, C. S., Hong, P. S., Shieh, T. M., & Chang, K.
W. (2004). Genome-wide profiling of oral squamous cell carcinoma. J Pathol,
204(3), 326-332.
Chi, L. M., Lee, C. W., Chang, K. P., Hao, S. P., Lee, H. M., Liang, Y., Hsueh, C., Yu,
C. J., Lee, I. N., Chang, Y. J., Lee, S. Y., Yeh, Y. M., Chang, Y. S., Chien, K.
Y., & Yu, J. S. (2009). Enhanced interferon signaling pathway in oral cancer
revealed by quantitative proteome analysis of microdissected specimens using
16O/18O labeling and integrated two-dimensional LC-ESI-MALDI tandem MS.
Mol Cell Proteomics, 8(7), 1453-1474.
Chiang, W. C., Wong, Y. K., Lin, S. C., Chang, K. W., & Liu, C. J. (2006). Increase of
MMP-13 expression in multi-stage oral carcinogenesis and epigallocatechin-3-
gallate suppress MMP-13 expression. Oral Dis, 12(1), 27-33.
Choi, S., & Myers, J. N. (2008). Molecular pathogenesis of oral squamous cell
carcinoma: implications for therapy. J Dent Res, 87(1), 14-32.
Ciardiello, F., De Vita, F., Orditura, M., & Tortora, G. (2004). The role of EGFR
inhibitors in nonsmall cell lung cancer. Curr Opin Oncol, 16(2), 130-135.
Coleman, W. B., & Tsongalis, G. J. (2002). The role of genomic instability in the
development of human cancer. In W. B. Coleman & G. J. Tsongalis (Eds.), The
Molecular Basis of Human Cancer (pp. 115-142). New York Springer
Science+Business Media
Cooper, G. M. (2000). Tumor Suppressor Genes The Cell: A Molecular Approach.
Washington: ASM Press.
Cooper, J. S., Pajak, T. F., Forastiere, A. A., Jacobs, J., Campbell, B. H., Saxman, S. B.,
Kish, J. A., Kim, H. E., Cmelak, A. J., Rotman, M., Machtay, M., Ensley, J. F.,
Chao, K. S., Schultz, C. J., Lee, N., Fu, K. K., & Radiation Therapy Oncology
Group, I. (2004). Postoperative concurrent radiotherapy and chemotherapy for
high-risk squamous-cell carcinoma of the head and neck. N Engl J Med,
350(19), 1937-1944.
Cordes, N., & van Beuningen, D. (2003). Cell adhesion to the extracellular matrix
protein fibronectin modulates radiation-dependent G2 phase arrest involving
integrin-linked kinase (ILK) and glycogen synthase kinase-3beta (GSK-3beta) in
vitro. Br J Cancer, 88(9), 1470-1479.
Croce, C. M. (2008). Oncogenes and cancer. N Engl J Med, 358(5), 502-511.
Croce, C. M., Sozzi, G., & Huebner, K. (1999). Role of FHIT in human cancer. J Clin
Oncol, 17(5), 1618-1624.

178
Culhaci, N., Metin, K., Copcu, E., & Dikicioglu, E. (2004). Elevated expression of
MMP-13 and TIMP-1 in head and neck squamous cell carcinomas may reflect
increased tumor invasiveness. BMC Cancer, 4, 42.
da Silva, S. D., Alaoui-Jamali, M. A., Soares, F. A., Carraro, D. M., Brentani, H. P.,
Hier, M., Rogatto, S. R., & Kowalski, L. P. (2014). TWIST1 is a molecular
marker for a poor prognosis in oral cancer and represents a potential therapeutic
target. Cancer, 120(3), 352-362.
da Silva, S. D., Hier, M., Mlynarek, A., Kowalski, L. P., & Alaoui-Jamali, M. A.
(2012). Recurrent oral cancer: current and emerging therapeutic approaches.
Front Pharmacol, 3, 149.
Das, R. K., Pal, M., Barui, A., Paul, R. R., Chakraborty, C., Ray, A. K., Sengupta, S., &
Chatterjee, J. (2010). Assessment of malignant potential of oral submucous
fibrosis through evaluation of p63, E-cadherin and CD105 expression. J Clin
Pathol, 63(10), 894-899.
DeBerardinis, R. J., Lum, J. J., Hatzivassiliou, G., & Thompson, C. B. (2008). The
biology of cancer: metabolic reprogramming fuels cell growth and proliferation.
Cell Metab, 7(1), 11-20.
Deheuninck, J., & Luo, K. (2009). Ski and SnoN, potent negative regulators of TGF-
beta signaling. Cell Res, 19(1), 47-57.
Denhart, B. C., Guidi, A. J., Tognazzi, K., Dvorak, H. F., & Brown, L. F. (1997).
Vascular permeability factor/vascular endothelial growth factor and its receptors
in oral and laryngeal squamous cell carcinoma and dysplasia. Lab Invest, 77(6),
659-664.
Desai, S. D. (2015). ISG15: A double edged sword in cancer. Oncoimmunology, 4(12),
e1052935.
Desai, S. D., Reed, R. E., Burks, J., Wood, L. M., Pullikuth, A. K., Haas, A. L., Liu, L.
F., Breslin, J. W., Meiners, S., & Sankar, S. (2012). ISG15 disrupts cytoskeletal
architecture and promotes motility in human breast cancer cells. Exp Biol Med
(Maywood), 237(1), 38-49.
Dienstmann, R., Jang, I. S., Bot, B., Friend, S., & Guinney, J. (2015). Database of
genomic biomarkers for cancer drugs and clinical targetability in solid tumors.
Cancer Discov, 5(2), 118-123.
Dube, S., Thomas, A., Abbott, L., Benz, P., Mitschow, C., Dube, D. K., & Poiesz, B. J.
(2016). Expression of tropomyosin 2 gene isoforms in human breast cancer cell
lines. Oncol Rep, 35(6), 3143-3150.
Duex, J. E., Comeau, L., Sorkin, A., Purow, B., & Kefas, B. (2011). Usp18 regulates
epidermal growth factor (EGF) receptor expression and cancer cell survival via
microRNA-7. J Biol Chem, 286(28), 25377-25386.
179
Dunne, A. A., Mandic, R., Falkenberg, S., Dalchow, C. V., Sesterhenn, A. M., &
Werner, J. A. (2005). RT-PCR expression profiling of matrix metalloproteinases
and their specific inhibitors in cell lines and fresh biopsies of squamous cell
carcinomas of the head and neck. In Vivo, 19(5), 943-948.
El-Naaj, I. A., Leiser, Y., Shveis, M., Sabo, E., & Peled, M. (2011). Incidence of oral
cancer occult metastasis and survival of T1-T2N0 oral cancer patients. J Oral
Maxillofac Surg, 69(10), 2674-2679.
Elmore, S. A. (2006). Histopathology of the lymph nodes. Toxicol Pathol, 34(5), 425-
454.
Etoh, T., Inoue, H., Yoshikawa, Y., Barnard, G. F., Kitano, S., & Mori, M. (2000).
Increased expression of collagenase-3 (MMP-13) and MT1-MMP in
oesophageal cancer is related to cancer aggressiveness. Gut, 47(1), 50-56.
Evan, G. I., & Vousden, K. H. (2001). Proliferation, cell cycle and apoptosis in cancer.
Nature, 411(6835), 342-348.
Eversole, L. R. (2001). Clinical outline of oral pathology: diagnosis and treatment.
Shelton: People's Medical Publishing House.
Farber, E. (1984). The multistep nature of cancer development. Cancer Res, 44(10),
4217-4223.
Ferlay, J., Soerjomataram, I., Dikshit, R., Eser, S., Mathers, C., Rebelo, M., Parkin, D.
M., Forman, D., & Bray, F. (2015). Cancer incidence and mortality worldwide:
sources, methods and major patterns in GLOBOCAN 2012. Int J Cancer,
136(5), E359-386.
Field, J. K. (1995). The role of oncogenes and tumour-suppressor genes in the aetiology
of oral, head and neck squamous cell carcinoma. J R Soc Med, 88(1), 35P-39P.
Folkman, J. (1990). What is the evidence that tumors are angiogenesis dependent? J
Natl Cancer Inst, 82(1), 4-6.
Folkman, J. (2006). Angiogenesis. Annu Rev Med, 57, 1-18.
Fröhling, S., & Döhner, H. (2008). Chromosomal abnormalities in cancer. New England
Journal of Medicine, 359(7), 722-734.
Fujita, M., Hirokawa, Y., Kashiwado, K., Akagi, Y., Kashimoto, K., Kiriu, H.,
Matsuura, K., & Ito, K. (1999). Interstitial brachytherapy for stage I and II
squamous cell carcinoma of the oral tongue: factors influencing local control
and soft tissue complications. Int J Radiat Oncol Biol Phys, 44(4), 767-775.
Furness, S., Glenny, A. M., Worthington, H. V., Pavitt, S., Oliver, R., Clarkson, J. E.,
Macluskey, M., Chan, K. K., & Conway, D. I. (2011). Interventions for the
treatment of oral cavity and oropharyngeal cancer: chemotherapy. Cochrane
Database Syst Rev(4), CD006386.

180
Gandini, S., Negri, E., Boffetta, P., La Vecchia, C., & Boyle, P. (2012). Mouthwash and
oral cancer risk quantitative meta-analysis of epidemiologic studies. Ann Agric
Environ Med, 19(2), 173-180.
Garewal, H. (1995). Antioxidants in oral cancer prevention. Am J Clin Nutr, 62(6
Suppl), 1410S-1416S.
Garnis, C., Campbell, J., Zhang, L., Rosin, M. P., & Lam, W. L. (2004a). OCGR array:
an oral cancer genomic regional array for comparative genomic hybridization
analysis. Oral oncology, 40(5), 511-519.
Garnis, C., Chari, R., Buys, T. P., Zhang, L., Ng, R. T., Rosin, M. P., & Lam, W. L.
(2009). Genomic imbalances in precancerous tissues signal oral cancer risk. Mol
Cancer, 8, 50.
Garnis, C., Coe, B. P., Zhang, L., Rosin, M. P., & Lam, W. L. (2004b). Overexpression
of LRP12, a gene contained within an 8q22 amplicon identified by high-
resolution array CGH analysis of oral squamous cell carcinomas. Oncogene,
23(14), 2582-2586.
Gisselsson, D., Jonson, T., Yu, C., Martins, C., Mandahl, N., Wiegant, J., Jin, Y.,
Mertens, F., & Jin, C. (2002). Centrosomal abnormalities, multipolar mitoses,
and chromosomal instability in head and neck tumours with dysfunctional
telomeres. Br J Cancer, 87(2), 202-207.
Gollin, S. M. (2005). Mechanisms leading to chromosomal instability. Semin Cancer
Biol, 15(1), 33-42.
Gordon, K. E., Ireland, H., Roberts, M., Steeghs, K., McCaul, J. A., MacDonald, D. G.,
& Parkinson, E. K. (2003). High levels of telomere dysfunction bestow a
selective disadvantage during the progression of human oral squamous cell
carcinoma. Cancer Res, 63(2), 458-467.
Gumbiner, B. M. (1996). Cell adhesion: the molecular basis of tissue architecture and
morphogenesis. Cell, 84(3), 345-357.
Gupta, B., & Johnson, N. W. (2014). Systematic review and meta-analysis of
association of smokeless tobacco and of betel quid without tobacco with
incidence of oral cancer in South Asia and the Pacific. PLoS One, 9(11),
e113385.
Haber, D. A., & Settleman, J. (2007). Cancer: drivers and passengers. Nature,
446(7132), 145-146.
Hahn, M., Hagedorn, G., Kuhlisch, E., Schackert, H. K., & Eckelt, U. (2002). Genetic
polymorphisms of drug-metabolizing enzymes and susceptibility to oral cavity
cancer. Oral Oncol, 38(5), 486-490.
Hamakawa, H., Nakashiro, K., Sumida, T., Shintani, S., Myers, J. N., Takes, R. P.,
Rinaldo, A., & Ferlito, A. (2008). Basic evidence of molecular targeted therapy
for oral cancer and salivary gland cancer. Head Neck, 30(6), 800-809.
181
Hanahan, D., & Folkman, J. (1996). Patterns and emerging mechanisms of the
angiogenic switch during tumorigenesis. Cell, 86(3), 353-364.
Hanahan, D., & Weinberg, R. A. (2000). The hallmarks of cancer. Cell, 100(1), 57-70.
Hanahan, D., & Weinberg, R. A. (2011). Hallmarks of cancer: the next generation. Cell,
144(5), 646-674.
Hayflick, L. (1997). Mortality and immortality at the cellular level. A review.
Biochemistry (Mosc), 62(11), 1180-1190.
He, L. H., Ma, Q., Shi, Y. H., Ge, J., Zhao, H. M., Li, S. F., & Tong, Z. S. (2013).
CHL1 is involved in human breast tumorigenesis and progression. Biochem
Biophys Res Commun, 438(2), 433-438.
Helen-Ng, L. C., Razak, I. A., Ghani, W. M., Marhazlinda, J., Norain, A. T., Raja
Jallaludin, R. L., Rahman, Z. A., Abdullah, N., & Zain, R. B. (2012). Dietary
pattern and oral cancer risk--a factor analysis study. Community Dent Oral
Epidemiol, 40(6), 560-566.
Herbst, R. S. (2004). Review of epidermal growth factor receptor biology. Int J Radiat
Oncol Biol Phys, 59(2 Suppl), 21-26.
Herity, B., Moriarty, M., Bourke, G. J., & Daly, L. (1981). A case-control study of head
and neck cancer in the Republic of Ireland. Br J Cancer, 43(2), 177-182.
Herrero, R., Castellsague, X., Pawlita, M., Lissowska, J., Kee, F., Balaram, P.,
Rajkumar, T., Sridhar, H., Rose, B., Pintos, J., Fernandez, L., Idris, A., Sanchez,
M. J., Nieto, A., Talamini, R., Tavani, A., Bosch, F. X., Reidel, U., Snijders, P.
J., Meijer, C. J., Viscidi, R., Munoz, N., Franceschi, S., & Group, I. M. O. C. S.
(2003). Human papillomavirus and oral cancer: the International Agency for
Research on Cancer multicenter study. J Natl Cancer Inst, 95(23), 1772-1783.
Heselmeyer, K., Schrock, E., du Manoir, S., Blegen, H., Shah, K., Steinbeck, R., Auer,
G., & Ried, T. (1996). Gain of chromosome 3q defines the transition from
severe dysplasia to invasive carcinoma of the uterine cervix. Proc Natl Acad Sci
U S A, 93(1), 479-484.
Hewitt, S. M., Dear, J., & Star, R. A. (2004). Discovery of protein biomarkers for renal
diseases. J Am Soc Nephrol, 15(7), 1677-1689.
Hinds, P. W., Dowdy, S. F., Eaton, E. N., Arnold, A., & Weinberg, R. A. (1994).
Function of a human cyclin gene as an oncogene. Proc Natl Acad Sci U S A,
91(2), 709-713.
Horner, M., Ries, L., Krapcho, M., Neyman, N., Aminou, R., Howlader, N., Altekruse,
S., Feuer, E., Huang, L., & Mariotto, A. (2009). SEER Cancer Statistics Review,
1975-2006, National Cancer Institute. Bethesda, MD.
https://seer.cancer.gov/archive/csr/1975_2006/

182
Howlader, N., Ries, L. A., Mariotto, A. B., Reichman, M. E., Ruhl, J., & Cronin, K. A.
(2010). Improved estimates of cancer-specific survival rates from population-
based data. J Natl Cancer Inst, 102(20), 1584-1598.
Hsieh, L. L., Wang, P. F., Chen, I. H., Liao, C. T., Wang, H. M., Chen, M. C., Chang, J.
T., & Cheng, A. J. (2001). Characteristics of mutations in the p53 gene in oral
squamous cell carcinoma associated with betel quid chewing and cigarette
smoking in Taiwanese. Carcinogenesis, 22(9), 1497-1503.
Huang, X., Godfrey, T. E., Gooding, W. E., McCarty, K. S., Jr., & Gollin, S. M. (2006).
Comprehensive genome and transcriptome analysis of the 11q13 amplicon in
human oral cancer and synteny to the 7F5 amplicon in murine oral carcinoma.
Genes Chromosomes Cancer, 45(11), 1058-1069.
Hunter, T., & Pines, J. (1991). Cyclins and cancer. Cell, 66(6), 1071-1074.
Hunter, T., & Pines, J. (1994). Cyclins and cancer. II: Cyclin D and CDK inhibitors
come of age. Cell, 79(4), 573-582.
IARC. (2004a). Betel-quid and areca-nut chewing and some areca-nut derived
nitrosamines. IARC Monogr Eval Carcinog Risks Hum, 85, 1-334.
IARC. (2004b). Tobacco smoke and involuntary smoking. IARC Monogr Eval
Carcinog Risks Hum, 83, 1-1438.
IARC. (2007). Smokeless tobacco and some tobacco-specific N-nitrosamines. IARC
Monogr Eval Carcinog Risks Hum, 89, 1-592.
IARC. (2010). Alcohol consumption and ethyl carbamate. IARC Monogr Eval Carcinog
Risks Hum, 96, 3-1383.
ICGC. (2013). Mutational landscape of gingivo-buccal oral squamous cell carcinoma
reveals new recurrently-mutated genes and molecular subgroups. Nat Commun,
4, 2873.
Igney, F. H., & Krammer, P. H. (2002). Death and anti-death: tumour resistance to
apoptosis. Nat Rev Cancer, 2(4), 277-288.
Inazawa, J., Inoue, J., & Imoto, I. (2004). Comparative genomic hybridization (CGH)-
arrays pave the way for identification of novel cancer-related genes. Cancer Sci,
95(7), 559-563.
International Human Genome Sequencing, C. (2004). Finishing the euchromatic
sequence of the human genome. Nature, 431(7011), 931-945.
Ishitoya, J., Toriyama, M., Oguchi, N., Kitamura, K., Ohshima, M., Asano, K., &
Yamamoto, T. (1989). Gene amplification and overexpression of EGF receptor
in squamous cell carcinomas of the head and neck. Br J Cancer, 59(4), 559-562.

183
Ivanov, S. V., Kuzmin, I., Wei, M. H., Pack, S., Geil, L., Johnson, B. E., Stanbridge, E.
J., & Lerman, M. I. (1998). Down-regulation of transmembrane carbonic
anhydrases in renal cell carcinoma cell lines by wild-type von Hippel-Lindau
transgenes. Proc Natl Acad Sci U S A, 95(21), 12596-12601.
Iyer, V. R., Eisen, M. B., Ross, D. T., Schuler, G., Moore, T., Lee, J. C., Trent, J. M.,
Staudt, L. M., Hudson, J., Jr., Boguski, M. S., Lashkari, D., Shalon, D., Botstein,
D., & Brown, P. O. (1999). The transcriptional program in the response of
human fibroblasts to serum. Science, 283(5398), 83-87.
Jeon, Y. J., Yoo, H. M., & Chung, C. H. (2010). ISG15 and immune diseases. Biochim
Biophys Acta, 1802(5), 485-496.
Jiang, L., Zeng, X., Yang, H., Wang, Z., Shen, J., Bai, J., Zhang, Y., Gao, F., Zhou, M.,
& Chen, Q. (2008). Oral cancer overexpressed 1 (ORAOV1): a regulator for the
cell growth and tumor angiogenesis in oral squamous cell carcinoma. Int J
Cancer, 123(8), 1779-1786.
Johansson, N., Airola, K., Grenman, R., Kariniemi, A. L., Saarialho-Kere, U., &
Kahari, V. M. (1997). Expression of collagenase-3 (matrix metalloproteinase-
13) in squamous cell carcinomas of the head and neck. Am J Pathol, 151(2),
499-508.
Johnson, N. W. (1991). Orofacial neoplasms: global epidemiology, risk factors and
recommendations for research. Int Dent J, 41(6), 365-375.
Johnson , N. W. (2003). Global epidemiology. In J. N. W. Shah J. P., Batsakis J. G
(Ed.), Oral cancer (pp. 3-4). New York: Martin Dunitz.
Jones, R. G., & Thompson, C. B. (2009). Tumor suppressors and cell metabolism: a
recipe for cancer growth. Genes Dev, 23(5), 537-548.
Jourenkova-Mironova, N., Voho, A., Bouchardy, C., Wikman, H., Dayer, P.,
Benhamou, S., & Hirvonen, A. (1999). Glutathione S-transferase GSTM1,
GSTM3, GSTP1 and GSTT1 genotypes and the risk of smoking-related oral and
pharyngeal cancers. Int J Cancer, 81(1), 44-48.
Kallioniemi, A. (2008). CGH microarrays and cancer. Curr Opin Biotechnol, 19(1), 36-
40.
Kalyankrishna, S., & Grandis, J. R. (2006). Epidermal growth factor receptor biology in
head and neck cancer. J Clin Oncol, 24(17), 2666-2672.
Kannan, S., Tahara, H., Yokozaki, H., Mathew, B., Nalinakumari, K. R., Nair, M. K., &
Tahara, E. (1997). Telomerase activity in premalignant and malignant lesions of
human oral mucosa. Cancer Epidemiol Biomarkers Prev, 6(6), 413-420.
Katayama, H., Brinkley, W. R., & Sen, S. (2003). The Aurora kinases: role in cell
transformation and tumorigenesis. Cancer Metastasis Rev, 22(4), 451-464.

184
Katoh, T., Kaneko, S., Kohshi, K., Munaka, M., Kitagawa, K., Kunugita, N., Ikemura,
K., & Kawamoto, T. (1999). Genetic polymorphisms of tobacco- and alcohol-
related metabolizing enzymes and oral cavity cancer. Int J Cancer, 83(5), 606-
609.
Kiessling, A., Hogrefe, C., Erb, S., Bobach, C., Fuessel, S., Wessjohann, L., & Seliger,
B. (2009). Expression, regulation and function of the ISGylation system in
prostate cancer. Oncogene, 28(28), 2606-2620.
Kietthubthew, S., Sriplung, H., & Au, W. W. (2001). Genetic and environmental
interactions on oral cancer in Southern Thailand. Environ Mol Mutagen, 37(2),
111-116.
Kinzler, K. W., & Vogelstein, B. (1997). Cancer-susceptibility genes. Gatekeepers and
caretakers. Nature, 386(6627), 761, 763.
Kinzler, K. W., & Vogelstein, B. (1998). Landscaping the cancer terrain. Science,
280(5366), 1036-1037.
Kirkitadze, M. D., & Barlow, P. N. (2001). Structure and flexibility of the multiple
domain proteins that regulate complement activation. Immunol Rev, 180, 146-
161.
Kleihues, P., & Stewart, B. W. (2003). World cancer report.
Knudson, A. G. (2001). Two genetic hits (more or less) to cancer. Nat Rev Cancer, 1(2),
157-162.
Knudson, A. G., Jr. (1971). Mutation and cancer: statistical study of retinoblastoma.
Proc Natl Acad Sci U S A, 68(4), 820-823.
Kononen, J., Bubendorf, L., Kallioniemi, A., Barlund, M., Schraml, P., Leighton, S.,
Torhorst, J., Mihatsch, M. J., Sauter, G., & Kallioniemi, O. P. (1998). Tissue
microarrays for high-throughput molecular profiling of tumor specimens. Nat
Med, 4(7), 844-847.
Koontongkaew, S., Chareonkitkajorn, L., Chanvitan, A., Leelakriangsak, M., &
Amornphimoltham, P. (2000). Alterations of p53, pRb, cyclin D(1) and cdk4 in
human oral and pharyngeal squamous cell carcinomas. Oral Oncol, 36(4), 334-
339.
Kowalski, L. P., Bagietto, R., Lara, J. R., Santos, R. L., Tagawa, E. K., & Santos, I. R.
(1999). Factors influencing contralateral lymph node metastasis from oral
carcinoma. Head Neck, 21(2), 104-110.
Kowalski, L. P., Hashimoto, I., & Magrin, J. (1993). End results of 114 extended
"commando" operations for retromolar trigone carcinoma. Am J Surg, 166(4),
374-379.

185
Kozomara, R., Jovic, N., Magic, Z., Brankovic-Magic, M., & Minic, V. (2005). p53
mutations and human papillomavirus infection in oral squamous cell
carcinomas: correlation with overall survival. J Craniomaxillofac Surg, 33(5),
342-348.
Kujan, O., Khattab, A., Oliver, R. J., Roberts, S. A., Thakker, N., & Sloan, P. (2007).
Why oral histopathology suffers inter-observer variability on grading oral
epithelial dysplasia: an attempt to understand the sources of variation. Oral
Oncol, 43(3), 224-231.
La Vecchia, C. (2009). Mouthwash and oral cancer risk: an update. Oral Oncol, 45(3),
198-200.
La Vecchia, C., Tavani, A., Franceschi, S., Levi, F., Corrao, G., & Negri, E. (1997).
Epidemiology and prevention of oral cancer. Oral Oncol, 33(5), 302-312.
Lam, K. Y., Ng, I. O., Yuen, A. P., Kwong, D. L., & Wei, W. (2000). Cyclin D1
expression in oral squamous cell carcinomas: clinicopathological relevance and
correlation with p53 expression. J Oral Pathol Med, 29(4), 167-172.
Langdon, J. D., Harvey, P. W., Rapidis, A. D., Patel, M. F., Johnson, N. W., & Hopps,
R. (1977). Oral cancer: the behaviour and response to treatment of 194 cases. J
Maxillofac Surg, 5(4), 221-237.
Legate, K. R., Montanez, E., Kudlacek, O., & Fassler, R. (2006). ILK, PINCH and
parvin: the tIPP of integrin signalling. Nat Rev Mol Cell Biol, 7(1), 20-31.
Lengauer, C., Kinzler, K. W., & Vogelstein, B. (1998). Genetic instabilities in human
cancers. Nature, 396(6712), 643-649.
Li, C., Wang, J., Zhang, H., Zhu, M., Chen, F., Hu, Y., Liu, H., & Zhu, H. (2014a).
Interferon-stimulated gene 15 (ISG15) is a trigger for tumorigenesis and
metastasis of hepatocellular carcinoma. Oncotarget, 5(18), 8429-8441.
Li, Y., Rouhi, O., Chen, H., Ramirez, R., Borgia, J. A., & Deng, Y. (2014b). RNA-Seq
and Network Analysis Revealed Interacting Pathways in TGF-beta-Treated
Lung Cancer Cell Lines. Cancer Inform, 13(Suppl 5), 129-140.
Liao, C. L., Lee, M. Y., Tyan, Y. S., Kok, L. F., Wu, T. S., Koo, C. L., Wang, P. H.,
Chao, K. C., & Han, C. P. (2009). Progesterone receptor does not improve the
performance and test effectiveness of the conventional 3-marker panel,
consisting of estrogen receptor, vimentin and carcinoembryonic antigen in
distinguishing between primary endocervical and endometrial adenocarcinomas
in a tissue microarray extension study. J Transl Med, 7, 37.
Licitra, L., Grandi, C., Guzzo, M., Mariani, L., Lo Vullo, S., Valvo, F., Quattrone, P.,
Valagussa, P., Bonadonna, G., Molinari, R., & Cantu, G. (2003). Primary
chemotherapy in resectable oral cavity squamous cell cancer: a randomized
controlled trial. J Clin Oncol, 21(2), 327-333.

186
Lindenblatt Rde, C., Martinez, G. L., Silva, L. E., Faria, P. S., Camisasca, D. R., &
Lourenco Sde, Q. (2012). Oral squamous cell carcinoma grading systems--
analysis of the best survival predictor. J Oral Pathol Med, 41(1), 34-39.
Lingen, M. W., Xiao, W., Schmitt, A., Jiang, B., Pickard, R., Kreinbrink, P., Perez-
Ordonez, B., Jordan, R. C., & Gillison, M. L. (2013). Low etiologic fraction for
high-risk human papillomavirus in oral cavity squamous cell carcinomas. Oral
Oncol, 49(1), 1-8.
Liotta, L. A. (1986). Tumor invasion and metastases--role of the extracellular matrix:
Rhoads Memorial Award lecture. Cancer Res, 46(1), 1-7.
Liu, C. J., Lin, S. C., Chen, Y. J., Chang, K. M., & Chang, K. W. (2006). Array-
comparative genomic hybridization to detect genomewide changes in
microdissected primary and metastatic oral squamous cell carcinomas. Mol
Carcinog, 45(10), 721-731.
Liu, G., Sengupta, P. K., Jamal, B., Yang, H. Y., Bouchie, M. P., Lindner, V., Varelas,
X., & Kukuruzinska, M. A. (2013). N-glycosylation induces the CTHRC1
protein and drives oral cancer cell migration. J Biol Chem, 288(28), 20217-
20227.
Livak, K. J., & Schmittgen, T. D. (2001). Analysis of relative gene expression data
using real-time quantitative PCR and the 2(-Delta Delta C(T)) Method. Methods,
25(4), 402-408.
Lo Muzio, L., Santarelli, A., Caltabiano, R., Rubini, C., Pieramici, T., Trevisiol, L.,
Carinci, F., Leonardi, R., De Lillo, A., Lanzafame, S., Bufo, P., & Piattelli, A.
(2005). p63 overexpression associates with poor prognosis in head and neck
squamous cell carcinoma. Hum Pathol, 36(2), 187-194.
Lobo, I. (2008). Chromosome abnormalities and cancer cytogenetics. Nature Education,
1(1), 35-43.
Lockwood, W. W., Chari, R., Chi, B., & Lam, W. L. (2006). Recent advances in array
comparative genomic hybridization technologies and their applications in human
genetics. Eur J Hum Genet, 14(2), 139-148.
Loeb, L. A. (2001). A mutator phenotype in cancer. Cancer Res, 61(8), 3230-3239.
Loeb, L. A., Loeb, K. R., & Anderson, J. P. (2003). Multiple mutations and cancer.
Proc Natl Acad Sci U S A, 100(3), 776-781.
Lopez-Nieva, P., Vaquero, C., Fernandez-Navarro, P., Gonzalez-Sanchez, L., Villa-
Morales, M., Santos, J., Esteller, M., & Fernandez-Piqueras, J. (2012). EPHA7,
a new target gene for 6q deletion in T-cell lymphoblastic lymphomas.
Carcinogenesis, 33(2), 452-458.
187
Lucito, R., Healy, J., Alexander, J., Reiner, A., Esposito, D., Chi, M., Rodgers, L.,
Brady, A., Sebat, J., Troge, J., West, J. A., Rostan, S., Nguyen, K. C., Powers,
S., Ye, K. Q., Olshen, A., Venkatraman, E., Norton, L., & Wigler, M. (2003).
Representational oligonucleotide microarray analysis: a high-resolution method
to detect genome copy number variation. Genome Res, 13(10), 2291-2305.
Ludwig, J. A., & Weinstein, J. N. (2005). Biomarkers in cancer staging, prognosis and
treatment selection. Nat Rev Cancer, 5(11), 845-856.
Lundahl, R. E., Foote, R. L., Bonner, J. A., Suman, V. J., Lewis, J. E., Kasperbauer, J.
L., McCaffrey, T. V., & Olsen, K. D. (1998). Combined neck dissection and
postoperative radiation therapy in the management of the high-risk neck: a
matched-pair analysis. Int J Radiat Oncol Biol Phys, 40(3), 529-534.
Luukkaa, M., Vihinen, P., Kronqvist, P., Vahlberg, T., Pyrhonen, S., Kahari, V. M., &
Grenman, R. (2006). Association between high collagenase-3 expression levels
and poor prognosis in patients with head and neck cancer. Head Neck, 28(3),
225-234.
Macfarlane, G. J., Boyle, P., Evstifeeva, T. V., Robertson, C., & Scully, C. (1994).
Rising trends of oral cancer mortality among males worldwide: the return of an
old public health problem. Cancer Causes Control, 5(3), 259-265.
Macluskey, M., & Ogden, G. R. (2000). An overview of the prevention of oral cancer
and diagnostic markers of malignant change: 2. Markers of value in tumour
diagnosis. Dent Update, 27(3), 148-152.
Makinen, L. K., Hayry, V., Atula, T., Haglund, C., Keski-Santti, H., Leivo, I., Makitie,
A., Passador-Santos, F., Bockelman, C., Salo, T., Sorsa, T., & Hagstrom, J.
(2012). Prognostic significance of matrix metalloproteinase-2, -8, -9, and -13 in
oral tongue cancer. J Oral Pathol Med, 41(5), 394-399.
Manning, F. C., & Patierno, S. R. (1996). Apoptosis: inhibitor or instigator of
carcinogenesis? Cancer Invest, 14(5), 455-465.
Marquis-Nicholson, R., Aftimos, S., Hayes, I., George, A., & Love, D. R. (2010). Array
comparative genomic hybridisation: a new tool in the diagnostic genetic
armoury. N Z Med J, 123(1318), 50-61.
Marsiglia, H., Haie-Meder, C., Sasso, G., Mamelle, G., & Gerbaulet, A. (2002).
Brachytherapy for T1-T2 floor-of-the-mouth cancers: the Gustave-Roussy
Institute experience. Int J Radiat Oncol Biol Phys, 52(5), 1257-1263.
Martin, D. B., & Nelson, P. S. (2001). From genomics to proteomics: techniques and
applications in cancer research. Trends Cell Biol, 11(11), S60-65.
Massano, J., Regateiro, F. S., Januario, G., & Ferreira, A. (2006). Oral squamous cell
carcinoma: review of prognostic and predictive factors. Oral Surg Oral Med
Oral Pathol Oral Radiol Endod, 102(1), 67-76.

188
Matsubara, R., Kawano, S., Kiyosue, T., Goto, Y., Hirano, M., Jinno, T., Toyoshima,
T., Kitamura, R., Oobu, K., & Nakamura, S. (2011). Increased DeltaNp63
expression is predictive of malignant transformation in oral epithelial dysplasia
and poor prognosis in oral squamous cell carcinoma. Int J Oncol, 39(6), 1391-
1399.
Matsumura, Y., Yashiro, M., Ohira, M., Tabuchi, H., & Hirakawa, K. (2005). 5-
Fluorouracil up-regulates interferon pathway gene expression in esophageal
cancer cells. Anticancer Res, 25(5), 3271-3278.
McCullough, M. J., & Farah, C. S. (2008). The role of alcohol in oral carcinogenesis
with particular reference to alcohol-containing mouthwashes. Aust Dent J, 53(4),
302-305.
Melino, G. (2011). p63 is a suppressor of tumorigenesis and metastasis interacting with
mutant p53. Cell Death Differ, 18(9), 1487-1499.
Mendelsohn, J., & Baselga, J. (2006). Epidermal growth factor receptor targeting in
cancer. Semin Oncol, 33(4), 369-385.
Mendez, E., Houck, J. R., Doody, D. R., Fan, W., Lohavanichbutr, P., Rue, T. C., Yueh,
B., Futran, N. D., Upton, M. P., Farwell, D. G., Heagerty, P. J., Zhao, L. P.,
Schwartz, S. M., & Chen, C. (2009). A genetic expression profile associated
with oral cancer identifies a group of patients at high risk of poor survival. Clin
Cancer Res, 15(4), 1353-1361.
Merlano, M., Benasso, M., Corvo, R., Rosso, R., Vitale, V., Blengio, F., Numico, G.,
Margarino, G., Bonelli, L., & Santi, L. (1996). Five-year update of a randomized
trial of alternating radiotherapy and chemotherapy compared with radiotherapy
alone in treatment of unresectable squamous cell carcinoma of the head and
neck. J Natl Cancer Inst, 88(9), 583-589.
Mishra, A., & Verma, M. (2010). Cancer biomarkers: are we ready for the prime time?
Cancers (Basel), 2(1), 190-208.
Mitelman, F., Johansson, B., Mandahl, N., & Mertens, F. (1997). Clinical significance
of cytogenetic findings in solid tumors. Cancer Genet Cytogenet, 95(1), 1-8.
Mortazavi, H., Baharvand, M., & Mehdipour, M. (2014). Oral potentially malignant
disorders: an overview of more than 20 entities. J Dent Res Dent Clin Dent
Prospects, 8(1), 6-14.
Mufti, S. I. (1992). Alcohol acts to promote incidence of tumors. Cancer Detect Prev,
16(3), 157-162.
Munger, K. (2002). Disruption of oncogene/tumor suppressor networks during human
carcinogenesis. Cancer Invest, 20(1), 71-81.
Musgrove, E. A., Caldon, C. E., Barraclough, J., Stone, A., & Sutherland, R. L. (2011).
Cyclin D as a therapeutic target in cancer. Nat Rev Cancer, 11(8), 558-572.

189
Mutation Consequences and Pathway Analysis working group of the International
Cancer Genome, C. (2015). Pathway and network analysis of cancer genomes.
Nat Methods, 12(7), 615-621.
Nagaraj, N. S. (2009). Evolving 'omics' technologies for diagnostics of head and neck
cancer. Brief Funct Genomic Proteomic, 8(1), 49-59.
Nagpal, J. K., & Das, B. R. (2003). Oral cancer: reviewing the present understanding of
its molecular mechanism and exploring the future directions for its effective
management. Oral Oncol, 39(3), 213-221.
Nair, J., Ohshima, H., Friesen, M., Croisy, A., Bhide, S. V., & Bartsch, H. (1985).
Tobacco-specific and betel nut-specific N-nitroso compounds: occurrence in
saliva and urine of betel quid chewers and formation in vitro by nitrosation of
betel quid. Carcinogenesis, 6(2), 295-303.
Negrini, S., Gorgoulis, V. G., & Halazonetis, T. D. (2010). Genomic instability--an
evolving hallmark of cancer. Nat Rev Mol Cell Biol, 11(3), 220-228.
Neville, B. W., & Day, T. A. (2002). Oral cancer and precancerous lesions. CA Cancer
J Clin, 52(4), 195-215.
Nieto, M. A. (2002). The snail superfamily of zinc-finger transcription factors. Nat Rev
Mol Cell Biol, 3(3), 155-166.
Noguti, J., De Moura, C. F., De Jesus, G. P., Da Silva, V. H., Hossaka, T. A., Oshima,
C. T., & Ribeiro, D. A. (2012). Metastasis from oral cancer: an overview.
Cancer Genomics Proteomics, 9(5), 329-335.
Noutomi, Y., Oga, A., Uchida, K., Okafuji, M., Ita, M., Kawauchi, S., Furuya, T.,
Ueyama, Y., & Sasaki, K. (2006). Comparative genomic hybridization reveals
genetic progression of oral squamous cell carcinoma from dysplasia via two
different tumourigenic pathways. J Pathol, 210(1), 67-74.
O-Charoenrat, P., Pillai, G., Patel, S., Fisher, C., Archer, D., Eccles, S., & Rhys-Evans,
P. (2003). Tumour thickness predicts cervical nodal metastases and survival in
early oral tongue cancer. Oral Oncol, 39(4), 386-390.
Oga, A., Kong, G., Tae, K., Lee, Y., & Sasaki, K. (2001). Comparative genomic
hybridization analysis reveals 3q gain resulting in genetic alteration in 3q in
advanced oral squamous cell carcinoma. Cancer Genet Cytogenet, 127(1), 24-
29.
Ogden, G. R., & Wight, A. J. (1998). Aetiology of oral cancer: alcohol. Br J Oral
Maxillofac Surg, 36(4), 247-251.
Okey, A. B., Harper, P. A., Grant, D. M., & Hill, R. P. (1998). Chemical and radiation
carcinogenesis. The Basic Science of Oncology (Tannock, I., Hill, R., Bristow, R.
and Harrington, L. eds.) New York, McGraw-Hill Inc, 25-48.
190
Olayioye, M. A., Neve, R. M., Lane, H. A., & Hynes, N. E. (2000). The ErbB signaling
network: receptor heterodimerization in development and cancer. EMBO J,
19(13), 3159-3167.
Oliveira, L. R., Ribeiro-Silva, A., Costa, J. P., Simoes, A. L., Matteo, M. A., &
Zucoloto, S. (2008). Prognostic factors and survival analysis in a sample of oral
squamous cell carcinoma patients. Oral Surg Oral Med Oral Pathol Oral Radiol
Endod, 106(5), 685-695.
Oliver, C. L., Bauer, J. A., Wolter, K. G., Ubell, M. L., Narayan, A., O'Connell, K. M.,
Fisher, S. G., Wang, S., Wu, X., Ji, M., Carey, T. E., & Bradford, C. R. (2004).
In vitro effects of the BH3 mimetic, (-)-gossypol, on head and neck squamous
cell carcinoma cells. Clin Cancer Res, 10(22), 7757-7763.
Omar, E. A. (2013). The Outline of Prognosis and New Advances in Diagnosis of Oral
Squamous Cell Carcinoma (OSCC): Review of the Literature. Journal of Oral
Oncology, 2013, 13.
Omar, Z. A., & Tamin, N. S. I. (2011). National Cancer Registry Report 2007. Malaysia
Cancer Statistics-Data and Figure, Kuala Lumpur: National Cancer Registry,
Ministry of Health Malaysia, 89.
Oren, M. (1992). The involvement of oncogenes and tumor suppressor genes in the
control of apoptosis. Cancer Metastasis Rev, 11(2), 141-148.
P, O. C., Rhys-Evans, P. H., & Eccles, S. A. (2001). Expression of matrix
metalloproteinases and their inhibitors correlates with invasion and metastasis in
squamous cell carcinoma of the head and neck. Arch Otolaryngol Head Neck
Surg, 127(7), 813-820.
Pacifico, A., & Leone, G. (2007). Role of p53 and CDKN2A inactivation in human
squamous cell carcinomas. J Biomed Biotechnol, 2007(3), 43418.
Parisi, E., & Glick, M. (2005). Cervical lymphadenopathy in the dental patient: a review
of clinical approach. Quintessence Int, 36(6), 423-436.
Park, J. Y., Muscat, J. E., Ren, Q., Schantz, S. P., Harwick, R. D., Stern, J. C., Pike, V.,
Richie, J. P., Jr., & Lazarus, P. (1997). CYP1A1 and GSTM1 polymorphisms
and oral cancer risk. Cancer Epidemiol Biomarkers Prev, 6(10), 791-797.
Patel, A. S., Schechter, G. L., Wasilenko, W. J., & Somers, K. D. (1998).
Overexpression of EMS1/cortactin in NIH3T3 fibroblasts causes increased cell
motility and invasion in vitro. Oncogene, 16(25), 3227-3232.
Patel, S. G., & Shah, J. P. (2005). TNM staging of cancers of the head and neck:
striving for uniformity among diversity. CA Cancer J Clin, 55(4), 242-258; quiz
261-242, 264.
Peng, C. H., Liao, C. T., Peng, S. C., Chen, Y. J., Cheng, A. J., Juang, J. L., Tsai, C. Y.,
Chen, T. C., Chuang, Y. J., Tang, C. Y., Hsieh, W. P., & Yen, T. C. (2011). A
novel molecular signature identified by systems genetics approach predicts
prognosis in oral squamous cell carcinoma. PLoS One, 6(8), e23452.
191
Petridou, E., Zavras, A. I., Lefatzis, D., Dessypris, N., Laskaris, G., Dokianakis, G.,
Segas, J., Douglas, C. W., Diehl, S. R., & Trichopoulos, D. (2002). The role of
diet and specific micronutrients in the etiology of oral carcinoma. Cancer,
94(11), 2981-2988.
Petti, S. (2003). Pooled estimate of world leukoplakia prevalence: a systematic review.
Oral Oncol, 39(8), 770-780.
Petti, S. (2009). Lifestyle risk factors for oral cancer. Oral Oncol, 45(4-5), 340-350.
Pezzella, F., Turley, H., Kuzu, I., Tungekar, M. F., Dunnill, M. S., Pierce, C. B., Harris,
A., Gatter, K. C., & Mason, D. Y. (1993). bcl-2 protein in non-small-cell lung
carcinoma. N Engl J Med, 329(10), 690-694.
Pickart, C. M. (2001). Mechanisms underlying ubiquitination. Annu Rev Biochem, 70,
503-533.
Pickering, C. R., Zhang, J., Yoo, S. Y., Bengtsson, L., Moorthy, S., Neskey, D. M.,
Zhao, M., Ortega Alves, M. V., Chang, K., Drummond, J., Cortez, E., Xie, T.
X., Zhang, D., Chung, W., Issa, J. P., Zweidler-McKay, P. A., Wu, X., El-
Naggar, A. K., Weinstein, J. N., Wang, J., Muzny, D. M., Gibbs, R. A.,
Wheeler, D. A., Myers, J. N., & Frederick, M. J. (2013). Integrative genomic
characterization of oral squamous cell carcinoma identifies frequent somatic
drivers. Cancer Discov, 3(7), 770-781.
Pindborg, J. J., Reichart, P.A., Smith, C.J., van der Waal, I. (1997). Histological Typing
of Cancer and Precancer of the Oral Mucosa. New York: Springer-Verlag Berlin
Heidelberg.
Pinkel, D., & Albertson, D. G. (2005). Array comparative genomic hybridization and its
applications in cancer. Nat Genet, 37 Suppl, S11-17.
Pon, J. R., & Marra, M. A. (2015). Driver and passenger mutations in cancer. Annu Rev
Pathol, 10, 25-50.
Przybytkowski, E., Ferrario, C., & Basik, M. (2011). The use of ultra-dense array CGH
analysis for the discovery of micro-copy number alterations and gene fusions in
the cancer genome. BMC Med Genomics, 4, 16.
Que, L., Zhao, D., Tang, X. F., Liu, J. Y., Zhang, X. Y., Zhan, Y. H., & Zhang, L.
(2016). Effects of lentivirus-mediated shRNA targeting integrin-linked kinase
on oral squamous cell carcinoma in vitro and in vivo. Oncol Rep, 35(1), 89-98.
Redon, R., Hussenet, T., Bour, G., Caulee, K., Jost, B., Muller, D., Abecassis, J., & du
Manoir, S. (2002). Amplicon mapping and transcriptional analysis pinpoint
cyclin L as a candidate oncogene in head and neck cancer. Cancer Res, 62(21),
6211-6217.
Reed, J. A., Lin, Q., Chen, D., Mian, I. S., & Medrano, E. E. (2005). SKI pathways
inducing progression of human melanoma. Cancer Metastasis Rev, 24(2), 265-
272.

192
Reshmi, S. C., & Gollin, S. M. (2005). Chromosomal instability in oral cancer cells. J
Dent Res, 84(2), 107-117.
Resnier, P., Montier, T., Mathieu, V., Benoit, J. P., & Passirani, C. (2013). A review of
the current status of siRNA nanomedicines in the treatment of cancer.
Biomaterials, 34(27), 6429-6443.
Reuschenbach, M., Kansy, K., Garbe, K., Vinokurova, S., Flechtenmacher, C., Toth, C.,
Prigge, E. S., Thiele, O. C., Reinert, S., Hoffmann, J., von Knebel Doeberitz,
M., & Freier, K. (2013). Lack of evidence of human papillomavirus-induced
squamous cell carcinomas of the oral cavity in southern Germany. Oral Oncol,
49(9), 937-942.
Reuter, C. W., Morgan, M. A., & Eckardt, A. (2007). Targeting EGF-receptor-
signalling in squamous cell carcinomas of the head and neck. Br J Cancer,
96(3), 408-416.
Ribeiro, D. C., Gleber-Netto, F. O., Sousa, S. F., Bernardes, V. D., Guimaraes-Abreu,
M. H., & Aguiar, M. C. (2012). Immunohistochemical expression of EGFR in
oral leukoplakia: association with clinicopathological features and cellular
proliferation. Med Oral Patol Oral Cir Bucal, 17(5), e739-744.
Rodrigo, J. P., Garcia, L. A., Ramos, S., Lazo, P. S., & Suarez, C. (2000). EMS1 gene
amplification correlates with poor prognosis in squamous cell carcinomas of the
head and neck. Clin Cancer Res, 6(8), 3177-3182.
Rodriguez, T., Altieri, A., Chatenoud, L., Gallus, S., Bosetti, C., Negri, E., Franceschi,
S., Levi, F., Talamini, R., & La Vecchia, C. (2004). Risk factors for oral and
pharyngeal cancer in young adults. Oral Oncol, 40(2), 207-213.
Rodu, B., & Jansson, C. (2004). Smokeless tobacco and oral cancer: a review of the
risks and determinants. Crit Rev Oral Biol Med, 15(5), 252-263.
Rogers, S. J., Harrington, K. J., Rhys-Evans, P., P, O. C., & Eccles, S. A. (2005).
Biological significance of c-erbB family oncogenes in head and neck cancer.
Cancer Metastasis Rev, 24(1), 47-69.
Roh, H. J., Shin, D. M., Lee, J. S., Ro, J. Y., Tainsky, M. A., Hong, W. K., &
Hittelman, W. N. (2000). Visualization of the timing of gene amplification
during multistep head and neck tumorigenesis. Cancer Res, 60(22), 6496-6502.
Rowland, I. R. (1991). Nutrition, toxicity, and cancer. Boca Raton, Florida: CRC Press.
Rowley, H., Jones, A., Spandidos, D., & Field, J. (1996). Definition of a tumor
suppressor gene locus on the short arm of chromosome 3 in squamous cell
carcinoma of the head and neck by means of microsatellite markers. Arch
Otolaryngol Head Neck Surg, 122(5), 497-501.
Roz, L., Wu, C. L., Porter, S., Scully, C., Speight, P., Read, A., Sloan, P., & Thakker,
N. (1996). Allelic imbalance on chromosome 3p in oral dysplastic lesions: an
early event in oral carcinogenesis. Cancer Res, 56(6), 1228-1231.

193
Ruiz, C., Martins, J. R., Rudin, F., Schneider, S., Dietsche, T., Fischer, C. A., Tornillo,
L., Terracciano, L. M., Schreiber, R., Bubendorf, L., & Kunzelmann, K. (2012).
Enhanced expression of ANO1 in head and neck squamous cell carcinoma
causes cell migration and correlates with poor prognosis. PLoS One, 7(8),
e43265.
Russo, A., Migliavacca, M., Zanna, I., Macaluso, M., Gebbia, N., & Bazan, V. (2006).
Caretakers and Gatekeepers. In: Encyclopedia of Life Sciences, John Wiley &
Sons.
Sager, R. (1989). Tumor suppressor genes: the puzzle and the promise. Science,
246(4936), 1406-1412.
Salahshourifar, I., Vincent-Chong, V. K., Kallarakkal, T. G., & Zain, R. B. (2014).
Genomic DNA copy number alterations from precursor oral lesions to oral
squamous cell carcinoma. Oral Oncol, 50(5), 404-412.
Sankaranarayanan, R., Ramadas, K., Amarasinghe, H., Subramanian, S., & Johnson, N.
(2015). Cancer: Disease Control Priorities. In H. Gelband, Jha, P.,
Sankaranarayanan (Ed.), Oral Cancer: Prevention, Early Detection, and
Treatment (Vol. 3). Washington (DC): The International Bank for
Reconstruction and Development / The World Bank; .
Sankaranarayanan, R., Swaminathan, R., Jayant, K., & Brenner, H. (2011). An
overview of cancer survival in Africa, Asia, the Caribbean and Central America:
the case for investment in cancer health services. IARC Sci Publ(162), 257-291.
Sant, M., Allemani, C., Santaquilani, M., Knijn, A., Marchesi, F., Capocaccia, R., &
Group, E. W. (2009). EUROCARE-4. Survival of cancer patients diagnosed in
1995-1999. Results and commentary. Eur J Cancer, 45(6), 931-991.
Sato, M., Sato, T., Izumo, T., & Amagasa, T. (1999). Genetic polymorphism of drug-
metabolizing enzymes and susceptibility to oral cancer. Carcinogenesis, 20(10),
1927-1931.
Saunders, W. S., Shuster, M., Huang, X., Gharaibeh, B., Enyenihi, A. H., Petersen, I., &
Gollin, S. M. (2000). Chromosomal instability and cytoskeletal defects in oral
cancer cells. Proc Natl Acad Sci U S A, 97(1), 303-308.
Sawair, F. A., Irwin, C. R., Gordon, D. J., Leonard, A. G., Stephenson, M., & Napier, S.
S. (2003). Invasive front grading: reliability and usefulness in the management
of oral squamous cell carcinoma. J Oral Pathol Med, 32(1), 1-9.
Sawazaki-Calone, I., Rangel, A., Bueno, A. G., Morais, C. F., Nagai, H. M., Kunz, R.
P., Souza, R. L., Rutkauskis, L., Salo, T., Almangush, A., & Coletta, R. D.
(2015). The prognostic value of histopathological grading systems in oral
squamous cell carcinomas. Oral Dis, 21(6), 755-761.
Schvartzman, J. M., Sotillo, R., & Benezra, R. (2010). Mitotic chromosomal instability
and cancer: mouse modelling of the human disease. Nat Rev Cancer, 10(2), 102-
115.

194
Scully, C., & Bagan, J. (2009). Oral squamous cell carcinoma: overview of current
understanding of aetiopathogenesis and clinical implications. Oral Dis, 15(6),
388-399.
Scully, C., Field, J. K., & Tanzawa, H. (2000). Genetic aberrations in oral or head and
neck squamous cell carcinoma 2: chromosomal aberrations. Oral Oncol, 36(4),
311-327.
Senchenko, V. N., Krasnov, G. S., Dmitriev, A. A., Kudryavtseva, A. V., Anedchenko,
E. A., Braga, E. A., Pronina, I. V., Kondratieva, T. T., Ivanov, S. V.,
Zabarovsky, E. R., & Lerman, M. I. (2011). Differential expression of CHL1
gene during development of major human cancers. PLoS One, 6(3), e15612.
Serrano, M., Hannon, G. J., & Beach, D. (1993). A new regulatory motif in cell-cycle
control causing specific inhibition of cyclin D/CDK4. Nature, 366(6456), 704-
707.
Shah, J. P. (1990). Cervical lymph node metastases--diagnostic, therapeutic, and
prognostic implications. Oncology (Williston Park), 4(10), 61-69; discussion 72,
76.
Shahnavaz, S. A., Regezi, J. A., Bradley, G., Dube, I. D., & Jordan, R. C. (2000). p53
gene mutations in sequential oral epithelial dysplasias and squamous cell
carcinomas. J Pathol, 190(4), 417-422.
Shay, J. W., & Wright, W. E. (2006). Telomerase therapeutics for cancer: challenges
and new directions. Nat Rev Drug Discov, 5(7), 577-584.
Sheu, J. J., Hua, C. H., Wan, L., Lin, Y. J., Lai, M. T., Tseng, H. C., Jinawath, N., Tsai,
M. H., Chang, N. W., Lin, C. F., Lin, C. C., Hsieh, L. J., Wang, T. L., Shih Ie,
M., & Tsai, F. J. (2009). Functional genomic analysis identified epidermal
growth factor receptor activation as the most common genetic event in oral
squamous cell carcinoma. Cancer Res, 69(6), 2568-2576.
Shiboski, C. H., Schmidt, B. L., & Jordan, R. C. (2005). Tongue and tonsil carcinoma:
increasing trends in the U.S. population ages 20-44 years. Cancer, 103(9), 1843-
1849.
Shinawi, M., & Cheung, S. W. (2008). The array CGH and its clinical applications.
Drug Discov Today, 13(17-18), 760-770.
Siebers, T. J., Merkx, M. A., Slootweg, P. J., Melchers, W. J., van Cleef, P., & de
Wilde, P. C. (2008). No high-risk HPV detected in SCC of the oral tongue in the
absolute absence of tobacco and alcohol--a case study of seven patients. Oral
Maxillofac Surg, 12(4), 185-188.
Silverman, S., Jr. (2001). Demographics and occurrence of oral and pharyngeal cancers.
The outcomes, the trends, the challenge. J Am Dent Assoc, 132 Suppl, 7S-11S.

195
Sjoblom, T., Jones, S., Wood, L. D., Parsons, D. W., Lin, J., Barber, T. D., Mandelker,
D., Leary, R. J., Ptak, J., Silliman, N., Szabo, S., Buckhaults, P., Farrell, C.,
Meeh, P., Markowitz, S. D., Willis, J., Dawson, D., Willson, J. K., Gazdar, A.
F., Hartigan, J., Wu, L., Liu, C., Parmigiani, G., Park, B. H., Bachman, K. E.,
Papadopoulos, N., Vogelstein, B., Kinzler, K. W., & Velculescu, V. E. (2006).
The consensus coding sequences of human breast and colorectal cancers.
Science, 314(5797), 268-274.
Snijders, A. M., Schmidt, B. L., Fridlyand, J., Dekker, N., Pinkel, D., Jordan, R. C., &
Albertson, D. G. (2005). Rare amplicons implicate frequent deregulation of cell
fate specification pathways in oral squamous cell carcinoma. Oncogene, 24(26),
4232-4242.
Sobin, L. H., Gospodarowicz, M. K., & Wittekind, C. (2011). TNM classification of
malignant tumours (7th ed.). Hoboken, New Jersey: John Wiley & Sons.
Song, G., Ouyang, G., & Bao, S. (2005). The activation of Akt/PKB signaling pathway
and cell survival. J Cell Mol Med, 9(1), 59-71.
Song, L., Liu, L., Wu, Z., Lin, C., Dai, T., Yu, C., Wang, X., Wu, J., Li, M., & Li, J.
(2012). Knockdown of stomatin-like protein 2 (STOML2) reduces the invasive
ability of glioma cells through inhibition of the NF-kappaB/MMP-9 pathway. J
Pathol, 226(3), 534-543.
Speight, P. M. (2007). Update on oral epithelial dysplasia and progression to cancer.
Head Neck Pathol, 1(1), 61-66.
Sporn, M. B. (1996). The war on cancer. Lancet, 347(9012), 1377-1381.
Sreelekha, T. T., Ramadas, K., Pandey, M., Thomas, G., Nalinakumari, K. R., & Pillai,
M. R. (2001). Genetic polymorphism of CYP1A1, GSTM1 and GSTT1 genes in
Indian oral cancer. Oral Oncol, 37(7), 593-598.
Sticht, C., Hofele, C., Flechtenmacher, C., Bosch, F. X., Freier, K., Lichter, P., & Joos,
S. (2005). Amplification of Cyclin L1 is associated with lymph node metastases
in head and neck squamous cell carcinoma (HNSCC). Br J Cancer, 92(4), 770-
774.
Stransky, N., Egloff, A. M., Tward, A. D., Kostic, A. D., Cibulskis, K., Sivachenko, A.,
Kryukov, G. V., Lawrence, M. S., Sougnez, C., McKenna, A., Shefler, E.,
Ramos, A. H., Stojanov, P., Carter, S. L., Voet, D., Cortes, M. L., Auclair, D.,
Berger, M. F., Saksena, G., Guiducci, C., Onofrio, R. C., Parkin, M., Romkes,
M., Weissfeld, J. L., Seethala, R. R., Wang, L., Rangel-Escareno, C., Fernandez-
Lopez, J. C., Hidalgo-Miranda, A., Melendez-Zajgla, J., Winckler, W., Ardlie,
K., Gabriel, S. B., Meyerson, M., Lander, E. S., Getz, G., Golub, T. R.,
Garraway, L. A., & Grandis, J. R. (2011). The mutational landscape of head and
neck squamous cell carcinoma. Science, 333(6046), 1157-1160.
Stratton, M. R., Campbell, P. J., & Futreal, P. A. (2009). The cancer genome. Nature,
458(7239), 719-724.

196
Su, X., Chakravarti, D., & Flores, E. R. (2013). p63 steps into the limelight: crucial
roles in the suppression of tumorigenesis and metastasis. Nat Rev Cancer, 13(2),
136-143.
Sudbo, J., Bankfalvi, A., Bryne, M., Marcelpoil, R., Boysen, M., Piffko, J., Hemmer, J.,
Kraft, K., & Reith, A. (2000). Prognostic value of graph theory-based tissue
architecture analysis in carcinomas of the tongue. Lab Invest, 80(12), 1881-
1889.
Sumino, J., Uzawa, N., Okada, N., Miyaguchi, K., Mogushi, K., Takahashi, K., Sato,
H., Michikawa, C., Nakata, Y., Tanaka, H., & Amagasa, T. (2013). Gene
expression changes in initiation and progression of oral squamous cell
carcinomas revealed by laser microdissection and oligonucleotide microarray
analysis. Int J Cancer, 132(3), 540-548.
Swaminathan, R., Lucas, E., & Sankaranarayanan, R. (2011). Cancer survival in Africa,
Asia, the Caribbean and Central America: database and attributes. IARC Sci
Publ(162), 23-31.
Tameda, M., Sugimoto, K., Shiraki, K., Yamamoto, N., Okamoto, R., Usui, M., Ito, M.,
Takei, Y., Nobori, T., Kojima, T., Suzuki, H., Uchida, M., & Uchida, K. (2014).
Collagen triple helix repeat containing 1 is overexpressed in hepatocellular
carcinoma and promotes cell proliferation and motility. Int J Oncol, 45(2), 541-
548.
Tang, L., Dai, D. L., Su, M., Martinka, M., Li, G., & Zhou, Y. (2006). Aberrant
expression of collagen triple helix repeat containing 1 in human solid cancers.
Clin Cancer Res, 12(12), 3716-3722.
Tang, M. R., Wang, Y. X., Guo, S., Han, S. Y., & Wang, D. (2012). CSMD1 exhibits
antitumor activity in A375 melanoma cells through activation of the Smad
pathway. Apoptosis, 17(9), 927-937.
Tankere, F., Camproux, A., Barry, B., Guedon, C., Depondt, J., & Gehanno, P. (2000).
Prognostic value of lymph node involvement in oral cancers: a study of 137
cases. Laryngoscope, 110(12), 2061-2065.
Taoudi Benchekroun, M., Saintigny, P., Thomas, S. M., El-Naggar, A. K.,
Papadimitrakopoulou, V., Ren, H., Lang, W., Fan, Y. H., Huang, J., Feng, L.,
Lee, J. J., Kim, E. S., Hong, W. K., Johnson, F. M., Grandis, J. R., & Mao, L.
(2010). Epidermal growth factor receptor expression and gene copy number in
the risk of oral cancer. Cancer Prev Res (Phila), 3(7), 800-809.
TCGA. (2015). Comprehensive genomic characterization of head and neck squamous
cell carcinomas. Nature, 517(7536), 576-582.
Thangaraj, S. V., Shyamsundar, V., Krishnamurthy, A., Ramani, P., Ganesan, K.,
Muthuswami, M., & Ramshankar, V. (2016). Molecular Portrait of Oral Tongue
Squamous Cell Carcinoma Shown by Integrative Meta-Analysis of Expression
Profiles with Validations. PLoS One, 11(6), e0156582.

197
Thiery, J. P. (2002). Epithelial-mesenchymal transitions in tumour progression. Nat Rev
Cancer, 2(6), 442-454.
Todd, R., Chou, M. Y., Matossian, K., Gallagher, G. T., Donoff, R. B., & Wong, D. T.
(1991). Cellular sources of transforming growth factor-alpha in human oral
cancer. J Dent Res, 70(5), 917-923.
Todd, R., Donoff, R. B., & Wong, D. T. (1997). The molecular biology of oral
carcinogenesis: toward a tumor progression model. J Oral Maxillofac Surg,
55(6), 613-623; discussion 623-615.
Towle, R., Tsui, I. F., Zhu, Y., MacLellan, S., Poh, C. F., & Garnis, C. (2014).
Recurring DNA copy number gain at chromosome 9p13 plays a role in the
activation of multiple candidate oncogenes in progressing oral premalignant
lesions. Cancer Med, 3(5), 1170-1184.
Tsui, I. F., Poh, C. F., Garnis, C., Rosin, M. P., Zhang, L., & Lam, W. L. (2009).
Multiple pathways in the FGF signaling network are frequently deregulated by
gene amplification in oral dysplasias. Int J Cancer, 125(9), 2219-2228.
Uchida, K., Oga, A., Nakao, M., Mano, T., Mihara, M., Kawauchi, S., Furuya, T.,
Ueyama, Y., & Sasaki, K. (2011). Loss of 3p26.3 is an independent prognostic
factor in patients with oral squamous cell carcinoma. Oncol Rep, 26(2), 463-
469.
Udagawa, T., Fernandez, A., Achilles, E. G., Folkman, J., & D'Amato, R. J. (2002).
Persistence of microscopic human cancers in mice: alterations in the angiogenic
balance accompanies loss of tumor dormancy. FASEB J, 16(11), 1361-1370.
van der Waal, I. (2009). Potentially malignant disorders of the oral and oropharyngeal
mucosa; terminology, classification and present concepts of management. Oral
Oncol, 45(4-5), 317-323.
van Hooff, S. R., Leusink, F. K., Roepman, P., Baatenburg de Jong, R. J., Speel, E. J.,
van den Brekel, M. W., van Velthuysen, M. L., van Diest, P. J., van Es, R. J.,
Merkx, M. A., Kummer, J. A., Leemans, C. R., Schuuring, E., Langendijk, J. A.,
Lacko, M., De Herdt, M. J., Jansen, J. C., Brakenhoff, R. H., Slootweg, P. J.,
Takes, R. P., & Holstege, F. C. (2012). Validation of a gene expression
signature for assessment of lymph node metastasis in oral squamous cell
carcinoma. J Clin Oncol, 30(33), 4104-4110.
Venkatraman, E. S., & Olshen, A. B. (2007). A faster circular binary segmentation
algorithm for the analysis of array CGH data. Bioinformatics, 23(6), 657-663.
Viet, C. T., & Schmidt, B. L. (2010). Understanding oral cancer in the genome era.
Head Neck, 32(9), 1246-1268.
Vijayakumar, M., Burrah, R., Sabitha, K. S., Nadimul, H., & Rajani, B. C. (2011). To
operate or not to operate n0 neck in early cancer of the tongue? A prospective
study. Indian J Surg Oncol, 2(3), 172-175.

198
Vincent-Chong, V. K., Anwar, A., Karen-Ng, L. P., Cheong, S. C., Yang, Y. H.,
Pradeep, P. J., Rahman, Z. A., Ismail, S. M., Zaini, Z. M., Prepageran, N.,
Kallarakkal, T. G., Ramanathan, A., Mohayadi, N. A., Rosli, N. S., Mustafa, W.
M., Abraham, M. T., Tay, K. K., & Zain, R. B. (2013). Genome wide analysis of
chromosomal alterations in oral squamous cell carcinomas revealed over
expression of MGAM and ADAM9. PLoS One, 8(2), e54705.
Vincent-Chong, V. K., Ismail, S. M., Rahman, Z. A., Sharifah, N. A., Anwar, A.,
Pradeep, P. J., Ramanathan, A., Karen-Ng, L. P., Kallarakkal, T. G., Mustafa,
W. M., Abraham, M. T., Tay, K. K., & Zain, R. B. (2012). Genome-wide
analysis of oral squamous cell carcinomas revealed over expression of ISG15,
Nestin and WNT11. Oral Dis, 18(5), 469-476.
Vincent-Chong, V. K., Salahshourifar, I., Razali, R., Anwar, A., & Zain, R. B. (2016).
Immortalization of epithelial cells in oral carcinogenesis as revealed by genome-
wide array comparative genomic hybridization: A meta-analysis. Head Neck, 38
(Suppl 1), E783-797.
Virgilio, L., Shuster, M., Gollin, S. M., Veronese, M. L., Ohta, M., Huebner, K., &
Croce, C. M. (1996). FHIT gene alterations in head and neck squamous cell
carcinomas. Proc Natl Acad Sci U S A, 93(18), 9770-9775.
Vogelstein, B., Papadopoulos, N., Velculescu, V. E., Zhou, S., Diaz, L. A., Jr., &
Kinzler, K. W. (2013). Cancer genome landscapes. Science, 339(6127), 1546-
1558.
Warnakulasuriya, S. (2009a). Causes of oral cancer--an appraisal of controversies. Br
Dent J, 207(10), 471-475.
Warnakulasuriya, S. (2009b). Global epidemiology of oral and oropharyngeal cancer.
Oral Oncol, 45(4-5), 309-316.
Warnakulasuriya, S. (2014a). Prognostic and predictive markers for oral squamous cell
carcinoma: The importance of clinical, pathological and molecular markers.
Saudi Journal of Medicine and Medical Sciences, 2(1), 12.
Warnakulasuriya, S. (2014b). Prognostic and predictive markers for oral squamous cell
carcinoma: The importance of clinical, pathological and molecular markers.
Saudi Journal of Medicine and Medical Sciences, 2(1), 12-16.
Warnakulasuriya, S., Johnson, N. W., & van der Waal, I. (2007). Nomenclature and
classification of potentially malignant disorders of the oral mucosa. J Oral
Pathol Med, 36(10), 575-580.
Warnakulasuriya, S., Reibel, J., Bouquot, J., & Dabelsteen, E. (2008). Oral epithelial
dysplasia classification systems: predictive value, utility, weaknesses and scope
for improvement. J Oral Pathol Med, 37(3), 127-133.
Warnakulasuriya, S., Sutherland, G., & Scully, C. (2005). Tobacco, oral cancer, and
treatment of dependence. Oral Oncol, 41(3), 244-260.
Weinberg, R. A. (1991). Tumor suppressor genes. Science, 254(5035), 1138-1146.

199
Weinberg, R. A. (1996). How cancer arises. Sci Am, 275(3), 62-70.
Weinstein, I. B. (2002). Cancer. Addiction to oncogenes--the Achilles heal of cancer.
Science, 297(5578), 63-64.
Wilczynski, S. P., Lin, B. T., Xie, Y., & Paz, I. B. (1998). Detection of human
papillomavirus DNA and oncoprotein overexpression are associated with
distinct morphological patterns of tonsillar squamous cell carcinoma. Am J
Pathol, 152(1), 145-156.
Wilkey, J. F., Buchberger, G., Saucier, K., Patel, S. M., Eisenberg, E., Nakagawa, H.,
Michaylira, C. Z., Rustgi, A. K., & Mallya, S. M. (2009). Cyclin D1
overexpression increases susceptibility to 4-nitroquinoline-1-oxide-induced
dysplasia and neoplasia in murine squamous oral epithelium. Mol Carcinog,
48(9), 853-861.
Williams, M. D. (2010). Integration of biomarkers including molecular targeted
therapies in head and neck cancer. Head Neck Pathol, 4(1), 62-69.
Winn, D. M., Blot, W. J., McLaughlin, J. K., Austin, D. F., Greenberg, R. S., Preston-
Martin, S., Schoenberg, J. B., & Fraumeni, J. F., Jr. (1991). Mouthwash use and
oral conditions in the risk of oral and pharyngeal cancer. Cancer Res, 51(11),
3044-3047.
Woolgar, J. A. (2006). Histopathological prognosticators in oral and oropharyngeal
squamous cell carcinoma. Oral Oncol, 42(3), 229-239.
Woolgar, J. A., Rogers, S., West, C. R., Errington, R. D., Brown, J. S., & Vaughan, E.
D. (1999). Survival and patterns of recurrence in 200 oral cancer patients treated
by radical surgery and neck dissection. Oral Oncol, 35(3), 257-265.
Woolgar, J. A., & Scott, J. (1995). Prediction of cervical lymph node metastasis in
squamous cell carcinoma of the tongue/floor of mouth. Head Neck, 17(6), 463-
472.
Wreesmann, V. B., Shi, W., Thaler, H. T., Poluri, A., Kraus, D. H., Pfister, D., Shaha,
A. R., Shah, J. P., Rao, P. H., & Singh, B. (2004). Identification of novel
prognosticators of outcome in squamous cell carcinoma of the head and neck. J
Clin Oncol, 22(19), 3965-3972.
Xi, S., & Grandis, J. R. (2003). Gene therapy for the treatment of oral squamous cell
carcinoma. J Dent Res, 82(1), 11-16.
Xia, W., Lau, Y. K., Zhang, H. Z., Liu, A. R., Li, L., Kiyokawa, N., Clayman, G. L.,
Katz, R. L., & Hung, M. C. (1997). Strong correlation between c-erbB-2
overexpression and overall survival of patients with oral squamous cell
carcinoma. Clin Cancer Res, 3(1), 3-9.

200
Xu, C., Liu, Y., Wang, P., Fan, W., Rue, T. C., Upton, M. P., Houck, J. R.,
Lohavanichbutr, P., Doody, D. R., Futran, N. D., Zhao, L. P., Schwartz, S. M.,
Chen, C., & Mendez, E. (2010). Integrative analysis of DNA copy number and
gene expression in metastatic oral squamous cell carcinoma identifies genes
associated with poor survival. Mol Cancer, 9, 143.
Yamamoto, S., Tomita, Y., Hoshida, Y., Iizuka, N., Kidogami, S., Miyata, H.,
Takiguchi, S., Fujiwara, Y., Yasuda, T., Yano, M., Nakamori, S., Sakon, M.,
Monden, M., & Aozasa, K. (2004). Expression level of valosin-containing
protein (p97) is associated with prognosis of esophageal carcinoma. Clin Cancer
Res, 10(16), 5558-5565.
Yang, A., Schweitzer, R., Sun, D., Kaghad, M., Walker, N., Bronson, R. T., Tabin, C.,
Sharpe, A., Caput, D., Crum, C., & McKeon, F. (1999). p63 is essential for
regenerative proliferation in limb, craniofacial and epithelial development.
Nature, 398(6729), 714-718.
Yanik, E. L., Katki, H. A., Silverberg, M. J., Manos, M. M., Engels, E. A., &
Chaturvedi, A. K. (2015). Leukoplakia, Oral Cavity Cancer Risk, and Cancer
Survival in the U.S. Elderly. Cancer Prev Res (Phila), 8(9), 857-863.
Yano, S., Kondo, K., Yamaguchi, M., Richmond, G., Hutchison, M., Wakeling, A.,
Averbuch, S., & Wadsworth, P. (2003). Distribution and function of EGFR in
human tissue and the effect of EGFR tyrosine kinase inhibition. Anticancer Res,
23(5A), 3639-3650.
Yokota, J., & Sugimura, T. (1993). Multiple steps in carcinogenesis involving
alterations of multiple tumor suppressor genes. FASEB J, 7(10), 920-925.
Yuen, A. P., Lam, K. Y., Wei, W. I., Lam, K. Y., Ho, C. M., Chow, T. L., & Yuen, W.
F. (2000). A comparison of the prognostic significance of tumor diameter,
length, width, thickness, area, volume, and clinicopathological features of oral
tongue carcinoma. Am J Surg, 180(2), 139-143.
Zain, R. B., Athirajan, V., Ghani, W. M., Razak, I. A., Raja Latifah, R. J., Ismail, S. M.,
Sallam, A. A., Bustam, A. Z., Rahman, Z. A., Hussien, A., Talib, N., Cheong, S.
C., & Jallaludin, A. (2013). An oral cancer biobank initiative: a platform for
multidisciplinary research in a developing country. Cell Tissue Bank, 14(1), 45-
52.
Zain, R. B., Ikeda, N., Razak, I. A., Axell, T., Majid, Z. A., Gupta, P. C., & Yaacob, M.
(1997). A national epidemiological survey of oral mucosal lesions in Malaysia.
Community Dent Oral Epidemiol, 25(5), 377-383.
Zelefsky, M. J., Harrison, L. B., Fass, D. E., Armstrong, J., Spiro, R. H., Shah, J. P., &
Strong, E. W. (1990). Postoperative radiotherapy for oral cavity cancers: impact
of anatomic subsite on treatment outcome. Head Neck, 12(6), 470-475.
Zhang, D., & Zhang, D. E. (2011). Interferon-stimulated gene 15 and the protein
ISGylation system. J Interferon Cytokine Res, 31(1), 119-130.

201
Zhang, L., Poh, C. F., Williams, M., Laronde, D. M., Berean, K., Gardner, P. J., Jiang,
H., Wu, L., Lee, J. J., & Rosin, M. P. (2012). Loss of heterozygosity (LOH)
profiles--validated risk predictors for progression to oral cancer. Cancer Prev
Res (Phila), 5(9), 1081-1089.
Zhang, W., & Liu, H. T. (2002). MAPK signal pathways in the regulation of cell
proliferation in mammalian cells. Cell Res, 12(1), 9-18.
Zhao, Y., Yu, D., Li, H., Nie, P., Zhu, Y., Liu, S., Zhu, M., & Fang, B. (2014). Cyclin
D1 overexpression is associated with poor clinicopathological outcome and
survival in oral squamous cell carcinoma in Asian populations: insights from a
meta-analysis. PLoS One, 9(3), e93210.
Zhu, Q., Krakowski, A. R., Dunham, E. E., Wang, L., Bandyopadhyay, A., Berdeaux,
R., Martin, G. S., Sun, L., & Luo, K. (2007). Dual role of SnoN in mammalian
tumorigenesis. Mol Cell Biol, 27(1), 324-339.
Zimmermann, M., Zouhair, A., Azria, D., & Ozsahin, M. (2006). The epidermal growth
factor receptor (EGFR) in head and neck cancer: its role and treatment
implications. Radiat Oncol, 1, 11.
Zlobec, I., Steele, R., Terracciano, L., Jass, J. R., & Lugli, A. (2007). Selecting
immunohistochemical cut-off scores for novel biomarkers of progression and
survival in colorectal cancer. J Clin Pathol, 60(10), 1112-1116.
zur Hausen, H. (1996). Papillomavirus infections-a major cause of human cancers.
Biochim Biophys Acta, 1288(2), F55-78.

202
LIST OF PUBLICATIONS AND PAPERS PRESENTED
List of publications
1. Vincent-Chong, V. K., Anwar, A., Karen-Ng, L. P., Cheong, S. C., Yang, Y. H.,
Pradeep, P. J., et al. (2013). Genome-wide analysis of chromosomal alterations in
oral squamous cell carcinomas revealed over-expression of MGAM and ADAM9.
PLoS One, 8(2), e54705.
2. Vincent-Chong, V. K., Salahshourifar, I., Karen-Ng, L. P., Siow, M. Y.,
Kallarakkal, T. G., Ramanathan, A., et al. (2014). Over-expression of MMP13 is
associated with clinical outcomes and poor prognosis in oral squamous cell
carcinoma. ScientificWorldJournal, 2014, 897523.
3. Vincent-Chong, V. K., Salahshourifar, I., Razali, R., Anwar, A., & Zain, R. B.
(2015). Immortalization of epithelial cells in oral carcinogenesis as revealed by
genome-wide array comparative genomic hybridization: A meta-analysis. Head
Neck.
4. Salahshourifar, I., Vincent-Chong, V. K., Kallarakkal, T. G., & Zain, R. B. (2014).
Genomic DNA copy number alterations from precursor oral lesions to oral
squamous cell carcinoma. Oral Oncol, 50(5), 404-412.

203
List of paper presented
1. Vincent-Chong VK. Meta-analysis of genome-wide profiling in oral squamous cell
carcinoma. Presented: 28th Annual Scientific Meeting of the International
Association for Dental Research Southeast Asian Division, from August 13 to
August 14, 2014 Kuching, Malaysia.
2. Vincent-Chong VK. Reduced expression of ISG15 by small interfering RNA
inhibits cell proliferation of gingival squamous cell carcinoma. Presented: 5th
International Academy of Oral Oncology, from July 8 to 11 July, 2015 at Sao
Paolo, Brazil.
3. Vincent-Chong VK. Genome-wide analysis of chromosomal alterations identified
interferon stimulated gene 15 (ISG15) as a driver gene for tumourigenesis and
metastasis of oral squamous cell carcinomas. Presented: International Postgraduate
Research Awards Seminar from March 7 to March 8, 2016 at University of Malaya,
Kuala Lumpur, Malaysia.
204
APPENDIX
APPENDIX A: DETAIL OF DNEASY BLOOD AND TISSUE KIT EXTRACTION
(QIAGEN GMBH GERMANY) PROTOCOL
All tumour tissues for test gDNA samples were isolated by using DNEasy Blood & Tissue
Kit (Qiagen GmBH Germany) following the manufacturer’s instructions. 750 µm of the
tissue sections were mixed with 1x PBS buffer and then centrifuged in 5000rpm for 5
minutes. The supernatant were discarded thereafter. Then, 180µl of ATL buffer and 20 µl
of proteinase K were added and then kept for incubation at 56º C, overnight. Later, 200 µl
AL buffer was added again and then followed by incubation at 70° C for 10 minutes.
Afterthat, absolute ethanol (200 µl) were added and thereafter all the mixtures were
transferred to QIAamp Mini spin for centrifugation at 8000rpm for 1 minute. After
centrifugation the collection tubes were discarded and new columns were placed into the
new collection tubes. To this 500 µl AW1 was added and then again centrifuged at
8000rpm for 1 minute duration. This process was repeated by changing only the buffer with
500 µl AW2. Column was spinned at 13200rpm for 3 minutes in order to dry the column
membrane. In continuation, 50 µl AE buffer was added into the column and then incubated
for 5 minutes. Final centrifugation was done at 13200 rpm for 3 minutes to collect the
elution buffer which contained DNA. The quality and quantity of gDNA were verified by
Nanodrop ND-2000. DNA concentration (ng/µl) and DNA purity (A260/A280) were
calculated using the spectrophotometer (NanoDrop ND-2000) according to the
manufacturer’s instructions.
205
APPENDIX B: DETAIL OF RNEASY MINI KIT EXTRACTION (QIAGEN GMBH
GERMANY) PROTOCOL
Fresh-frozen tissue sections were incubated in 350 µl Buffer RLT which contained 3.5 µl
beta mercaptoethanol. The mixture was homogenized with 1 ml syringe. One volume of
70% ethanol was added into the mixture followed by vortexing for 30 seconds. The mixture
was transferred into RNeasy MinElute spin column assembly with 2 ml collection tube and
centrifuge for 15 second at 10,000 rpm. The flow through solution was discarded. There
were 350 µl of buffer RW1 was added into the RNeasy MinElute spin column assembly
with 2 ml collection tubes and centrifuged and for 15 seconds at 10,000 rpm to wash the
spin column. The flow through solution and collection tubes was discarded. RNeasy
MinElute spin column was placed with a new 2 ml collection tube and 500 µl Buffer RPE
was added to the spin column continued by centrifuged for 15 seconds at 10,000 rpm to
wash the spin column membrane. Total of 500 µl of 80% ethanol was added to the RNeasy
MinElute spin column and centrifuged for 15 seconds at 10,000 rpm to wash the spin
column membrane. The flow through solution and collection tube was discarded. RNeasy
MinElute spin column was placed with a new 2 ml collection tube. The lid of the spin
column was opened during centrifugation at full speed for 5 minutes. The flow through
solution and collection tube was discarded. The RNeasy MinElute spin column was placed
in a new 1.5 ml collection tube. Total of 14 µl of RNase free water was directly added to
the center of the spin column membrane and centrifuged for 3 minutes at full speed to elute
the RNA. The RNA integrity number (RIN) and concentration of RNA extracted was
evaluated using Agilent 2100 Bioanalyzer (Agilent Technologies).

205
APPENDIX C: CLINICO-PATHOLOGICAL PARAMETERS AND SOCIO-DEMOGRAPHIC DATA OF THE 75 PATIENTS
FOR ARRAY CGH STUDY
NO IRPA GENDER AGE ETHNICITY SMOKE DRINK CHEW TUMOUR SUBSITE TUMOUR SIZE LNM TUMOUR STAGE EARLY/ ADVANCED DIFFERENTIATION STATUS MONTHS
1 04-0014-11 MALE 78 CHINESE NO YES NO GUM T1 NO I EARLY MODERATE DEAD 15
2 04-0020-11 FEMALE 77 INDIAN YES NO NO BM T2 NO II EARLY WELL ALIVE 21
3 04-0028-11 MALE 65 CHINESE YES YES NO FOM T3 YES III ADVANCED MODERATE DEAD 6
4 04-0030-11 MALE 66 CHINESE YES NO NO OTHER T2 YES III ADVANCED WELL DEAD 21
5 04-0034-10 FEMALE 70 INDIAN NO NO NO TONGUE T2 NO II EARLY WELL DEAD 29
6 04-0002-10 MALE 66 MALAY NO NO NO GUM T4 YES IV ADVANCED WELL DEAD 12
7 04-0005-09 FEMALE 59 INDIAN NO YES YES BM T2 NO II EARLY WELL ALIVE 58
8 04-0006-09 MALE 55 INDIAN YES NO NO TONGUE T2 NO II EARLY WELL DEAD 42
9 04-0007-12 FEMALE 33 INDIAN NO NO YES BM T2 NO II EARLY MODERATE ALIVE 22
10 04-0008-10 MALE 62 MALAY YES NO NO TONGUE T2 YES IV ADVANCED MODERATE ALIVE 44
11 04-0013-09 MALE 63 CHINESE YES NO NO TONGUE T1 NO I EARLY MODERATE ALIVE 55
12 04-0013-11 FEMALE 65 INDIAN NO NO YES BM+GUM T2 YES III ADVANCED WELL ALIVE 43
13 04-0015-09 FEMALE 60 INDIAN NO YES YES
T1 NO I EARLY MODERATE ALIVE 54
14 04-0040-10 FEMALE 79 INDIAN NO NO YES OTHER T4 NO IV ADVANCED WELL DEAD 19
15 06-0002-13 FEMALE 65 INDIAN NO NO YES BM T3 YES IV ADVANCED POOR DEAD 7
16 06-0012-13 MALE 43 CHINESE NO NO NO TONGUE T3 YES IV ADVANCED MODERATE DEAD 7
17 06-0074-12 FEMALE 60 INDIAN NO NO YES BM T1 YES IV ADVANCED MODERATE DEAD 15
18 06-0002-11 FEMALE 75 INDIAN NO NO YES BM T4 YES IV ADVANCED MODERATE DEAD 1
19 06-0007-11 FEMALE 51 CHINESE NO NO NO TONGUE T1 YES IV ADVANCED WELL ALIVE 36
20 06-0009-11 FEMALE 42 INDIAN NO NO YES BM T3 YES IV ADVANCED MODERATE DEAD 9
21 06-0011-11 MALE 49 INDIAN YES YES YES FOM+TONG T4 YES IV ADVANCED MODERATE DEAD 8
22 06-0014-11 MALE 66 INDIAN NO NO YES HP T2 NO II EARLY MODERATE ALIVE 33
23 06-0018-10 MALE 56 INDIAN YES YES NO T+FOM T2 YES IV ADVANCED MODERATE ALIVE 43
24 06-0019-13 MALE 56 INDIAN NO NO NO PALATE T2 YES IV ADVANCED MODERATE DEAD 12
20
6

206
NO IRPA GENDER AGE ETHNICITY SMOKE DRINK CHEW TUMOUR
SUBSITE
TUMOU
R SIZE LNM
TUMOUR
STAGE
EARLY/
ADVANCED DIFFERENTIATION STATUS MONTHS
25 06-0020-12 MALE 73 INDIAN NO NO YES BM T2 YES IV ADVANCED MODERATE ALIVE 23
26 06-0021-11 FEMALE 48 INDIAN NO NO YES BM T2 NO II EARLY MODERATE ALIVE 33
27 06-0022-12 FEMALE 35 INDIAN YES YES NO TONGUE T1 NO I EARLY POOR ALIVE 22
28 06-0028-11 FEMALE 71 INDIAN NO NO YES GUM+BM T2 NO II EARLY MODERATE ALIVE 30
29 06-0031-11 FEMALE 64 INDIAN NO NO YES BM+HP T3 NO III ADVANCED MODERATE DEAD 6
30 06-0033-10 FEMALE 72 INDIAN NO NO YES GUM T3 YES IV ADVANCED MODERATE DEAD 6
31 06-0036-11 FEMALE 62 INDIAN NO NO YES BM T2 YES IV ADVANCED MODERATE DEAD 9
32 06-0038-11 FEMALE 58 INDIAN NO NO YES BM T2 NO II EARLY MODERATE ALIVE 36
33 06-0040-09 FEMALE 74 INDIAN NO NO YES BM+HP T4 YES IV ADVANCED WELL DEAD 1
34 06-0044-10 FEMALE 49 INDIAN NO NO YES BM T1 YES III ADVANCED MODERATE ALIVE 44
35 06-0050-10 FEMALE 52 MALAY NO NO NO TONGUE T2 YES IV ADVANCED MODERATE DEAD 13
36 06-0037-08 FEMALE 36 INDIAN NO NO YES BM T1 NO I EARLY WELL ALIVE 65
37 01-0049-12 FEMALE 69 INDIAN NO NO YES
T2 NO II EARLY MODERATE ALIVE 14
38 01-0001-06 FEMALE 71 INDIAN NO NO YES BM+GUM T3 YES IV ADVANCED WELL DEAD 8
39 01-0003-10 FEMALE 57 INDIAN NO NO YES LIP T2 NO II EARLY WELL ALIVE 48
40 01-0005-12 FEMALE 49 MALAY NO NO NO GUM+BM T2 YES IV ADVANCED MODERATE DEAD 1
41 01-0006-09 MALE 52 CHINESE YES NO NO TONGUE T1 NO I EARLY WELL ALIVE 57
42 01-0009-11 FEMALE 62 MALAY NO NO NO BM T3 YES IV ADVANCED WELL ALIVE 34
43 01-0010-10 FEMALE 56 CHINESE NO NO NO TONGUE T3 NO III ADVANCED WELL DEAD 14
44 01-0011-10 FEMALE 63 INDIAN NO NO NO TONGUE T2 YES IV ADVANCED MODERATE DEAD 12
45 01-0012-11 MALE 57 CHINESE NO NO NO GUM T1 NO I EARLY WELL ALIVE 34
46 01-0018-11 MALE 69 CHINESE NO NO NO GUM T4 NO IV ADVANCED WELL DEAD 12
47 01-0019-10 FEMALE 76 INDIAN NO NO YES BM T2 NO II EARLY MODERATE ALIVE 48
48 01-0020-11 FEMALE 56 INDIAN NO NO YES GUM T1 YES III ADVANCED WELL ALIVE 32
49 01-0024-10 FEMALE 29 CHINESE YES NO NO TONGUE T1 NO I EARLY POOR ALIVE 42
20
7

207
NO IRPA GENDER AGE ETHNICITY SMOKE DRINK CHEW TUMOUR
SUBSITE
TUMOU
R SIZE LNM
TUMOU
R
STAGE
EARLY/
ADVANCED DIFFERENTIATION STATUS MONTHS
50 01-0025-12 MALE 62 CHINESE YES YES NO TONGUE T2 YES IV ADVANCED MODERATE ALIVE 21
51 01-0026-06 FEMALE 58 INDIAN NO NO YES BM+GUM T1 NO I EARLY WELL ALIVE 89
52 01-0030-10 FEMALE 33 MALAY NO NO NO TONGUE T3 YES IV ADVANCED MODERATE DEAD 15
53 01-0032-12 MALE 69 CHINESE YES YES NO HP T4 NO IV ADVANCED MODERATE ALIVE 19
54 01-0036-11 FEMALE 69 INDIAN NO NO YES BM T2 NO II EARLY MODERATE ALIVE 28
55 01-0048-11 MALE 87 INDIAN YES NO NO TONGUE T2 YES IV ADVANCED WELL DEAD 11
56 11-0007-10 FEMALE 50 OTHER NO NO YES BM T2 NO II EARLY WELL ALIVE 43
57 11-0008-10 FEMALE 56 OTHER YES NO NO BM+GUM T4 YES IV ADVANCED WELL DEAD 12
58 11-0018-10 MALE 57 OTHER YES YES NO GUM+BM+
F T4 YES IV ADVANCED WELL DEAD 7
59 11-0001-12 FEMALE 27 CHINESE NO NO NO TONGUE T2 YES IV ADVANCED POOR DEAD 3
60 11-0002-08 FEMALE 71 OTHER NO NO YES LIP T2 NO II EARLY WELL DEAD 2
61 11-0002-12 FEMALE 66 OTHER YES NO NO GUM+OP T4 YES IV ADVANCED WELL ALIVE 25
62 11-0004-07 FEMALE 58 OTHER NO NO YES SP+TONGU T3 NO III ADVANCED MODERATE DEAD 11
63 11-0004-12 MALE 81 CHINESE YES NO NO GUM T4 NO IV ADVANCED WELL ALIVE 24
64 11-0005-07 MALE 30 CHINESE NO NO NO TONGUE T3 YES III ADVANCED WELL DEAD 12
65 11-0006-08 FEMALE 77 OTHER YES NO YES PALATE+T T4 NO IV ADVANCED MODERATE DEAD 3
66 11-0007-04 MALE 69 OTHER YES NO YES TONGUE T2 NO II EARLY WELL ALIVE 114
67 11-0008-04 FEMALE 54 OTHER YES NO YES GUM T2 YES IV ADVANCED MODERATE DEAD 12
68 11-0009-07 FEMALE 51 MALAY NO NO NO TONGUE T3 NO III ADVANCED WELL DEAD 10
69 11-0009-10 FEMALE 27 CHINESE NO NO NO TONGUE T1 YES III ADVANCED WELL ALIVE 44
70 11-0013-10 MALE 58 OTHER YES YES NO FOM T4 NO IV ADVANCED MODERATE ALIVE 41
71 11-0014-10 FEMALE 69 CHINESE NO NO NO GUM T4 YES IV ADVANCED MODERATE ALIVE 47
72 11-0015-10 MALE 59 MALAY YES NO NO BM T3 NO III ADVANCED MODERATE ALIVE 39
73 11-0017-10 FEMALE 67 MALAY NO NO YES GUM T4 NO III ADVANCED MODERATE DEAD 9
20
8

208
NO IRPA GENDER AGE ETHNICITY SMOKE DRINK CHEW TUMOUR
SUBSITE
TUMOU
R SIZE LNM
TUMOU
R
STAGE
EARLY/
ADVANCED DIFFERENTIATION STATUS MONTHS
74 11-0049-11 MALE 37 OTHER NO NO NO GUM T3 YES IV ADVANCED WELL ALIVE 28
75 11-0010-10 FEMALE 35 CHINESE NO NO NO TONGUE T1 NO I EARLY WELL ALIVE 43
20
9

209
APPENDIX D: CLINICO-PATHOLOGICAL PARAMETERS AND SOCIO-DEMOGRAPHIC DATA OF THE 66 PATIENTS
FOR TAQMAN PCR ASSAY
NO IRPA GENDER AGE ETHNICITY SMOKE DRINK CHEW TUMOR
SUBSITE
TUMOR
SIZE LNM
TUMOR
STAGE
EARLY/
ADVANCED DIFFERENTIATION STATUS MONTHS LRP12 CCND1 TPM2 FSCN1 EGFR CLPTM1L CHL1 CSMD1
1 04-0014-
11 MALE 78 CHINESE NO YES NO GUM T1 NO I EARLY MODERATE dead 15 6.07 10.01 1.85 2.11 10.81 2.39 1.7 1.74
2 04-0028-
11 MALE 65 CHINESE YES YES NO FOM T3 YES III ADVANCED MODERATE dead 6 1.74 1.25 1.5 2.02 2.24 1.76 1.81 1.56
3 04-0034-
10 FEMALE 70 INDIAN NO NO NO TONGUE T2 NO II EARLY WELL dead 29 1.49 1.53 1.57 2.29 2.4 2.17 0.98 1.21
4 04-0002-
10 MALE 66 MALAY NO NO NO GUM T4 YES IV ADVANCED WELL dead 12 1.4 4.46 4.66 3.09 228.36 1.47 0.79 0.72
5 04-0006-
09 MALE 55 INDIAN YES NO NO TONGUE T2 NO II EARLY WELL dead 42 0.42 0.26 0.25 0.48 0.33 0.44 0.26 0.32
6 04-0007-
12 FEMALE 33 INDIAN NO NO YES BM T2 NO II EARLY MODERATE alive 22 2.34 2.17 1.97 1.53 1.88 2.9 1.42 1.89
7 04-0008-
10 MALE 62 MALAY YES NO NO TONGUE T2 YES IV ADVANCED MODERATE alive 44 0.39 0.2 0.19 0.26 0.41 0.28 0.24 0.18
8 04-0013-
09 MALE 63 CHINESE YES NO NO TONGUE T1 NO I EARLY MODERATE alive 55 0.32 0.27 0.22 0.37 0.3 0.38 0.24 0.28
9 04-0040-
10 FEMALE 79 INDIAN NO NO YES OTHER T4 NO IV ADVANCED WELL dead 19 0.89 0.33 0.28 0.57 0.37 0.37 0.34 0.36
10 06-0002-
13 FEMALE 65 INDIAN NO NO YES BM T3 YES IV ADVANCED POOR dead 7 1.59 1.68 1.81 1.88 33.34 2.4 1.18 0.9
11 06-0012-
13 MALE 43 CHINESE NO NO NO TONGUE T3 YES IV ADVANCED MODERATE dead 7 1.91 2.93 2.04 2.09 14.72 2.8 1.39 1.44
12 06-0074-
12 FEMALE 60 INDIAN NO NO YES BM T1 YES IV ADVANCED MODERATE dead 15 0.8 1.09 1.08 1.34 1.61 1.76 0.9 1.28
13 06-0002-
11 FEMALE 75 INDIAN NO NO YES BM T4 YES IV ADVANCED MODERATE dead 1 0.75 0.27 0.38 0.54 0.33 0.37 0.19 0.08
14 06-0009-
11 FEMALE 42 INDIAN NO NO YES BM T3 YES IV ADVANCED MODERATE dead 9 0.54 0.75 0.13 0.32 1.86 0.27 0.17 0.1
15 06-0011-
11 MALE 49 INDIAN YES YES YES FOM+TONG T4 YES IV ADVANCED MODERATE dead 8 2.01 1.88 1.45 1.53 1.76 2.54 2.73 1.61
16 06-0014-
11 MALE 66 INDIAN NO NO YES HP T2 NO II EARLY MODERATE alive 33 1.21 1.61 2.18 22.94 2.1 2.68 1.42 34.48
17 06-0018-
10 MALE 56 INDIAN YES YES NO T+FOM T2 YES IV ADVANCED MODERATE alive 43 2.22 1.86 1.95 2.33 2.37 3.17 5.92 2.8
18 06-0019-
13 MALE 56 INDIAN NO NO NO PALATE T2 YES IV ADVANCED MODERATE dead 12 2.05 1.66 1.77 1.75 13.48 2.33 1.51 1.59
19 06-0020-
12 MALE 73 INDIAN NO NO YES BM T2 YES IV ADVANCED MODERATE alive 23 1.43 1.6 2.7 24.51 2.67 3.46 1.51 31.35
20 06-0021-
11 FEMALE 48 INDIAN NO NO YES BM T2 NO II EARLY MODERATE alive 33 3.45 10.9 2.26 3.2 4.78 3.02 5.73 2.08
21 06-0022-
12 FEMALE 35 INDIAN YES YES NO TONGUE T1 NO I EARLY POOR alive 22 2.47 1.78 1.99 3.01 3.24 21.52 2.23 1.64
22 06-0028-
11 FEMALE 71 INDIAN NO NO YES GUM+BM T2 NO II EARLY MODERATE alive 30 1.94 2.15 2.36 3.47 2.71 36.66 2.58 2.06
23 06-0031-
11 FEMALE 64 INDIAN NO NO YES BM+HP T3 NO III ADVANCED MODERATE dead 6 2.06 2.18 2.5 2.95 2.03 21.89 1.77 1.23
24 06-0033-
10 FEMALE 72 INDIAN NO NO YES GUM T3 YES IV ADVANCED MODERATE dead 6 1.61 1.78 1.56 3.16 2.74 2.46 1.73 1.8
25 06-0036-
11 FEMALE 62 INDIAN NO NO YES BM T2 YES IV ADVANCED MODERATE dead 9 1.25 13.48 1.71 2.5 6.73 1.91 2.04 1.11
21
0
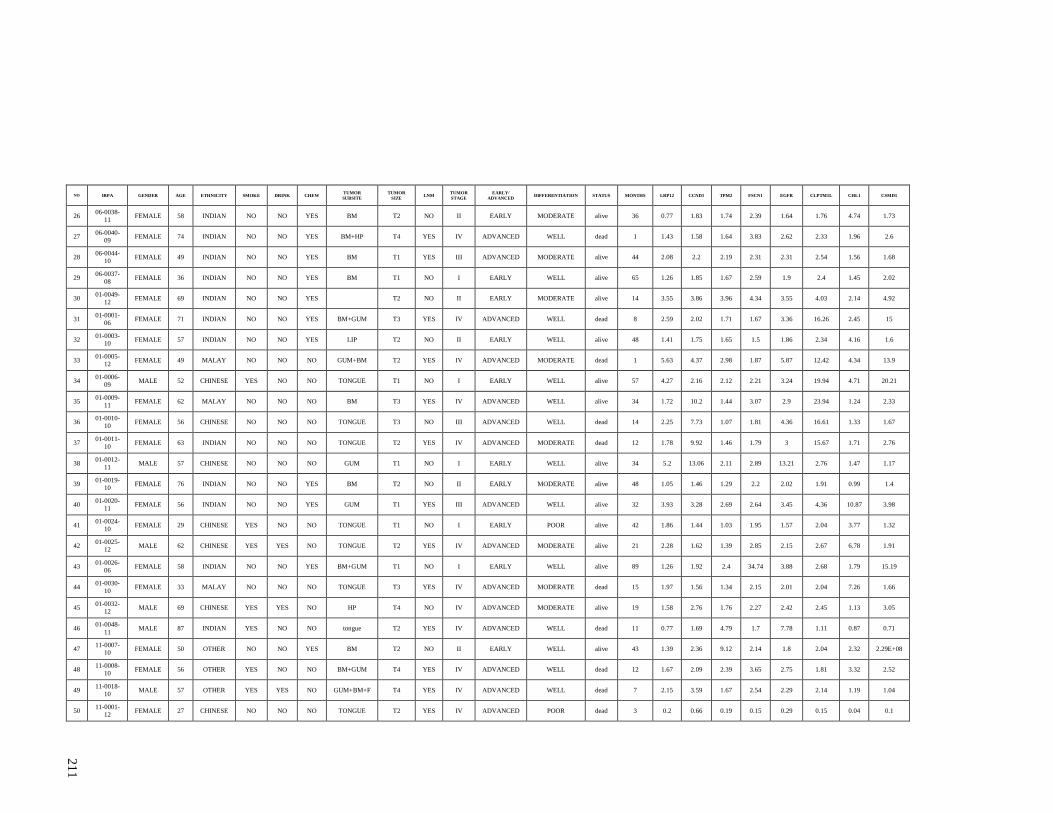
210
NO IRPA GENDER AGE ETHNICITY SMOKE DRINK CHEW TUMOR
SUBSITE
TUMOR
SIZE LNM
TUMOR
STAGE
EARLY/
ADVANCED DIFFERENTIATION STATUS MONTHS LRP12 CCND1 TPM2 FSCN1 EGFR CLPTM1L CHL1 CSMD1
26 06-0038-
11 FEMALE 58 INDIAN NO NO YES BM T2 NO II EARLY MODERATE alive 36 0.77 1.83 1.74 2.39 1.64 1.76 4.74 1.73
27 06-0040-
09 FEMALE 74 INDIAN NO NO YES BM+HP T4 YES IV ADVANCED WELL dead 1 1.43 1.58 1.64 3.83 2.62 2.33 1.96 2.6
28 06-0044-
10 FEMALE 49 INDIAN NO NO YES BM T1 YES III ADVANCED MODERATE alive 44 2.08 2.2 2.19 2.31 2.31 2.54 1.56 1.68
29 06-0037-
08 FEMALE 36 INDIAN NO NO YES BM T1 NO I EARLY WELL alive 65 1.26 1.85 1.67 2.59 1.9 2.4 1.45 2.02
30 01-0049-
12 FEMALE 69 INDIAN NO NO YES
T2 NO II EARLY MODERATE alive 14 3.55 3.86 3.96 4.34 3.55 4.03 2.14 4.92
31 01-0001-
06 FEMALE 71 INDIAN NO NO YES BM+GUM T3 YES IV ADVANCED WELL dead 8 2.59 2.02 1.71 1.67 3.36 16.26 2.45 15
32 01-0003-
10 FEMALE 57 INDIAN NO NO YES LIP T2 NO II EARLY WELL alive 48 1.41 1.75 1.65 1.5 1.86 2.34 4.16 1.6
33 01-0005-
12 FEMALE 49 MALAY NO NO NO GUM+BM T2 YES IV ADVANCED MODERATE dead 1 5.63 4.37 2.98 1.87 5.87 12.42 4.34 13.9
34 01-0006-
09 MALE 52 CHINESE YES NO NO TONGUE T1 NO I EARLY WELL alive 57 4.27 2.16 2.12 2.21 3.24 19.94 4.71 20.21
35 01-0009-
11 FEMALE 62 MALAY NO NO NO BM T3 YES IV ADVANCED WELL alive 34 1.72 10.2 1.44 3.07 2.9 23.94 1.24 2.33
36 01-0010-
10 FEMALE 56 CHINESE NO NO NO TONGUE T3 NO III ADVANCED WELL dead 14 2.25 7.73 1.07 1.81 4.36 16.61 1.33 1.67
37 01-0011-
10 FEMALE 63 INDIAN NO NO NO TONGUE T2 YES IV ADVANCED MODERATE dead 12 1.78 9.92 1.46 1.79 3 15.67 1.71 2.76
38 01-0012-
11 MALE 57 CHINESE NO NO NO GUM T1 NO I EARLY WELL alive 34 5.2 13.06 2.11 2.89 13.21 2.76 1.47 1.17
39 01-0019-
10 FEMALE 76 INDIAN NO NO YES BM T2 NO II EARLY MODERATE alive 48 1.05 1.46 1.29 2.2 2.02 1.91 0.99 1.4
40 01-0020-
11 FEMALE 56 INDIAN NO NO YES GUM T1 YES III ADVANCED WELL alive 32 3.93 3.28 2.69 2.64 3.45 4.36 10.87 3.98
41 01-0024-
10 FEMALE 29 CHINESE YES NO NO TONGUE T1 NO I EARLY POOR alive 42 1.86 1.44 1.03 1.95 1.57 2.04 3.77 1.32
42 01-0025-
12 MALE 62 CHINESE YES YES NO TONGUE T2 YES IV ADVANCED MODERATE alive 21 2.28 1.62 1.39 2.85 2.15 2.67 6.78 1.91
43 01-0026-
06 FEMALE 58 INDIAN NO NO YES BM+GUM T1 NO I EARLY WELL alive 89 1.26 1.92 2.4 34.74 3.88 2.68 1.79 15.19
44 01-0030-
10 FEMALE 33 MALAY NO NO NO TONGUE T3 YES IV ADVANCED MODERATE dead 15 1.97 1.56 1.34 2.15 2.01 2.04 7.26 1.66
45 01-0032-
12 MALE 69 CHINESE YES YES NO HP T4 NO IV ADVANCED MODERATE alive 19 1.58 2.76 1.76 2.27 2.42 2.45 1.13 3.05
46 01-0048-
11 MALE 87 INDIAN YES NO NO tongue T2 YES IV ADVANCED WELL dead 11 0.77 1.69 4.79 1.7 7.78 1.11 0.87 0.71
47 11-0007-
10 FEMALE 50 OTHER NO NO YES BM T2 NO II EARLY WELL alive 43 1.39 2.36 9.12 2.14 1.8 2.04 2.32 2.29E+08
48 11-0008-
10 FEMALE 56 OTHER YES NO NO BM+GUM T4 YES IV ADVANCED WELL dead 12 1.67 2.09 2.39 3.65 2.75 1.81 3.32 2.52
49 11-0018-
10 MALE 57 OTHER YES YES NO GUM+BM+F T4 YES IV ADVANCED WELL dead 7 2.15 3.59 1.67 2.54 2.29 2.14 1.19 1.04
50 11-0001-
12 FEMALE 27 CHINESE NO NO NO TONGUE T2 YES IV ADVANCED POOR dead 3 0.2 0.66 0.19 0.15 0.29 0.15 0.04 0.1
21
1

211
NO IRPA GENDER AGE ETHNICITY SMOKE DRINK CHEW TUMOR
SUBSITE
TUMOR
SIZE LNM
TUMOR
STAGE
EARLY/
ADVANCED DIFFERENTIATION STATUS MONTHS LRP12 CCND1 TPM2 FSCN1 EGFR CLPTM1L CHL1 CSMD1
51 11-0002-
08 FEMALE 71 OTHER NO NO YES LIP T2 NO II EARLY WELL dead 2 2.03 1.98 2.25 2.81 3.24 2.12 1.56 1.53
52 11-0002-
12 FEMALE 66 OTHER YES NO NO GUM+OP T4 YES IV ADVANCED WELL alive 25 0.52 0.65 0.4 0.38 0.65 0.55 0.25 0.51
53 11-0004-
07 FEMALE 58 OTHER NO NO YES SP+TONGU T3 NO III ADVANCED MODERATE dead 11 3.71 1.31 1.38 2.34 1.94 2 1.03 1.5
54 11-0004-
12 MALE 81 CHINESE YES NO NO GUM T4 NO IV ADVANCED WELL alive 24 0.63 0.43 0.22 0.24 0.38 0.23 0.14 0.29
55 11-0005-
07 MALE 30 CHINESE NO NO NO TONGUE T3 YES III ADVANCED WELL dead 12 6.45 1.52 1.07 1.34 4.38 1.69 1.2 1.22
56 11-0006-
08 FEMALE 77 OTHER YES NO YES PALATE+T T4 NO IV ADVANCED MODERATE dead 3 2.83 2.99 14.07 3.05 3.33 2.9 4.38 2.56E+08
57 11-0007-
04 MALE 69 OTHER YES NO YES TONGUE T2 NO II EARLY WELL alive 114 7.3 11.2 1.49 2.69 16.11 3.29 1.6 1.24
58 11-0008-
04 FEMALE 54 OTHER YES NO YES GUM T2 YES IV ADVANCED MODERATE dead 12 3.32 0.76 0.94 0.75 5.51 1.04 0.7 0.72
59 11-0009-
07 FEMALE 51 MALAY NO NO NO TONGUE T3 NO III ADVANCED WELL dead 10 1.09 1.59 6.54 1.78 1.51 1.66 2.64 1.35E+09
60 11-0009-
10 FEMALE 27 CHINESE NO NO NO TONGUE T1 YES III ADVANCED WELL alive 44 1.46 2.31 2.25 2.48 2.28 1.97 2.17 2.09
61 11-0013-
10 MALE 58 OTHER YES YES NO FOM T4 NO IV ADVANCED MODERATE alive 41 2.12 2.45 1.79 3.48 3.24 2.55 2.64 1.65
62 11-0014-
10 FEMALE 69 CHINESE NO NO NO GUM T4 YES IV ADVANCED MODERATE alive 47 2.54 1.86 1.92 1.72 2.49 1.65 3.67 2.45
63 11-0015-
10 MALE 59 MALAY YES NO NO BM T3 NO III ADVANCED MODERATE alive 39 2.38 2.06 1.46 2.46 23.49 2.71 2.27 1.62
64 11-0017-
10 FEMALE 67 MALAY NO NO YES GUM T4 NO III ADVANCED MODERATE dead 9 1.11 1.88 1.62 1.47 3.27 1.99 3.54 1.28
65 11-0049-
11 MALE 37 OTHER NO NO NO GUM T3 YES IV ADVANCED WELL alive 28 2.07 1.78 2.13 1.24 1.67 1.81 1.23 1.79
66 11-0010-
10 FEMALE 35 CHINESE NO NO NO TONGUE T1 NO I EARLY WELL alive 43 1.33 2.06 1.97 2.51 1.7 1.89 2.85 1.89
21
2

212
APPENDIX E: CLINICO-PATHOLOGICAL PARAMETERS AND SOCIO-DEMOGRAPHIC DATA OF THE 68 PATIENTS
FOR MMP13 GENE EXPRESSION QPCR STUDY
NO IRPA GENDER AGE SMOKE DRINK CHEW TUMOR
SUBSITE LNM
TUMOUR
STAGE RQ MMP13 ALIVE/ DEATH MONTHS
1 01-0023-09-1 Male 42 YES NO NO Tongue No Early 137.61 ALIVE 22
2 01-0005-09-1 Female 71 NO NO NO Non tongue No Advanced 228.85 ALIVE 24
3 06-0029-08-1 Female 86 YES NO NO Non tongue Yes Advanced 6.22 DECEASED 8
4 06-0012-08-1 Male 47 YES NO NO Tongue No Early 121.93 ALIVE 39
5 01-0048-07-1 Male 71 YES NO NO Tongue Yes Advanced 1538.79 DECEASED 5
6 04-0021-08-1 Female 45 NO NO NO Tongue No Early 503.97 LOF 6
7 01-0006-09-1 Male 52 YES NO NO Tongue No Early 23.14 ALIVE 31
8 04-0017-09-1 Male 30 NO NO NO Tongue Yes Advanced 228.64 DECEASED 13
9 11-0005-07-1 Male 34 YES NO NO Tongue Yes Advanced 944.77 DECEASED 13
10 04-0021-06-1 Male 48 YES NO NO Tongue Yes Advanced 492.31 DECEASED 1
11 01-0004-09-1 Female 75 NO NO YES Non tongue No Advanced 259.8 ALIVE 14
12 11-0039-05-1 Female 52 NO NO YES Tongue Yes Advanced 1139.5 DECEASED 1
13 01-0046-05-1 Male 45 NO YES NO Tongue Yes Advanced 46.51 DECEASED 9
14 01-0036-08-1 Female 63 NO YES YES Non tongue Yes Advanced 145.68 ALIVE 42
15 04-0014-09-1 Female 37 NO NO NO Tongue No Early 207.54 LOF 15
16 01-0028-09-1 Female 44 YES YES NO Tongue Yes Advanced 73.95 DECEASED 10
17 04-0006-10-1 Male 36 YES YES NO Tongue No Early 945.99 ALIVE 12
18 01-0002-10-1 Male 72 NO NO YES Non tongue No Advanced 5.53 LOF 9
19 06-0005-10-1 Female 63 NO YES YES Non tongue No Early 2.47 DECEASED 3
20 06-0027-09-1 Male 62 NO YES YES Non tongue Yes Advanced 34.65 DECEASED 4
21 01-0022-07-1 Male 49 YES NO NO Non tongue No Advanced 26.12 LOF 39
22 01-0024-08-1 Female 61 NO NO YES Non tongue Yes Advanced 207.28 ALIVE 33
23 01-0007-09-1 Female 61 NO NO YES Non tongue Yes Advanced 83.29 LOF 3
24 06-0030-10-1 Female 53 NO NO YES Tongue Yes Advanced 4.24 DECEASED 8
21
3

213
NO IRPA GENDER AGE SMOKE DRINK CHEW TUMOR
SUBSITE LNM
TUMOUR
STAGE RQ MMP13 ALIVE/ DEATH MONTHS
25 04-0032-10-1 Female 86 NO NO YES Tongue No Early 57.39 ALIVE 18
26 04-0019-05-1 Female 55 NO NO YES Non tongue No Early 1.56 LOF 52
27 04-0014-08-1 Male 60 YES NO NO Non tongue Yes Advanced 2.3 ALIVE 40
28 04-0013-08-1 Female 62 NO NO YES Tongue Yes Advanced 8.07 LOF 6
29 11-0002-08 Female 71 NO NO YES Non tongue No Early 53.6 DECEASED 12
30 01-0058-07 Female 66 YES YES NO Non tongue No Early 4 ALIVE 35
31 01-0107-08 Female 65 YES NO NO Non tongue No Advanced 33.76 DECEASED 15
32 01-0011-10 Female 63 NO NO NO Tongue Yes Advanced 8.15 DECEASED 6
33 01-0106-08 Male 20 NO YES NO Non tongue Yes Advanced 11.84 DECEASED 12
34 01-0022-10 Female 51 NO NO NO Non tongue Yes Advanced 383.2 DECEASED 9
35 01-0024-10 Male 29 YES NO NO Tongue No Early 6.49 ALIVE 14
36 01-0025-12 Male 62 YES YES NO Tongue Yes Advanced 119.17 ALIVE 7
37 01-0005-12 Female 49 NO NO NO Non tongue Yes Advanced 23.34 DECEASED 1
38 01-0019-10 Female 76 NO NO YES Non tongue No Early 4.55 ALIVE 24
39 01-0012-11 Female 57 NO NO NO Non tongue No Early 162.53 ALIVE 17
40 06-0012-08 Male 47 YES NO NO Tongue No Early 126.17 ALIVE 39
41 06-0010-09 Female 73 NO YES YES Tongue Yes Advanced 0.49 LOF 5
42 06-0032-08 Male 48 YES NO YES Non tongue Yes Advanced 1.69 DECEASED 8
43 06-0033-10 Female 72 NO NO YES Non tongue Yes Advanced 568.4 DECEASED 6
44 06-0005-09 Female 49 NO NO YES Tongue No Early 956.81 ALIVE 27
45 06-0018-10 Male 56 YES YES NO Tongue Yes Advanced 30.7 ALIVE 31
46 06-0055-10 Female 60 NO YES YES Non tongue No Early 501.07 ALIVE 25
47 06-0002-11 Female 75 NO NO YES Non tongue Yes Advanced 3.56 DECEASED 1
48 06-0011-11 Male 48 YES YES YES Tongue Yes Advanced 1517.47 DECEASED 11
21
4

214
NO IRPA GENDER AGE SMOKE DRINK CHEW TUMOR
SUBSITE LNM
TUMOUR
STAGE RQ MMP13 ALIVE/ DEATH MONTHS
49 06-0028-11 Female 71 NO NO YES Non tongue No Early 0.49 ALIVE 18
50 06-0009-11 Female 41 NO NO YES Non tongue Yes Advanced 697.69 DECEASED 9
51 06-0007-11 Female 51 NO NO NO Tongue Yes Advanced 42.03 ALIVE 12
52 06-0031-11 Female 64 NO YES YES Non tongue Yes Advanced 239.01 DECEASED 2
53 04-0007-08 Female 52 NO NO NO Tongue No Early 9.98 ALIVE 48
54 04-0022-09 Female 70 NO NO NO Non tongue No Advanced 0.38 ALIVE 12
55 04-0040-10 Female 79 NO NO YES Non tongue No Early 60.98 DECEASED 18
56 04-0005-09 Female 59 NO YES YES Non tongue No Early 243.4 ALIVE 33
57 04-0026-08 Female 29 NO NO NO Tongue Yes Advanced 4.71 DECEASED 32
58 04-0008-10 Male 62 YES NO NO Tongue Yes Advanced 4.22 ALIVE 33
59 04-0013-11 Female 65 NO NO YES Non tongue Yes Advanced 12.8 ALIVE 19
60 04-0002-10 Male 66 NO NO NO Non tongue Yes Advanced 349.87 DECEASED 12
61 11-0004-07 Female 58 NO NO YES Tongue No Advanced 1759.66 DECEASED 11
62 11-0010-10 Female 35 NO NO NO Tongue No Early 275.33 ALIVE 30
63 11-0013-10 Male 58 YES YES NO Non tongue No Advanced 31.51 ALIVE 28
64 11-0015-10 Female 59 YES NO NO Non tongue No Advanced 19.61 ALIVE 26
65 11-0018-10 Female 46 YES YES NO Non tongue Yes Advanced 2239.82 DECEASED 29
66 01-0009-11 Female 61 NO NO NO Non tongue Yes Advanced 596.09 DECEASED 12
67 01-0018-11 Male 69 NO NO NO Non tongue No Advanced 152.2 ALIVE .
68 04-0008-09 Female . YES NO NO Non tongue No Advanced 52.64 ALIVE .
21
5

215
APPENDIX F: CLINICO-PATHOLOGICAL PARAMETERS AND SOCIO-DEMOGRAPHIC DATA OF THE 68 PATIENTS
FOR ISG15 GENE EXPRESSION QPCR STUDY
NO IRPA GENDER AGE SMOKE DRINK CHEW TUMOR
SUBSITE LNM
TUMOUR
STAGE ALIVE/ DEATH MONTHS RQ ISG15
1 01-0023-09-1 Male 42 YES NO NO Tongue No Early ALIVE 22 18.52
2 06-0012-08-1 Male 47 YES NO NO Tongue No Early ALIVE 39 19.12
3 01-0048-07-1 Male 71 YES NO NO Tongue
Advanced DECEASED 5 271.09
4 04-0021-08-1 Female 45 NO NO NO Tongue No Early LOF 6 2.5
5 01-0006-09-1 Male 52 YES NO NO Tongue No Early ALIVE 31 26.14
6 04-0017-09-1 Male 30 NO NO NO Tongue Yes Advanced DECEASED 13 85.7
7 11-0005-07-1 Male 34 YES NO NO Tongue Yes Advanced DECEASED 13 1.44
8 04-0021-06-1 Male 48 YES NO NO Tongue Yes Advanced DECEASED 1 36.21
9 11-0039-05-1 Female 52 NO NO YES Tongue Yes Advanced DECEASED 1 52.32
10 01-0046-05-1 Male 45 NO YES NO Tongue Yes Advanced DECEASED 9 9.1
11 04-0014-09-1 Female 37 NO NO NO Tongue No Early LOF 15 7.98
12 01-0028-09-1 Female 44 YES YES NO Tongue Yes Advanced DECEASED 10 13.79
13 04-0006-10-1 Male 36 YES YES NO Tongue No Early ALIVE 12 6.82
14 06-0030-10-1 Female 53 NO NO YES Tongue Yes Advanced DECEASED 8 1.45
15 04-0032-10-1 Female 86 NO NO YES Tongue No Early ALIVE 18 54.44
16 04-0013-08-1 Female 62 NO NO YES Tongue Yes Advanced LOF 6 371.93
17 01-0011-10 Female 63 NO NO NO Tongue Yes Advanced DECEASED 6 65.35
18 01-0024-10 Male 29 YES NO NO Tongue No Early ALIVE 14 23.93
19 01-0025-12 Male 62 YES YES NO Tongue Yes Advanced ALIVE 7 4.55
20 06-0012-08 Male 47 YES NO NO Tongue No Early ALIVE 39 23.13
21 06-0010-09 Female 73 NO YES YES Tongue Yes Advanced LOF 5 5.4
22 06-0005-09 Female 49 NO NO YES Tongue No Early ALIVE 27 101.77
21
6

216
NO IRPA GENDER AGE SMOKE DRINK CHEW TUMOR
SUBSITE LNM
TUMOUR
STAGE ALIVE/ DEATH MONTHS RQ ISG15
23 06-0018-10 Male 56 YES YES NO Tongue Yes Advanced ALIVE 31 37.06
24 06-0011-11 Male 48 YES YES YES Tongue Yes Advanced DECEASED 11 28.36
25 06-0007-11 Female 51 NO NO NO Tongue Yes Advanced ALIVE 12 223.75
26 04-0007-08 Female 52 NO NO NO Tongue No Early ALIVE 48 3.05
27 04-0026-08 Female 29 NO NO NO Tongue Yes Advanced DECEASED 32 15.48
28 04-0008-10 Male 62 YES NO NO Tongue Yes Advanced ALIVE 33 1.65
29 11-0004-07 Female 58 NO NO YES Tongue No Advanced DECEASED 11 18.37
30 11-0010-10 Female 35 NO NO NO Tongue No Early ALIVE 30 22.21
31 01-0005-09-1 Female 71 NO NO NO Non tongue No Advanced ALIVE 24 2.68
32 06-0029-08-1 Female 86 YES NO NO Non tongue Yes Advanced DECEASED 8 0.8
33 01-0004-09-1 Female 75 NO NO YES Non tongue No Advanced ALIVE 14 56.82
34 01-0036-08-1 Female 63 NO YES YES Non tongue Yes Advanced ALIVE 42 237.74
35 01-0002-10-1 Male 72 NO NO YES Non tongue No Advanced LOF 9 19.54
36 06-0005-10-1 Female 63 NO YES YES Non tongue No Early DECEASED 3 37.88
37 06-0027-09-1 Male 62 NO YES YES Non tongue Yes Advanced DECEASED 4 11.73
38 01-0022-07-1 Male 49 YES NO NO Non tongue No Advanced LOF 39 17.11
39 01-0024-08-1 Female 61 NO NO YES Non tongue Yes Advanced ALIVE 33 48.52
40 01-0007-09-1 Female 61 NO NO YES Non tongue Yes Advanced LOF 3 21.68
41 04-0019-05-1 Female 55 NO NO YES Non tongue No Early LOF 52 0.42
42 04-0014-08-1 Male 60 YES NO NO Non tongue Yes Advanced ALIVE 40 3.68
43 11-0002-08 Female 71 NO NO YES Non tongue No Early DECEASED 12 114.19
44 01-0058-07 Female 66 YES YES NO Non tongue No Early ALIVE 35 103.72
45 01-0107-08 Female 65 YES NO NO Non tongue No Advanced DECEASED 15 1.32
46 01-0106-08 Male 20 NO YES NO Non tongue Yes Advanced DECEASED 12 4.51
21
7

217
NO IRPA GENDER AGE SMOKE DRINK CHEW TUMOR
SUBSITE LNM
TUMOUR
STAGE ALIVE/ DEATH MONTHS RQ ISG15
47 01-0022-10 Female 51 NO NO NO Non tongue Yes Advanced DECEASED 9 12.9
48 01-0005-12 Female 49 NO NO NO Non tongue Yes Advanced DECEASED 1 41.34
49 01-0019-10 Female 76 NO NO YES Non tongue No Early ALIVE 24 31.51
50 01-0012-11 Female 57 NO NO NO Non tongue No Early ALIVE 17 89.17
51 06-0032-08 Male 48 YES NO YES Non tongue Yes Advanced DECEASED 8 2.53
52 06-0033-10 Female 72 NO NO YES Non tongue Yes Advanced DECEASED 6 208.16
53 06-0055-10 Female 60 NO YES YES Non tongue No Early ALIVE 25 139.18
54 06-0002-11 Female 75 NO NO YES Non tongue Yes Advanced DECEASED 1 29.99
55 06-0028-11 Female 71 NO NO YES Non tongue No Early ALIVE 18 28.73
56 06-0009-11 Female 41 NO NO YES Non tongue Yes Advanced DECEASED 9 29.25
57 06-0031-11 Female 64 NO YES YES Non tongue Yes Advanced DECEASED 2 40.5
58 04-0022-09 Female 70 NO NO NO Non tongue No Advanced ALIVE 12 1.46
59 04-0040-10 Female 79 NO NO YES Non tongue No Early DECEASED 18 3.79
60 04-0005-09 Female 59 NO YES YES Non tongue No Early ALIVE 33 25.09
61 04-0013-11 Female 65 NO NO YES Non tongue Yes Advanced ALIVE 19 5.43
62 04-0002-10 Male 66 NO NO NO Non tongue Yes Advanced DECEASED 12 1.92
63 11-0013-10 Male 58 YES YES NO Non tongue No Advanced ALIVE 28 16.81
64 11-0015-10 Female 59 YES NO NO Non tongue No Advanced ALIVE 26 3.57
21
8

219
APPENDIX G: DETAIL OF REVERSE TRANSCRIPTION CDNA SYNTHESIS
PROTOCOL
cDNA was synthesized using High Capacity cDNA Reverse Transcription Kit (Applied
Biosystems, USA). Total of 2 µg pf total extracted RNA were adjusted into final volume of
50 µl with nuclease free water and mixed with 50 µl 2X reverse transcription (RT) master
mix. The reverse transcription master mix was set-up as follows:
Reverse transcription PCR ingredients.
Component Volume/Reaction (µl)
10 X RT buffer 10
25 X dNTPs mix (100 mM) 4
10 X RT random primers 10
MultiScribeTM RT (50U/µl) 5
Nuclease free water 21
Total per reaction 50
Reverse transcription was performed by setting the thermal cycler conditions as below:
Reverse transcription PCR conditions.
Step 1 Step 2 Step 3 Step 4
Temperature (º C) 25 37 85 4
Time 10 min 120 min 5 sec ∞

220
APPENDIX H: CLINICO-PATHOLOGICAL PARAMETERS AND SOCIO-DEMOGRAPHIC DATA OF THE OSCC PATIENTS
FOR MMP13 PROTEIN EXPRESSION IHC STUDY
NO BLOCK AGE GENDER SMOKE DRINK CHEW TUMOR
SUBSITE
TUMOR
SIZES LNM
TUMOUR
STAGE
EARLY/
ADVANCED POI DIFFERENTIATION
ALIVE/
DEAD MONTHS
MMP13
SCORE
1 D119/06 61 Female Yes No No Buccal 2 no 2 Early stage Non-
cohesive Well Dead 15 7
2 D137/04 70 Female Yes No No Buccal 2 no 3 Late stage Non-
cohesive Mod Dead 21 4
3 D142/09 49 Female Yes No No Tongue 1 no 1 Early stage Non-
cohesive Mod Alive 35 6
4 D139/04 60 Female Yes No No Buccal/Palate 4 yes 4 Late stage Non-
cohesive Well Dead 21 7.67
5 D139/05 70 Female Yes No No Buccal/Gum 4 yes 4 Late stage Non-
cohesive Mod Dead 66 4.67
6 D146/08 49 Male No Yes No Tongue 1 no 1 Early stage Non-
cohesive Well Alive 47 3.33
7 D150/08 80 Male No Yes Yes Tongue 1 no 1 Early stage Non-
cohesive Mod Dead 24 2
8 D164/04 72 Male No No Yes Tongue 2 no 2 Early stage Non-
cohesive Mod Dead 19 5
9 D406/07 74 Female No No Yes Gum 4 yes 4 Late stage Non-
cohesive Well Dead 7 5.33
10 D193/08 66 Female Yes No Yes Buccal 2 no 2 Early stage Non-
cohesive Well Alive 47 6.67
11 D212/05 59 Female Yes No No Buccal 4 yes 4 Late stage Non-
cohesive Well Dead 26 6
12 D75/08 70 Female No No No Buccal 4 yes 4 Late stage Non-
cohesive Mod Dead 19 6
13 D250/05 76 Male No No Yes Tongue 1 no 1 Early stage Non-
cohesive Mod Alive 80 4
14 D264/06 63 Female No No No Tongue 1 no 4 Late stage Non-
cohesive Mod Dead 12 5.33
15 D268/08 44 Male Yes No No Gum 4 yes 4 Late stage Non-
cohesive Well Dead 12 4.33
16 D287/07 49 Female No No No Tongue 3 no 3 Late stage Non-
cohesive Mod Alive 57 4.67
17 D335/03 55 Male No No No Buccal 1 no 1 Early stage Cohesive Mod Dead 38 3.33
18 D373/09 67 Male No Yes Yes Tongue 2 no 2 Early stage Non-
cohesive Mod Alive 53 2.67
19 D379/04 64 Male Yes No Yes Lip 1 no 1 Early stage Non-
cohesive Well Alive 92 5.33
20 D388/08 56 Female Yes No Yes Buccal 3 no 4 Late stage Non-
cohesive Mod Dead 37 4
21 D390/06 58 Female Yes No No Mandible 1 no 1 Early stage Cohesive Well Alive 65 3.33
22 D393/07 50 Male No No Yes Tongue 4 yes 4 Late stage Non-
cohesive Mod Alive 55 3.33
23 D410/07 60 Female Yes No No Tongue 2 no 4 Late stage Non-
cohesive Well Dead 3 5.33
24 D422/04 41 Male No Yes No Gum, Buccal 2 no 4 Late stage Non-
cohesive Mod Alive 89 7.67
22
0

221
NO BLOCK AGE GENDER SMOKE DRINK CHEW TUMOR
SUBSITE
TUMOR
SIZES LNM
TUMOUR
STAGE
EARLY/
ADVANCED POI DIFFERENTIATION
ALIVE/
DEAD MONTHS
MMP13
SCORE
25 D422/05 28 Female No No No Tongue 1 no 1 Early stage Cohesive Well Alive 76 2.67
26 D442/06 66 Female Yes No No Gum 4 yes 4 Late stage Cohesive Well Dead 60 6.67
27 D48/06 59 Female Yes No Yes Buccal 2 no 4 Late stage Non-
cohesive Mod Alive 43 6.67
28 D508/07 41 Female No No No Tongue 2 no 3 Late stage Non-
cohesive Mod Dead 17 7
29 D525/06 61 Female Yes No No Buccal 2 no 2 Early stage Non-
cohesive Well Dead 9 5
30 D67/07 49 Male No Yes Yes Tongue 1 no 1 Early stage Cohesive Well Alive 15 5
31 D68/05 67 Female Yes No No Buccal 4 yes 4 Late stage Non-
cohesive Well Dead 10 5
32 D184/07 67 Male No No No Gum 4 yes 4 Late stage Non-
cohesive Mod Dead 4 4
33 D146/04 80 Female Yes No Yes Gum 4 yes 4 Late stage Cohesive Well Alive 93 3.33
34 D517/04 70 Female Yes No No Buccal 3 no 3 Late stage Non-
cohesive Mod Alive 20 7.67
35 D273/06 49 Female Yes No No Buccal 4 yes 4 Late stage Cohesive Mod Alive 67 8.33
36 D498/06 58 Female Yes No No Gum 3 no 4 Late stage Non-
cohesive Well Dead 5 6.33
37 D158/10 53 Male No Yes Yes Tongue 2 no 4 Late stage Non-
cohesive Mod Dead 13 4
38 D353/09 62 Male Yes No Yes Buccal 4 yes 4 Late stage Non-
cohesive Mod Dead 10 8
39 D366/06 67 Female Yes No Yes Buccal 1 no 4 Late stage Non-
cohesive Well Alive 65 2.67
40 D226/10 59 Female Yes No No Buccal 4 yes 4 Late stage Non-
cohesive Mod Dead 21 8
41 D419/08 48 Male No Yes Yes FOM 4 yes 4 Late stage Non-
cohesive Well Dead 6 5.33
42 D553/10 49 Female Yes No No Buccal 1 no 3 Late stage Non-
cohesive Mod Alive 16 2
43 D113/04 66 Female Yes No No Buccal 4 yes 4 Late stage Non-
cohesive Mod Dead 77 4.67
44 D210/05 36 Male No Yes No Gum 4 yes 4 Late stage Non-
cohesive Mod Dead 8 3
45 D304/09 60 Female Yes No No Tongue 2 no 4 Late stage Non-
cohesive Mod Dead 6 4.67
46 D48/05 50 Male Yes No No Buccal 4 yes 4 Late stage Non-
cohesive Well Alive 75 6.67
47 D474/04 50 Female Yes No No Buccal 2 no 3 Late stage Non-
cohesive Mod Dead 44 7.67
48 D601/08 56 Male No Yes Yes Buccal 2 no 2 Early stage Non-
cohesive Well Alive 38 1.67
22
1
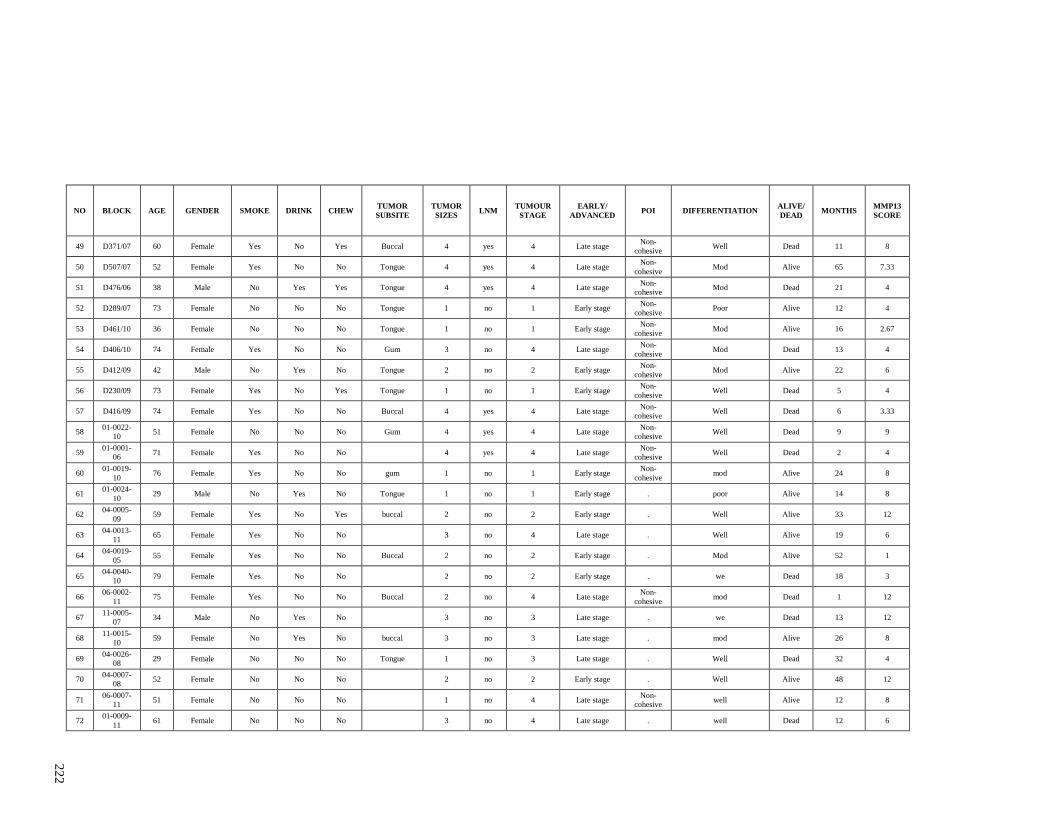
222
NO BLOCK AGE GENDER SMOKE DRINK CHEW TUMOR
SUBSITE
TUMOR
SIZES LNM
TUMOUR
STAGE
EARLY/
ADVANCED POI DIFFERENTIATION
ALIVE/
DEAD MONTHS
MMP13
SCORE
49 D371/07 60 Female Yes No Yes Buccal 4 yes 4 Late stage Non-
cohesive Well Dead 11 8
50 D507/07 52 Female Yes No No Tongue 4 yes 4 Late stage Non-
cohesive Mod Alive 65 7.33
51 D476/06 38 Male No Yes Yes Tongue 4 yes 4 Late stage Non-
cohesive Mod Dead 21 4
52 D289/07 73 Female No No No Tongue 1 no 1 Early stage Non-
cohesive Poor Alive 12 4
53 D461/10 36 Female No No No Tongue 1 no 1 Early stage Non-
cohesive Mod Alive 16 2.67
54 D406/10 74 Female Yes No No Gum 3 no 4 Late stage Non-
cohesive Mod Dead 13 4
55 D412/09 42 Male No Yes No Tongue 2 no 2 Early stage Non-
cohesive Mod Alive 22 6
56 D230/09 73 Female Yes No Yes Tongue 1 no 1 Early stage Non-
cohesive Well Dead 5 4
57 D416/09 74 Female Yes No No Buccal 4 yes 4 Late stage Non-
cohesive Well Dead 6 3.33
58 01-0022-
10 51 Female No No No Gum 4 yes 4 Late stage
Non-
cohesive Well Dead 9 9
59 01-0001-
06 71 Female Yes No No
4 yes 4 Late stage
Non-
cohesive Well Dead 2 4
60 01-0019-
10 76 Female Yes No No gum 1 no 1 Early stage
Non-
cohesive mod Alive 24 8
61 01-0024-
10 29 Male No Yes No Tongue 1 no 1 Early stage . poor Alive 14 8
62 04-0005-
09 59 Female Yes No Yes buccal 2 no 2 Early stage . Well Alive 33 12
63 04-0013-
11 65 Female Yes No No
3 no 4 Late stage . Well Alive 19 6
64 04-0019-
05 55 Female Yes No No Buccal 2 no 2 Early stage . Mod Alive 52 1
65 04-0040-
10 79 Female Yes No No
2 no 2 Early stage . we Dead 18 3
66 06-0002-
11 75 Female Yes No No Buccal 2 no 4 Late stage
Non-
cohesive mod Dead 1 12
67 11-0005-
07 34 Male No Yes No
3 no 3 Late stage . we Dead 13 12
68 11-0015-
10 59 Female No Yes No buccal 3 no 3 Late stage . mod Alive 26 8
69 04-0026-
08 29 Female No No No Tongue 1 no 3 Late stage . Well Dead 32 4
70 04-0007-
08 52 Female No No No
2 no 2 Early stage . Well Alive 48 12
71 06-0007-
11 51 Female No No No
1 no 4 Late stage
Non-
cohesive well Alive 12 8
72 01-0009-
11 61 Female No No No
3 no 4 Late stage . well Dead 12 6
22
2

223
NO BLOCK AGE GENDER SMOKE DRINK CHEW TUMOR
SUBSITE
TUMOR
SIZES LNM
TUMOUR
STAGE
EARLY/
ADVANCED POI DIFFERENTIATION
ALIVE/
DEAD MONTHS
MMP13
SCORE
73 01-0025-
12 62 Male No Yes Yes
1 no 4 Late stage
Non-
cohesive mod Alive 7 12
74 01-0002-
10 72 Male Yes No No buccal 4 yes 4 Late stage . Well Alive 9 2
75 01-0003-
10 57 Female Yes No No
2 . 2 Early stage . WELL Alive 36 8
76 01-0023-
08 80 Male No Yes Yes
1 . 1 Early stage
Non-
cohesive MOD Dead 24 9
77 01-0024-
08 61 Female Yes No No
2 . 4 Late stage Cohesive MOD Alive 57 6
78 01-0106-
08 20 Male No No Yes
4 . 4 Late stage .
Dead 12 4
79 04-0026-
08 29 Female No No No
1 . 4 Late stage . WELL Dead 32 6
80 01-0026-
06 58 Female No Yes Yes BUCCAL 1 . 1 Early stage . WELL Alive 77 6
81 01-0043-
11 63 Female Yes No No GUM 3 . 3 Late stage
Non-
cohesive MOD Alive 23 9
82 11-0008-
10 58 Male No Yes No BU 3 . 4 Late stage .
Dead 11 4
83 11-0049-
11 37 Male No No No
4 . 4 Late stage .
Alive 15 4
84 D184/07 67 Male No No No gum 4 yes 4 Late stage Non-
cohesive Mod Dead 3 12
85 D265/10 77 Female No No Yes Tongue 1 no 1 Early stage Cohesive Mod Alive 27 6
86 D375/10 56 Female Yes No No gum 4 yes 4 Late stage Cohesive mod Dead 10 6.67
87 D382/07 88 Male Yes No No Cheek 2 no 2 Early stage Non-
cohesive Poor Alive 48 3
88 D406/04 60 Female No No No Buccal 2 no 2 Early stage Non-
cohesive Mod Dead 20 4.5
89 D418/08 53 Male Yes No Yes Tongue 1 no 1 Early stage Cohesive Well Alive 54 3
90 D62/06 72 Female Yes No No Buccal 1 no 1 Early stage Cohesive Well Alive 59 8
91 D93/07 74 Female Yes No No Cheek 1 . 1 Early stage Non-
cohesive WELL Dead 31 6
92 D106/07 52 Male No Yes Yes Tongue 4 . 4 Late stage Non-
cohesive Mod Dead 1 6
93 D182/07 65 Female Yes No No TONGUE 1 . . Late stage . WWEL Dead 1 7
94 D194/07 77 Female No No No BM . . . . .
Dead 11 7
95 D198/10 38 Male No No No TONGUE 1 no 1 Early stage Non-
cohesive MOD Alive 12 8
96 D356/10 89 Female Yes No Yes GUM . . . . Non-
cohesive MOD Alive . 5.33
22
3

224
NO BLOCK AGE GENDER SMOKE DRINK CHEW TUMOR
SUBSITE
TUMOR
SIZES LNM
TUMOUR
STAGE
EARLY/
ADVANCED POI DIFFERENTIATION
ALIVE/
DEAD MONTHS
MMP13
SCORE
97 D419/07 66 Female No Yes Yes BM 2 no 2 Early stage Non-
cohesive WELL Alive 45 2
98 D426/10 49 Female Yes No No LIP 2 no 2 Early stage Non-
cohesive MOD Alive 15 3.33
99 D446/10 72 Female Yes No No BM 4 yes 4 Late stage Non-
cohesive MOD Dead 9 4
100 D493/10 49 Female Yes No No LIP 2 no 2 Early stage Cohesive MOD Alive 29 4.5
101 D426/07 65 Male No Yes Yes FOM 1 no 4 Late stage Non-
cohesive MOD Dead 38 5
102 D607/10 52 Female No No No TONUE 4 yes 4 Late stage Non-
cohesive MOD Dead 13 3.7
103 D609/10 56 Male No Yes Yes FOM 1 no 4 Late stage Non-
cohesive MOD Alive 18 5.33
22
4

225
APPENDIX I: CLINICO-PATHOLOGICAL PARAMETERS AND SOCIO-DEMOGRAPHIC DATA OF THE OSCC PATIENTS
FOR ISG15 PROTEIN EXPRESSION IHC STUDY
NO BLOCK AGE GENDER SMOKE DRINK CHEW TUMOR
SUBSITE
TUMOR
SIZES LNM
TUMOR
STAGE
EARLY/
ADVANCED POI DIFFERENTIATION
ALIVE/
DEAD MONTHS
ISG15
SCORE
1 D119/06 61 Female Yes No No Buccal 2 no 2 Early stage Non-cohesive well Dead 15 10
2 D137/04 70 Female Yes No No Buccal 2 no 3 Late stage Non-cohesive poor and moderate Dead 21 9
3 D142/09 49 Female Yes No No Tongue 1 no 1 Early stage Non-cohesive poor and moderate Alive 35 9
4 D139/04 60 Female Yes No No Buccal/Palate 4 yes 4 Late stage Non-cohesive well Dead 21 4
5 D139/05 70 Female Yes No No Buccal/Gum 4 yes 4 Late stage Non-cohesive poor and moderate Dead 66 6
6 D146/08 49 Male No Yes No Tongue 1 no 1 Early stage Non-cohesive well Alive 47 9
7 D150/08 80 Male No Yes Yes Tongue 1 no 1 Early stage Non-cohesive poor and moderate Dead 24 1.5
8 D164/04 72 Male No No Yes Tongue 2 no 2 Early stage Non-cohesive poor and moderate Dead 19 1
9 D406/07 74 Female No No Yes Gum 4 yes 4 Late stage Non-cohesive well Dead 7 6.67
10 D193/08 66 Female Yes No Yes Buccal 2 no 2 Early stage Non-cohesive well Alive 47 1
11 D212/05 59 Female Yes No No Buccal 4 yes 4 Late stage Non-cohesive well Dead 26 7
12 D75/08 70 Female No No No Buccal 4 yes 4 Late stage Non-cohesive poor and moderate Dead 19 5.33
13 D250/05 76 Male No No Yes Tongue 1 no 1 Early stage Non-cohesive poor and moderate Alive 80 3
14 D268/08 44 Male Yes No No Gum 4 yes 4 Late stage Non-cohesive well Dead 12 5.67
15 D287/07 49 Female No No No Tongue 3 no 3 Late stage Non-cohesive poor and moderate Alive 57 12
16 D335/03 55 Male No No No Buccal 1 no 1 Early stage Cohesive poor and moderate Dead 38 3.33
17 D373/09 67 Male No Yes Yes Tongue 2 no 2 Early stage Non-cohesive poor and moderate Alive 53 3
18 D379/04 64 Male Yes No Yes Lip 1 no 1 Early stage Non-cohesive well Alive 92 3.33
19 D388/08 56 Female Yes No Yes Buccal 3 no 4 Late stage Non-cohesive poor and moderate Dead 37 1
20 D390/06 58 Female Yes No No Mandible 1 no 1 Early stage Cohesive well Alive 65 1
21 D393/07 50 Male No No Yes Tongue 4 yes 4 Late stage Non-cohesive poor and moderate Alive 55 3.67
22 D410/07 60 Female Yes No No Tongue 2 no 4 Late stage Non-cohesive well Dead 3 4.67
23 D422/04 41 Male No Yes No Gum, Buccal 2 no 4 Late stage Non-cohesive poor and moderate Alive 89 4.5
24 D422/05 28 Female No No No Tongue 1 no 1 Early stage Cohesive well Alive 76 3.33
22
5

226
NO BLOCK AGE GENDER SMOKE DRINK CHEW TUMOR
SUBSITE
TUMOR
SIZES LNM
TUMOR
STAGE
EARLY/
ADVANCED POI DIFFERENTIATION
ALIVE/
DEAD MONTHS
ISG15
SCORE
25 D442/06 66 Female Yes No No Gum 4 yes 4 Late stage Cohesive well Dead 60 3.33
26 D48/06 59 Female Yes No Yes Buccal 2 no 4 Late stage Non-cohesive poor and moderate Alive 43 7.33
27 D508/07 41 Female No No No Tongue 2 no 3 Late stage Non-cohesive poor and moderate Dead 17 9
28 D525/06 61 Female Yes No No Buccal 2 no 2 Early stage Non-cohesive well Dead 9 11
29 D67/07 49 Male No Yes Yes Tongue 1 no 1 Early stage Cohesive well Alive 15 3.67
30 D68/05 67 Female Yes No No Buccal 4 yes 4 Late stage Non-cohesive well Dead 10 2
31 D184/07 67 Male No No No Gum 4 yes 4 Late stage Non-cohesive poor and moderate Dead 4 2.33
32 D146/04 80 Female Yes No Yes Gum 4 yes 4 Late stage Cohesive well Alive 93 1.5
33 D517/04 70 Female Yes No No Buccal 3 no 3 Late stage Non-cohesive poor and moderate Alive 88 3
34 D273/06 49 Female Yes No No Buccal 4 yes 4 Late stage Cohesive poor and moderate Alive 67 5
35 D498/06 58 Female Yes No No Gum 3 no 4 Late stage Non-cohesive well Dead 5 3.33
36 D158/10 53 Male No Yes Yes Tongue 2 no 4 Late stage Non-cohesive poor and moderate Dead 13 5.67
37 D353/09 62 Male Yes No Yes Buccal 4 yes 4 Late stage Non-cohesive poor and moderate Dead 10 4
38 D366/06 67 Female Yes No Yes Buccal 1 no 4 Late stage Non-cohesive well Alive 65 3
39 D226/10 59 Female Yes No No Buccal 4 yes 4 Late stage Non-cohesive poor and moderate Dead 21 5
40 D419/08 48 Male No Yes Yes FOM 4 yes 4 Late stage Non-cohesive well Dead 6 1.33
41 D553/10 49 Female Yes No No Buccal 1 no 3 Late stage Non-cohesive poor and moderate Alive 16 3.33
42 D113/04 66 Female Yes No No Buccal 4 yes 4 Late stage Non-cohesive poor and moderate Dead 77 4
43 D210/05 36 Male No Yes No Gum 4 yes 4 Late stage Non-cohesive poor and moderate Dead 8 1
44 D304/09 60 Female Yes No No Tongue 2 no 4 Late stage Non-cohesive poor and moderate Dead 6 4
45 D48/05 50 Male Yes No No Buccal 4 yes 4 Late stage Non-cohesive well Alive 75 1
46 D474/04 50 Female Yes No No Buccal 2 no 3 Late stage Non-cohesive poor and moderate Dead 44 7
47 D601/08 56 Male No Yes Yes Buccal 2 no 2 Early stage Non-cohesive well Alive 38 2
48 D50707 52 Female Yes No No Tongue 4 yes 4 Late stage Non-cohesive poor and moderate Alive 65 9
22
6

227
NO BLOCK AGE GENDER SMOKE DRINK CHEW TUMOR
SUBSITE
TUMOR
SIZES LNM
TUMOR
STAGE
EARLY/
ADVANCED POI DIFFERENTIATION
ALIVE/
DEAD MONTHS
ISG15
SCORE
49 D476/06 38 Male No Yes Yes Tongue 4 yes 4 Late stage Non-cohesive poor and moderate Dead 21 4
50 D289/07 73 Female No No No Tongue 1 no 1 Early stage Non-cohesive poor and moderate Alive 12 2
51 D461/10 36 Female No No No Tongue 1 no 1 Early stage Non-cohesive poor and moderate Alive 16 3
52 D406/10 74 Female Yes No No Gum 3 no 4 Late stage Non-cohesive poor and moderate Dead 13 6
53 D412/09 42 Male No Yes No Tongue 2 no 2 Early stage Non-cohesive poor and moderate Alive 22 3
22
7

228
APPENDIX J: DEMOGRAPHICS AND CLINICO-PATHOLOGICAL CHARACTERISTICS OF PATIENTS FROM WHICH
THE CELL LINES USED IN THIS STUDY WERE DERIVED.
Cell lines Age Gender Broader’s Differentiation TNMa
Stage Tumor subsite Risk habits
ORL-48T 79 Female Well 4 2 0 IV Gum None
ORL-188T 56 Male Moderate 2 2 X IV Tongue Smoking
ORL-204T 76 Male Moderate 4 1 X IV Buccal Mucosa Betel quid chewing, Smoking,
Alcohol drinking
aLargest tumour dimension and node status determined by histopathology examination.
22
8

229
APPENDIX K: ASSOCIATION OF ISG15 MRNA EXPRESSION WITH SOCIO-
DEMOGRAPHIC AND CLINICO-PATHOLOGICAL PARAMETERS
Variables Category No. of
samples
(%)
Low
expression of
ISG15
High expression
of ISG15
No. of
samples (%)
No. of samples
(%)
p value
64 38 26
Gender Male 23 (35.9) 18 (47.4) 5 (19.2) 0.021
Female 41 (64.1) 20 (52.6) 21 (80.8)
Age
(years)
< 45 12 (18.8) 10 (26.3) 2 (7.7) 0.057
≥ 45 52 (81.2) 28 (73.7) 24 (92.3)
Smoking No 42 (65.6) 21 (55.3) 21 (80.8) 0.035
Yes 22 (34.4) 17 (44.7) 5 (19.2)
Drinking No 48 (75.0) 29 (76.3) 19 (73.1) 0.769
Yes 16 (25.0) 9 (23.7) 7 (26.9)
Betel
quid
chewing
No 36 (56.3) 27 (71.1) 9 (34.6) 0.004
Yes 28 (43.8) 11 (28.9) 17 (65.4)
Tumour
site
Tongue 30 (46.9) 19 (50.0) 11 (42.3) 0.545
Non-
tongue*
34 (53.1) 19 (50.0) 15 (57.7)
Lymph
node
status
Negative 31 (48.4) 21 (55.3) 10 (38.5) 0.187
Positive 33 (51.6) 17 (44.7) 16 (61.5)
pTNM
Staging
Early stage 22 (34.4) 13 (24.2) 9 (34.6) 0.973
Advanced
stage
42 (65.6) 25 (65.8) 17 (65.4)
*Buccal mucosa, gingiva, lip, floor of mouth, palate
Significant p - value were highlighted in bold.
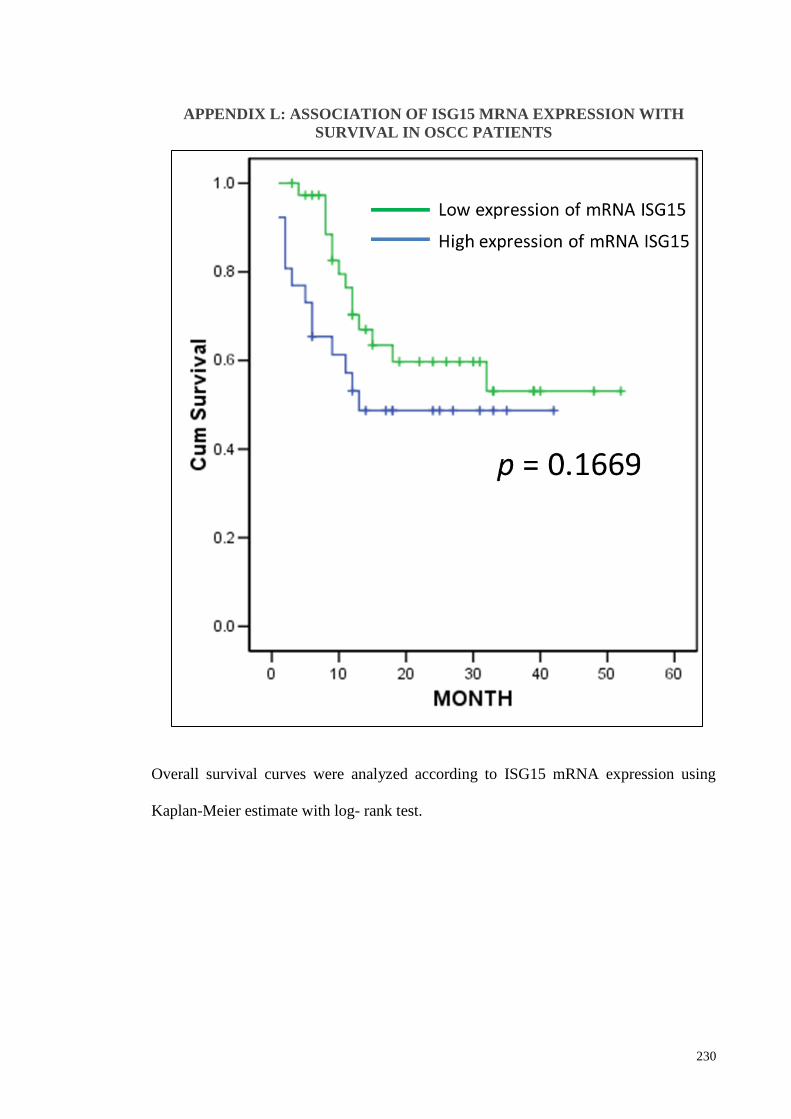
230
APPENDIX L: ASSOCIATION OF ISG15 MRNA EXPRESSION WITH
SURVIVAL IN OSCC PATIENTS
Overall survival curves were analyzed according to ISG15 mRNA expression using
Kaplan-Meier estimate with log- rank test.

231