mmfx 2 (astm a 1035, grade 100) steel rebar...
TRANSCRIPT

MMFX 2 (ASTM A 1035, GRADE 100) STEEL REBAR
CORROSION PERFORMANCE TESTING
IN ACCORDANCE WITH AASHTO MP 18M/MP 18-09
Prepared for:
MMFX Technologies Corporation
August 3, 2011 TCG # 11072
Report Prepared by:
Neal Berke, VP Materials Science
Phone | (269) 384 - 9980
3401 Midlink Drive Kalamazoo | MI | 49048
www.tourneyconsulting.com Fax | (269) 384 - 9981

Tourney Consulting Group Page 2 Project 11072
3401 Midlink Drive August 3, 2011
Kalamazoo, MI 49048 269.384.9980
Executive Summary
Tourney Consulting Group (TCG) was contracted by MMFX Technologies Corporation to evaluate the corrosion performance of MMFX 2 (ASTM A1035-Grade 100) concrete reinforcing bars according to the requirements of AASHTO Standard Specification: MP 18M/MP 18-09--Uncoated, Corrosion-Resistant, Deformed and Plain Alloy, Billet-Steel Bars for Concrete Reinforcement and Dowels. Tourney Consulting Group (TCG) is an AASHTO accredited, CCRL inspected, USACE validated testing laboratory.
The scope of the work was to perform polarization resistance and potentiodynamic polarization tests on No. 3 through No. 11 (10-36 mm) bars of MMFX 2, using a No. 4 (13 mm) ASTM A 615, Grade 60 bar for comparison.
In addition, micrographs of etched specimens were taken as an index for confirmation of the microstructure for each of the test bars.
Corrosion experiments were performed in accordance with the methods in AASHTO MP 18M/MP 18-09 Annex A A.1.5 and performance was rated in accordance with the requirements in Annex A A.1.2. All of the MMFX 2 specimens met the Polarization Resistance Test requirements of Annex A A.1.2.1. Likewise, all of the MMFX 2 specimens met the Potentiodynamic Test requirement of Annex A A.1.2.2.
Specifically Annex A A.1.2.1 requires that the ratio of the polarization resistance (Rp) measured at pH = 10 to the polarization resistance measured at pH = 13 is greater than equal to (>) 0.5. This was the case for all of the MMFX 2 bars. The comparison ASTM A 615, Grade 60 bar had a ratio under 0.1.
Annex A A.1.2.2 requires that the measured pitting potential is greater than or equal to (>) 250 mV vs. Ag/AgCl reference electrode at a [Cl-]/[OH-] ratio equal to 2. All of the MMFX 2 bars meet this requirement. The comparison ASTM A 615, Grade 60 bars did not meet this requirement.
The metallographic examination showed the Martensite, fine grain microstructure structure for the MMFX 2 bars at a 500x magnification. The etchant used for the MMFX 2 bars was ASTM E 407, Etchant No. 88 (water/HCl/HNO3), which is recommended for steel alloys with the level of chromium in MMFX 2. The A 615 No. 4 bar had a pearlite, coarser grain microstructure with ferrite at the grain boundaries. The A 615 bar was etched with ASTM E 407 Etchant 74a (Nital).
The corrosion testing and metallographic analyses show that the MMFX 2 bars meet the requirements of AASHTO MP 18M/MP 18-09, Section 11. The Professional Service Industries, Inc. test report (reference 1) documents that the MMFX 2 meets the chemical and mechanical requirements of AASHTO MP 18M/MP 18-09.

Tourney Consulting Group Page 3 Project 11072
3401 Midlink Drive August 3, 2011
Kalamazoo, MI 49048 269.384.9980
I. Introduction Tourney Consulting Group (TCG) is an AASHTO accredited, CCRL inspected, USACE validated testing laboratory. TCG was contracted by MMFX Technologies Corporation to evaluate the corrosion performance of MMFX 2 (ASTM A1035-Grade 100) concrete reinforcing bars according to the requirements of AASHTO MP 18M/MP 18-09.
This work was requested and authorized by MMFX Technologies. The scope of our work was to perform polarization resistance and potentiodynamic polarization tests on No. 3 through No. 11 (10-36 mm) bars of MMFX 2, using a No. 4 (13 mm) ASTM A 615, Grade 60 bar for comparison.
In addition, micrographs of etched specimens at 250x and 500x were taken as an index for confirmation of the microstructure for each of the test bars.
II. Chemical and Mechanical Properties: Chemical analysies of the MMFX 2 reinforcing bars were performed by Professional Service Industries, Inc.(PSI), Reference 1. Table 1 shows the chemical analyses of the MMFX 2 steel bars tested.
Table 1 AASHTO MP 18M Section 6 Chemistry Measurements. The maximum (weight %) is given except as indicated. Reported as required in Annex A A1.6.3.
Additional testing by PSI confirmed that the MMFX 2 reinforcing bars met the general requirements in Sections 7, 8, 9, 10 12, 13, and 21 of AASHTO MP 18M (reference 2).
The ASTM A 615 steel chemistry is given below in Table 2 from the Mill Test Report provided by Nucor Steel. A copy of the mill sheet with mechanical properties is attached in Appendix 1.
Table 2 Chemical Composition of Grade 60 A 615 comparator reinforcing bars. Bar Size Heat %C %Cr %Mn %Si %S %P %Cu %Ni %Mo %Al %V %N
4 (13) 782352 0.43 0.12 1.17 0.18 0.030 0.010 0.35 0.10 0.02 NR 0.004 NR
NR=Not reported.

Tourney Consulting Group Page 4 Project 11072
3401 Midlink Drive August 3, 2011
Kalamazoo, MI 49048 269.384.9980
III. Corrosion Testing
III.a. Specimen Preparation and Corrosion Cell
Comparative corrosion tests were conducted according to AASHTO MP 18—ANNEX A, using duplicate MMFX 2 test specimens for each bar size. The electrical connection to the specimens was according to Annex A A1.5.1. A typical specimen is shown in Figure 1.
Figure 1 Typical specimen prepared to 1000 grit with shrink-wrap seal.
The areas of all the specimens were measured by measuring the diameter of the specimen and averaging the exposed lengths from 4 locations. The areas are given in Table 3. The coefficient of variance for all the samples was under 4%. Note that duplicate specimens were used in all the corrosion testing. The first number refers to the bar size and the letter indicates specimen a or b. The ASTM A 615 steel comparator bar is referred to as 4-60 with an a or b as it was from a number 4 bar and is Grade 60.

Tourney Consulting Group Page 5 Project 11072
3401 Midlink Drive August 3, 2011
Kalamazoo, MI 49048 269.384.9980
Table 3 Exposed area of the specimens tested.
Specimen/Heat Number Area(cm2)
3a/021811 3.665802
3b/021811 3.547967
4a/021711 3.319046
4b/021711 3.759503
5a/021511 3.63056
5b/021511 3.641463
6a/021011 3.542237
6b/021011 3.757261
7a/020711 3.603991
7b/020711 3.852915
8a/060411 3.743249
8b/060411 3.812557
9a/060811 3.815471
9b/060811 3.672915
10a/526707 3.856035
10b/526707 3.739106
11a/409908 3.817104
11b/409908 3.620537
4‐60a/782352 3.667326
4‐60b/782352 3.79978
AVG 3.693241
SD 0.132212
Figure 2 is a photograph of the corrosion cell. A salt bridge was used to prevent contamination of the test solution from the reference electrode which was Ag/AgCl and is saturated in chloride.
Note that all cells were filled with 500 mL of the test solution to maintain over 100 mL/cm2 of solution to surface area. The counter electrode was a mixed metal oxice mesh, and a Gamry Reference 600 potentiostat was used to conduct the corrosion testing.

Tourney Consulting Group Page 6 Project 11072
3401 Midlink Drive August 3, 2011
Kalamazoo, MI 49048 269.384.9980
Figure 2 Corrosion cell setup.
Figure 2 shows a 1 L polypropylene beaker, specimen, salt bridge and Ag/AgCl reference electrode, mixed metal oxide mesh counter electrode and the Gamry Reference 600 potentiostat.
III.b. Polarization Resistance Testing
Polarization resistance testing was conducted first in a pH 13 solution and then at pH 10 in accordance with the requirements in Annex A1.5.4.1. Table 4 (reference 2) gives the compositions of the two solutions.
Table 4 Polarization Resistance Aqueous Test Solutions
pH NaOH (mol/L) Is (= ∑ ǀ ǀ) NaOH (g/L) K2SO4 (mol/L) K2SO4 (g/L)
13 0.1 0.1 4.0 - -
10 0.001 0.1 0.004 0.0333 5.8042
Note Is is the ionic strength where ci is the concentration of the ith ion and zi is the charge on the ith ion.

Tourney Consulting Group Page 7 Project 11072
3401 Midlink Drive August 3, 2011
Kalamazoo, MI 49048 269.384.9980
Figure 3 shows typical polarization resistance curves for the MMFX 2 steel samples. Note that the polarization resistance at pH 10 remains high. Figure 4 shows typical polarization resistance curves for the A 615 rebars. Note the significant decrease in polarization resistance at pH 10 indicating that the steel is no longer passive and corroding.
Figure 3a Polarization resistance of No. 11 bar “a” at pH =13.
Rp=37.17 k or 142 kcm2.
Figure 3b Polarization resistance of No. 11 bar “a” at pH =10.
Rp=87.60 k or 335 kcm2. Rp(pH 10)/Rp(pH 13) = 2.36, so it passes the requirements of being greater than 0.5.

Tourney Consulting Group Page 8 Project 11072
3401 Midlink Drive August 3, 2011
Kalamazoo, MI 49048 269.384.9980
Figure 4a Polarization resistance curve for A615 specimen “a” at pH 13.
Rp=58.70 k or 215 kcm2.
Figure 4b Polarization resistance curve for A615 specimen “a” at pH 10.
Rp=0.70 k or 2.57 kcm2. Rp(pH 10)/Rp(pH 13) = 0.01, so it fails the requirements of being greater than 0.5.
Figure 6 shows the appearance of a typical MMFX 2 specimen versus that of a A 615 specimen after removal from polarization resistance at pH 10. There is severe staining

Tourney Consulting Group Page 9 Project 11072
3401 Midlink Drive August 3, 2011
Kalamazoo, MI 49048 269.384.9980
on the A 615 and the MMFX 2 specimen has no corrosion damage. This is in agreement with the electrochemical results.
MMFX 2 A 615
Figure 6 Polarization Resistance Specimen Comparison after testing in pH 10. Highly reflective surface of MMFX 2 specimen is showing reflections of the surrounding lab. Note severe staining in A 615 specimen.
Table 5 shows the results for all of the specimens. All of the MMFX 2 steels pass the requirements in A1.12.1 with Rp(pH 10)/Rp(pH 13) > 0.5. The reference A615 reinforcing bar fails.
III.c. Potentiodynamic Experiments
In accordance with Annex A A1.5.4.2 (reference 2) potentiodynamic tests were carried out in synthetic pore water solutions as shown Table 6. One solution was without chloride and the other had a chloride-to-hydroxide ratio of 2. The curves without chloride were cyclic returning to the starting potential. Cyclic polarization was used with the chloride curves but pitting potentials are determined from the potentiodynamic portion of the curve from negative to positive potentials.
The current density information is not required to be reported but is useful as it shows 2 to 3 orders of magnitude less current density than for pitting samples of the A 615 rebar specimens at 250 mV vs. Ag/AgCl when chloride is added. A typical curve shown in Figure 7.
All of the specimens showed passive behavior in the synthetic pore water solution without chloride. At the start of the transpassive region at approximately 550 mV vs.

Tourney Consulting Group Page 10 Project 11072
3401 Midlink Drive August 3, 2011
Kalamazoo, MI 49048 269.384.9980
Saturated Ag/AgCl the anodic current densities were all under 30 A/cm2, and all the curves came back to low current densities as expected for totally passive materials. Table 5 Results from polarization resistance at pH 13 and pH 10 as required to be reported in A1.6.1. Specimens 3a-11b are MMFX 2 and 4-60a&b are A 615 rebar specimens.
Specimen/Heat Number
Polarization Resistance
pH=10 pH=13 Rp@pH=10/Rp@pH=13 Passing is > 0.5
Rp [kΩ] Rp [kΩ]
3a/021811 79.46 63.27 1.26 Pass
3b/021811 82.67 41.09 2.01 Pass
4a/021711 65.96 65.00 1.01 Pass
4b/021711 77.07 53.82 1.43 Pass
5a/021511 74.30 49.68 1.50 Pass
5b/021511 59.11 46.60 1.27 Pass
6a/021011 93.25 46.83 1.99 Pass
6b/021011 77.64 33.74 2.30 Pass
7a/020711 67.10 50.68 1.32 Pass
7b/020711 51.68 37.45 1.38 Pass
8a/060411 59.26 52.86 1.12 Pass
8b/060411 68.53 38.89 1.76 Pass
9a/060811 83.03 39.62 2.10 Pass
9b/060811 65.64 37.15 1.77 Pass
10a/526707 96.67 55.48 1.74 Pass
10b/526707 96.07 41.20 2.33 Pass
11a/409908 87.60 37.17 2.36 Pass
11b/409908 70.53 33.79 2.09 Pass
4‐60a/782352 0.70 58.70 0.01 FAIL
4‐60b/782352 0.60 40.87 0.01 FAIL
Table 6 Synthetic pore water solutions used for Potentiodynamic Tests.
[Cl-]/[OH-] KOH (mol/L)
KOH (g/L)
NaOH (mol/L)
NaOH (g/L)
[Cl-] (mol/L)
NaCl (mol/L)
NaCl (g/L)
0 0.55 30.86 0.16 6.4 0.00 0.00 0.00
2 0.55 30.86 0.16 6.4 1.42 1.42 82.98

Tourney Consulting Group Page 11 Project 11072
3401 Midlink Drive August 3, 2011
Kalamazoo, MI 49048 269.384.9980
The potentiodynamic curves with chloride at 2:1 vs. hydroxide showed that the A 615 steels had pitting potentials below 250 mV vs. Ag/AgCl so they fail. All of the MMFX 2 specimens had pitting potentials more positive than 250 mV vs. Ag/AgCl so the MMFX 2 steels pass the requirements of MP 18.
Figure 8 show photos of a MMFX 2 specimen vs. the A 615 reference. The corresponding cyclic potentiodynamic curves are shown in Figures 9 and 10.
Figure 7 Typical cyclic polarization curve in synthetic pore water. Specimen shown is MMFX 2, specimen 3a. Note curve starts at lower far right.
Figure 8 Specimens after cyclic potentiodynamic runs in synthetic pore water with chlorides. Note severe pitting in the A 615 steel is magnified due to continuing the polarization beyond the pitting potential, where corrosion rates were high.
MMFX‐2 Spec. 3b A 615 Specimen b

Tourney Consulting Group Page 12 Project 11072
3401 Midlink Drive August 3, 2011
Kalamazoo, MI 49048 269.384.9980
Figure 9 Cyclic Polariztion for MMFX 2 specimen 3b in synthetic pore water with chloride. Curve starts at far right on bottom. Curve shows passive behavior which was verified by lack of pitting in the specimen. Specimen passed the test method.
Figure 10 Cyclic Polariztion for A 615 specimen b in synthetic pore water with chloride. Curve starts at far right on bottom. Run aborted due to ultrahigh current densities on return curve. Note severe pitting initiated at 115.7 mV vs. Ag/AgCl so specimen failed.

Tourney Consulting Group Page 13 Project 11072
3401 Midlink Drive August 3, 2011
Kalamazoo, MI 49048 269.384.9980
Table 7 shows the results from the potentiondynamic testing. Some MMFX 2 specimens had pitting potentials below the the transpassive potential of 550 mV vs. Ag/AgCl, but all were above 250 mV required by the specification and thus all were passing. The current densities are shown at 250 mV vs. Ag/AgCl for the upward portion of the curves to demonstrate behavior was passive and similar to those for the passive solution without chlorides.
Table 7 Potentiodynamic Results as required to be reported in Annex A A1.6.2.
Pore Water without Cl‐
Pore Water with Cl‐
Pore Water with Cl‐
Pore Water with Cl‐
Pore Water with Cl‐
Transpassive Potential Ag/AgCl
Current density at
ETP
Pitting Potential Ag/AgCl
Current density at 250 mV*
MP 18 Requiremen
t
Pitting Potential
SHE
Specimen/ Heat Number
E [mV] I [μA/cm2] Ep [mV] I [μA/cm2] Pass is
Ep >250 mV SHE=SSC +197 mV
3a/021811 550 18.6 476.3 15.1 Pass 676.3
3b/021811 550 23.1 TP** 9.5 Pass 747
4a/021711 550 16.2 TP 10.5 Pass 747
4b/021711 550 19.6 TP 8.6 Pass 747
5a/021511 550 20.4 396.4 10.0 Pass 593.4
5b/021511 550 21.2 510.5 10.0 Pass 707.5
6a/021011 550 19.9 367.4 9.8 Pass 564.4
6b/021011 550 17.3 TP 9.0 Pass 747
7a/020711 550 19.6 TP 10.4 Pass 747
7b/020711 550 19.1 TP 10.4 Pass 747
8a/060411 550 20.8 473.5 10.8 Pass 670.5
8b/060411 550 18.1 TP 10.1 Pass 747
9a/060811 550 12.2 294.4 10.1 Pass 491.4
9b/060811 550 16.0 412.6 10.8 Pass 609.6
10a/526707 550 21.8 448.1 9.4 Pass 645.1
10b/526707 550 15.9 TP 9.6 Pass 747
11a/409908 550 17.2 276.5 8.2 Pass 473.5
11b/409908 550 17.1 401.9 11.9 Pass 598.9
4‐60a/782352 550 25.9 144.0 870.0 Fail 341
4‐60b/782352 550 23.1 115.7 101.2 Fail 312.7
*Current density at 250 mV vs. saturated Ag/AgCl reference electrode
**TP or transpassive potential is at 550 mV vs. Ag/AgCl.
SHE is the Standard Hydrogen Reference Electrode

Tourney Consulting Group Page 14 Project 11072
3401 Midlink Drive August 3, 2011
Kalamazoo, MI 49048 269.384.9980
For chloride free pore water the pitting potential and transpassive potential are the same and ETP = Ep = 550 mV vs. Sat. Ag/AgCl = 747 mV vs. Standard Hydrogen Electrode (SHE).
IV. Metallography
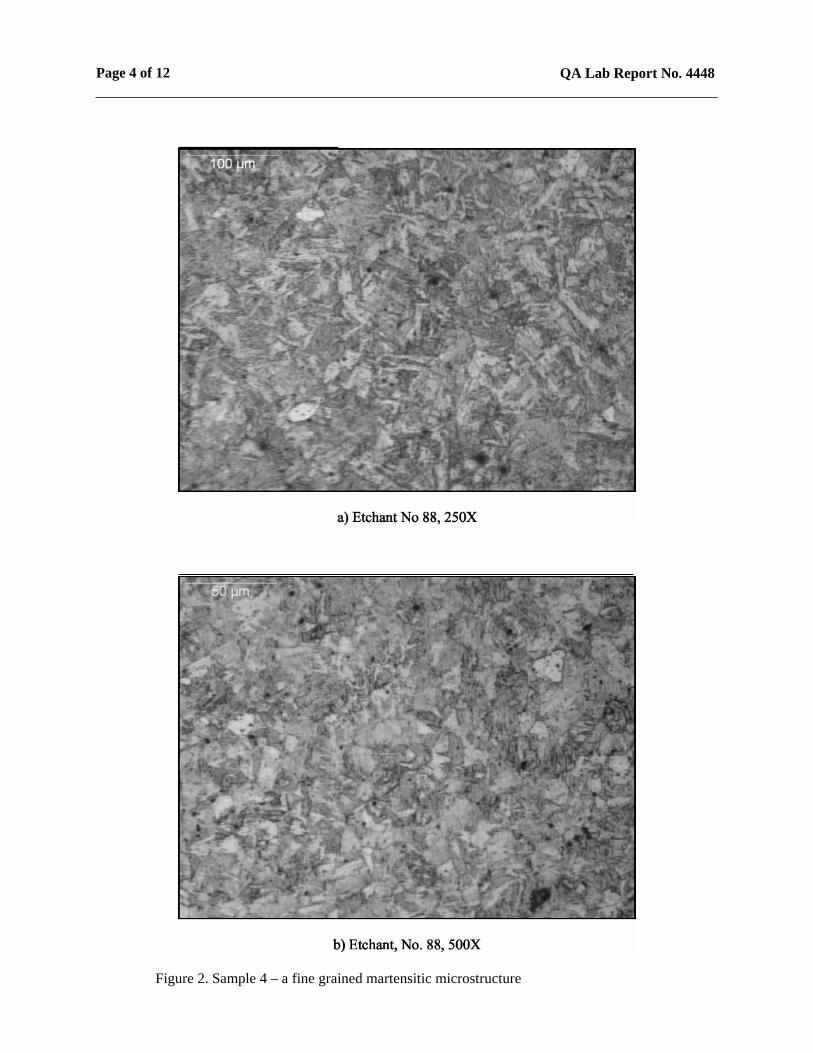
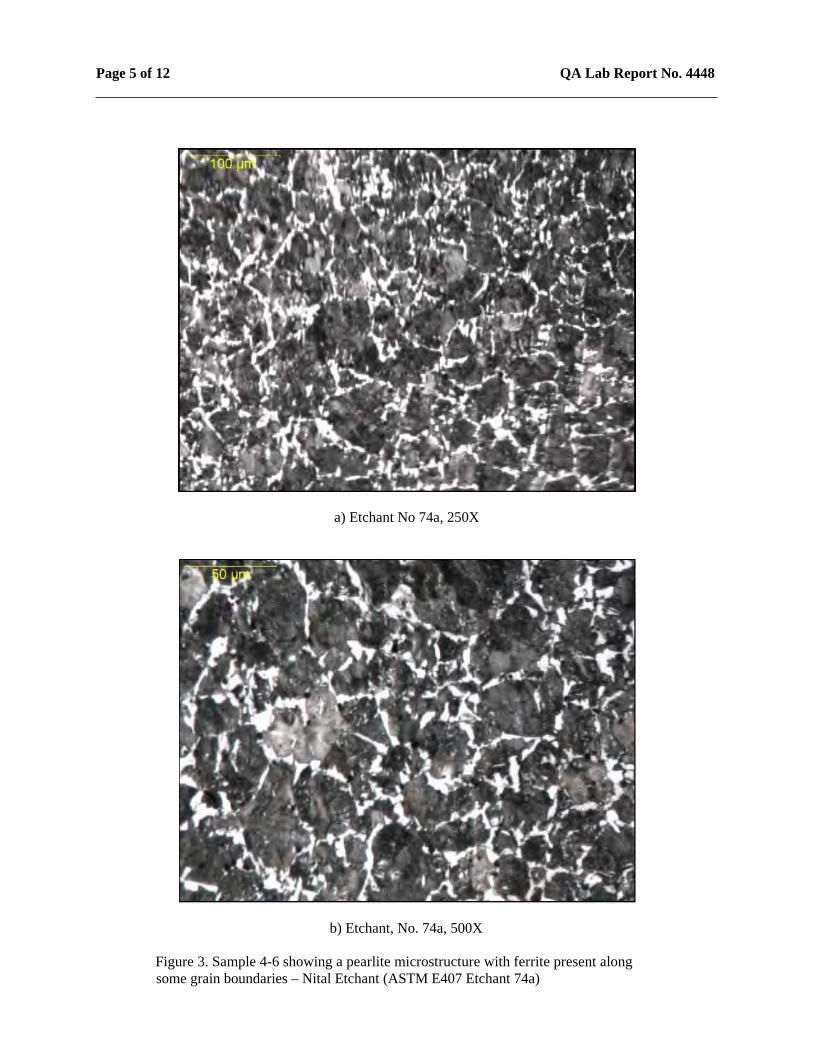
Cross sections were prepared and polished for the 9 MMFX 2 (Table 1) bars and the A 615 (Table 2 )bar. Samples were polished to a 1 micron diamond finish. ASTM E 407, etchant No. 88 (H2O/HCl/HNO3) was used for the MMFX 2 bars. The A 615 bar was etched with ASTM E 407 Etchant 74a (Nital).
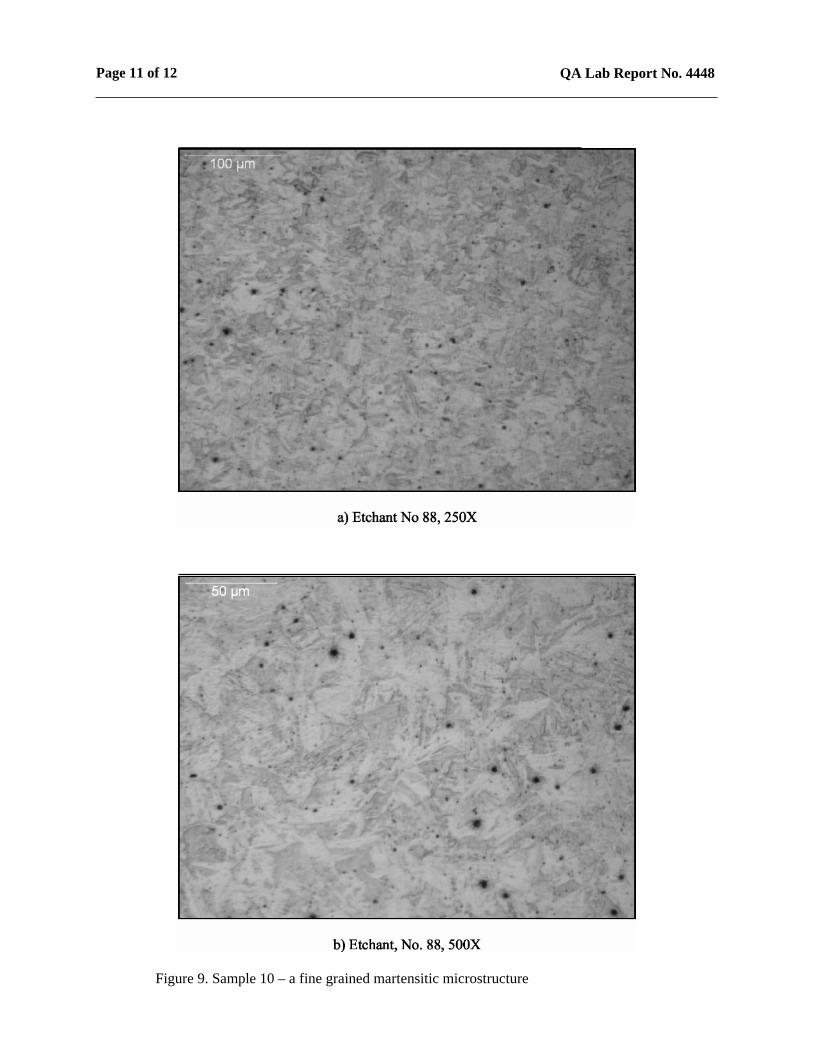
The full metallurgical report is in Appendix 2. The MMFX 2 bars have a martensitic structure, that needed a higher magnification be seen. The A 615 bar had coarse perlite grains with ferrite at some of the grain boundaries.
Summary and Conclusions
MMFX 2 steel bar sizes No. 3 thru 11 were tested in accordance with the corrosion performance requirements of AASHTO MP 18M/MP 18-09 (reference 2) as required in Section 11 as set forth in Annex A. All MMFX 2 test bars met and exceeded the corrosion test requirements of AASHTO MP 18.
The polarization resistance data as required in Annex A A1.6.1 are given in Table 5 of the report. All of the MMFX 2 bars passed the requirements. The A 615 controls did not pass.
The potentiodynamic data as required in Annex A A1.6.2 are given in Table 7. All of the MMFX 2 bars passed the requirements. The A 615 controls did not pass.
Table 1 provides the chemical constituents of the MMFX 2 bars tested as required to be reported in Annex A A1.6.3.
The metallographic photos show the martensitc structure in the MMFX 2 steel bars.
We appreciate the opportunity to provide our services to you on this project. Should you have any questions or comments regarding this report, please feel free to contact me.
Sincerely,
Neal S. Berke, Ph.D.
Vice President

Tourney Consulting Group Page 15 Project 11072
3401 Midlink Drive August 3, 2011
Kalamazoo, MI 49048 269.384.9980
References 1. Professional Services Group, Project 0689492-2a: Chemical Mechanical Analysis,
Tests and Measurements performed on Bar numers 3,4,5,6,7,8,9,10, and 11 MMFX 2 (AASHTO MP18/ASTM A 1035) grade 100 steel rebar samples, June 30, 2011.
2. AASHTO Standard Specification: MP 18M/MP 18-09 Uncoated, Corrosion-Resistant, Deformed and Plain Alloy, Billet-Steel Bars for Concrete Reinforcement and Dowels.

Tourney Consulting Group Page 16 Project 11072
3401 Midlink Drive August 3, 2011
Kalamazoo, MI 49048 269.384.9980
Appendix 1
Mill Test Report for A 615 Steel Used as the Reference

Tourney Consulting Group Page 17 Project 11072
3401 Midlink Drive August 3, 2011
Kalamazoo, MI 49048 269.384.9980
APPENDIX 2
METALLOGRAPHIC ANALYSIS

Quality Associates – Metallurgical Services
1795 Foundation Drive – Niles, MI 49120 Phone 269-695-2623 FAX 269-695-4423
Page 1 of 12 QA Lab Report No. 4448 _____________________________________________________________________________________ TO: Neal Berke 25 July 2011 Tourney Consulting Group, Ltd. 3401 Midlink Drive Kalamazoo, MI 49048 _____________________________________________________________________________________ SUBJECT: Concrete Reinforcement Bars Specification: ASTM A1035 Grade 100 rebar – 9 samples ASTM A615 Grade 60 rebar – 1 sample _____________________________________________________________________________________ OBJECT: Provide photographs and general description of the microstructure. _____________________________________________________________________________________ RECEIVED: A total of ten samples were submitted for analysis. These pieces had been pre-
cut, rough ground then finish ground using 1000 grit paper. _____________________________________________________________________________________ CONCLUSION: Results of the analysis are provided herein. _____________________________________________________________________________________ TEST DATA: Metallographic Examination per ASTM Methods
The samples were rough polished using 6µm diamond, followed by finish polishing using 1µm diamond per ASTM E3. Microstructures of the 9-10 percent chromium alloy bars, ASTM A1035 Grade 100, were revealed by using Etchant 88 per ASTM E407. The carbon steel sample, ASTM A615 Grade 60, microstructure was revealed with the use of Etchant 74a per ASTM E407. Photographs were taken of the microstructure (Figures 1 to 10) using a Unitron Versamet metallurgical microscope equipped with a digital camera employing the Pax-It software. Summary of the general observations for the microstructure are presented for comparative purposes (Table I).
_____________________________________________________________________________________ Report by: Approved by:
Matt Guisbert David A. Guisbert, P.E. _____________________________________________________________________________________ DISTRIBUTION: N. Berke ATTACHMENTS: Figures 1 to 10 Lab File 4448 Table I

Page 2 of 12 QA Lab Report No. 4448 _____________________________________________________________________________________
Table I. Summary of the Metallographic Examination
Sample Magnification
Comments 250X 500X
Sample 3 - 3/8” Diameter ASTM A1035 Grade 100
Fine Grain Martensite Structure appears to be cold
worked martensite
Sample 4 - 4/8” Diameter ASTM A1035 Grade 100
Fine Grain Martensite Structure appears to be cold
worked martensite
Sample 4-6 - 4/8” Diameter ASTM A615 Grade 60
Coarse Grain Pearlite Pearlite grains with ferrite along the grain boundaries
Sample 5 - 5/8” Diameter ASTM A1035 Grade 100
Fine Grain Martensite Structure appears to be cold
worked martensite
Sample 6 - 6/8” Diameter ASTM A1035 Grade 100
Fine Grain Martensite Structure appears to be cold
worked martensite
Sample 7 - 7/8” Diameter ASTM A1035 Grade 100
Fine Grain Martensite Structure appears to be cold
worked martensite
Sample 8 - 8/8” Diameter ASTM A1035 Grade 100
Fine Grain Martensite Structure appears to be cold
worked martensite
Sample 9 - 9/8” Diameter ASTM A1035 Grade 100
Fine Grain Martensite Structure appears to be cold
worked martensite
Sample 10 - 10/8” Diameter ASTM A1035 Grade 100
Fine Grain Martensite Structure appears to be cold
worked martensite
Sample 11 - 11/8” Diameter ASTM A1035 Grade 100
Fine Grain Martensite Structure appears to be cold
worked martensite

Page 3 of 12 QA Lab Report No. 4448
b) Etchant, No. 88, 500X
Figure 1. Sample 3 – a fine grained martensitic microstructure
Page 4 of 12 QA Lab Report No. 4448
Figure 2. Sample 4 – a fine grained martensitic microstructure
Page 5 of 12 QA Lab Report No. 4448
a) Etchant No 74a, 250X
b) Etchant, No. 74a, 500X
Figure 3. Sample 4-6 showing a pearlite microstructure with ferrite present alongsome grain boundaries – Nital Etchant (ASTM E407 Etchant 74a)

Page 6 of 12 QA Lab Report No. 4448
Figure 4. Sample 5 – a fine grained martensitic microstructure

Page 7 of 12 QA Lab Report No. 4448
Figure 5. Sample 6 – a fine grained martensitic microstructure

Page 8 of 12 QA Lab Report No. 4448
Figure 6. Sample 7 – a fine grained martensitic microstructure

Page 9 of 12 QA Lab Report No. 4448
Figure 7. Sample 8 – a fine grained martensitic microstructure

Page 10 of 12 QA Lab Report No. 4448
Figure 8. Sample 9 – a fine grained martensitic microstructure
Page 11 of 12 QA Lab Report No. 4448
Figure 9. Sample 10 – a fine grained martensitic microstructure

Page 12 of 12 QA Lab Report No. 4448
Figure 10. Sample 11 – a fine grained martensitic microstructure