mixing biocides into ship's ballast water—great lakes - legislative
TRANSCRIPT

Mixing Biocides into Ship’s Ballast Water—Great Lakes Bulk Carrier Field Trials Prepared for Isle Royale National Park Houghton, Michigan File No. 09078.01 17 January 2012 Rev. B
PREPARED:
Kevin J. Reynolds, PE Project Manager
CHECKED:
Jon K. Markestad, PE Senior Marine Engineer
APPROVED: David W. Larsen, PE
Principal-in-Charge
SIGNED ORIGINAL ON FILE

Mixing Biocides into Ship’s Ballast Water iii The Glosten Associates, Inc. Great Lakes Bulk Carrier Field Trials, Rev. B File No 09078.01, 17 January 2012
Contents Section 1 Background .................................................................................................................. 3
1.1 Objectives .................................................................................................................................. 4 1.2 Phase II—Passive Mixing Methods Trials ................................................................................ 5 1.3 Phase III—Active Mixing Methods Trials ................................................................................ 6
Section 2 Study Approach—Feasibility ...................................................................................... 8
2.1 Hypothesis ................................................................................................................................. 8 2.2 Taking a Stepwise Approach - Feasibility ................................................................................ 8
Section 3 Test Platform (M/V Indiana Harbor) .......................................................................... 10
3.1 Particulars ................................................................................................................................ 10 3.2 Description of Ballast Water Tanks and Piping System ......................................................... 11 3.3 Description of Ballast Water Tank Sampling .......................................................................... 14
3.3.1 Tank Vertical Profiles: Samples VF, VM, and VA .......................................................16
3.3.2 Tank Discrete Points: Samples B, C, D, and E .............................................................16
3.3.3 Discharge End-of-Pipe Monitoring: Samples Port and Starboard ................................19
3.3.4 Sampling System Apparatus and Instruments ................................................................20
3.3.5 Sampling Regime ...........................................................................................................23
Section 4 Mixing Trials Objectives and Methods .................................................................... 24
4.1 Objectives ................................................................................................................................ 24 4.1.1 Dye Concentration Deviation and “Fully Mixed” ..........................................................24
4.1.2 Practical Timeframes .....................................................................................................24
4.2 Mixing Trials Overview .......................................................................................................... 25 4.2.1 Phase II—Passive Mixing Methods Trials .....................................................................25
4.2.2 Phase III—Active Mixing Methods Trials .....................................................................26
4.3 Tracer Dye Selection and Application .................................................................................... 27 4.3.1 Dye Selection .................................................................................................................27
4.3.2 Setting Data Confidence Requirements .........................................................................28
4.3.3 Accuracy and Percent Deviation ....................................................................................29
4.3.4 Dye Standards and Instrument Calibration ....................................................................30
4.3.5 Dose Measurement .........................................................................................................30
4.4 Equipment ............................................................................................................................... 31 4.4.1 Basic Equipment ............................................................................................................31
4.4.2 Method-Specific Equipment ..........................................................................................31
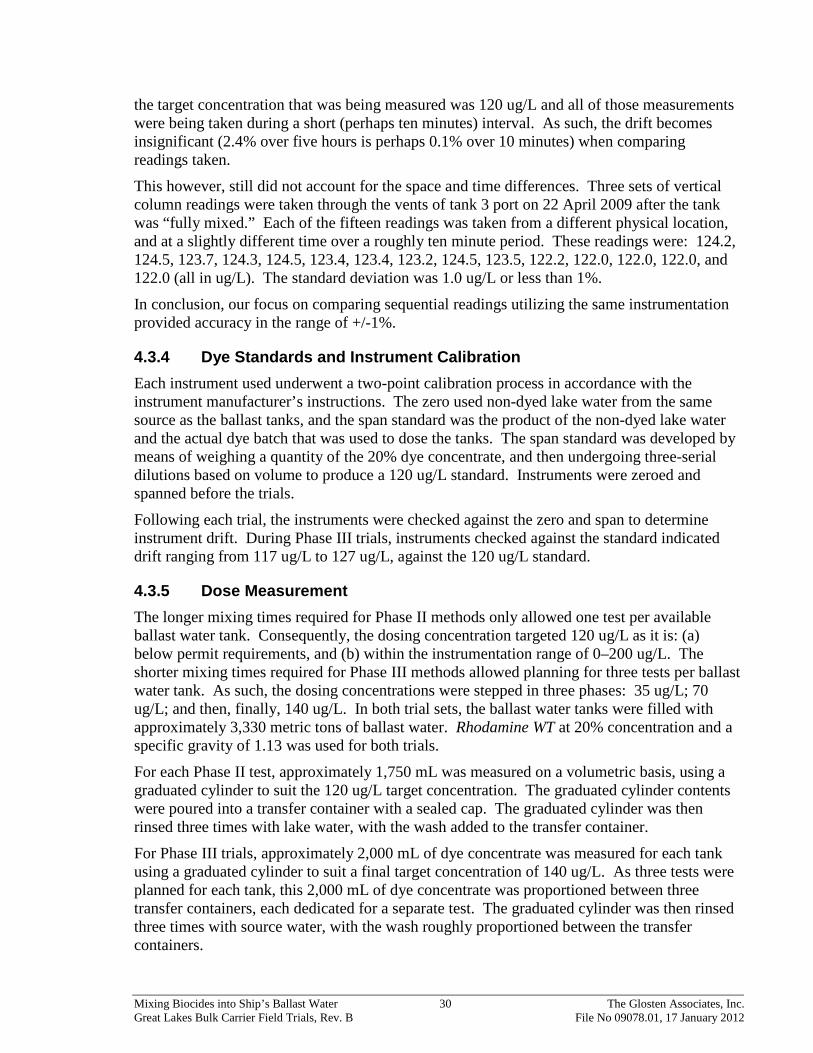
4.5 Method 1: In-Line Dosing ...................................................................................................... 37 4.6 Method 2: Bulk-on-Bottom Dosing ....................................................................................... 38 4.7 Method 3: Perforated Hose Dosing ........................................................................................ 39

Mixing Biocides into Ship’s Ballast Water iv The Glosten Associates, Inc. Great Lakes Bulk Carrier Field Trials, Rev. B File No 09078.01, 17 January 2012
4.8 Method 4: Internal Transfer Dosing ....................................................................................... 40 4.9 Method 5: Vent Dosing .......................................................................................................... 41 4.10 Method 6: Nozzle or Eductor Active Mixing ......................................................................... 42 4.11 Method 7: Air Lift Mixing Point Diffuser.............................................................................. 45
Section 5 Vessel Dynamics Data Collection ............................................................................ 47
5.1 Objective ................................................................................................................................. 47 5.2 Accelerometers ........................................................................................................................ 47 5.3 Inclinometers ........................................................................................................................... 47 5.4 Vessel Log ............................................................................................................................... 48 5.5 Video of Ballast Surface Water ............................................................................................... 48 5.6 Surface Re-Aeration Coefficient ............................................................................................. 48 5.7 Submerged Pressure Transducers ............................................................................................ 50
Section 6 Data Summary ............................................................................................................ 51
6.1 Data Summary Overview ........................................................................................................ 51 6.2 Data Formats and Files ............................................................................................................ 51 6.3 Vessel Route ............................................................................................................................ 53
6.3.1 Phase II—Passive Mixing Methods ...............................................................................53
6.3.2 Phase III—Active Mixing Methods ...............................................................................53
6.4 Environmental Data................................................................................................................. 54 6.4.1 Overview ........................................................................................................................54
6.4.2 Pressure Transducers ......................................................................................................54
6.4.3 Surface Re-Aeration Coefficient ....................................................................................55
6.5 In-Tank Mixing Data ............................................................................................................... 57 6.5.1 Phase II—Passive Mixing Methods ...............................................................................57
6.5.2 Phase III—Active Mixing Methods ...............................................................................60
Section 7 Conclusions ............................................................................................................... 69
7.1 Support of Emergency Response Guide .................................................................................. 69 7.2 Environmental Effects ............................................................................................................. 69
7.2.1 Phase II - Passive Mixing Methods ................................................................................69
7.2.2 Phase III - Active Mixing Methods ................................................................................69
7.3 Relative Efficiency Calculation .............................................................................................. 69 7.3.1 Average Absolute Deviation ..........................................................................................69
7.4 Relative Rankings and Discussion .......................................................................................... 71 7.4.1 Nozzle Active Mixing ....................................................................................................72
7.4.2 Air Lift Point Diffuser Mixing (Figure 33, Figure 34, and Figure 35) ..........................74
7.4.3 In-Line Dosing (Figure 27) ............................................................................................74
7.4.4 Air Lift Grid Diffuser Mixing (Figure 30, Figure 31, and Figure 32) ...........................75
7.4.5 Bulk-on-Bottom Dosing (Figure 26) ..............................................................................75
Mixing Biocides into Ship’s Ballast Water v The Glosten Associates, Inc. Great Lakes Bulk Carrier Field Trials, Rev. B File No 09078.01, 17 January 2012
7.4.6 Perforated Hose Dosing (Figure 23) ..............................................................................75
7.4.7 Vent Dosing (Phase II Trials – Figure 24 and Figure 25) (Phase III Trials – Figure 28 and Figure 29) ...........................................................................................................76
7.4.8 Internal Transfer (Figure 22) ..........................................................................................77
Section 8 Acknowledgements ................................................................................................... 78 Section 9 References .................................................................................................................. 80
Section 10 Testing Schedule ....................................................................................................... 81

Mixing Biocides into Ship’s Ballast Water vi The Glosten Associates, Inc. Great Lakes Bulk Carrier Field Trials, Rev. B File No 09078.01, 17 January 2012
Revision History
Section Rev Description Date Approved
All - Initial Release 16 July 2010 -
All A Rev. — was stamped and signed by Kevin J. Reynolds, P.E., Washington Registration No. 36584, on 16 July 2010. The stamp and signature above applies only to the content of the current revision.
4 November 2010 JKM
All Revision to include findings of Phase III mixing trials of active mixing methods.
7.4 All
B Revised relative ranking system. Update to reflect USGS and NPS comments.
17 January 2012 KJR

Mixing Biocides into Ship’s Ballast Water 1 The Glosten Associates, Inc. Great Lakes Bulk Carrier Field Trials, Rev. B File No 09078.01, 17 January 2012
Executive Summary Marine vessels of all types move not only people and goods, but also move ballast water in order to maintain stability and trim, control hull stresses, and assure propeller immersion. Ballast water is often taken up by a ship in a port in one geographic location and discharged into the harbor of a port in a different geographic location. Ballast water may be considered high risk if it suspected or known to contain harmful aquatic organisms and/or pathogens. When such high risk ballast water is transferred from one port to another, it could result in a non-native species invasion or result in fish mortality from the release of harmful pathogens.
Ballast water management efforts to minimize such transfers include mandatory ballast water exchange for transoceanic and some inter-coastal voyages and, more recently, the development of water treatment capabilities on the vessels themselves; however, many gaps remain in this management approach. Of those vessels currently required to manage ballast water, equipment failures or human error could result in the arrival of high risk ballast water. In addition, a vessel that has not managed its ballast water could go aground; this creates an incident where potentially high risk ballast water may be pumped off the vessel for purposes of refloating.
Vessels operating on the U.S. Great Lakes, inland waterways systems, and on some near coastal voyages are not currently required to manage their ballast water discharges. There is concern that transfer of organisms and pathogens between the lakes could be harmful. In particular, recent pathogen outbreaks have occurred in some parts of the Great Lakes, but not others. Methods to treat ballast water from affected locations are particularly desired by management at Isle Royal National Park in the State of Michigan.
To address the need to have strategies that can be implemented to manage high risk ballast water, the National Park Service (NPS) has developed an Emergency Response Guide for Handling Ballast Water to Control Non-Indigenous Species (hereafter referred to as Guide). The Guide assumes that there are suitable biocides that can inactivate the harmful organisms and pathogens. The Guide outlines several methods for mixing such biocides into the ballast tanks of marine vessels. This report outlines the field work performed in the development of suitable methods to address a fundamental challenge for an emergency responder; e.g., how to mix biocides into large, complex ballast tanks that are already full of water.
The field trials were conducted on the Great Lakes bulk carrier, M/V Indiana Harbor, to determine the relative effectiveness of five passive and four active methods of mixing chemicals into a vessel’s ballast water. The trialed passive methods were selected for their promise to be used in handling vessels with high-risk ballast water by using materials readily available on board the vessel. The active methods were selected for their promise to rapidly mix (in under 2 hours mixing time) a full ballast tank using readily obtainable equipment; this equipment may not be available on the vessel, however.
Passive method trials were conducted in April of 2009, and active method trials were conducted in May of 2010. Vessel trials offer significant challenges including:
• Vessel motions, which can eventually become a more dominant mechanism for mixing than the mixing methods being tested.
Mixing Biocides into Ship’s Ballast Water 2 The Glosten Associates, Inc. Great Lakes Bulk Carrier Field Trials, Rev. B File No 09078.01, 17 January 2012
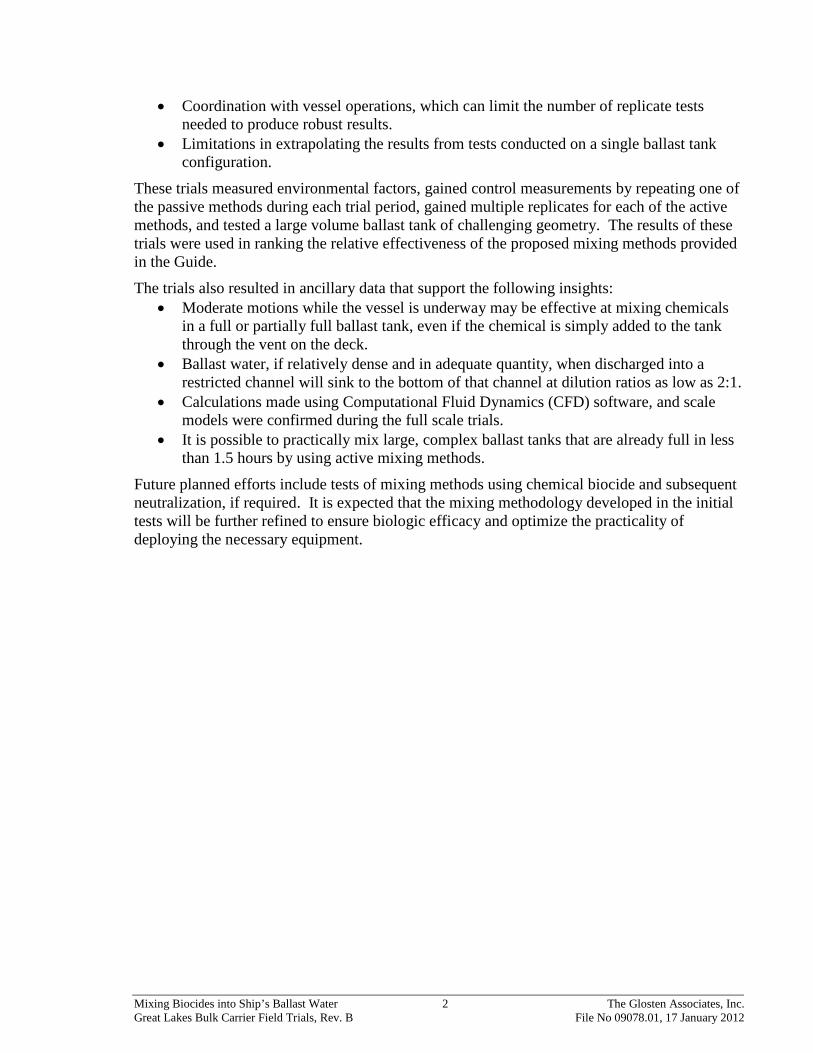
• Coordination with vessel operations, which can limit the number of replicate tests needed to produce robust results.
• Limitations in extrapolating the results from tests conducted on a single ballast tank configuration.
These trials measured environmental factors, gained control measurements by repeating one of the passive methods during each trial period, gained multiple replicates for each of the active methods, and tested a large volume ballast tank of challenging geometry. The results of these trials were used in ranking the relative effectiveness of the proposed mixing methods provided in the Guide.
The trials also resulted in ancillary data that support the following insights: • Moderate motions while the vessel is underway may be effective at mixing chemicals
in a full or partially full ballast tank, even if the chemical is simply added to the tank through the vent on the deck.
• Ballast water, if relatively dense and in adequate quantity, when discharged into a restricted channel will sink to the bottom of that channel at dilution ratios as low as 2:1.
• Calculations made using Computational Fluid Dynamics (CFD) software, and scale models were confirmed during the full scale trials.
• It is possible to practically mix large, complex ballast tanks that are already full in less than 1.5 hours by using active mixing methods.
Future planned efforts include tests of mixing methods using chemical biocide and subsequent neutralization, if required. It is expected that the mixing methodology developed in the initial tests will be further refined to ensure biologic efficacy and optimize the practicality of deploying the necessary equipment.

Mixing Biocides into Ship’s Ballast Water 3 The Glosten Associates, Inc. Great Lakes Bulk Carrier Field Trials, Rev. B File No 09078.01, 17 January 2012
Section 1 Background An effective response to high risk ballast water has become increasingly important, as commercial vessels are a primary vector in the transfer of unwanted aquatic non-indigenous species (NIS) throughout the world. Over 40,000 commercial vessels currently carry cargo between the world’s ports, taking on ballast water in one aquatic ecosystem and discharging it, in an industrial quantity, in another quite different ecosystem. When non-native aquatic life is released into an ecosystem, it may out-compete native species. Problems directly resulting from invasive species include the collapse of entire commercial fisheries, the displacement of native seabed communities, and the red tide contamination absorbed by filter-feeding shellfish.
Vessels with high risk ballast water will require novel intervention methods that can be applied at sea before arrival, upon arrival in port, or at the incident location of a grounding. An example of this casualty risk was demonstrated when the M/T Igloo Moon was grounded and required salvage operations in 1996. Emergency treatment of ballast water was necessary, as ballast water from the stricken tanker had to be offloaded in order to move the vessel off the reef. Because of the origins of the ballast water and the vessel’s proximity to the sensitive environment of Biscayne Bay National Park, concerns were raised over the potential risk of introducing non-indigenous biota via the ballast water that could harm the reef’s natural biota. Twelve days after the stranding, the 1.1 million gallons of water in the ballast tanks were treated with liquid calcium hypochlorite. The chemical was poured through the tank vents on deck into the full ballast tanks. After sufficient exposure time elapsed, the treated ballast water was discharged overboard and the grounded freighter was towed off the reef without incident (see Reference 13).
The methods used in this emergency treatment response were not sufficiently vetted but were deemed better than doing nothing in terms of reducing the risk of a new introduction. The situation also made it clear that further research was needed to develop scientifically verified methods to dose ballast tanks with a biocide that was proven to be effective and could be neutralized to a safe level for discharge.
Photo 1 - Tanker Igloo Moon is shown carrying suspect ballast water shown aground on a
sensitive coral reef. The adjacent vessel is receiving cargo from the casualty vessel. (NOAA photo)
Mixing Biocides into Ship’s Ballast Water 4 The Glosten Associates, Inc. Great Lakes Bulk Carrier Field Trials, Rev. B File No 09078.01, 17 January 2012
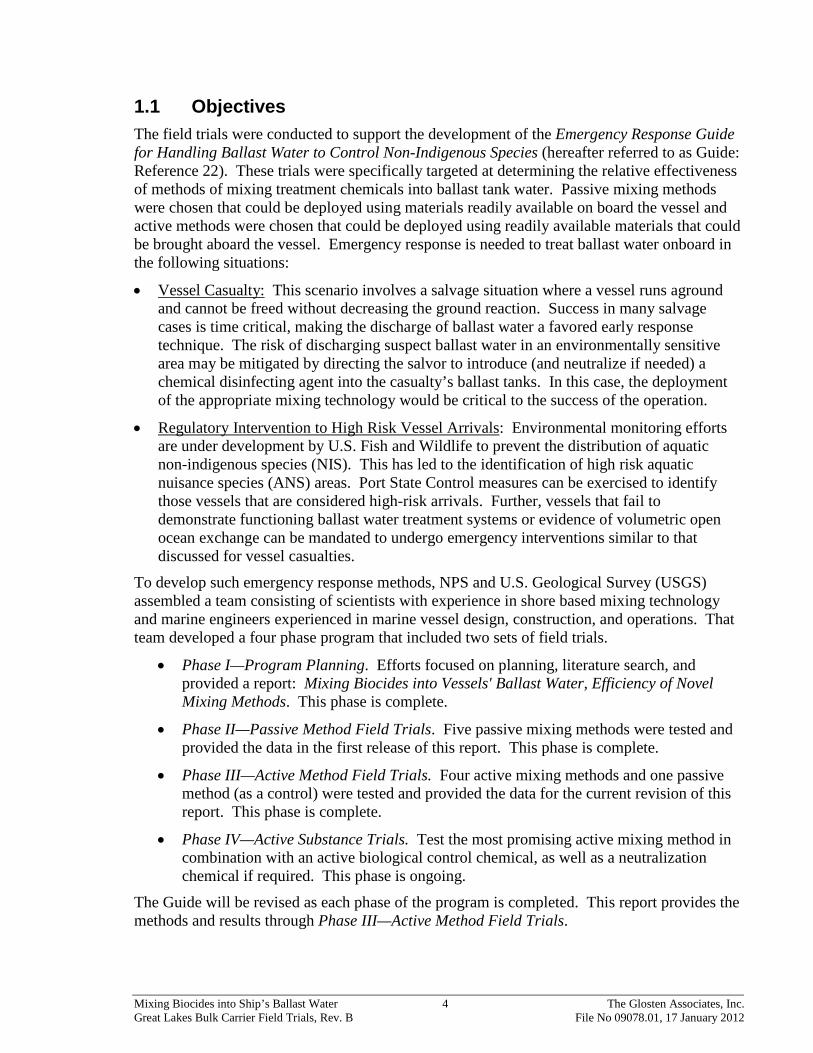
1.1 Objectives The field trials were conducted to support the development of the Emergency Response Guide for Handling Ballast Water to Control Non-Indigenous Species (hereafter referred to as Guide: Reference 22). These trials were specifically targeted at determining the relative effectiveness of methods of mixing treatment chemicals into ballast tank water. Passive mixing methods were chosen that could be deployed using materials readily available on board the vessel and active methods were chosen that could be deployed using readily available materials that could be brought aboard the vessel. Emergency response is needed to treat ballast water onboard in the following situations:
• Vessel Casualty:
•
This scenario involves a salvage situation where a vessel runs aground and cannot be freed without decreasing the ground reaction. Success in many salvage cases is time critical, making the discharge of ballast water a favored early response technique. The risk of discharging suspect ballast water in an environmentally sensitive area may be mitigated by directing the salvor to introduce (and neutralize if needed) a chemical disinfecting agent into the casualty’s ballast tanks. In this case, the deployment of the appropriate mixing technology would be critical to the success of the operation.
Regulatory Intervention to High Risk Vessel Arrivals
To develop such emergency response methods, NPS and U.S. Geological Survey (USGS) assembled a team consisting of scientists with experience in shore based mixing technology and marine engineers experienced in marine vessel design, construction, and operations. That team developed a four phase program that included two sets of field trials.
: Environmental monitoring efforts are under development by U.S. Fish and Wildlife to prevent the distribution of aquatic non-indigenous species (NIS). This has led to the identification of high risk aquatic nuisance species (ANS) areas. Port State Control measures can be exercised to identify those vessels that are considered high-risk arrivals. Further, vessels that fail to demonstrate functioning ballast water treatment systems or evidence of volumetric open ocean exchange can be mandated to undergo emergency interventions similar to that discussed for vessel casualties.
• Phase I—Program Planning. Efforts focused on planning, literature search, and provided a report: Mixing Biocides into Vessels' Ballast Water, Efficiency of Novel Mixing Methods. This phase is complete.
• Phase II—Passive Method Field Trials. Five passive mixing methods were tested and provided the data in the first release of this report. This phase is complete.
• Phase III—Active Method Field Trials. Four active mixing methods and one passive method (as a control) were tested and provided the data for the current revision of this report. This phase is complete.
• Phase IV—Active Substance Trials. Test the most promising active mixing method in combination with an active biological control chemical, as well as a neutralization chemical if required. This phase is ongoing.
The Guide will be revised as each phase of the program is completed. This report provides the methods and results through Phase III—Active Method Field Trials.

Mixing Biocides into Ship’s Ballast Water 5 The Glosten Associates, Inc. Great Lakes Bulk Carrier Field Trials, Rev. B File No 09078.01, 17 January 2012
1.2 Phase II—Passive Mixing Methods Trials The Phase II trials were conducted between 12 and 24 April 2009 on the American Steamship Company bulk carrier the M/V Indiana Harbor. The charts below show the progression of the trip from Indiana Harbor in Indiana to Duluth, Minnesota. During this trip, the passive methods for mixing a chemical into ballast water were tested. The six person team boarded the vessel in Duluth and installed dosing and sampling equipment in route to Indiana Harbor while the vessel was transporting bulk cargo. Once the vessel unloaded its cargo in Indiana Harbor and completed taking on ballast, the test team began dosing the tanks with dye and measuring the concentration of dye as it dispersed throughout each tank. The team completed all trials before arriving back in Duluth. During discharge of ballast water in Duluth, a discharge study in Duluth Harbor was conducted by a third party.
Figure 1 - Phase II Trials Route (Lake Michigan Leg)
Mixing Biocides into Ship’s Ballast Water 6 The Glosten Associates, Inc. Great Lakes Bulk Carrier Field Trials, Rev. B File No 09078.01, 17 January 2012
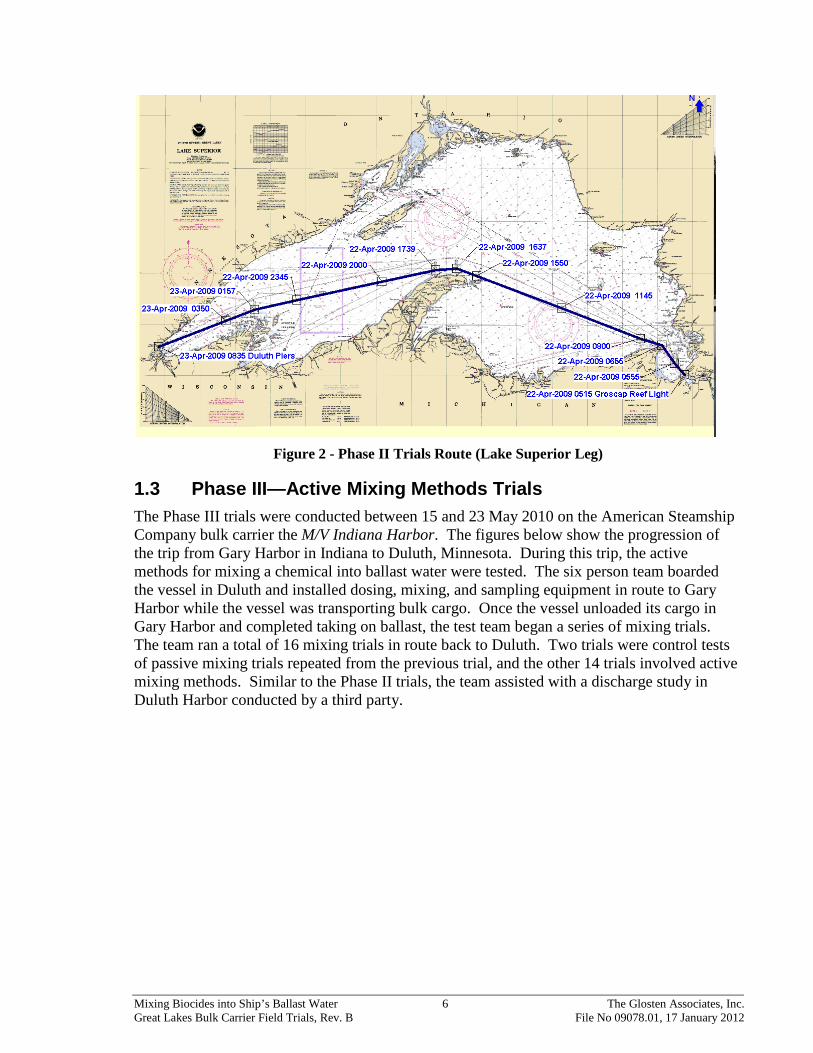
Figure 2 - Phase II Trials Route (Lake Superior Leg)
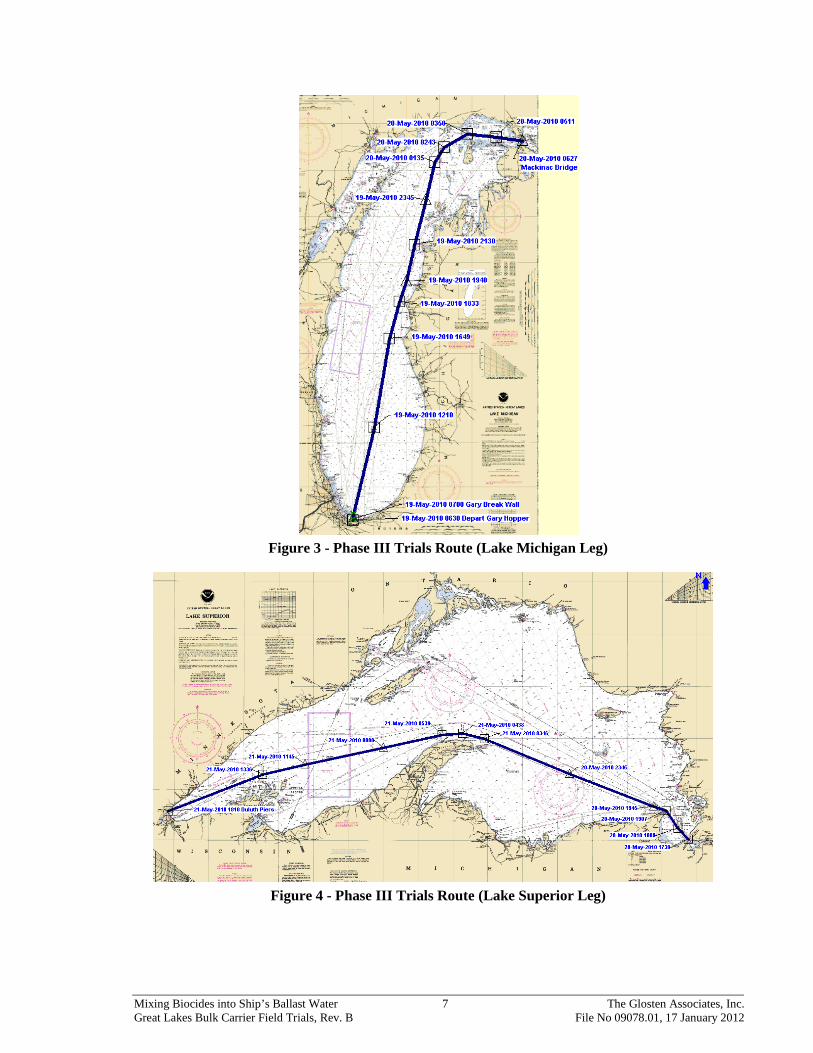
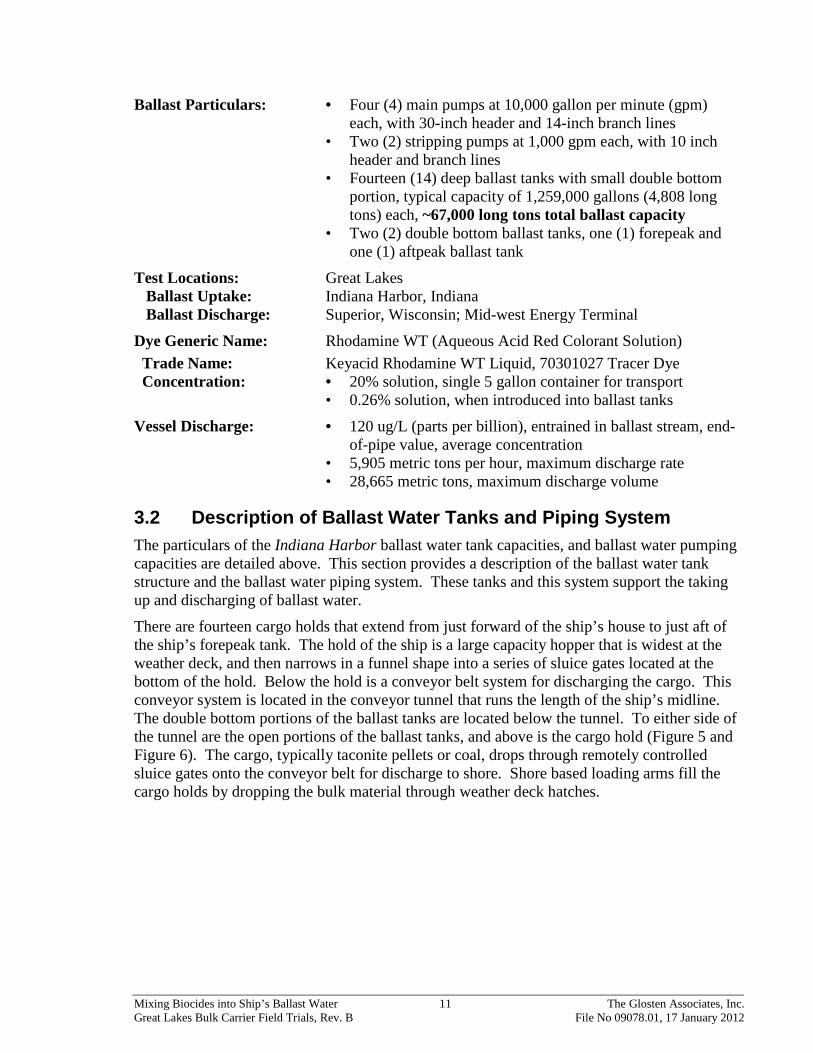
1.3 Phase III—Active Mixing Methods Trials The Phase III trials were conducted between 15 and 23 May 2010 on the American Steamship Company bulk carrier the M/V Indiana Harbor. The figures below show the progression of the trip from Gary Harbor in Indiana to Duluth, Minnesota. During this trip, the active methods for mixing a chemical into ballast water were tested. The six person team boarded the vessel in Duluth and installed dosing, mixing, and sampling equipment in route to Gary Harbor while the vessel was transporting bulk cargo. Once the vessel unloaded its cargo in Gary Harbor and completed taking on ballast, the test team began a series of mixing trials. The team ran a total of 16 mixing trials in route back to Duluth. Two trials were control tests of passive mixing trials repeated from the previous trial, and the other 14 trials involved active mixing methods. Similar to the Phase II trials, the team assisted with a discharge study in Duluth Harbor conducted by a third party.
Mixing Biocides into Ship’s Ballast Water 7 The Glosten Associates, Inc. Great Lakes Bulk Carrier Field Trials, Rev. B File No 09078.01, 17 January 2012
Figure 3 - Phase III Trials Route (Lake Michigan Leg)
Figure 4 - Phase III Trials Route (Lake Superior Leg)

Mixing Biocides into Ship’s Ballast Water 8 The Glosten Associates, Inc. Great Lakes Bulk Carrier Field Trials, Rev. B File No 09078.01, 17 January 2012
Section 2 Study Approach—Feasibility 2.1 Hypothesis The study asserts that, if an emergency situation occurs and ballast water needs treatment before discharge, novel mixing methods may be effective in dosing and mixing a biocide into full ballast water tanks.
2.2 Taking a Stepwise Approach - Feasibility A series of steps were defined by the project team to guide the progressing of the studies towards development of novel mixing solutions and deliver a final emergency response guide. This study took the first of these steps, which was determining the feasibility of basic mixing methods by performing field tests on a Great Lakes bulk carrier. The results of this effort are reported here, and have been incorporated into the first draft of an emergency response guide for handling high risk ballast water (Reference 21).
The feasibility phase was supported by computational fluid dynamics work and scale modeling that looks at the development of novel methods. Further phases will build on the early lessons learned during the tests using the basic mixing methods and scale modeling efforts and field verification of the methods will continue. At the end of each phase, the Emergency Response Guide for Handling Ballast Water to Control Non-Indigenous Species will be updated.
The following table outlines both the methods trialed during these tests, as well as the methods which are being explored in the scale model work, with potential field trials planned depending on their success.

Mixing Biocides into Ship’s Ballast Water 9 The Glosten Associates, Inc. Great Lakes Bulk Carrier Field Trials, Rev. B File No 09078.01, 17 January 2012
Table 1 -Mixing Methods Summary
Mixing Method Class Test Description Mixing Energy Dye Method/Particulars Status
Variation A: Bulk Dye Dose on Top
Bulk Load Applied at: Tank Manhole or Vent
Done-Phase I
Variation B: Bulk Dye Dose through Sounding Tube
Bulk Load Applied at: Tank Sounding Tube
Defer
Variation C: Perforated Hose Dosing
Bulk Load Applied by means of perforated tube hung vertically.
Done-Phase I
Filling Empty Tank: Bulk-On-Bottom Dosing
Hydraulic Energy of Loaded Ballast Water
Bulk Load Applied at Tank Manhole or Tank Vent
Done-Phase I
In-Line DosingTurbulent Flow of Ballast Water in Pipe
Metering Pump Injection in Ballast Main
Done-Phase I
Internal Transfer Dosing
Circulating Ballast Water
Set-up Circulation Loop Internal to Ballast Tank, Meter Dye into Loop
Done-Phase I
Axial Flow PropellerMechanical Device Inserted thru Tank Manhole
Metering Pump Injection behind Propeller Blade
Defer
Metering Pump Injection into Eductors Located Below Each Tank Vent With Flow Directed Athwartship.
Done- Phase II
Metering Pump Injection into Eductors Located at longitudinal Center of Tank with two flows each directed 45° Off Athwartship
Done- Phase II
Metering Pump Injection into Nozzels Located Below Each Tank Vent With Flow Directed Athwartship.
Done- Phase II
Metering Pump Injection into Nozzles Located at longitudinal Center of Tank with two flows each directed 45° Off Athwartship
Done- Phase II
Variation A: Dye Bulk Dosing
Bulk Load Dropped thru Tank Manholes
Defer
Metering Pump Injection into Air Lift Tube. Sparging Tables Located at 1/3 and 2/3 Longitudinal distance
Done- Phase II
Metering Pump Injection into Air Lift Tube. Sparging Stones Located Under Each Vent.
Done- Phase II
Variation C: Dye Pumped into Lateral Intake Line
Metering Pump Injection into Lateral Intake Line
Defer
Variation A: Liquid Carbon Dioxide
Metering Pump Injection into Air Lift Tube
Defer
Variation B: Liquid Nitrogen
Metering Pump Injection into Air Lift Tube
Defer
Variation C: Dry IceBulk Load Dropped thru Tank Manholes or Air Lift Tube
Defer
Air Lift Mixing
Variation B: Dye Pumped into Air Lift Tube
Compressed Air Lift Device Inserted thru
Tank Manhole
Air Lift Pumping, Mixing by Compressed Air
Air Lift Pumping, Mixing by Chemical Agitation
Rapid Release of Gas into Full Tank
Venturi Effect Using a Metering Valve to Proportion Dye into Defer
Variation C: Dye Bulk Dosing
Bulk Load Dropped thru Tank Manholes
Defer
Dye Pumped into Eductor Line
Eductor Device Inserted thru Tank
Manhole
Nozzle Mixing in tank
Nozzle Devise Inserted through Tank
Manhole
Passive Mixing
Active Mixing
Variation A: Dye Pumped into Eductor Line
Variation B: Dye Proportioned by
Ship's Underway Motion:
Ship's Motion
Eductor Mixing In Tank

Mixing Biocides into Ship’s Ballast Water 10 The Glosten Associates, Inc. Great Lakes Bulk Carrier Field Trials, Rev. B File No 09078.01, 17 January 2012
Section 3 Test Platform (M/V Indiana Harbor) The American Steamship Company provided access to one of their newer ships operating on the Great Lakes. Cooperation from the company was instrumental in outfitting the ship for field testing, as well as providing advice to the project team on many shipboard practicalities for implementation of the research. The ship will continue to be used during all four phases of the project to allow for results comparison. The ballast tanks on the vessel are large and complex, thereby providing a unique opportunity to test mixing methods under challenging circumstances. Because the tanks include both deep and double-bottom areas, the mixing methods that performed well at mixing an entire tank should be considered for further evaluation under a variety of tank configurations.
Photo 2 Great Lakes Bulk Carrier Walter J. McCarthy Jr. This ship is identical to the
Indiana Harbor used in Trials. (A portion of the deck of the Indiana Harbor is shown in the right of the photo.)
3.1 Particulars Vessel Name: M/V Indiana Harbor
Owner: American Steamship Company
Built: Bay Shipbuilding, 1979
Particulars: • Great Lakes Bulk Carrier, U.S. Flag • Iron ore pellets and western coal transport • 1,000'-0" length overall • 105'-0" beam, 56'-0" depth, 34'-3/4" midsummer draft (MS) • 80,900 gross tons deadweight capacity at MS draft • 10,000 tons/hour cargo unloading capacity • 14,000 shaft horsepower, twin screw
Mixing Biocides into Ship’s Ballast Water 11 The Glosten Associates, Inc. Great Lakes Bulk Carrier Field Trials, Rev. B File No 09078.01, 17 January 2012
Ballast Particulars: • Four (4) main pumps at 10,000 gallon per minute (gpm) each, with 30-inch header and 14-inch branch lines
• Two (2) stripping pumps at 1,000 gpm each, with 10 inch header and branch lines
• Fourteen (14) deep ballast tanks with small double bottom portion, typical capacity of 1,259,000 gallons (4,808 long tons) each, ~67,000 long tons total ballast capacity
• Two (2) double bottom ballast tanks, one (1) forepeak and one (1) aftpeak ballast tank
Test Locations: Great Lakes Ballast Uptake: Indiana Harbor, Indiana Ballast Discharge: Superior, Wisconsin; Mid-west Energy Terminal
Dye Generic Name: Rhodamine WT (Aqueous Acid Red Colorant Solution) Trade Name: Keyacid Rhodamine WT Liquid, 70301027 Tracer Dye Concentration: • 20% solution, single 5 gallon container for transport
• 0.26% solution, when introduced into ballast tanks
Vessel Discharge: • 120 ug/L (parts per billion), entrained in ballast stream, end-of-pipe value, average concentration
• 5,905 metric tons per hour, maximum discharge rate • 28,665 metric tons, maximum discharge volume
3.2 Description of Ballast Water Tanks and Piping System The particulars of the Indiana Harbor ballast water tank capacities, and ballast water pumping capacities are detailed above. This section provides a description of the ballast water tank structure and the ballast water piping system. These tanks and this system support the taking up and discharging of ballast water.
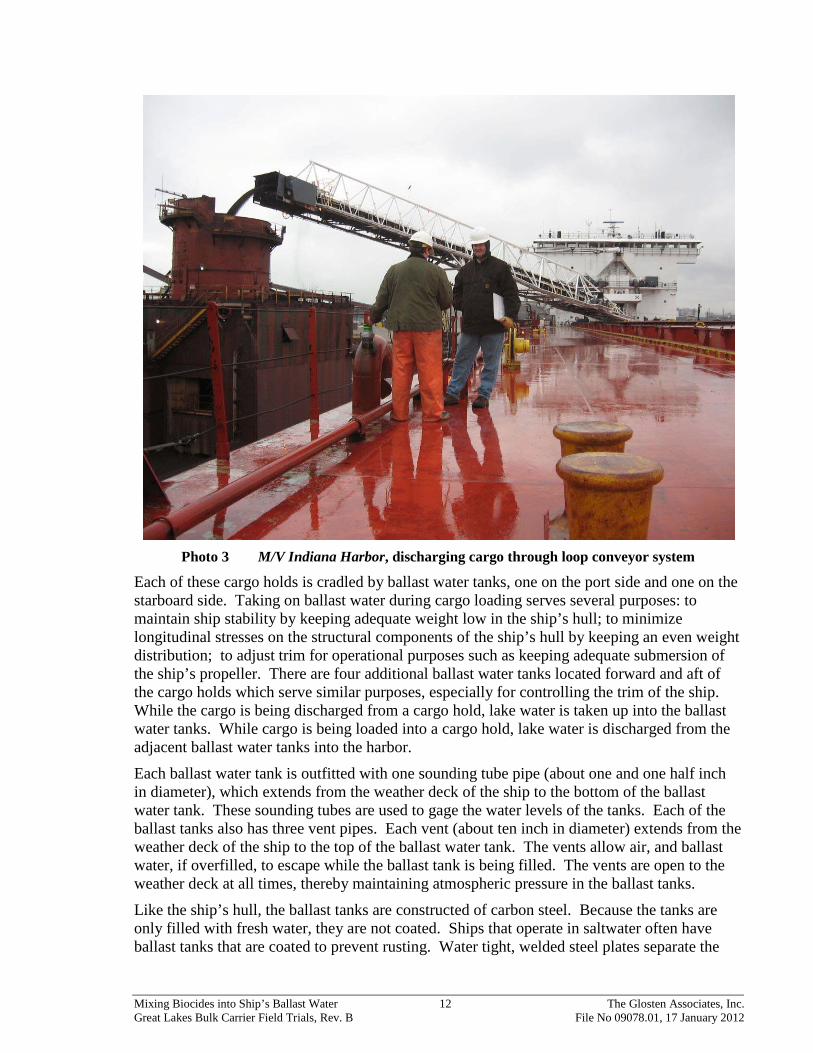
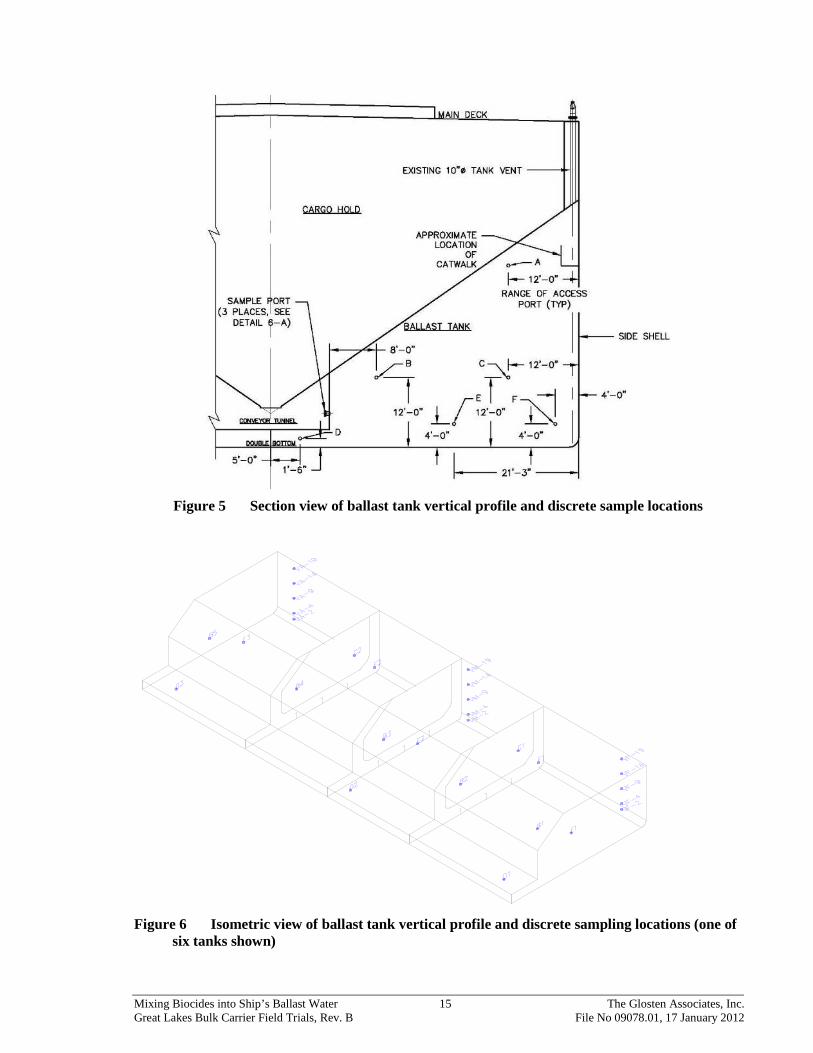
There are fourteen cargo holds that extend from just forward of the ship’s house to just aft of the ship’s forepeak tank. The hold of the ship is a large capacity hopper that is widest at the weather deck, and then narrows in a funnel shape into a series of sluice gates located at the bottom of the hold. Below the hold is a conveyor belt system for discharging the cargo. This conveyor system is located in the conveyor tunnel that runs the length of the ship’s midline. The double bottom portions of the ballast tanks are located below the tunnel. To either side of the tunnel are the open portions of the ballast tanks, and above is the cargo hold (Figure 5 and Figure 6). The cargo, typically taconite pellets or coal, drops through remotely controlled sluice gates onto the conveyor belt for discharge to shore. Shore based loading arms fill the cargo holds by dropping the bulk material through weather deck hatches.
Mixing Biocides into Ship’s Ballast Water 12 The Glosten Associates, Inc. Great Lakes Bulk Carrier Field Trials, Rev. B File No 09078.01, 17 January 2012
Photo 3 M/V Indiana Harbor, discharging cargo through loop conveyor system
Each of these cargo holds is cradled by ballast water tanks, one on the port side and one on the starboard side. Taking on ballast water during cargo loading serves several purposes: to maintain ship stability by keeping adequate weight low in the ship’s hull; to minimize longitudinal stresses on the structural components of the ship’s hull by keeping an even weight distribution; to adjust trim for operational purposes such as keeping adequate submersion of the ship’s propeller. There are four additional ballast water tanks located forward and aft of the cargo holds which serve similar purposes, especially for controlling the trim of the ship. While the cargo is being discharged from a cargo hold, lake water is taken up into the ballast water tanks. While cargo is being loaded into a cargo hold, lake water is discharged from the adjacent ballast water tanks into the harbor.
Each ballast water tank is outfitted with one sounding tube pipe (about one and one half inch in diameter), which extends from the weather deck of the ship to the bottom of the ballast water tank. These sounding tubes are used to gage the water levels of the tanks. Each of the ballast tanks also has three vent pipes. Each vent (about ten inch in diameter) extends from the weather deck of the ship to the top of the ballast water tank. The vents allow air, and ballast water, if overfilled, to escape while the ballast tank is being filled. The vents are open to the weather deck at all times, thereby maintaining atmospheric pressure in the ballast tanks.
Like the ship’s hull, the ballast tanks are constructed of carbon steel. Because the tanks are only filled with fresh water, they are not coated. Ships that operate in saltwater often have ballast tanks that are coated to prevent rusting. Water tight, welded steel plates separate the

Mixing Biocides into Ship’s Ballast Water 13 The Glosten Associates, Inc. Great Lakes Bulk Carrier Field Trials, Rev. B File No 09078.01, 17 January 2012
ballast water tanks from each other, the cargo holds, the conveyor tunnel, and the outside or side shell of the ship. All structural supports for these plates are located in the ballast water tanks. This includes deep frames every thirty-six feet along the length of the tanks, as well as smaller stiffening structures located every two feet between the frames. In addition, there are stanchions located as needed to provide vertical structural support. To enhance drainage from the tanks when water is discharged, support structures and structural steel webbing inside the tank have limber holes (often referred to as “rat holes”).
The Indiana Harbor is outfitted with separate port and starboard side ballast water main lines for filling the tanks, as well as cross-over lines between each mainline. The crossover lines, which are normally closed, can be used to move ballast water from one side of the ship to the other. Each ballast tank has two points on the main line where water can be moved in or out of the tank. The first is a larger suction and fill line that terminates at about the longitudinal center of the ballast tank, about twelve inches above the floor. The second is a smaller suction point for stripping water out of the tank that terminates at the aft end of the ballast tank, closer to the floor. Each point is controlled by remotely operated valves located in the conveyor tunnel. The tanks are almost always filled and emptied in port/starboard pairs, so as to prevent a list on the ship.
Each main line used to move water into the tanks is connected to a sea chest. A sea chest is essentially a large steel box welded to the bottom skin of the ship in the main machinery space, located at the aft end of the ship. These boxes are outfitted with a steel grate that prevents large items, typically one-inch or larger, from entering the ballast water main lines. Further, these boxes are outfitted with vents that extend to the weather deck to prevent them from becoming air bound.
To fill the ballast tanks, water is allowed to freely enter the sea chest. Because the ships are frequently in shallow water, sometimes even sitting on the lake bed, a large amount of sediment can also enter the sea chest and subsequently enter the ballast tanks. The ship’s propellers can also stir up sediment during docking operations and external environmental effects such as river run off can increase the amount to sediment in the water. Once water, and sediment, enters the sea chest it is moved to the ballast tanks using either gravitation forces or with pumps, whichever is most effective.
To empty the ballast tanks, water enters the ballast main line through the same opening that was used to deliver the water to the tank. If possible, gravitational forces are used to discharge the water through the same sea chest used during uptake. When gravity alone is not enough, pumps are then used to complete the majority of the tank. If needed, each tank can be further emptied by using the smaller stripping line in each tank. A separate pump is connected to the stripping line, but the discharge from the stripping line still goes through the same sea chest as the water does from the main line. The sediment that enters the ballast tanks during uptake tends to settle in the tanks, within the complex structure on the bottom. When the tanks are discharged, much of this sediment is left behind. Through successive empty and fill cycles, the sediment continues to build up, with accumulations particularly significant behind larger structures. We observed relatively large deposits, as much at two-feet deep, of clay-like sediment in the ballast tanks during the tests.

Mixing Biocides into Ship’s Ballast Water 14 The Glosten Associates, Inc. Great Lakes Bulk Carrier Field Trials, Rev. B File No 09078.01, 17 January 2012
3.3 Description of Ballast Water Tank Sampling The efficiency of the various mixing methods was estimated by means of monitoring the concentration of the dye in the ballast water at various points in time of the mixing processes. Given the large size and complex arrangement of the ballast tanks, three different methods were used to gather water samples from the ballast tanks. The following sections describe the methods used and locations where the samples were taken.
• Discrete samples. This method involved using tubing fixed to a specific location in the tank and running to a remote sampling apparatus in the conveyor tunnel. See photos 5, 6, and 7.
• Vertical profiles. This method involved lowering a sampling device through the vent at the top of the tank and collecting samples vertically from the top of the tanks to the bottom.
• Discharge “end-of-pipe” sampling. This method involved taking samples of a small slip-stream of the ballast water as it was passing through the main line in the engine room.
The ship itself has a total of fourteen (14) deep ballast water tanks. Three pairs, for a total of six (6) of these tanks, were set-up for sampling. This provided a total of 152 sample points within the tanks. The discharge sampling provided an additional two (2) locations.
• Two of the six tanks used in the tests (Tank #3 port and #3 starboard) were equipped with fifteen (15) discrete sampling points inside each tank and three (3) vertical profile sampling points in each tank.
• The remaining four of the six tanks used in the tests (Tank #4 port, #4 starboard, #5 port, and #5 starboard) were equipped with eight (8) discrete sampling points in each tank and three (3) vertical profile samples points in each tank.
Mixing Biocides into Ship’s Ballast Water 15 The Glosten Associates, Inc. Great Lakes Bulk Carrier Field Trials, Rev. B File No 09078.01, 17 January 2012
Figure 5 Section view of ballast tank vertical profile and discrete sample locations
Figure 6 Isometric view of ballast tank vertical profile and discrete sampling locations (one of
six tanks shown)

Mixing Biocides into Ship’s Ballast Water 16 The Glosten Associates, Inc. Great Lakes Bulk Carrier Field Trials, Rev. B File No 09078.01, 17 January 2012
3.3.1 Tank Vertical Profiles: Samples VF, VM, and VA The vertical forward (show as “VF” in Figure 6), vertical middle (VM), and vertical aft (VA) sampling locations were accessed from the ballast tank weather deck vents. The number following each of the sample port locations denotes the associated water depth. For example, VM-2 is the reading recorded from the middle tank profile at two-feet of water depth.
At these locations, the ballast water was tested by lowering a probe through the tank vents and measuring the water properties at various heights throughout the water column. This above deck testing was conducted on each tank through the tank vents wherever it was possible to lower the probe through vent. Some vents were obstructed by sounding tubes or dye dosing equipment. Sampling took place periodically.
Photo 4 Tank Vertical Profiles - team members on vessel’s main deck lowering sonde
through fitting on tank vent and reading handheld data logger
3.3.2 Tank Discrete Points: Samples B, C, D, and E Sample locations labeled B, C, D, and E (as shown in Figure 6) indicate a specific sectional location, or height from the floor and transverse distance from the side shell. The numbers denote sequence of longitudinal location, with number 1 being most forward. For example, D-1 is the forward-most sample point located in the ballast tank double bottom portion.
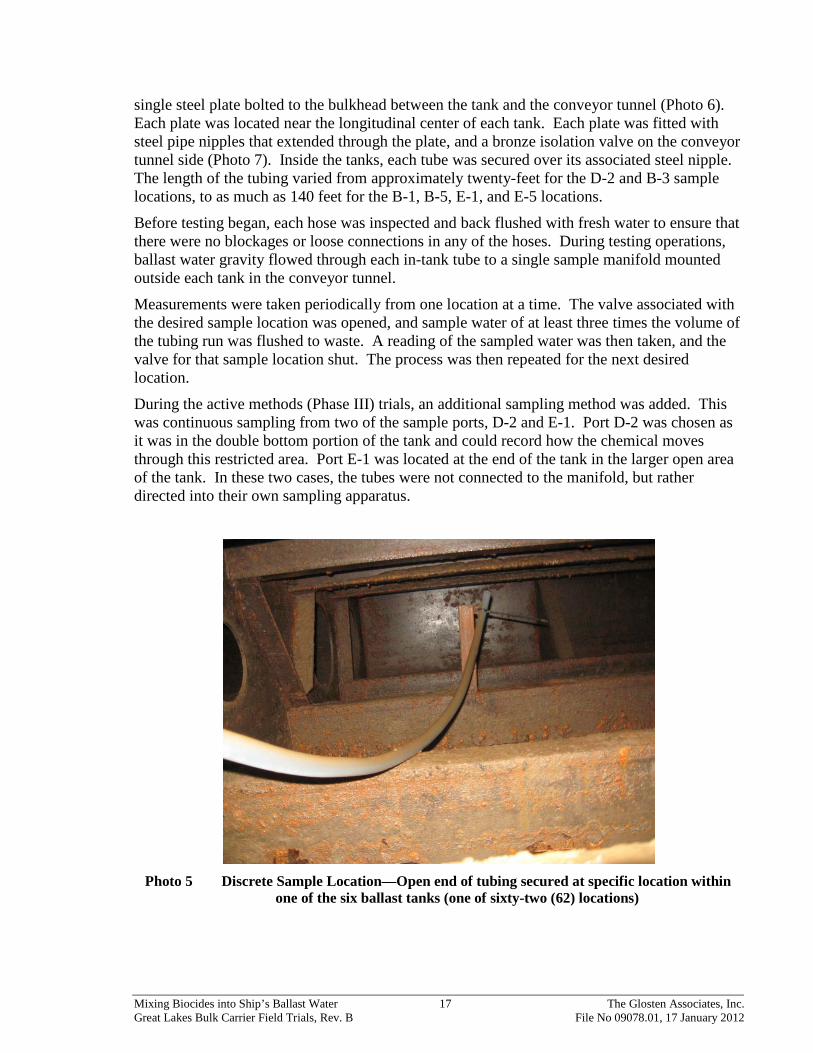
The sample tubing used in each of the six ballast tanks was three-quarter inch clear PVC. Within each tank, each tube was individually run from its selected position (Photo 5) to a
Mixing Biocides into Ship’s Ballast Water 17 The Glosten Associates, Inc. Great Lakes Bulk Carrier Field Trials, Rev. B File No 09078.01, 17 January 2012
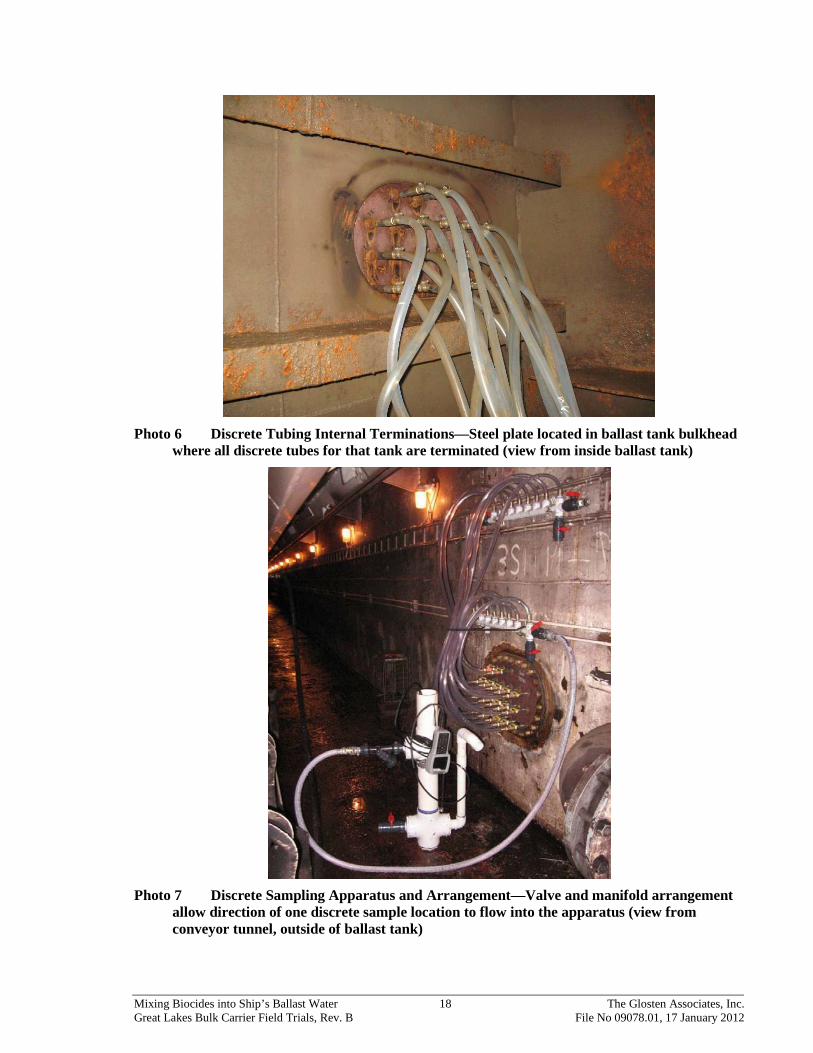
single steel plate bolted to the bulkhead between the tank and the conveyor tunnel (Photo 6). Each plate was located near the longitudinal center of each tank. Each plate was fitted with steel pipe nipples that extended through the plate, and a bronze isolation valve on the conveyor tunnel side (Photo 7). Inside the tanks, each tube was secured over its associated steel nipple. The length of the tubing varied from approximately twenty-feet for the D-2 and B-3 sample locations, to as much as 140 feet for the B-1, B-5, E-1, and E-5 locations.
Before testing began, each hose was inspected and back flushed with fresh water to ensure that there were no blockages or loose connections in any of the hoses. During testing operations, ballast water gravity flowed through each in-tank tube to a single sample manifold mounted outside each tank in the conveyor tunnel.
Measurements were taken periodically from one location at a time. The valve associated with the desired sample location was opened, and sample water of at least three times the volume of the tubing run was flushed to waste. A reading of the sampled water was then taken, and the valve for that sample location shut. The process was then repeated for the next desired location.
During the active methods (Phase III) trials, an additional sampling method was added. This was continuous sampling from two of the sample ports, D-2 and E-1. Port D-2 was chosen as it was in the double bottom portion of the tank and could record how the chemical moves through this restricted area. Port E-1 was located at the end of the tank in the larger open area of the tank. In these two cases, the tubes were not connected to the manifold, but rather directed into their own sampling apparatus.
Photo 5 Discrete Sample Location—Open end of tubing secured at specific location within
one of the six ballast tanks (one of sixty-two (62) locations)
Mixing Biocides into Ship’s Ballast Water 18 The Glosten Associates, Inc. Great Lakes Bulk Carrier Field Trials, Rev. B File No 09078.01, 17 January 2012
Photo 6 Discrete Tubing Internal Terminations—Steel plate located in ballast tank bulkhead
where all discrete tubes for that tank are terminated (view from inside ballast tank)
Photo 7 Discrete Sampling Apparatus and Arrangement—Valve and manifold arrangement
allow direction of one discrete sample location to flow into the apparatus (view from conveyor tunnel, outside of ballast tank)
Mixing Biocides into Ship’s Ballast Water 19 The Glosten Associates, Inc. Great Lakes Bulk Carrier Field Trials, Rev. B File No 09078.01, 17 January 2012
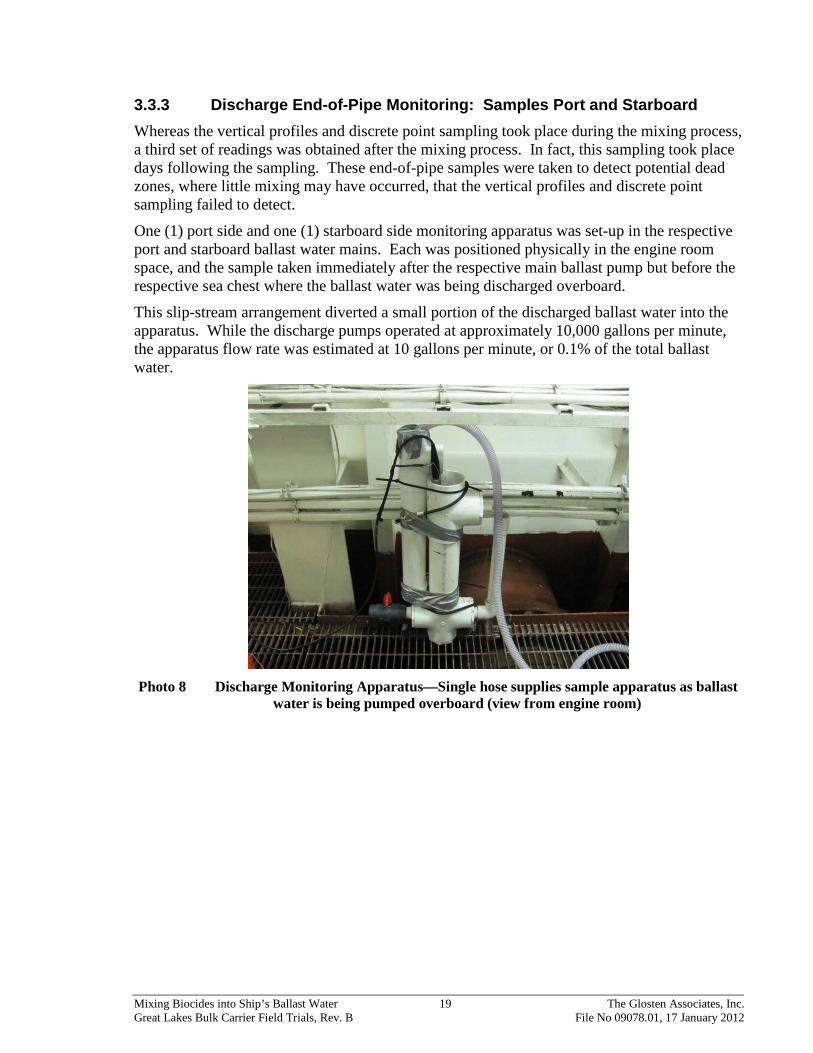
3.3.3 Discharge End-of-Pipe Monitoring: Samples Port and Starboard Whereas the vertical profiles and discrete point sampling took place during the mixing process, a third set of readings was obtained after the mixing process. In fact, this sampling took place days following the sampling. These end-of-pipe samples were taken to detect potential dead zones, where little mixing may have occurred, that the vertical profiles and discrete point sampling failed to detect.
One (1) port side and one (1) starboard side monitoring apparatus was set-up in the respective port and starboard ballast water mains. Each was positioned physically in the engine room space, and the sample taken immediately after the respective main ballast pump but before the respective sea chest where the ballast water was being discharged overboard.
This slip-stream arrangement diverted a small portion of the discharged ballast water into the apparatus. While the discharge pumps operated at approximately 10,000 gallons per minute, the apparatus flow rate was estimated at 10 gallons per minute, or 0.1% of the total ballast water.
Photo 8 Discharge Monitoring Apparatus—Single hose supplies sample apparatus as ballast
water is being pumped overboard (view from engine room)

Mixing Biocides into Ship’s Ballast Water 20 The Glosten Associates, Inc. Great Lakes Bulk Carrier Field Trials, Rev. B File No 09078.01, 17 January 2012
Photo 9 Making Discharge Sampling Connection
3.3.4 Sampling System Apparatus and Instruments The sampling apparatus was purpose built to permit reliable monitoring of the many discrete sampling locations, with a few sets of instruments. Given sixty-eight discrete locations, it was not fiscally feasible for the project to have sixty-eight sets of instruments. The objectives of the sampling device included:
• Means for quick and easy change from one discrete point to a second.
• De-bubbling of the sample to prevent false readings of the instrument.
• Submersion of the instrument maintained (e.g., kept “wet”) to prevent out-of-range readings that would delay rapid sampling.
The sample water flowed from the tubing (either directly from the ballast tank, or through a manifold) through a 50 micron sediment strainer and into the side of a four-inch diameter PVC sonde chamber. The sample water was drained down the vertical length of the chamber into a tee-fitting, then up through a discharge tube, and then dumped to waste. The discharge tube functioned like a weir, keeping the sonde chamber water level above the sample inlet to minimize air entrainment. Further, the sonde chamber was open at the top to allow any entrained air to escape. The sonde itself sat inside the sonde chamber (figure 7).
A second bottom connection was used to periodically flush sediment from the bottom of the main chamber. The discharge tube served a second function, as it allowed a location for grab samples to be taken.

Mixing Biocides into Ship’s Ballast Water 21 The Glosten Associates, Inc. Great Lakes Bulk Carrier Field Trials, Rev. B File No 09078.01, 17 January 2012
• In the case of periodic sampling, the ballast water flowed into a manifold. By opening and closing manifold valves, ballast water from the selected discrete point was routed to the apparatus.
• In the case of continuous sampling, the ballast water flowed directly from the discrete sampling tube into the apparatus, by-passing the manifold.
Figure 7 Sampling Apparatus Arrangement
Water quality measurements were performed with the YSI Optical Monitoring System (OMS) 600 system, which was outfitted to measure conductivity, temperature, and Rhodamine concentration. For continuous monitoring, readings were automatically recorded at set intervals in the data logger. For discrete monitoring, readings were manually entered into the display and recorded on log sheets.

Mixing Biocides into Ship’s Ballast Water 22 The Glosten Associates, Inc. Great Lakes Bulk Carrier Field Trials, Rev. B File No 09078.01, 17 January 2012
Photo 10 Sampling Instrumentation—YSI 650 Multiparameter Display System, YSI 600
Optical Monitoring System Sonde, and YSI 6130 Rhodamine Sensor
Table 2 YSI 600 OMS Specifications—only conductivity, temperature, and Rhodamine
recorded during trials (table by YSI International)

Mixing Biocides into Ship’s Ballast Water 23 The Glosten Associates, Inc. Great Lakes Bulk Carrier Field Trials, Rev. B File No 09078.01, 17 January 2012
3.3.5 Sampling Regime
3.3.5.1 Phase II Trials
During the Phase II Trials, samples were taken at approximately 1, 2, 4, 8, 16, 24, 36, 48, and 60 hours after each mixing method was applied. This included both the vertical profiles and the tank discrete points. Discharge end-of-pipe continuous sampling was performed during deballasting of the six test tanks.
A grab sample routine was established for the tank discrete points in the case of an instrument failure, or in the event that Rhodamine concentrations exceeded the capacity of the instrumentation. Several samples were taken as precautionary measures but, as no failures occurred, the samples were not analyzed. In addition, samples were also taken from each B, C, D, and E location after reaching the 60-hour mark for that particular tank. These samples were taken in case that post-processing indicated an inconsistency in the instrument readings. As post-processing indicated consistent trends, such as dye concentrations moving towards equilibrium, these grab samples were not analyzed.
3.3.5.2 Phase III Sampling
The Phase III nozzle and air lift mixing methods (Tanks 3P, 3S, 4P, and 4S) were expected to mix the ballast tanks more rapidly than the methods employed during Phase II. Therefore, tank discrete samples were taken at approximately ten-minute intervals. Vertical profiles were not taken. For the two control tanks that repeated the vent dosing passive mixing method (5P and 5S), the Phase II sampling procedure for tank discrete monitoring was employed except, again, vertical profiles were not taken.
As with Phase II, discharge end-of-pipe continuous sampling was performed during deballasting of the six test tanks, and grab samples were taken which were analyzed by the University of Minnesota, Duluth.

Mixing Biocides into Ship’s Ballast Water 24 The Glosten Associates, Inc. Great Lakes Bulk Carrier Field Trials, Rev. B File No 09078.01, 17 January 2012
Section 4 Mixing Trials Objectives and Methods
4.1 Objectives The objectives of the mixing trials included:
• Establishing a rough estimate of the off time required for various methods to mix a ballast tank.
• Establishing a relative ranking between the methods based on: time for mixing, difficulty of set-up, and suitability for full or empty ballast tanks.
4.1.1 Dye Concentration Deviation and “Fully Mixed” The trials were set-up to measure the relative differences in dye concentration over time.
The use of a biocide demands that all portions of a tank are exposed to a minimum concentration. Therefore, mixing efficiency for ballast water biocide application is of concern with regard to the deviation between the target dose and the lowest concentration. For example, if biological efficacy requires a minimum dose of 10 parts per million, a dose of 11 parts per million should be applied to account for an expected deviation of 10%.
The trials were set-up to be able to determine when dye concentrations reached a deviation of less than 25% and 10%. This less than 10% deviation, for the purposes of the trials, was considered to be fully mixed. The selection of a 10% deviation for a fully mixed tank was selected as similar to the accuracy of biocide concentrations and measurement instruments. Field teams need to consider multiple uncertainties when applying the biocides, including their ability to fully mix it into a ballast tank, the actual ballast tank water volume; the actual concentrations of biocide concentrates, and biocide application challenges.
4.1.2 Practical Timeframes The timing of dye concentration measurements was adjusted to suit the expected times of the various methods to mix into the ballast water tanks. For Phase II trials, the expected timeframe for mixing the tanks was more than one day. Therefore, measurements were never more than once an hour and, in the later stages of mixing, intervals were more than four hours. For Phase III trials, the expected timeframe was less than two hours and, therefore, measurements were conducted at ten minute intervals.
The measured timeframes were well within practical timeframes for applying biocides on marine vessels. In an actual incident, an emergency response team would likely be needed to treat multiple tanks, and one or more treatment kits would be moved between these multiple tanks. From an application perspective, this would require set-up, mixing time, and then breakdown. Many marine operations take place in four-hour shifts; at the end of the period, either the team is then changed out or a rest period takes place. Thus, practical field application methods would fall into the following categories:
• Less than two hours, where multiple ballast tanks could be dosed within a single shift. • Between two and four hours, where one ballast tank could be dosed per shift. • Greater than eight hours, where dosing a ballast tank would take more than one shift
and need multiple application crew.

Mixing Biocides into Ship’s Ballast Water 25 The Glosten Associates, Inc. Great Lakes Bulk Carrier Field Trials, Rev. B File No 09078.01, 17 January 2012
4.2 Mixing Trials Overview
4.2.1 Phase II—Passive Mixing Methods Trials The Phase II trials tested five methods for mixing biocides into full and empty ballast water tanks. The methods were selected as they could be practically executed using equipment commonly available on board most marine vessels. As such, these methods could assist a vessel operator attempting to handle their own high-risk ballast water in an emergency.
In each test, a tracer dye was used in place of the biocide. As the mixing methods were predicted to take several days to reach 95% efficiency, only one test per each of the six (6) tanks was planned and executed. Of the five (5) methods, only the vent dosing was replicated. The other methods were performed only once, which allowed for a relative comparison between the methods, but lacked a means to judge the repeatability of that specific method.
Table 3 - Passive Mixing Methods Overview
TANK MIXING
METHOD DESCRIPTION APPLICATION BENEFIT 5P Bulk-on-
Bottom Dosing
Dye was pumped into an empty ballast water tank. The mixing energy was provided by the force of the ballast water filling the ballast tank.
Can be used in cases where slack tankage exists on the casualty vessel and re-distribution of ballast water may decrease ground reaction at the impingement point. Ballast water entering the tank can mix the dye upon entry.
5S In-Line Dosing
Dye was pumped into the ballast piping while the ballast water is being filled. The mixing energy was provided by the turbulence in the main ballast piping, and the force of the ballast water itself entering and filling the ballast tank.
Can be used in cases where slack tankage exists on the casualty and re-distribution of ballast water may decrease ground reaction at the impingement point. Dye can mix into the ballast water before entering the tank.
3P Internal Transfer Dosing
Dye was pumped into the circulating water loop of a full ballast water tank. The loop removed ballast water from one tank location, and pumped it into another tank location. The mixing energy was provided by the transfer pump, moving the ballast water.
Can be used in cases where tanks are already filled and there are sufficient tank fittings and equipment to set up the circulation loop. Dye is injected into the circulation loop after flow is established through the portable pump. The circulation loop promotes fluid motion inside the tank to promote mixing, even without the presence of natural vessel motion.
3S Perforated Hose Dosing
Dye was pumped into a 3/4" perforated hose that hung vertically through the water column of a full ballast tank. Energy was imparted by the force of the dye pump.
Can be used in cases where tanks are already filled and there are vents or manholes that allow vertical access from tank top to tank bottom. Equipment is readily available on most vessels and setup for this procedure is easy. Natural motion of the vessel continues mixing the dye after injection is complete.
4P & 4S
Vent Dosing Dye was pumped onto the top of a full ballast water tank through a tank vent opening. Energy is imparted by the freefall of the dye.
Can be used in cases where tanks are already filled and there are vents or manholes that allow access into the tank top. Equipment is readily available and there is almost no equipment setup required.

Mixing Biocides into Ship’s Ballast Water 26 The Glosten Associates, Inc. Great Lakes Bulk Carrier Field Trials, Rev. B File No 09078.01, 17 January 2012
The 4P and 4S tanks tested only one mixing method, in order to promote repeatability in results. This mixing technique is currently the most widely used method for applying biocide to ballast tanks with high risk ballast water, so it was critical to get accurate results from this tank pair. For these trials, ballast water was first pumped into the 5P and 5S tank pair, then into the 3P and 3S tank pair, and then, finally, into the 4P and 4S tank pair.
4.2.2 Phase III—Active Mixing Methods Trials Phase III repeated the vent dosing method from the Phase II trials, and introduced six new methods for mixing biocides into ballast water tanks. The first two new methods were variations on air lifts that released compressed gas at the bottom of the ballast tank to impart mixing. The next four methods were variations of water jet mixing, two of which used educators and two of which used nozzles. A total of sixteen (16) tests were conducted in the Phase III shipboard trials.
Table 4 Methods and Tests Overview for Phase III Trials
TANK MIXING METHOD DESCRIPTION
# of Trials BENEFIT
3P Air-Lift: Two Diffuser tables with large footprint
Two widely spaced air-lift diffuser tables established a ~6' square bubble column, resulting in circulation of ballast water within tank. Dye was injected into each of the bubble columns.
3 Very rapid mixing potential. Requires in tank assembly so cannot be used on existing full tank. Requires specialty hardware to construct diffuser grid that may be harder to source.
4P Air-Lift: Three Point Diffusers
Three widely spaced air-lift point diffusers, each establishing a bubble column, resulted in circulation of ballast water within tank. Dye was injected into each of the bubble columns.
3 Can be used in cases where tanks are already filled and there are vents or manholes that allow vertical access from tank top to tank bottom. Cylindrical diffusers can be lowered into tank through manholes or removable vent piping. Diffusers can be made from materials available at most industrial supply houses.
3S Eductor: Three Longitudinally Spaced Units
Three widely spaced water powered eductors each established circulation of ballast water within the tank. Dye was injected into each of the eductors.
1 Can be used in cases where tanks are already filled and there are vents or manholes that allow vertical access from tank top to tank bottom. Eductors can be lowered into full tank from manholes or removable vent pipes. Water to power the eductors can be provided by the vessel’s washdown or firemain system.
3S Eductor: Two Units at Longitudinal Midpoint of Tank
Two water powered eductors were located at a single centered location in the ballast tank. Each eductor established circulation of ballast water within the tank. Dye was injected into each of the eductors.
2 Can be used in cases where tanks are already filled and there are vents or manholes that allow vertical access from tank top to tank bottom. Eductors can be lowered into full tank from manhole or removable vent pipes. Water to power the eductors can be provided by the vessel’s washdown or firemain system.

Mixing Biocides into Ship’s Ballast Water 27 The Glosten Associates, Inc. Great Lakes Bulk Carrier Field Trials, Rev. B File No 09078.01, 17 January 2012
TANK MIXING METHOD DESCRIPTION
# of Trials BENEFIT
4S Nozzle: Three Units Longitudinally Spaced
Three widely spaced water powered nozzles each established circulation of ballast water within tank. Dye was injected into each of the eductors.
3 Can be used in cases where tanks are already filled and there are vents or manholes that allow vertical access from tank top to tank bottom. Nozzles can be lowered into full tank from manholes or removable vent pipes. Water to power the nozzles can be provided by the vessel’s washdown or firemain system.
4S Nozzle: Two Units at Longitudinal Midpoint of Tank
Two water powered nozzles were located at a single centered location in the ballast tank. Each eductor established circulation of ballast water within the tank. Dye was injected into each of the nozzles.
2 Can be used in cases where tanks are already filled and there are vents or manholes that allow vertical access from tank top to tank bottom. Nozzles can be lowered into full tank from manhole or removable vent pipes. Water to power the Nozzles can be provided by the vessel’s washdown or firemain system.
5P & 5S
Vent Dosing Dye was pumped into the vent of a filled ballast tank and allowed to mix using natural ship motion.
2 (1 per tank)
Control test repeated from Phase 2 testing. Can be used in cases where tanks are already filled and there are vents or manholes that allow access into the tank top. Equipment is readily available and there is almost no equipment setup required.
4.3 Tracer Dye Selection and Application
4.3.1 Dye Selection A tracer dye, Rhodamine WT, was selected to evaluate the efficiency of the various mixing methods. The dye met multiple selection criteria for the testing effort, as:
• It was commercially available and widely used field instrumentation and dye batches.
• Regulatory agencies were generally familiar with dye, which decreased the time and effort to gain required permits.
• It was fit for purpose, with a documented history of use in previous shipboard, wastewater, and geological trials.
• It had suitable chemical properties for conservative test results, it: o Was a similar density to the tested ballast water at dilute concentrations,
o Had a low molecular diffusion rate, which assured that mixing results were primarily a function of physical mixing actions and not chemical reactions.
• As an inert compound, it was safe for handling with standard personal protection equipment.
The trials were conducted in accordance with permits from Wisconsin, Michigan, and Minnesota. Although allowable discharge concentrations were generally higher, applications and methods targeted an end-of-pipe discharge concentration of 120 ug/L.

Mixing Biocides into Ship’s Ballast Water 28 The Glosten Associates, Inc. Great Lakes Bulk Carrier Field Trials, Rev. B File No 09078.01, 17 January 2012
4.3.2 Setting Data Confidence Requirements Dye application and measurement methods were developed to provide general guidance to first responders in estimating both: the time required for applying the method, and the expected deviation between target biocide concentration and actual concentrations in the ballast water tank after the application of that method. For the purposes of this report and in broad terms, the mixing efficiency is considered to be the time required for a particular method to achieve a target deviation. These trials set the target deviation at 25% and 10%, as that level of accuracy was in line with a first responder’s ability to estimate ballast tank volumes, measure biocide bulk quantities, and time the application of various mixing methods.
Further, it is important to understand that the trials could only provide the first responder with the relative mixing efficiency of the various trialed methods. This is because marine vessel ballast tanks vary significantly in configuration and volume. As such, the required mixing times and measured dosing deviations experienced with the trial tank configurations could not be directly applied to different tank configurations. The tank configurations used in the trial were moderately complex, and included a short double bottom portion and deep frames that hindered mixing. Marine vessel tank configurations include deep tanks that could be more easily mixed, as well as more complex “L-shaped” tanks that have more extensive baffling and a more extended double bottom portion that could be more difficult to mix. The volume of ballast water in the trial tanks was generally 880,000 gallons. This was generally on the high end of ballast tank volumes. It may be reasonable to assume that achieving mixing in smaller capacity tanks would require less mixing.
In practice, a first responder will be able to use the mixing efficiency indicated in the trials as one of the criteria in selecting a method. Other criteria might include availability of equipment, physical limitations of the tanks to be treated, and time available to perform the mixing. The first responder will also be able to use the time to complete mixing of the selected method as a rough indicator for planning purposes. It should also be noted that most biocides will diffuse through the water at a much faster rate the test dye which may reduce the need for complete mixing efficiency.
At this time, there are no guidelines for how conservative a first responder might be in actually applying the trialed methods in actual practice. However, based on consultation with a marine salvage engineer, it is understood that first responders generally work with rough estimates and tend to be conservative. For example, if trials indicated that mixing methods required 105 minutes, a first responder might be conservative and plan to apply the method for 120 minutes. For an additional example, if trials indicated that a mixing method achieved a deviation between the high and low concentration of 10%, a first responder might be conservative and apply a dose 20% higher than required. A first responder is also likely to obtain and measure samples to confirm that the required targets had in fact been reached. Confidence that adequate mixing has actually been achieved will require the responder to take measurements during and/or following employment of the selected method.
Understanding the end use of the report findings decreased the trial methods focus on accuracy and bias, and increased its focus on repeatability and representativeness; e.g., it was more important to measure how readings converged than it was to know their absolute value.

Mixing Biocides into Ship’s Ballast Water 29 The Glosten Associates, Inc. Great Lakes Bulk Carrier Field Trials, Rev. B File No 09078.01, 17 January 2012
4.3.3 Accuracy and Percent Deviation Accuracy of the field measurements are a combination of the ability to dose the ballast tanks to target dye chemical concentration and then to measure those concentrations. However, the accuracy of the overall testing efforts can be improved by employing methods that rely on comparative measures rather than absolute concentrations.
The first challenge was to dose the tanks to a known dye concentration. The dye batch, sold as a 20% concentration, was provided by the manufacturer as only accurate within +/- 5%. To measure the dye for the dosing we used a 2,000 mL graduated cylinder with 10 mL graduations. For a measurement of 1,740 mL, the accuracy was +/- 6%. To determine the ballast tank volume, we used the ship’s tank level indicating system. Based on experience and conversations with the ship’s crew, we estimated the accuracy to be at least +/-5%. Combined, our ability to dose the ballast tanks to an absolute dye concentration was +/- 16%.
The second challenge was to determine the accuracy of measurements. First, we developed a standard (discussed below) for calibrating the instrument. We used an electronic scale rated for 120 to 0.01 grams, accurate within +/-0.02 grams. Based on measuring ~24 grams, our accuracy was +/- 0.1%. We then accounted for the nameplate accuracy of our dye concentration sonde, details above, which is +/-5%. Combined, we rounded to +/- 5%.
The third challenge was our ability to take repeated readings in various locations throughout the ballast water tank in space and time. As our focus was to compare the dye concentration differences between the various locations, ideally all readings would have been taken at the same time. One way to accomplish this (although we did not implement this option) would have been to deploy multiple instruments in each tested tank. In this way, the readings would have had occurred at the same time, and the time variable would be mostly eliminated from our accuracy considerations. However, even with time removed from the equation of accuracy, we also needed to consider dose accuracy of +/-16% and measurement accuracy of +/-5% for a combined +/-21% accuracy. Given that we were focusing on reducing the difference in dye concentrations to less than 10%, this level of accuracy was problematic.
The approach we took to address this challenge was to use the same instrument for all readings. (Note – we did use two supplementary meters during phase 3 trials.) We then combined the consideration that we were using one meter, with the consideration that we were looking for differences in concentration, to determine that we could almost disregard considerations of absolute value measurements; “almost,” only because we still needed to stay within the limits of the meter, and because the meter accuracy was dependent on the total deflection.
Our focus, therefore, was the ability of the instrument to repeatedly provide the same reading when reading the same dye concentration. There were multiple challenges for accurately repeating such readings. We took various steps to account for those challenges.
To limit the impact of bubbles on the lens, the unit was cleaned before starting a reading series. The impact of temperature was limited because the meter self-corrects for temperature, and the ballast tank temperatures were fairly consistent.
The meters tended to drift over time. For example, following a five hour testing period on 23 April 2009, the three meters had all drifted from a 100 ug/L calibration to 100.5, 97.6, and 101.7 ug/L. This implied a drift of at least 2.4% in one case. However, it should be noted that
Mixing Biocides into Ship’s Ballast Water 30 The Glosten Associates, Inc. Great Lakes Bulk Carrier Field Trials, Rev. B File No 09078.01, 17 January 2012
the target concentration that was being measured was 120 ug/L and all of those measurements were being taken during a short (perhaps ten minutes) interval. As such, the drift becomes insignificant (2.4% over five hours is perhaps 0.1% over 10 minutes) when comparing readings taken.
This however, still did not account for the space and time differences. Three sets of vertical column readings were taken through the vents of tank 3 port on 22 April 2009 after the tank was “fully mixed.” Each of the fifteen readings was taken from a different physical location, and at a slightly different time over a roughly ten minute period. These readings were: 124.2, 124.5, 123.7, 124.3, 124.5, 123.4, 123.4, 123.2, 124.5, 123.5, 122.2, 122.0, 122.0, 122.0, and 122.0 (all in ug/L). The standard deviation was 1.0 ug/L or less than 1%.
In conclusion, our focus on comparing sequential readings utilizing the same instrumentation provided accuracy in the range of +/-1%.
4.3.4 Dye Standards and Instrument Calibration Each instrument used underwent a two-point calibration process in accordance with the instrument manufacturer’s instructions. The zero used non-dyed lake water from the same source as the ballast tanks, and the span standard was the product of the non-dyed lake water and the actual dye batch that was used to dose the tanks. The span standard was developed by means of weighing a quantity of the 20% dye concentrate, and then undergoing three-serial dilutions based on volume to produce a 120 ug/L standard. Instruments were zeroed and spanned before the trials.
Following each trial, the instruments were checked against the zero and span to determine instrument drift. During Phase III trials, instruments checked against the standard indicated drift ranging from 117 ug/L to 127 ug/L, against the 120 ug/L standard.
4.3.5 Dose Measurement The longer mixing times required for Phase II methods only allowed one test per available ballast water tank. Consequently, the dosing concentration targeted 120 ug/L as it is: (a) below permit requirements, and (b) within the instrumentation range of 0–200 ug/L. The shorter mixing times required for Phase III methods allowed planning for three tests per ballast water tank. As such, the dosing concentrations were stepped in three phases: 35 ug/L; 70 ug/L; and then, finally, 140 ug/L. In both trial sets, the ballast water tanks were filled with approximately 3,330 metric tons of ballast water. Rhodamine WT at 20% concentration and a specific gravity of 1.13 was used for both trials.
For each Phase II test, approximately 1,750 mL was measured on a volumetric basis, using a graduated cylinder to suit the 120 ug/L target concentration. The graduated cylinder contents were poured into a transfer container with a sealed cap. The graduated cylinder was then rinsed three times with lake water, with the wash added to the transfer container.
For Phase III trials, approximately 2,000 mL of dye concentrate was measured for each tank using a graduated cylinder to suit a final target concentration of 140 ug/L. As three tests were planned for each tank, this 2,000 mL of dye concentrate was proportioned between three transfer containers, each dedicated for a separate test. The graduated cylinder was then rinsed three times with source water, with the wash roughly proportioned between the transfer containers.

Mixing Biocides into Ship’s Ballast Water 31 The Glosten Associates, Inc. Great Lakes Bulk Carrier Field Trials, Rev. B File No 09078.01, 17 January 2012
4.4 Equipment The methods trialed in Phase II assumed that the response team only had access to typical vessel’s equipment. In general, this consisted of small pump(s), hoses, fittings, and drums.
The methods trialed in Phase III assumed that certain equipment would be brought on board the vessel by the response team. This equipment was mostly available at industrial supply stores and rental companies, but may be harder to obtain on short notice.
4.4.1 Basic Equipment Basic equipment used in the trials included the following.
• Pump (1): Execution required use of a small pump with capacity between 5 and 20 gallons per minute, a check valve on discharge side, and adequate head to overcome ballast main pressure. The trials actually used a Wilden P1 air-operated diaphragm pump rated at 15.5 gallons per minute and a maximum pressure of 125 psi.
• Drum (1): Execution required a 20 to 50 gallon capacity, to add chemical diluted with water. The trials used plastic trash barrels at 40 gallon capacities.
• Hose (2): Execution required hoses of 3/4 to 1 inch in diameter, with length and fittings to suit. These were rated to the greater of the ballast main pressure or small pump head. One hose was fitted to the suction side of the pump, and the second hose to the discharge side of the pump. Actual trials used a 1–inch, spiral wound PVC hose, rated for discharge and suction use.
Photo 11 Phase II Trial Small Pump, Hoses, and Dosing Drum
4.4.2 Method-Specific Equipment Method-specific equipment used in the trials included the following.
• Perforated Hose Equipment: This equipment supported the “Perforated Hose” Method conducted in Phase II trials.

Mixing Biocides into Ship’s Ballast Water 32 The Glosten Associates, Inc. Great Lakes Bulk Carrier Field Trials, Rev. B File No 09078.01, 17 January 2012
o Hose (1): A 3/4-inch diameter hose, approximately forty feet in length, was used in the trials. The hose was a “red rubber” utility hose typically used in shipboard compressed air service. The hose was drilled with 1/8" diameter holes, spaced evenly 6" to 12" apart along the 20 foot submerged length of the hose, on all sides of the hose. The end of the hose was plugged. The end of the hose was weighted so that it would hang vertically (about 5 pounds of weight).
Photo 12 Testing the spray pattern of the perforated hose prior to in-tank test
• Internal Transfer Equipment: This equipment supported the “Internal Transfer” Method conducted in Phase II trials.
o Hose (2): Several three-inch hoses were used for suction and discharge service to the diaphragm pump.
o Transfer Pump (1): A Wilden M8 three-inch diaphragm pump was used, which was rated to a maximum of 165 gallons per minute.
o Chemical Injection Manifold (1): The manifold used consisted of a tee fitting connected to the inlet side of the pump. A valve and reducer were connected to the branch side of the tee for injection of the chemical.
Photo 13 Internal transfer method, showing suction hose from ballast tank leading to
diaphragm pump

Mixing Biocides into Ship’s Ballast Water 33 The Glosten Associates, Inc. Great Lakes Bulk Carrier Field Trials, Rev. B File No 09078.01, 17 January 2012
• Eductor Equipment (2 or 3 eductors): This equipment supported the “Eductor Mixing” Methods conducted in Phase III trials.
o Hose: Trials used 3-inch diameter rigid hoses. The length reached from the water supply on the main deck to each of the three eductor locations. The hoses were run in parallel with each other.
o Eductor: Eductors had orifices sized to suit a water supply flow from the ship’s firemain, with a flow rate estimated at 325 gallons per minute.
o Flow meter: These were used to measure the flow to each of the three eductors. o Valves: These were used to balance the flow between each of the eductors. o Fittings: These were used to allow injection of dye into each hose.
Photo 14 Eductor mounted to vessel structure in ballast tank
• Nozzle Equipment: This equipment supported the “Nozzle Mixing” Method conducted in Phase III trials.
o Hoses: Trial used two-inch diameter rigid hoses, each for individual nozzles. The length reached from the water supply on the main deck to each of the nozzle locations. The hoses were run in parallel with each other.
o Nozzles: Three (3) nozzles were used, each were one and one-half inch (1-1/2") NST base solid stream nozzle with three quarter inch (3/4") or seven-eighths inch (7/8") outlet. Each assumed a supply of ~150 gallons of water a minute at 50 pounds per square inch at each nozzle inlet.
o Flow meters: These were used to measure the flow to each of the nozzles. o Valves: These were used to balance the flow between each of the nozzles. o Fittings: These were used to allow injection of chemical into each hose.

Mixing Biocides into Ship’s Ballast Water 34 The Glosten Associates, Inc. Great Lakes Bulk Carrier Field Trials, Rev. B File No 09078.01, 17 January 2012
Photo 15 Nozzle mounted to vessel structure inside ballast tank
• Air Lift Equipment: This equipment supported the “Air Lift (Point Diffuser)” Methods conducted in Phase III trials.
o Air compressor(s): Used a diesel powered air compressor(s) that provided 150 scfm per point diffuser.
o Pressure reducing station: Used to reduce air pressure to ~15psi at the tank bottom.
o Hoses: Used one and one-half inch (1-1/2") diameter hose for each point diffuser, rated 30psi minimal, with length and fittings to suit. The length reached from the air supply on the main deck to each of the diffuser locations. The hoses were run in parallel with each other.
o Point Diffusers: Used largest diameter PVC pipe (Schedule 40) that fit through manhole or cut off vent pipe, roughly three feet (~3') long, capped and plumbed with fittings to attach to air hose, with one eighth inch (1/8") holes drilled on three inch (3") centers over whole surface of pipe.
o Valves: Sized to suit air hose and used to balance the flow between the point diffusers.
o Hose: Used a small diameter hose to suit chemical pump with length to match each air hose to inject chemical at each diffuser location. Fittings split and balanced flow between all lines.

Mixing Biocides into Ship’s Ballast Water 35 The Glosten Associates, Inc. Great Lakes Bulk Carrier Field Trials, Rev. B File No 09078.01, 17 January 2012
Photo 16 Point diffusers, 10" diameter pipes, 36" long, with ~100 holes each 1/8" diameter
• Air Lift Equipment: This equipment supported the “Air Lift (Grid Diffuser)” Methods conducted in Phase III trials.
o Air compressor(s): Used a diesel powered air compressor(s) that provided 250 scfm to each grid diffuser.
o Pressure reducing station: Used to reduce air pressure to ~15psi at the tank bottom.
o Mist eliminator or air dryer to prevent icing during pressure reduction. o Hose: Ran two-inch (2") diameter hose to each grid diffuser, rated 30psi
minimal, with length and fittings to suit. The length reached from the air supply on the main deck to each of the diffuser locations. The hoses ran in parallel with each other.
o Grid of Diffusers: Used a grid of course bubble puck diffusers, spaced in a twelve inch (12") grid, diffuser array sized to fit between deep web frames. Fittings made air tight connections to pucks and air hose.
o Mounting system held diffuser grid in place. o Valves: Valves were sized to suit air hose, and used to balance the flow
between each of the diffuser grids. o Hose: Used a small diameter hose to suit chemical pump with length to match
each air hose to inject chemical at each diffuser location. Fittings split and balanced flow between all lines.

Mixing Biocides into Ship’s Ballast Water 36 The Glosten Associates, Inc. Great Lakes Bulk Carrier Field Trials, Rev. B File No 09078.01, 17 January 2012
Photo 17 Grid diffuser, 18 course bubble puck diffusers
Photo 18 Air supply on deck for point and grid diffuser trials

Mixing Biocides into Ship’s Ballast Water 37 The Glosten Associates, Inc. Great Lakes Bulk Carrier Field Trials, Rev. B File No 09078.01, 17 January 2012
4.5 Method 1: In-Line Dosing This method was used to simulate treatment of the water as it was delivered to an empty ballast tank (Tank 5S) during the uptake of ~880,000 gallons of ballast water.
The in-line dosing method injected the dye directly into the ballast main while the ballast was being gravitated or pumped into the ballast tank. The mixing took place both in the piping, as well as in the tank. For these trials, the testing team:
1. Determined how much day was needed to treat the target ballast tank.
2. Connected the small pump and hose between the drum and the ballast pump (preferably on pump suction side).
3. Filled the drum with water, started the dye dosing pump, and continued filling the drum with water such that it stayed partially full.
4. Started ballasting, added dye to drum in proportion to amount of ballast water loaded. Continued filling drum with water such that it stayed partially full.
5. Finished adding dye before all the ballast water was in the tank to ensure 100% of dye had been added to the drum before finishing ballasting. This allowed the drum to be flushed and emptied into the ballast line as filling of the tanks was being completed.
Figure 8 Overview of inline dosing method
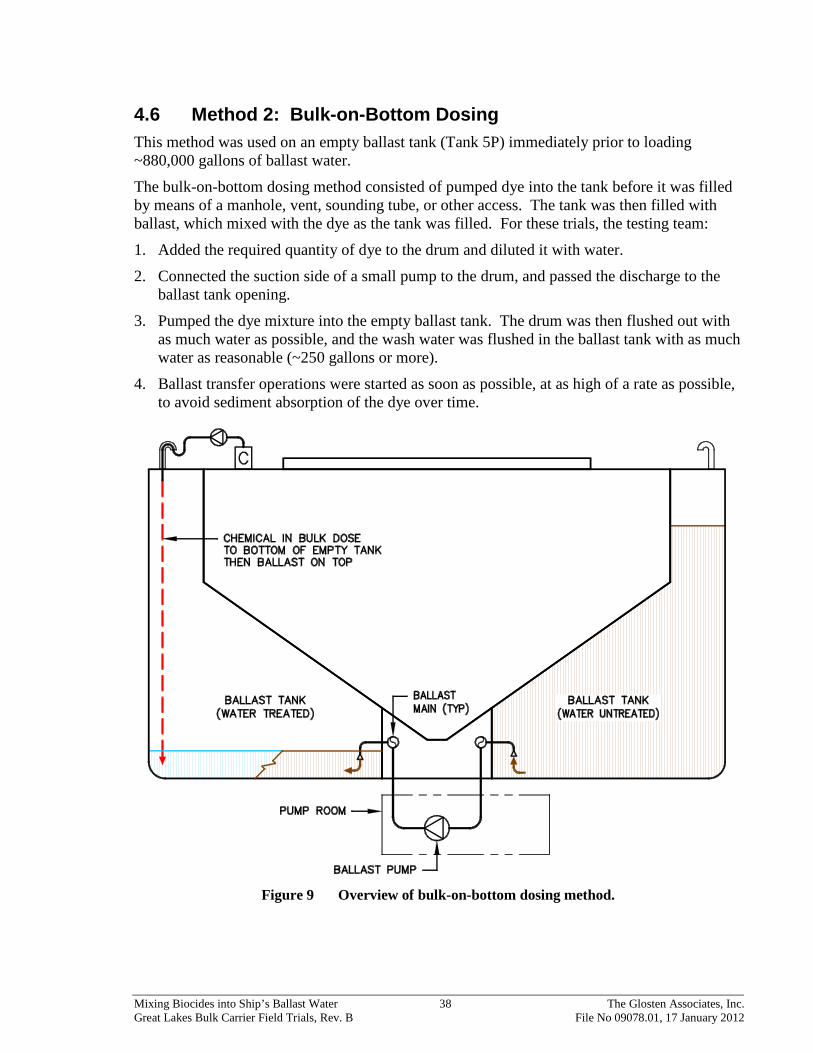
Mixing Biocides into Ship’s Ballast Water 38 The Glosten Associates, Inc. Great Lakes Bulk Carrier Field Trials, Rev. B File No 09078.01, 17 January 2012
4.6 Method 2: Bulk-on-Bottom Dosing This method was used on an empty ballast tank (Tank 5P) immediately prior to loading ~880,000 gallons of ballast water.
The bulk-on-bottom dosing method consisted of pumped dye into the tank before it was filled by means of a manhole, vent, sounding tube, or other access. The tank was then filled with ballast, which mixed with the dye as the tank was filled. For these trials, the testing team:
1. Added the required quantity of dye to the drum and diluted it with water.
2. Connected the suction side of a small pump to the drum, and passed the discharge to the ballast tank opening.
3. Pumped the dye mixture into the empty ballast tank. The drum was then flushed out with as much water as possible, and the wash water was flushed in the ballast tank with as much water as reasonable (~250 gallons or more).
4. Ballast transfer operations were started as soon as possible, at as high of a rate as possible, to avoid sediment absorption of the dye over time.
Figure 9 Overview of bulk-on-bottom dosing method.
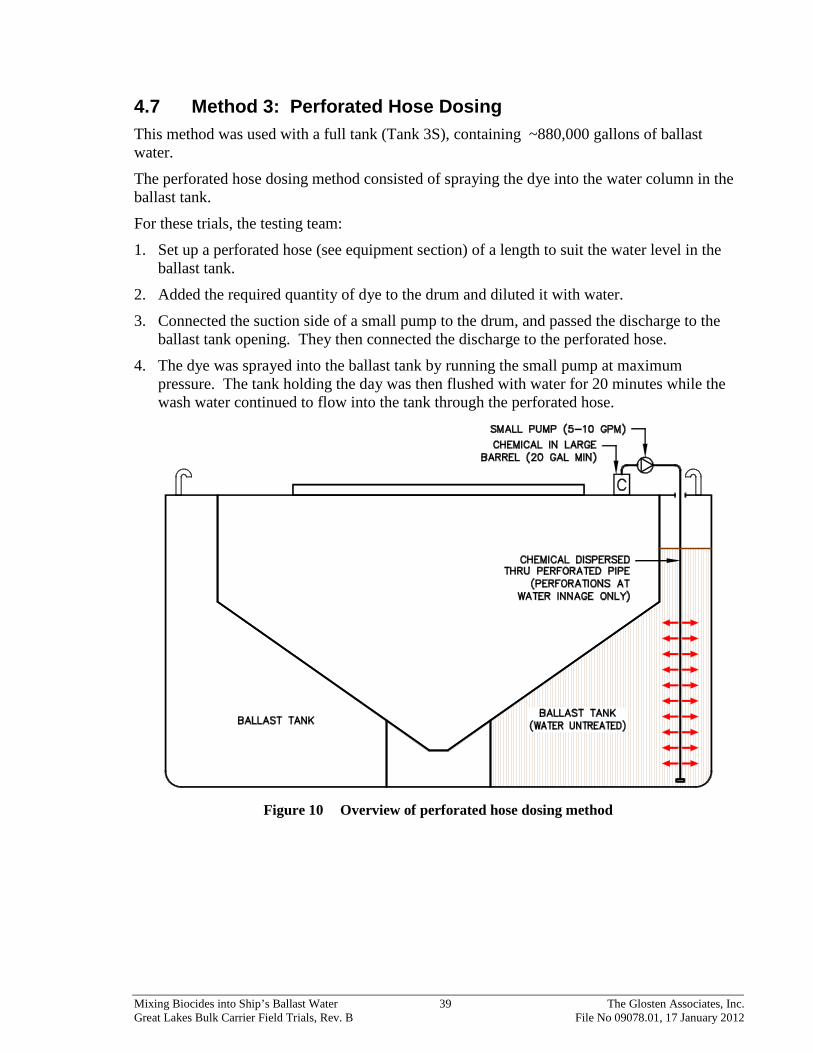
Mixing Biocides into Ship’s Ballast Water 39 The Glosten Associates, Inc. Great Lakes Bulk Carrier Field Trials, Rev. B File No 09078.01, 17 January 2012
4.7 Method 3: Perforated Hose Dosing This method was used with a full tank (Tank 3S), containing ~880,000 gallons of ballast water.
The perforated hose dosing method consisted of spraying the dye into the water column in the ballast tank.
For these trials, the testing team:
1. Set up a perforated hose (see equipment section) of a length to suit the water level in the ballast tank.
2. Added the required quantity of dye to the drum and diluted it with water.
3. Connected the suction side of a small pump to the drum, and passed the discharge to the ballast tank opening. They then connected the discharge to the perforated hose.
4. The dye was sprayed into the ballast tank by running the small pump at maximum pressure. The tank holding the day was then flushed with water for 20 minutes while the wash water continued to flow into the tank through the perforated hose.
Figure 10 Overview of perforated hose dosing method

Mixing Biocides into Ship’s Ballast Water 40 The Glosten Associates, Inc. Great Lakes Bulk Carrier Field Trials, Rev. B File No 09078.01, 17 January 2012
4.8 Method 4: Internal Transfer Dosing This method was used to circulate water within a ballast tank (Tank 3P) previously filled with ~880,000 gallons of ballast water.
The internal transfer dosing circulated the ballast water internally within a single tank. The dye was metered into the circulation loop during this process. For this trial, the testing team:
1. Set up the Internal Transfer Equipment (see Equipment List section).
2. Started the large circulation pump. This was run during dosing, and for as long afterwards as needed to achieve mixing (several days).
3. Set up small dosing pump and hoses, connecting to the suction manifold. They then added the required quantity of dye into a drum and diluted it with water.
4. Injected the dye into the circulation loop over a period of no less than two hours. The drum was washed with water for 20 minutes and the wash water was injected into the circulation loop.
5. Continued running the circulation loop until mixing was achieved.
Figure 11 Overview of recirculation dosing method—note that trials actually located suction
hose and pump adjacent to the bottom of the tank and pumped "up" to the tank top vent

Mixing Biocides into Ship’s Ballast Water 41 The Glosten Associates, Inc. Great Lakes Bulk Carrier Field Trials, Rev. B File No 09078.01, 17 January 2012
4.9 Method 5: Vent Dosing This method was used in ballast tanks previously filled with ~880,000 gallons of ballast water each (Tanks 4P and 4S for Phase II trials, and Tanks 5P and 5S for Phase III trials as a control test).
The vent/sounding tube dosing method consisted of pumping dye through any available tank opening into the full ballast tank. The dye was expected to mix into the ballast water by a combination of diffusion and any motion which the vessel may undergo. For these trials, the testing team:
1. Added the dye to treat the tank into a drum and diluted with water.
2. Connected a suction side of small pump to the drum, and passed the discharge to the ballast tank opening.
3. Injected the partially full ballast tank with the dye and flushed out the drum with as much water as practical (~250 gallons or more). The wash water was then placed into the ballast tank with as much water as possible.
Figure 12 Overview of vent dosing method
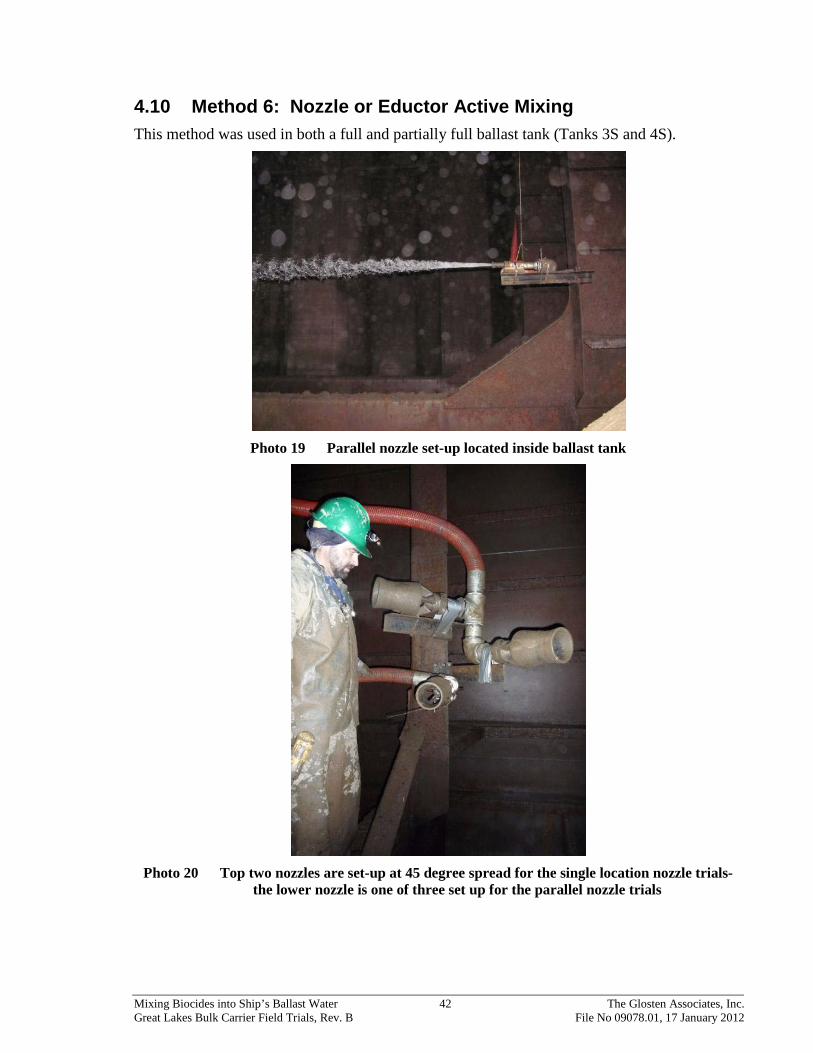
Mixing Biocides into Ship’s Ballast Water 42 The Glosten Associates, Inc. Great Lakes Bulk Carrier Field Trials, Rev. B File No 09078.01, 17 January 2012
4.10 Method 6: Nozzle or Eductor Active Mixing This method was used in both a full and partially full ballast tank (Tanks 3S and 4S).
Photo 19 Parallel nozzle set-up located inside ballast tank
Photo 20 Top two nozzles are set-up at 45 degree spread for the single location nozzle trials-
the lower nozzle is one of three set up for the parallel nozzle trials

Mixing Biocides into Ship’s Ballast Water 43 The Glosten Associates, Inc. Great Lakes Bulk Carrier Field Trials, Rev. B File No 09078.01, 17 January 2012
For these trials, the testing team placed nozzles and eductors inside of the empty tanks. One configuration consisted of one set of two nozzles in a single location, pointing 45 degrees away from each other. A second configuration consisted of a set of three nozzles/eductors in three separate locations in the tank, each in parallel to each other.
The tanks were then filled with ~880,000 gallons of ballast water.
The dye was metered into the nozzle motive water flow from a fire main, and mixed into the ballast water by the turbulent water movement induced by the nozzles. The testing team then:
1. Obtained a source water supply; the vessel's firemain was utilized at ~350 gpm at ~50psi.
2. Nozzles and eductors were fixed on rigid pipes ~3' above bottom structure.
3. The required quantity of dye to treat the tank was added to the drum and then diluted with the source water.
4. Set up the dye injection. The small, high head metering pump was connected in line with the water source.
5. Opened the fire main and established tank circulation.
6. Injected tracer dye into water source over a period of 10-20 minutes. The dye drum was then flushed with water and the wash water was delivered to the tanks through the nozzles or eductors.
7. Ran water through nozzles or eductors for about 2 hours after the start of dye injection to complete mixing.
Figure 13 Overview of three nozzle arrangement

Mixing Biocides into Ship’s Ballast Water 44 The Glosten Associates, Inc. Great Lakes Bulk Carrier Field Trials, Rev. B File No 09078.01, 17 January 2012
Figure 14 Overview of two nozzle, 45 degree arrangement

Mixing Biocides into Ship’s Ballast Water 45 The Glosten Associates, Inc. Great Lakes Bulk Carrier Field Trials, Rev. B File No 09078.01, 17 January 2012
4.11 Method 7: Air Lift Mixing Point Diffuser This method was used in a ballast water tank (Tank 4P) previously filled with ~880,000 gallons.
Three point diffusers were located in the ballast tank along outboard sideshell, centered between deep frames, and spaced equally between the tank vents. The dye was introduced to the tank just above each point diffuser using a pump and tubing. The dye was mixed into the ballast water by turbulent water movement.
Figure 15 Point diffuser located in ballast tank
For these trials, the testing team:
1. Set up diffuser(s), by placing diffuser rigs that created micro-bubbles into the ballast tank and connected the air supply to the diffusers.
2. Set up dye dosing by adding the dye to the drum and diluting it with water. A small pump was used to move the dye to the diffusers in the tanks. The tubing was terminated 1' above each diffuser. The dosing pump was started, and balancing valves used to adjust flow to equalize delivery of dye to the three locations in the tank.
3. Located point diffusers in the tank using an air supply hose until ~4' above the bottom. They then ensured there was enough weight attached to keep them submerged.
4. Started an air supply of approximately 450 scfm at 20 feet of head to establish in tank circulation.
5. Injected the ballast tank with dye over a period of 5-10 minutes. They then flushed the dye drum with water, and pumped the wash water into the tank through the diffuser.
6. Continued to run air through the diffusers for 2 hours after the start of dye injection to complete mixing.

Mixing Biocides into Ship’s Ballast Water 46 The Glosten Associates, Inc. Great Lakes Bulk Carrier Field Trials, Rev. B File No 09078.01, 17 January 2012
Figure 16 Overview of point diffuser method.

Mixing Biocides into Ship’s Ballast Water 47 The Glosten Associates, Inc. Great Lakes Bulk Carrier Field Trials, Rev. B File No 09078.01, 17 January 2012
Section 5 Vessel Dynamics Data Collection
5.1 Objective The efficacy of passive and active mixing methods was influenced by forces generated by normal vessel operations. These forces include accelerations associated with vibration and movement about the vessels major axis, e.g. roll, pitch, and yaw. During initial mixing tests, the instruments/methods described below were used as indicators of these forces.
5.2 Accelerometers A GP1-L programmable accelerometer (Sensr brand) and its associated software were used to measure and summarize accelerations in the x, y and z axis of the vessel during a prescribed sampling period. The x-axis was taken as the longitudinal axis of the vessel. Measurements were in units of G (gravity). Two accelerometers were used. One was placed on deck near the aft vent of Ballast Tank 3P adjacent to the port side of Hatch No. 11. The second unit was located under the hopper tank in the conveyer tunnel near the aft end of Ballast Tank 3P. Both instruments were attached directly to structural steel using the magnetic mounting assembly provided by the Sensr group (R001-199-V2). Power requirements of each sensor were provided by two AA batteries. Data logging was initiated at T=0 (0600 h vessel time, EST) of the prescribed sampling schedule established for the morning of April 20, 2009. The data was logged for a planned period of 70 h, which provided coverage through the early morning period of April 23.
Photo 21 GPL1 Accelerometer
5.3 Inclinometers Two types of inclinometers were used to measure pitch, roll, and yaw during the 70 h test period described in Method 1. Measurements were in units of degrees from the horizontal established in reference to gravity. A Microstrain Model 3DM inclinometer was placed on deck near the aft vent of Ballast Tank 3P adjacent to the port side of Hatch No. 11, and located just above (within cm) the previously described accelerometer. The inclinometer was mounted on 2x4 wood framing to minimize the influence of structural steel on magnetic heading readings (yaw) provided by the instrument. A second inclinometer (Jasco) was positioned on the starboard side of the vessels in the wood shop located in the bow of the vessel (3 m from centerline, 1.5 m from the floor). Commercial software and dedicated laptop computers (Panasonic Model CF-18) were used to log and summarize instrument readings. Power requirements for both instrument types were 110V AC, as provided by existing vessel service receptacles.

Mixing Biocides into Ship’s Ballast Water 48 The Glosten Associates, Inc. Great Lakes Bulk Carrier Field Trials, Rev. B File No 09078.01, 17 January 2012
Photo 22 3DM inclinometer mounted at tank vent
5.4 Vessel Log For the vessel’s log, weather condition, sea condition, and vessel position were used to document operating conditions during the prescribed test period. Specific variables included wave height, wind direction and speed, barometric pressure, air, cloud cover, precipitation, vessel speed and direction, latitude, longitude, vessel operations and load condition. All variables were measured by the vessel’s crew, as summarized in the vessel’s official log. Log entries were photographed following completion of the dye dispersion analyses scheduled at their time of arrival in Duluth, Minnesota.
5.5 Video of Ballast Surface Water Turbulence and wave action within ballast tank 3P were qualitatively evaluated using a Fisheye® type underwater video camera. The video camera was mounted on a 10 foot section of PVC pipe, which was threaded to accept two additional 10 foot sections of pipe so as to provide a planned extension to a position 30 feet below deck. The camera and an associated submersible light (UK C4, Underwater Kinetics®) were lowered to the headspace/water interface at the midpoint tank vent previously outfitted with a 10-inch flange. A video survey panned the view directly below the vent at four points during the trial: (1) while leaving Indiana Harbor, (2) at a Mid-Lake Michigan point, (3) at a pre- Sault Locks point, (4) at a mid-Lake Superior point, and (5) while entering Duluth harbor. Video images were digitized using commercial hardware package (Diamond® One touch Video Capture VC500), then recorded using a dedicated laptop computer (Panasonic Model CF-18).
5.6 Surface Re-Aeration Coefficient Vessel motion and vibration was expected to enhance the movement of gases into and out of the solution as quantitatively measured by the overall mass transfer coefficient kLa. The kLa was determined for spring water held in an open rectangular container positioned adjacent to the inclinometer monitoring bow roll, pitch, and yaw, as described in Method 2, above. The kLa was established during the light seas case on our return run through Lake Michigan, as well as the moderate seas case encountered during the return run to Duluth across Lake Superior. Further, kLa was established in three replicate trials conducted as controls under conditions of no movement (stationary) in the onboard laboratory.
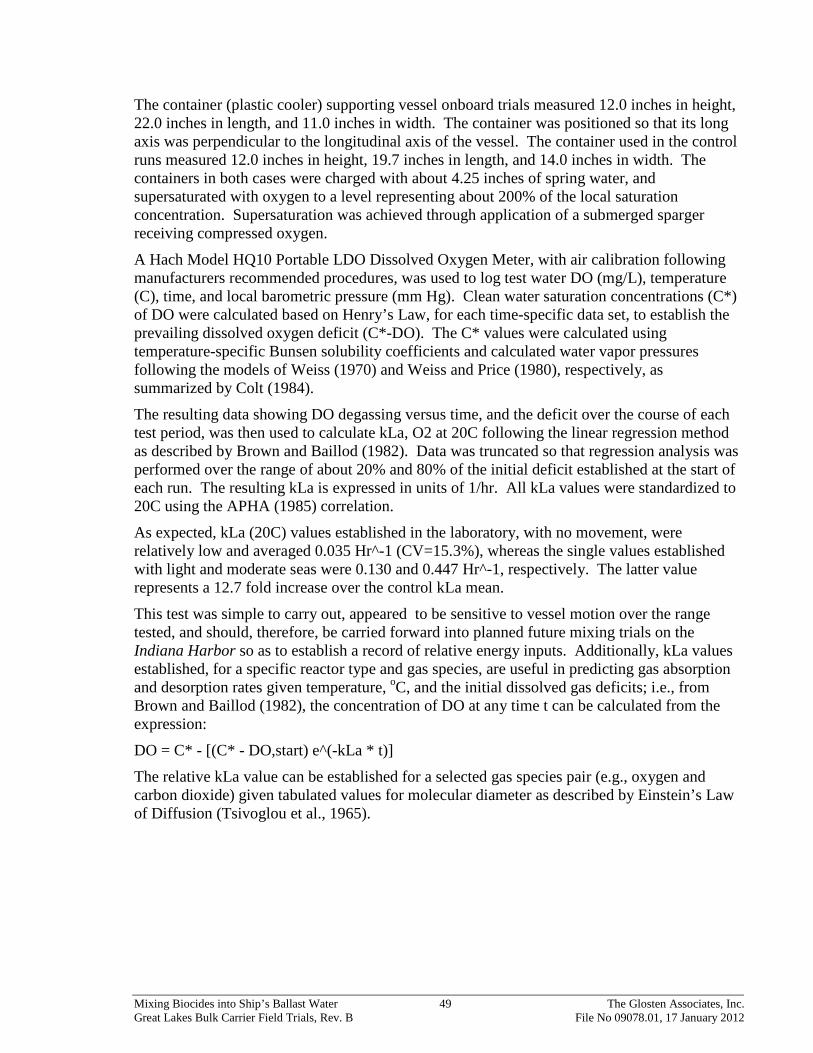
Mixing Biocides into Ship’s Ballast Water 49 The Glosten Associates, Inc. Great Lakes Bulk Carrier Field Trials, Rev. B File No 09078.01, 17 January 2012
The container (plastic cooler) supporting vessel onboard trials measured 12.0 inches in height, 22.0 inches in length, and 11.0 inches in width. The container was positioned so that its long axis was perpendicular to the longitudinal axis of the vessel. The container used in the control runs measured 12.0 inches in height, 19.7 inches in length, and 14.0 inches in width. The containers in both cases were charged with about 4.25 inches of spring water, and supersaturated with oxygen to a level representing about 200% of the local saturation concentration. Supersaturation was achieved through application of a submerged sparger receiving compressed oxygen.
A Hach Model HQ10 Portable LDO Dissolved Oxygen Meter, with air calibration following manufacturers recommended procedures, was used to log test water DO (mg/L), temperature (C), time, and local barometric pressure (mm Hg). Clean water saturation concentrations (C*) of DO were calculated based on Henry’s Law, for each time-specific data set, to establish the prevailing dissolved oxygen deficit (C*-DO). The C* values were calculated using temperature-specific Bunsen solubility coefficients and calculated water vapor pressures following the models of Weiss (1970) and Weiss and Price (1980), respectively, as summarized by Colt (1984).
The resulting data showing DO degassing versus time, and the deficit over the course of each test period, was then used to calculate kLa, O2 at 20C following the linear regression method as described by Brown and Baillod (1982). Data was truncated so that regression analysis was performed over the range of about 20% and 80% of the initial deficit established at the start of each run. The resulting kLa is expressed in units of 1/hr. All kLa values were standardized to 20C using the APHA (1985) correlation.
As expected, kLa (20C) values established in the laboratory, with no movement, were relatively low and averaged 0.035 Hr^-1 (CV=15.3%), whereas the single values established with light and moderate seas were 0.130 and 0.447 Hr^-1, respectively. The latter value represents a 12.7 fold increase over the control kLa mean.
This test was simple to carry out, appeared to be sensitive to vessel motion over the range tested, and should, therefore, be carried forward into planned future mixing trials on the Indiana Harbor so as to establish a record of relative energy inputs. Additionally, kLa values established, for a specific reactor type and gas species, are useful in predicting gas absorption and desorption rates given temperature, oC, and the initial dissolved gas deficits; i.e., from Brown and Baillod (1982), the concentration of DO at any time t can be calculated from the expression:
DO = C* - [(C* - DO,start) e^(-kLa * t)]
The relative kLa value can be established for a selected gas species pair (e.g., oxygen and carbon dioxide) given tabulated values for molecular diameter as described by Einstein’s Law of Diffusion (Tsivoglou et al., 1965).

Mixing Biocides into Ship’s Ballast Water 50 The Glosten Associates, Inc. Great Lakes Bulk Carrier Field Trials, Rev. B File No 09078.01, 17 January 2012
f Photo 23 Surface reaeration test equipment
5.7 Submerged Pressure Transducers Wave action within the tanks will cause fluctuations in measured pressure within a vertical water column. These pressure variations were measured by means of remote pressure transducers (RBR Global Model RBR-1050). By subtracting out the atmospheric baseline measurement and converting the recorded values in decibars to feet of water, the tank level may be monitored directly above the pressure transducer.
The minimum recording rate for the RBR-1050 transducers used in this experiment was one second. This rate is too slow for accurate mapping of the wave profile within the tank, but it is adequate to determine the maximum wave height at any given time over the course of this experiment. A total of three pressure transducers were used in the 3P tank. All three pressure transducers were located 4 feet above baseline, and 12 feet inboard of the side shell. Longitudinally, the forward transducer was in line with the A2/C2 sample hose inlets, the middle pressure transducer is in line with the middle tank vent, and the aft pressure transducer is in line with the A1/C1 sample hose inlets.
Each pressure transducer was powered by the two CR 123 camera batteries housed within the unit. The units are configured using RBR Data Logger Software version 6.13. This same software was also used for configuring the start and stop time for data collection, as well as the sampling interval. The manufacturer of this software is RBR Global (www.rbr-global.com).
Photo 24 Pressure transducers following retrieval from full ballast water tanks

Mixing Biocides into Ship’s Ballast Water 51 The Glosten Associates, Inc. Great Lakes Bulk Carrier Field Trials, Rev. B File No 09078.01, 17 January 2012
Section 6 Data Summary
6.1 Data Summary Overview Data from the trials were collected using the instruments detailed in the previous sections. It was understood that some of the data would be used to support recommendations for the emergency response guide development. This analysis is reviewed in the conclusions.
The remainder of the data was collected for future analysis. These data are available for others for review, and for the development of additional conclusions. Such future work might include the determination of the impact of a vessel's motion on the mixing of chemicals in the ballast tank, or the superimposition of chemical molecular diffusion rates of promising biocides onto the mixing effects of the Rhodamine WT. The available electronic files include the:
• Sonde data for in-tank testing above deck, below deck, continuous discharge sampling, and environmental testing onboard and around the vessel
• Accelerometers
• Inclinometers
• Pressure transducers
• Video of tank 3P ballast water surface
• Surface reaeration
• Vessel’s log
6.2 Data Formats and Files The data were originally collected in several file types and formats. Some of the files have been entered into more typical programs, such as Excel, for ease of analysis. Other data were hand written and transposed into Excel. The data available are summarized in the following table.
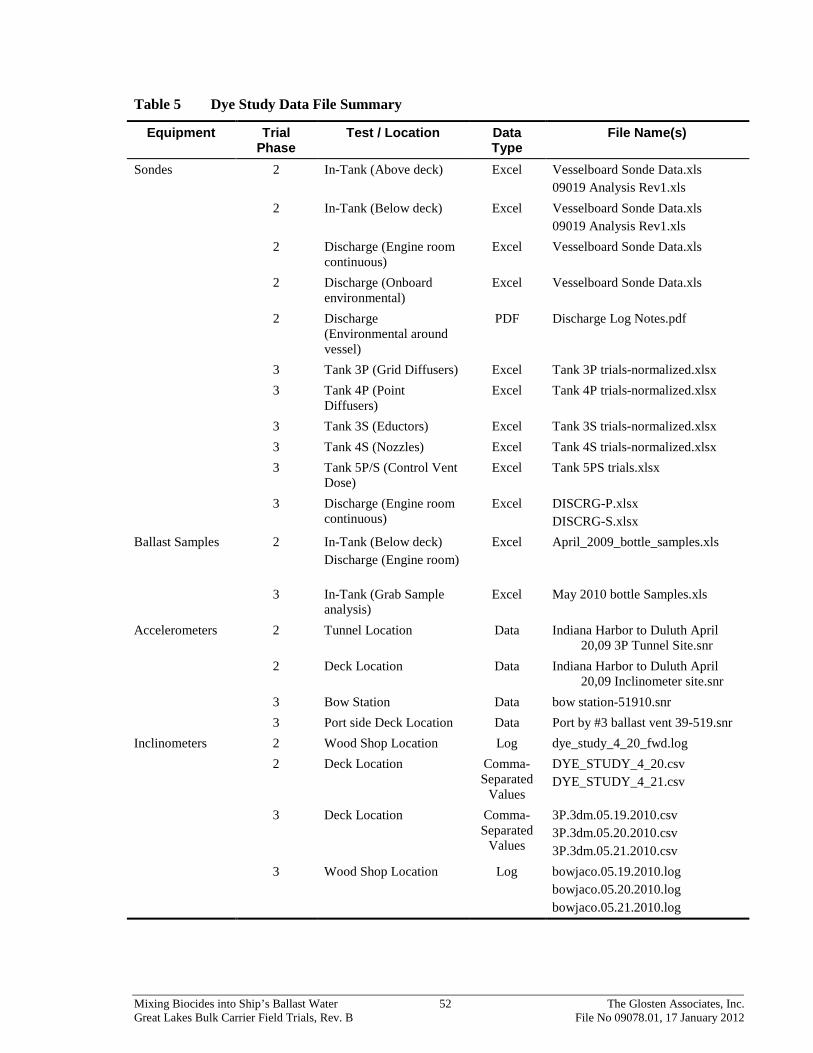
Mixing Biocides into Ship’s Ballast Water 52 The Glosten Associates, Inc. Great Lakes Bulk Carrier Field Trials, Rev. B File No 09078.01, 17 January 2012
Table 5 Dye Study Data File Summary
Equipment Trial Phase
Test / Location Data Type
File Name(s)
Sondes 2 In-Tank (Above deck) Excel Vesselboard Sonde Data.xls 09019 Analysis Rev1.xls
2 In-Tank (Below deck) Excel Vesselboard Sonde Data.xls 09019 Analysis Rev1.xls
2 Discharge (Engine room continuous)
Excel Vesselboard Sonde Data.xls
2 Discharge (Onboard environmental)
Excel Vesselboard Sonde Data.xls
2 Discharge (Environmental around vessel)
PDF Discharge Log Notes.pdf
3 Tank 3P (Grid Diffusers) Excel Tank 3P trials-normalized.xlsx 3 Tank 4P (Point
Diffusers) Excel Tank 4P trials-normalized.xlsx
3 Tank 3S (Eductors) Excel Tank 3S trials-normalized.xlsx 3 Tank 4S (Nozzles) Excel Tank 4S trials-normalized.xlsx 3 Tank 5P/S (Control Vent
Dose) Excel Tank 5PS trials.xlsx
3 Discharge (Engine room continuous)
Excel DISCRG-P.xlsx DISCRG-S.xlsx
Ballast Samples 2 In-Tank (Below deck) Discharge (Engine room)
Excel April_2009_bottle_samples.xls
3 In-Tank (Grab Sample analysis)
Excel May 2010 bottle Samples.xls
Accelerometers 2 Tunnel Location Data Indiana Harbor to Duluth April 20,09 3P Tunnel Site.snr
2 Deck Location Data Indiana Harbor to Duluth April 20,09 Inclinometer site.snr
3 Bow Station Data bow station-51910.snr 3 Port side Deck Location Data Port by #3 ballast vent 39-519.snr
Inclinometers 2 Wood Shop Location Log dye_study_4_20_fwd.log 2 Deck Location Comma-
Separated Values
DYE_STUDY_4_20.csv DYE_STUDY_4_21.csv
3 Deck Location Comma-Separated
Values
3P.3dm.05.19.2010.csv 3P.3dm.05.20.2010.csv 3P.3dm.05.21.2010.csv
3 Wood Shop Location Log bowjaco.05.19.2010.log bowjaco.05.20.2010.log bowjaco.05.21.2010.log

Mixing Biocides into Ship’s Ballast Water 53 The Glosten Associates, Inc. Great Lakes Bulk Carrier Field Trials, Rev. B File No 09078.01, 17 January 2012
Equipment Trial Phase
Test / Location Data Type
File Name(s)
Pressure Transducers
2 Tank 3P Forward Data 013551_3P Tank_5-28-09.dat 2 Tank 3P Middle Data 013550_3P Tank_4-22-09.dat 2 Tank 3P Aft Data
Excel 013552_3P Tank_4-22-09.dat 013552.xlsx
3 Tank 5P Aft Data 013550 During trial.dat 3 Tank 5P Middle Data 013551 During Trial.dat 3 Tank 5P Forward Data 013552 During Trial.dat
Ballast Water Surface Video
2 Tank 3P Video P4220127.AVI
Surface Reaeration
2 Wood Shop Location 2 Tunnel Location 3 Woodshop Location
Vessel’s Log 2 Vessel Excel 20Apr-24AprLog.xls 3 Vessel Photos Vessels Log.pdf
6.3 Vessel Route
6.3.1 Phase II—Passive Mixing Methods All dye was introduced to the ballast tanks within 3 hours of departing Indiana Harbor, Indiana. Conditions were calm, and vessel motions were minimal through Lake Michigan until departure for the Sault Ste. Marie locks and entrance to Lake Superior. The light vessel motions during the initial 33 hours resulted in minimal vessel motion and induced mixing. After departing the Sault Ste. Marie locks, conditions gradually deteriorated to a moderate sea state for the northwesterly portion of the trip in Lake Superior. These increased vessel motions, which resulted in greater vessel motion, induced mixing. Data collection was stopped roughly 12 hours before arriving in Duluth, to allow time for demobilization of all of the testing equipment. This condition corresponds to the majority of the southwesterly portion of the trip on Lake Superior.
6.3.2 Phase III—Active Mixing Methods For this phase, dye was introduced to the tanks at multiple times throughout the trip except in control tanks. The control tanks (5P & 5S) were both dosed with dye soon after leaving Gary Harbor. The vessel’s route was almost identical to the Phase II trial route. Weather was calm in both lakes and in the Sault Locks. Data collection was stopped in the control tanks, roughly 8 hours before arrival in Duluth.
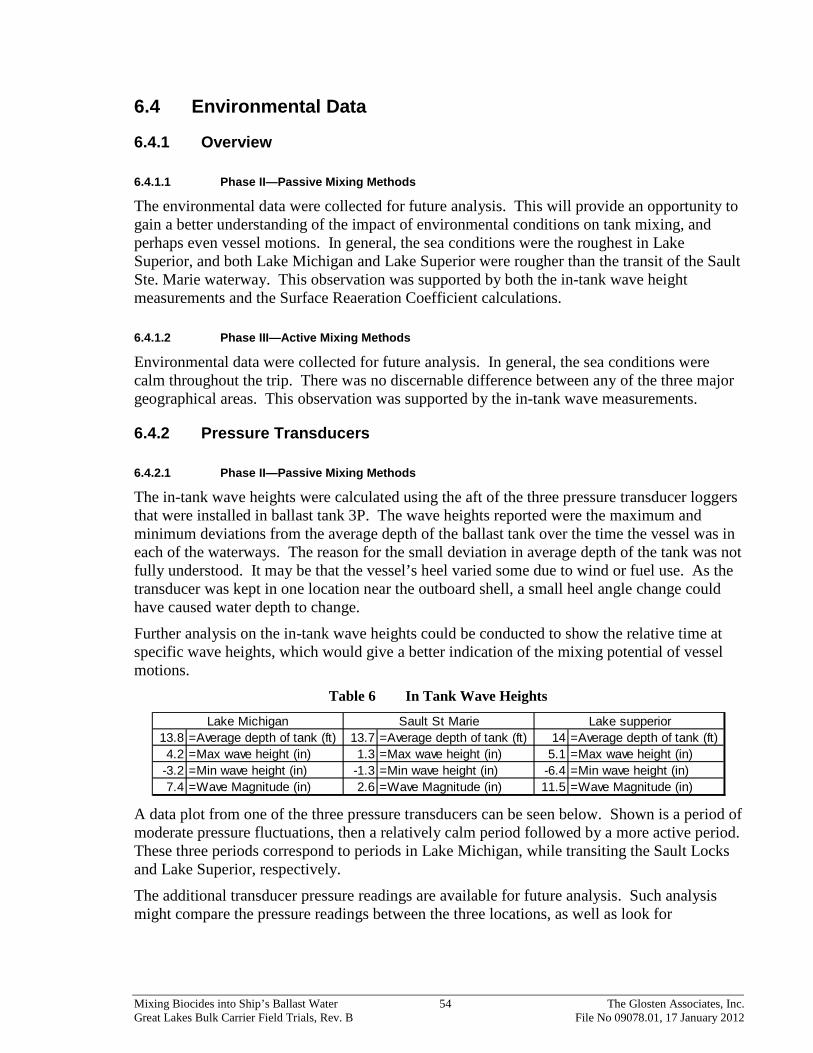
Mixing Biocides into Ship’s Ballast Water 54 The Glosten Associates, Inc. Great Lakes Bulk Carrier Field Trials, Rev. B File No 09078.01, 17 January 2012
6.4 Environmental Data
6.4.1 Overview
6.4.1.1 Phase II—Passive Mixing Methods
The environmental data were collected for future analysis. This will provide an opportunity to gain a better understanding of the impact of environmental conditions on tank mixing, and perhaps even vessel motions. In general, the sea conditions were the roughest in Lake Superior, and both Lake Michigan and Lake Superior were rougher than the transit of the Sault Ste. Marie waterway. This observation was supported by both the in-tank wave height measurements and the Surface Reaeration Coefficient calculations.
6.4.1.2 Phase III—Active Mixing Methods
Environmental data were collected for future analysis. In general, the sea conditions were calm throughout the trip. There was no discernable difference between any of the three major geographical areas. This observation was supported by the in-tank wave measurements.
6.4.2 Pressure Transducers
6.4.2.1 Phase II—Passive Mixing Methods
The in-tank wave heights were calculated using the aft of the three pressure transducer loggers that were installed in ballast tank 3P. The wave heights reported were the maximum and minimum deviations from the average depth of the ballast tank over the time the vessel was in each of the waterways. The reason for the small deviation in average depth of the tank was not fully understood. It may be that the vessel’s heel varied some due to wind or fuel use. As the transducer was kept in one location near the outboard shell, a small heel angle change could have caused water depth to change.
Further analysis on the in-tank wave heights could be conducted to show the relative time at specific wave heights, which would give a better indication of the mixing potential of vessel motions.
Table 6 In Tank Wave Heights
A data plot from one of the three pressure transducers can be seen below. Shown is a period of moderate pressure fluctuations, then a relatively calm period followed by a more active period. These three periods correspond to periods in Lake Michigan, while transiting the Sault Locks and Lake Superior, respectively.
The additional transducer pressure readings are available for future analysis. Such analysis might compare the pressure readings between the three locations, as well as look for
13.8 =Average depth of tank (ft) 13.7 =Average depth of tank (ft) 14 =Average depth of tank (ft)4.2 =Max wave height (in) 1.3 =Max wave height (in) 5.1 =Max wave height (in)
-3.2 =Min wave height (in) -1.3 =Min wave height (in) -6.4 =Min wave height (in)7.4 =Wave Magnitude (in) 2.6 =Wave Magnitude (in) 11.5 =Wave Magnitude (in)
Lake Michigan Sault St Marie Lake supperior

Mixing Biocides into Ship’s Ballast Water 55 The Glosten Associates, Inc. Great Lakes Bulk Carrier Field Trials, Rev. B File No 09078.01, 17 January 2012
consistency between the readings. Further, there may be an ability to track a wave transit from one end of the tank to another.
Figure 17 Phase II trial pressure transducer readings
6.4.2.2 Phase III—Active Mixing Methods
A plot of one of the three pressure transducers can be seen below. From the plot, it can be seen that throughout the entire trip the wave motions were minimal.
The average wave heights were not calculated for Phase III trials as it was clear that vessel motions were minimal.
Figure 18 Phase III trial pressure transducer readings
6.4.3 Surface Re-Aeration Coefficient
6.4.3.1 Phase II—Passive Mixing Methods
The following figures provide a rough approximation of the energy imparted to the ballast tanks from the vessel’s motion and vibration, based on relative changes in the measured mass transfer coefficient kLa. Measurements were taken for the light seas cases through Lake Michigan, moderate seas case through Lake Superior, and were controlled, subsequently, in a laboratory.
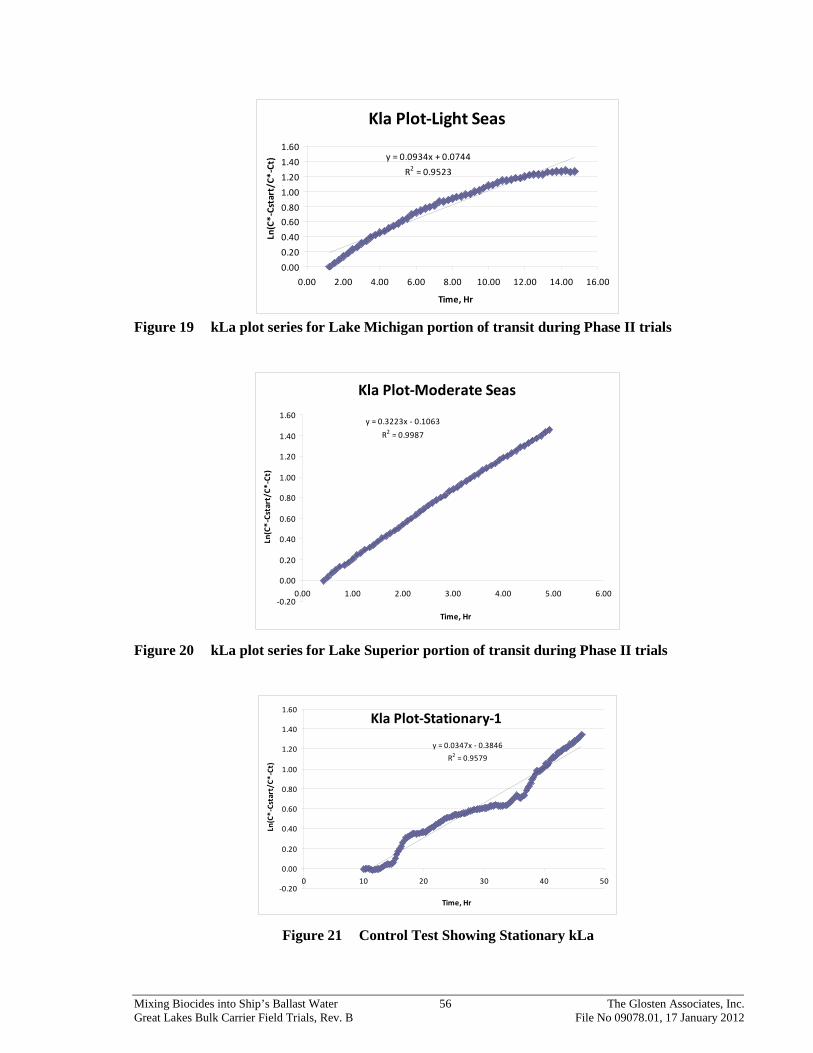
Mixing Biocides into Ship’s Ballast Water 56 The Glosten Associates, Inc. Great Lakes Bulk Carrier Field Trials, Rev. B File No 09078.01, 17 January 2012
Figure 19 kLa plot series for Lake Michigan portion of transit during Phase II trials
Figure 20 kLa plot series for Lake Superior portion of transit during Phase II trials
Figure 21 Control Test Showing Stationary kLa
Kla Plot-Light Seas
y = 0.0934x + 0.0744R2 = 0.9523
0.000.200.400.600.801.001.201.401.60
0.00 2.00 4.00 6.00 8.00 10.00 12.00 14.00 16.00
Time, Hr
Ln(C
*-Cs
tart
/C*-
Ct)
Kla Plot-Moderate Seas
y = 0.3223x - 0.1063R2 = 0.9987
-0.20
0.00
0.20
0.40
0.60
0.80
1.00
1.20
1.40
1.60
0.00 1.00 2.00 3.00 4.00 5.00 6.00
Time, Hr
Ln(C
*-Cs
tart
/C*-
Ct)
Kla Plot-Stationary-1
y = 0.0347x - 0.3846R2 = 0.9579
-0.20
0.00
0.20
0.40
0.60
0.80
1.00
1.20
1.40
1.60
0 10 20 30 40 50
Time, Hr
Ln(C
*-Cs
tart
/C*-
Ct)

Mixing Biocides into Ship’s Ballast Water 57 The Glosten Associates, Inc. Great Lakes Bulk Carrier Field Trials, Rev. B File No 09078.01, 17 January 2012
6.4.3.2 Phase III—Active Mixing Methods
Surface reaeration experiments were attempted during the Phase III trials, but due to unforeseen complications, no data is available.
6.5 In-Tank Mixing Data
6.5.1 Phase II—Passive Mixing Methods In-tank mixing data is reported, herein, to provide an overview of the general trends of the various trialed mixing methods. The data is presented as actual tracer dye concentrations as measured. It should be noted that the vessel’s motion played a significant role in the mixing of the dye in the ballast tanks, particularly in the later hours of the trials. A further discussion is provided in the conclusions.
Figure 22 Convergence of Dye Concentrations to being “Well Mixed” during Mixing Trial
Time Series Plot of Dye Concentration during Mixing Trial
Tank 3 Port - Internal Transfer
-50
0
50
100
150
200
250
300
0:00 4:48 9:36 14:24 19:12 24:00 28:48 33:36 38:24 43:12 48:00
Time (hours)
Con
cent
ratio
n (u
g/L)
B1 B2 B3 B4 B5 C1 C2 D1D2 D3 E1 E2 E3 F1 F2 Fwd 40.5Fwd 45.5 Fwd 50.5 Fwd 55.5 Fwd 57.5 Mid 40.5 Mid 45.5 Mid 50.5 Mid 55.5Mid 57.5 Aft 40.5 Aft 45.5 Aft 50.5 Aft 55.5 Aft 57.5

Mixing Biocides into Ship’s Ballast Water 58 The Glosten Associates, Inc. Great Lakes Bulk Carrier Field Trials, Rev. B File No 09078.01, 17 January 2012
Figure 23 Time Series Plot of Dye Concentration during Mixing Trial
Figure 24 Time Series Plot of Dye Concentration during Mixing Trial
Tank 3 Stbd - Perforated Hose
-50
0
50
100
150
200
250
300
0:00 4:48 9:36 14:24 19:12 24:00 28:48 33:36 38:24 43:12 48:00
Time (hours)
Con
cent
ratio
n (u
g/L)
B1 B2 B3 B4 B5 C1 C2 D1D2 D3 E1 E2 E3 F1 F2 Fwd 40.5Fwd 45.5 Fwd 50.5 Fwd 55.5 Fwd 57.5 Mid 40.5 Mid 45.5 Mid 50.5 Mid 55.5Mid 57.5 Aft 40.5 Aft 45.5 Aft 50.5 Aft 55.5 Aft 57.5
Tank 4 Port - Vent Dosing
-50
0
50
100
150
200
250
300
0:00 12:00 24:00 36:00 48:00 60:00
Time (hours)
Con
cent
ratio
n (u
g/L)
B1 B2 B3 B4 B5 C1 C2 D1D2 D3 E1 E2 E3 F1 F2 Fwd 40.5Fwd 45.5 Fwd 50.5 Fwd 55.5 Fwd 57.5 Mid 40.5 Mid 45.5 Mid 50.5 Mid 55.5Mid 57.5 Aft 40.5 Aft 45.5 Aft 50.5 Aft 55.5 Aft 57.5

Mixing Biocides into Ship’s Ballast Water 59 The Glosten Associates, Inc. Great Lakes Bulk Carrier Field Trials, Rev. B File No 09078.01, 17 January 2012
Figure 25 Time Series Plot of Dye Concentration during Mixing Trial
Figure 26 Time Series Plot of Dye Concentration during Mixing Trial
Tank 4 Stbd - Vent Dosing
-50
0
50
100
150
200
250
300
0:00 12:00 24:00 36:00 48:00 60:00
Time (hours)
Con
cent
ratio
n (u
g/L)
B1 B2 B3 B4 B5 C1 C2 D1D2 D3 E1 E2 E3 F1 F2 Fwd 40.5Fwd 45.5 Fwd 50.5 Fwd 55.5 Fwd 57.5 Mid 40.5 Mid 45.5 Mid 50.5 Mid 55.5Mid 57.5 Aft 40.5 Aft 45.5 Aft 50.5 Aft 55.5 Aft 57.5
Tank 5 Port - Bulk-on-Bottom Dosing
0
50
100
150
200
250
300
0:00 12:00 24:00 36:00 48:00 60:00 72:00
Time (hours)
Con
cent
ratio
n (u
g/L)
B1 B2 B3 B4 B5 C1 C2 D1D2 D3 E1 E2 E3 F1 F2 Fwd 40.5Fwd 45.5 Fwd 50.5 Fwd 55.5 Fwd 57.5 Mid 40.5 Mid 45.5 Mid 50.5 Mid 55.5Mid 57.5 Aft 40.5 Aft 45.5 Aft 50.5 Aft 55.5 Aft 57.5

Mixing Biocides into Ship’s Ballast Water 60 The Glosten Associates, Inc. Great Lakes Bulk Carrier Field Trials, Rev. B File No 09078.01, 17 January 2012
Figure 27 Time Series Plot of Dye Concentration during Mixing Trial
6.5.2 Phase III—Active Mixing Methods In-tank mixing data are reported, herein, to provide an overview of the general trends of the various trialed mixing methods. The first two data sets are for the 5 Port and 5 Starboard “control tanks” that repeated the vent dosing methods performed during the Phase II trials. These plots report actual tracer dye concentrations.
The subsequent plots for the faster mixing trials in tanks 3 Port, 3 Starboard, 4 Port, and 4 Starboard tanks. In order to perform multiple trials per tank, each tank was dosed in three steps. The plots “normalize” the concentrations to allow a comparison between the various steps. The normalization is based on a scale of 1, where the initial tank concentration is 0 and the fully mixed target concentration is 1.
-50
0
50
100
150
200
250
300
0:00 12:00 24:00 36:00 48:00 60:00
Conc
entra
tion
(ug/
L)
Time (hours)
Tank 5 Stbd - In-Line Dosing
B1 B2 B3 B4 B5 C1 C2 D1 D2 D3
E1 E2 E3 F1 F2 Fwd 40.5 Fwd 45.5 Fwd 50.5 Fwd 55.5 Fwd 57.5
Mid 40.5 Mid 45.5 Mid 50.5 Mid 55.5 Mid 57.5 Aft 40.5 Aft 45.5 Aft 50.5 Aft 55.5 Aft 57.5

Mixing Biocides into Ship’s Ballast Water 61 The Glosten Associates, Inc. Great Lakes Bulk Carrier Field Trials, Rev. B File No 09078.01, 17 January 2012
Figure 28 Time Series Plot of Dye Concentration during Mixing Trial
Figure 29 Time Series Plot of Dye Concentration during Mixing Trial
-50
0
50
100
150
200
250
300
350
0:00 12:00 24:00 36:00 48:00 60:00
Rhod
amin
e W
T (u
g/L)
Time After Dosing (hh:mm)
Tank 5 Port - Vent Dosing
E1 B2 B3 B4 B5 D1 D2 D3
-50
0
50
100
150
200
250
300
350
0:00 12:00 24:00 36:00 48:00 60:00
Rhod
amin
e W
T (u
g/L)
Time After Dosing (hh:mm)
Tank 5 Starboard - Vent Dosing
E1 B2 B3 B4 B5 D1 D2 D3

Mixing Biocides into Ship’s Ballast Water 62 The Glosten Associates, Inc. Great Lakes Bulk Carrier Field Trials, Rev. B File No 09078.01, 17 January 2012
Figure 30 Normalized Time Series Plot of Relative Dye Concentration during Mixing Trial
Figure 31 Time Series Plot of Relative Dye Concentration during Mixing Trial
0
0.2
0.4
0.6
0.8
1
1.2
1.4
1.6
1.8
2
0:00 0:15 0:30 0:45 1:00 1:15 1:30 1:45 2:00 2:15
Rela
tive
Dye
Conc
entra
tion
Time After Dosing (hh:mm)
Tank 3 Port - 2 Diffuser Grids, Trial 1 Normalized - Sample Ports
B1
B2
B3
B4
B5
C1
C2
D1
D2
D3
E1
E2
E3
F1
F2
D2 Continuous
B1 Continuous
Lower 10% Bound
Upper 10% Bound
0
0.2
0.4
0.6
0.8
1
1.2
1.4
1.6
1.8
2
0:00 0:15 0:30 0:45 1:00 1:15 1:30 1:45 2:00 2:15
Rela
tive
Dye
Conc
entra
tion
Time After Dosing (hh:mm)
Tank 3 Port - 2 Diffuser Grids, Trial 2 Normalized - Sample Ports
B1
B2
B3
B4
B5
C1
C2
D1
D2
D3
E1
E2
E3
F1
F2
D2 Continuous
E1 Continuous
Lower 10% Bound
Upper 10% Bound
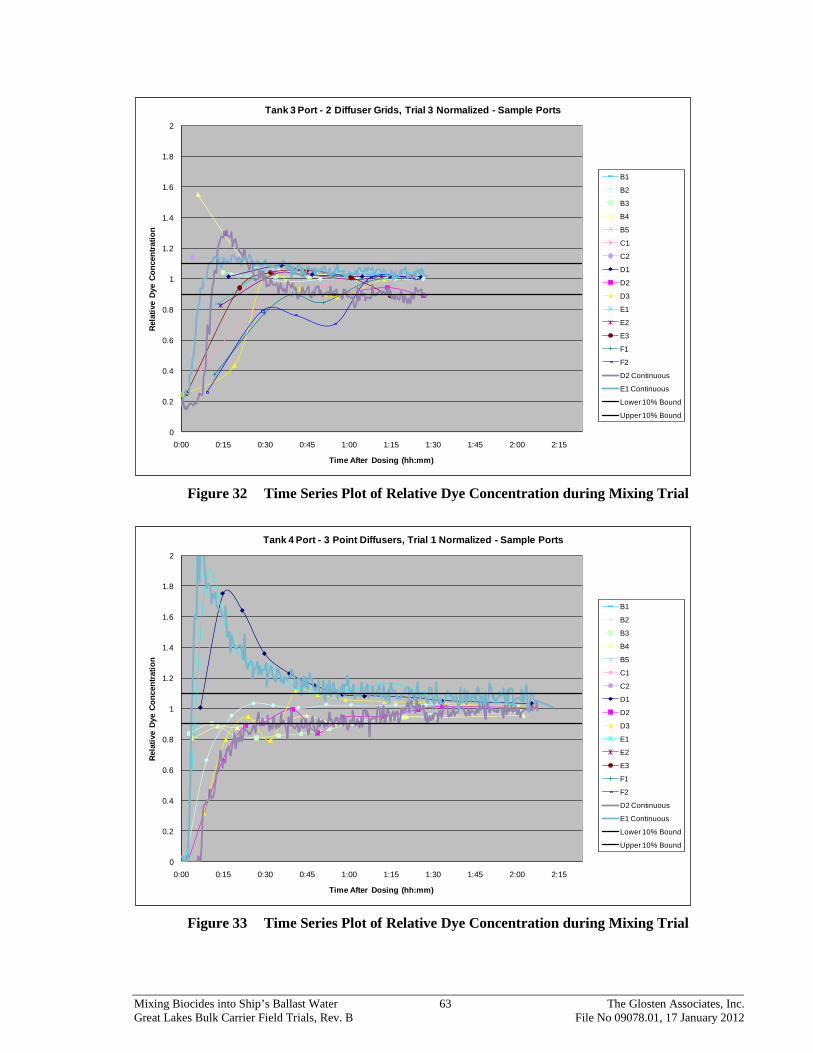
Mixing Biocides into Ship’s Ballast Water 63 The Glosten Associates, Inc. Great Lakes Bulk Carrier Field Trials, Rev. B File No 09078.01, 17 January 2012
Figure 32 Time Series Plot of Relative Dye Concentration during Mixing Trial
Figure 33 Time Series Plot of Relative Dye Concentration during Mixing Trial
0
0.2
0.4
0.6
0.8
1
1.2
1.4
1.6
1.8
2
0:00 0:15 0:30 0:45 1:00 1:15 1:30 1:45 2:00 2:15
Rela
tive
Dye
Conc
entra
tion
Time After Dosing (hh:mm)
Tank 3 Port - 2 Diffuser Grids, Trial 3 Normalized - Sample Ports
B1
B2
B3
B4
B5
C1
C2
D1
D2
D3
E1
E2
E3
F1
F2
D2 Continuous
E1 Continuous
Lower 10% Bound
Upper 10% Bound
0
0.2
0.4
0.6
0.8
1
1.2
1.4
1.6
1.8
2
0:00 0:15 0:30 0:45 1:00 1:15 1:30 1:45 2:00 2:15
Rela
tive
Dye
Conc
entra
tion
Time After Dosing (hh:mm)
Tank 4 Port - 3 Point Diffusers, Trial 1 Normalized - Sample Ports
B1
B2
B3
B4
B5
C1
C2
D1
D2
D3
E1
E2
E3
F1
F2
D2 Continuous
E1 Continuous
Lower 10% Bound
Upper 10% Bound

Mixing Biocides into Ship’s Ballast Water 64 The Glosten Associates, Inc. Great Lakes Bulk Carrier Field Trials, Rev. B File No 09078.01, 17 January 2012
Figure 34 Time Series Plot of Relative Dye Concentration during Mixing Trial
Figure 35 Time Series Plot of Relative Dye Concentration during Mixing Trial
0
0.2
0.4
0.6
0.8
1
1.2
1.4
1.6
1.8
2
0:00 0:15 0:30 0:45 1:00 1:15 1:30 1:45 2:00 2:15
Rela
tive
Dye
Conc
entra
tion
Time After Dosing (hh:mm)
Tank 4 Port - 3 Point Diffusers, Trial 2 Normalized - Sample Ports
B1
B2
B3
B4
B5
C1
C2
D1
D2
D3
E1
E2
E3
F1
F2
D2 Continuous
E1 Continuous
Lower 10% Bound
Upper 10% Bound
0
0.2
0.4
0.6
0.8
1
1.2
1.4
1.6
1.8
2
0:00 0:15 0:30 0:45 1:00 1:15 1:30 1:45 2:00 2:15
Rela
tive
Dye
Conc
entra
tion
Time After Dosing (hh:mm)
Tank 4 Port - 3 Point Diffusers, Trial 3 Normalized - Sample Ports
B1
B2
B3
B4
B5
C1
C2
D1
D2
D3
E1
E2
E3
F1
F2
D2 Continuous
E1 Continuous
Lower 10% Bound
Upper 10% Bound
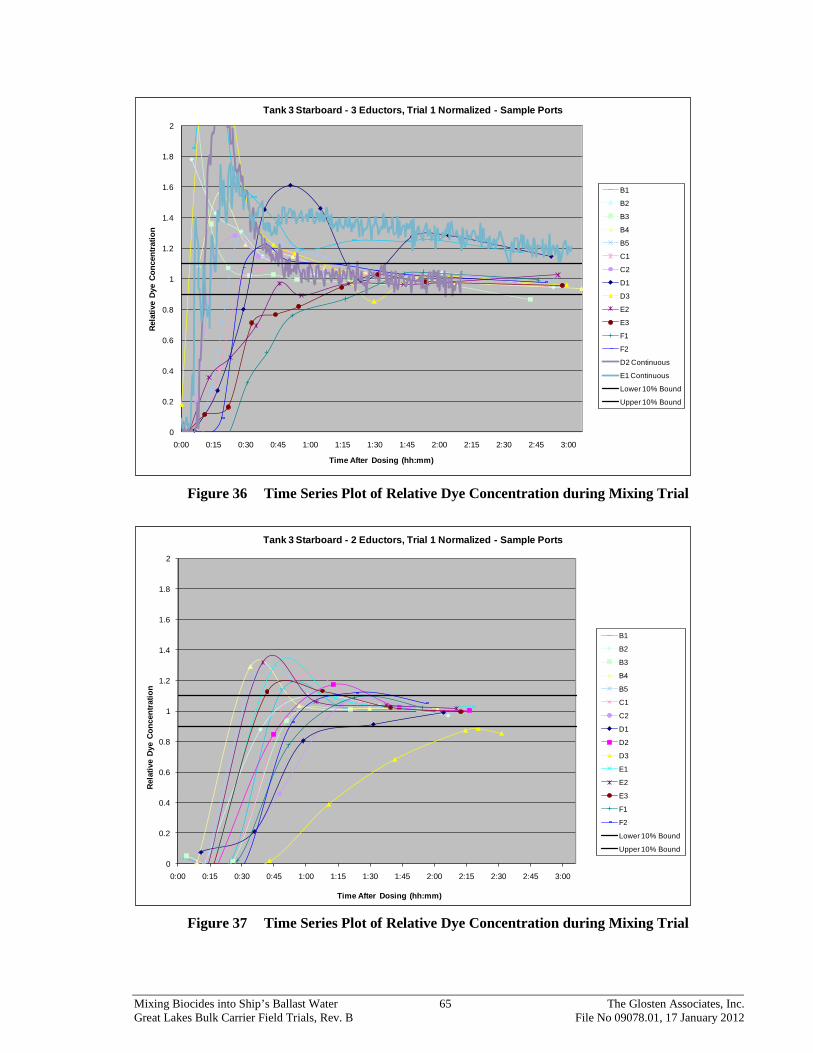
Mixing Biocides into Ship’s Ballast Water 65 The Glosten Associates, Inc. Great Lakes Bulk Carrier Field Trials, Rev. B File No 09078.01, 17 January 2012
Figure 36 Time Series Plot of Relative Dye Concentration during Mixing Trial
Figure 37 Time Series Plot of Relative Dye Concentration during Mixing Trial
0
0.2
0.4
0.6
0.8
1
1.2
1.4
1.6
1.8
2
0:00 0:15 0:30 0:45 1:00 1:15 1:30 1:45 2:00 2:15 2:30 2:45 3:00
Rela
tive
Dye
Conc
entra
tion
Time After Dosing (hh:mm)
Tank 3 Starboard - 3 Eductors, Trial 1 Normalized - Sample Ports
B1
B2
B3
B4
B5
C1
C2
D1
D3
E2
E3
F1
F2
D2 Continuous
E1 Continuous
Lower 10% Bound
Upper 10% Bound
0
0.2
0.4
0.6
0.8
1
1.2
1.4
1.6
1.8
2
0:00 0:15 0:30 0:45 1:00 1:15 1:30 1:45 2:00 2:15 2:30 2:45 3:00
Rela
tive
Dye
Conc
entra
tion
Time After Dosing (hh:mm)
Tank 3 Starboard - 2 Eductors, Trial 1 Normalized - Sample Ports
B1
B2
B3
B4
B5
C1
C2
D1
D2
D3
E1
E2
E3
F1
F2
Lower 10% Bound
Upper 10% Bound
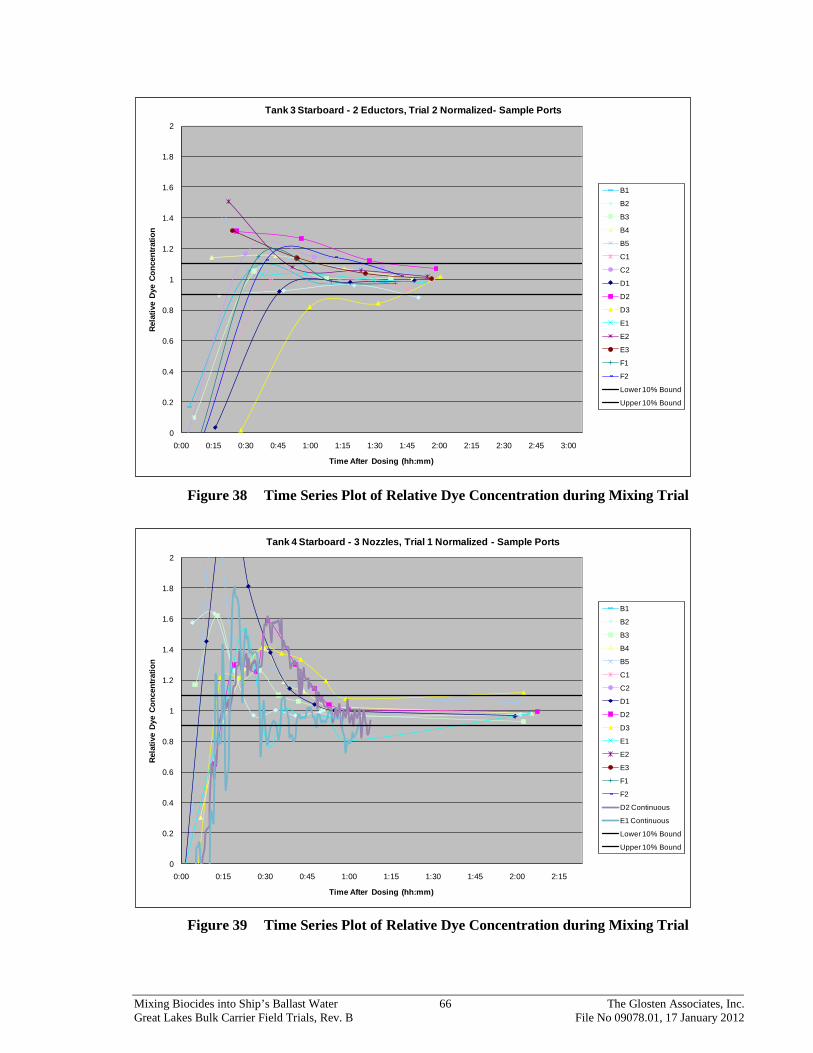
Mixing Biocides into Ship’s Ballast Water 66 The Glosten Associates, Inc. Great Lakes Bulk Carrier Field Trials, Rev. B File No 09078.01, 17 January 2012
Figure 38 Time Series Plot of Relative Dye Concentration during Mixing Trial
Figure 39 Time Series Plot of Relative Dye Concentration during Mixing Trial
0
0.2
0.4
0.6
0.8
1
1.2
1.4
1.6
1.8
2
0:00 0:15 0:30 0:45 1:00 1:15 1:30 1:45 2:00 2:15 2:30 2:45 3:00
Rela
tive
Dye
Conc
entra
tion
Time After Dosing (hh:mm)
Tank 3 Starboard - 2 Eductors, Trial 2 Normalized- Sample Ports
B1
B2
B3
B4
B5
C1
C2
D1
D2
D3
E1
E2
E3
F1
F2
Lower 10% Bound
Upper 10% Bound
0
0.2
0.4
0.6
0.8
1
1.2
1.4
1.6
1.8
2
0:00 0:15 0:30 0:45 1:00 1:15 1:30 1:45 2:00 2:15
Rela
tive
Dye
Conc
entra
tion
Time After Dosing (hh:mm)
Tank 4 Starboard - 3 Nozzles, Trial 1 Normalized - Sample Ports
B1
B2
B3
B4
B5
C1
C2
D1
D2
D3
E1
E2
E3
F1
F2
D2 Continuous
E1 Continuous
Lower 10% Bound
Upper 10% Bound

Mixing Biocides into Ship’s Ballast Water 67 The Glosten Associates, Inc. Great Lakes Bulk Carrier Field Trials, Rev. B File No 09078.01, 17 January 2012
Figure 40 Time Series Plot of Relative Dye Concentration during Mixing Trial
Figure 41 Time Series Plot of Relative Dye Concentration during Mixing Trial
0
0.2
0.4
0.6
0.8
1
1.2
1.4
1.6
1.8
2
0:00 0:15 0:30 0:45 1:00 1:15 1:30 1:45 2:00 2:15
Rela
tive
Dye
Conc
entra
tion
Time After Dosing (hh:mm)
Tank 4 Starboard - 3 Nozzles, Trial 2 Normalized - Sample Ports
B1
B2
B3
B4
B5
C1
C2
D1
D2
D3
E1
E2
E3
F1
F2
D2 Continuous
E1 Continuous
Lower 10% Bound
Upper 10% Bound
0
0.2
0.4
0.6
0.8
1
1.2
1.4
1.6
1.8
2
0:00 0:15 0:30 0:45 1:00 1:15 1:30 1:45 2:00 2:15
Rela
tive
Dye
Conc
entra
tion
Time After Dosing (hh:mm)
Tank 4 Starboard - 3 Nozzles, Trial 3 Normalized - Sample Ports
B1
B2
B3
B4
B5
C1
C2
D1
D2
D3
E1
E2
E3
F1
F2
D2 Continuous
Lower 10% Bound
Upper 10% Bound
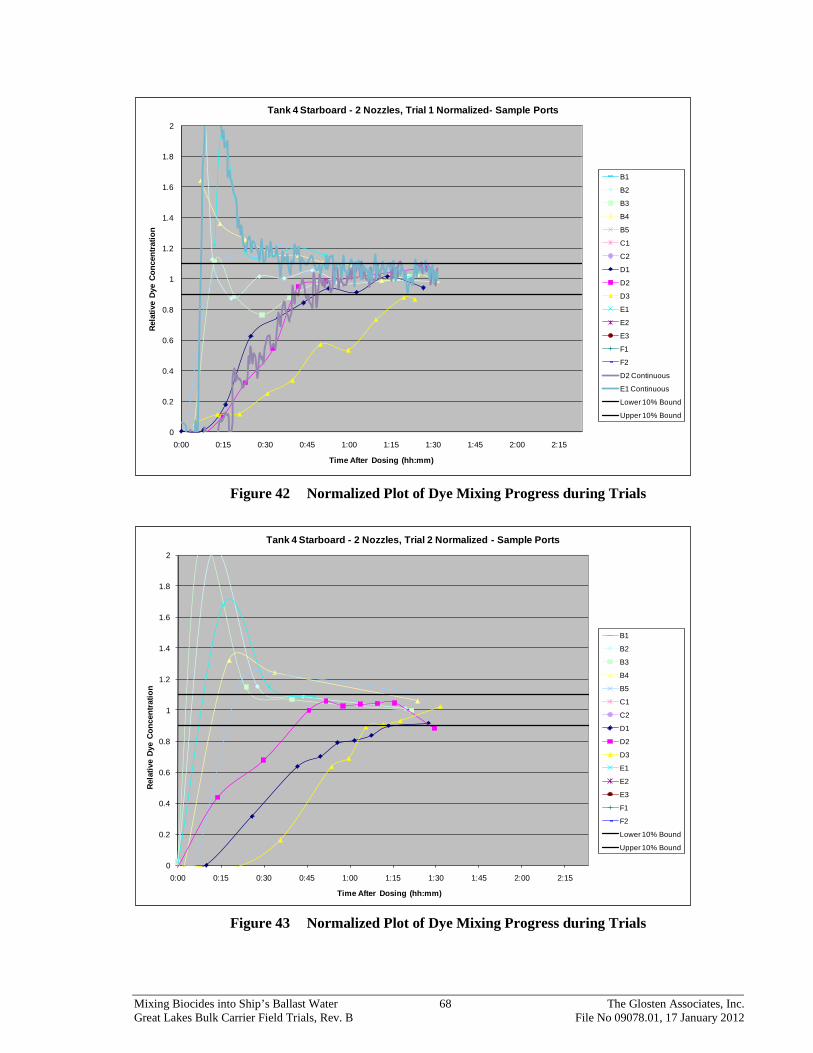
Mixing Biocides into Ship’s Ballast Water 68 The Glosten Associates, Inc. Great Lakes Bulk Carrier Field Trials, Rev. B File No 09078.01, 17 January 2012
Figure 42 Normalized Plot of Dye Mixing Progress during Trials
Figure 43 Normalized Plot of Dye Mixing Progress during Trials
0
0.2
0.4
0.6
0.8
1
1.2
1.4
1.6
1.8
2
0:00 0:15 0:30 0:45 1:00 1:15 1:30 1:45 2:00 2:15
Rela
tive
Dye
Conc
entra
tion
Time After Dosing (hh:mm)
Tank 4 Starboard - 2 Nozzles, Trial 1 Normalized- Sample Ports
B1
B2
B3
B4
B5
C1
C2
D1
D2
D3
E1
E2
E3
F1
F2
D2 Continuous
E1 Continuous
Lower 10% Bound
Upper 10% Bound
0
0.2
0.4
0.6
0.8
1
1.2
1.4
1.6
1.8
2
0:00 0:15 0:30 0:45 1:00 1:15 1:30 1:45 2:00 2:15
Rela
tive
Dye
Conc
entra
tion
Time After Dosing (hh:mm)
Tank 4 Starboard - 2 Nozzles, Trial 2 Normalized - Sample Ports
B1
B2
B3
B4
B5
C1
C2
D1
D2
D3
E1
E2
E3
F1
F2
Lower 10% Bound
Upper 10% Bound

Mixing Biocides into Ship’s Ballast Water 69 The Glosten Associates, Inc. Great Lakes Bulk Carrier Field Trials, Rev. B File No 09078.01, 17 January 2012
Section 7 Conclusions
7.1 Support of Emergency Response Guide In addition to determining the effectiveness of novel mixing methods for dosing and mixing a biocide into ballast water tanks, these trials were conducted to support the development of an emergency response guide. The guide will provide instructions to first responders on how to implement the mixing methods trialed here. Additionally, this guide provides a recommendation on the relative efficiency of each method. In this way, the first responder will work to target the most effective method first and, should conditions make application of the first choice too challenging, then move on to the next method.
7.2 Environmental Effects
7.2.1 Phase II - Passive Mixing Methods Moderate vessel motions appear to be effective at mixing chemicals into ballast tanks given adequate time. This is evidenced in the plots of dye concentration versus time. After the 33 hour mark, when the vessel entered the moderate seas of Lake Superior, the dye concentration values converged quickly. The accelerated mixing was attributable to the increase in vessel motion induced mixing.
The increased surface re-aeration kLa values during this period of moderate seas support this conclusion.
7.2.2 Phase III - Active Mixing Methods Light vessels motions do not appear to be effective at mixing chemicals into ballast tanks. Again, data were not analyzed in detail for the Phase III trials. Weather was calm and the in tank pressure fluctuations were minimal. The control tank mixing plots show even mixing rates throughout the trip. It can be concluded that the reduced final mixing in the control tanks, compared to the Phase II trials, can be attributed to the reduced vessel motions.
Due to the short duration of the active mixing methods trials and the mild weather conditions, it can be concluded that weather did not have an effect on the advanced mixing trials.
7.3 Relative Efficiency Calculation The relative efficiency of each method was calculated by comparing the average absolute deviation of each trialed method, and then weighting it for known field factors that may have had significant impact on the results.
7.3.1 Average Absolute Deviation The average absolute deviation or, simply, average deviation of a data set, is the average of the absolute deviations of data points from their mean.
The focus of biocide application is to ensure adequate contact or “soak” time of organisms at a certain concentration. This soak time cannot start until there is some confidence that the required concentration is evenly distributed throughout the ballast tank. If one corner of the

Mixing Biocides into Ship’s Ballast Water 70 The Glosten Associates, Inc. Great Lakes Bulk Carrier Field Trials, Rev. B File No 09078.01, 17 January 2012
ballast tank remains un-exposed to the biocide (offer referred to as being “cold”) at less than toxic concentrations for targeted organisms, viable high-risk organisms may be discharged even after treatment. The sampling tubing installed in the tanks was arranged to measure these far corners, and to look for deviations in the mixing pattern.
7.3.1.1 Phase II—Passive Mixing Methods
For the passive mixing trials, deviation from the target concentration of 120 ug/L was used as the metric for successful mixing. For example, a deviation of 25ug/L for the perforated hose method at 12 hours can be translated to 79% mixed (25/120= 79%). We could then expect tank doses to range between 145 ug/L and 94.8 ug/L, when targeting 120 ug/L.
Figure 44 Phase II trials - Deviation measurements of dye concentrations
The above figure was developed as:
o Recorded concentration vs. time since application data on dye concentrations for each tank/mixing method.
o Calculated average absolute deviation for each dataset was based on adjusted data.
o Exponential trend lines were provided for each data series.
Phase III—Active Mixing Methods
The average absolute deviation for each of the active mixing trials was calculated, and is shown in the figure below. For the active mixing trials, a target concentration of 30ug/L was used as a metric for successful mixing. A deviation of 3ug/L represented a 10% deviation, or a tank that is 90% mixed.
0.0
20.0
40.0
60.0
80.0
100.0
120.0
0:00 12:00 24:00 36:00 48:00 60:00
Conc
entra
tion
(ug/
L)
Time (hours)
Average Absolute Deviation
Internal Transfer Perforated Hose Vent #1 Vent #2Bulk Bottom In-Line Expon. (Internal Transfer) Expon. (Perforated Hose)Expon. (Vent #1) Expon. (Vent #2) Expon. (Bulk Bottom) Expon. (In-Line)

Mixing Biocides into Ship’s Ballast Water 71 The Glosten Associates, Inc. Great Lakes Bulk Carrier Field Trials, Rev. B File No 09078.01, 17 January 2012
,
Figure 45 Phase III trials-deviation measurements of dye concentrations
The above figure was developed as follows:
o Recorded dye concentration vs. time since application of dye for each tank/mixing method/trial.
o Calculated average absolute deviation for each timeframe dataset and plot vs. the average time the dataset was taken.
o Exponential trend lines were provided for each data series.
o To determine when a method reached 90% mixing, a line was placed at 10% of the target concentration, or 3 ug/L.
A trial that takes less time to converge on a 90% mixing line was assumed to be a faster mixing method.
7.4 Relative Rankings and Discussion Relative rankings of the various mixing methods are shown in Table 7. These rankings are used as a basis for the emergency response guide. Furthermore the time data provides rough guidance regarding the time required for the chemical dosing concentration average deviation to be less than 10% and less than 25%. This would mean that a tank requiring 10 parts per million of a chemical would need to be treated to 11 ppm and 12.5 ppm, respectively, to compensate for mixing efficiency.
0
2
4
6
8
10
12
14
16
18
20
0:00 0:15 0:30 0:45 1:00 1:15 1:30 1:45 2:00 2:15 2:30 2:45 3:00
Conc
entr
atio
n De
viat
ion
(ug/
L)
Time
AVERAGE ABSOLUTE DEVIATION ALL TRIALS 2 Sparging Tables Trial 12 Sparging Tables Trial 22 Sparging Tables Trial 33 Sparging units trial 13 Sparging units trial 23 Sparging units trial 33 Nozzles Trial 13 Nozzles Trial 23 Nozzles Trial 32 Nozzles Trial 12 Nozzles Trial 22 Eductors Trial 12 Eductors Trial 23 Eductors Trial 190% mixingExpon. (2 Sparging Tables Trial 1)Expon. (2 Sparging Tables Trial 2)Expon. (2 Sparging Tables Trial 3)Expon. (3 Sparging units trial 1)Expon. (3 Sparging units trial 2)Expon. (3 Sparging units trial 3)Expon. (3 Nozzles Trial 1)Expon. (3 Nozzles Trial 2)Expon. (3 Nozzles Trial 3)Expon. (2 Nozzles Trial 1)Expon. (2 Nozzles Trial 2)Expon. (2 Eductors Trial 1)Expon. (2 Eductors Trial 2)Expon. (3 Eductors Trial 1)Linear (90% mixing)

Mixing Biocides into Ship’s Ballast Water 72 The Glosten Associates, Inc. Great Lakes Bulk Carrier Field Trials, Rev. B File No 09078.01, 17 January 2012
Methods are relatively ranked best to worst as they performed during the various trials. It is reasonable to assume that additional trials and improvements of techniques might change these results. “Vessel in Place” assumes a grounded or stationary vessel. “Vessel in Motion” assumes typical vessel motions in a seaway, which over time acts as an effective means of mixing chemical within a tank regardless of the chemical application method. These rankings consider the data that resulted from the deviation calculations, as well as lessons learned during the trials.
Passive and active mixing methods are considered in the same table. Active methods are much faster than the passive methods but require equipment and more advanced installation and operation procedures. The decision to use active methods must be based on the equipment readily available, the required timeframe for treatment, and the skill of the technicians that will install and operate the equipment.
Table 7 Mixing Method Relative Rankings
7.4.1 Nozzle Active Mixing
7.4.1.1 Two Nozzle Mixing (Figure 42 and Figure 43)
The two nozzle mixing setup requires access to only one location with clear access from the deck to the bottom of the tank. The nozzles in the trials were installed in an empty tank and clamped onto the vessels structural framing in a V-pattern, pointing roughly 45 degrees forward and aft of athwart vessel. The installation method could be modified by attaching the nozzles onto a riser pipe, allowing them to be lowered from the deck with water hose attached. The chemical could be introduced into the water stream on deck, and diluted in route to the
Mixing Method
Time to Reach 90% Mixing
(hrs)Setup
DifficultyRelative Ranking Reasoning
Nozzle Active Mixing 1.5 Moderate 1 Rapid mixing and moderate installation/operation effort.
Air Lift Point Diffuser Mixing 1.25 Moderate 2Rapid mixing only using air. Installation more challenging than nozzle.
In Line Dosing 4 Moderate 3Rapid mixing. Requires transfer of all ballast water, so not always practical for emergency use
Air Lift Grid Diffuser Mixing 1.25 Hard 4Rapid mixing. Not practical to install in full ballast tank, so not always practical for emergency use
Bulk-on-Bottom DosingModerate Seas 24Mild Seas 48
Perforated Hose Dosing 16 Easy 6Moderate mixing rate. Simple application. Could be improved by introducing chemical in multiple locations
Vent DosingModerate Seas 24Mild Seas 36
Internal Transfer Dosing 36 Moderate 8Slow mixing for effort required. Increase transfer rate to reduce mixing time, or add nozzle for rapid mixing.
Easy application, mixing times could be improved by applying chemical close to ballast intake
Slow mixing relying on ships motions for majority of mixing. Mixing would be very slow for stationary ship
5
7Easy
Easy

Mixing Biocides into Ship’s Ballast Water 73 The Glosten Associates, Inc. Great Lakes Bulk Carrier Field Trials, Rev. B File No 09078.01, 17 January 2012
nozzle. The relatively large volume of water required to power each nozzle, ~150gpm each, may prove to be a challenge. For the trials, water was provided by the firemain and added to the tank, increasing the ballast load. In many circumstances, this would not be acceptable. In order to avoid adding water, a submersible pump could be lowered into one of the deck openings to provide the water flow and pressure required to operate the system.
The two trials of this system both showed rapid mixing of the ballast tanks as summarized in Figure 45. Each of the trials resulted in the tank reaching <25% deviation within 35 minutes in the middle of the tank, with only the double bottom area taking 1 hour. The tank reached <10% deviation within 1-1/2 hours. The double bottom portion of the tank was the slowest to mix. The energy imparted to the water in the middle of the tank by the nozzles had a hard time inducing flow into the double bottom area.
Nozzle mixing using 2 nozzles for the example tank configuration resulted in:
• Average Deviation <25% within 1 hour
• Average Deviation <10% within 1-1/2 hours This method could be easy to set up if there was a way to install the submersible pump to recirculate the water.
7.4.1.2 Three Nozzle Mixing (Figure 39, Figure 40, and Figure 41)
The three nozzle mixing setup requires access to three locations along the longest bulkhead in the tank, with clear access from the deck to the bottom of the tank. The nozzles in the trials were installed in an empty tank and clamped onto the vessels structural framing with each nozzle pointing athwart vessel. The installation method could be modified by attaching the nozzles onto riser pipes, allowing them to be lowered from the deck with water hose attached. The chemical could be introduced into the water stream on deck, and diluted in route to the nozzles. The relatively large volume of water required to power each nozzle, ~100gpm each, may prove to be a challenge. For the trials, water was provided by the firemain and added to the tank, increasing the ballast load. In many circumstances, this would not be acceptable. In order to avoid adding water, a submersible pump could be lowered into one of the deck opening to provide the water flow and pressure required to operate the system.
The first trial of this arrangement worked quite well, with the tank reaching <25% deviation within 50 minutes, and <10% deviation within 1-1/2 hours. The second and third trials had complications during the trials. The second trial had problems maintaining the proper water flow, and the dye injection pump failed and required assistance before all the dye was introduced. The time to < 25% deviation was 1-1/4 hours, and <10% deviation was seen at 1-3/4 hours. The third trial started out in a non-homogonous state, as the concentration of dye in the tank had to be reduced before the trial began. Water was pumped out of the tank, and back in again, to dilute the existing dye. The fresh water that was introduced did not mix well before the trial began. As a result, the concentration plot looks nothing like the others and, after 2 hours of mixing, the tank was just getting to <25% deviation. From these trials, it is hard to say how long mixing would take on a consistent basis, but with proper setup and well functioning equipment, mixing could be rapid.

Mixing Biocides into Ship’s Ballast Water 74 The Glosten Associates, Inc. Great Lakes Bulk Carrier Field Trials, Rev. B File No 09078.01, 17 January 2012
Nozzle mixing using three nozzles for the example tank configuration resulted in:
• Average Deviation <25% within 1-1/4 hours
• Average Deviation <10% within 1-1/2 hours This method could be relatively easily set up if there were a way to install the submersible pump to recirculate the water, but the requirement of three locations could be problematic.
7.4.2 Air Lift Point Diffuser Mixing (Figure 33, Figure 34, and Figure 35) The three point diffusers used in the trial were installed in the tank before filling with water. The method of installation could easily be modified to allow installation on any vessel that has ~12" diameter direct vertical access to the bottom of the tank roughly every 50 feet. The sparging heads could be weighed sufficiently to ensure they stayed at the proper depth, and then were lowered through the deck with the air and chemical supply hoses attached.
The three trials showed quite consistent results, with most portions of the tank evenly converging in an asymptotic manor. The double bottom portions of the tank showed slightly more concentration volatility, as the water movement was greatly restricted by structure.
Air lift mixing using three point diffusers for the example tank configuration resulted in:
• Average Deviation <25% within 45 minutes
• Average Deviation <10% within 1-1/4 hours
This method would be relatively easy to install, and operated provided that enough air volume could be provided, but the requirement of three locations could be problematic.
7.4.3 In-Line Dosing (Figure 27) In-line dosing meters the chemical into the ballast main while the tank is being filled. Mixing takes place in the pipe, through the pump, and as the ballast enters the tank. This method can be as efficient as the metering method employed. In the case of these trials, rudimentary methods were employed to simulate rough field conditions with less than perfect equipment. Rather than carefully metering in the chemical with a special pump, the dye was pumped into the main in four “shots” at the beginning, two in the middle, and one at the end of the one hour ballasting operation. While not worst case, typical response personnel should be able to meet this level of efficiency.
The raw data initially showed concentrations as low as 57 ug/L in the far reaches of the double bottom area, which was significantly below the targeted 120 ug/L. However, within four hours, these areas had reached at least 95 ug/L; this at a time when the vessel was still at the dock (no vessel motions). By 12 hours, the deviation was less than 10%.
In-line dosing for the example tank configuration resulted in:
• Average Deviation <25% immediately
• Average Deviation <10% within four hours Carefully metering in the treatment chemical will improve efficiency.
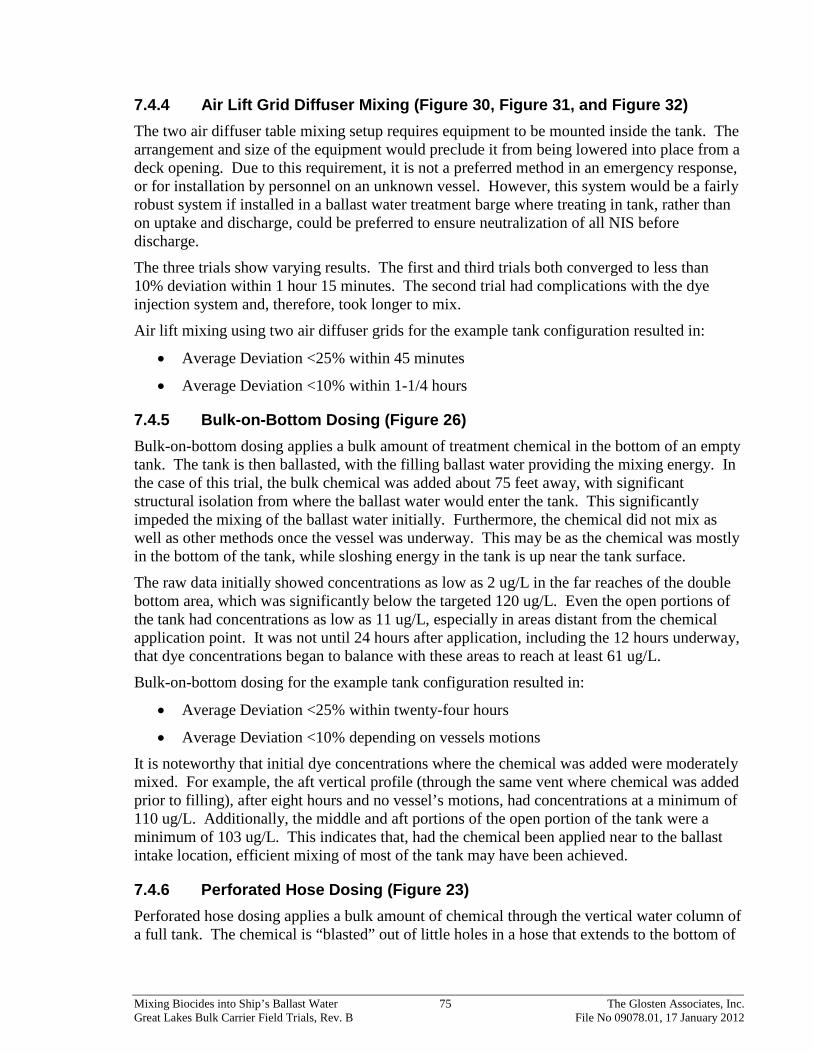
Mixing Biocides into Ship’s Ballast Water 75 The Glosten Associates, Inc. Great Lakes Bulk Carrier Field Trials, Rev. B File No 09078.01, 17 January 2012
7.4.4 Air Lift Grid Diffuser Mixing (Figure 30, Figure 31, and Figure 32) The two air diffuser table mixing setup requires equipment to be mounted inside the tank. The arrangement and size of the equipment would preclude it from being lowered into place from a deck opening. Due to this requirement, it is not a preferred method in an emergency response, or for installation by personnel on an unknown vessel. However, this system would be a fairly robust system if installed in a ballast water treatment barge where treating in tank, rather than on uptake and discharge, could be preferred to ensure neutralization of all NIS before discharge.
The three trials show varying results. The first and third trials both converged to less than 10% deviation within 1 hour 15 minutes. The second trial had complications with the dye injection system and, therefore, took longer to mix.
Air lift mixing using two air diffuser grids for the example tank configuration resulted in:
• Average Deviation <25% within 45 minutes
• Average Deviation <10% within 1-1/4 hours
7.4.5 Bulk-on-Bottom Dosing (Figure 26) Bulk-on-bottom dosing applies a bulk amount of treatment chemical in the bottom of an empty tank. The tank is then ballasted, with the filling ballast water providing the mixing energy. In the case of this trial, the bulk chemical was added about 75 feet away, with significant structural isolation from where the ballast water would enter the tank. This significantly impeded the mixing of the ballast water initially. Furthermore, the chemical did not mix as well as other methods once the vessel was underway. This may be as the chemical was mostly in the bottom of the tank, while sloshing energy in the tank is up near the tank surface.
The raw data initially showed concentrations as low as 2 ug/L in the far reaches of the double bottom area, which was significantly below the targeted 120 ug/L. Even the open portions of the tank had concentrations as low as 11 ug/L, especially in areas distant from the chemical application point. It was not until 24 hours after application, including the 12 hours underway, that dye concentrations began to balance with these areas to reach at least 61 ug/L.
Bulk-on-bottom dosing for the example tank configuration resulted in:
• Average Deviation <25% within twenty-four hours
• Average Deviation <10% depending on vessels motions It is noteworthy that initial dye concentrations where the chemical was added were moderately mixed. For example, the aft vertical profile (through the same vent where chemical was added prior to filling), after eight hours and no vessel’s motions, had concentrations at a minimum of 110 ug/L. Additionally, the middle and aft portions of the open portion of the tank were a minimum of 103 ug/L. This indicates that, had the chemical been applied near to the ballast intake location, efficient mixing of most of the tank may have been achieved.
7.4.6 Perforated Hose Dosing (Figure 23) Perforated hose dosing applies a bulk amount of chemical through the vertical water column of a full tank. The chemical is “blasted” out of little holes in a hose that extends to the bottom of

Mixing Biocides into Ship’s Ballast Water 76 The Glosten Associates, Inc. Great Lakes Bulk Carrier Field Trials, Rev. B File No 09078.01, 17 January 2012
the tank. In these trials, the chemical was “chased” with water, but compressed air might be even more effective. It is worth note that this method could have been applied in three separate vertical locations in the tank, but was only applied to a single location.
The results of this method were promising. Within seven hours of application, all locations in the middle and forward portions of the tank (even those 75 feet away) had a concentration of at least 42 ug/L, with all but two greater than 90 ug/L. Within 16 hours, the tank was generally well mixed, with all but two of the aft readings over 94 ug/L.
Perforate hose dosing for the example tank configuration resulted in:
• Average Deviation <25% within fourteen hours
• Average Deviation <10% within sixteen hours It is apparent that the method immediately distributed the chemical evenly in the vertical column. This allowed it to be rapidly dispersed by vessels motion, even in the relative light seas of Lake Michigan. It could be assumed that, had the method been applied not in just one vent, but rather all three, mixing would have been more rapid. Additional “chasing” of the chemical, perhaps with compressed air, would also be expected to increase mixing efficiency.
7.4.7 Vent Dosing (Phase II Trials – Figure 24 and Figure 25) (Phase III Trials – Figure 28 and Figure 29)
Vent dosing simply adds the chemical to the top of a full or partially full ballast tank through the vent. In the case of the trials, the tanks were only partially full. The mixing is then a result of any momentum from the action of adding the chemical, any energy impacted from vessel motions, and any molecular diffusion.
As this is the method used on the Igloo Moon high risk ballast water response, and by Argentina when treating vessel’s ballast water for pathogens, this method was trialed twice to gain at least one set of replicates.
The results of this method indicated that mixing is dependent on vessel motions, and would not be a preferred method for a vessel at rest. The chemical slowly migrated from the application point and, within two hours, only two of seventeen sample locations gaining a meaningful reading. After eleven hours of vessel motions, chemical readings in the upper portions of the tank were increasing. It was not until after twenty-four hours that the chemical reached the lower and forward portions of the tank, and deviations were less than 25%.
Vent dosing for the example tank configuration resulted in:
• Average Deviation <25% after twenty-four hours
• Average Deviation <10% after thirty-six hours The replicates of this method showed the same trends, with the chemical migrating more quickly in the upper reaches of the tank, and more slowly to lower portions of the tank. The variability was on the range of ten percent. It would appear that the more locations that one could apply the chemical, the more quickly it might be well mixed.

Mixing Biocides into Ship’s Ballast Water 77 The Glosten Associates, Inc. Great Lakes Bulk Carrier Field Trials, Rev. B File No 09078.01, 17 January 2012
7.4.8 Internal Transfer (Figure 22) Internal transfer dosing circulates ballast water from one area in the tank to another. The chemical is metered into this circulation loop. The results from this effort indicated that the circulation loop generally short circuits most of the tank volume, as the water repeatedly takes the path of least resistance.
The relatively low flow rate of this circuit, about 175 gpm in a tank of 180,000 gallons, was likely a factor in this lack of mixing. After one tank volume of mixing (or 18 hours), this method had reached 25% deviation, but still left the aft portion of the tank (double bottom and deep tank reaches) essentially short circuited with four readings below 40 ug/L.
Vent dosing for the example tank configuration resulted in:
• Average Deviation <25% after eighteen hours
• Average Deviation <10% after thirty-six hours A higher flow rate for the tank size may result in better mixing results. Another improvement approach may be to move the location of the circuit to several locations. However, it appears that this method is a great deal of effort for little gain in mixing efficiency.

Mixing Biocides into Ship’s Ballast Water 78 The Glosten Associates, Inc. Great Lakes Bulk Carrier Field Trials, Rev. B File No 09078.01, 17 January 2012
Section 8 Acknowledgements We thank Dr. Barnaby Watten, Noah Adams, Matt Sholtis, Gary Rutz and Travis Tucker of USGS for their identification, engineering, and testing of the active mixing techniques evaluated in Phase III trials, as well as the development and implementation of appropriate methods for characterizing ship dynamics in Phase II and III.
In addition, we thank Scott Smith of the USGS Western Fisheries Research Center for his efforts in partnership development, industry outreach, and consultation of program development.
Development of this report was possible because of broad support from multiple sources.
• National Park Service. Phyllis Green of Isle Royale National Park identified the need for the Guide, formed the project team, and provided broad coordination of multiple stakeholders.
• National Parks of Lake Superior Foundation. NPLSF provided efficient management of the Phase I and II project grants.
• U.S. Geological Survey. USGS is providing efficient management of the Phase III project grant.
• Legislative-Citizen Commission on Minnesota Resources through the Environment and Natural Resources Trust Fund: LCCMR provided financial support from the ENRTF for the Phase III grant.
• Great Lakes Fisheries Trust. GLFT provided financial support for the Phase II grant.
• National Oceanic and Atmospheric Administration. NOAA provided financial support for Phase I grant.
• American Steamship Company. Noel Bassett, Pierre Pelletreau, and Kenny Gliwa provided access to the M/V Indiana Harbor. Additionally, ASC installed extensive sampling equipment inside the vessel’s ballast water tanks.
• M/V Indiana Harbor. Captain Yowell and his crew provided significant support to all phases of our testing efforts. The support of the conveyor men and engineers was critical to project success.
• Phase II Field Team. Dr. Barnaby Watten, Noah Adams, and Gary Rutz of the U.S. Geological Survey; and Kevin Reynolds, Jon Markestad and Dan Clopton of The Glosten Associates conducted 8 days and nights of field trials.
• Phase III Field Team. Dr. Barnaby Watten, Gary Rutz, Matt Sholtis, and Travis Tucker of the U.S. Geological Survey; and Jon Markestad and Robin Madsen of The Glosten Associates conducted 11 days and nights of field trials.
• Phase II Discharge Team. Jay Austin and his team from Minnesota Technical University, Jay Glase of National Park Service, and the NPLSF volunteers Dave Miller and Chris Gale performed discharge sampling from the vessel and two small crafts during the Phase II ballast discharge.

Mixing Biocides into Ship’s Ballast Water 79 The Glosten Associates, Inc. Great Lakes Bulk Carrier Field Trials, Rev. B File No 09078.01, 17 January 2012
• Phase II Discharge Team. Jay Austin and his team from Minnesota Technical University and the NPLSF volunteer Dave Miller performed discharge sampling from the vessel and a small craft during the Phase III ballast discharge.
• Review and comment on the first draft came from broad sources including: U.S. EPA – Great Lakes, U.S. EPA – Region 5, U.S. Coast Guard Cleveland, NOAA, American Salvage Association, California State Lands Commission, and University of Wisconsin-Superior.

Mixing Biocides into Ship’s Ballast Water 80 The Glosten Associates, Inc. Great Lakes Bulk Carrier Field Trials, Rev. B File No 09078.01, 17 January 2012
Section 9 References 1. NRC (National Research Council). 1996. Stemming the tide: Controlling introductions of
nonindigenous species by vessels’ ballast water. Marine Board Committee on Vessels’ Ballast Operations. Wash. DC: National Academy Press.
2. Corrina Chase, Christine Reilly, and Judith Pederson, Ph.D, “Marine Bioinvasions Fact Sheet—Ballast Water Treatment Options,” NOAA SeaGrant, 2003.
3. “Evaluation of Chemicals for Potential Treatment of Ballast Water,” US Coast Guard Research and Development Center, October 2004.
4. “Ballast Water Treatment Methods – Chemical Chemicals,” Prince William Sound Regional Citizens' Advisory Council, January 29, 2005.
5. “Critical Review of a Ballast Water Chemical Treatment Demonstration Project Using Sodium Hypochlorite,” BMT Fleet Technology, May 2004.
6. “Ballast Water Treatment Technology,” Lloyd’s Register, September 2008.
7. “Full-Scale Design Studies of Ballast Water Treatment Systems,” Glosten-Herbert Hyde Marine, April 2002.
8. “Guidelines For Risk Assessment Under Regulation A-4 of the BWM Convention (G7), Resolution MEPC.162(56),” International Maritime Organization, July 13, 2007.
9. Hoff, M.; “A Model Screening Process to Rapidly Assess Risks of Nonnative Species Impacts,” U.S. Fish and Wildlife Service, October 29, 2008.
10. Washington Department of Fish & Wildlife, “Chinese Submersible Barge “LUCKY ANGEL” Arrives in Bellingham – Cooperative ballast water treatment and hull fouling investigation case,” January 7, 2009.
11. Jeffery R. Cordell, et al., “Factors influencing densities of non-indigenous species in the ballast water of vessels arriving at ports in Puget Sound, Washington, United States,” 27 October 2008
12. “Ballast Water Treatment During Emergency Response Operations Planning Issues,” Region 4 Regional Response Team for Area Contingency Plan Development, US National Response Team, 09 May 2002.
13. Mearns, A.; Benggio, B.; Waite, T.; “Ballast Water Treatment During Emergency Response: The Case of The M/T Igloo Moon,” 1999.
14. Reynolds, K.; “Vessel’s Ballast Discharge Dispersion, Benchmark Dye Tracer Test,” The Glosten Associates, January 14, 2005.
15. Reynolds, K.; “Mixing Chemicals into Vessel’s Ballast Water - Efficiency of Novel Mixing Methods,” The Glosten Associates, November 26, 2008.
16. APHA (1985). Standard Methods for the Examination of Water and Wastewater, 16th edn, American Public Health Association, Washington D.C. p 1268.
17. Brown, L.C. and C.C. Baillod (1982). Modeling and Interpretting Oxygen Transfer Data. J. Environmental Eng. Div., ASCE. Vol 108, No. EE4.
18. Colt, J. (1984). Computation of dissolved gas concentrations in water as functions of temperature , salinity and pressure. American Fisheries Society, Bethesda, Maryland, Special Publication No. 14, p 154.

Mixing Biocides into Ship’s Ballast Water 81 The Glosten Associates, Inc. Great Lakes Bulk Carrier Field Trials, Rev. B File No 09078.01, 17 January 2012
Section 10 Testing Schedule The following timeline shows the schedule by which the ballast dye study was conducted during the Phase III - Active Mixing Method trials. Team members included:
• Barnaby Watten, Principal Investigator—USGS • Jon Markestad, Project Marine Engineer—Glosten • Robin Madsen, Project Naval Architect—Glosten • Travis Tucker, Associate Investigator —USGS • Gary Rutz, Associate Investigator —USGS • Matt Shultis, Associate Investigator—USGS
Date Ship Location Tasks
Prior to 9 May
Frasier Shipyard
The dye team delivered two compressors, an air hose, and additional gear to the Frasier Shipyard.
9 May Superior Fuel Dock
While vessel was at the fuel dock, the shipyard transferred equipment and loaded it aboard. Compressors were lashed down on the Main Deck port side between Ballast Tanks 3 and 4. Hose and equipment was stowed and secured on Main Deck.
12 May Superior Fuel Dock
The dye team arrived in Duluth and checked into the hotel
13 May Superior Fuel Dock
The dye team met for breakfast to discuss mobilization plans, and then met with Jay Austin regarding the Dilution Study. Additional equipment was procured and picked up in Superior (All)
14 May Vessel Underway
The vessel prepared for the dye team arrival by adding one extra cot in each owner’s stateroom, for total of three bunks per room. The dye team met with Alouez Marine to plan the Two Harbors’ equipment transfer to the vessel. Additional Equipment was then procured and picked up in Superior (All).
15 May Two Harbors The vessel received additional equipment (est. three pallets) in Two Harbors as delivered by Alouez Marine. Six dye study team members boarded the vessel. The dye team remained available to discuss plans with the Captain as needed, moved personal equipment to staterooms, and met for a safety and orientation meeting. The team then confirmed that the shipped gear was onboard the ship, and moved it into the conveyor tunnel. The sampling team then began setting up sampling manifolds in the conveyor tunnel.
16 May Two Harbors (departed)
Ship crew and dye team met for a safety and logistics review. Ship crew then provided an electric impact wrench for the dye team to remove bolted access, one pair of ballast tanks at a time. Ship crew certified 3P and 3S safe for entry, assisted with washdown hose connections on deck and in tunnel, and assisted with fueling the air compressors on the Main Deck.

Mixing Biocides into Ship’s Ballast Water 82 The Glosten Associates, Inc. Great Lakes Bulk Carrier Field Trials, Rev. B File No 09078.01, 17 January 2012
Date Ship Location Tasks
16 May (continued)
The Air Lift Mixing Team • Set up deck mixing equipment • Set up 3P in-tank dosing equipment and test
The Eductor Team • Set up deck mixing equipment • Set up 3S in-tank mixing equipment and test
The Sample Team • Set up deck dosing equipment • Set up tank sample equipment • Inspected sample tube installations 3P, 3S • Made rhodamine standards
The dye team then calibrated instruments and set up the environmental measurement equipment.
17 May Underway Ship’s crew certified 4P, 4S, 5P, 5S as safe for entry (one pair at a time) and assisted with washdown hose connections (as needed).
The dye team continued setting up project
The Air Lift Mixing Team • Set up 4P in-tank mixing equipment and test
The Eductor Mixing Team • Set up 4S in tank mixing equipment and test
The Sample Team • Completed set-up tank sample equipment • Inspected sample tube installations 4P, 4S 5P, 5S • Installed pressure transducers in 5P
Completed all calibration of instruments Complete set-up environmental measurement equipment
18 May Gary, Indiana (arrived)
Ship crew communicated ballast activities with test team
After ballasting complete for 5P and 5S, the dye team dosed from top with full dye quantity. They then performed sampling measurements on Ballast Tanks 5P and 5S from the Tunnel and Main Deck. Environment measurements were begun.
Gary, Indiana (departed)
Ship crew communicated ballast activities with test team
The test team dosed and sampled 3P, 3S, 4P, 4S, one tank at a time, with either an air lift trial or eductor trial (estimated 2-3 hours per tank)
19 May Underway
Ship crew communicated ballast activities with test team The test team discharged partial ballast as needed from 3S and 4S (estimated at 20,000 gal per tank per hour of eductor mixing and communicated ballast amount to crew).
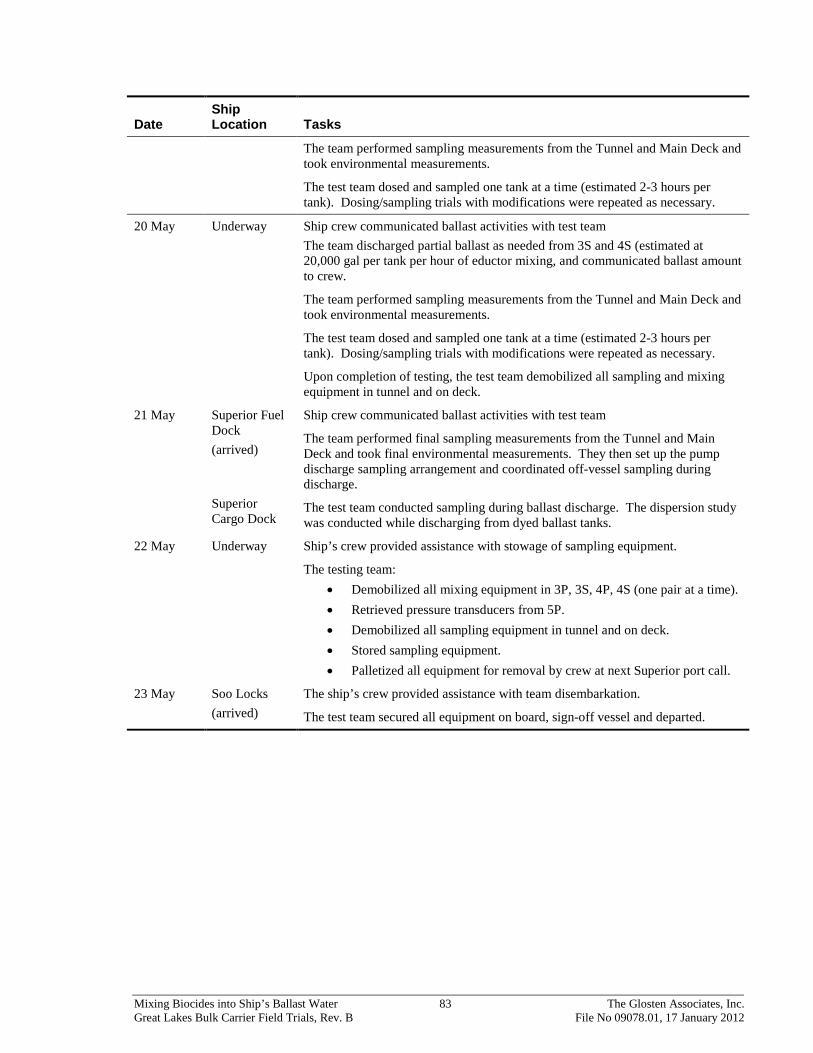
Mixing Biocides into Ship’s Ballast Water 83 The Glosten Associates, Inc. Great Lakes Bulk Carrier Field Trials, Rev. B File No 09078.01, 17 January 2012
Date Ship Location Tasks
The team performed sampling measurements from the Tunnel and Main Deck and took environmental measurements.
The test team dosed and sampled one tank at a time (estimated 2-3 hours per tank). Dosing/sampling trials with modifications were repeated as necessary.
20 May Underway Ship crew communicated ballast activities with test team The team discharged partial ballast as needed from 3S and 4S (estimated at 20,000 gal per tank per hour of eductor mixing, and communicated ballast amount to crew.
The team performed sampling measurements from the Tunnel and Main Deck and took environmental measurements.
The test team dosed and sampled one tank at a time (estimated 2-3 hours per tank). Dosing/sampling trials with modifications were repeated as necessary.
Upon completion of testing, the test team demobilized all sampling and mixing equipment in tunnel and on deck.
21 May Superior Fuel Dock (arrived)
Ship crew communicated ballast activities with test team
The team performed final sampling measurements from the Tunnel and Main Deck and took final environmental measurements. They then set up the pump discharge sampling arrangement and coordinated off-vessel sampling during discharge.
Superior Cargo Dock
The test team conducted sampling during ballast discharge. The dispersion study was conducted while discharging from dyed ballast tanks.
22 May Underway
Ship’s crew provided assistance with stowage of sampling equipment.
The testing team: • Demobilized all mixing equipment in 3P, 3S, 4P, 4S (one pair at a time). • Retrieved pressure transducers from 5P. • Demobilized all sampling equipment in tunnel and on deck. • Stored sampling equipment. • Palletized all equipment for removal by crew at next Superior port call.
23 May Soo Locks (arrived)
The ship’s crew provided assistance with team disembarkation.
The test team secured all equipment on board, sign-off vessel and departed.